1850-2200 greenland ice sheet smb as simulated by … · 1850-2200 greenland ice sheet smb ... •...
TRANSCRIPT

1850-2200 Greenland ice sheet SMB as simulated by CESM1.1 (CAM5.2)
Miren Vizcaino (1), Leo van Kampenhout (2), Jan Lenaerts (2), Vincent Cabot (1), William Sacks (3)
(1) TU Delft, The Netherlands
(2) IMAU, Utrecht University, The Netherlands (3) NCAR, CO, USA

Contributors to GrIS mass loss Mass anomalies referred to equilibrium (mean 1961-1990 SMB and 1996 ice discharge)
Enderlin et al., GRL, 2014
42% 68%

Projections require SMB & ice flow coupling
• 1st GrIS projections with coupled AOGCM-ISM1 under RCP/ECP
• Elevation change enhances SMB loss by 10% (2100) & 30% (2300)
• Ice discharge decreases due to thinning and retreat from increased surface melt
1 ECHAM5/MPIOM-SICOPOLIS Vizcaino et al., GRL, 2015

GrIS surface mass budget (SMB) Run-off=
Melt+Rainfall-Refreezing Precipitation
= Snowfall+Rainfall SMB=
Precipitation - Ablation
kg m-2 yr-1 1958-2007 means from high-resolution regional climate model RACMO (Ettema et al. GRL, 2009)

SMB from GCMs
• Runoff is underestimated in CMIP5 models
• Deficient snow schemes (e.g., fixed albedo)
Cullather et al., 2014
cm-2 yr-1 w.e.

CESM1.0: 1st realistic GCM simulation of GrIS SMB
“Recipe”: 1. Realistic surface climate 2. Explicit albedo, melt
and refreezing simulation in CLM
3. Downscalling based on SMB calculation at fixed elevations
kg m-2 yr-1
Simulated snowfall minus melt (dots: observations)
Vizcaino et al, J. Clim., 2013 (Evaluation) Vizcaino et al, J. Clim., 2014 (Projections)

Outline
1850-2200 CESM1.1(CAM5.2)/FV1 simulations: • 1960-2005: Present-Day climate and SMB
– LW biases and SMB implications
• RCP2.6 & RCP8.5_4x scenarios • Outlook

1960-2005 GRIS CLIMATE & SMB

Snowfall is well simulated
• Better agreement than in CAM4, specially wet SW & dry N interior
1° 11 km RACMO2.3 is forced with reanalysis

Rainfall is well simulated
• Overestimated in CAM4
• Affects mass budget and surface albedo

Atmospheric circulation is well simulated

Cold bias

Melt & surface energy budget
• Most of melt energy M comes from surface radiation
• Albedo-melt feedback
13

Incoming longwave is underestimated (W m-2)

Cloud liquid water is too low

Melt is underestimated

SMB PROJECTIONS UP TO 2300 WITH CESM1.1 (CAM5.2) & FIXED GRIS TOPOGRAPHY

We capped CO2 forcing at 4x
RCP2.6
RCP8.5

Downward SW decreases (JJA)
• Due to enhanced cloud cover
2080-99 minus 1980-99, RCP8.5

Downward LW increases 2080-99 minus 1980-99, RCP8.5 (W m-2)
• Higher increase than in CESM1.0, explaining similar SMB by 2100 regardless of high present-day SMB

Surface albedo decreases

Net radiation increases
2080-99 minus 1980-99, RCP8.5 • Due to
increased downward LW & reduced albedo

Climate & SMB change

SMB change
1960-2005, RACMO: 376 ± 117 Gt yr-1
CESM1.0: 359 ± 120 Gt yr-1

Ablation area expand by 2100

Surface energy fluxes RCP8.5

Surface energy fluxes RCP8.5

Surface energy fluxes RCP2.6

Surface energy fluxes RCP2.6


Summary • GrIS surface melt is underestimated in
CESM1.1(CAM5.2) due to insufficient cloud liquid content causing low incoming LW
• GrIS precipitation is well simulated • SMB becomes negative by 2100 in RCP8.5,
similarly to CESM1.0 (CAM4) • SMB modestly decreases by 2100 in RCP2.6 • Further melt increases by 2200 in both scenarios • RCP8.5 beyond 2100 had to be capped at 4xCO2
(code breaks) • We will repeat simulations after surface radiation
budget is improved
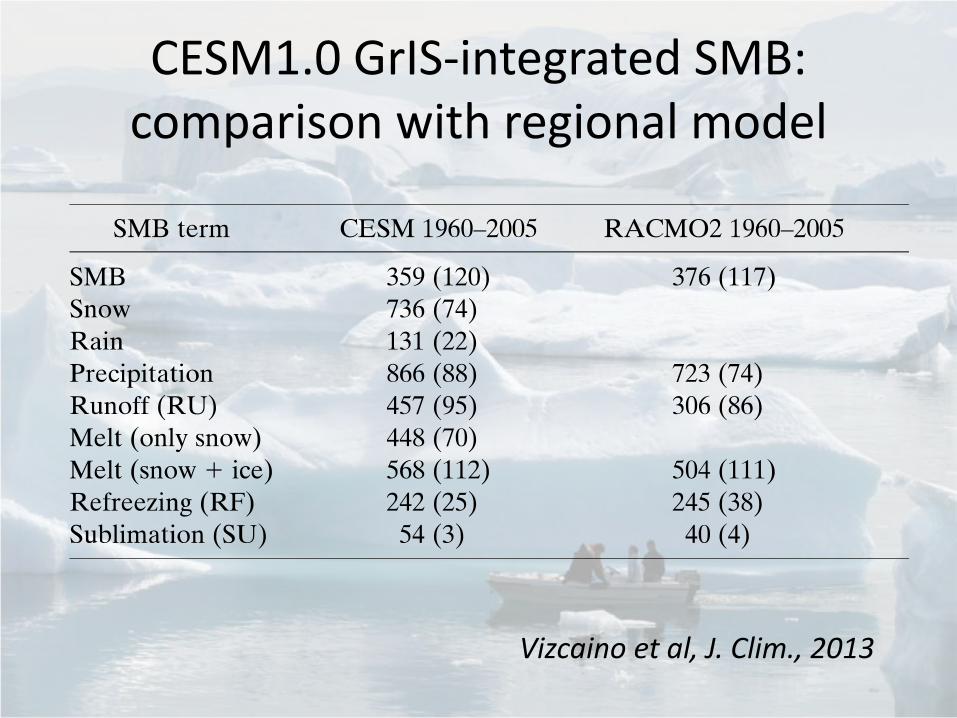
CESM1.0 GrIS-integrated SMB: comparison with regional model
Vizcaino et al, J. Clim., 2013

Vizcaino et al, J. Clim., 2014
CESM1.0 GrIS-integrated SMB: Projections