1886 cc 1_t15_eng
TRANSCRIPT

1Q15 Earnings Release Conference Call
May 12th, 2015
Agenda
1Q15 Events and Highlights 3
1Q15 Financial Highlights 4
Net Interest Margin 5
Expenses and Efficiency Ratio 6
Loan Portfolio 7Loan Portfolio 7
Continuous Loan Portfolio Management 8
Main Sectors – Sugar and Ethanol | Agriculture| Real Estate 9
Main Sectors – Energy and Engineering 10
Loan Portfolio Quality 11
FICC 12
Pine Investimentos 13
Funding 14
Asset & Liability Management 15
Capital Adequacy Ratio (BIS), Basel III 16
2/17Investor Relations | 1Q15 |A parte de imagem com identificação de relação rId28 não foi encontrada no arquivo.
1Q15 Events and Highlights
1. Increase in the positive liquidity gap, with 12 months for credit versus 17 months for funding.
2. Liquid balance sheet, with a cash position of R$1.4 billion, equivalent to 48% of time deposits.
3. Active and constant liability management that led to a further reduction in the cost of funding.
4. Loan portfolio coverage ratio above 4% as a result of an important increase in provisions in the last twelve months.
5. 16% reduction of personnel and administrative expenses in the quarter, as a result of the diligence and anticipation of an adversep p q , g p
market in 2015.
6. 18th largest bank in derivative transactions and the 3rd largest in commodity derivatives segment according to CETIP – OTC Clearing
HHouse.
3/17Investor Relations | 1Q15 |A parte de imagem com identificação de relação rId28 não foi encontrada no arquivo.

1Q15 Financial HighlightsThe main performance indicators were within expectations in the period.
Total Loan Portfolio1
-1.7%
R$ million
Total Funding
-1.6%
Shareholders’ Equity
-1.0%
9,826 9,657 8,500 8,367 1,256 1,244
D 14 M 15D 14 M 15
, ,
D 14 M 15Dec-14 Mar-15Dec-14 Mar-15
Net Income
Dec-14 Mar-15
NIM Evolution
-10 bps
ROAE
+160 bps+100.0%
10 bps +160 bps
5 10
4.1% 4.0%
1.7%
3.3%
4/17Investor Relations | 1Q15 |A parte de imagem com identificação de relação rId28 não foi encontrada no arquivo.
1 Includes Stand by LCs, Bank Guarantees, Credit Securities to be Received and Securities (bonds, CRIs, eurobonds and fund shares)
4Q14 1Q15 4Q14 1Q15 4Q14 1Q15
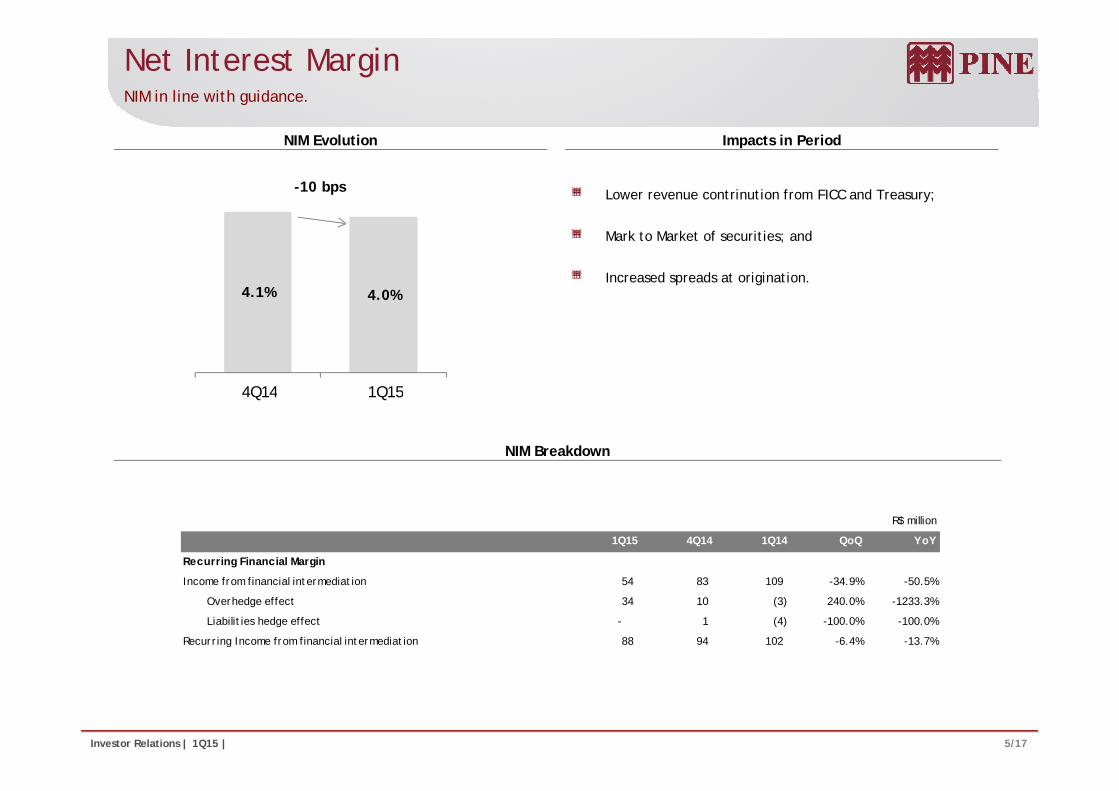
Net Interest MarginNIM in line with guidance.
-10 bps
NIM Evolution Impacts in Period
Lower revenue contrinution from FICC and Treasury;
4.1% 4.0%
Mark to Market of securities; and
Increased spreads at origination.
4Q14 1Q154Q14 1Q15
NIM Breakdown
R$ million
1Q15 4Q14 1Q14 QoQ YoY
Recurring Financ ial Margin
Income from financial intermediation 54 83 109 -34.9% -50.5%
Overhedge effect 34 10 (3) 240.0% -1233.3%
Liabilities hedge effect - 1 (4) -100.0% -100.0%
Recurring Income from financial intermediation 88 94 102 -6.4% -13.7%
5/17Investor Relations | 1Q15 |A parte de imagem com identificação de relação rId28 não foi encontrada no arquivo.

Expenses and Efficiency RatioCost control, better than the guidance range.
Expenses
39.8% 42.2% 39.1%4 0 . 0 %
6 0 . 0 %
4 5
5 0
2327
23
26
22- 2 0 . 0 %
0 . 0 %
2 0 . 0 %
2 5
3 0
3 5
4 0
Personnel Expenses
Other administrative expenses
18
- 8 0 . 0 %
- 6 0 . 0 %
- 4 0 . 0 %
5
1 0
1 5
2 0
expenses
Recurring Efficiency Ratio (%)
Efficiency Ratio
- 1 0 0 . 0 %0
1Q14 4Q14 1Q15
R$ million
1Q15 4Q14 1Q14 QoQ YoY
Operating expenses 1 45 52 53 -13.5% -15.1%
(-) Non-recurring expenses (1) (3) (4) -66.7% -75.0%
R i O ti E (A) 43 49 49 12 2% 12 2%Recurring Operating Expenses (A) 43 49 49 -12.2% -12.2%
Recurring Revenues 2 (B) 110 116 123 -5.2% -10.6%
Recurring Efficiency Ratio (A/B) 39.1% 42.2% 39.8% -310 bps -70 bps
1 Other administrative expenses + tax expenses + personnel expenses2 Gross Income from financial intermediation - provision for loan losses + fee income + overhedge effect - hedge impact
6/17Investor Relations | 1Q15 |A parte de imagem com identificação de relação rId28 não foi encontrada no arquivo.

Loan PortfolioThe portfolio ended the period at R$9.7 billion...
R$ million
-4.3%
903 989 1 116 826
9,6579,5379,930 10,090 10,032 9,800 9,826
-1.7%
3 073
2,909 2,905 2,941 2,896 2,969
3,191
842
1,059
965 903 1,116 924 826
909 Trade finance: 9.4%8,405
8,994 1
826 844 990
1,068 1,103 1,071 1,248 1,302
1,118
2,501 2,807
3,073 3,191
Bank Guarantees: 33%33.0%
4 509 5,050 5,093 4,904 4,731 4,730 4 440
826 844
BNDES Onlending : 11.6%
4,236 4,284 4,509 4,731 4,730 4,440
Working Capital: 46%246.0%
7/17Investor Relations | 1Q15 |A parte de imagem com identificação de relação rId28 não foi encontrada no arquivo.
Mar-13 Jun-13 Sept-13 Dec-13 Mar-14 Jun-14 Sept-14 Dec-14 Mar-151 Includes Stand by LC2 Includes debentures, CRIs, Hedge Fund Shares, Eurobonds, Credit Portfolio acquired from financial institutions with recourse and Individuals

Continuous Loan Portfolio Management...with improved sector diversification.
13%14%12%15%20% Sugar and
Sectors Rebalance
Sugar and Ethanol13%Food Industry
Construction Material
1%
Other9%
10%10%10%8%8%
12%10%12%12%8%
12%12%13%11%9%
20%Ethanol
Real Estate
Energy
Real Estate12%
S i li d
Vehicles and Parts2%
Retail2%
Meatpacking2%
2% 1%
7%6%5%5%5%8%8%8%7%8%
0%Agriculture
Engineering
Transportation
Energy12%
Chemicals4%
Metallurgy4%
Specialized Services
3%
38%40%40%43%42%
Mar‐15Dec‐14Mar‐14Mar‐13Mar‐12
pand Logistics
OthersAgriculture10%
Engineering8%
Transportation and Logistics
7%
Telecom5%
Foreign Trade4%
4%
7%
The composition of the portfolio of the 20 largest clients changed by over 15% in the past twelve months;
The total portfolio share of the 20 largest clients remained below 30%, in line with market peers.
8/17Investor Relations | 1Q15 |A parte de imagem com identificação de relação rId28 não foi encontrada no arquivo.

Main SectorsSugar and Ethanol | Real Estate | Agriculture
MallCommercial
3%MSOnlending Trade Finance
Sugar and Ethanol Real Estate
Exposure by Product Exposure by State Exposure by Product Exposure by Segment
Guarantees23%
Warehouse14%
Mall7%
SP75%
PR6%
GO2%
AL0%
MS0%
Guarantees34%
g9% Finance
7%
Working Capital
77%
Residential Lots40%
Residential36%
MG17%
Working Capital
50%
Agriculture
Exposure by Product Exposure by State
Trade Finance
14% Onlending12%
Guarantees1%
Exposure by Product Exposure by State
MT32%
MS
Others8%
Working
SP30%BA
9%
ES5%
CE4%
MS2%
9/17Investor Relations | 1Q15 |A parte de imagem com identificação de relação rId28 não foi encontrada no arquivo.
Working Capital
73%PR10%

Main SectorsEnergy | Engineering
Energy Engineering
Exposure by Product Exposure by Product
Guarantees11%
Onlending3%
Working Capital
18%
Onlending8%
Working Capital
Guarantees74%
p86%
Exposure by SegmentExposure by Segment
Transporta-tion34%
Concession31%
UTE13%
Distributors10%
Transmitting 34% 31%
I d t i lEnergy
1%
Wind Energy
g8%
Equipment Supplier
6%
SHPs UHEs3%
T d
10/17Investor Relations | 1Q15 |A parte de imagem com identificação de relação rId28 não foi encontrada no arquivo.
Industrial22%
Oil and Gas7%
Sanitation5%
1%gy
59% Trader1%

Loan Portfolio Quality94% of loan portfolio classified between AA-C ratings.
March 31st, 2015
Loan Portfolio Quality – Res. 2,682 Non Performing Loans > 90 days (Total Contract)
B39.0%
1.2% 1.1% 0.7%0.1%
0.7% 0.3% 0.3%1.1%
2.1%
C14.3%
Contracts Overdue: total amount of the contracts overdue for more than 90 days / Loan Portfolio
Mar-13 Jun-13 Sep-13 Dec-13 Mar-14 Jun-14 Sep-14 Dec-14 Mar-15
AA-A40.2%
D-E3.0%
F-H3.4%
Contracts Overdue: total amount of the contracts overdue for more than 90 days / Loan Portfolioexcluding Bank Guarantees and Stand-by Letters of Credit.
Credit Coverage Collaterals
Products
6.2%
5.0%
6.4%
2.9% 2.9%4.1%
Products Pledge
40%Investments3%
Mar-14 Dec-14 Mar-15
D-H Portfolio Coverage of Total Portfolio Receivables19%
Properties Pledge
38%1 2
11/17Investor Relations | 1Q15 |A parte de imagem com identificação de relação rId28 não foi encontrada no arquivo.
1D-H Portfolio: D-H Portfolio / Loan Portfolio Res. 2,6822Coverage of Total Portfolio: Provisions / Loan Portfolio Res. 2,682
g19%38%

FICCProven trackrecord: 3rd in commodity derivatives1.
March 31st, 2015 R$ million
Client Notional Derivatives by Market Notional Value and MtM
Notional Amount
MtM
Stressed MtM
Fixed Income7%
Currencies80% 482
354 288 221
349
(47)
Stressed MtM
Commodities13%
7%
11,268 14,382 8,376 7,703 7,482
(243)
(532)
(47)
(365)
(103)
Scenario on March 31st 2015:
Market Segments Portfolio Profile
Mar-14 Jun-14 Sept-14 Dec-14 Mar-15
Scenario on March 31st,2015:
Duration: 149 days
Mark-to-Market: R$349 million
Fixed Income: Fixed, Floating, Inflation, Libor
Currencies: Dollar, Euro, Yen, Pound, Canadian Dollar,Australian Dollar
Stress Scenario (Dollar: +31% and Commodities Prices: -30%):
Stressed MtM : (R$103 million)
Commodities: Sugar, Soybean (Grain, Meal and Oil), Corn,Cotton, Metals, Energy
12/17Investor Relations | 1Q15 |A parte de imagem com identificação de relação rId28 não foi encontrada no arquivo.
1Source: Reporte Cetip, March 2015
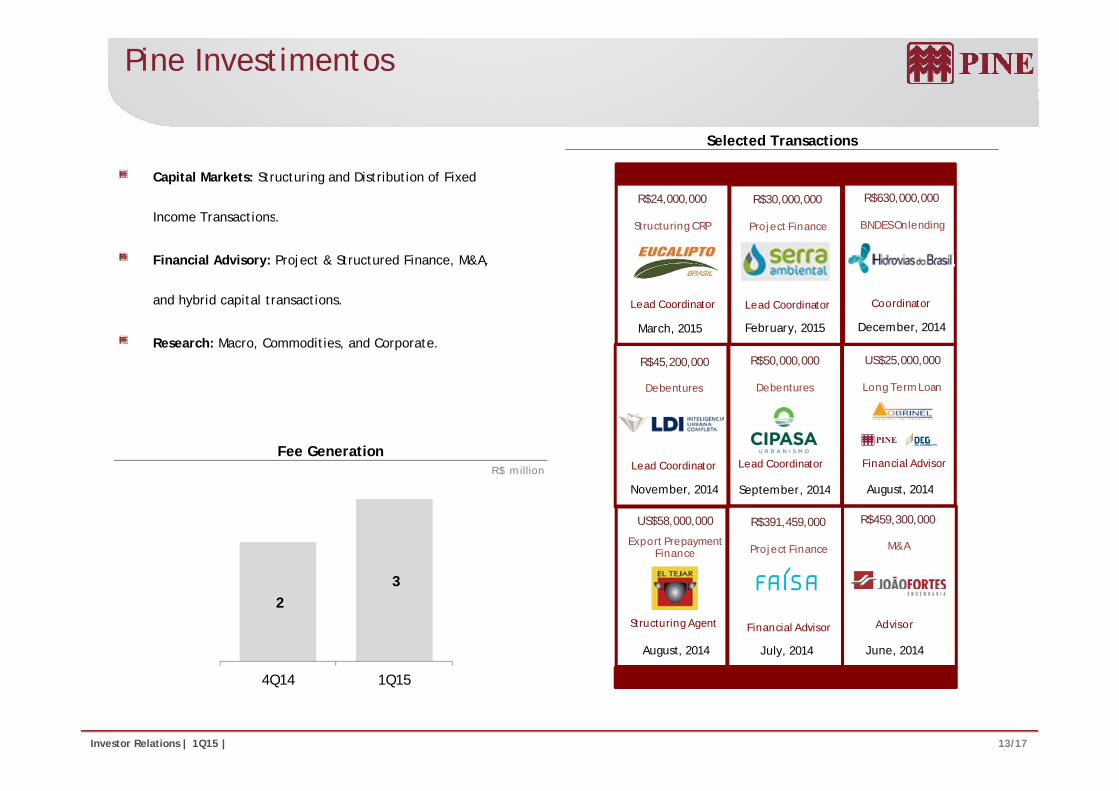
Pine Investimentos
R$630,000,000R$30,000,000R$24,000,000
Selected Transactions
Capital Markets: Structuring and Distribution of Fixed
Income TransactionsBNDES Onlending
Coordinator
Project Finance
Lead Coordinator
Structuring CRP
Lead Coordinator
Income Transactions.
Financial Advisory: Project & Structured Finance, M&A,
and hybrid capital transactions.
Long Term Loan
US$25,000,000
Debentures
R$50,000,000R$45,200,000
Debentures
December, 2014
Coordinator
February, 2015March, 2015
Lead CoordinatorLead Coordinatory p
Research: Macro, Commodities, and Corporate.
A t 2014
Financial Advisor
S b 2014
Lead Coordinator
N b 2014
Lead CoordinatorR$ million
Fee Generation
Export Prepayment Finance
August, 2014
US$58,000,000 R$459,300,000
M&A
September, 2014November, 2014
Project Finance
R$391,459,000
August, 2014
Structuring Agent
June, 2014
Advisor
July, 2014
Financial Advisor
2 3
13/17Investor Relations | 1Q15 |A parte de imagem com identificação de relação rId28 não foi encontrada no arquivo.
4Q14 1Q15

FundingDiversified sources of funding...
R$ million
58% 48%42% 44% 41%39% 41% 35% 48% Cash over Deposits
8 797 Trade Finance: 11 1%
-4.9%
434 113 364
346 388
687 500
478
473 531 430
773 973
871 834
1,064 819 839
929
8,367
6 589
7,111
7,8948,383
8,7978,559 8,638 8,500
Trade Finance: 11.1%
Private Placements: 9.2%
Multilateral Lines: 10%
I i l C i l M k
10.0%
1,174 1 086 286 649
632 582 594 709
635 642
689
762 792
833 508 892
747
796 402
435
437
459 434
427 323
347
338 78 80
69
113 346 687
837
171 181
429
762 997
6,589 International Capital Markets: 4%
Financial Letter : 9.5%
Local Capital Markets: 6.1%
4.0%
972 1,013 1,048
1,112 1,022 761 731
225 254 372 475 659
908 920
1,122
110 110 93 90
76 80 98
69
157
126 19 20 23
27 41 30 27
24
859 862 1,099 1,141
1,174 1,086 1,292
1,333
1,161
154 286 509 Onlending: 13.9%
Demand Deposits: 0.3%
Interbank Time Deposits: 1.9%
2,087 2,185 1,944 2,175 2,314 2,271 1,905 1,720
1,209
,731
545
361
1,273 High Net Worth Individual Time Deposits: 15.2%
Corporate Time Deposits: 4.3%
Institutional Time Deposits: 14.5%
14/17Investor Relations | 1Q15 |A parte de imagem com identificação de relação rId28 não foi encontrada no arquivo.
Mar-13 Jun-13 Sept-13 Dec-13 Mar-14 Jun-14 Sept-14 Dec-14 Mar-15
14.5%

Asset & Liability Management... keeping a positive gap between credit and funding.
Leverage Credit over Funding Ratio
82% 83%80% 80%7 9 7 9
9 . 0
1 0 . 0
Expanded loan Porfolio
Loan Portfolio excluding Bank Guarantees
80% 80%77%7.9x 7.9x 7.7x 7.8x 7.8x
5.6x 5.6x 5.4x 5.4x 5.2x
4 . 0
5 . 0
6 . 0
7 . 0
8 . 0
Mar-14 Jun-14 Sept-14 Dec-14 Mar-15‐
1 . 0
2 . 0
3 . 0
Mar-14 Jun-14 Sept-14 Dec-14 Mar-15
Total Deposits Others
Leverage: Expanded Loan Portfolio / Shareholders’ EquityExpanded Loan Portfolio excluding Bank Guarantees and Stand-by Letters of Credit /
Shareholders’ Equity
Credit over Funding ratio: Loan Portfolio excluding Bank Guarantees and Stand-by Letters ofCredit / Total Funding
ALM – Average Maturity Total Deposits over Total FundingR$ millionmonths
53% 53% 57% 59% 64%
Total Deposits Others
8,638 8,3678,797 8,559 8,500
16 16 16
16 17
47% 47% 43% 41% 36%
59% 64%14 14
13 12 12
Funding
15/17Investor Relations | 1Q15 |A parte de imagem com identificação de relação rId28 não foi encontrada no arquivo.
43% 41% 36%
Mar-14 Jun-14 Sept-14 Dec-14 Mar-15Mar-14 Jun-14 Sept-14 Dec-14 Mar-15
Credit

Capital Adequacy Ratio (BIS), Basel III BIS ratio reached 13.0%.
Tier II Tier I
2.1% 2.3%2.2%
1 4% 13 0%
17.1% 17.0%15.9%
14.1% 13.7% 13.7% 13.8% 13.9%
Minimum Regulatory Capital (11%)
15.0% 14 7% 13 7%
2.1% 1.5% 1.5% 1.4% 1.4%0.8%13.0%
15.0% 14.7% 13.7%12.0% 12.2% 12.2% 12.4% 12.4% 12.2%
Mar-13 Jun-13 Sept-13 Dec-13 Mar-14 Jun-14 Sept-14 Dec-14 Mar-15
R$ Million BIS (%)
Tier I 1,232 12.2%
Tier II 85 0.8%
Total 1 317 13.0%
16/17Investor Relations | 1Q15 |A parte de imagem com identificação de relação rId28 não foi encontrada no arquivo.
Total 1,317 13.0%

Investor Relations
Noberto N. Pinheiro Junior
CEO/IRO
Raquel Varela BastosHead of Investor Relations, Marketing & Press
Luiz MaximoInvestor Relations SpecialistInvestor Relations Specialist
Ana LopesInvestor Relations Analyst
Gabriel NettoInvestor Relations Analyst
Phone: (55 11) 3372-5343
www.pine.com/[email protected]
17/17Investor Relations | 1Q15 |A parte de imagem com identificação de relação rId28 não foi encontrada no arquivo.
This report may contain forward-looking statements concerning the business prospects, projections of operating and financial results and growth outlook of PINE. These are merely projections and as suchare based solely on management’s expectations regarding the future of the business. These statements depend substantially on market conditions, the performance of the sector and the Brazilian economy(political and economic changes, volatility in interest and exchange rates, technological changes, inflation, financial disintermediation, competitive pressures on products and prices and changes in taxlegislation) and therefore are subject to change without prior notice.