189449 03 solar pv full web - qualenergia.it that is worth more than ... typical cost and...
TRANSCRIPT

International Renewable Energy Agency
IRENAIREN
AwoRk
INgpApAppE
R
RENEWABLE ENERGY TECHNOLOGIES: COST ANALYSIS SERIES
June 2012
Solar Photovoltaics
Volume 1: Power Sector
Issue 4/5

Unless expressly stated otherwise, the findings, interpretations and conclusions expressed hereinare those of the various IRENA staff members, contributors, consultants and advisers to the IRENASecretariat who prepared the work and do not necessarily represent the views of the InternationalRenewable Energy Agency or its Members. The designations employed and the presentation ofmaterials herein do not imply the expression of any opinion whatsoever on the part of the Secretariatof the International Renewable Energy Agency concerning the legal status of any country, territory,city or area or of its authorities, or concerning the delimitation of its frontiers or boundaries.The term"country" as used in this material also refers, as appropriate, to territories or areas.
Acknowledgement
For further information or to provide feedback, please contact Michael Taylor, IRENA Innovationand Technology Centre, Robert-Schuman-Platz 3, 53175 Bonn, Germany; [email protected].
This working paper is available for download from www.irena.org/Publications
Copyright (c) IRENA 2012Unless otherwise indicated, material in this publication may be used freely, shared or reprinted,but acknowledgement is requested.
About IRENA
The International Renewable Energy Agency (IRENA) is an intergovernmental organisation dedicatedto renewable energy.
In accordance with its Statute, IRENA's objective is to "promote the widespread and increasedadoption and the sustainable use of all forms of renewable energy". This concerns all forms ofenergy produced from renewable sources in a sustainable manner and includes bioenergy,geothermal energy, hydropower, ocean, solar and wind energy.
As of May 2012, the membership of IRENA comprised 158 States and the European Union (EU), outof which 94 States and the EU have ratified the Statute.
This paper was prepared by the IRENA Secretariat. The paper benefitted from an internal IRENAreview, as well as valuable comments and guidance from Zuzana Dobrotkova (IEA), Al Goodrich(NREL), Miller Mackay (NREL), Cedric Philibert (IEA), Giorgio Simbolotti (ENEA) and Professor XIWenhua (UNIDO-ISEC).

Renewable power generation can help countries meet their sustainable development
goals through provision of access to clean, secure, reliable and affordable energy.
Renewable energy has gone mainstream,accounting for the majority of capacity
additions in power generation today.Tens of gigawatts of wind, hydropower and
solar photovoltaic capacity are installed worldwide every year in a renewable energy
market that is worth more than a hundred billion USD annually.Other renewable power
technology markets are also emerging. Recent years have seen dramatic reductions in
renewable energy technologies’ costs as a result of R&D and accelerated deployment.
Yet policy-makers are often not aware of the latest cost data.
International Renewable Energy Agency (IRENA) Member Countries have asked for
better, objective cost data for renewable energy technologies.This working paper
aims to serve that need and is part of a set of five reports on solar pholtovoltaics,wind,
biomass, hydropower and concentrating solar power that address the current costs of
these key renewable power technology options.The reports provide valuable insights
into the current state of deployment, types of technologies available and their costs and
performance.The analysis is based on a range of data sources with the objective of
developing a uniform dataset that supports comparison across technologies of different
cost indicators - equipment, project and levelised cost of electricity – and allows for
technology and cost trends, as well as their variability to be assessed.
The papers are not a detailed financial analysis of project economics. However, they do
provide simple, clear metrics based on up-to-date and reliable information which can be
used to evaluate the costs and performance of different renewable power generation
technologies.These reports help to inform the current debate about renewable power
generation and assist governments and key decision makers to make informed
decisions on policy and investment.
The dataset used in these papers will be augmented over time with new project cost
data collected from IRENA Member Countries.The combined data will be the basis for
forthcoming IRENA publications and toolkits to assist countries with renewable energy
policy development and planning.Therefore,we welcome your feedback on the data
and analysis presented in these papers, and we hope that they help you in your policy,
planning and investment decisions.
Dolf Gielen
Director, Innovation and Technology
Preface
KEY FINDINGS i
LISt oF tabLES aND FIGurES ii
1. INtroDuCtIoN 1
1.1 Different measures of cost
1.2 Levelised cost of electricity generation
2. SoLar PHotoVoLtaIC tECHNoLoGIES 4
2.1 First-generation PV technologies: Crystalline silicon cells
2.2 Second-generation PV technologies:thin-film solar cells
2.3 third-generation PV technologies
2.4 the Solar PV resource
2.5 Summary of PV technologies
3. CurrENt GLobaL PV MarKEt trENDS 12
3.1 total installed PV capacity
3.2 annual PV capacity additions
3.3 Future projections of PV capacity growth
4. CoSt aND PErForMaNCE 15
4.1 Solar PV module price/cost
4.2 balance of system cost
4.3 total PV system costs
5. PV SYStEM CoSt rEDuCtIoN PotENtIaL 28
5.1 Cost reduction potential for c-Si PV modules
5.2 Cost reduction potential for thin-film PV modules
5.3 boS cost reduction potentials
5.4 overall cost reduction potentials for PV systems
5.5 PV module efficiency improvements
6. LEVELISED CoSt oF ELECtrICItY FroM SoLar PV 38
6.1 LCoE EStIMatES For 2011 to 2015
rEFErENCES 42
aCroNYMS 45
Contents
ii Cost Analysis of Solar Photovoltaics

1. At the beginning of 2012, thin-filmmodule prices (factory gate or spot) had fallen below USD 1/watt (W), with pricesbetween USD 0.84 and USD 0.93/W available. The prices of crystalline silicon (c-Si) modules aremore varied, but weretypically in the range USD 1.02 to USD 1.24/W for the most competitive markets. PV module costs have a learningrate of 22%, implying that costs will decline by just over a fifth with every doubling of capacity. Continued rapid costreductions are likely due to the rapid growth in deployment, given that cumulative installed capacity grew by 71% in2011 alone.
Key findings
Module cost,factory gate or spot(2010 USD/W)
Installed cost(2010 USD/W)
Efficiency(%)
Levelised cost ofelectricity
(2010 USD/kWh)
Residential
c-Si PV system 1.02 – 1.24 3.8 – 5.8 14 0.25 – 0.65
c-Si PV system with battery storage 1.02 – 1.24 5 – 6 14 0.36 – 0.71
Utility-scale
Amorphous Si thin film 0.84 – 0.93 3.6 – 5.0 8 – 9 0.26 – 0.59
2. The total installed cost of PV systems can vary widely within individual countries, and between countries and regions.These variations reflect the maturity of domestic markets, local labour and manufacturing costs, incentive levels andstructures, and a range of other factors. At an average of USD 3.8/W for c-Si systems, Germany has the lowest PV systemcosts in the small-scale residentialmarket (<5 kW). In comparison, the average installed cost in 2011 in Italy, Spain, Portugaland the United States was between USD 5.7 to USD 5.8/W.
3. Utility-scale systems using thin-film amorphous silicon, Cadmium Telluride (CdTe) and Copper-Indium-Gallium-Diselenide (CIGS) PV modules tend to have lower capital costs than residential systems in a given market, butthis is not always the case if tracking is included. Thin-film utility-scale systems had an average cost of aroundUSD 3.9/W in 2010, not substantially cheaper than the average cost of a residential c-Si system in Germany
5. Despite the large LCOE range, PV is often already competitive with residential tariffs in regions with good solarresources, low PV system costs and high electricity tariffs for residential consumers. In addition, PVwith storage is nowvirtually always cheaper than diesel generators for the provision of off-grid electricity.
6. The prospects for continued cost reductions are very good. However, the rate at which PV costs will decline is highlyuncertain due to the very rapid growth in the PV market compared to the installed base and the high learning rate forPV. As a result, even small differences in scenarios for PV growth can have a big impact on the projected decline inmodule prices. Leaving aside this uncertainty, the installed costs of a c-Si residential systemmay decline from betweenUSD 3.8 to USD 5.8/W in 2011 to between USD 2.9 to USD 4.1/W in 2015 if current trends continue.
Note: Assumes a 10% cost of capital.
Table 1: Typical cosT and performance values for solar pv sysTems
iCost Analysis of Solar Photovoltaics
in 2011.
4. Despite the impressive declines in PV system costs, the levelised cost of electricity (LCOE) of PV remains high.The LCOE of residential systems without storage assuming a 10% cost of capital was in the range USD 0.25 andUSD 0.65/kWh in 2011. When electricity storage is added, the cost range increases to USD 0.36 and USD 0.71/kWh.The LCOE of current utility-scale thin-film PV systems was estimated to be between USD 0.26 and USD 0.59/kWhin 2011 for thin-film systems.
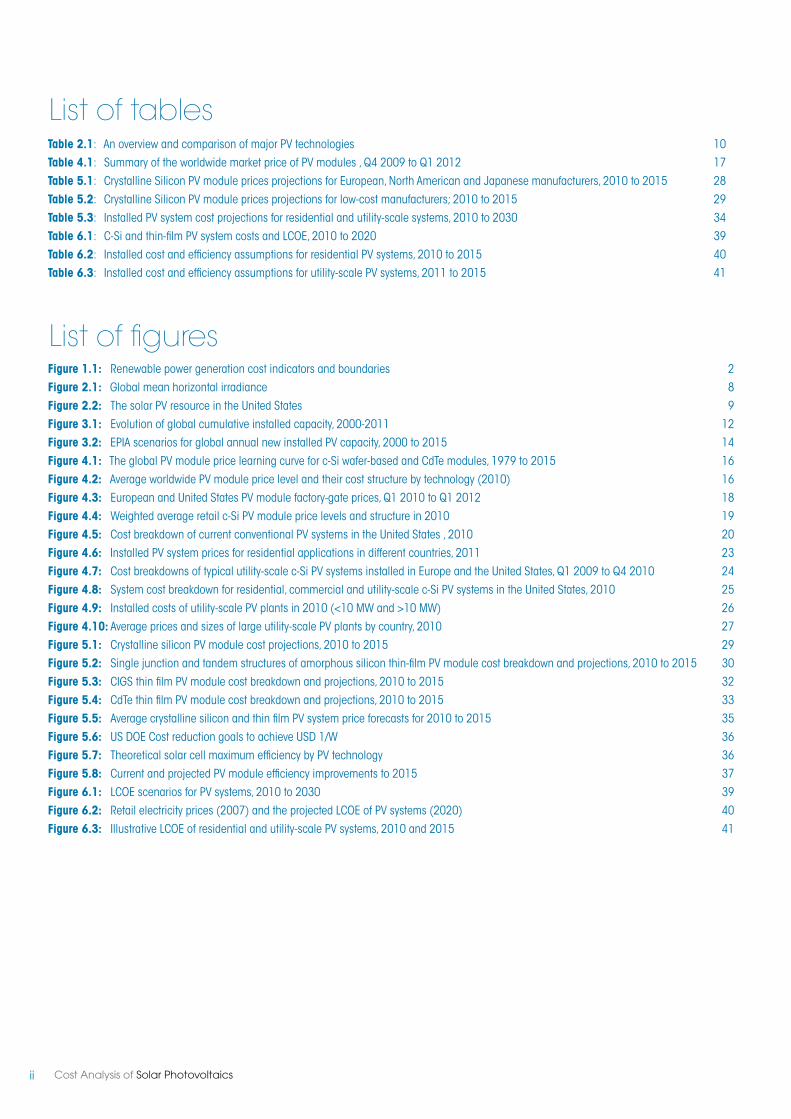
List of tables
List of figures
Table 2.1: an overview and comparison of major PV technologies 10
Table 4.1: Summary of the worldwide market price of PV modules ,Q4 2009 to Q1 2012 17
Table 5.1: Crystalline Silicon PV module prices projections for European,North american and Japanese manufacturers, 2010 to 2015 28
Table 5.2: Crystalline Silicon PV module prices projections for low-cost manufacturers; 2010 to 2015 29
Table 5.3: Installed PV system cost projections for residential and utility-scale systems, 2010 to 2030 34
Table 6.1: C-Si and thin-film PV system costs and LCoE, 2010 to 2020 39
Table 6.2: Installed cost and efficiency assumptions for residential PV systems, 2010 to 2015 40
Table 6.3: Installed cost and efficiency assumptions for utility-scale PV systems, 2011 to 2015 41
Figure 1.1: renewable power generation cost indicators and boundaries 2
Figure 2.1: Global mean horizontal irradiance 8
Figure 2.2: the solar PV resource in the united States 9
Figure 3.1: Evolution of global cumulative installed capacity, 2000-2011 12
Figure 3.2: EPIa scenarios for global annual new installed PV capacity, 2000 to 2015 14
Figure 4.1: the global PV module price learning curve for c-Si wafer-based and Cdte modules, 1979 to 2015 16
Figure 4.2: average worldwide PV module price level and their cost structure by technology (2010) 16
Figure 4.3: European and united States PV module factory-gate prices,Q1 2010 to Q1 2012 18
Figure 4.4: Weighted average retail c-Si PV module price levels and structure in 2010 19
Figure 4.5: Cost breakdown of current conventional PV systems in the united States , 2010 20
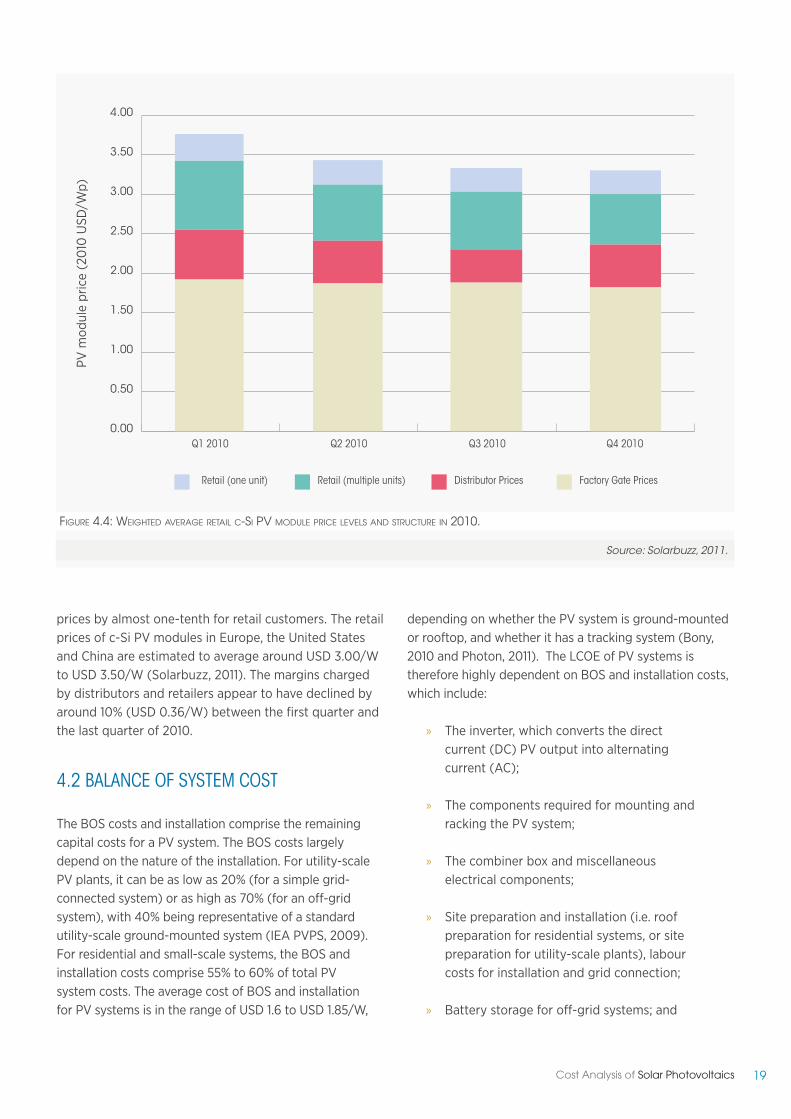
Figure 4.6: Installed PV system prices for residential applications in different countries, 2011 23
Figure 4.7: Cost breakdowns of typical utility-scale c-Si PV systems installed in Europe and the united States,Q1 2009 to Q4 2010 24
Figure 4.8: System cost breakdown for residential, commercial and utility-scale c-Si PV systems in the united States, 2010 25
Figure 4.9: Installed costs of utility-scale PV plants in 2010 (<10 MW and >10 MW) 26
Figure 4.10: average prices and sizes of large utility-scale PV plants by country, 2010 27
Figure 5.1: Crystalline silicon PV module cost projections, 2010 to 2015 29
Figure 5.2: Single junction and tandem structures of amorphous silicon thin-film PV module cost breakdown and projections, 2010 to 2015 30
Figure 5.3: CIGS thin film PV module cost breakdown and projections, 2010 to 2015 32
Figure 5.4: Cdte thin film PV module cost breakdown and projections, 2010 to 2015 33
Figure 5.5: average crystalline silicon and thin film PV system price forecasts for 2010 to 2015 35
Figure 5.6: uS DoE Cost reduction goals to achieve uSD 1/W 36
Figure 5.7: theoretical solar cell maximum efficiency by PV technology 36
Figure 5.8: Current and projected PV module efficiency improvements to 2015 37
Figure 6.1: LCoE scenarios for PV systems, 2010 to 2030 39
Figure 6.2: retail electricity prices (2007) and the projected LCoE of PV systems (2020) 40
Figure 6.3: Illustrative LCoE of residential and utility-scale PV systems, 2010 and 2015 41
ii Cost Analysis of Solar Photovoltaics
1Cost Analysis of Solar Photovoltaics
1. Introduction
Without access to reliable information on the relativecosts and benefits of renewable energy technologiesit is difficult, if not impossible, for governments toarrive at an accurate assessment of which renewableenergy technologies are the most appropriate for theirparticular circumstances. These papers fill a significantgap in information availability because there is a lackof accurate, comparable, reliable and up-to-date dataon the costs and performance of renewable energytechnologies. The rapid growth in installed capacity ofrenewable energy technologies and the associated costreductions mean that even data one or two years oldcan significantly overestimate the cost of electricity fromrenewable energy technologies. There is also a significantamount of perceived knowledge about the cost andperformance of renewable power generation that is notaccurate or even misleading. Conventions on how tocalculate costs can influence the outcome significantlyand it is imperative that these are well-documented.
The absence of accurate and reliable data on the costand performance of renewable power generationtechnologies is therefore a significant barrier to theuptake of these technologies. Providing this informationwill help governments, policy-makers, investors andutilities make informed decisions about the rolerenewable energy can play in their power generationmix. This paper examines the fixed and variable costcomponents of solar photovoltaics (PV), by country andregion and provides the levelised cost of electricity fromsolar PV, given a number of key assumptions. This up-to-date analysis of the costs of generating electricity fromsolar PV will allow a fair comparison of solar PV withother generating technologies.1
R enewable energy technologies can help countries meet their policy goals for secure, reliable and affordableenergy to expand electricity access and promote development. This paper is part of a series on the costs
and performance of renewable energy technologies produced by IRENA. The goal of these papers is to assistgovernment decision-making and ensure that governments have access to up-to-date and reliable information onthe costs and performance of renewable energy technologies.
1.1 DIFFErENt MEaSurES oF CoSt
Cost can be measured in a number of different ways,and each way of accounting for the cost of powergeneration brings its own insights. The costs that can beexamined include equipment costs (e.g. PV modules),financing costs, total installed cost, fixed and variableoperating and maintenance costs (O&M), fuel costs andthe levelised cost of energy (LCOE).
The analysis of costs can be very detailed, but forcomparison purposes and transparency, the approachused here is a simplified one. This allows greater scrutinyof the underlying data and assumptions, improvingtransparency and confidence in the analysis, as well asfacilitating the comparison of costs by country or regionfor the same technologies in order to identify what arethe key drivers in any differences.
The three indicators that have been selected are:
» Equipment cost (factory gate FOB anddelivered at site CIF);
» Total installed project cost, including fixedfinancing costs2; and
» The levelised cost of electricity.
The analysis in this paper focuses on estimating the costof solar PV energy from the perspective of a privateinvestor, whether they are a state-owned electricitygeneration utility, an independent power producer oran individual or community looking to invest in small-
1 IRENA, through its other work programmes, is also looking at the costs and benefits, as well as the macroeconmic impacts, of renewable powergeneration technologies. See WWW.IRENA.ORG for further details.2Banks or other financial institutions will often charge a fee, such as a percentage of the total funds sought, to arrange the debt financing of a project.These costs are often reported separately under project development costs.
2 Cost Analysis of Solar Photovoltaics
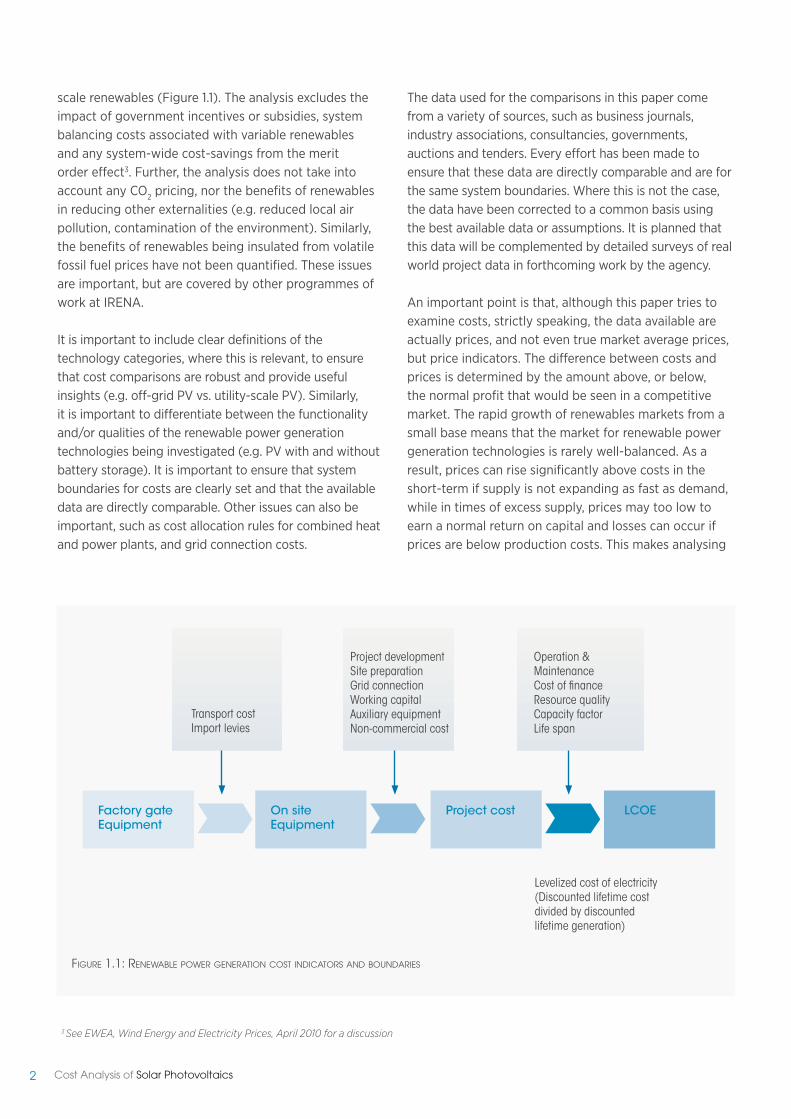
scale renewables (Figure 1.1). The analysis excludes theimpact of government incentives or subsidies, systembalancing costs associated with variable renewablesand any system-wide cost-savings from the meritorder effect3. Further, the analysis does not take intoaccount any CO2 pricing, nor the benefits of renewablesin reducing other externalities (e.g. reduced local airpollution, contamination of the environment). Similarly,the benefits of renewables being insulated from volatilefossil fuel prices have not been quantified. These issuesare important, but are covered by other programmes ofwork at IRENA.
It is important to include clear definitions of thetechnology categories, where this is relevant, to ensurethat cost comparisons are robust and provide usefulinsights (e.g. off-grid PV vs. utility-scale PV). Similarly,it is important to differentiate between the functionalityand/or qualities of the renewable power generationtechnologies being investigated (e.g. PV with and withoutbattery storage). It is important to ensure that systemboundaries for costs are clearly set and that the availabledata are directly comparable. Other issues can also beimportant, such as cost allocation rules for combined heatand power plants, and grid connection costs.
figure 1.1: renewable power generaTion cosT indicaTors and boundaries
The data used for the comparisons in this paper comefrom a variety of sources, such as business journals,industry associations, consultancies, governments,auctions and tenders. Every effort has been made toensure that these data are directly comparable and are forthe same system boundaries. Where this is not the case,the data have been corrected to a common basis usingthe best available data or assumptions. It is planned thatthis data will be complemented by detailed surveys of realworld project data in forthcoming work by the agency.
An important point is that, although this paper tries toexamine costs, strictly speaking, the data available areactually prices, and not even true market average prices,but price indicators. The difference between costs andprices is determined by the amount above, or below,the normal profit that would be seen in a competitivemarket. The rapid growth of renewables markets from asmall base means that the market for renewable powergeneration technologies is rarely well-balanced. As aresult, prices can rise significantly above costs in theshort-term if supply is not expanding as fast as demand,while in times of excess supply, prices may too low toearn a normal return on capital and losses can occur ifprices are below production costs. This makes analysing
3See EWEA, Wind Energy and Electricity Prices, April 2010 for a discussion
Factory gateEquipment
transport costImport levies
Project developmentSite preparationGrid connectionWorking capitalauxiliary equipmentNon-commercial cost
operation &MaintenanceCost of financeresource qualityCapacity factorLife span
Levelized cost of electricity(Discounted lifetime costdivided by discountedlifetime generation)
On siteEquipment
Project cost LCOE

3Cost Analysis of Solar Photovoltaics
the cost of renewable power generation technologieschallenging and every effort is made to indicate whethercurrent equipment costs are above or below their long-term trend.
The cost of equipment at the factory gate is oftenavailable from market surveys or from other sources.A key difficulty is often reconciling different sourcesof data to identify why data for the same period differ.The balance of capital costs in total project coststends to vary even more widely than power generationequipment costs, as it is often based on significant localcontent, which depends on the cost structure of wherethe project is being developed. Total installed costs cantherefore vary significantly by project, country and regiondepending on a wide range of factors.
1.2 LEVELISED CoSt oF ELECtrICItYGENEratIoN
The LCOE of renewable energy technologies varies bytechnology, country and project based on the renewableenergy resource, capital and operating costs, andthe efficiency / performance of the technology. Theapproach used in the analysis presented here is based ona discounted cash flow (DCF) analysis. This method ofcalculating the cost of renewable energy technologies isbased on discounting financial flows (annual, quarterlyor monthly) to a common basis, taking into considerationthe time value of money. Given the capital intensivenature of most renewable power generation technologiesand the fact that fuel costs are low, or often zero, theweighted average cost of capital (WACC), often alsoreferred to as the discount rate, used to evaluate theproject has a critical impact on the LCOE.
There are many potential trade-offs to be consideredwhen developing an LCOE modelling approach. Theapproach taken here is relatively simplistic, given the factthat the model needs to be applied to a wide range oftechnologies in different countries and regions. However,this has the additional advantage that the analysis istransparent and easy to understand. In addition, moredetailed LCOE analyses result in a significantly higheroverhead in terms of the granularity of assumptions
4 An analysis based on nominal values with specific inflation assumptions for each of the cost components is beyond the scope of this analysis. Projectdevelopers will develop their own specific cash-flow models to identify the profitability of a project from their perspective.
required. This often gives the impression of greateraccuracy, but when it is not possible to robustlypopulate the model with assumptions, or to differentiateassumptions based on real world data, then the“accuracy” of the approach can be misleading.
The formula used for calculating the LCOE of renewableenergy technologies is:
Where:
LCOE = the average lifetime levelised cost of electricitygeneration;It = investment expenditures in the year t;Mt = operations and maintenance expenditures in theyear t;Ft = fuel expenditures in the year t;Et = electricity generation in the year t;r = discount rate; andn = economic life of the system.
All costs presented in this paper are real 2010 USD; that isto say, after inflation has been taken into account, unlessotherwise stated.4 The LCOE is the price of electricityrequired for a project where revenues would equal costs,including making a return on the capital invested equalto the discount rate. An electricity price above this wouldyield a greater return on capital, while a price below itwould yielder a lower return on capital, or even a loss.
As already mentioned, although different cost measuresare useful in different situations, the LCOE of renewableenergy technologies is a widely used measure bywhich renewable energy technologies can be evaluatedfor modelling or policy development. Similarly, moredetailed DCF approaches taking into account taxation,subsidies and other incentives are used by renewableenergy project developers to assess the profitability ofreal world projects.
Σ
Σ
nt = 1
nt = 1
It + Mt + Ft(1+r)t
Et(1+r)t
LCOE =

4 Cost Analysis of Solar Photovoltaics
2. Solar photovoltaictechnologies
P hotovoltaics, also called solar cells, are electronicdevices that convert sunlight directly into
electricity5. The modern form of the solar cell wasinvented in 1954 at Bell Telephone Laboratories. Today,PV is one of the fastest growing renewable energytechnologies and it is expected that it will play a majorrole in the future global electricity generation mix.Solar PV systems are also one of the most “democratic”renewable technologies, in that their modular sizemeans that they are within the reach of individuals,co-operatives and small-businesses who want to accesstheir own generation and lock-in electricity prices.
PV technology offers a number of significant benefits,including:
» Solar power is a renewable resource that isavailable everywhere in the world.
» Solar PV technologies are small andhighly modular and can be used virtuallyanywhere, unlike many other electricitygeneration technologies.
» Unlike conventional power plants using coal,nuclear, oil and gas; solar PV has no fuel costsand relatively low operation and maintenance(O&M) costs. PV can therefore offer a pricehedge against volatile fossil fuel prices.
» PV, although variable, has a highcoincidence with peak electricity demanddriven by cooling in summer and year roundin hot countries.
A PV system consists of PV cells that are groupedtogether to form a PV module, and the auxiliarycomponents (i.e. balance of system - BOS), including the
inverter, controls, etc. There are a wide range of PV celltechnologies on the market today, using different typesof materials, and an even larger number will be availablein the future. PV cell technologies are usually classifiedinto three generations, depending on the basic materialused and the level of commercial maturity:
» First-generation PV systems (fullycommercial) use the wafer-based crystallinesilicon (c-Si) technology, either singlecrystalline (sc-Si) or multi-crystalline (mc-Si).
» Second-generation PV systems (earlymarket deployment) are based on thin-filmPV technologies and generally includethree main families: 1) amorphous (a-Si)and micromorph silicon (a-Si/µc-Si); 2)Cadmium-Telluride (CdTe); and 3) Copper-Indium-Selenide (CIS) and Copper-Indium-Gallium-Diselenide (CIGS).
» Third-generation PV systems includetechnologies, such as concentrating PV(CPV) and organic PV cells that are stillunder demonstration or have not yet beenwidely commercialised, as well as novelconcepts under development.
2.1 FIrSt-GENEratIoN PV tECHNoLoGIES:CrYStaLLINE SILICoN CELLS
Silicon is one of the most abundant elements in theearth‘s crust. It is a semiconductor material suitablefor PV applications, with energy band gap6 of 1.1eV.Crystalline silicon is the material most commonly usedin the PV industry, and wafer-based c-Si PV cells andmodules dominate the current market. This is a mature
5 The Photovoltaic effect is when two different (or differently doped) semiconducting materials (e.g. silicon, germanium), in close contact with eachother generate an electrical current when exposed to sunlight. The sunlight provides the electrons with the energy needed to leave their bounds andcross the junction between the two materials. This occurs more easily in one direction than in the other and gives one side of the junction a negativecharge with respect to the other side (p-n junction), thus generating a voltage and a direct current (DC). PV cells work with direct and diffusedlight and generate electricity even during cloudy days, though with reduced production and conversion efficiency. Electricity production is roughlyproportional to the solar irradiance, while efficiency is reduced only slowly as solar irradiance declines.6The energy needed to produce electron excitation and to activate the PV process.

5Cost Analysis of Solar Photovoltaics
technology that utilises the accumulated knowledge basedeveloped within the electronic industry. This type ofsolar cell is in mass production and individual companieswill soon be producing it at the rate of several hundredMW a year and even at the GW-scale. The manufacturingprocess of wafer-based silicon PV modules comprisesfour steps:
1. Polysilicon production;
2. Ingot/wafer production;
3. Cell production; and
4. Module assembly.
Crystalline silicon cells are classified into three main typesdepending on how the Si wafers are made. They are:
» Monocrystalline (Mono c-Si) sometimesalso called single crystalline (sc-Si);
» Polycrystalline (Poly c-Si), sometimesreferred to as multi-crystalline (mc-Si); and
» EFG ribbon silicon and silicon sheet-definedfilm growth (EFG ribbon-sheet c-Si).
Commercial production of c-Si modules began in 1963when Sharp Corporation of Japan started producingcommercial PV modules and installed a 242 Watt (W) PVmodule on a lighthouse, the world’s largest commercialPV installation at the time (Green, 2001). Crystallinesilicon technologies accounted for about 87% of globalPV sales in 2010 (Schott Solar, 2011). The efficiencyof crystalline silicon modules ranges from 14% to 19%(see Table 2.1).7 While a mature technology, continuedcost reductions are possible through improvementsin materials and manufacturing processes, and fromeconomies of scale if the market continues to grow,enabling a number of high-volume manufacturers toemerge.
2.2 SECoND-GENEratIoN PVtECHNoLoGIES:tHIN-FILM SoLar CELLS
After more than 20 years of R&D, thin-film solar cellsare beginning to be deployed in significant quantities.Thin-film solar cells could potentially provide lower costelectricity than c-Si wafer-based solar cells. However,this isn’t certain, as lower capital costs, due to lowerproduction and materials costs, are offset to some extentby lower efficiencies and very low c-Si module costsmake the economics even more challenging. Thin-filmsolar cells are comprised of successive thin layers, just1 to 4 µm thick, of solar cells deposited onto a large,inexpensive substrate such as glass, polymer, or metal.As a consequence, they require a lot less semiconductormaterial to manufacture in order to absorb the sameamount of sunlight (up to 99% less material thancrystalline solar cells). In addition, thin films can bepackaged into flexible and lightweight structures, whichcan be easily integrated into building components(building-integrated PV, BIPV). The three primary typesof thin-film solar cells that have been commerciallydeveloped are:
» Amorphous silicon (a-Si and a-Si/µc-Si);
» Cadmium Telluride (Cd-Te); and
» Copper-Indium-Selenide (CIS) and Copper-Indium-Gallium-Diselenide (CIGS).
Amorphous silicon solar cells, along with CdTe PV cells,are the most developed and widely known thin-film solarcells. Amorphous silicon can be deposited on cheap andvery large substrates (up to 5.7 m² of glass) based oncontinuous deposition techniques, thus considerablyreducing manufacturing costs. A number of companiesare also developing light, flexible a-Si modules perfectlysuitable for flat and curved surfaces, such as roofsand facades. Currently, amorphous silicon PV moduleefficiencies are in the range 4% to 8%. Very small cells atlaboratory level may reach efficiencies of 12.2% (Mehta,2010). The main disadvantage of amorphous silicon
7 It is important to be aware of the hierarchy of efficiency in PV, as a number of efficiencies can be quoted. The highest efficiency for a PV material isusually the “laboratory” efficiency, where optimum designs are tested. PV cell efficiencies are less than this, because compromises are often required tomake affordable cells. Module efficiency is somewhat lower than cell efficiency, given the losses involved in the PV module system.

6 Cost Analysis of Solar Photovoltaics
2.3 tHIrD-GENEratIoN PV tECHNoLoGIES
Third-generation PV technologies are at the pre-commercial stage and vary from technologies underdemonstration (e.g. multi-junction concentratingPV) to novel concepts still in need of basic R&D (e.g.quantum-structured PV cells). Some third-generation PVtechnologies are beginning to be commercialised, but itremains to be seen how successful they will be in takingmarket share from existing technologies. There are fourtypes of third-generation PV technologies:
» Concentrating PV (CPV);
» Dye-sensitized solar cells (DSSC);
» Organic solar cells; and
» Novel and emerging solar cell concepts.
Concentrating photovoltaic technologyConcentrating PV (CPV) systems utilise optical devices,such as lenses or mirrors, to concentrate direct solarradiation onto very small, highly efficient multi-junctionsolar cells made of a semiconductor material. Thesunlight concentration factor ranges from 2 to 100suns (low- to medium-concentration) up to 1 000 suns(high concentration). To be effective, the lenses needto be permanently oriented towards the sun, using asingle- or double-axis tracking system for low and highconcentrations, respectively. Cooling systems (active orpassive) are needed for some concentrating PV designs,while other novel approaches can get round this need.
Low- to medium-concentration systems (up to 100 suns)can be combined with silicon solar cells, but highertemperatures will reduce their efficiency, while highconcentration systems (beyond 500 suns) are usuallyassociated with multi-junction solar cells made bysemiconductor compounds from groups III and V of theperiodic table (e.g. gallium arsenide), which offer thehighest PV conversion efficiency. Multi-junction (either‘tandem’ or ‘triple’ junction) solar cells consist of a stackof layered p–n junctions, each made from a distinct setof semiconductors, with different band gap and spectralabsorption to absorb as much of the solar spectrum aspossible. Most commonly employed materials are
solar cells is that they suffer from a significant reductionin power output over time (15% to 35%), as the sundegrades their performance. Even thinner layers couldincrease the electric field strength across the materialand provide better stability and less reduction in poweroutput, but this reduces light absorption and hence cellefficiency. A notable variant of amorphous silicon solarcells is the multi-junction thin-film silicon (a-Si/µc-Si)which consists of a-Si cell with additional layers of a-Siand micro-crystalline silicon (µc-Si) applied onto thesubstrate.8 The advantage of the µc-Si layer is that itabsorbs more light from the red and near infrared part ofthe light spectrum, thus increasing the efficiency by upto 10%. The thickness of the µc-Si layer is in the order of3 µm and makes the cells thicker and more stable. Thecurrent deposition techniques enable the production ofmulti-junction thin-films up to 1.4 m².
Cadmium Telluride thin-film PV solar cells have lowerproduction costs and higher cell efficiencies (up to16.7% [Green, 2011]) than other thin-film technologies.This combination makes CdTe thin-films the mosteconomical thin-film technology currently available, withmanufacturing costs of under USD 0.75/W achieved byat least one producer (First Solar, 2011). The two mainraw materials are cadmium and tellurium. Cadmiumis a by-product of zinc mining and tellurium is a by-product of copper processing. A potential problem isthat tellurium is produced in far lower quantities thancadmium and availability in the long-term may dependon whether the copper industry can optimise extraction,refining and recycling yields. Cadmium also has issuesaround its toxicity that may limit its use.
Copper-Indium-Selenide (CIS) and Copper-Indium-Gallium-Diselenide (CIGS) PV cells offer the highestefficiencies of all thin-film PV technologies. CIS solarcell production has been successfully commercialised bymany firms in conjunction with universities (e.g. WurthSolar, Solibro, Miasole, Nanosolar, Avancis, SolarFrontierand Honda Soltec). Current module efficiencies are inthe range of 7% to 16%, but efficiencies of up to 20.3%have been achieved in the laboratory, close to that of c-Sicells (ZSW, 2010 and Green, 2011). The race is now on toincrease the efficiency of commercial modules. By 2010,CIGS producer Solar Frontier has reached an annualproduction capacity of 1 GW (Bank Sarasin, 2010).
8 These are sometimes also referred to as micromorphous silicon cells.
7Cost Analysis of Solar Photovoltaics
Ge (0.67 eV), GaAs or InGaAs (1.4 eV), and InGaP (1.85eV). A triple-junction cell with band gaps of 0.74, 1.2 and1.8 eV would reach a theoretical efficiency of 59%. Giventheir complexity and costs, multi-junctions are used forsmall-area solar cells with high sunlight concentration orin space applications (Nature Photonics, 2010).
Commercial CPV modules with silicon-based cells offerefficiency in the range of 20% to 25%. CPV based onmulti-junction solar cells using III-V semiconductors haveachieved laboratory efficiency of more than 40% (IEA,2010).9 Commercial multi-junction devices manufacturedby Sharp, Emcore, Spectrolab and Azur have efficienciesof around 35% - significantly higher than conventionalsingle-junction c-SI solar cells. Continued R&D holds thepromise of increasing CPV efficiencies up to 45% or even50% (Cotal, 2009).
To maximise the electricity generation, CPV modulesneed to be permanently oriented towards the sun, usinga single- or double-axis sun-tracking system. Multi-junction solar cells, along with sun-tracking systems,result in expensive CPV modules in comparison withconventional PV. On the other hand, their higherefficiency and the smaller surface area of active materialrequired may eventually compensate for the highercosts, depending on the evolution of costs and efficiency.Because CPV modules rely on direct sunlight, they needto be used in regions with clear skies and high directsolar irradiation to maximise performance.
Dye-sensitized solar cellsDye-sensitized solar cells use photo-electrochemicalsolar cells, which are based on semiconductor structuresformed between a photo-sensitised anode and anelectrolyte. In a typical DSSC, the semiconductornanocrystals serve as antennae that harvest the sunlight(photons) and the dye molecule is responsible for thecharge separation (photocurrent)10. It is unique in thatit mimics natural photosynthesis (Grätzel, 1991). Thesecells are attractive because they use low-cost materialsand are simple to manufacture. They release electronsfrom, for example, titanium dioxide covered by a light-absorbing pigment. However, their performance candegrade over time with exposure to UV light and the useof a liquid electrolyte can be problematic when there is arisk of freezing.
Laboratory efficiencies of around 12% have beenachieved due to the development of new broadbanddyes and electrolytes (Grätzel, 2009), however,commercial efficiencies are low - typically under 4% to5%. The main reason why efficiencies of DSSC are low isbecause there are very few dyes that can absorb a broadspectral range. An interesting area of research is the useof nanocrystalline semiconductors that can allow DSSCsto have a broad spectral coverage. Thousands of organicdyes have been studied and tested in order to design,synthesise and assemble nanostructured materials thatwill allow higher power conversion efficiencies for DSSCs.
organic solar cellsOrganic solar cells are composed of organic or polymermaterials (such as organic polymers or small organicmolecules). They are inexpensive, but not very efficient.They are emerging as a niche technology, but theirfuture development is not clear. Their success in recentyears has been due to many significant improvementsthat have led to higher efficiencies. Organic PVmodule efficiencies are now in the range 4% to 5% forcommercial systems and 6% to 8% in the laboratory(OrgaPVnet, 2009).
In addition to the low efficiency, a major challengefor organic solar cells is their instability over time.Suppliers of organic solar cells are moving towards fullcommercialisation and have announced plans to increaseproduction to more than 1 GW by 2012 (EPIA, 2011a).Organic cell production uses high-speed and low-temperature roll-to-roll manufacturing processes andstandard printing technologies. As a result, organic solarcells may be able to compete with other PV technologiesin some applications, because manufacturing costs arecontinuing to decline and are expected to reachUSD 0.50/W by 2020 (EPIA, 2011a).
Organic cells can be applied to plastic sheets in a mannersimilar to the printing and coating industries, meaning thatorganic solar cells are lightweight and flexible, makingthem ideal for mobile applications and for fitting to avariety of uneven surfaces. This makes them particularlyuseful for portable applications, a first target market forthis technology. Potential uses include battery chargersfor mobile phones, laptops, radios, flashlights, toys andalmost any hand-held device that uses a battery. The
9Solar Junctions (U.S.) reported that USDOE NREL has confirmed that the III-V multi-junction CPV cell developed by Solar Junctions has achieved arecord 43.5% efficiency at greater than 400 suns and preserved an efficiency as high as 43% out to 1000 suns (Solar Junction, 2011).10This type solar cell is also known as the Grätzel cell, after its inventor Michael Grätzel.

8 Cost Analysis of Solar Photovoltaics
modules can be fixed almost anywhere to anything, orthey can be incorporated into the housing of a device.They can also be rolled up or folded for storage when notin use. These properties will make organic PV modulesattractive for building-integrated applications as it willexpand the range of shapes and forms where PV systemscan be applied. Another advantage is that the technologyuses abundant, non-toxic materials and is based on a veryscalable production process with high productivity.
Novel and emerging solar cell conceptsIn addition to the above mentioned third-generationtechnologies, there are a number of novel solar celltechnologies under development that rely on usingquantum dots/wires, quantum wells, or super latticetechnologies (Nozik, 2011 and Raffaelle, 2011). Thesetechnologies are likely to be used in concentratingPV technologies where they could achieve very highefficiencies by overcoming the thermodynamic limitationsof conventional (crystalline) cells. However, these high-
efficiency approaches are in the fundamental materialsresearch phase. Furthest from the market are the novelconcepts, often incorporating enabling technologies suchas nanotechnology, which aim to modify the active layerto better match the solar spectrum (Leung, 2011).
2.4 tHE SoLar PV rESourCE
Solar PV systems operate in the presence of direct ordiffuse solar irradiation. The higher the level of solarresource, the lower the LCOE will be. Siting solar PVsystems in areas with high solar resources, usuallyexpressed as annual mean figures in kWh/m2/year oras kWh/m2/day, will therefore minimise the cost ofelectricity from solar PV.
The global solar resource is massive. Around 885million TWh worth of solar radiation reaches the Earth’ssurface each year (IEA, 2011). The solar resource varies
figure 2.1: global mean horizonTal irradiance
Source: 3Tier, 2012.
9Cost Analysis of Solar Photovoltaics
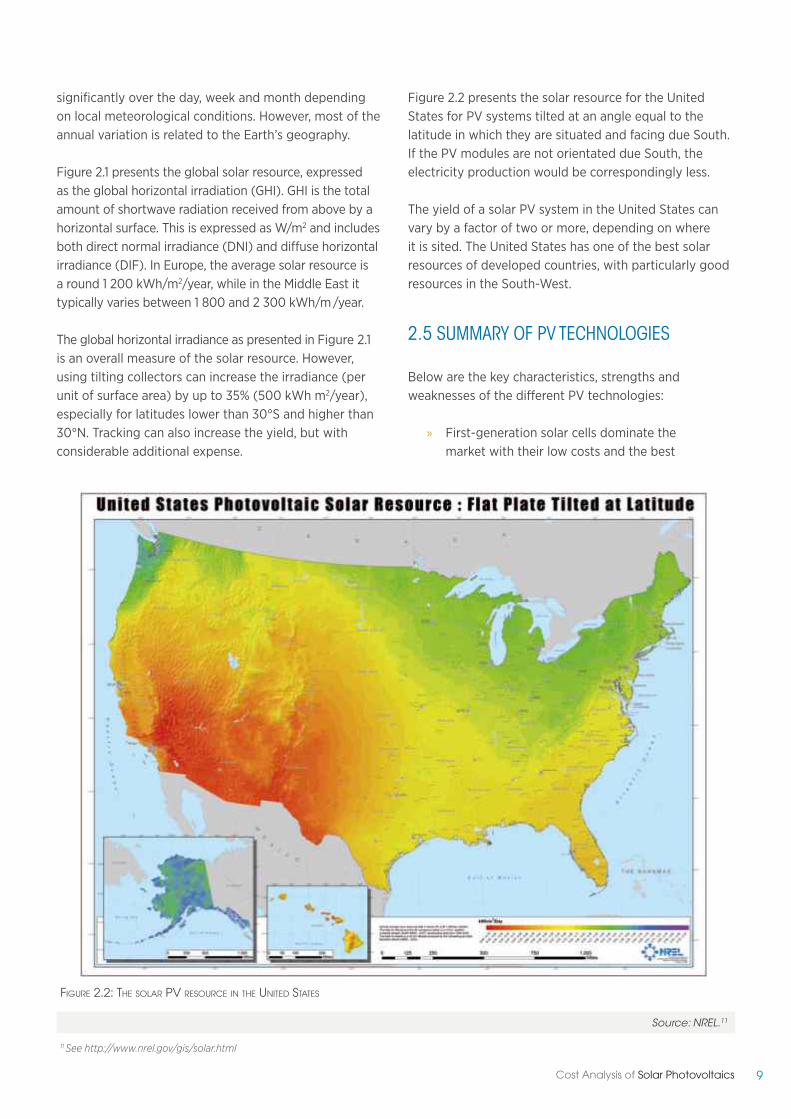
Figure 2.2 presents the solar resource for the UnitedStates for PV systems tilted at an angle equal to thelatitude in which they are situated and facing due South.If the PV modules are not orientated due South, theelectricity production would be correspondingly less.
The yield of a solar PV system in the United States canvary by a factor of two or more, depending on whereit is sited. The United States has one of the best solarresources of developed countries, with particularly goodresources in the South-West.
2.5 SuMMarY oF PV tECHNoLoGIES
Below are the key characteristics, strengths andweaknesses of the different PV technologies:
» First-generation solar cells dominate themarket with their low costs and the best
significantly over the day, week and month dependingon local meteorological conditions. However, most of theannual variation is related to the Earth’s geography.
Figure 2.1 presents the global solar resource, expressedas the global horizontal irradiation (GHI). GHI is the totalamount of shortwave radiation received from above by ahorizontal surface. This is expressed as W/m2 and includesboth direct normal irradiance (DNI) and diffuse horizontalirradiance (DIF). In Europe, the average solar resource isa round 1 200 kWh/m2/year, while in the Middle East ittypically varies between 1 800 and 2 300 kWh/m/year.
The global horizontal irradiance as presented in Figure 2.1is an overall measure of the solar resource. However,using tilting collectors can increase the irradiance (perunit of surface area) by up to 35% (500 kWh m2/year),especially for latitudes lower than 30°S and higher than30°N. Tracking can also increase the yield, but withconsiderable additional expense.
figure 2.2: The solar pv resource in The uniTed sTaTes
Source: NREL.11
11See http://www.nrel.gov/gis/solar.html

10 Cost Analysis of Solar Photovoltaics
Tabl
e2.1:
an
over
view
and
compa
riso
nofmajo
rpv
Technolo
gies
*Note:StandardTestingConditions,temperature25
oC,lightintensity1000W/m
2 ,airmass1.5.
1stGen
eratio
nPV
2ndGen
eratio
nPV
3rdGen
eratio
nPV
Technology
Units
Single
crystalline
silic
on(sc-Si)
Polycrystalline
silic
on(p
c-Si)
Amorp
houssilic
on
(a-Si)
CopperIndium
Gallium
Diselenide(C
IS/
CIG
S)
Cadmium
Tellu
rideso
lar
cells
(CdTe
)
III-V
compound
Multijunctio
n,
Concentra
tedPV
(CPV
)
Dye
-sensitized
(DSS
C)
Organic
or
Polymer
(OPV
)
Best
rese
archso
larc
ell
efficiencyatA
M1.5*
%24
.710
.4Single
junctio
n13
.2Ta
ndem
20.3
16.5
43.5
11.1
11.1
Confirmedso
larc
ell
efficiencyatA
M1.5
%20
-24
14-18
6-8
10-12
8-10
36-41
8.8
8.3
CommercialPVModule
effic
ienc
yatA
M1.5
%15
-19
13-15
5-8
7-11
8-11
25-30
1-5
1
Confirmedmaximum
PVModule
efficiency
%23
167.1/
10.0
12.1
11.2
25-
-
Curre
ntP
Vmodule
cost
USD
/W<1.4
<1.4
~0.8
~0.9
~0.9
--
-
Markets
hare
in20
09%
833
113
--
-
Markets
hare
in20
10%
872
29
--
-
Maximum
PVmodule
outputp
ower
W32
030
012
012
012
0-
-
PVmodule
size
m2
2.0
1.4-2.5
1.4
0.6-1.0
0.72
--
-
Areaneededperk
Wm
27
815
1011
--
-
State
of
commercialisatio
nMature
with
large-
scale
productio
nMature
with
large-scale
productio
n
Early
deploym
ent
phase
,medium-
scale
productio
n
Early
deploym
ent
phase
,medium-
scale
productio
n
Early
deploym
ent
phase
,sm
all-sc
ale
productio
n
Just
commercialised,
small-sc
ale
productio
n
R&D
phase
R&D
phase
11Cost Analysis of Solar Photovoltaics
commercially available efficiency. Theyare a relatively mature PV technology,with a wide range of well-establishedmanufacturers. Although very significantcost reductions occurred in recent years,the costs of the basic materials arerelatively high and it is not clear whetherfurther cost reductions will be sufficient toachieve full economic competitiveness inthe wholesale power generation market inareas with modest solar resources.
» Second-generation thin-film PVtechnologies are attractive because oftheir low material and manufacturingcosts, but this has to be balanced by lowerefficiencies than those obtained fromfirst-generation technologies. Thin-filmtechnologies are less mature than first-
generation PV and still have a modestmarket share, except for utility-scalesystems. They are struggling to competewith very low c-Si module prices andalso face issues of durability, materialsavailability and materials toxicity (in thecase of Cadmium).
» Third-generation technologies are yet to becommercialised at any scale. ConcentratingPV has the potential to have the highestefficiency of any PV module, although it is notclear at what cost premium. Other organicor hybrid organic/conventional (DSSC) PVtechnologies are at the R&D stage. They offerlow efficiency, but also low cost and weight,and free-form shaping. Therefore, they couldfill niche markets (e.g. mobile applications)where these features are required.
UN Photo library
12 Cost Analysis of Solar Photovoltaics
3.Current globalPV market trends
3.1 totaL INStaLLED PV CaPaCItY
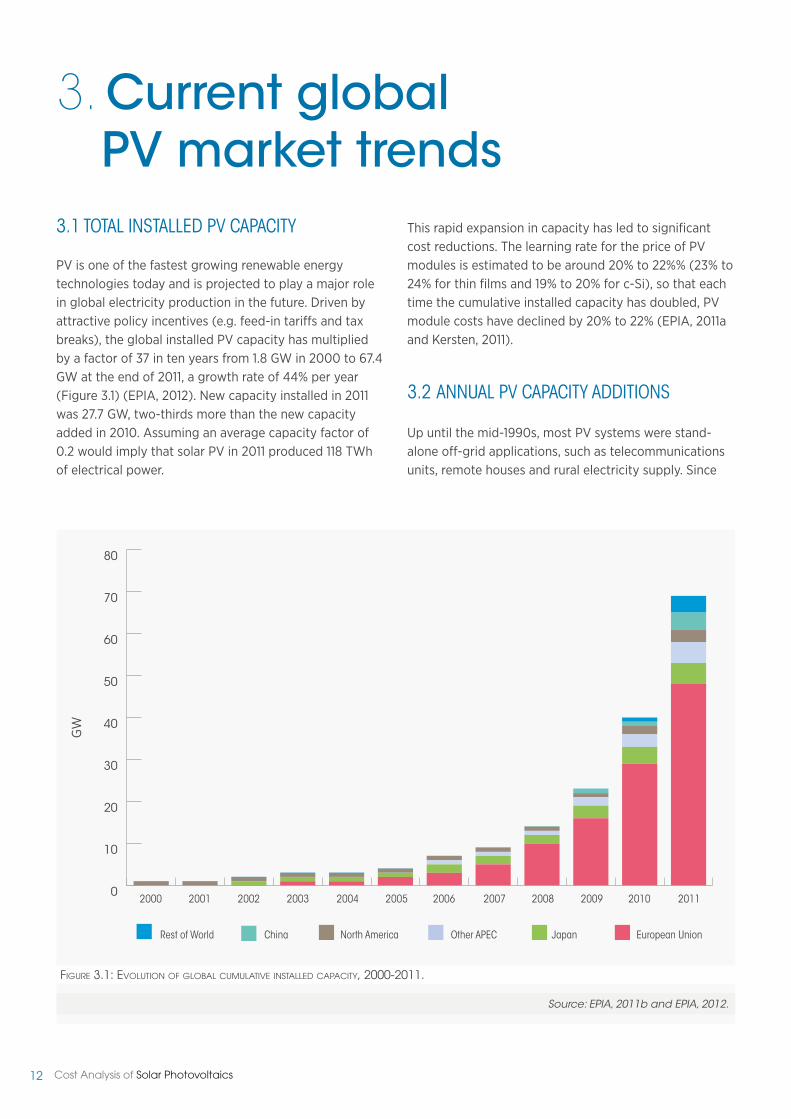
PV is one of the fastest growing renewable energytechnologies today and is projected to play a major rolein global electricity production in the future. Driven byattractive policy incentives (e.g. feed-in tariffs and taxbreaks), the global installed PV capacity has multipliedby a factor of 37 in ten years from 1.8 GW in 2000 to 67.4GW at the end of 2011, a growth rate of 44% per year(Figure 3.1) (EPIA, 2012). New capacity installed in 2011was 27.7 GW, two-thirds more than the new capacityadded in 2010. Assuming an average capacity factor of0.2 would imply that solar PV in 2011 produced 118 TWhof electrical power.
This rapid expansion in capacity has led to significantcost reductions. The learning rate for the price of PVmodules is estimated to be around 20% to 22%% (23% to24% for thin films and 19% to 20% for c-Si), so that eachtime the cumulative installed capacity has doubled, PVmodule costs have declined by 20% to 22% (EPIA, 2011aand Kersten, 2011).
3.2 aNNuaL PV CaPaCItY aDDItIoNS
Up until the mid-1990s, most PV systems were stand-alone off-grid applications, such as telecommunicationsunits, remote houses and rural electricity supply. Since
figure 3.1: evoluTion of global cumulaTive insTalled capaciTy, 2000-2011.
Source: EPIA, 2011b and EPIA, 2012.
2002 200920052003 20102000 20062004 2011
GW
2001 200820070
10
20
30
40
50
60
70
80
Chinarest of World European unionNorth america other aPEC Japan
13Cost Analysis of Solar Photovoltaics
then, the number of grid-connected systems hasincreased rapidly due to the impact of various supportand incentive schemes introduced in many countries. Inthe last decade—and this trend has accelerated in recentyears—grid-connected installations have become thelargest sector for new PV installations. The growth inutility-scale systems has also accelerated in recent yearsand is now an important market.
In 2010, new installed capacity PV capacity was 16.6 GW.Most of this growth was driven by the rapid expansionof the German and Italian markets. With 7.4 GW installedin Germany in just one year, the country continues todominate the global PV market. Italy installed 2.3 GW,starting to exploit some of the potential of its huge solarresources. Other countries also saw significant growth(EPIA, 2011a).
In 2011, 27.7 GW of new PV capacity was installed,two-thirds more than was installed in 2010. Europeaccounted for around three-quarters (20.9 GW) of allnew capacity added in 2011. Italy built on its growthin 2010, adding an impressive 9 GW of new capacity,increasing total installed capacity by 260%. Germanyadded 7.5 GW in 2011. Six countries added more thanone GW in 2011 (i.e. Italy, Germany, China, United States,Japan and France).
Despite the rapid growth of the PV market, less than0.2% of global electricity production is generatedby PV. The market outlook is entering an uncertainphase with the problems facing the global economy. Itremains to be seen what the long-term impact of theeconomic challenges facing the world economy andgovernment budgets will have on the PV market. Giventhat the European market has accounted for 80% ofglobal demand in recent years, any reduction in annualdemand in Europe as a result of the depressed economicsituation will have a large impact on supply and demandin the global PV industry. However, any slowing in theEuropean market could conceivably be offset by policymeasures that boost other PV markets, such as Australia,Canada, China, India, Japan, the United States and othercountries that are experiencing strong growth. Thebiggest emerging markets are China, the Middle East,South Korea, India and other Southeast-Asian countries.Although emerging PV markets will probably not growby as much in absolute terms as Europe has done inrecent years, growth in these markets looks set to besustained.
3.3 FuturE ProJECtIoNSoF PV CaPaCItY GroWtH
The global PV market growth in 2011 was well belowmanufacturers’ capabilities, as global PV silicon wafercapacity may have reached 50.9 GW/year by the end of2011 (a 62% increase on 2010) and the total c-Si solar cellcapacity may have reached 60.6 GW/year in 2011 (a 91%increase on 2010) (EPIA, 2011b). Most of this expansiontook place in mainland China and Taiwan.
Most of the PV growth in recent years has been drivenby promotion policies, including effective feed-in tariffs(FiT) and other incentives that have helped developmarkets in key countries, reduce prices (throughdeployment), improve the economics of PV investmentsand raise investors’ interest. There are already over 120PV power plants with a capacity of 10 MW or more(Komoto, 2010). The largest operational solar PV plantis an 100 MW ground-mounted plant in California. Thelargest building-integrated/roof-mounted system (11.8MW) is located in Spain (Komoto, 2010).
Projections to 2015 are particularly challenging, giventhat new installed capacity has been growing so rapidly.Projections from 2010 to 2015, made in 2011, already riskbeing out of date, given the rapid growth in installedcapacity in 2011. Analysing trends in 2011 resulted inprojections of total installed PV capacity in 2015 ofbetween 131 GW and 196 GW (EPIA, 2011b). Althoughthe upper range of this projection still looks reasonable,the lower end looks unduly pessimistic as even if newcapacity growth stabilised at 2011 levels, this figurewould already be reached by around the end of 2013 orearly 2014.
Although it remains to be seen what impact, if any,the continued economic weakness in Europe mighteventually have on capacity additions.
The International Energy Agency’s (IEA) PV roadmap isbased on scenarios that yield an average annual marketgrowth rate of 17% in the next decade, leading to a globalcumulative installed PV power capacity of 200 GW by2020 (IEA, 2010). Given the pace of developments inthe PV sector, even small differences in start years orassumptions can lead to very divergent results for futureinstalled PV capacity and the IEA roadmap is likely tohave underestimated installed capacity by 2020.

14 Cost Analysis of Solar Photovoltaics
GW
figure 3.2: epia scenarios for global annual new insTalled pv capaciTy, 2000 To 2015
Source: EPIA, 2011b.
0
10
20
30
40
50
2002 2009 201220052003 2010 20132000 20062004 2011 2014 20152001 20082007
EPIa Moderate EPIa Policy-Driven

15Cost Analysis of Solar Photovoltaics
4.Cost and performance
PV is a mature, proven technology that is rapidlyapproaching grid parity.12 It is a renewable, secure
energy source with very high plant reliability and isnot exposed to any fuel price volatility. PV has maderemarkable progress in reducing costs, as until recentlygrid parity still seemed very far away. It was only a fewyears ago that PV electricity was four to five times moreexpensive than fossil fuels. However, with increasesin fossil fuel prices and continuing cost reductions inPV modules, grid parity could occur as early as 2012to 2013 in sunny regions of USA, Japan and SouthernEurope. Other regions with lower electricity productioncosts and/or more moderate solar resources mayachieve grid parity as early as 2020 (Breyer andGerlach, 2011). That is without taking into accountthat PV is often already competitive for peak powerproduction, for generation in grid-constrained areas,and for many off-grid applications.
The cost of the electricity generated by a PV system isdetermined by the capital cost (CAPEX), the discountrate, the variable costs (OPEX), the level of solarirradiation and the efficiency of the solar cells. Of theseparameters, the capital cost, the cost of finance andefficiency are the most critical and improvements inthese parameters provide the largest opportunity forcost reductions.
The capital cost of a PV system is composed of the PVmodule cost and the Balance of system (BOS) cost. ThePV module is the interconnected array of PV cells andits cost is determined by raw material costs, notablysilicon prices, cell processing/manufacturing and moduleassembly costs. The BOS cost includes items, such as thecost of the structural system (e.g. structural installation,racks, site preparation and other attachments), theelectrical system costs (e.g. the inverter, transformer,wiring and other electrical installation costs) and thebattery or other storage system cost in the case of off-grid applications.
4.1 SoLar PV MoDuLE PrICE/CoSt
The PV module cost is typically between a third and a halfof the total capital cost of a PV system, depending on thesize of the project and the type of PV module.13 ProjectingPV module costs into the future is complicated by the highlearning rate of 22% that has been experienced historically(see Figure 4.1).14With the PV market growing so rapidlycompared to the installed base, projections of costreductions can quickly become out of date.
The absolute cost and structure of PV modules variesby technology. Conventional c-Si PV modules are themost expensive PV technology, with the exception ofCPV modules, but they also have the highest commercialefficiency. However, CIGS modules are approaching theefficiency levels of c-Si modules and are cheaper.Figure 4.2 illustrates average worldwide PV module coststructures by technology.
Accurate data on global average PV module pricesare difficult to obtain and in reality there is a widerange of prices, depending on the cost structure of themanufacturer, market features and module efficiency.However, an estimate for the global price of c-Si PVmodules in 2008 was USD 4.05/W and this had declinedto USD 2.21/W in 2010 (Solarbuzz, 2011), a decline of 45%in just two years.
The rate of decline in costs has not slowed and byJanuary 2012 spot market and factory gate prices inEurope for low-cost Chinese and other emerging marketmanufacturers of c-Si modules had dropped to aroundUSD 1.05/W (Photovoltaik, 2012). Spot and factory gateprices for c-Si modules from European, Japanese andother manufacturers had declined to between USD 1.22and USD 1.4/W (Table 4.1).
By the fourth quarter of 2010, the cost of monocrystallinesilicon PV modules in Europe was between USD 1.43/W
12The term “grid parity” is often used loosely and inconsistently. In this paper, it is meant to represent the point where the LCOE of PV, without subsidies,is the same or lower than the residential electricity price, excluding taxes. Other definitions include a price equal to or lower than the price of peak,shoulder or base-load electricity generation. In some cases, it will include or exclude taxes and subsidies.13PV module prices are usually quoted per “DC Watt peak” (Wp), based on the rated PV module output power (at the maximum power point) underStandard test condition AM1.5 (solar insolation 1000W/m2, temperature 25oC). All prices in this paper are “DC Watt peak”.14 After deviating from the historical trend between 2003 and 2008 due to supply bottlenecks, learning rates have returned towards the historic rate inrecent years (Hearps, 2011).

16 Cost Analysis of Solar Photovoltaics
figure 4.1 The global pv module price learning curve for c-si wafer-based and cdTe modules, 1979 To 2015
figure 4.2 average worldwide pv module price level and Their cosT sTrucTure by Technology (2010).
Sources: based on data from EPIA and Photovoltaic Technology Platform, 2010 and Liebreich, 2011.
Sources: IRENA and data from Japan’s National Institute for Advanced Industrial Science and Technology (AIST)
100.00
10.00
1.00
0.101 10 100 1.000 10.000 100.000 1.000.000
PVmod
ulepricebrea
kdow
nGloba
lMod
uleaveran
geselling
price(2010
USD
/Wp)
Cumulative production volume (MW)
C-Si16%Efficiency
CdTe12%
TF-Si12%
CIGS15%
DSSC10%
OPV10%
1979
19921998
2002
2006 c-Si price increasedue to polysilicon shortage
22% price reduction for eachdoubling of cumulative volume
2004
2011$1.3-1.5
2010$1.52
2014$1.05
2015$1.08
c-Si Cdte
0%
20%
40%
60%
80%
100%
Module
Cell
Wafer
Depreciation Materials Labor o&M Glass

17Cost Analysis of Solar Photovoltaics
Tabl
e4.1su
mmary
ofTh
eworl
dwidemark
eTpr
iceofpv
modules,Q
420
09To
Q120
12
Sources:Solarbuzz,2011;Photovoltaik,2012andLuo,2011.
Factory-gate
pric
ein
Europe(U
SD/W
att)
2009
2010
2011
2012
PVmodule
supplie
rsQ4
Q1
Q2
Q3
Q4
Q1
Q2
Q3
Q4
Q1
Highefficiencyc-Si
2.45
2.22
2.25
2.29
2.21
2.20
2.15
2.10
2.00
1.94
Japanese
/Western
c-Si*
*1.98
1.81
1.83
1.74
1.66
1.40
1.27
1.08
1.22
1.22
Chinese
majorc
-Si*
**1.51
1.42
1.52
1.51
1.45
1.39
1.39
1.39
1.39
1.24
Emergingeconomiesc-Si
****
1.45
1.35
1.42
1.43
1.43
1.36
1.31
1.03
1,02
1.02
Higheffic
iencythin-film
(via
distributio
n,FirstS
olar)
1.26
1.30
1.39
1.37
1.27
1.16
1.05
0.98
0.93
0.93
Factory-gate
pric
ein
theUnite
dStates(U
SD/W
att)
Highefficiencyc-Si
2.86
2.20
2.55
2.55
2.53
2.30
2.30
2.30
2.30
2.20
Japanese
/Western
c-Si
2.10
2.05
1.95
1.95
1.93
1.91
1.91
1.91
1.91
1.82
Chinese
majorc
-Si
1.91
1.87
1.83
1.87
1.80
1.43
1.43
1.47
1.43
1.34
Emergingec
onomies-c-Si
1.89
1.75
1.70
1.78
1.74
1.50
1.50
1.50
1.50
1.41
Highefficiencythin-film
(via
distributio
n,FirstS
olar)
1.21
1.20
1.22
1.25
1.19
1.20
1.22
1.25
0.93
0.93
Notes:B
ased
onshort-term
contract
prices
forq
uantities
of0.5MW
ormore.Sp
otmarketp
rices
aretypically
morevo
latile.*Su
npow
eran
dSa
nyo**
Sharp,Ky
ocera,So
larw
orld
andSc
hoth
***Su
ntech,Yu
ngli,TrinaSo
lara
ndGreen
Energy,etc.****Chine
se,Taiwan
ese,Ko
rean
andIndian
man
ufacturers.

18 Cost Analysis of Solar Photovoltaics
figure 4.3: european and uniTed sTaTes pv module facTory-gaTe prices, Q1 2010 To Q1 2012.
Sources: Solarbuzz, 2011; Photovoltaik, 2012 and Luo, 2011.
(emerging economy manufacturers) and USD 2.21/W(high efficiency c-Si modules), while thin-film PVmodules cost USD 1.27/W. In the United States, theprice range for monocrystalline silicon PV modules wasbetween USD 1.74/W and USD 2.53/W, with thin-film PVmodules costing USD 1.19/W. In general, factory-gateprices appear to be slightly higher in the United Statesthan in Europe (Figure 4.3). This is perhaps due to thehigher support offered by United States’ policies in 2010.Also, Chinese modules tend to be cheaper than modulesfrom OECD manufacturers. In the past this could beattributed to their lower quality, but this is not always thecase as today many Chinese makers meet internationaland OECD national quality standards.
PV module prices have continued to decline in 2011and the lowest prices in the market were USD 1.59/W
0.0
0.2
0.4
0.6
0.8
1.0
1.2
1.4
1.6
1.8
2.0
UnitedStates
(2010
USD
/Wp)
Europe
(2010
USD
/Wp)
Japanese/Westernc-Si
Japanese/Westernc-Si
Q1 2011
Q1 2012
Q1 2010China Majorsc-Si
China Majorsc-Si
Emergingc-Si brands
Emergingc-Si brands
High efficiency thin film(via distribution)
High efficiency thin film(via distribution)
for monocrystralline PV modules, USD 1.63/W formulticrystralline PV modules, USD 1.52/W for CdTethin-film PV modules and USD 1.22/W for amorphoussilicon PV modules (Bolman, 2011). However, averageprices are significantly higher. In Germany, marketprices for PV modules made in Europe and the UnitedStates (excluding those from First Solar and Sunpower),averaged USD 2.15/W in the second quarter of 2011,slightly higher than those of Japanese PV modules atUSD 2.13/W. In contrast, the price of PV modules fromAsian countries was USD 1.87/W.
The PV module prices presented so far are factory gateprices. Accurate data on retail prices for PV modulesare difficult to obtain, but are estimated to be between35% and 45% higher than factory gate prices (Figure4.4). The purchase of multiple PV modules can reduce
0.0
0.5
1.0
1.5
2.0
2.5
19Cost Analysis of Solar Photovoltaics
0.00
0.50
1.00
1.50
2.00
2.50
3.00
3.50
4.00
figure 4.4: weighTed average reTail c-si pv module price levels and sTrucTure in 2010.
Source: Solarbuzz, 2011.
PVmod
uleprice(2010
USD
/Wp)
retail (one unit) retail (multiple units) Distributor Prices Factory Gate Prices
Q1 2010 Q2 2010 Q3 2010 Q4 2010
prices by almost one-tenth for retail customers. The retailprices of c-Si PV modules in Europe, the United Statesand China are estimated to average around USD 3.00/Wto USD 3.50/W (Solarbuzz, 2011). The margins chargedby distributors and retailers appear to have declined byaround 10% (USD 0.36/W) between the first quarter andthe last quarter of 2010.
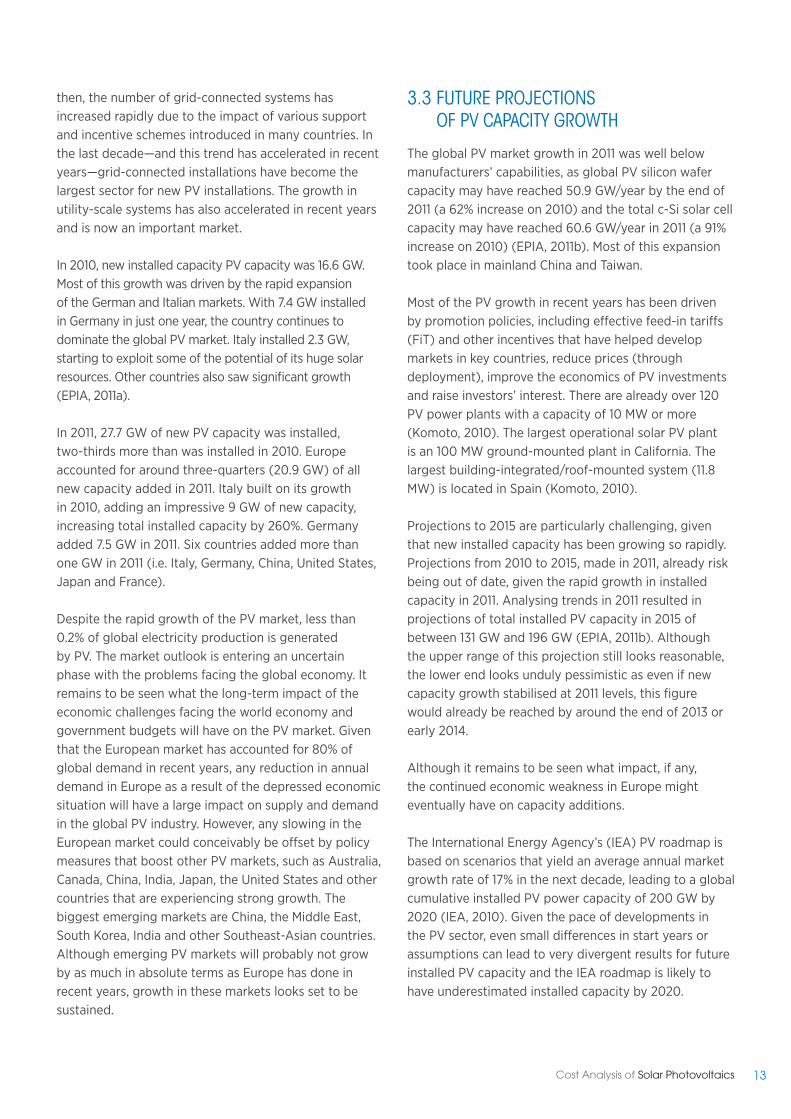
4.2 baLaNCE oF SYStEM CoSt
The BOS costs and installation comprise the remainingcapital costs for a PV system. The BOS costs largelydepend on the nature of the installation. For utility-scalePV plants, it can be as low as 20% (for a simple grid-connected system) or as high as 70% (for an off-gridsystem), with 40% being representative of a standardutility-scale ground-mounted system (IEA PVPS, 2009).For residential and small-scale systems, the BOS andinstallation costs comprise 55% to 60% of total PVsystem costs. The average cost of BOS and installationfor PV systems is in the range of USD 1.6 to USD 1.85/W,
depending on whether the PV system is ground-mountedor rooftop, and whether it has a tracking system (Bony,2010 and Photon, 2011). The LCOE of PV systems istherefore highly dependent on BOS and installation costs,which include:
» The inverter, which converts the directcurrent (DC) PV output into alternatingcurrent (AC);
» The components required for mounting andracking the PV system;
» The combiner box and miscellaneouselectrical components;
» Site preparation and installation (i.e. roofpreparation for residential systems, or sitepreparation for utility-scale plants), labourcosts for installation and grid connection;
» Battery storage for off-grid systems; and

20 Cost Analysis of Solar Photovoltaics
figure 4.5: cosT breakdown of currenT convenTional pv sysTems in The uniTed sTaTes , 2010
Source: Bony, 2010
» System design, management, installeroverhead, permit fees and any up-frontfinancing costs.
Rooftop-mounted systems have BOS costs around USD0.25/W higher than ground-mounted systems, primarilydue to the additional cost of preparing the roof to receivethe PV modules and slightly more costly installation. Inabsolute terms, the electric system costs are roughly thesame in both systems and account for around one-third ofthe BOS costs in ground-mounted systems and somewhatless in residential rooftop systems due to their higher BOScosts (Figure 4.5).
The inverter is one of the key components of a PVsystem. It converts the DC electricity from the PVmodules into AC electricity. Inverter sizes range fromsmall textbook-sized devices for residential use tolarge container-sized solutions for utility-scale systems.The size and numbers of inverters required depend on
InstalledCost(2010
USD
/Wp)
balance of system
Module
business process
Structural installation
racking
SIte prep, attachments
Electrical installation
Wiring, transformer
Inverter
PV System BOS
Ground-Mounted Ground-Mountedrooftop rooftop
3.753.50
the installed PV capacity and system design options.Inverters are the primary power electronics componentsof a PV system and typically account for 5% of totalinstalled system costs. Currently, inverter cost rangesfrom USD 0.27/W to USD 1.08/W, depending on thesystem size (Photon, 2011b). Larger systems tend to havelower inverter costs per unit of capacity, with systemsin the 10 to 100 kW range having costs of betweenUSD 0.23 to USD 0.57/W. However, some of the mostcompetitive inverters for small-scale applications (<5kW) can rival those costs, as the range in 2010 was USD0.31 to USD 1.03/W (Photon, 2011b).
Mounting structures and racking hardware componentsfor PV modules are typically pre-engineered systems ofaluminium or steel racks. They account for approximately6% of the total capital cost of PV systems (Mehta andMaycock, 2011). Mounting structures vary depending onwhere the PV systems are sited, with different solutionsfor residential and commercial systems, for roof types
0
1
2
3
4
0.0
0.5
1.0
1.5
2.0
1.60
1.85

21Cost Analysis of Solar Photovoltaics
(e.g. flat membrane, sloped metal) and ground-mountedsystems. Because of their low value and substantialweight, mounting and racking structures are generallyproduced and/or assembled locally, as shipping wouldbe prohibitively expensive, except from countrieswhere labour costs are so low that they can offsettransportation costs.
Combiner box and miscellaneous electrical componentsinclude all remaining installation components, includingcombiner boxes, wires/conductors, conduits, datamonitoring systems, and other miscellaneous hardware.Combiner boxes are the only PV system-specific productincluded in this category and they are sourced fromdedicated manufacturers who supply pre-engineeredsystems. Other miscellaneous electrical hardware (e.g.wires, electrical conduits, overcurrent protection) arecommodity products and can be sourced virtuallyanywhere.
Site preparation and system installation are majorcomponents of the BOS and installation costs. Theyinclude site preparation (roof or ground-based),any physical construction works (e.g. electricalinfrastructure), installation and connection of the system.Labour costs make up the majority of the installationcosts, and vary by project and country.
System design, management and administrative costsinclude system design, legal, permitting, financing andproject management costs. For residential and small-scale PV systems, these costs are typically included inthe total PV installed prices quoted by companies. Forlarge-scale installations these costs might be manageddirectly by the promoter or sub-contracted to a serviceprovider. When PV system costs are quoted in literature,these costs are typically included in overhead costs andprofit margins. These soft costs depend significantlyon local conditions. In the United States (2010), theyaccounted for an average 37% of total system costs (GTMResearch, 2011).
Electricity storage systems for off-grid PV systemsenable electricity use at night or during cloudy periods.A variety of electricity storage systems exist, or are underdevelopment, but they are expensive and tend to bemore suited to large-scale applications. For small-scalesystems, standard lead-acid batteries are the technologyof choice. Redox flow batteries represent an emergingoption, but these are not yet commercially available.
Capacitors are another emerging technology, but aremore suited to very short-term electricity storage.
Batteries increase the cost of the PV system, but muchless than grid connection in remote areas. They areneeded not only for remote residential and commercialapplications, but also for off-grid repeater stations formobile phones, radio beacons, etc.
Lead-acid batteries are the oldest, most widely appliedelectricity storage technology and are a proven option.Car or truck batteries are sometimes used because theyare the cheapest option, but they are not designed foruse with power generation technologies and have a shortlifespan (as low as 50 cycles). Deep-cycle, lead-acidbatteries are a proven option, with much longer lifespansthan car batteries. However, even deep-cycle batterieswill last longer if the discharge rate is kept low. Forinstance, limiting the discharge to 20% or less can allowthe battery to last for ten years. The trade-off is higherinitial costs, as 5 kWh of battery storage is needed forevery 1 kWh of electricity used from storage.
In sunny African conditions a 1 kW PV system may supply1 500 kWh per year (4 kWh/day). Assuming half of thisenergy is needed in the evenings, this means 2 kWh ofuseful storage is needed, requiring 10 kWh of batterystorage if battery life is to be optimised. This representsan investment of USD 1 500 (USD 150/kWh), to whicha battery charge controller must be added if this is notincluded in the PV system. The addition of storage,assuming the PV system costs around USD 3 000/kW,therefore adds 50% to the PV system cost (total USD 4500/kW).
Other battery options include lithium-ion (Li-ion) orsodium-sulphur (NAS) batteries. Their cost, at USD 550to USD 600/kWh, is higher than for deep-cycle, lead-acidbatteries. However, NAS is a new battery technology andglobal production capacity is less than 150 MW per year,so cost reductions are likely. NAS batteries are currentlylarge-scale storage solutions, with a single NAS batterybeing in the several MW capacity range (the batterywill weigh ten tonnes, or more). Production of smallerscale NAS batteries is just starting. NAS batteries couldtherefore be used for a mini-grid, village or small citysize storage solutions. In the longer-term, NAS batterycosts could come down significantly, as they havebeen designed to use cheap and abundant materials.Li-ion batteries are small-scale, often powering laptop

22 Cost Analysis of Solar Photovoltaics
computers, and may therefore be better suited to highlymodular small-scale off-grid solutions if costs comedown. Other options such as redox flow batteries are stillat a development stage and their practical feasibility isnot yet proven.
Batteries are connected to the PV array via a chargecontroller to protect against overcharging or discharging,and this controller can provide information about thestate of the system. Off-grid PV systems can be hybrids(e.g. in conjunction with wind and electricity storage)and / or be combined with a back-up power system (e.g.a biomass or diesel generator) to ensure a more reliablesupply of electricity or to allow higher loads.
4.3 totaL PV SYStEM CoStS
The total cost of a PV system is made up of the costs ofthe PV modules, BOS and installation. While different PVtechnologies have different PV module costs, the overallPV system cost also depends on the size of the system(due to the economies of scale with large utility-scaleprojects), and on whether the system is ground- or roof-mounted. To analyse costs, PV systems can be groupedinto four main end-use markets:
» Residential PV systems typically donot exceed 20 kW and are usually roof-mounted;
» Large-scale building PV systems typicallydo not exceed 1 MW and are placed on largebuildings or complexes, e.g. commercialbuildings, schools, hospitals, universities;
» Utility-scale PV systems are larger than 1MW and are generally ground-mounted; and
» Off-grid applications15vary in size fromsmall systems for remote beacons or relaystations to mid-size systems for homes orbusinesses not connected to the grid, all
the way up to large-scale PV systems thatprovide electricity to off-grid communities.
The total installed cost of a PV system also dependson the project location, scale and funding conditions inindividual countries, and the maturity and size of themarket. For instance, Germany has one of the morecompetitive PV markets, given the large domestic PVmarket and its history of stable long-term incentives.
Costs of residential PV SystemsIn Germany in 2011, the price of a residential PV systemwith a capacity of between 2 kW and 5 kW averagedUSD 3 777/kW, including installation (Figure 4.6). InItaly, Portugal and Spain, the price of the equivalent PVsystem is USD 5 787/kW on average, which is about thesame as the average in the United States of USD 5 657/kW (Photon, 2011a and 2011b).
Larger PV systems with a capacity of between 5 kWand 10 kW in Germany cost USD 3 600/kW on average,including installation in 2011 (Photon, 2011a and 2011b).In the other countries, such as Italy and Portugal, theaverage price is USD 5 314/kW. In the United States,the average price for these systems is USD 5 433/kW(Photon, 2011b).
The differences in the prices of PV systems in differentcountries can also depend on incentive schemes thatare not sufficiently reactive to PV cost reductions. Ifincentives are not regularly realigned with decliningPV manufacturing costs, installers and promoters canmaintain high prices and achieve higher margins. Thus,PV system prices can be higher in countries with highersolar subsidies.
Costs of Large-scale utility PV SystemsLarge-scale utility PV systems are generally at least 1 MWin size. They operate as any other centralised power plant,providing power to the grid. Thousands of such PV plantsare currently in operation worldwide. In addition to thechoice of the basic PV technology, their cost dependson whether the system is roof- or ground-mounted, andwhether it is equipped with a sun-tracking mechanism.
15 Off-grid applications dominated the PV market until the mid-1990s. Since then, grid-connected systems have increased rapidly due to the impact ofincentive policies introduced in many countries. The majority of today’s installations are grid-connected, building systems, as incentives are usually themost generous for these applications. However, large-scale ground-mounted systems have gained a considerable market share in recent years as a resultof changing incentive schemes and the rapid cost reductions of PV systems. Off-grid systems are still an important market in regions with poor grid access,but their share of new PV installations has dropped to less than 10%.
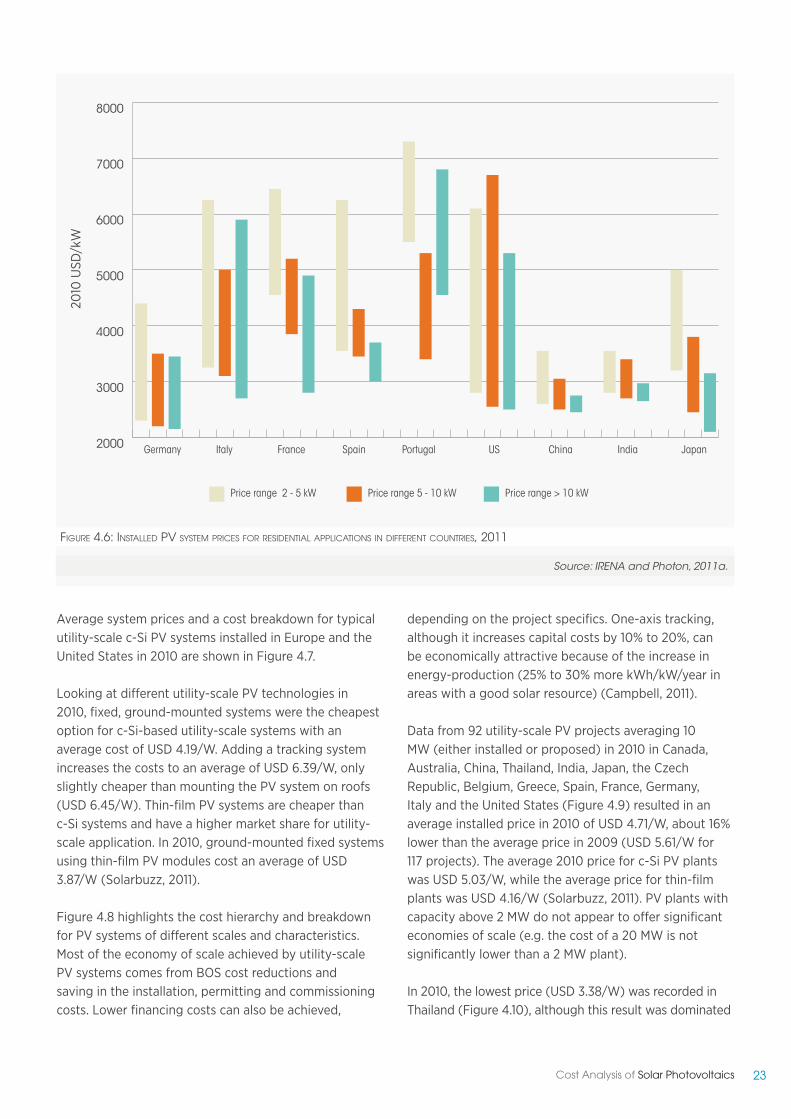
23Cost Analysis of Solar Photovoltaics
figure 4.6: insTalled pv sysTem prices for residenTial applicaTions in differenT counTries, 2011
Source: IRENA and Photon, 2011a.
2000
3000
4000
5000
6000
7000
8000
2010
USD
/kW
Germany Italy France Spain Portugal uS China India Japan
Price range 2 - 5 kW Price range 5 - 10 kW Price range > 10 kW
Average system prices and a cost breakdown for typicalutility-scale c-Si PV systems installed in Europe and theUnited States in 2010 are shown in Figure 4.7.
Looking at different utility-scale PV technologies in2010, fixed, ground-mounted systems were the cheapestoption for c-Si-based utility-scale systems with anaverage cost of USD 4.19/W. Adding a tracking systemincreases the costs to an average of USD 6.39/W, onlyslightly cheaper than mounting the PV system on roofs(USD 6.45/W). Thin-film PV systems are cheaper thanc-Si systems and have a higher market share for utility-scale application. In 2010, ground-mounted fixed systemsusing thin-film PV modules cost an average of USD3.87/W (Solarbuzz, 2011).
Figure 4.8 highlights the cost hierarchy and breakdownfor PV systems of different scales and characteristics.Most of the economy of scale achieved by utility-scalePV systems comes from BOS cost reductions andsaving in the installation, permitting and commissioningcosts. Lower financing costs can also be achieved,
depending on the project specifics. One-axis tracking,although it increases capital costs by 10% to 20%, canbe economically attractive because of the increase inenergy-production (25% to 30% more kWh/kW/year inareas with a good solar resource) (Campbell, 2011).
Data from 92 utility-scale PV projects averaging 10MW (either installed or proposed) in 2010 in Canada,Australia, China, Thailand, India, Japan, the CzechRepublic, Belgium, Greece, Spain, France, Germany,Italy and the United States (Figure 4.9) resulted in anaverage installed price in 2010 of USD 4.71/W, about 16%lower than the average price in 2009 (USD 5.61/W for117 projects). The average 2010 price for c-Si PV plantswas USD 5.03/W, while the average price for thin-filmplants was USD 4.16/W (Solarbuzz, 2011). PV plants withcapacity above 2 MW do not appear to offer significanteconomies of scale (e.g. the cost of a 20 MW is notsignificantly lower than a 2 MW plant).
In 2010, the lowest price (USD 3.38/W) was recorded inThailand (Figure 4.10), although this result was dominated

24 Cost Analysis of Solar Photovoltaics
figure 4.7 cosT breakdowns of Typical uTiliTy-scale c-si pv sysTems insTalled in europe and The uniTed sTaTes, Q1 2009 To Q4 2010.
Source: IRENA and Solarbuzz, 2011.
0
1
2
3
4
5
6
0
1
2
3
4
5
6
7
2010
USD
/Wp
2010
USD
/Wp
Q4 2009
Q4 2009
Q1 2010
Q1 2010
Q2 2010
Q2 2010
Q3 2010
Q3 2010
Q4 2010
Q4 2010
Installed PV System
PV Modules
Solar Cells
Wafers
Polysilicon
Average market price in Europe
Average market price in the United States

25Cost Analysis of Solar Photovoltaics
figure 4.8: sysTem cosT breakdown for residenTial, commercial and uTiliTy-scale c-si pv sysTems in The uniTed sTaTes, 2010.
Source: Goodrich, 2012.
0.00
1.00
2.00
3.00
4.00
5.00
6.00
7.00
8.00
Installedsystem
price(2010
USD
/Wp)
residential49 kWp
Commercial217 kWp
utility (Fixed axis)187.5 MWp
utility (one axis)187.5 MWp dc
4.40
3.80
4.59
5.71
Sales tax (5%)
Supply chain cost
Installer profit
Installer overheads
Site preparation
Land acquisition
Permitting and commissioning
Hardware labor
Electrical labor
tracker
Installation materials
Inverter
Module
by an 84 MW thin-film PV plant installed in Thailand. Thehighest for utility-scale PV plants was recorded in Japan(USD 6.50/W), albeit the average project size is lowerthan in Europe and China. Among the major PV markets,Germany showed the lowest average price at USD 3.64/Wfor c-Si-based PV plants. It was noted that prices of c-Sisystems (USD 3.65/W) were surprisingly close to thoseof thin-film systems (USD 3.61/W). The widest pricevariation occurred in Italy with lowest and highest figuresof USD 2.89/W and USD 6.67/W. In the United States, theaverage price was USD 4.83/W, with an average capacityof 4.8MW.
Falling PV system prices, the high cost of fossil fuels inmany markets in recent times and effective and broader
incentive schemes have driven the growth in utility-scalePV plants. Since 2005, more than 1 200 PV plants with acapacity of 1 MW or more have been commissioned, withover 120 of these PV plants having an output of 10 MWor more (Philibert, 2011). Since 2007, the number and sizeof MW-scale PV systems has risen, especially in Germanyand Spain (Komoto, 2010). Today’s leading markets forutility-scale PV systems are Germany, Spain, Canada andthe United States16, but utility-scale PV systems are alsobeing commissioned in India, China and the Middle East.An important emerging issue for utility-scale systems is thatBOS and installation costs have, in some cases, not beendeclining as fast as the cost of PV modules. Therefore, theirshare of the overall PV cost, currently around half of utility-scale c-Si PV system costs, could increase over time.
16 Some of the largest plants are located in Spain (60 MW Olmedilla, 50 MW Puertollano) and Germany (54 MW Strabkirchen and 53 MW TurnowPerilack).
26 Cost Analysis of Solar Photovoltaics
figure 4.9: insTalled cosTs of uTiliTy-scale pv planTs in 2010 (<10 mw and >10 mw)
Source: Solarbuzz, 2011
2 4 6 8 100
2
4
6
8
10
12
0 20 40 60 80 1000
2
4
6
8
10
12
2010
USD
/Wp
2010
USD
/Wp
PV plant size (MW)
PV plant size (MW)
< 10 MW
> 10 MW

27Cost Analysis of Solar Photovoltaics
2010
USD
/Wp
MW
figure 4.10: average prices and sizes of large uTiliTy-scale pv planTs by counTry, 2010.
Source: Solarbuzz, 2011
0
1
2
3
4
5
6
7
0
5
10
15
20
25
30
35
average cost
Canada
rest of asia Germa
nyaustra
lia Japan ItalyChina roE unitedStates
average system size
UN Photo library
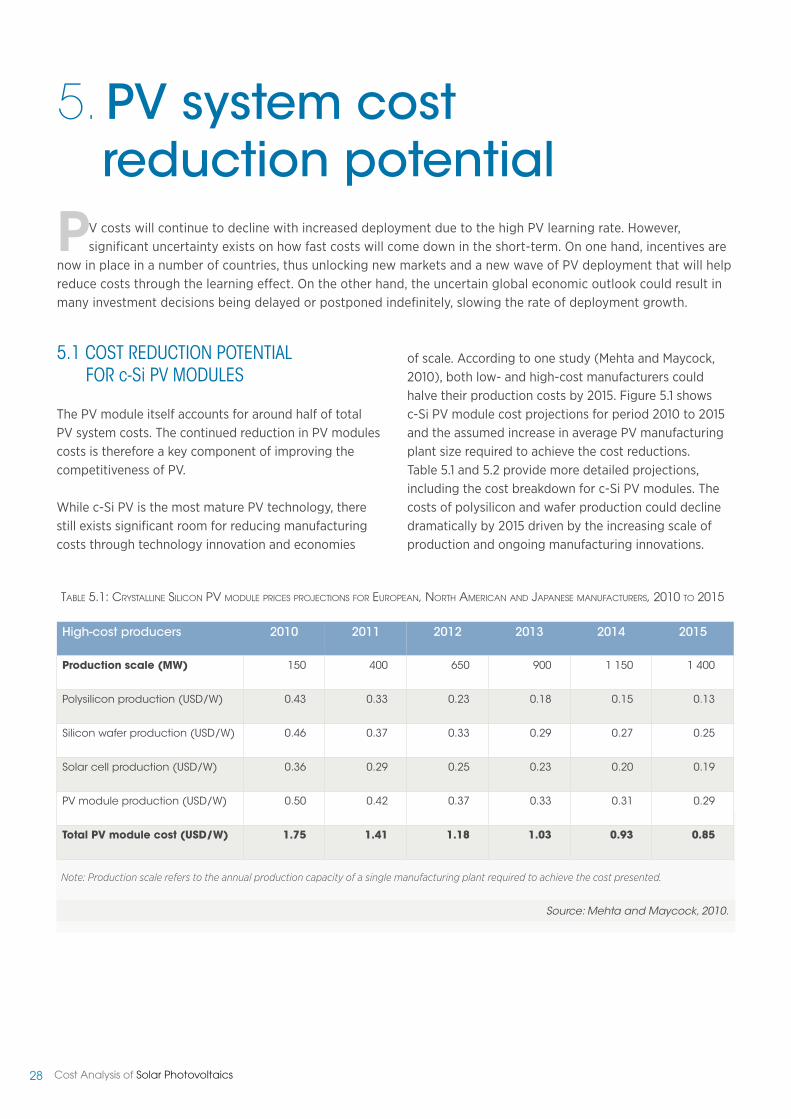
28 Cost Analysis of Solar Photovoltaics
5. PV system costreduction potential
PV costs will continue to decline with increased deployment due to the high PV learning rate. However,significant uncertainty exists on how fast costs will come down in the short-term. On one hand, incentives are
now in place in a number of countries, thus unlocking new markets and a new wave of PV deployment that will helpreduce costs through the learning effect. On the other hand, the uncertain global economic outlook could result inmany investment decisions being delayed or postponed indefinitely, slowing the rate of deployment growth.
5.1 CoSt rEDuCtIoN PotENtIaLFor c-Si PV MoDuLES
The PV module itself accounts for around half of totalPV system costs. The continued reduction in PV modulescosts is therefore a key component of improving thecompetitiveness of PV.
While c-Si PV is the most mature PV technology, therestill exists significant room for reducing manufacturingcosts through technology innovation and economies
of scale. According to one study (Mehta and Maycock,2010), both low- and high-cost manufacturers couldhalve their production costs by 2015. Figure 5.1 showsc-Si PV module cost projections for period 2010 to 2015and the assumed increase in average PV manufacturingplant size required to achieve the cost reductions.Table 5.1 and 5.2 provide more detailed projections,including the cost breakdown for c-Si PV modules. Thecosts of polysilicon and wafer production could declinedramatically by 2015 driven by the increasing scale ofproduction and ongoing manufacturing innovations.
Note: Production scale refers to the annual production capacity of a single manufacturing plant required to achieve the cost presented.
Table 5.1: crysTalline silicon pv module prices projecTions for european, norTh american and japanese manufacTurers, 2010 To 2015
Source: Mehta and Maycock, 2010.
High-cost producers 2010 2011 2012 2013 2014 2015
Production scale (MW) 150 400 650 900 1 150 1 400
Polysilicon production (USD/W) 0.43 0.33 0.23 0.18 0.15 0.13
Silicon wafer production (USD/W) 0.46 0.37 0.33 0.29 0.27 0.25
Solar cell production (USD/W) 0.36 0.29 0.25 0.23 0.20 0.19
PV module production (USD/W) 0.50 0.42 0.37 0.33 0.31 0.29
Total PV module cost (USD/W) 1.75 1.41 1.18 1.03 0.93 0.85

29Cost Analysis of Solar Photovoltaics
figure 5.1: crysTalline silicon pv module cosT projecTions, 2010 To 2015
Note: Production scale refers to the annual production capacity of a single manufacturing plant required to achieve the cost presented.
Table 5.2: crysTalline silicon pv module prices projecTions for low-cosT manufacTurers; 2010 To 2015
Source: Mehta and Maycock, 2010.
Source: Mehta and Maycock, 2010.
0.8
1.0
1.2
1.4
1.6
1.8
0
200
400
600
800
1000
1200
1400
1600
Mod
uleco
st(2010
USD
/Wp)
Plan
tsize
(MW)
Constant scale (350 MW/yr capacity) Incresing economies of scale Manufacturing plant size (MW)
2010 2011E 2012E 2013E 2014E 2015E
Low-cost producers –China, etc.
2010 2011 2012 2013 20 14 2015
Production scale (MW) 350 600 850 1 100 1 350 1 600
Polysilicon production (USD/W) 0.47 0.39 0.25 0.20 0.16 0.14
Silicon wafer production (USD/W) 0.34 0.28 0.26 0.24 0.22 0.20
Solar cell production (USD/W) 0.24 0.21 0.19 0.18 0.16 0.15
PV module production (USD/W) 0.36 0.31 0.29 0.27 0.25 0.23
Total PV module cost (USD/W) 1.41 1.20 0.99 0.87 0.73 0.73
1.75
1.64
1.47
1.41
1.16
1.36
1.26
1.20
0.85
0.93
1.03
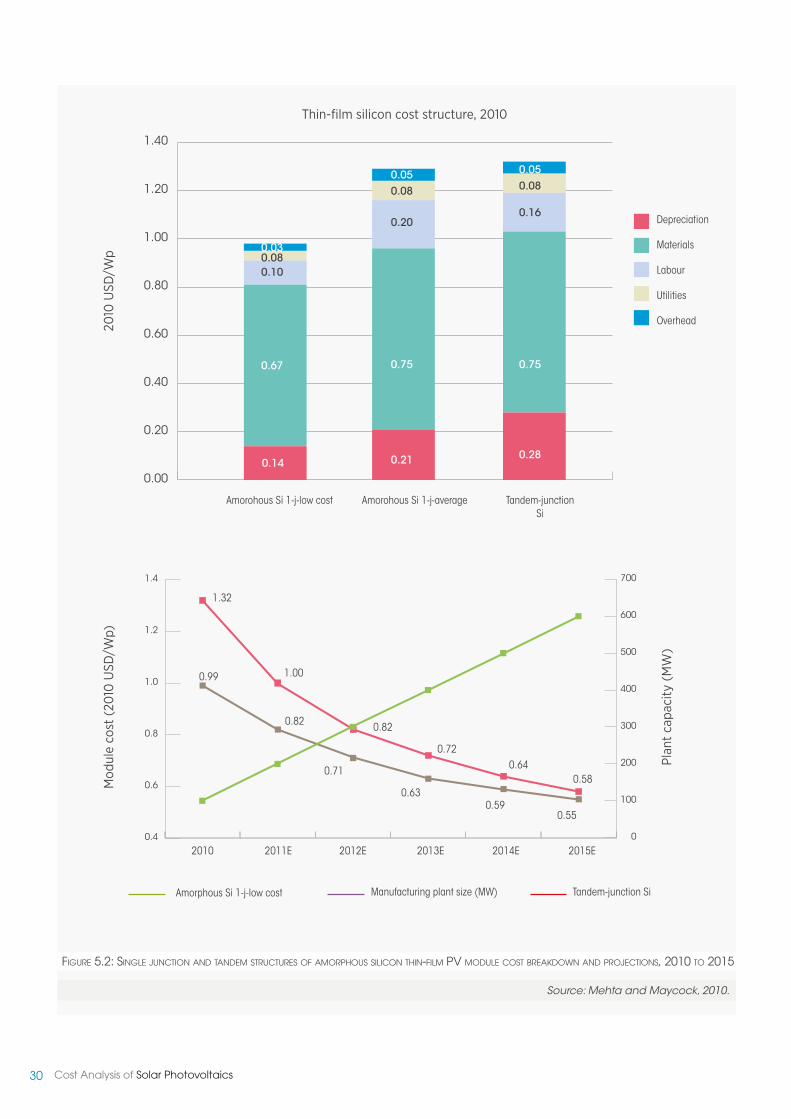
30 Cost Analysis of Solar Photovoltaics
0.4
0.6
0.8
1.0
1.2
1.4
0
100
200
300
400
500
600
700
figure 5.2: single juncTion and Tandem sTrucTures of amorphous silicon Thin-film pv module cosT breakdown and projecTions, 2010 To 2015
Source: Mehta and Maycock, 2010.
Thin-film silicon cost structure, 2010
amorohous Si 1-j-low cost
Mod
uleco
st(2010
USD
/Wp)
2010
USD
/Wp
Plan
tcapa
city
(MW)
amorohous Si 1-j-average tandem-junctionSi
1.32
1.000.99
0.82 0.82
0.720.64
0.58
0.55
0.71
0.630.59
0.00
0.20
0.40
0.60
0.80
1.00
1.20
1.40
Depreciation
Materials
Labour
utilities
overhead
2010
amorphous Si 1-j-low cost
2011E 2012E 2013E 2014E 2015E
Manufacturing plant size (MW) tandem-junction Si
0.14
0.05 0.05
0.08 0.08
0.200.16
0.75 0.75
0.21 0.28
0.030.080.10
0.67

31Cost Analysis of Solar Photovoltaics
Alternative studies project a similar decline in PV moduleprices by 2015. Solarbuzz projects that c-Si PV moduleprices will decline from USD 2.17/W in 2010 to as low asUSD 1.07/W in 2015; Lux Research projects a slightly lessaggressive decline to around USD 1.2/W in 2015 (LuxResearch, 2010). Given the rapid cost reductions in 2011,these projections for average c-Si module prices arelikely to be bettered.
5.2 CoSt rEDuCtIoN PotENtIaLFor tHIN-FILM PV MoDuLES
Thin film PV modules are cheaper than c-Si modules, butfurther cost reductions are expected by 2015. Single-junction amorphous PV modules are projected to declinefrom USD 0.99/W in 2010 to just USD 0.55/W, whiletandem-junction silicon PV modules could decline fromUSD 1.32/W in 2010 to USD 0.58/W by 2015 (Figure 5.2).
For co-evaporation CIGS PV modules, costs could reducefrom around USD 1.31/W in 2010 to USD 0.63/W by 2015while the reduction for sputtering-based CIGS systems ismore modest (USD 0.69/W by 2015, Figure 5.3) (Mehta andMaycock, 2010). CdTe modules’ manufacturing costs coulddrop from around USD 0.73/Wp in 2010 to just USD 0.49/Wp in 2015 (Figure 5.4).
5.3. boS CoSt rEDuCtIoN PotENtIaLS
The BOS and installation costs will becomeproportionately more important over time as PV modulecosts continue to decline. Therefore, BOS cost reductionswill become vital to continuing the rapid LCOE costreductions of PV systems. Among BOS components, thecost of the inverter is generally well-known while this isoften not the case for remaining electrical, structural andinstallation costs, which vary widely depending on localconditions and labour costs.
Achieving cost reductions is more challenging for BOSthan for PV modules because BOS involves a numberof different components17 and suppliers, more maturetechnologies, and is, and will probably always be
due to its nature, a less integrated industry. However,technological developments to optimise physical designand reduce BOS costs are still possible. There are manypossible design strategies, but further work will berequired to identify what combination of approachesis optimal in different circumstances and markets. Thisis an area of debate in the industry (Bony, 2010 andNewman, 2011). The most important factors to reduceBOS and installation costs are outlined below. Thesefactors together could result in BOS and installation costreductions similar to those for PV modules.
Electrical system improvements start with efforts toimprove the design of the inverter. Historically, invertercosts have trended down with PV module costs.Continued investment in R&D and improvements inmanufacturing processes should allow this trend tocontinue. One interesting area of development and costreduction is the use of micro-inverters directly integratedinto the PV modules, which also reduce the installationcost18. Also important for both inverters and micro-inverters are efforts to increase the lifetime from today’s5-10 years which is significantly shorter than the lifetimeof the PV system life19. All of these efforts are projectedto halve inverter costs by 2020 (Mott MacDonald, 2011).
Structural system improvements include downsizing ofthe structural components. This could yield up to 40%of the BOS cost reductions. Efficient designs to minimisethe impact of wind loads could result in significantreduction in the structural costs by allowing lighter,cheaper structures (Bony, 2010).
Installation costs can be reduced with continuedexperience, increased market scale and competition.Process automation and high-level pre-assembly andstandardisation could reduce labour costs for installationby up to 30% (Bony, 2010).
Standardisation and economies of scale will help reducecomponent costs by high volume manufacturing of BOScomponents. The potential cost reduction is large, asmost BOS component manufacturers today are smallcompanies. Large companies are pursuing importanteconomies of scale strategies to remain competitive.(Bony, 2010).
17 An idea of the number of components involved can be taken from the example of a utility-scale PV system (>20 MW plant) currently underconstruction. At this plant, 45 of 63 cost items for the BOS cost less than USD 0.02/W and these 45 components contributed only about USD 0.25/Wpto the total BOS cost (US DOE, 2010).18The introduction these more intelligent PV modules with integrated micro-inverters and DC optimising devices has already begun and these so called“smart AC modules” are expected to take a significant share of the residential market.19 In the short-term, this could lead to higher inverter prices, but a lower LCOE for PV systems. However, it is likely that the incremental gains in inverterlife should be able to be achieved at modest cost and the overall downward trend in inverter costs will continue.

32 Cost Analysis of Solar Photovoltaics
figure 5.3: cigs Thin film pv module cosT breakdown and projecTions, 2010 To 2015
Source: Mehta and Maycock, 2010.
0.4
0.6
0.8
1.0
1.2
1.4
0
100
200
300
400
500
600
0.0
0.2
0.4
0.6
0.8
1.0
1.2
1.4
1.6
2010
USD
/Wp
CIGS cost structure, 2010E
CIGS manufacturing cost
CIGS - coevaporation
1.35
1.31
0.90
0.82
0.690.63
CIGS - sputter
2010 2011E 2012E 2013E 2014E 2015E
Sputtering fixed scale (100 MW)
Coevaporation - increasing scale
Coevaporation - fixed scale
Sputtering - increasing scale
2010
USD
/Wp
Plan
tsize
(MW)
Manufacturing plant size (MW)
0.04 0.04
0.12 0.14
0.11 0.12
0.83 0.91
0.21 0.14
Depreciation
Materials
Labour
utilities
overhead

33Cost Analysis of Solar Photovoltaics
figure 5.4: cdTe Thin film pv module cosT breakdown and projecTions, 2010 To 2015
Source: Mehta and Maycock, 2010.
0.0
0.2
0.4
0.6
0.8
0.40
0.45
0.50
0.55
0.60
0.65
0.70
0.75
0
500
1000
1500
2000
2500
3000
3500
4000
Mod
uleco
st(2010
USD
/Wp)
Mod
uleco
st(2010
USD
/Wp)
Plan
tsize
(MW)
CdTe cost structure, 2011E
Low-cost CdTe manufacturing cost, 2010E - 2015E
Fixed Scale (800 MW)
0.73
0.69
0.65
0.67
0.64
0.62
0.59
0.52
0.49
0.60
0.56
Incread scale (1500 MW)
Fixed Scale (800 MW) Increasing Scale Manufacturing plant size (MW)
0.040.04
0.100.09
0.05 0.05
0.49 0.41
0.07 0.07
Depreciation
Materials
Labour
utilities
overhead

34 Cost Analysis of Solar Photovoltaics
5.4.oVEraLL CoSt rEDuCtIoN PotENtIaLSFor PV SYStEMS
Overall PV system costs are projected to continue todecline rapidly, although uncertainties exist at themoment regarding the markets growth in the short term.Short-term projections for the PV market are rapidly outof date given the rapid pace of developments. Longerterm projections are likely to experience less volatility.
PV system costs for residential systems are projected todecline from USD 4 200 to USD 6 000/kW in 2010 tobetween USD 1 800 to USD 2 700/kW by 2020 and toUSD 1 500 to USD 1 800/kW by 2030 (Table 5.2). Utility-scale systems can expect to achieve similar reductionsfrom between USD 3 600 to USD 4 000/kW in 2010to USD 1 800/kW in 2020 and as low as USD 1 060 toUSD 1 380/kW by 2030. These projections might be tooconservative in the medium- to long-term given thatthey are based on a learning rate of 18%, which is lessthan the historical rate of 22%. However, this uncertaintyis balanced by the possibility that the learning rate willreduce slowly over time as the technology becomesmore mature.
Taking into account the near-term market growth, amore nuanced cost reduction scenario is projected forresidential systems by 2015 (Figure 5.5). Large-scalePV plants are projected to reduce system costs frombetween USD 3 730 to USD 3 900/kW in 2011 to USD2 200 to USD 2 640/kW by 2015 (Solarbuzz, 2011). For
c-Si PV systems, the total installed costs could declineto between USD 2 270/kW and USD 2 770/kW by 2015,while thin-film PV systems could decline to between USD1 860/kW and USD 2 240/kW.
In addition to projections based on deployment andlearning rates, more aspirational goals (backed bysignificant R&D and market transformation policies),such as the Sunshot initiative in the United States,exist. The Sunshot initiative aims to achieve a “$1/W PVsystem” for utility-scale applications in 2020 and USD1.5/W for residential systems (US DOE, 2012). This wouldmean that PV systems could produce electricity at USD0.05 to USD 0.07/kWh, making PV systems competitivenot only with the residential and commercial tariffs forelectricity, but also with the wholesale rate of electricitywithout subsidies in virtually all regional electricitymarkets in the United States (US DOE, 2012 and USDOE, 2010). However, this does not take into accounttransmission line development / strengthening andelectricity storage needs to meet demand when the sunis not shining. The view of US DOE experts is that, at thecurrent rate of progress, the PV system cost by 2016 islikely to reach USD 2.20/W for utility-sized systems, USD2.50/W for commercial building-scale, and USD 3.50/Wand residential systems (US DOE, 2010). By 2020, utility-scale systems could decline in an “evolutionary” scenarioto between USD 1.71 and USD 1.91/W (Goodrich, 2012).Residential systems might decline in this same scenarioto USD 2.29/W in 2020.
Note: * data is for 2008.
Table 5.3 insTalled pv sysTem cosT projecTions for residenTial and uTiliTy-scale sysTems, 2010 To 2030
Sources: EPIA, 2011a; Solarbuzz, 2011 and IEA, 2010.
2010 2015 2020 2030
Utility-scale
EPIA (c-Si) 3 600 1 800 1 060 - 1 380
IEA (c-Si) 4 000* 1 800 1 200
Resdiential/Commercial
IEA 5 000 - 6 000* 2 250 - 2 700 1 500 - 1 800
Solarbuzz (c-Si) 4 560 2 280 - 2 770
Solarbuzz (thin film) 4 160 1 860 - 2 240

35Cost Analysis of Solar Photovoltaics
figure 5.5: average crysTalline silicon and Thin-film pv sysTem price forecasTs for 2010 To 2015
Source: Solarbuzz, 2011.
1
2
3
4
5
2010
USD
/Wp
2010
balance Energy Green World Production Led
2011 2012 2013 2014 2015
Average thin film PV system price
15% pa decline
1
2
3
4
5Average c-Si PV system price
2010
USD
/Wp
2010 2011 2012 2013 2014 2015
balance Energy Green World Production Led9% pa decline 14% pa decline
11% pa decline

36 Cost Analysis of Solar Photovoltaics
figure 5.6: us doe cosT reducTion goals To achieve usd 1/w
Source: Lushetsky, 2010.
0.0
0.5
1.0
1.5
2.0
2.5
3.0
3.5
2010
USD
/Wp
2010 (estimated) 2016 $1/Watt
0.18
0.10
0.40
0.50
0.22
3.40
2.20
1.00
1.48
0.97
1.05
1.70
Power electronic
boS/Installation
Module
figure 5.7: TheoreTical solar cell maximum efficiency by pv Technology
Source: Mehta and Maycock, 2010.
0% 10% 20% 30% 40% 50% 60% 70% 80% 90% 100%
CrystallineSilicon
ConcentratingPV (using
multijunction)
Cdte
30
30
29
27
68
88
CIGS
amorphous Si
Multijunction
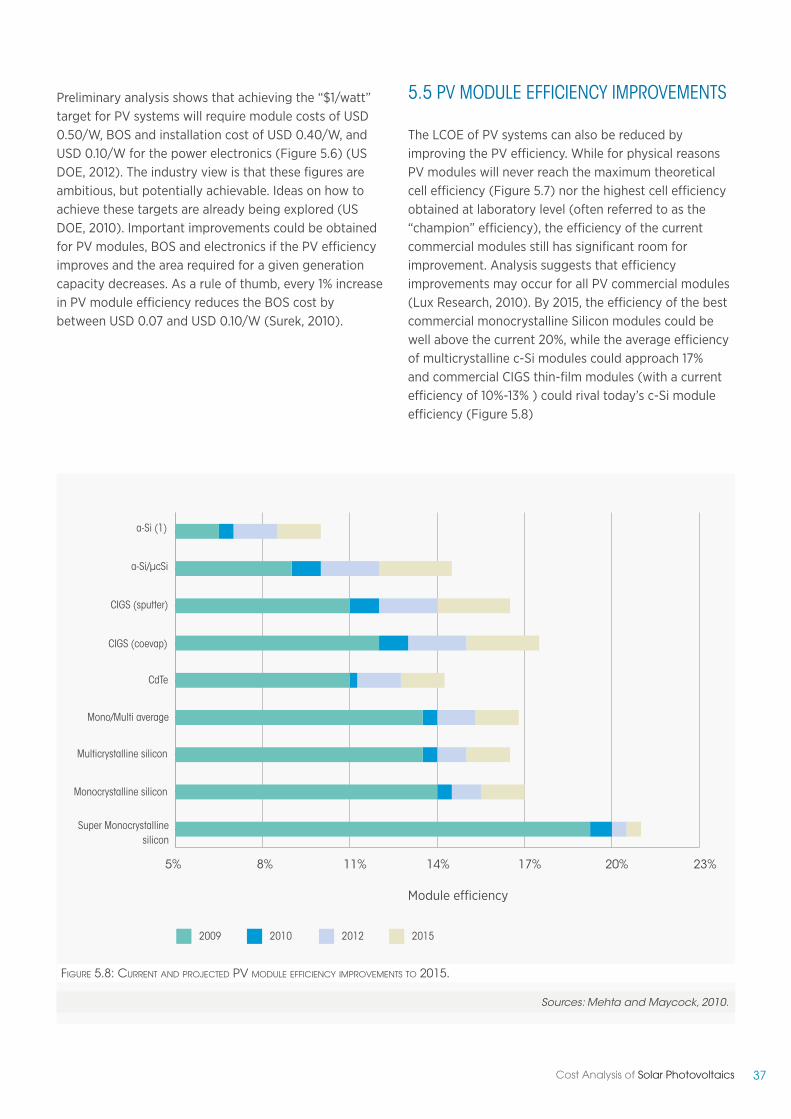
37Cost Analysis of Solar Photovoltaics
figure 5.8: currenT and projecTed pv module efficiency improvemenTs To 2015.
Sources: Mehta and Maycock, 2010.
5% 8% 11% 14% 17% 20% 23%
a-Si (1)
a-Si/µcSi
CIGS (sputter)
CIGS (coevap)
Cdte
Mono/Multi average
Multicrystalline silicon
Monocrystalline silicon
Super Monocrystallinesilicon
Module efficiency
2009 2010 2012 2015
Preliminary analysis shows that achieving the “$1/watt”target for PV systems will require module costs of USD0.50/W, BOS and installation cost of USD 0.40/W, andUSD 0.10/W for the power electronics (Figure 5.6) (USDOE, 2012). The industry view is that these figures areambitious, but potentially achievable. Ideas on how toachieve these targets are already being explored (USDOE, 2010). Important improvements could be obtainedfor PV modules, BOS and electronics if the PV efficiencyimproves and the area required for a given generationcapacity decreases. As a rule of thumb, every 1% increasein PV module efficiency reduces the BOS cost bybetween USD 0.07 and USD 0.10/W (Surek, 2010).
5.5 PV MoDuLE EFFICIENCY IMProVEMENtS
The LCOE of PV systems can also be reduced byimproving the PV efficiency. While for physical reasonsPV modules will never reach the maximum theoreticalcell efficiency (Figure 5.7) nor the highest cell efficiencyobtained at laboratory level (often referred to as the“champion” efficiency), the efficiency of the currentcommercial modules still has significant room forimprovement. Analysis suggests that efficiencyimprovements may occur for all PV commercial modules(Lux Research, 2010). By 2015, the efficiency of the bestcommercial monocrystalline Silicon modules could bewell above the current 20%, while the average efficiencyof multicrystalline c-Si modules could approach 17%and commercial CIGS thin-film modules (with a currentefficiency of 10%-13% ) could rival today’s c-Si moduleefficiency (Figure 5.8)

38 Cost Analysis of Solar Photovoltaics
6.Levelised costof electricity from solar PV
PV systems, like most renewable power generation technologies, are capital intensive, but have no fuel costs.The three key drivers of the LCOE of PV systems are:
The solar resource is the key determinant of theoutput yield of a PV system per kW, in that it is the keydeterminant of the average capacity factor achieved. Thetilt and orientation of the panels, as well as the presenceof any tracking system, also impacts on the yield. Avoidingshading of the systems wherever possible is vital.
When the LCOE of a PV system is the same or lessthan residential electricity tariff, then the PV electricityis economically competitive for residential users.Competitiveness has been already achieved in somecountries where the electricity retail price is particularlyhigh and solar irradiation and climate are particularlyfavourable to the PV electricity generation (e.g. someSouthern European countries). With PV system costscontinuously declining, PV will become economicallyattractive for residential and many commercial sectorconsumers in many countries. Some projections suggestthat PV systems will be economic without support forresidential consumers in most countries by 2020 andthat the cost of PV electricity will continue decliningsteadily toward a full competitiveness with conventionalelectricity generation options.
However, much depends on whether the current rateat which PV system costs decline continues and therate of deployment. Critically, in many countries whichexperience afternoon demand peaks, the value ofPV electricity can substantially exceed the averagegrid-based generation cost. Similarly, many of theseprojections are based on continued increases in thecost of electricity from conventional power generationtechnologies.
The International Energy Agency (IEA) in its PVTechnology Roadmap (IEA, 2010) projects that:
» Over the current decade, continuedgovernment support will enable the LCOE ofPV to decline sufficiently to compete withretail electricity prices in a growing numberof countries.
» In 2020, the LCOE of PV systems will rangebetween USD 0.105 and USD 0.21/kWh forlarge, utility-scale plants, and between USD0.16 and USD 0.315/kWh for residential PVsystems.
Under the IEA scenario, the LCOE of PV systems willnot reach grid parity in most countries until after2020. However, given how fast PV costs have beendeclining and how rapid PV markets are growing inmany countries, a more favourable PV scenario might bepossible. The European Photovoltaic Industry Association(EPIA) estimates that the LCOE of PV could drop fromUSD 0.22 to USD 0.27/kWh in 2010 to USD 0.06 to USD0.10/kWh by 2020 (Figure 6.1) (EPIA and A.T. Kearney,2011c), while analysis of the US market projects thatthe LCOE of residential c-Si PV systems could declineto between USD 0.10 and USD 0.18/kWh by 2015, andto between USD 0.07 and USD 0.12/kWh by 2020. TheLCOE of utility-scale systems for both thin film and c-Sicould decline to between USD 0.06 and USD 0.10/kWhby 2020 (Table 6.1). This would enable PV systems tocompete with residential tariffs in a wide range of regionsin the United States and to reach grid parity in high-costregions by 2015 (Figure 6.2).
z The capital and the installation costs of PV modules and BOS (USD/W);z The average annual electricity yield (kWh per kW), a function of the local solar radiation and the solar cells’technical performance; and
z The cost of finance for the PV system.
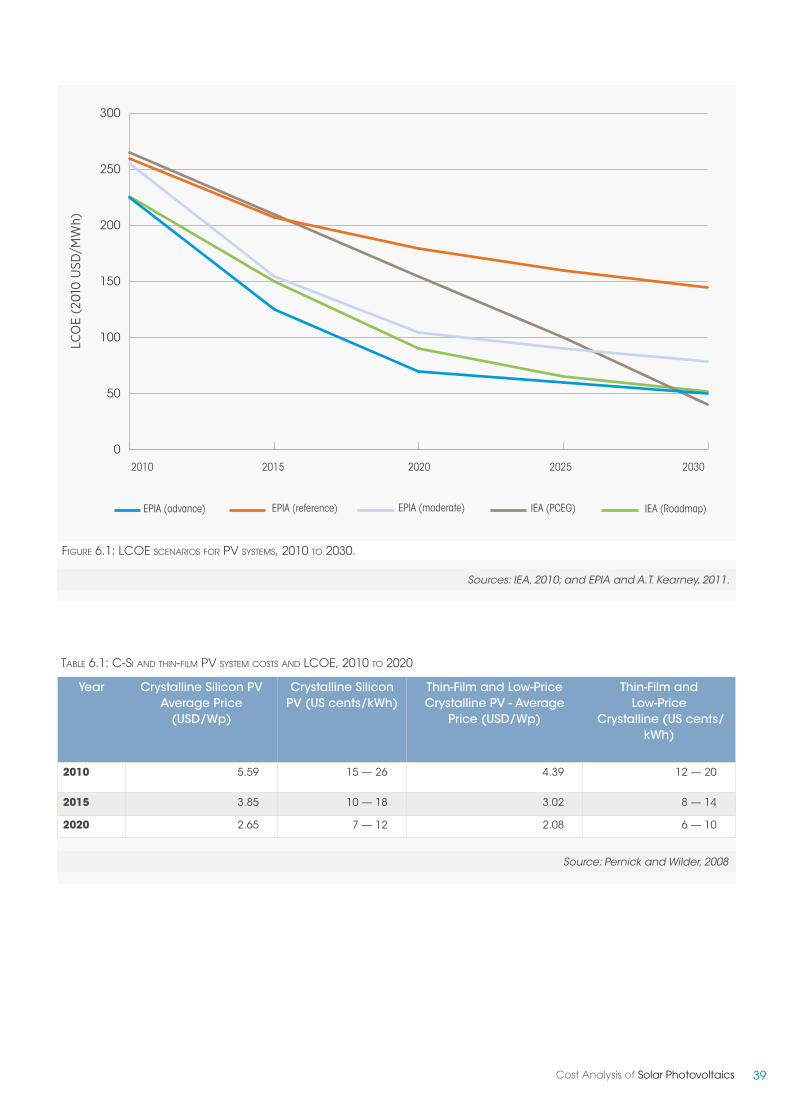
39Cost Analysis of Solar Photovoltaics
figure 6.1: lcoe scenarios for pv sysTems, 2010 To 2030.
Sources: IEA, 2010; and EPIA and A.T. Kearney, 2011.
LCOE(2010
USD
/MWh)
0
50
100
150
200
250
300
2010 2020 2025 20302015
EPIa (advance) EPIa (moderate) IEa (roadmap)EPIa (reference) IEa (PCEG)
Table 6.1: c-si and Thin-film pv sysTem cosTs and lcoe, 2010 To 2020
Source: Pernick and Wilder, 2008
Year Crystalline Silicon PVAverage Price(USD/Wp)
Crystalline SiliconPV (US cents/kWh)
Thin-Film and Low-PriceCrystalline PV - Average
Price (USD/Wp)
Thin-Film andLow-Price
Crystalline (US cents/kWh)
2010 5.59 15 — 26 4.39 12 — 20
2015 3.85 10 — 18 3.02 8 — 14
2020 2.65 7 — 12 2.08 6 — 10

40 Cost Analysis of Solar Photovoltaics
figure 6.2: reTail elecTriciTy prices (2007) and The projecTed lcoe of pv sysTems (2020)
Source: Pernick and Wilder, 2008.
12.9
Table 6.2: insTalled cosT and efficiency assumpTions for residenTial pv sysTems, 2010 To 2015
0 10 20 30 40
San Francisco
Kauai
boston
baltimore
Delaware
Phoenix
Santa Monica
New Haven
Long Island
New York
reno
Las Vegas
San Diego
39.8
20.2
13.2
15.4
7.5
12.7
18.3
16.0
19.5
11.7
9.5
16.3
6.1 LCoE EStIMatES For 2011 to 2015
This section analyses the current estimates of the LCOEof utility-scale and residential PV systems for differenttechnologies and looks at the outlook for cost reductionsto 2015. The analysis is based on the data presentedin the earlier sections, and the main assumptions aresummarised in Tables 6.2 and 6.3.
2010 2011 2015
c-Si PV system
Installed cost (2010 USD/kW) 3 800 to 5 800 3 070 to 5 000 2 850 to 4 100
Efficiency (%) 14 14 17
C-Si PV system with battery storage
Installed cost (2010 USD/kW) 5 000 to 6 000 4 000 to 5 000 3 800 to 4 300
Efficiency (%) 14 14 17
The LCOE of current c-Si residential PV systems withoutbattery storage was estimated to be between USD 0.28and USD 0.70/kWh in 2010. This is estimated to havedeclined to between USD 0.25 and USD 0.65/kWh in2011 with the reduction in c-Si module prices to as lowas USD 1.04 to USD 1.34/Wp by the end of 2011. By 2015it is estimated that the LCOE of these systems coulddecline to between USD 0.21 and USD 0.49/kWh. This
US cents/kWh
the LCoE range of PV in 2020

41Cost Analysis of Solar Photovoltaics
2010 2011 2015
Amorphous Si thin film
Installed cost (2010 USD/kW) 3 600 to 5 000 3 600 to 5 000 2 500 to 3 400
Efficiency (%) 8 to 9 11 to 12
CdTe and CIGS
Installed cost (2010 USD/kW) 3 600 to 5 000 2 640 to 4 500 2 500 to 3 500
Efficiency (%) 11 to 12 11 to 12 13 to 17
would make the LCOE of PV systems in areas with goodsolar resource competitive for the residential end-usercompared to grid prices in many countries.20
When storage is included, the LCOE range of residential PVsystems is estimated to be between USD 0.36 and USD 0.71/kWh, although this does not take into account the additionalvalue of the flexibility to supply PV electricity when the sunis not shining. By 2015, the LCOE of these systems coulddecline to between USD 0.31 and USD 0.52/kWh (Figure 6.3).
20 For instance, average residential prices in Europe are in the region of USD 0.23/kWh.
Utility-scale systems have lower average costs thanresidential systems, but the lowest LCOE of utility-scale systems is not significantly lower than the mostcompetitive residential markets. The LCOE of currentutility-scale thin-film PV systems was estimated to bebetween USD 0.26 and USD 0.59/kWh in 2010. Thesignificant drop in PV module prices in 2011 resulted inthis range declining to between USD 0.20 and USD 0.52/kWh. By 2015 the LCOE of utility-scale systems couldreduce to between USD 0.19 and USD 0.42/kWh.
figure 6.3: illusTraTive lcoe of residenTial and uTiliTy-scale pv sysTems, 2010 and 2015
Note: Capital costs and efficiency are from Tables 6.2 and 6.3. DC to AC efficiency is assumed to be 77%. Load factors are assumed to be between 15%and 25%, and O&M costs are fixed at USD 6.5/kW/year.
0.0
0.1
0.2
0.3
0.4
0.5
0.6
0.7
0.8
2010
USD
/kWh
Assumes a 10% cost of capital
c-Si (2010) c-Si (2015) c-Si withstorage(2010)
residential utility-scale
c-Si withstorage(2015)
amorphousSi (2010)
amorphousSi (2015)
Cdte andCIS/CIGS(2010)
Cdte andCIS/CIGS(2015)
Table 6.3: insTalled cosT and efficiency assumpTions for uTiliTy-scale pv sysTems, 2011 To 2015

42 Cost Analysis of Solar Photovoltaics
ReferencesBank Sarasin, (2010), Solar industry - Entering new dimensions, Bank Sarasin, Basel.
Bony, l. et al. (2010), Achieving Low-Cost Solar PV: Industry Workshop Recommendations for Near-Term Balance of System Cost Reductions, Rocky Mountain Institute, Co.http://www.rmi.org/Content/Files/ BOS Report.pdf
Breyer, C. and A. Gerlach (2011), Global Overview on Grid-Parity Event Dynamics, Proceedings of the26th European Photovoltaic Solar Energy Conference, 5 – 9 September, Hamburg.
Campbell, M. (2011), PV Power Plant Cost Trends, presentation to U.S. Department of Energy Balanceof Systems (BOS) SunPower Workshop, January 13.
Cotal, H. et al. (2009), III–V multijunction solar cells for concentrating photovoltaics, Energy Environ-ment Science, 2009, 2, pps 174–192, Sylmar, CA.
European Photovoltaic Industry Association (EPIA) (2011a), Solar Generation 6: Solar Photovoltaic En-ergy Empowering the World, EPIA, Brussels.
EPIA (2011b), Global Market Outlook for Photovoltaics until 2015, EPIA, Brussels.
EPIA and A.T. Kearney (2011), Solar Photovoltaics: Competing in the Energy Sector, EPIA, Brussels.
EPIA and Photovolatic Technology Platform (2011), Solar Europe Industry Initiative ImplementationPlan 2010-2012, EPIA, Brussels.
EPIA (2012), Market Report 2011, EPIA, Brussels.
First Solar (2011), First Solar Corporate Overview: Q2 2011, First Solar, Tempe, AZ.http://www.firstsolar.com/~/media/WWW/Files/Downloads/PDF/FSLR_CorpOverview.ashx
Goodrich, A.; T. James and M. Woodhouse (2012), Residential, Commercial, and Utility-Scale Photovol-taic (PV) System Prices in the United States: Current Drivers and Cost Reduction Opportunities,NREL, Golden, CO.
Grätzel, M. and O’Regan, B. (1991), “A Low-Cost, High-Efficiency Solar Cell Based on DyesensitizedColloidal TiO2 Films”, Nature, Vol. 353, pps 737-740.
Grätzel M. (2009), Recent Advances in Mesoscopic Solar Cells, Accounts of Chemical Research, Vol. 42,pps 1781-1798, Washington, D.C.
Green, M. A. (2001), Clean Energy from Photovoltaics, World Scientific Publishing Co., Hackensack, NJ.
Green, M. A. (2009), The Path to 25% Silicon Solar Cell Efficiency: History of Silicon Cell Evolution,Progress in Photovoltaics, Vol. 17, issue 3, pps 183-189.
Green, M.A. et al. (2011), Solar Cell Efficiency Tables (Version 37), Progress in Photovoltaics: Researchand Applications, Vol. 19, pps 84-92, John Wiley & Sons Ltd., N.J.
GTM Research (2011), U.S. Solar Energy Trade Assessment 2011, Greentech Media Inc., Boston, MA.
Hearps, P. and D. McConnell (2011), Renewable Energy Technology Cost Review, Melbourne EnergyInstitute, 2011, Melbourne, Vic.

43Cost Analysis of Solar Photovoltaics
International Energy Agency (IEA) (2010), Technology Roadmap: Solar Photovoltaic Energy, IEA/OECD, Paris.
IEA (2011), Solar Energy Perspectives, IEA/OECD, Paris.
IEA Photovoltaic Power Systems (IEA PVPS) (2009), Trends in Photovoltaic Applications, IEA PVPS.http://www.iea-pvps.org/fileadmin/dam/public/report/statistics/tr_2009_neu.pdf
Kersten, F. et al. (2011), PV Learning Curves: Past and Future Drivers of Cost Reduction, Proceedings ofthe 26th European Photovoltaic Solar Energy Conference, 5 – 9 September, Hamburg.
Komoto, K. (2010), Survey of Large Scale PV Systems in the World, IEA PVPS Task 8: 25thParticipantMeeting, Mizuho, Japan.
Kurokawa, K. et al. (2003), Energy from Desert: Feasibility of Very Large Scale Photovoltaic PowerGeneration (VLS-PV) Systems, Routledge, Taylor and Francis, Oxford.
Leung, Siu-fung et al. (2011), Engineered Optical Absorption of Nano/Micro-pillar Arrays for EfficientPhotovoltaics, presentation to the symposium “Third-Generation and Emerging Solar-CellTechnologies”, April 26 - 29, 2011, Golden, CO.
Liebreich, M. (2011), Bloomberg New Energy Finance Summit: Keynote Presentation, BNEF, 5 April,London.
Luo, L. (2011), Demand and latest pricing developments in the PV Industry, BNEF, presentation to 6thAsiaSolar PV Industry Forum, 6 May.
Lushetsky, J. (2010), Prospects for $1/W Electricity from Solar, presentation to “One Dollar a Watt”workshop, August 10, Washington, D.C.
Lux Research (2010), Module Cost Structure Breakdown: Can Thin Film Survive the Crystalline SiliconOnslaught?, Lux Research, Boston, MA.
Mehta, S. (2010), PV Technology, Production and Cost Outlook: 2010-2015, Greentech Media Research,October, Boston, MA.
Mehta, S. and P. Maycock (2010), The PV Supply Chain: Manufacturing, Technologies, Costs, GreentechMedia Research and PV Energy Systems, 11 October.
Mott MacDonald (2011), Costs of low-carbon generating technologies, Mott MacDonald, Bristol.
Nature Photonics (2010), Future Perspectives of Photovoltaics, Proceedings of the Conference, NaturePublishing Group, Nature Asia-Pacific, Tokyo.
Newman, S. (2011), Outcomes of the RMI PV BOS Charrette, Presentation to the DOE SunShot BOSProcess Workshop, February 9, Washington, D.C.
Nozik, A. et al. (2011), Multiple Exciton Generation in Colloidal Quantum Dots, Singlet Fission in Mol-ecules, Quantum Dot Arrays, Quantum Dot Solar Cells, and Effects of Solar Concentration, Pre-sentation to the symposium “Third-Generation and Emerging Solar-Cell Technologies”, April26 - 29, 2011, Golden, Co.
OrgaPVnet (2009), Technology Roadmap Towards Stable & Low-cost Organic Based Solar Cells, Or-gaPVnet, Brussels.
44 Cost Analysis of Solar Photovoltaics
Pernick, R. and C. Wilder (2008), Utility Solar Assessment (USA) Study: Reaching Ten Percent Solar by2025, Clean Edge Inc. and Co-op America
Philibert, C. (2011), Interactions of Policies for Renewable Energy and Climate, International EnergyAgency, Paris. http://www.iea.org/publications/free_new_Desc.asp?PUBS_ID=2358
Photon (2011a), Photon International, Photon, Issue 4-2011, Aachen.
Photon (2011b), Photon International, Photon, Issue 5-2011, Aachen.
Photovoltaik (2012), Photovoltaik Magazin, Alfons W. Gentner Verlag GmbH & Co. KG / Solarpraxis AG,03/2012, Stuttgart.
Raffaelle, R.P. (2011), Next Generation Photovoltaics, presentation to the symposium “Third-Generationand Emerging Solar-Cell Technologies”, April 26 - 29, 2011, Golden, CO.
SCHOTT Solar (2011), Crystalline Silicon Technology, http://www.us.schott.com/photovoltaic/english/about_pv/technologies/crystalline/
Solarbuzz (2011), Annual World PV Market Review, Solarbuzz, 12 April 2011, Port Washington, NY.
Solar Junction (2011), Solar Junction Breaks World Record with 43.5% Efficient CPV Production Cell,http://www.sj-solar.com/downloads/Solar_Junction_World_Record%20Efficiency14April11.pdf
Surek, T. (2010), The Race to Grid Parity: Crystalline Silicon vs. Thin Films, Surek PV Consulting.
US DOE (2010), $1/W Photovoltaic Systems Workshop Summary, US DOE, Washington, D.C.
US DOE (2012), Sunshot Vision Study, US DOE, Washington, D.C.
Zentrum für Sonnenenergie und Wasserstoff-Forschung Baden-Württemberg (ZSW) (2010), ZSW Re-searchers Break Own CIGS Efficiency Record and Hit 20.3%, ZSW.http://compoundsemiconductor.net/csc/news-details.php?id=19732311
45Cost Analysis of Solar Photovoltaics
APEC Asia-Pacific Economic Cooperation
a-Si Amorphous silicon
BOS Balance of system
CAPEX Capital expenditure
CdTe Cadmium-Telluride
CIF Cost, insurance and freight
CIGS Copper-Indium-Gallium-Diselenide
CIS Copper-Indium-Selenide
CPV Concentrating PV
c-Si Crystalline silicon
DCF Discounted cash flow
DNI Direct normal irradiance
DSSC Dye-sensitized solar cells
EU-27 The 27 European Union member countries
FOB Free-on-board
GHG Greenhouse gas
GW Gigawatt
kW Kilowatt
kWh kilowatt hour
mc-Si multi-crystalline silicon
MENA Middle East and North Africa
MW Megawatt
MWh Megawatt hour
LCOE Levelised cost of energy
O&M Operating and maintenance
OPEX Operation and maintenance expenditure
PV Photovoltaics
R&D Research and Development
sc-Si Single crystalline silicon
USD United States dollar
Wp Watt peak
WACC Weighted average cost of capital
Acronyms

IRENA Secretar iat
C67 Office Bui lding, Khal idiyah (32nd) Street
P.O. Box 236, Abu Dhabi,
United Arab Emirates
www.irena.org
Copyright 2012
IRENAIRENAIRENA SecrSecret
C67C67 OfOffiice Bui ldingBui ldingBui lding Khal idiyKhal idiyahah (32(32nd) StrStreeteet
P..O Box 236,236, AbuAbu Dhabi,
UnitUnited ArArabab EmirEmirates
wwwwwwwww.irena.orena.orena.orena.orgg
CopCopyrr ightr ight 201220122012CopCopyrr ightr ight
etar iat
Bui lding, Khal idiy
Dhabi,
ar iatar iat
Bui lding, Khal idiyKhal idiyKhal idiy
Dhabi,Dhabi,Dhabi,