18_ppt
DESCRIPTION
nice1TRANSCRIPT

New Development of Ethanol New Development of Ethanol Industry in IndonesiaIndustry in Indonesia
Petrus PanakaPetrus PanakaPT Gikoko Kogyo IndonesiaPT Gikoko Kogyo Indonesia
[email protected]@indo.net.id&&
M. M. ArifArif [email protected]@yahoo.com
Starch Technology Center (B2TP)Starch Technology Center (B2TP)Agency for the Assessment and Application of Technology (BPPT)Agency for the Assessment and Application of Technology (BPPT)
Asian Science & Technology SeminarAsian Science & Technology SeminarJakarta. March 7. 2007Jakarta. March 7. 2007
Outline of PresentationOutline of Presentation1. Indonesia biomass potential for Biofuel2. Road Map of Bioethanol & Industry Plant in
Indonesia3. Ethanol Production and Export in Indonesia 4. Strategy to solve oil price problem :- Increase renewable fuel (biofuel) utilization- Increase value added for energy resources5. R &D of Gasohol.6. Conclusions
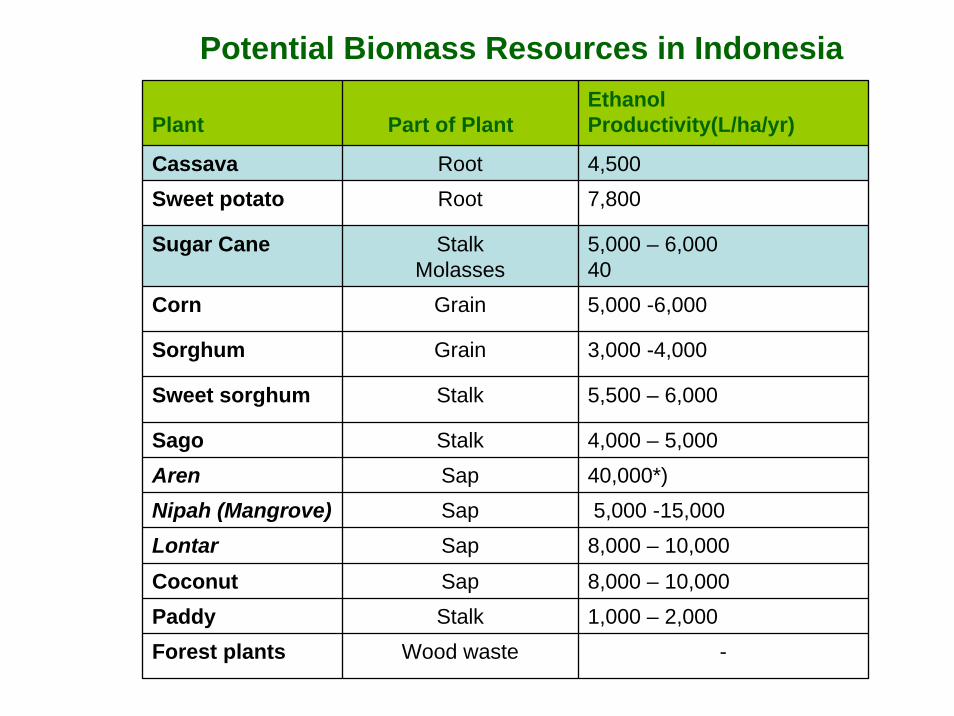
Plant Part of Plant Ethanol Productivity(L/ha/yr)
Cassava Root 4,500Sweet potato Root 7,800
Sugar Cane StalkMolasses
5,000 – 6,00040
Corn Grain 5,000 -6,000
Sorghum Grain 3,000 -4,000
Sweet sorghum Stalk 5,500 – 6,000
Sago Stalk 4,000 – 5,000Aren Sap 40,000*)Nipah (Mangrove) Sap 5,000 -15,000Lontar Sap 8,000 – 10,000
Coconut Sap 8,000 – 10,000Paddy Stalk 1,000 – 2,000Forest plants Wood waste -
Potential Biomass Resources in Indonesia

ProvinceArea
(mil. ha)Productivity
(ton/yr)Avr production
(t/ha)
North Sumatera 27.6 411.94 14.90
Lampung 298.48 4,984.62 16.70
West Java 114.69 1,651.48 14.40
CenterJava 215.52 3,469.80 16.10
Jogyakarta 47.48 764.41 16.10
East Java 241.20 3,786.88 15.70
Banten 10.75 154.82 14.40
South Sulawasi 41.88 607.29 14.50
NTB 8.28 88.57 10.70
NTT 75.51 808.00 10.70
Papua 3.83 40.93 10.69
Others 114.44 1,705.23 14.90
Indonesia 1,239.86 18,473.96 14.90
Source : BPS. 2004
Cassava Plantation in Indonesia
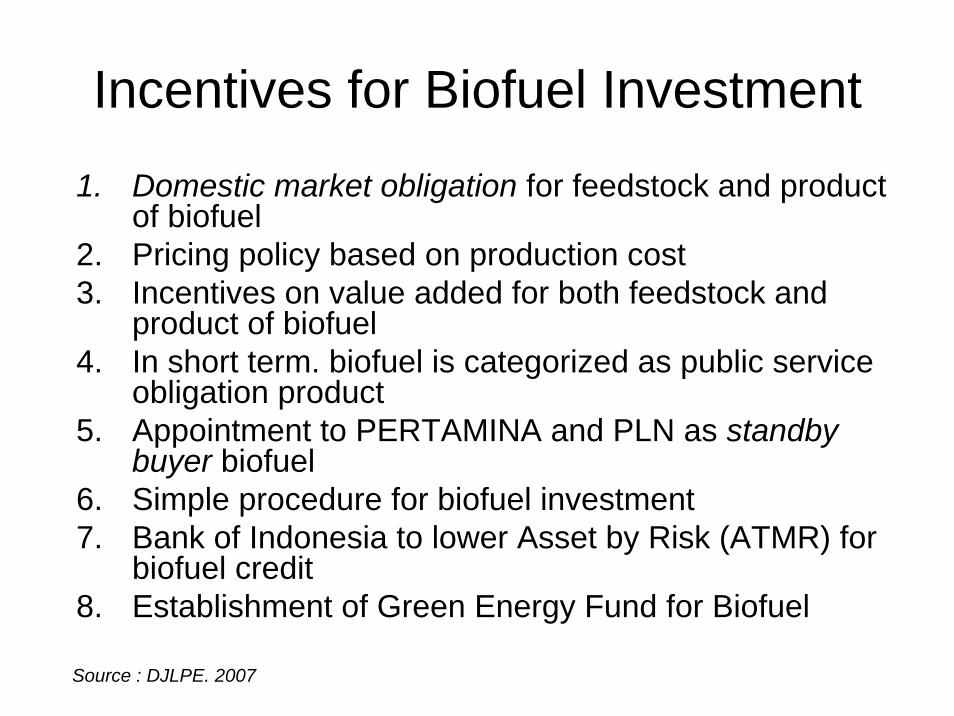
Incentives for Biofuel Investment
1. Domestic market obligation for feedstock and product of biofuel
2. Pricing policy based on production cost3. Incentives on value added for both feedstock and
product of biofuel4. In short term. biofuel is categorized as public service
obligation product5. Appointment to PERTAMINA and PLN as standby
buyer biofuel6. Simple procedure for biofuel investment7. Bank of Indonesia to lower Asset by Risk (ATMR) for
biofuel credit8. Establishment of Green Energy Fund for Biofuel
Source : DJLPE. 2007
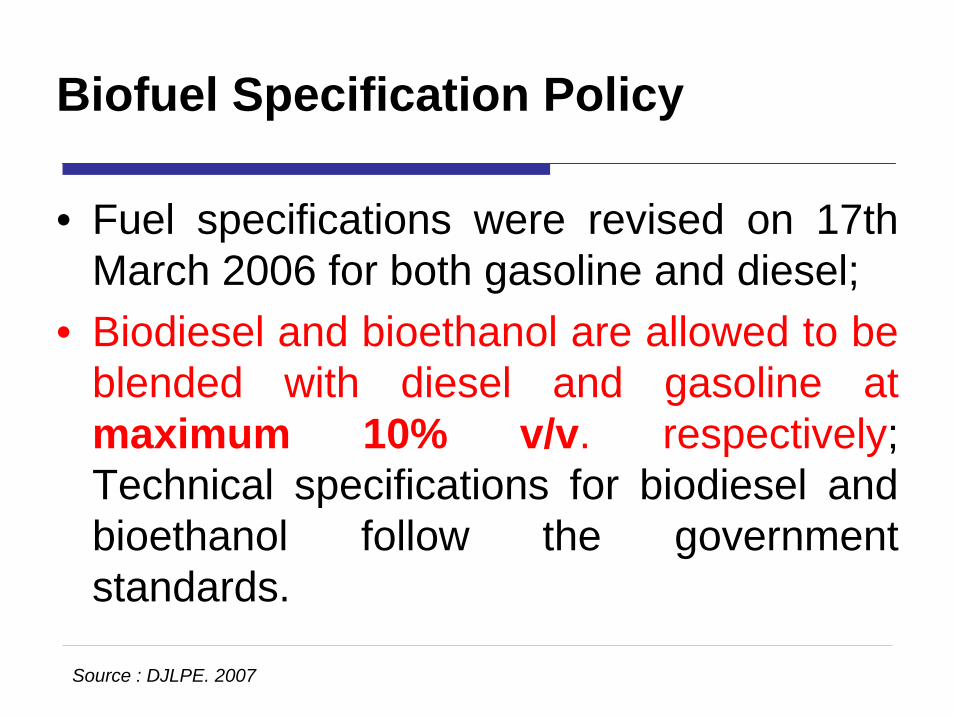
Biofuel Specification Policy
• Fuel specifications were revised on 17th March 2006 for both gasoline and diesel;
• Biodiesel and bioethanol are allowed to be blended with diesel and gasoline at maximum 10% v/v. respectively; Technical specifications for biodiesel and bioethanol follow the government standards.
Source : DJLPE. 2007

ROAD MAP OF BIOETANOLYear 2006 – 2010 2011-2015 2016-2025
NATIONAL STANDARAD OF FUELGRADE FOR GASOHOL & ETHANOL (FGE)
Bioetanol supply 1.48 mil kl (10% of total gasoline
consumption)
Gasohol E-10(Bioetanol from cassava & molasses)
Strain yeast improvement
Fermentationprocess
technology
Membrane technology for
dehydration
BioethanolDehydration
with adsorben
Bioetanol production 99.5% (FGE) by chemical dehydration technique and
molecular sieving of molasses feedstock based and commercial scale
Bioetanol production 99.5% (FGE) with production rate and high energy ratio
based on cassava and starch feedstock for commercial scale
Carbohydrate resources for bioethanol feedstock
Lignocellulose as bioethanol feedstock
and fuel
Bioetanol production 99.5% (FGE) from lignocelulose fibre
(agriculture/forest waste).starch and cassava (incl. algae) at commercial
scale
Product
Technology
R & D
Bioetanol supply 2.78 mil kl ( 15% of total gasoline consumption)
Bioetanol supply 6.28 mil kl ( minimal 20 % of total gasoline consumption)
Gasohol/ FGE (Bioetanol from cassava. starch & molasses)
Gasohol/ FGE (Bioetanol from lignocellulose.starch and cassave )
Market
TechnologyStatus
R&D
Source : DJLPE. 2007

Road map for BioethanolIndustry Plant Construction
2005 2015 202 52007 2009
Demo plant BPPT8 kL/hari
Pembangunan104 plant @ 60kL/hari
Pembangunan 62 plant @ 60kL/hari
2013
Pembangunan 114 plant @ 60kL/hari
2018 2023202020102005 2015 202 52007 2009
Demo plant BPPT8 kL/hari
Pembangunan104 plant @ 60kL/hari
Pembangunan 62 plant @ 60kL/hari
2013
Pembangunan 114 plant @ 60kL/hari
2018 202320202010
Note :1). 60 kL/day capacity is the lowest capacity of commercial ethanol plant based on starch feedstock. It needs about
Rp 150 billion per-plant investment.2). For efficiency reasons. investors should be encouraged to construct 2-3 times of those capacity.3). The development of commercial plant under 60 kL/day is possible with local avaiable feedstock (especially starch.
sap.’ lontar’. ‘nipah’. sugarcane and sweet sorgum) for rural areas where price of fuel oil is high.
The construction of104 plants @60 KL/day
The construction of62 plants @60 KL/day The construction of 114 plants @60 KL/day
8 KL/day
Source : DJLPE. 2007
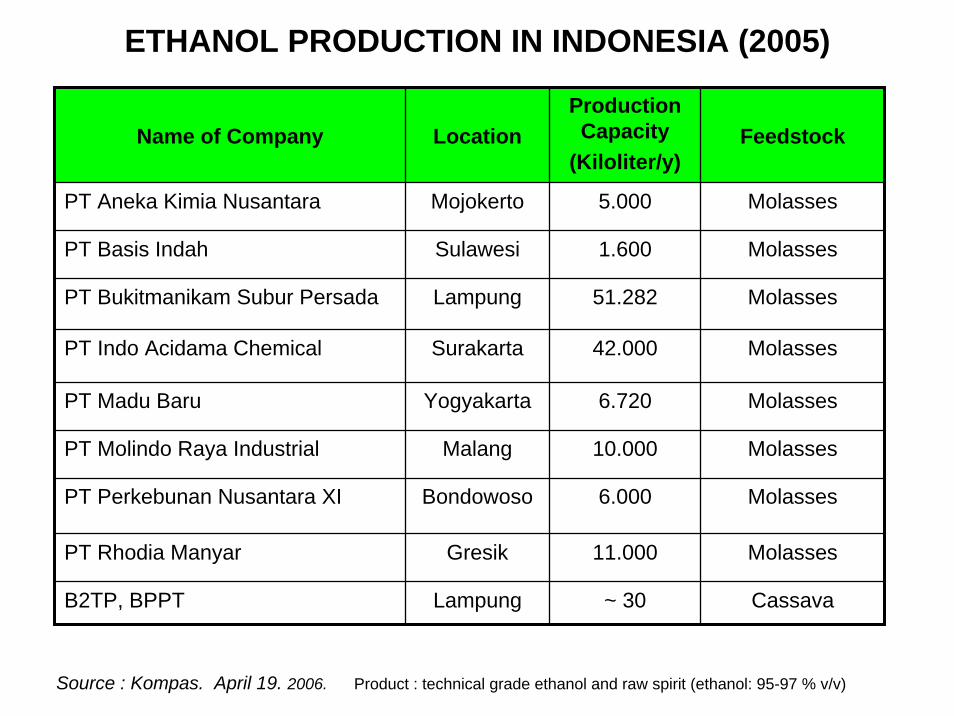
ETHANOL PRODUCTION IN INDONESIA (2005)
Name of Company LocationProduction Capacity
(Kiloliter/y)Feedstock
PT Aneka Kimia Nusantara Mojokerto 5.000 Molasses
PT Basis Indah Sulawesi 1.600 Molasses
PT Bukitmanikam Subur Persada Lampung 51.282 Molasses
PT Indo Acidama Chemical Surakarta 42.000 Molasses
PT Madu Baru Yogyakarta 6.720 Molasses
PT Molindo Raya Industrial Malang 10.000 Molasses
PT Perkebunan Nusantara XI Bondowoso 6.000 Molasses
PT Rhodia Manyar Gresik 11.000 Molasses
B2TP, BPPT Lampung ~ 30 Cassava
Source : Kompas. April 19. 2006. Product : technical grade ethanol and raw spirit (ethanol: 95-97 % v/v)

Indonesia Ethanol Export Country Destination (2004)
Destination Capacity (ton) Value (US$)
Japan 9,459.5 3,337,018
China 12.8 8,800
Singapore 255.50 145,726
Philippines 7,374.405 2,609,972
Malaysia 12.8 7,672
Taiwan 4,982.963 2,948,038
Thailand 12.8 7,890
Others 87.662 115,382
Total 22,198.43 9,180,498
Source : Kompas. April 19. 2006
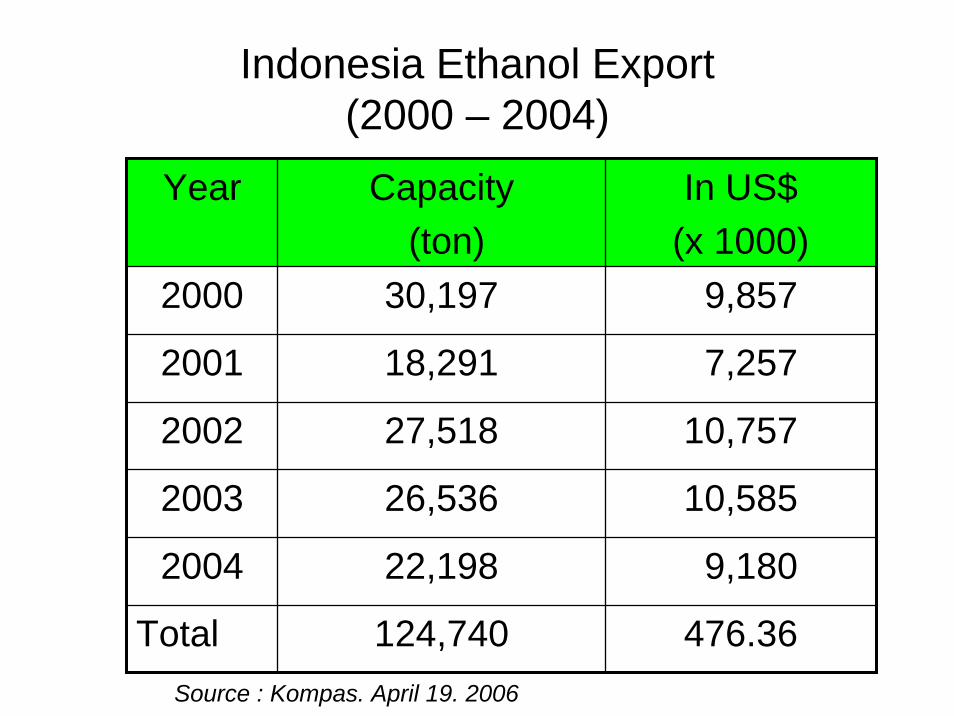
Indonesia Ethanol Export(2000 – 2004)
Year Capacity(ton)
In US$(x 1000)
2000 30,197 9,857
2001 18,291 7,257
2002 27,518 10,757
2003 26,536 10,585
2004 22,198 9,180
Total 124,740 476.36Source : Kompas. April 19. 2006

FUTURE ETHANOL PLANTS IN INDONESIA
Name of Company LocationProduction Capacity
(Kiloliter/y)Feedstock
PT Indo Lampung Distillery Lampung 60,000 Molasses
PT Sampurna Ponorogo 16,800 Cassava
PT RNI & Choi Biofuel Co. Pasuruan 11,200 Molasses
Kanematsu Corporation ? 30,000 Cassava
CNOOC & PT Smart & HongkongEnergy
? ? Cassava & Molasses
PT Medco Energi Internasional Tbk Kotabumi ? Cassava
PTPN X & PT Molindo Raya Industri Kediri 120 Molasses
Source : From Kompas & Sinar Harapan. July 2006 – March 2007.
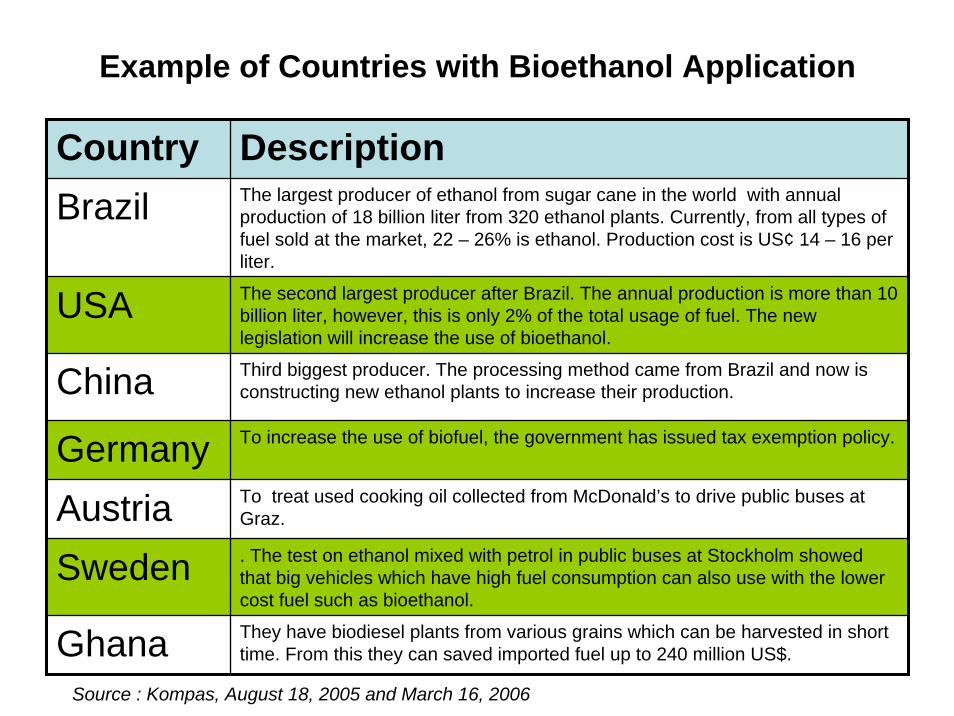
Example of Countries with Bioethanol Application
Country DescriptionBrazil The largest producer of ethanol from sugar cane in the world with annual
production of 18 billion liter from 320 ethanol plants. Currently, from all types of fuel sold at the market, 22 – 26% is ethanol. Production cost is US¢ 14 – 16 per liter.
USA The second largest producer after Brazil. The annual production is more than 10 billion liter, however, this is only 2% of the total usage of fuel. The new legislation will increase the use of bioethanol.
China Third biggest producer. The processing method came from Brazil and now is constructing new ethanol plants to increase their production.
Germany To increase the use of biofuel, the government has issued tax exemption policy.
Austria To treat used cooking oil collected from McDonald’s to drive public buses at Graz.
Sweden . The test on ethanol mixed with petrol in public buses at Stockholm showed that big vehicles which have high fuel consumption can also use with the lower cost fuel such as bioethanol.
Ghana They have biodiesel plants from various grains which can be harvested in short time. From this they can saved imported fuel up to 240 million US$.
Source : Kompas, August 18, 2005 and March 16, 2006

Continue…Country DescriptionThailand E10, Gasohol. Target from December 2005, increased filling station from 829 to ncreased filling station from 829 to
4,000 stations.4,000 stations. 6 ethanol plants (2006) with production of 1,090 kL/day. Another 17 plants permitted with total capacity of 300,000 kL/day.
Indonesia “Biopremium” (E5, 5% ethanol & 95% petrol) and “biopertamax” (E5, 5% ethanol & 95% pertamax) products from PT Molindo Raya and Pertamina. As for Aug 2006, only 2 bioethanol filling stations have been operating at Malangand Semarang.
Japan E3. Ethanol Import from Brazil.
Source : Kompas, August 18, 2005 and March 16, 2006

PretreatmentCooking and
Saccharification Fermentation
Distillation
Cassava
Dehydration FGE(Ethanol 99.5%)
Molasses
Fuel Grade Ethanol (FGE) Production Flow Diagram Based on Cassava
AmylasesYeast
Source : B2TP-BPPT
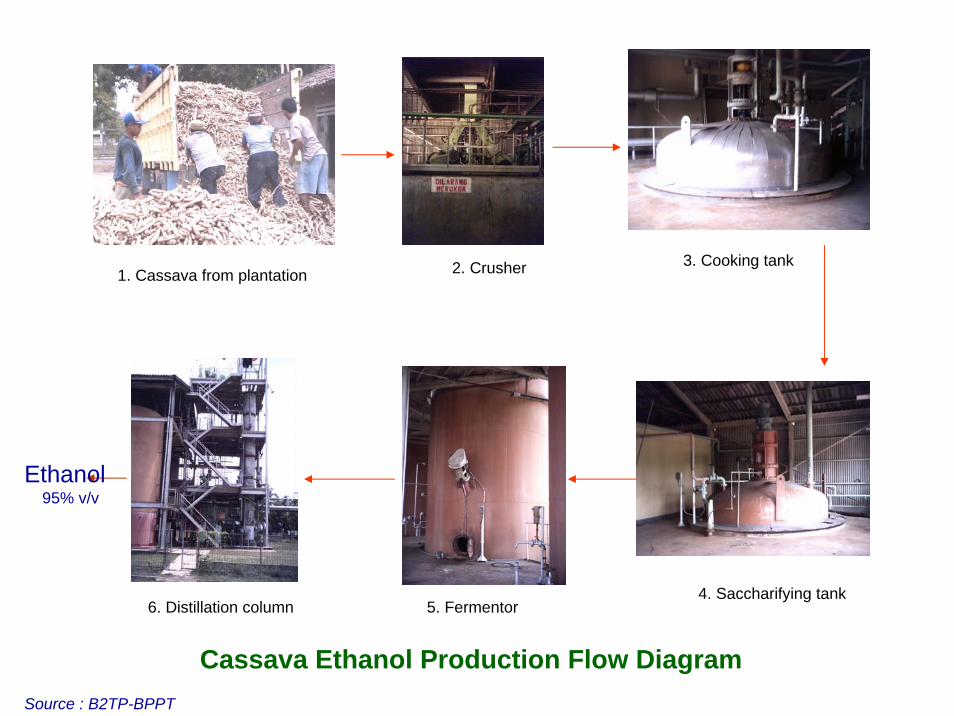
1. Cassava from plantation 2. Crusher 3. Cooking tank
4. Saccharifying tank5. Fermentor6. Distillation column
Cassava Ethanol Production Flow Diagram
Ethanol95% v/v
Source : B2TP-BPPT

Total SugarBroth volume (liter)
Start Finish
102.367 14.39 1.81 9.0 97.12 5.27
101.990 14.82 0.40 9.4 98.50 5.20
100.196 14.91 1.80 9.2 92.80 5.34
106.181 15.84 0.50 8.9 87.25 5.87
99.930 13.87 0.30 7.7 86.00 5.42
99.462 11.80 1.40 7.1 93.00 5.26
98.311 13.75 0.40 8.6 97.00 5.27
98.169 14.46 1.20 9.2 98.79
Average
5.19
5.35
Ethanol(%)
Ferm.Ratio(%)
Ratio of Cassava/Ethanol
Source : B2TP-BPPT
R&D of Bioethanol from CassavaCassava Fermentation Using Pilot Plant of 8 KL/Day
BPPT’s 8 kL/day Ethanol Pilot Plant at Lampung, Established in 1983

Engine Performance & Emission Testing using Chassis Dynamometer
Ambient & SampleGas Collection Bags
Raw Bench
DynoControl
AmbientAir Filters
CVS Sampler
TurbineExhauster Unit
Autotest Environmental &Auxiliary Input
Tailpipe Sample
DiluteSample
Driver Aid
FanCVS Control Unit
Light Duty GasolineShort ModalTypical System Schematic
Engine standard test : 80/1269 EECEmission standard test : UN-ECE 83-04 Source : B2TP-BPPT

Automotive Engine Performance and Emission testing by a Chassis Dynamometer at BTMP-BPPT.
Source : B2TP-BPPT
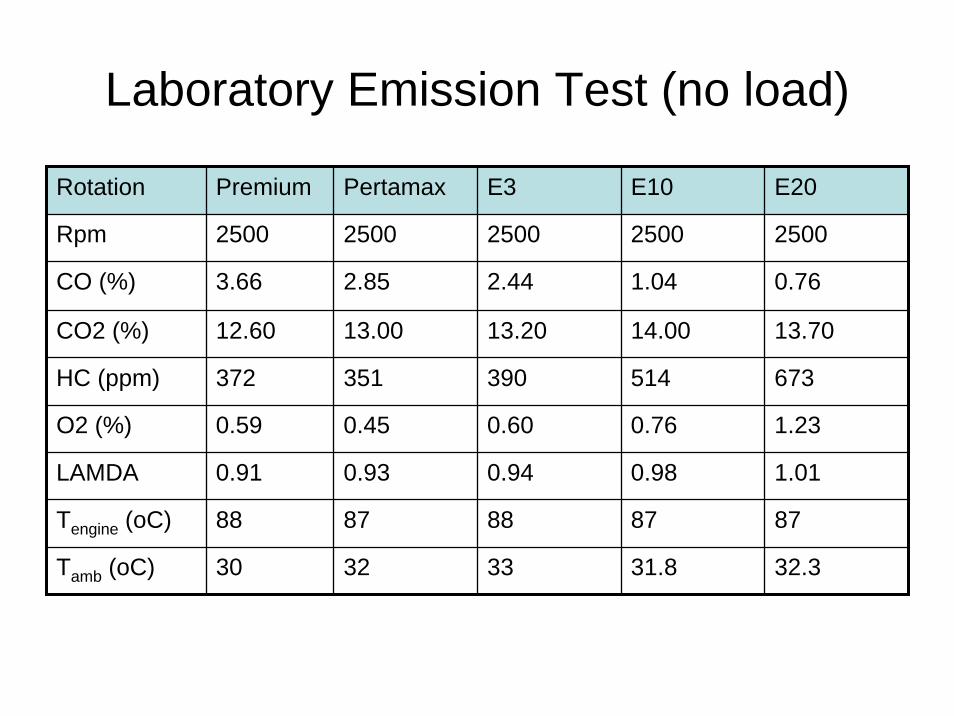
Laboratory Emission Test (no load)
Rotation Premium Pertamax E3 E10 E20
Rpm 2500 2500 2500 2500 2500
CO (%) 3.66 2.85 2.44 1.04 0.76
CO2 (%) 12.60 13.00 13.20 14.00 13.70
HC (ppm) 372 351 390 514 673
O2 (%) 0.59 0.45 0.60 0.76 1.23
LAMDA 0.91 0.93 0.94 0.98 1.01
Tengine (oC) 88 87 88 87 87
Tamb (oC) 30 32 33 31.8 32.3
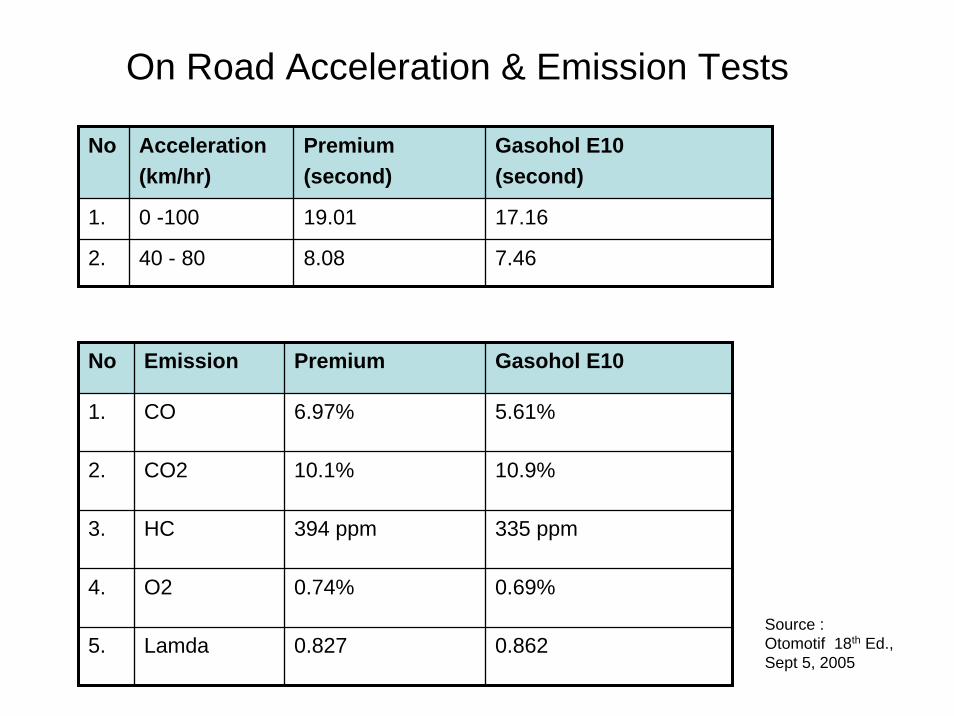
On Road Acceleration & Emission Tests
No Acceleration(km/hr)
Premium(second)
Gasohol E10 (second)
1. 0 -100 19.01 17.16
2. 40 - 80 8.08 7.46
No Emission Premium Gasohol E10
1. CO 6.97% 5.61%
2. CO2 10.1% 10.9%
3. HC 394 ppm 335 ppm
4. O2 0.74% 0.69%
5. Lamda 0.827 0.862Source :Otomotif 18th Ed.,Sept 5, 2005
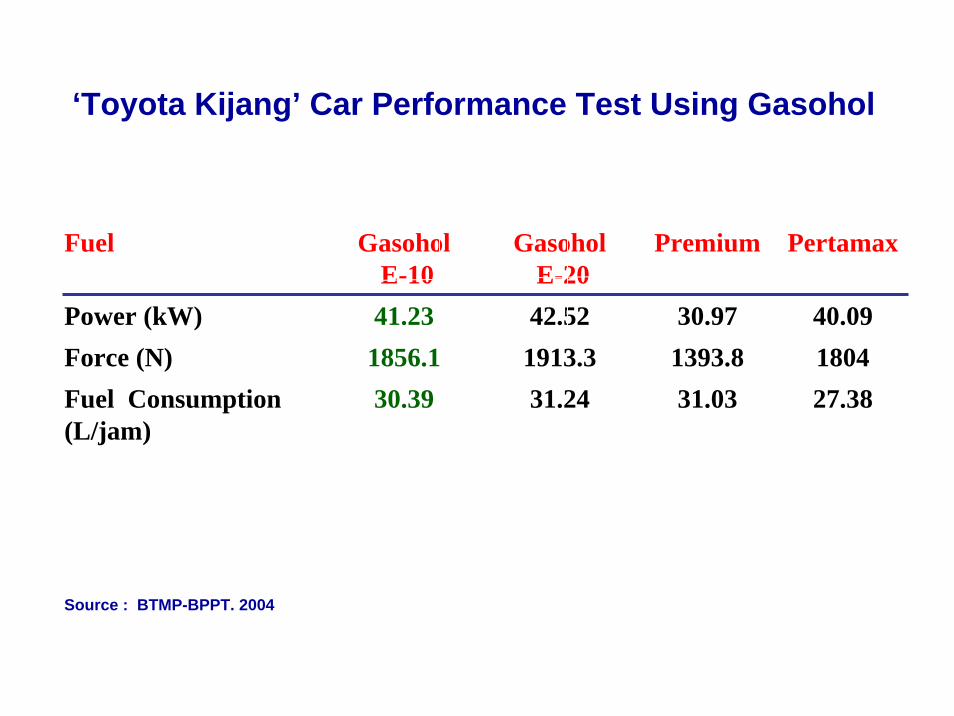
Fuel GasoholE-10
GasoholE-20
Premium Pertamax
Power (kW) 41.23 42.52 30.97 40.09Force (N) 1856.1 1913.3 1393.8 1804Fuel Consumption (L/jam)
30.39 31.24 31.03 27.38
‘Toyota Kijang’ Car Performance Test Using Gasohol
Source : BTMP-BPPT. 2004
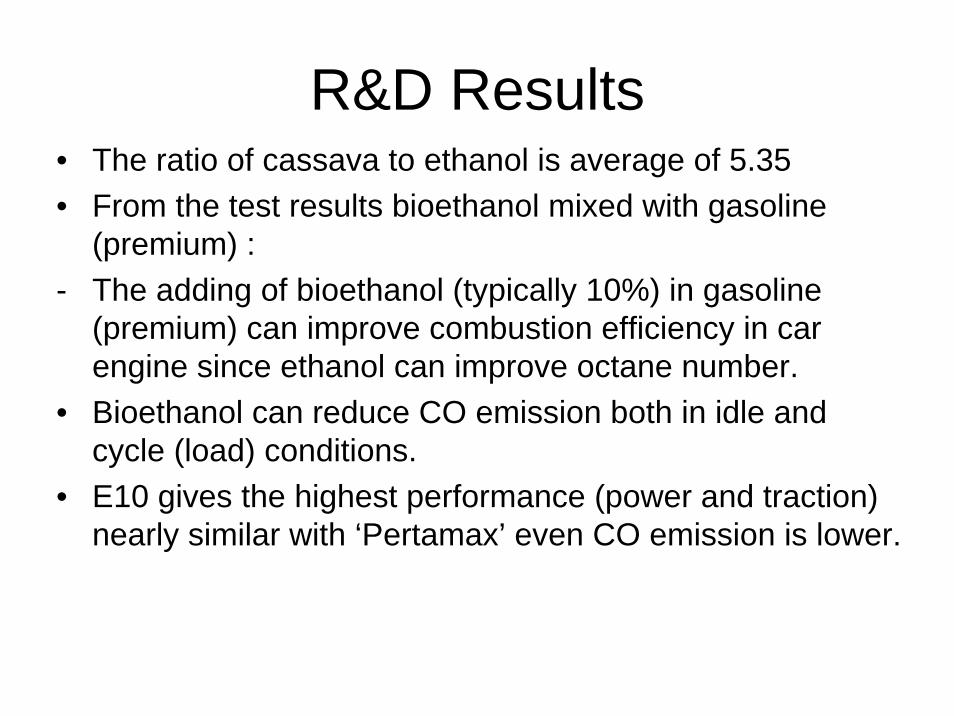
R&D Results• The ratio of cassava to ethanol is average of 5.35• From the test results bioethanol mixed with gasoline
(premium) :- The adding of bioethanol (typically 10%) in gasoline
(premium) can improve combustion efficiency in car engine since ethanol can improve octane number.
• Bioethanol can reduce CO emission both in idle and cycle (load) conditions.
• E10 gives the highest performance (power and traction) nearly similar with ‘Pertamax’ even CO emission is lower.

Conclusions• Indonesia has a big potential in utilizing biomass as biofuel feedstock to
produce bioethanol, such as sugarcane (molasses), cassava, sweet potato, corn, etc. At current status, the annual total production of bioethanol is about 200,000 kL from more than 10 major companies whereas the demand is 1.7 million kL per year. With the current price of bioethanol of Rp. 5,300 (US$ 0.58) per liter, the mass utilization of these feedstock to produce bioethanol is anticipated in the near future.
• The government plans to produce enough biofuel by 2010 to replace 10% of the country’s total oil-based fuel consumption which reached 70 million kiloliter last year. Regarding to this, Government has issued policies & regulations on the supply & utilization of biofuel as alternative fuel and providing incentive and tariff.
• Government has to establish a commercialization scheme for bioethanolutilization in order to integrate with an existing fossil fuel commercialization and also creating a simple testing system and standard procedure for bioethanol.
• Starch Technology Center (B2TP), BPPT has initiated R&D of 8 kL per day ethanol pilot plant using cassave in Lampung since 1983. It is expected more private & government owned companies can utilize BPPT’sexperiences to develop their commercial plants in Indonesia in the near future.
For more information
PT GIKOKO KOGYO INDONESIAPulo Gadung Industrial EstateJl. Pulo Kambing Kav II I/9Jakarta 13930Tel: 62 460 9380Fax: 62 21 21 460 1970web site: www.gikoko.co.id
STARCH TECHNOLOGY CENTER (B2TP)- BPPTBPPT Building II, 16th fl.Jl. M.H. Thamrin 8, JakartaTel. 021 3169598