(19) united states (12) patent application publication (10 ... · a top view bop view cop view s...
TRANSCRIPT

(19) United States (12) Patent Application Publication (10) Pub. No.: US 2015/0285794 A1
US 2015028,5794A1
Maerk et al. (43) Pub. Date: Oct. 8, 2015
(54) HIGH-THROUGHPUT NANOIMMUNOASSAY Publication Classification CHIP
(51) Int. Cl. (71) Applicant: ECOLE POLYTECHNIQUE GOIN33/543 (2006.01)
FEDERALE DE LAUSANNE (EPFL), (52) U.S. Cl. Lausanne (CH) CPC ................................ G0IN33/54386 (2013.01)
(72) Inventors: Sebastian Maerkl, Basel (CH); Jose Luis Garcia-Cordero, San Pedro Garcia Garcia (MX) (57) ABSTRACT
(21) Appl. No.: 14/436,168 The nanoimmunoassay chip comprises at least flow and con 1-1. trol layers, divided into several rows, each row containing a
(22) PCT Filed: Sep. 5, 2013 plurality of single assay units, each assay unit contains two spotting chambers (1) and an assay chamber in the middle,
(86). PCT No.: PCT/B2O13A058312 wherein neck valves (2) separate the spotting chambers from S371 (c)(1), the assay chamber during Surface derivatization, said assay (2) Date: Apr. 16, 2015 units being isolated from one another during incubation by
O O isolation valves (3), wherein relief valves (4) help release Related U.S. Application Data built-up pressure into a microfluidic channel (5) after incu
(60) Provisional application No. 61/715,961, filed on Oct. bation and wherein round valves in the assay chamber define 19, 2012. and protect the circular immunoassay regions (6).

Patent Application Publication Oct. 8, 2015 Sheet 1 of 14 US 2015/0285794 A1
Passivatii ayes efects & 8ieustavidir & Bioti: 388:88
:- - - - Y-Yre Capture Artigens & Fluorophore antic dises
SReagers
Sri :3thaic sp3tirig
. Pays chip aligners
^& 334-ye: giate aggxy-gass side
Figure 1

Patent Application Publication Oct. 8, 2015 Sheet 2 of 14 US 2015/0285794 A1
- t k
0. l 10 00 000 OOOC 1 3 5
Dextran tracer (pM) Spotting Factor
Figure 2
8
8. S 3 s f r
9.4 5 sooo
.
&
-5:
:
3.
: Y 233.
8.
33 (E4)
Figure 3
Patent Application Publication Oct. 8, 2015 Sheet 3 of 14 US 2015/0285794 A1
2.3 S.
: & 3. 4. 2 3.
£:SA 18 log (e. ESA'NFaiogi Rt.)
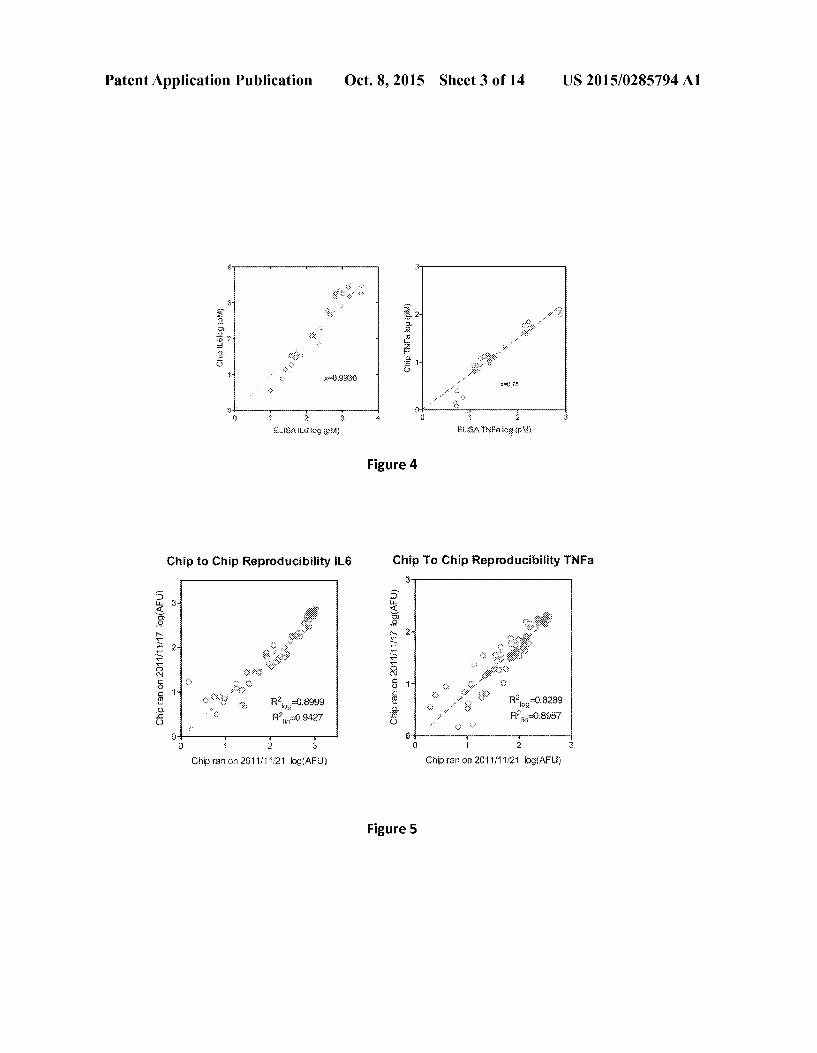
Figure 4
Chip to Chip Reproducibility L6 Chip to Chip Reproducibility TNFa 3.
R S s s &
N. 2
& s s S c s
s S2. .S. - c & .
t 2 r
Chip fast of 281 ft 1.21 kg(AF) Chiara on 2011:11:2 logiAFU)
Figure 5

Patent Application Publication Oct. 8, 2015 Sheet 4 of 14 US 2015/0285794 A1
Detection TNFO in human Serum
11 OO 45 O
t Sy N - e.
S S S S S S S S S S TNFol (pM)
Figure 6

Patent Application Publication Oct. 8, 2015 Sheet 5 of 14 US 2015/0285794 A1
Detection of HSP70 in human Serum
400
300
2OO
1 O O
N N Q N S S S S S S NS
HSP70 (nM)
Figure 7

Patent Application Publication Oct. 8, 2015 Sheet 6 of 14 US 2015/0285794 A1
2 FOWLAYER b CONTROLAYER
low-resistance channel
2x Relief W Capacitors Keiie
Spotting. Pressure *:::::“S valve chamber relief chare &
Necka. Š Šs Assay . valve & 4X charter Support Sarodwich c Rond
pillars waves valves Neck - s:$s.
Spotting ... wave chamber Pessare 2x S Š
relief chanie Capacitors ......SSS...S.
- Low-fesistance chanie
oss-sector Wiley Spotting S.ŠSSS
PDS chamber DS Š s S.
C SPONG d AYERE ASSEMBLY e
& &
&
&
Spotted sample
SSS Su s
Figure 8
SNN

Patent Application Publication Oct. 8, 2015 Sheet 7 of 14 US 2015/0285794 A1
S&
Cross-section View
Figure 9

Patent Application Publication Oct. 8, 2015 Sheet 8 of 14 US 2015/0285794 A1
acME box. COME deME
SS S.S. SNS S
Figure 10

Patent Application Publication Oct. 8, 2015 Sheet 9 of 14 US 2015/0285794 A1
:::::::::::::::::::::::::8
Figure 11

Patent Application Publication Oct. 8, 2015 Sheet 10 of 14 US 2015/0285794 A1
arewbacceX devel
SSSSSX& &
Š S SS
s & s &
Š SS SS SS
Figure 12

Patent Application Publication Oct. 8, 2015 Sheet 11 of 14 US 2015/0285794 A1
a top View bop view Cop view
S
& Y XXXXXXXXXXXX
s
Figure 13

Patent Application Publication Oct. 8, 2015 Sheet 12 of 14 US 2015/0285794 A1
SSSSSSSSSSSSSSSSSSSSSSSSSS
www.ww. S$ SSS SSSSSSSSSSSSSSSSSSSSSSSSSSSSSSSSS S.Š SS
r SS SS SSSSSSSSSSSSSSSSSSSSSSSSSSSSSSSSSSSSSSSSSSSSSSSSSS SR SSSSS SSS y S s
S
S. S S
S&SSSSSSSSSSSSSSSSSSS S.
5mn SSSSSSS SS ssassssssssssssssssssssssssssssssssssssssssssssssssssssssssssssssss
S.
8
SSS SSSSS SSS Sssssssssssssssssssssssssssssssssssssssssssssssssssssssssssssssssssssssssssssssssssssssssssssssssssssssssssssssssssssssssssss Š
w w SS S S &s S s S XXXXXXXXXXXX XXXXXXXXXX xxxxxxx xxx XXXXXXXXXXXX xxxx S SSS www.xxxxw &YSN XWXXXXXXXXX Nymy
S S S S ŠS S& XXXXXXXXX xxxs S & S S Š S S s:Sass S S S
Š SS
S Š S SSSSSSSSSSSSSSSSSSSSSSSSSSSSSSSSSSSSSSSSSSSSSSSSSSSSSSSSSSSSSSSSSSSSSSSSSSSSSSSSSSSSSSSSSSSSSSSSSSSSSSSSSSSSS SSSSSSSSSSSSSSSSSSSSSSSSSSSSSSSSSSSSSSSSSSSSSSSSSSSSSSSSSSSSSSSSSSSSSSSSSSSSSSSSSSSSSSSSSSSSSSSSSS Saraxraxxarxxxxxxxxxxxxxxxxxxxxxx S$
S
Xy w
S. S-ar-WW-as- -----------------------------------. S SS SSSSSSSSS SSSSSSSSS SSSSSSSS SSSSSSSSSS SSSSSSSS SSSSSSSSSSSSSS S. S. S S YS SSS
www.xxx SXSXxxxxxxxx Saxxxxxxx XXXXXXXXX
S S. S. Xxxxxxxxxxx
w Exxxxxxxxxxx SSSSXXXXX
SXSXxxxxxx XXXXXXXXXX
www.xxxxxxx XXXXXXXXXX
Sw S. S
S S S S
NS SSSSSSSSSSSSSSSSSSSSSSSSSSSSSSSSSSSSSSSSSSSSSSSSSSSSSSSSSSSSSSSSSSSSSSSSSSSSSSSSSSSSSSSSSSSSSSSSSSSSSSSSSSSSSSSSSSSSSSSSSSSSSSSSSSSSSSSSSSSSSSSSSSSSSSSSSSSSSSSSS aaaaaaaaaaaaaaaaaaaaaaaaaaaaaaaaaaaaaaaaaaaaaaaaaaaaaaaaaaaaaaaaaaaaaaaaaaaaaaaaaaaaaaaaaaaaaaaaaaaaaaaaaaaaaaaaaaaaaaaaaaS SSSSSSSSSSSSSSSSSSSS SSSSSSSSSSSSSSSSSSSSSSSSSSSSSSSSSSSSSSSSSSSSSSSSSSSSSSSSSSSSSSSSSSSSSSSSSSSSSSSSSSSSSSSSSSSSSSSSSSSSSS Y S S.
0.5mm S SS SS S S S SS
Figure 14
Patent Application Publication Oct. 8, 2015 Sheet 13 of 14 US 2015/0285794 A1
SS SSS
sawsaw's xxxx
5m ryyyyyyyyyyyyy
N Sy S S SS S. SS N.
SS & & S SS SS \ X Š
S &S S S O SS SS S SS NS SS & sy SSSSSSSSSSSS Sssssssssssssss:SSSSSSSSSS
SSSSSSSSSSSSS S. S
SS XXXXXXXXXXX SS Š
SS SS S. S.
SSS SS S
SS SS Rs.
SS AXXXXXXXY
SS SS S
XXXXXXXXXXX Swxxxxxxx
& XXXXXXXXXX. xxxxxx
XXXXXXXXXXX SXXXXXXXXXX
XXXXXXXXXXX &xxxxxxxx
SS Swxxxxxxx
SY SSSSSSS S. S S S s Š & S $ Š
S S. S
NS S Š Sssssssssss SSS ŠSSSSS SSSSSSSSSSSSSSSSSSSSSSSSSSSSSSSSSSSSSSSSSSSSSSSSSSSSSSSSSSSSSSSSSSSSSSSSSSSSSSSSSSSSSSSSSSSSSSSSSSSSSSSSSSSSSSSSSSSSSSSSSSSSS x
SWS S S S & Š S. SS w
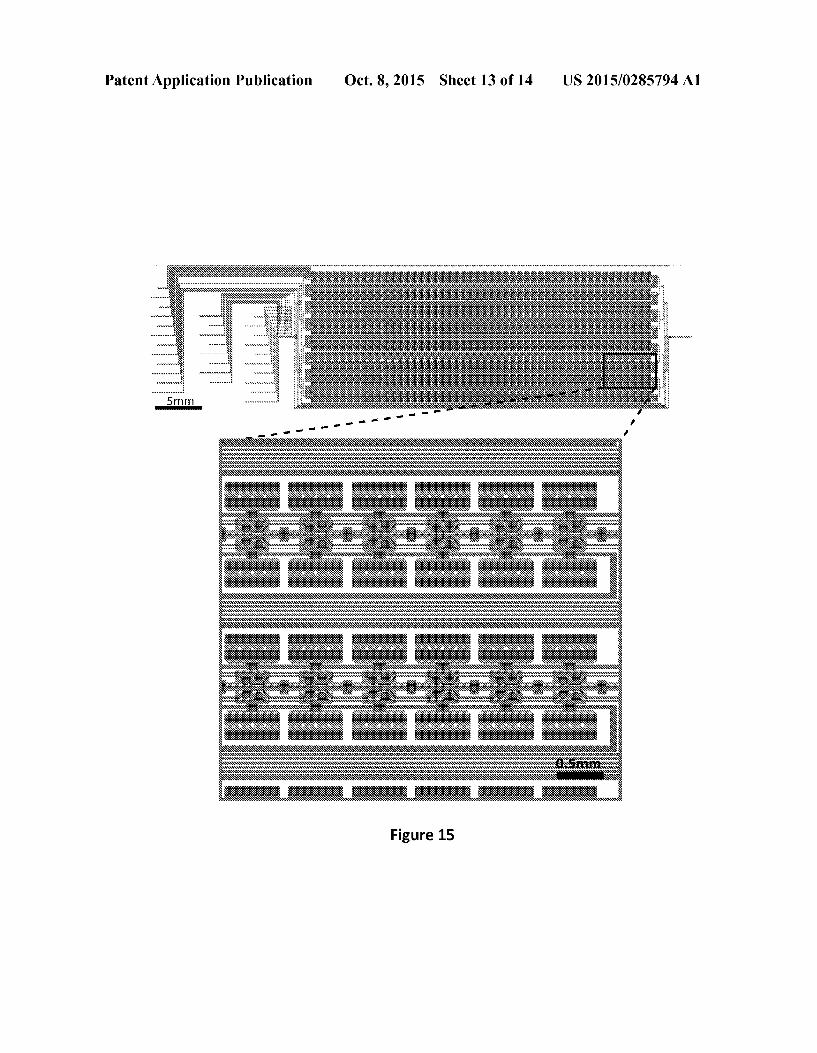
Figure 15


US 2015/0285794 A1
HIGH-THROUGHPUT NANOMMUNOASSAY CHIP
FIELD OF THE INVENTION
0001. The present invention concerns a multiplexed high throughput nanoimmunoassay microfluidic device capable to quantify four biomarkers in 384 5-nL biological samples for a total of 1,536 assays. 0002 The sample throughput of the chip according to the invention is 30 times higher than recent integrated microflu idic systems (Heath et al. Nat Biotech, 2008, and Huang et al. Lab Chip, 2012), with an order of magnitude higher assay throughput. This ultra high-throughput translates into a 1,000 fold reduction in reagent costs and a significant reduction in personnel cost per sample leading to a highly competitive diagnostic tool as compared to standard ELISA and/or mul tiplexed ELISA. The limit of detection is 100 fM, a similar performance as ELISA, but does so by detecting as little as 600 antigen molecules in 5-nL Volume samples (~1 Zepto mole), 20-fold lower than current state-of-the-art techniques (Duffy et al, Nat Biotech, 2010). 0003. The chip according to the invention is compatible with a number of complex biological matrices/samples including, but not limited to, blood serum, cell culture medium, and bronchoalveolar lavage (BAL). In one applica tion, our nanoimmunoassay chip enabled a large-scale screening study by reducing the cost of reagents for the experiment from 20,000 Euros down to 15 Euros, and by automating and streamlining the entire process. 0004 More generally, the nanoimmunoassay chip accord ing to the invention will have a significant impact on the healthcare sector by drastically reducing the cost of diagnos tic assays. In fact, in the near future it will be possible to routinely and periodically screen Small blood samples from healthy individuals for large panels of disease indicators. With technologies Such as the nanoimmunoassay chip described here, the cost of such preventative screens will be minimal, and be far outweighed by the benefits and cost reductions associated with early diagnosis of disease. Addi tionally, low-cost diagnostics will give rise to personalized diagnostics. In personalized diagnostics many hundreds of biomarkers are expected to be measured in short intervals (a few times a year) per individual. This wealth of data will generate a personalized base-line indicative of health, and allow the identification of departures from normalcy.
BACKGROUND OF THE INVENTION AND PRIOR ART
0005 While the most recent commercial technologies have drastically increased biomarker throughput, these novel immunoassays bear similar drawbacks as their classic coun terpart, the enzyme-linked immunosorbent assay (ELISA), Such as requirement of large sample Volumes, long process and hands-on times, poor automation, and high costs. The integration of microfluidics with micro?nano-scale biosen sors has been touted for over 15 years as a solution to these technical challenges, not only by reducing sample Volume and reagents consumption, but also by decreasing limits of detection (LOD), offering multiplexing, automation, and sys tems integration, while keeping the overall system simple in design and low in cost" . However, the most sensitive bio sensors, based on beads, require large sample Volumes not Suitable for miniaturization; moreover, complex fabrication,
Oct. 8, 2015
Surface bio-functionalization issues, and desalting steps in nanowire and MEMS biosensors render the integration of microfluidic devices with the above mentioned characteris tics challenging and costly. Here, we describe an integrated and automated multiplexed nanoimmunoassay chip, which combines advantages of microfluidics and microarray tech nologies, delivers performances similar to ELISA, and at the same time drastically reduces sample and reagent volume consumption and cost 1000-fold, while drastically increasing sample throughput.
DETAILED DESCRIPTION OF THE INVENTION
0006. The present invention will be better understood from the following detailed description and from appended drawings which show: 0007 FIGS. 1a to 1c illustrate the principle of the chip of the invention; 0008 FIG. 1d illustrates an embodiment of an immunoas Say; 0009 FIG.1e illustrates the principle of a method accord ing to the present invention; 0010 FIG. 2 illustrates immunoassay performance char acterization using a fluorescent tracer, 0011 FIG. 3 illustrates a comparison of calibration curves for TNFO, IL-6, IL-12, and IL-23 obtained with the nanoim munoassay chip of the invention and a typical ELISA; 0012 FIG. 4 illustrates a comparison of blind tests run with the nanoimmunoassay chip and an ELISA; (0013 FIG. 5 illustrates chip to chip reproducibility over time. 0014 FIG. 6 illustrates detection of biomarker TNFO in human serum. 0015 FIG. 7 illustrates detection of biomarker HSP70 in human serum. 0016 FIG. 8 illustrates a single assay unit; 0017 FIG. 9 illustrates a passivation step: 0018 FIG. 10 illustrate an antibody immobilization step: (0019 FIG. 11 illustrates an Incubation step: 0020 FIG. 12 illustrates a washing step; 0021 FIG. 13 illustrates a washing step. 0022 FIG. 14 illustrates an alternative microfluidic device design. 0023 FIG. 15 illustrates an alternative microfluidic device design. 0024 FIG. 16 illustrates a microfluidic device design with 1024 chambers. 0025. The nanoimmunoassay chip according to the inven tion is capable of analyzing 4 biomarkers in parallel from 384 biological samples using nanoliter Volume samples, for a total of 1,536 measurements per chip. 0026. The platform is based on a polydimethylsiloxane (PDMS) microfluidic chip of 384 assay units (FIGS. 1a, b). Each assay unit contains two 1.7-nL spotting chambers that encapsulate the same sample (FIG. 1c). Assay units are iso lated from one another during incubation steps with isolation valves to eliminate cross-contaminations. A 1-nL reaction chamber, which lies between the spotting chambers, contains four circular immunoassay regions of 60-um diameter cre ated in situ by rounded valves using a mechanism developed by Maerklet al. Any biotinylated capture antibody can be immobilized in these regions, allowing for the parallel detec tion of four biomarkers of choice (FIG. 1d). Samples to ana lyze are automatically picked from a 384-microtiter plate with a microarray robot, and precisely spotted on an epoxy

US 2015/0285794 A1
functionalized microscope glass slide using a 5-nL delivery volume spot pin (FIG. 1e). The PDMS chip is then directly aligned on top of the spotted slide and bonded. After deriva tization of the chip surface, and immobilization of the bioti nylated capture antibodies in the reaction chambers, the rehy drated spotted sample is allowed to diffuse and react with the capture antibodies. Detection occurs after flowing a fluores cently-labeled secondary antibody. 0027. For a more detailed description of the fabrication and operation of the device see Device Fabrication and Operation sections below. 0028 Specifically, FIG. 1 illustrates a nanoimmunoassay chip workflow. 0029 FIG. 1(a) The microfluidic device comprises flow (blue) and control (red) layers, divided into eight rows 0030 FIG. 1(b) each row containing 48 single assay units for a total of 384 units. 0031 FIG. 1 (c) Each assay unit contains two spotting chambers (1) and an assay chamber in the middle. Neck valves (2) separate the spotting chambers from the assay chamber during Surface derivatization. Assay units are iso lated from one another during incubation by isolation valves (3). Relief valves (4) help release built-up pressure into a microfluidic channel (5) after incubation. Four round valves in the assay chamber define and protect the circular immu noassay regions (6). 0032 FIG. 1(d) A sandwich immunoassay is performed under each round valve with a combination of biotinylated and fluorophore-labelled antibodies. 0033 FIG. 1(e) Biological solutions kept in a microtiter well-plate are automatically spotted onto an epoxy-coated glass slide using a microarray robot. Dried spots have a diam eter of ~350 lum. A microfluidic chip made by multilayer soft-lithography is aligned on top of the spotted slide. Differ ent reagents are loaded into plastic tubing and connected to the chip. A fluorescent Scanner reads the fluorescent intensity of the immunoassay regions. 0034. In contrast to a 96-well plate ELISA that requires coating of each well with 50-400 ng of antibody, each assay unit on-chip according to the present invention requires 20-160 pg. This corresponds to a decrease in the amount of antibody needed of more than three orders of magnitude for similar number of assays (see Table 1). Overall, the nanoim munoassay chip according to the invention reduces cost and sample volumes by at least a factor of 1,000 while offering complete integration and automation with minimum user intervention (see Table 1).
TABLE 1.
Comparison of nanoimmunoassay chip and a 96-well plate ELISA per single assay unit
Nanoimmunoassay chip ELISA
Effective assay volume 5 mL. 100 L Sample volume 10 mL. 100 L Capture antibody amount 20-160 pg 50-400 ng Detection antibody amount 20-160 pg 50-400 ng Standard protein volume 10 mL. 100 L Enzymatic amplification step No Yes Multiplexing 4 1 LOD (TNFC., IL6) 100 fM 100 fM Hands-on time 10 min 100 min Automation Microfluidics Robot Pipetting steps 1 30
Oct. 8, 2015
TABLE 1-continued
Comparison of nanoimmunoassay chip and a 96-well plate ELISA per single assay unit
Nanoimmunoassay chip ELISA
Type of samples Various (culture media, serum, BAL) Total reagent consumption volume 0.5 L 7700 L Total cost of reagents --S0.005-0.020 --S5-20
0035. The performance of the chip is assessed by quanti fying the amount of protein effectively diffusing from the spotting chambers into the reaction chambers. We spiked different concentrations of a fluorescent tracer (Alexa647 labeled Dextran, 10 KDa) in undiluted serum and spotted the solutions onto the chip. The same solutions were flowed into the chip and fluorescent intensity values were compared to the spotted values. We observed a 100% recovery of the tracer into the reaction chambers (FIG.2a); moreover we found that multi-spotting allows for up to three-fold higher sample con centration (FIG.2b). 0036 More specifically, FIG. 2 illustrates Immunoassay performance characterization using a fluorescent tracer. Dif ferent concentrations of a fluorescent tracer (Alexa647-la beled Dextran 10 KDa) were diluted in serum and spotted onto the chip. The same solutions were flowed onto the chip and fluorescent intensity values were compared to the spotted values. A 100% reconstitution of the tracer into the reaction chambers was observed (FIG. 2a). As up to 93% of blood serum consist of water, we reasoned that spotting multiples times with intermittent pauses to allow evaporation, could lead to sample concentration and thus increase the amount of protein spotted. Multi-spotting allows for up to three fold sample concentration and thus three times higher protein concentrations can be gained by multi-spotting five times onto the same position (FIG.2b). Higher multi-spotting num bers are limited by the size of the microfluidic assay units, nevertheless this technique demonstrates to be a simple alter native to other microfluidic pre-concentration methods. 0037. As a second step, the sensitivity of our platform was determined by running calibration curves for the cytokines IL-6, TNFO, IL-12p70, IL-23 in cell culture medium; LOD and dynamic range were comparable to ones obtained with ELISA (FIG. 3). Notably, for the lowest concentration detected, 100 fM, the platform of the invention is able to readily detect 830 molecules (~50 Zeptomoles) using the same antibody combinations used in commercially available kits. Thus, the present microfluidic approach for biomarker detection compares favorably with other biosensors in terms of sensitivity but Surpasses them in terms of simplicity and throughput. 0038 FIG. 3 illustrates a comparison of calibration curves for TNFO, IL-6, IL-12, and IL-23 obtained with the nanoim munoassay chip of the invention and a typical ELISA. Cali bration curves for cytokines IL-6, TNFC., IL-12p70, IL-23 in cell culture media were spotted and found to be similar to ones obtained with a standard ELISA. 0039. To further compare the chip to standard ELISA methods, we determined the concentration of IL-6 and TNFC. in stimulated cell culture samples known to express both cytokines at a wide concentration range. Samples were ana lyzed on-chip in triplicates, including 8 known protein dilu tions for the calibration curves of each cytokine, as well as 10 blank controls, for a total of 234 spotted and 428 data points.

US 2015/0285794 A1
A log correlation of 0.96 and 0.75 was found for IL-6 and TNFO, respectively, (FIG. 4), demonstrating that the nanoim munoassay chip according to the invention is as accurate as an ELISA. To evaluate the stability, reproducibility, and robust ness of our platform over time, a chip spotted on the same day was run five days later and similar correlations were found (FIG. 5). 0040 FIG. 5 illustrates Chip to chip reproducibility over time. The chip used to determined the concentration of unknown cell culture samples was run five days later and log correlations of 0.89 and 0.82 for IL-6 and TNFO, respectively, were observed.
0041 FIG. 6 illustrates detection of biomarker TNFO. spiked in human serum at different concentrations. The limit of detection is 570 fM (defined as 3 times the standard devia tion of the control signal). 0042 FIG. 7 illustrates detection of biomarker HSP70 spiked in human serum at different concentrations. The limit of detection is 10 pM (or 800 pg/mL), which compares favor ably with commercial ELISA kits that have a limit of detec tion of 780 pg/mL (HSP70 ELISA Kit, ADI-EKS-700B, Enzo Life Sciences).
Device Fabrication
2.a. Chip Fabrication 0043. The microfluidic device comprises two layers. Molds for each layer were fabricated using standard lithog raphy techniques on 4" silicon wafers. Briefly, photolithog raphy masks were laid out in Clewin (WieWeb, Netherlands) and photo-plotted on a chromium Substrate pre-coated with AZ1518 (Nanofilm, CA) using a laser pattern generator (DWL2000, Heidelberg Instruments, Germany). The control and flow layer molds were patterned with SU8 phothoresist (GM1060, Gersteltec, Switzerland) to a height of ~30 um, and with AZ9260 photoresist (Microchemicals, Germany) to a height of ~10 um, respectively, according to manufacturer instructions. The flow layer mold was baked for 2 hours at 180° C. to reflow the photoresist and obtain rounded struc tures. Molds were treated in a vapor bath of trymethylchlo rosilane (TMCS, Sigma-Aldrich, USA) for 30 min before using them. 0044 Devices were cast in polydimethylsiloxane (Sylgard 184, Dow Corning, USA) employing different ratios of cur ing agent. The control layer was cast thick (~5 mm) using a ratio of 1:5 and degassed for 10 min in a vacuum desiccator. PDMS, at a ratio of 1:20, was spun on the flow layer mold at 2100 rpm in a spin coater (P6700, Specialty Coating Systems, USA) to obtain a thin layer (-30 um). Both molds were baked at 80° C. for 30 min in a convection oven. Next, the PDMS control layer replicas were peeled-off from the mold and holes for control ports punched using a manual hole-puncher. The control replicas were manually aligned on top of the flow layer and baked at 80°C. for 1.5 hours. Aligned replicas were cut and peeled-off from the mold. Finally, holes for flow inlet ports were manually punched. 0045 Microfluidic flow and control pressure regulation was achieved using a custom built pneumatic setup. Pressure for flow lines was set to 3 psi using an analog pressure gauge. Microfluidic control lines were grouped in two sets, one set for the microfluidic rounded valves and the other set for the rest of the control lines. Each set was connected to two dif ferent pressure gauges through a 3-way Solenoid valves
Oct. 8, 2015
(Pneumadyne Inc). Solenoid valves were controlled from a PC by means of a graphical using interface programed in LabView.
2.b Preparation of Epoxy-Silane Glass Slides 0046. This protocol for coating glass slides, adapted from Nam et al", produces a homogenous, dense monolayer of epoxy-silane groups on the Surface of the glass, where epoxy groups are preferentially exposed on the Surface of the mono layer. Glass slides were functionalized as follows. A solution of 720 mL of milli-Q water and ammonia solution (NH-OH 25%, 1133.2500, VWR) in a 5:1 ratio, respectively, was heated to 80° C. Next, 150 mL of hydrogen peroxide (HO 30%,99265, ReactoLab, Switzerland) were added to the mix and cut-edge glass microscope slides (631-1550, VWR) bathed in the solution for 30 min. Glass slides were then rinsed with milli-Q water and blow-dried. 0047 A solution of 1% 3-Glycidoxypropyl-trimethoxym ethylsilane (97% pure, 216545000, Acros Organics) in tolu ene was prepared and the glass slides incubated in it for 20 min. Glass slides were then rinsed with toluene and blow dried, followed by a baking step for 30 min at 120° C. The glass slides were sonicated in toluene for 20 min, rinsed with isopropanol, and N blow-dried. Finally, glass slides were vacuum-stored at room temperature.
2.c Automatic Sample Microarraying 0048 Biological samples were pipetted into a 384-well microtiter plate (No. 264573, Thermo Fisher Scientific, USA). Samples were spotted in triplicate onto epoxy-silane coated glass slides using a microarray robot (QArray2, Genetix, UK) with a 4.9 nL delivery-volume spot pin (946MP8XB, Arrayit, USA). It is possible to spot up to 48 samples in parallel with a similar number of pins. A glass slide can contain a maximum of 768 spots (2 spots per assay). Samples were randomly spotted on glass slides; up to three slides were spotted on one round. 0049. The humidity of the microarray robot chamber was set to 60%. We found that 60% humidity gave us the most consistent features in terms of spot diameter (-300 um). This humidity percentage also prevented the sample channel of the spotting pin to dry and therefore get clogged. For Viscous samples, such as serum, we found that using the Touch Off feature on the robot reduced blotting remove excess sample from the pin tip. A 2-step Touch Off with a 500 msec pause after dipping was found Sufficient. A stringent wash between spotting different samples was necessary to prevent any carry-over from sample to sample. The table 2 below shows the sequence of Washing steps we found were adequate to avoid cross-contamination.
TABLE 2
Liquid Wash time (sec) Dry time (sec)
De-ionized water De-ionized water PBS.O.05% Tween 20 De-ionized water PBS.O.05% Tween 20 De-ionized water
0050 Spotted slides were stored in the dark for at least two hours in an incubator at 40°C. before manual alignment of the PDMS device. For high-humidity environments, this step

US 2015/0285794 A1
allowed for most of the water to evaporate from the sample and thus facilitate device alignment. The assembled device was incubated overnight in the dark at 40°C.
2.d Antibodies and Recombinant Cytokines 0051 Mouse antibodies and standard proteins used, all purchased from eBioScience (San Diego, USA), are Summa rized in the table below. Purified primary antibodies for IL-23p 19 and IL-12p35 were purchased, and subsequently biotinylated using a biotinylation kit (EZ-Link Micro Sulfo NHS-Biotinylation Kit, Thermo Fisher Scientific, Rockford, USA) according to the manufacturer instructions. All mouse secondary antibodies were conjugated with phycoerythrin (PE). We used a common secondary antibody for the detec tion of IL-12 and IL-23 that reacts with the p40 subunit of both antibodies.
TABLE 3
Mouse Capture antibody Detection antibody recombinant protein (Biotin) (PE)
IL-6 39-8061-60 36-7O62-85 12-7O61-41 TNF-alpha 39-8321-60 13-7341-81 12-7423-41 IL-23 39-8231-60 16-7232-85 12-7123-41 IL-12 p70 39-8121-60 14-7122-85 12-7123-41
3. Device Operation 0052. The platform is based on a polydimethylsiloxane (PDMS) microfluidic chip of 384 assay units fabricated by multilayer soft-lithography as described in the previous sec tion. A single assay unit consists of flow and control layers (FIGS. 8...a, b). The flow layer consists of an assay chamber and of two spotting chambers that encapsulate the dry spotted biological solutions (FIG. 8.a). The spotting chambers con tain a pressure relief channel that terminates in a low resis tance fluidic channel. Support pillars in the different cham bers prevent the PDMS roof from collapsing into the substrate. The control layer (FIG.8.b) includes 4 round valves that overlap with the assay chamber. Two neck valves isolate the spotting chambers from the assay chamber. Two sandwich valves isolate single assay units from one another during incubation steps. To help release some of the build-up pres Sure that occurs during rehydration of the spotted chambers, relief valves are open for the pressurized fluid to flow through the pressure relief channel into the low-resistance channels. Biological solutions are spotted on a planar Substrate (FIG. 8.c) and align with the assembled chip (FIGS. 8.d, e). 0053 FIG. 8 illustrates a single assay unit schematic. 0054 FIGS. 8(a, b) Each assay unit comprises two layers fabricated by multilayer soft-lithography. 0055 FIG. 8(c) The biological solution is spotted twice on a planar Substrate 0056 FIGS. 8(d, e) aligned with the assembled assay unit and 0057 Execution of nanoimmunoassay chip protocol 0058 a. Reagent loading. All reagents were aspirated into Tygon tubing (0.020" ID, AAQ02103, Coler-Parmer). 80 uL of PBS buffer with 0.05% Tween-20 was connected to the first inlet of the device. PBS/Tween was used as a washing buffer throughout the experiments. 30 uL of biotinylated BSA (29.130. Thermo Fisher Scientific) at a concentration of 2 mg/mL and 15 lull of neutravidin (31000. Thermo Fisher Scientific) at 0.5 mg/mL were connected to the second and
Oct. 8, 2015
third inlet, respectively. 10 uI of 5% milk powder resus pended in PBS was connected to the fourth inlet. 0059 b. Control line priming. Microfluidic control chan nels were primed with dH-0 at 6 psi. Once the channels were filled the pressure was increased to 20 psi to close all the valves except for the rounded valve lines (FIG. 9). 0060 c. Biotin-neutravidin layer deposition. Reaction chambers were passivated by flowing biotin-BSA for 20 min at 3 psi. At this step, it is possible to use blocking buffers such as BSA, milk, or casein while keeping the buttons closed but this adds another step and consequently increases the assay time. Biotin-BSA was washed by flowing PBS/Tween for 5 min. Neutravidin was then flowed for 20 min through the chambers and washed for 5 min. The pressure in the rounded valve lines was increased to 20 psi and the rounded valves closed. Closing the rounded valves mechanically shields a round area of ~2700 um (60-um diameter) at the bottom Surface and delineates the space where the sandwich immu noassay takes place. Biotin-BSA was flowed again for 20 min followed by a washing step of 5 min. Next 5% of non-fat dry milk in PBS was flushed for 10 min and washed for 5 min.
0061 FIG. 9 illustrates a. Passivation step. Relief and neck valves are closed and different reagents required for the pas Sivation step flowed through the assay chamber. 0062 d. Primary antibody immobilization. Each primary antibody is immobilized under its corresponding rounded valve, FIG. 10. Biotinylated antibodies were diluted in 1% blocker casein in PBS (37528, Thermo Fisher Scientific). Optimal working concentration for all primary antibodies was found to be 2 ug/mL except for anti-IL6 antibody, which was 200 ng/mL. 15uL of each antibody dilution were loaded into different Tygon tubing pieces and connected to the device. (At this step there is a layer of biotin-BSA-neutravidin under the area protected by the rounded valves.) One of the rounded valves was opened while keeping the rest of the rounded valves closed, and the first antibody was flowed for 20 min followed by a 10 min washing step. This process was repeated for the remaining primary antibodies. A final block ing step with milk was performed by opening all the valves, flowing milk for 10 min, and finally washing for 5 min with PBS/Tween. 0063 Water from the control lines diffuses constantly through the PDMS due to is porosity, thus all spotted samples have fully rehydrated at this step. This also increases consid erably the pressure inside the spotting chambers. A couple of capacitor strategically located on top of the spotting cham bers release some of this pressure by absorbing some of the water from the pressurized spotting chamber. 0064 FIG. 10 illustrates an Antibody immobilization step. Rounded valves are open sequentially to immobilize different antibodies under each of them. Solid arrows point to the different rounded valves closed during each step. Dotted arrows point to the spotting chambers. Over time, the spotted Solution rehydrates because of water permeation through the PDMS from pressurized valves and builds up pressure in the chamber. A couple of capacitors sitting on top of the cham bers help release some of this pressure by water permeation through the membrane separating the control layer and the flow layer. 0065 e. Sample incubation. To incubate the sample, the isolation valves separating each reaction chambers were closed and the chamber valves opened, FIG. 11. Rehydrated samples are incubated for at least one hour at room tempera ture.

US 2015/0285794 A1
0066 FIG. 11 illustrates an Incubation step. (a) Sandwich valves are closed to isolate single assay units from each other. (b) The neck valves are opened and the rehydrated sample diffuses through the chambers and allowed to incubate. 0067 f. Sample washing. During incubation the pressure across the three chambers equilibrate (the pressure is higher in the spotting chamber than the reaction chamber before incubation), raising the reaction chamber internal pressure to the point were the rounded valves will not close when actu ated. Relief valves are opened to dissipate some of the pres Sure in the spotting chambers (and therefore in the reaction chamber) and to allow the rounded valves to fully deflect and protect the antibody-antigen complex (FIG. 12). After a few seconds the chamber valves are closed, isolation valves open, and unbound material washed away by flowing PBS/Tween for 20 min. 0068 FIG. 12 illustrates a. Washing step. 0069 FIGS. 12(a, b) After incubation, round valves are closed and relief valves are opened to release some of the pressure, arrows pointing to bottom relief valve. 0070 FIG. 12(c) After a few seconds some of the biologi cal solution overflows into the relief channel. 0071 FIG. 12(d) Next, the neck valves are closed, sand wich valves opened and the assay chamber washed. 0072 g. Detection step. A cocktail of secondary detection antibodies was diluted in casein/PBS to a concentration of 0.01 ug/mL, 0.05 ug/mL, and 1 lug/mL, for IL6, TNFC., and IL-12/IL-23 p40 antibodies, respectively. The cocktail was flowed through the chip for 10 min, isolating valves closed, and rounded valves opened. After the secondary antibodies were incubated with the bound complex for 20 min, the rounded valves were closed to protect the sandwich complex, followed by a final wash of PBS/Tween for 10 minto remove unbound antibodies. 0073 FIG. 13 illustrates a further washing step. 0074 FIG. 13(a) A cocktail of detection antibodies is flowed through the chip. Arrow points to the assay chamber. 0075 FIG. 13(b) Next, sandwich valves are closed and all the rounded valves open; arrows pointing to the rounded valves. Detection antibodies are bound to their respective antigens. 0076 FIG. 13(c) After 15 min, rounded valves are closed again and sandwich valves open. A final washing step is performed. 0077 h. Optical Readout. The microfluidic device was scanned using a fluorescent microarray Scanner (Array WorX e-Biochip Reader, Applied Precision, USA) equipped with a Cy3 filter (540/25 X, 595/50M). Devices were scanned with an exposure time of 1 Sec at the highest resolution of 3.25um. Stitched images were exported as a 16-bit TIFF file. 0078 i. Data analysis. Image files were analyzed using a microarray image analysis software (GenePix Pro v6.0. Molecular Devices) and Matlab (Mathworks). An analysis template grid was manually created containing 1536 circular features that matched the location of the 4 rounded valves for the 386 reaction chambers on the chip. For each chip, the grid was manually aligned and the diameter of the circular features adjusted for each of the 1536 detection assays. Although this step could be automated, the manual alignment of the PDMS device to the glass slide introduced an inconsistent offset between rows and columns that varied across chips. The positions of each feature and its diameter were saved in a text file, which was fed to a Matlab script. The script automati cally computes the mean fluorescent intensity inside each
Oct. 8, 2015
feature and Subtracts the local background around the feature. It then generates a file reporting the relative fluorescent unit (RFU) values of the four different biomarkers for each assay. The script also arranges the RFU values of the calibration curves for each biomarker. 0079 1. Statistics Analysis. A statistical software (Prism v5.0, GraphPad) was used to perform a non-linear regression analysis on the standard curves. Data from the calibration curves were fit using a dose-response model (variable slope, four-parameters), weighting data points by the observed stan dard deviation. Unknown RFU values were interpolated from the standard curves.
4. Alternative Microfluidic Device Designs 0080. Other microfluidic device designs as illustrated in FIG. 14, FIG. 15, and FIG. 16, can be used to perform the same operations described here. FIG. 14 illustrates a device similar to the one described in FIG. 1 but without a relief valve. FIG. 15 illustrates a device with bigger spotting cham ber to increase assay sensitivities. FIG. 16 illustrates a device capable to perform 1024 nanoimmunoassays in parallel.
5. Materials and Reagents Used
Bone Marrow-Derived Dendritic Cell Culture
I0081 Bone marrow-derived dendritic cells (BM-DCs) were generated as previously described (ref Lutz). Briefly, bone marrow cells were flushed from the femur and tibiae of 7 weeks old C57BL/6 mice and cultured for 9 days in RPMI medium (Invitrogen/LuBioScience, Lucern, Switzerland) supplemented with 10% FBS, Penicillin/Streptomycin (both Invitrogen), and 10 ng/ml recombinant GM-CSF (Peprotech, Rocky Hill, USA). Fresh medium was added to the culture on day 3, 6 and 8. On day 9, cells were harvested and plated in round-bottom 96-well plates at 2x10 cells/well in 100 ul IMDM medium (Invitrogen) supplemented with 10% FBS and Penicillin/Streptomycin. Immediately after, 100 ul of IMDM medium containing the different TLR ligand mixtures were added to the cells. Medium only was added to the non-activated controls. After 24h of incubation, 160 ul super natant were transferred to new plates and stored at -20° C. until further analysis.
ELISA Validation
I0082. A pilot experiment to compare the nanoimmunoas say chip to ELISA was performed by activating BM-DCs with different concentrations of single TLR ligands. BM-DCs were activated for 24 has described above, and the secretion of IL-6 and TNFC. was measured in the supernatant by ready set-go ELISA kits (eBioscience) or by using the nanoimmu noassay chip. ELISA assay was performed according to manufacturers instructions; plates were read on a Safire 2 microplate reader (Tecan, Männedorf, Switzerland).
1. A nanoimmunoassay chip comprising at least flow and control layers, divided into several rows, each row containing a plurality of single assay units, each assay unit contains two spotting chambers and an assay chamber in the middle, wherein neck valves separate the spotting chambers from the assay chamber during Surface derivatization, said assay units being isolated from one another during incubation by isola tion valves, wherein relief valves help release built-up pres sure into a microfluidic channel after incubation and wherein

US 2015/0285794 A1
round valves in the assay chamber define and protect the circular immunoassay regions.
2. The chip of claim 1, wherein it comprises eight rows. 3. The chip of claim 1, wherein it comprises 48 single assay
units per row. 4. The chip of claim 1, wherein it comprises four round
button valves. 5. The chip of claim 1, wherein each said spotting cham
bers has a volume of about 1.7 nL. 6. The chip of claim 1, wherein the assay chamber has a
Volume of about 1 mL. 7. The chip of claim 1, wherein the assay chamber com
prises four circular immunoassay regions of 60 um diameter each to detect four biomarkers of choice.
8. An analyzing system comprising at least a chip as defined in claim 1.
9. A system as defined in claim 8, further comprising at least a well plate for keeping the biological solutions, an epoxy-coated glass slide on top of which the solution is spot ted and on which the chip is aligned.
10. A method ofusing a chip as defined in claim 1, wherein said method comprises the following steps:
a. Reagent loading. b. Control line priming.
Oct. 8, 2015
c. Biotin-neutravidin layer deposition. d. Primary antibody immobilization. e. Sample incubation. f. Sample washing. g. Detection step h. Optical Readout i. Data analysis and 1. Statistics Analysis. 11. A method comprising a chip of claim 1 which is aligned
to an array of samples, or which has been directly pro grammed with samples using a method of sample arraying.
12. A method comprising a chip of claim 1 which is aligned to an array of detection molecules, or which has been directly programmed with an array of detection molecules including but not limited to antibodies, DNA, or aptamers.
13. A microfluidic chip of claim 1, applied to the detection/ quantitation of biomarkers in biological samples, including but not limited to, blood, blood serum, BAL, cell culture medium, buffer solutions. Biomarkers include but are not limited to: proteins, peptides, DNA, RNA, organic molecules, and inorganic molecules. Biological samples may include but are not limited to: human, mouse, insect, plant, fungal, and bacterial origins.