1985-11_hp journal papers
DESCRIPTION
985-11_HP Journal PapersTRANSCRIPT
H E W L E T T - P A C K A R D
N O V E M B E R 1 9 B 5
© Copr. 1949-1998 Hewlett-Packard Co.
H E W L E T T - P A C K A R D
November 1985 Volume 36 • Number 11
Articles
4 Thin-Fi lm Memory Disc Development, by James E. Opfer, Bruce F. Spenner, Bangalore R . N a t a r a j a n , R i c h a r d A . B a u g h , E d w a r d S . M u r d o c k , C h a r l e s C . M o r e h o u s e , a n d
David recording provides Sputtering a cobalt al loy on a disc for magnetic data recording provides improved per formance and re l iab i l i ty , but not wi thout carefu l development .
6 M - H L o o p M e a s u r e m e n t s 8 A L a s e r P a r t i c l e S c a n n e r
11 D y n a m i c T e s t i n g o f T h i n - F i l m M a g n e t i c R e c o r d i n g D i s c s , b y J o h n H o d g e s , K e i t h S . Roske l ley , and Denn is R . Edson A modu la r approach i s a key e lement .
I n - L i n e S p u t t e r i n g D e p o s i t i o n S y s t e m f o r T h i n - F i l m D i s c F a b r i c a t i o n , b y G e o r g e A . Drennan , Rober t J . Lawton , and M ichae l B . Jacobson A soph is t i ca ted con t ro l sys tem
and physical design moves the d iscs f rom one deposi t ion step to the next wi thout exposing the d iscs to a tmospher ic condi t ions between s teps.
Th in -F i lm D isc Re l iab i l i t y— the Conserva t ive Approach, by C l i f fo rd K . Day , C . G i rv in Ha rk i ns , S tephan P . Howe , and Pau l Poo rman Wear , f r i c t i on , and co r ros ion mus t be
evaluated and contro l led.
31 Authors
M a n u f a c t u r i n g T h i n - F i l m D i s c s , b y G l e n n E . M o o r e , J r . , R i c h a r d S . S e y m o u r , a n d Darrel drive Bloomquist Optimizing disc fabrication has a major effect on disc drive product
cost and qual i ty .
Q O T h i n - F i l m D i s c s : M a g n e t i c , E l e c t r i c a l , a n d M e c h a n i c a l D e s i g n , b y M i c h a e l C . A l l y n , J Peter parameters Goglia, and Scott R. Smay When the magnetic and electr ical parameters
requ i re a head to f l y on l y 200 nm above a d i sc , su r f ace smoo thness becomes an impo r tan t des ign parameter .
Editor. Richard Wright Dolan • Associate Editor. Kenneth A Shaw • Assistant Editor. Nancy R. Teater • Art Director. Photographer. An/id A Damelson • Support Supervisor, Susan E Wright I l lustrator, Publisher, S. Vanderbloom • Administrative Services. Typography. Anne S. LoPresti • European Production Supervisor, Michael Zandwijken • Publisher, Russell M H Berg
2 HEWLETT-PACKARD JOURNAL NOVEMBER 1985 © Hewlett-Packard Company 1985 Printed in U.S.A.
© Copr. 1949-1998 Hewlett-Packard Co.
In this Issue ^ â € ¢ f e - * ^ H ^ H T h e i n c o r p o r a t i o n o f a s p u t t e r e d t h i n - f i l m m a g n e t i c d i s c i n t h e H P 9 7 5 0 1 A
I 3 V 2 - l n c h 1 0 - M b y t e D i s c D r i v e c u l m i n a t e d s e v e r a l y e a r s o f e f f o r t a t H P â „¢ ^H Labora to r ies and HP 's D isc Memory and Gree ley D iv is ions . The th in - f i lm
I d isc , in wh ich a magnet ic meta l l i c layer ac ts as the data s torage medium, A f r e p r e s e n t s a m a j o r t e c h n o l o g y a d v a n c e i n r i g i d m a g n e t i c r e c o r d i n g d i s c s .
HP's the of vacuum sputtering deposition instead of plating for the production of the thin f i lms has led to much t ighter process control, higher yields, better manufacturabi l i ty, and lower costs.
J . . . formed J Disc h 1977. DICK Hackborn. then genera: manager o f the newly formed Disc Memory recording init iated the program. Hackborn believed that as magnetic recording technology evolved, the thin-f i lm magnet ic disc would play a crucial role in future disc dr ives.
The ini t ia l HP invest igat ion of thin-f i lm disc technology was done at HP Labs by Jim Opfer and Len Cut ler and the i r groups and is summar ized in the ar t ic le on page 4. Severa l courses were pursued technology parallel to establish a solid foundation for future work and to determine if the technology was feasib le. In addi t ion to theoret ical s tudies of magnet ic recording by Dave Bromley, Richard Baugh, appropriate Ed Murdock, characterization equipment was developed to ensure that appropriate parameters could be studied (examples are descr ibed by Robin Gi f ford and Vic Hesterman and by Rich Elder in the boxes on pages 6 and 8). Various materials systems were evaluated by B.R. Natarajan wi th heavy emphasis on the re l iabi l i ty of the disc. As the program evolved, i t became apparent f i rs t the disc fabr icat ion process would be as important as the disc i tsel f , and the f i rs t in - l ine Drennan ( ILS) sys tem was des igned, bu i l t , and tes ted (see ar t i c le by George Drennan on page 21).
A t the D isc Memory D iv is ion , severa l p rograms were s ta r ted in magnet ic record ing theory , p r o c e s s n e w c h a r a c t e r i z a t i o n , a n d r e l i a b i l i t y t o c o m p l e m e n t t h e H P L a b s w o r k . T h e n e w p rog rams d i sc t a i l o r i ng t he t echno logy t o a d r i ve p roduc t , d i sc manu fac tu rab i l i t y , and d i sc cost. the participation ingredient in the success of the thin-film disc program was the early participation of the d r i ve deve lopment teams managed by Duncan Ter ry , Wins ton M i tche l l , and Doug Me l lo r . Opt imiz ing the d isc and dr ive combinat ion requi red extensive test ing and cooperat ion between the teams. The ar t ic le by Mike Al lyn, Pete Gogl ia , and Scot t Smay on page 36 g ives some fee l for the product- related challenges.
M u c h d i s c . w a s a l s o f o c u s e d o n t h e m a n u f a c t u r a b i l i t y o f t h e d i s c . T h e a r t i c l e b y R i c k Seymour , Dar re l B loomqu is t , and me on page 34 summar izes the work on the manufac tu r ing p rocess , wh i l e t he a r t i c l e by John Hodges , Ke i t h Roske l l ey , and Denn i s Edson on page 11 descr ibes the f inal disc test systems. The modular i ty of the test systems al lows them to be used for any the and to be upgraded for future high-performance media. This cont inues the emphasis on a workhorse technology. The manufactur ing ef for t inc luded extensive cost models developed by Ken improvements, and Don Peterson to predict the impact of demand, process improvements, automat ion, and o ther fac tors on the d isc cost . F ina l ly , C l i f f Day, Pau l Poorman, Steve Howe, and Girvin Harkins descr ibe the cont inuing rel iabi l i ty work in their art ic le on page 25.
-Glenn E. Moore, Jr . , Guest Edi tor
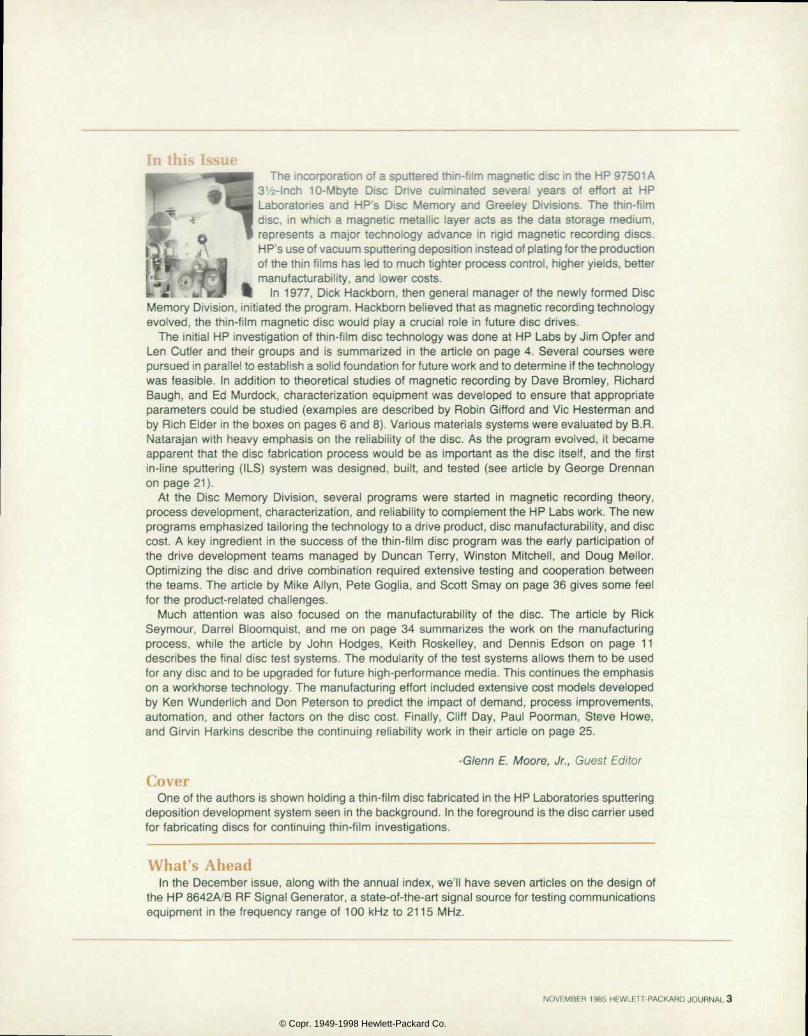
Cover One of the authors is shown holding a thin-f i lm disc fabricated in the HP Laboratories sputtering
deposit ion development system seen in the background. In the foreground is the disc carr ier used for fabricat ing discs for continuing thin-f i lm investigat ions.
What's Ahead In the December issue, along with the annual index, we' l l have seven art ic les on the design of
the HP 8642A/B RF Signal Generator, a state-of-the-art s ignal source for test ing communicat ions equipment in the f requency range of 100 kHz to 21 15 MHz.
NOVEMBER 1985 HEWLETT-PACKARD JOURNAL 3
© Copr. 1949-1998 Hewlett-Packard Co.
Thin-Fi lm Memory Disc Development Deve lop ing a new record ing medium for d isc memor ies requi red carefu l a t tent ion to the development and characterization of materials, processes, and test systems.
by James E. Opfer, Bruce F. Spenner, Bangalore R. Natarajan, Richard A. Baugh, Edward S. Murdock, Char les C. Morehouse, and David J . Bromley
THIN-FILM DISC DEVELOPMENT at HP Laboratories was begun to give Hewlett-Packard mastery over the technology of a key component of disc drives. This
development, it was believed, would lead to a better under standing of the recording medium and the recording pro cess and perhaps result in a component proprietary to HP. A thin-film medium was chosen over the traditional par- ticulate media because of the opportunity to make a con tribution to disc performance. Along with this choice came the attendant risk that thin-film discs would suffer from potentially unsolvable problems. The combination of op portunity and risk justified assembling a special team of people. This team was to develop a superior recording disc and an expanding set of capabilities to characterize impor tant problems of magnetic recording — both those of a gen eral nature and those known to be specific to thin-film discs.
Initial Definition At the onset of the program, thin magnetic films had
already exhibited considerable promise for use as recording media. Cobalt films were known to have sufficient magneti zation for recording at high density when prepared in the form of films as thin as 50 nm. The uniformity of recording fields in these very thin films led to the expectation of high recording performance if other salient problems could be solved. Cobalt films were known to be highly susceptible
to corrosion, and the wear properties of unmodified metal films, to the extent that they had been characterized, were not acceptable. Detailed recording properties of a homo geneous medium were not known, nor was the incidence of defects in a thin-film layer. Finally, it had to be de monstrated that the desirable properties of thin magnetic films could be obtained reproducibly and at a competitive price.
To deal with these uncertainties, investigations were begun in each area of concern. Investigation of corrosion effects was initiated at both the practical level and a more fundamental level. Apparatus and measurement methods were established to characterize the wear performance. Computerized test equipment was developed to measure recording properties and the distribution of defects. Fi nally, as development and characterization of the thin-film disc progressed, modeling of the recording physics helped to validate the experimental results and design choices.
Mater ial and Process Development The disc material and process development required an
integrated approach. Not only was there a requirement for certain macromagnetic properties of the thin magnetic films, but these properties had to be uniform over a disc surface and had to be prepared relatively free of defects on a substrate meeting both cost and mechanical requirements.
Optimization of a disc recording system requires a match-
1600 -
8 1 2 Platinum Concentration (atomic %)
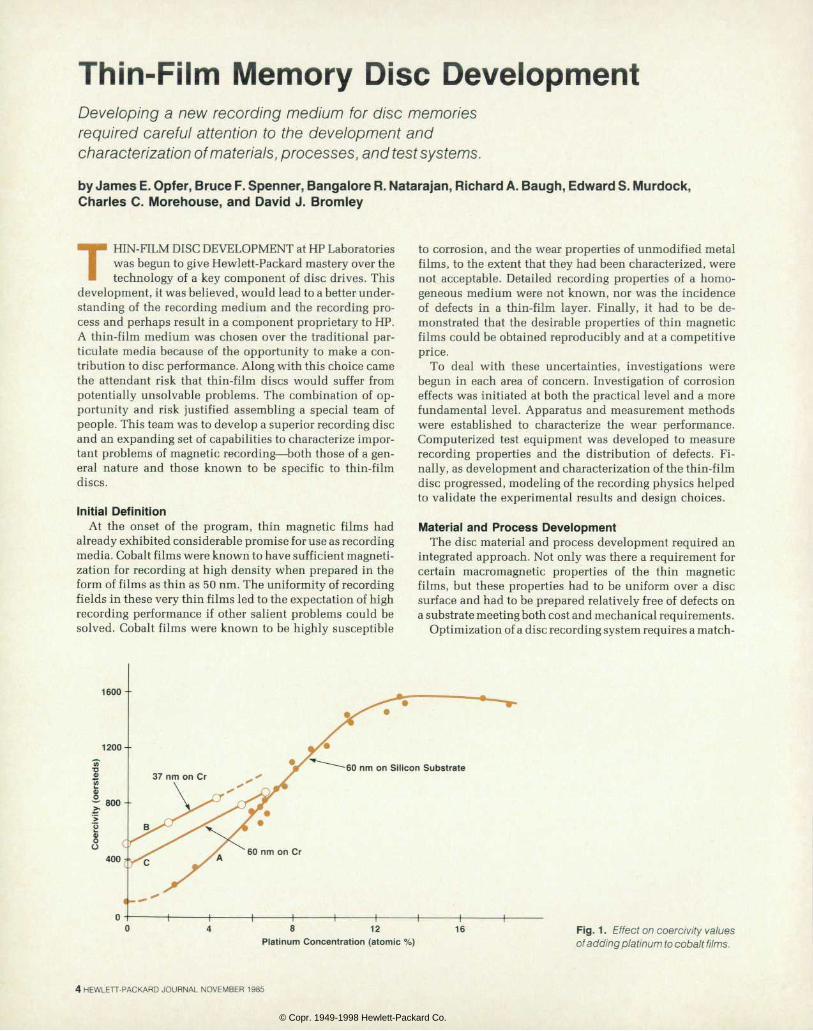
16 Fig. 1. Ef fect on coerdvi ty va lues of adding platinum to cobalt fi lms.
4 HEWLETT-PACKARD JOURNAL NOVEMBER 1985
© Copr. 1949-1998 Hewlett-Packard Co.
0.0015 -r
S m
0 . 0 0 1 0 4 -
I ._ D
0.0005 -i-
0.0000 5 0 0 1 0 0 0
Recording Density (transit ions/mm)
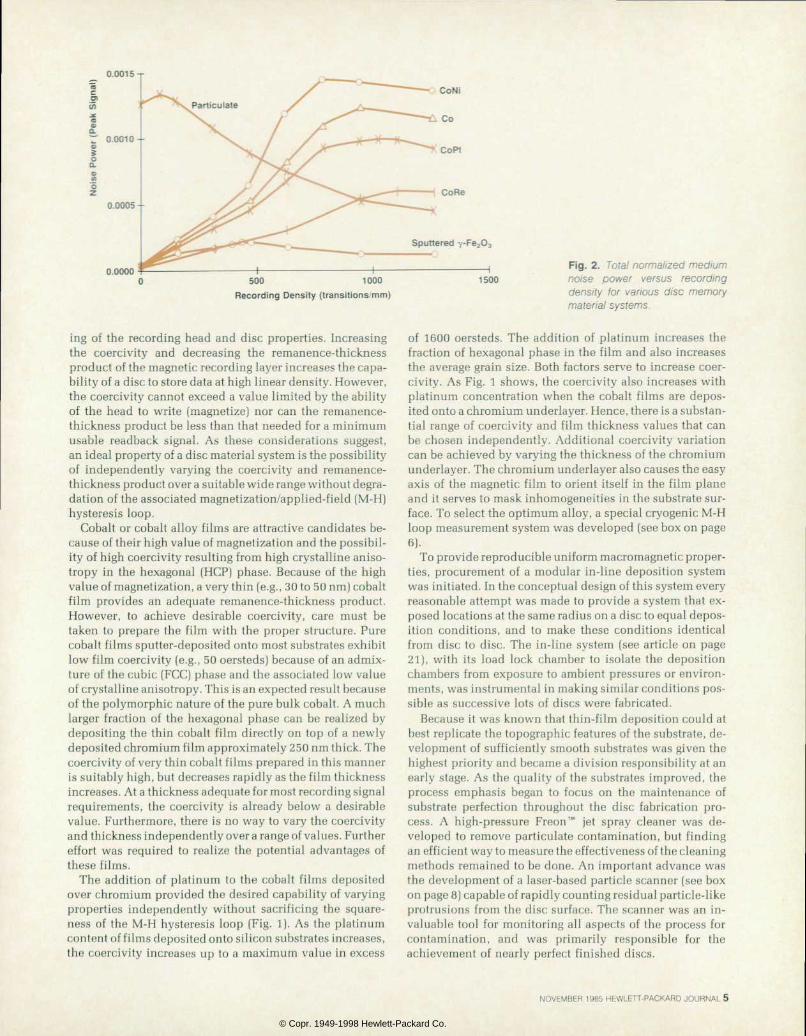
ing of the recording head and disc properties. Increasing the coercivity and decreasing the remanence-thickness product of the magnetic recording layer increases the capa bility of a disc to store data at high linear density. However, the coercivity cannot exceed a value limited by the ability of the head to write (magnetize) nor can the remanence- thickness product be less than that needed for a minimum usable readback signal. As these considerations suggest, an ideal property of a disc material system is the possibility of independently varying the coercivity and remanence- thickness product over a suitable wide range without degra dation of the associated magnetization/applied-field (M-H) hysteresis loop.
Cobalt or cobalt alloy films are attractive candidates be cause of their high value of magnetization and the possibil ity of high coercivity resulting from high crystalline aniso- tropy in the hexagonal (HCP) phase. Because of the high value of magnetization, a very thin (e.g., 30 to 50 nm) cobalt film provides an adequate remanence-thickness product. However, to achieve desirable coercivity, care must be taken to prepare the film with the proper structure. Pure cobalt films sputter-deposited onto most substrates exhibit low film coercivity (e.g., 50 oersteds) because of an admix ture of the cubic (FCC) phase and the associated low value of crystalline anisotropy. This is an expected result because of the polymorphic nature of the pure bulk cobalt. A much larger fraction of the hexagonal phase can be realized by depositing the thin cobalt film directly on top of a newly deposited chromium film approximately 250 nm thick. The coercivity of very thin cobalt films prepared in this manner is suitably high, but decreases rapidly as the film thickness increases. At a thickness adequate for most recording signal requirements, the coercivity is already below a desirable value. Furthermore, there is no way to vary the coercivity and thickness independently over a range of values. Further effort was required to realize the potential advantages of these films.
The addition of platinum to the cobalt films deposited over chromium provided the desired capability of varying properties independently without sacrificing the square ness of the M-H hysteresis loop (Fig. 1). As the platinum content of films deposited onto silicon substrates increases, the coercivity increases up to a maximum value in excess
1500
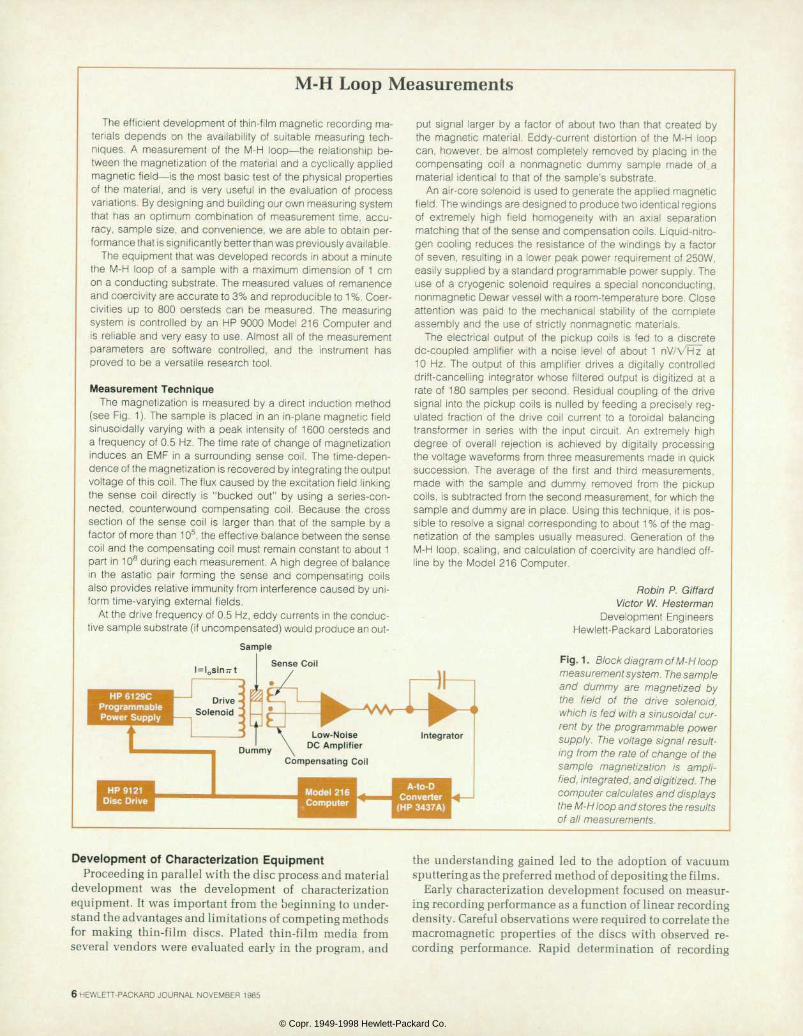
F ig . 2 . To ta l no rma l i zed med ium n o i s e p o w e r v e r s u s r e c o r d i n g dens i t y f o r va r i ous d i sc memory material systems.
of 1600 oersteds. The addition of platinum increases the fraction of hexagonal phase in the film and also increases the average grain size. Both factors serve to increase coer civity. As Fig. 1 shows, the coercivity also increases with platinum concentration when the cobalt films are depos ited onto a chromium underlayer. Hence, there is a substan tial range of coercivity and film thickness values that can be chosen independently. Additional coercivity variation can be achieved by varying the thickness of the chromium underlayer. The chromium underlayer also causes the easy axis of the magnetic film to orient itself in the film plane and it serves to mask inhomogeneities in the substrate sur face. To select the optimum alloy, a special cryogenic M-H loop measurement system was developed (see box on page 6).
To provide reproducible uniform macromagnetic proper ties, procurement of a modular in-line deposition system was initiated. In the conceptual design of this system every reasonable attempt was made to provide a system that ex posed locations at the same radius on a disc to equal depos ition conditions, and to make these conditions identical from disc to disc. The in-line system (see article on page 21), with its load lock chamber to isolate the deposition chambers from exposure to ambient pressures or environ ments, was instrumental in making similar conditions pos sible as successive lots of discs were fabricated.
Because it was known that thin-film deposition could at best de the topographic features of the substrate, de velopment of sufficiently smooth substrates was given the highest priority and became a division responsibility at an early stage. As the quality of the substrates improved, the process emphasis began to focus on the maintenance of substrate perfection throughout the disc fabrication pro cess. A high-pressure Freonâ„¢ jet spray cleaner was de veloped to remove particulate contamination, but finding an efficient way to measure the effectiveness of the cleaning methods remained to be done. An important advance was the development of a laser-based particle scanner (see box on page 8) capable of rapidly counting residual particle-like protrusions from the disc surface. The scanner was an in valuable tool for monitoring all aspects of the process for contamination, and was primarily responsible for the achievement of nearly perfect finished discs.
NOVEMBER 1985 HEWLETT-PACKARD JOURNAL 5
© Copr. 1949-1998 Hewlett-Packard Co.
M-H Loop Measurements
The ef f ic ient development of th in- f i lm magnet ic record ing ma te r ia l s depends on the ava i lab i l i t y o f su i tab le measur ing tech n iques. A measurement o f the M-H loop— the re la t ionsh ip be tween the magnet izat ion of the mater ia l and a cycl ical ly appl ied magnetic f ield — is the most basic test of the physical properties o f the mater ia l , and is very usefu l in the eva luat ion o f process var iat ions. By designing and bui lding our own measuring system tha t has an op t imum comb ina t ion o f measuremen t t ime , accu racy , sample s ize , and conven ience, we are ab le to obta in per formance that is significantly better than was previously available.
The equipment that was developed records in about a minute the M-H loop o f a samp le w i th a max imum d imens ion o f 1 cm on a conduct ing subst rate. The measured va lues of remanence and coercivi ty are accurate to 3% and reproducible to 1 %. Coer- c i v i t i es up to 800 oe rs teds can be measu red . The measu r ing sys tem i s con t ro l l ed by an HP 9000 Mode l 216 Compute r and is re l iab le and very easy to use. Almost a l l o f the measurement p a r a m e t e r s a r e s o f t w a r e c o n t r o l l e d , a n d t h e i n s t r u m e n t h a s proved to be a versat i le research tool .
Measurement Technique The magnet izat ion is measured by a d i rect induct ion method
(see Fig. 1) . The sample is p laced in an in-p lane magnet ic f ie ld s inusoidal ly vary ing wi th a peak in tensi ty of 1600 oersteds and a f requency of 0.5 Hz. The t ime rate of change of magnet izat ion i nduces an EMF in a su r round ing sense co i l . The t ime-depen dence of the magnetization is recovered by integrating the output voltage of this coi l . The f lux caused by the excitat ion f ield l inking t he sense co i l d i r ec t l y i s " bucked ou t " by us i ng a se r i es - con nec ted , coun te rwound compensa t i ng co i l . Because the c ross sect ion o f the sense co i l i s la rger than that o f the sample by a factor of more than 105, the effect ive balance between the sense coi l and the compensat ing coi l must remain constant to about 1 part in 108 dur ing each measurement. A high degree of balance i n t he as ta t i c pa i r f o rm ing the sense and compensa t i ng co i l s a lso provides re lat ive immuni ty f rom inter ference caused by uni form t ime-varying external f ie lds.
At the dr ive f requency of 0.5 Hz, eddy currents in the conduc t i ve ou t - subs t ra te ( i f uncompensa ted) wou ld p roduce an ou t -
Sample
H P 6 1 2 9 C Programmable Power Supply
I=l0sinjit
Drive So leno id
Sense Co i l
HP 9121 Disc Orive
D u m m y Low-No ise
DC Amp l i f i e r
C o m p e n s a t i n g C o i l
Model 216 Computer
put s igna l la rger by a fac tor o f about two than tha t c rea ted by the magnet ic mater ia l . Eddy-cur rent d is tor t ion o f the M-H loop can, however , be a lmost comple te ly removed by p lac ing in the c o m p e n s a t i n g c o i l a n o n m a g n e t i c d u m m y s a m p l e m a d e o f a mater ial ident ical to that of the sample's substrate.
An air-core solenoid is used to generate the appl ied magnet ic f ield. The windings are designed to produce two identical regions o f ex t reme ly h igh f i e l d homogene i t y w i th an ax ia l sepa ra t i on matching that of the sense and compensat ion coi ls . L iquid-ni t ro gen coo l ing reduces the res is tance o f the wind ings by a fac tor of seven, resul t ing in a lower peak power requirement of 250W, easi ly suppl ied by a standard programmable power supply. The use o f a c ryogenic so leno id requ i res a spec ia l nonconduct ing, nonmagnet ic Dewar vessel with a room-temperature bore. Close a t ten t ion was pa id to the mechan ica l s tab i l i t y o f the comple te assembly and the use of s t r ic t ly nonmagnet ic mater ia ls .
The e lec t r i ca l ou tpu t o f the p ickup co i l s i s fed to a d isc re te de-coupled ampl i f ie r w i th a no ise leve l o f about 1 nV/VPTz" a t 10 Hz. The output o f th is ampl i f ie r dr ives a d ig i ta l ly cont ro l led dr i f t -cancel l ing integrator whose f i l tered output is d ig i t ized at a rate of 180 samples per second. Residual coupl ing of the dr ive s ignal in to the p ickup co i ls is nu l led by feeding a prec ise ly reg u la ted f rac t ion o f the dr ive co i l cur rent to a to ro ida l ba lanc ing t rans fo rmer in ser ies w i th the inpu t c i rcu i t . An ex t remely h igh degree o f overa l l re jec t ion is ach ieved by d ig i ta l l y p rocess ing the vol tage waveforms f rom three measurements made in quick success ion . The average o f the f i rs t and th i rd measurements , m a d e w i t h t h e s a m p l e a n d d u m m y r e m o v e d f r o m t h e p i c k u p coi ls, is subtracted from the second measurement, for which the sample and dummy are in p lace. Using th is technique, i t is pos s ib le to resolve a s ignal corresponding to about 1% of the mag net izat ion o f the samples usual ly measured. Generat ion o f the M-H loop, scal ing, and calcu lat ion of coerc iv i ty are handled of f l ine by the Model 216 Computer .
Robin P. Gi f fa rd Victor W. Hesterman
Development Engineers Hewlet t -Packard Laborator ies
Fig. 1 . Block diagram of M-H loop measurement system. The sample a n d d u m m y a r e m a g n e t i z e d b y t h e f i e l d o f t h e d r i v e s o l e n o i d , which is fed wi th a s inusoidal cur ren t by the p rogrammable power supp ly . The vo l tage s igna l resu l t ing from the rate of change of the s a m p l e m a g n e t i z a t i o n i s a m p l i f ied, integrated, and digit ized. The computer calculates and displays the M-H loop and stores the results of al l measurements.
In tegra tor
A-to-D Converter
(HP 3437 A)
Development of Character izat ion Equipment Proceeding in parallel with the disc process and material
development was the development of characterization equipment. It was important from the beginning to under stand the advantages and limitations of competing methods for making thin-film discs. Plated thin-film media from several vendors were evaluated early in the program, and
the understanding gained led to the adoption of vacuum sputtering as the preferred method of depositing the films.
Early characterization development focused on measur ing recording performance as a function of linear recording density. Careful observations were required to correlate the macromagnetic properties of the discs with observed re cording performance. Rapid determination of recording
6 HEWLETT-PACKARD JOURNAL NOVEMBER 1985
© Copr. 1949-1998 Hewlett-Packard Co.
properties provided the important feedback that guided the evolution of the materials system. Accompanying im provement in the disc properties was an increase in sophis tication of the measurement tools. The study of the noise mechanism in thin-film discs discussed later is one exam ple of the characterization work that was done.
Another major contribution of the characterization was the separation of modulation effects into those caused by head flying height variations and those caused by material property variations (see article on page 36). The latter vari ations provided the most direct evidence of the sensitivity of disc properties to minor variations in the fabrication process. The elimination of process features that caused modulation also resulted in a process providing a high degree of disc-to-disc reproducibility.
A final important contribution of the characterization equipment was the measurement of the distribution of de fects in discs as made and in discs that had been exposed to various controlled environments. A significant conclu sion based on these measurements was that discs could be made by means of sputtering to a degree of perfection lim ited essentially by the degree of perfection of the substrate itself. Furthermore, the effects of hostile environments could be quantitatively assessed in terms of variations in defect count.
The evolution of this ability to characterize discs led to the capability of specifying disc performance in terms that could be readily measured. An important contribution to the overall development process was the creation of an External Reference Specification (ERS) for the thin-film disc and the definition of a procedure for testing these specifications. The combination of the specification and the test procedure, more than any other single thing, pro vided a template by which the divisions could gauge the progress of the effort at HP Labs.
Noise Characterization Errors in a disc memory come from many sources, one
of which is the magnetic noise of the recording medium itself. This noise arises from random fluctuations in the magnetization along a recorded track and results in random shifts in the locations of the signal peaks. Given the mean value of this time jitter, the bit error rate from the medium
so--
I 4 5 4
4 0 - -
3 5 - -
30 1 1 1 1 0 . 0 0 . 2 0 . 4 0 . 6 0 . 8
T r a n s v e r s e D i s p l a c e m e n t ( m m a c r o s s T r a c k )
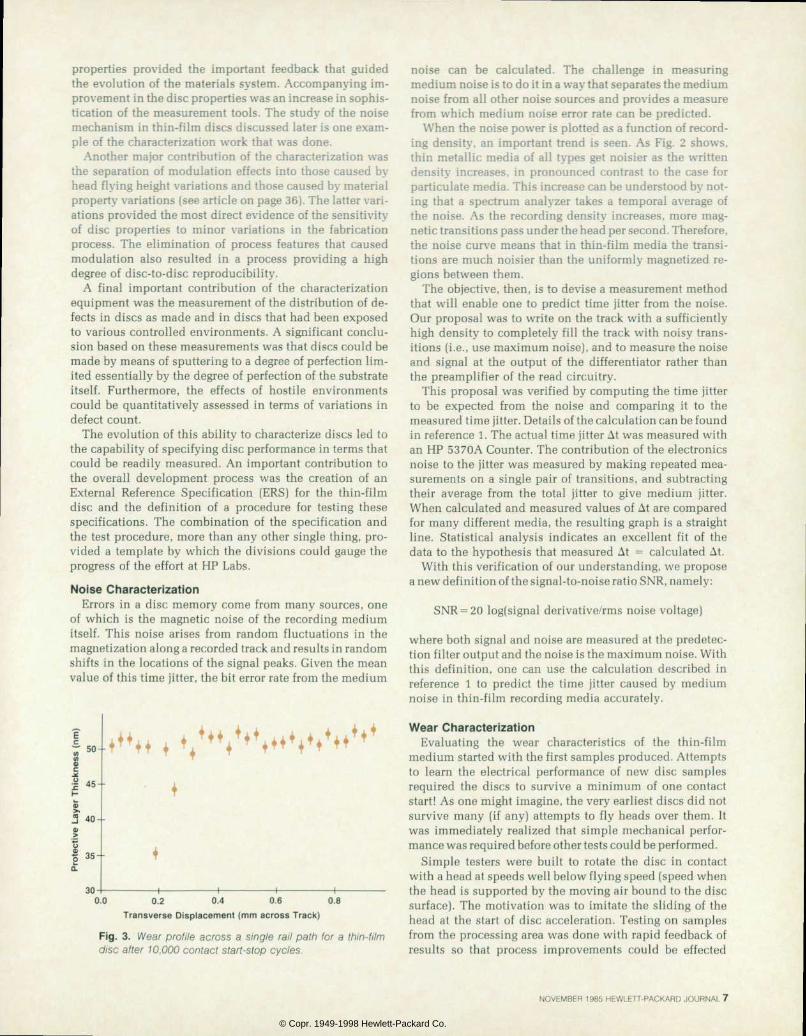
Fig . 3 . Wear p ro f i le across a s ing le ra i l pa th fo r a th in - f i lm disc af ter 10,000 contact s tar t -s top cycles.
noise can be calculated. The challenge in measuring medium noise is to do it in a way that separates the medium noise from all other noise sources and provides a measure from which medium noise error rate can be predicted.
When the noise power is plotted as a function of record ing density, an important trend is seen. As Fig. 2 shows, thin metallic media of all types get noisier as the written density increases, in pronounced contrast to the case for particulate media. This increase can be understood by not ing that a spectrum analyzer takes a temporal average of the noise. As the recording density increases, more mag netic transitions pass under the head per second. Therefore, the noise curve means that in thin-film media the transi tions are much noisier than the uniformly magnetized re gions between them.
The objective, then, is to devise a measurement method that will enable one to predict time jitter from the noise. Our proposal was to write on the track with a sufficiently high density to completely fill the track with noisy trans itions (i.e., use maximum noise), and to measure the noise and signal at the output of the differentiator rather than the preamplifier of the read circuitry.
This proposal was verified by computing the time jitter to be expected from the noise and comparing it to the measured time jitter. Details of the calculation can be found in reference 1. The actual time jitter At was measured with an HP 5370A Counter. The contribution of the electronics noise to the jitter was measured by making repeated mea surements on a single pair of transitions, and subtracting their average from the total jitter to give medium jitter. When calculated and measured values of At are compared for many different media, the resulting graph is a straight line. Statistical analysis indicates an excellent fit of the data to the hypothesis that measured At = calculated At.
With this verification of our understanding, we propose a new definition of the signal-to-noise ratio SNR, namely:
SNR=20 log(signal derivative/rms noise voltage)
where both signal and noise are measured at the predetec- tion filter output and the noise is the maximum noise. With this definition, one can use the calculation described in reference 1 to predict the time jitter caused by medium noise in thin-film recording media accurately.
Wear Characterizat ion Evaluating the wear characteristics of the thin-film
medium started with the first samples produced. Attempts to learn the electrical performance of new disc samples required the discs to survive a minimum of one contact start! As one might imagine, the very earliest discs did not survive many (if any) attempts to fly heads over them. It was immediately realized that simple mechanical perfor mance was required before other tests could be performed.
Simple testers were built to rotate the disc in contact with a head at speeds well below flying speed (speed when the head is supported by the moving air bound to the disc surface). The motivation was to imitate the sliding of the head at the start of disc acceleration. Testing on samples from the processing area was done with rapid feedback of results so that process improvements could be effected
NOVEMBER 1985 HEWLETT-PACKARD JOURNAL 7
© Copr. 1949-1998 Hewlett-Packard Co.
A Laser Particle Scanner
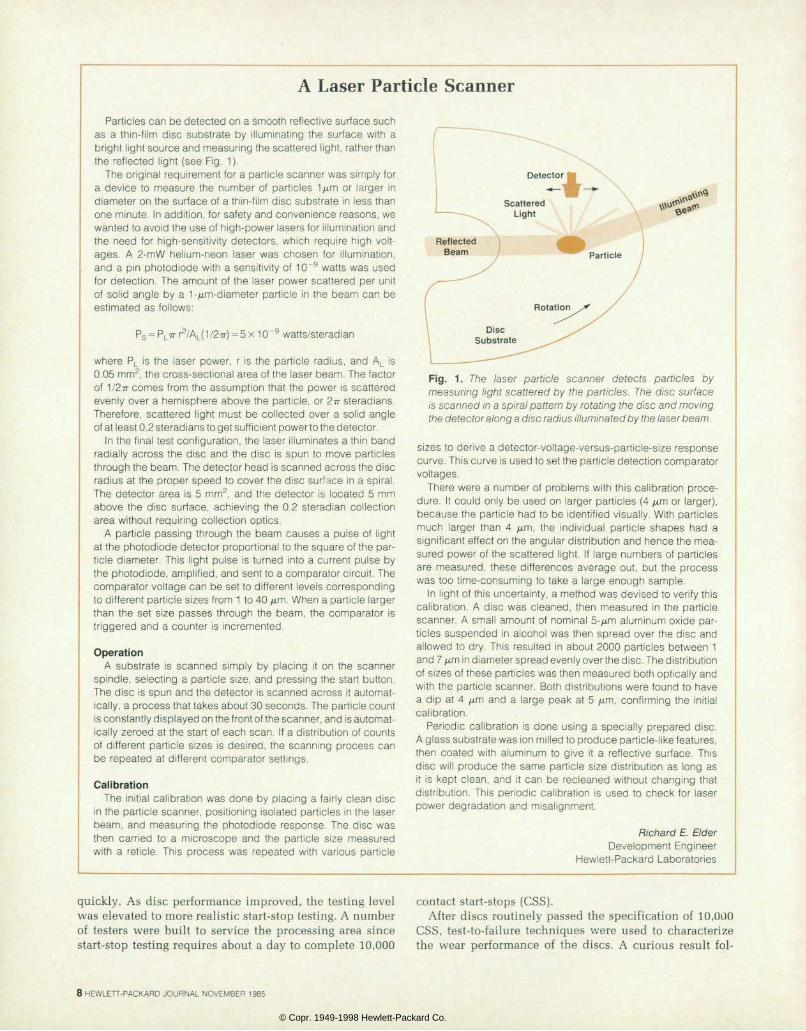
Part ic les can be detected on a smooth ref lect ive surface such as a th in - f i lm d isc subs t ra te by i l l uminat ing the sur face w i th a bright l ight source and measuring the scattered l ight, rather than the ref lected l ight (see Fig. 1).
The or ig inal requirement for a part ic le scanner was simply for a dev ice to measure the number o f par t i c les 1 / j .m or la rger in diameter on the surface of a thin-f i lm disc substrate in less than one minute. In addit ion, for safety and convenience reasons, we wanted to avoid the use of high-power lasers for i l lumination and the need for h igh-sens i t iv i ty detec tors , wh ich requ i re h igh vo l t ages . A 2 -mW he l ium-neon laser was chosen fo r i l l umina t ion , and a p in photodiode wi th a sensi t iv i ty of 1CT9 wat ts was used for detect ion. The amount of the laser power scat tered per un i t of sol id angle by a 1-/¿m-diameter part ic le in the beam can be est imated as fol lows:
Ps = PLi7r2/AL(1/2ir) = 5x10"9 watts/steradian
where PL is the laser power , r i s the par t i c le rad ius , and AL is 0.05 mm2, the cross-sectional area of the laser beam. The factor of 1/2 77 comes from the assumption that the power is scattered evenly over a hemisphere above the par t ic le , or 2 i r s teradians. Therefore , scat tered l ight must be co l lec ted over a so l id ang le of at least 0.2 steradians to get sufficient power to the detector.
In the f inal test configurat ion, the laser i l luminates a thin band rad ia l ly across the d isc and the d isc is spun to move par t ic les through the beam. The detector head is scanned across the disc radius at the proper speed to cover the disc surface in a spira l . The de tec tor a rea is 5 mm2, and the de tec to r i s loca ted 5 mm above the d isc sur face , ach iev ing the 0 .2 s te rad ian co l lec t ion area wi thout requir ing col lect ion opt ics.
A par t i c le pass ing th rough the beam causes a pu lse o f l i gh t at the photodiode detector proport ional to the square of the par t i c l e b y T h i s l i g h t p u l s e i s t u r n e d i n t o a c u r r e n t p u l s e b y the photodiode, ampl i f ied, and sent to a comparator c i rcui t . The comparator vol tage can be set to d i f ferent levels corresponding to different particle sizes from 1 to 40 /¿m. When a particle larger than the se t s i ze passes th rough the beam, the compara to r i s t r iggered and a counter is incremented.
Operation A subs t ra te i s scanned s imp ly by p lac ing i t on the scanner
spindle, select ing a part ic le s ize, and pressing the star t but ton. The d isc is spun and the detector is scanned across i t automat ical ly, a process that takes about 30 seconds. The part ic le count is constantly displayed on the front of the scanner, and is automat ical ly zeroed at the start of each scan. I f a distr ibut ion of counts o f d i f fe rent par t ic le s izes is des i red, the scanning process can be repeated at d i f ferent comparator set t ings.
Calibration The in i t ia l ca l ibrat ion was done by p lac ing a fa i r ly c lean d isc
in the part ic le scanner, posi t ioning isolated part ic les in the laser beam, and measur ing the pho tod iode response . The d isc was t hen ca r r i ed t o a m ic roscope and t he pa r t i c l e s i ze measu red w i th a re t ic le . Th is p rocess was repeated w i th var ious par t i c le
F i g . 1 . T h e l a s e r p a r t i c l e s c a n n e r d e t e c t s p a r t i c l e s b y measur ing l ight scat tered by the par t ic les. The d isc sur face is scanned in a spiral pattern by rotat ing the disc and moving the detector along a disc radius il luminated by the laser beam.
sizes to der ive a detector-vol tage-versus-part ic le-s ize response curve. This curve is used to set the part icle detection comparator voltages.
There were a number o f prob lems wi th th is ca l ib ra t ion proce dure. I t could only be used on larger part ic les (4 yum or larger), because the part ic le had to be ident i f ied v isual ly. With part ic les much l a rge r t han 4 / j .m , t he i nd i v idua l pa r t i c l e shapes had a s igni f icant ef fect on the angular d ist r ibut ion and hence the mea sured power of the scat tered l ight . I f large numbers of part ic les are measured, these d i f fe rences average out , bu t the process was too t ime-consuming to take a large enough sample.
In l ight of this uncertainty, a method was devised to veri fy this ca l ib ra t ion . A d isc was c leaned, then measured in the par t i c le scanner . A smal l amount o f nominal 5- /u ,m a luminum ox ide par t ic les suspended in a lcoho l was then spread over the d isc and a l lowed to dry. This resul ted in about 2000 par t ic les between 1 and 7 /urn in diameter spread evenly over the disc. The distribution of s izes of these part ic les was then measured both opt ical ly and wi th the par t ic le scanner. Both d is t r ibut ions were found to have a dip at 4 /urn and a large peak at 5 /¿m, conf i rming the in i t ia l calibration.
Per iod ic ca l ib ra t ion is done us ing a spec ia l ly prepared d isc . A glass substrate was ¡on milled to produce particle-like features, then coated w i th a luminum to g ive i t a re f lec t ive sur face. Th is d isc wi l l p roduce the same par t ic le s ize d is t r ibut ion as long as i t i s kept c lean, and i t can be rec leaned wi thout chang ing tha t d is t r ibut ion. This per iod ic ca l ibrat ion is used to check for laser power degradat ion and misa l ignment .
Richard E. Elder Development Engineer
Hewlet t -Packard Laborator ies
quickly. As disc performance improved, the testing level was elevated to more realistic start-stop testing. A number of testers were built to service the processing area since start-stop testing requires about a day to complete 10,000
contact start-stops (CSS). After discs routinely passed the specification of 10,000
CSS, test-to-failure techniques were used to characterize the wear performance of the discs. A curious result fol-
8 HEWLETT-PACKARD JOURNAL NOVEMBER 1985
© Copr. 1949-1998 Hewlett-Packard Co.
0 . 0 0 . 2 0 . 4 0 . 6 0 . 8 1 . 0
Transverse Displacement (mm across Track)
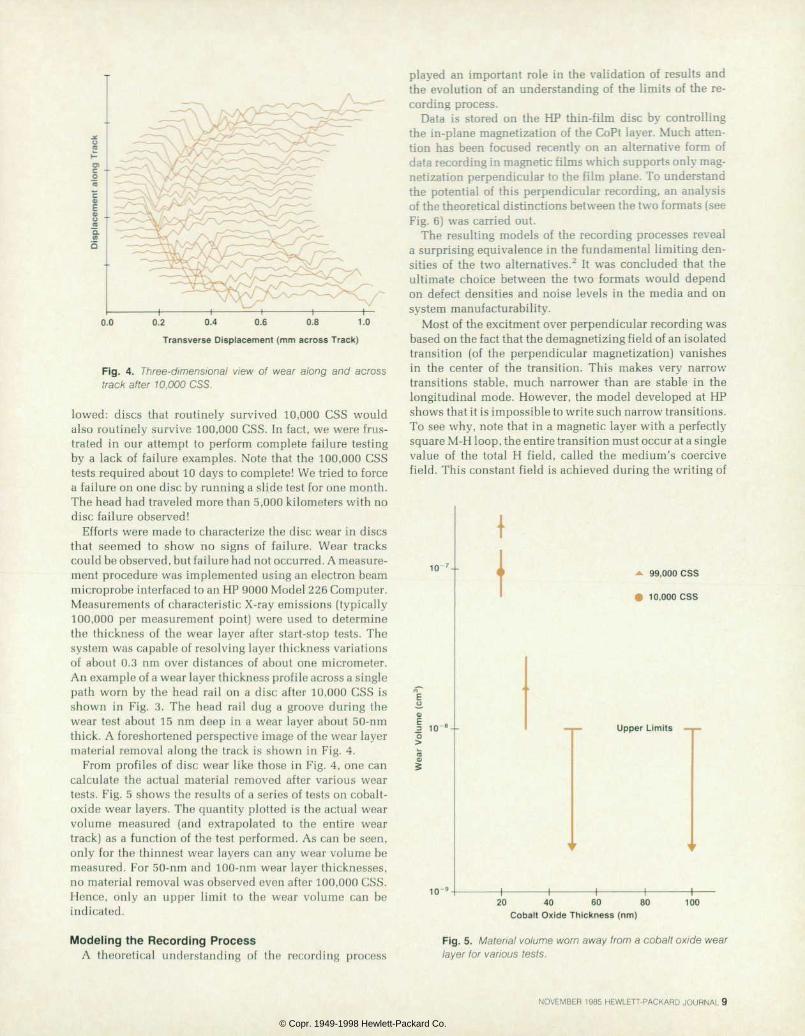
F ig . 4 . Th ree -d imens iona l v i ew o f wea r a l ong and ac ross track after 10,000 CSS.
lowed: discs that routinely survived 10,000 CSS would also routinely survive 100,000 CSS. In fact, we were frus trated in our attempt to perform complete failure testing by a lack of failure examples. Note that the 100,000 CSS tests required about 10 days to complete! We tried to force a failure on one disc by running a slide test for one month. The head had traveled more than 5,000 kilometers with no disc failure observed!
Efforts were made to characterize the disc wear in discs that seemed to show no signs of failure. Wear tracks could be observed, but failure had not occurred. A measure ment procedure was implemented using an electron beam microprobe interfaced to an HP 9000 Model 226 Computer. Measurements of characteristic X-ray emissions (typically 100,000 per measurement point) were used to determine the thickness of the wear layer after start-stop tests. The system was capable of resolving layer thickness variations of about 0.3 nm over distances of about one micrometer. An example of a wear layer thickness profile across a single path worn by the head rail on a disc after 10,000 CSS is shown in Fig. 3. The head rail dug a groove during the wear test about 15 nm deep in a wear layer about 50-nm thick. A foreshortened perspective image of the wear layer material removal along the track is shown in Fig. 4.
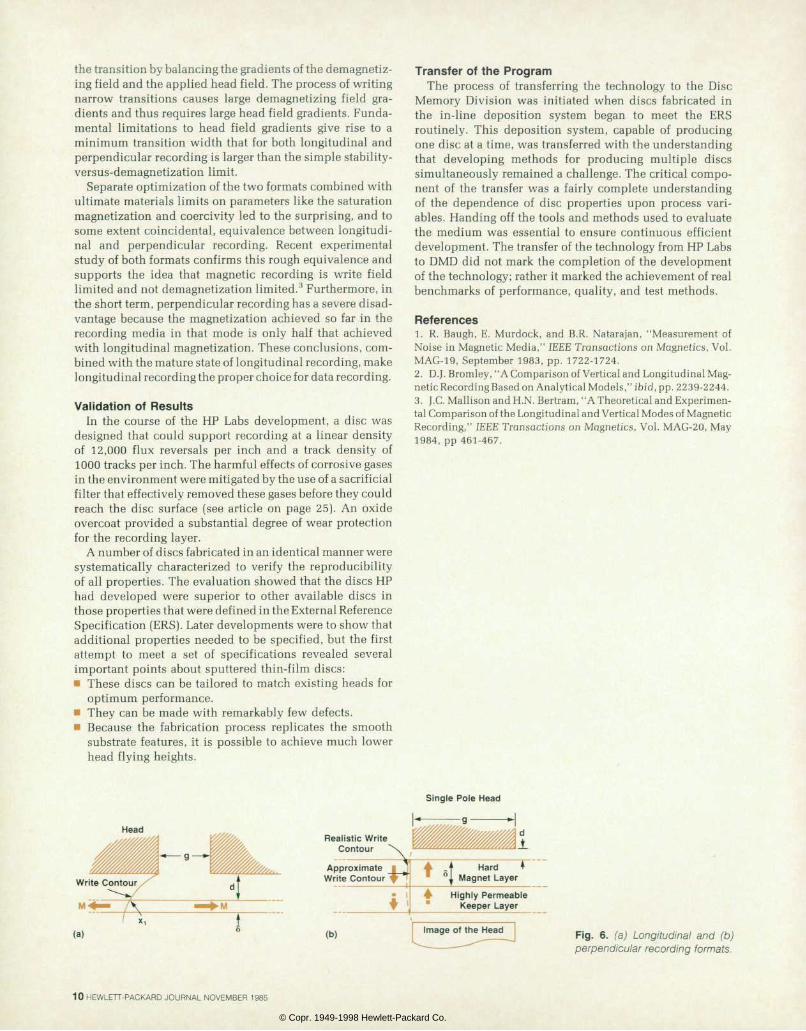
From profiles of disc wear like those in Fig. 4, one can calculate the actual material removed after various wear tests. Fig. 5 shows the results of a series of tests on cobalt- oxide wear layers. The quantity plotted is the actual wear volume measured (and extrapolated to the entire wear track) as a function of the test performed. As can be seen, only for the thinnest wear layers can any wear volume be measured. For 50-nm and 100-nm wear layer thicknesses, no material removal was observed even after 100,000 CSS. Hence, only an upper limit to the wear volume can be indicated.
Model ing the Recording Process A theoretical understanding of the recording process
played an important role in the validation of results and the evolution of an understanding of the limits of the re cording process.
Data is stored on the HP thin-film disc by controlling the in-plane magnetization of the CoPt layer. Much atten tion has been focused recently on an alternative form of data recording in magnetic films which supports only mag netization perpendicular to the film plane. To understand the potential of this perpendicular recording, an analysis of the theoretical distinctions between the two formats (see Fig. 6) was carried out.
The resulting models of the recording processes reveal a surprising equivalence in the fundamental limiting den sities of the two alternatives.2 It was concluded that the ultimate choice between the two formats would depend on defect densities and noise levels in the media and on system manufacturability.
Most of the excitment over perpendicular recording was based on the fact that the demagnetizing field of an isolated transition (of the perpendicular magnetization) vanishes in the center of the transition. This makes very narrow transitions stable, much narrower than are stable in the longitudinal mode. However, the model developed at HP shows that it is impossible to write such narrow transitions. To see why, note that in a magnetic layer with a perfectly square M-H loop, the entire transition must occur at a single value of the total H field, called the medium's coercive field. This constant field is achieved during the writing of
u
I 1 0 - o
I D ' 9
I A 9 9 , 0 0 0 C S S
S 1 0 , 0 0 0 C S S
Upper Limits — ¡—
2 0 4 0 6 0 8 0 Cobalt Oxide Thickness (nm)
100
Fig. 5 . Mater ia l vo lume worn away f rom a cobal t ox ide wear layer for various tests.
NOVEMBER 1985 HEWLETT-PACKARD JOURNAL 9
© Copr. 1949-1998 Hewlett-Packard Co.
the transition by balancing the gradients of the demagnetiz ing field and the applied head field. The process of writing narrow transitions causes large demagnetizing field gra dients and thus requires large head field gradients. Funda mental limitations to head field gradients give rise to a minimum transition width that for both longitudinal and perpendicular recording is larger than the simple stability- versus-demagnetization limit.
Separate optimization of the two formats combined with ultimate materials limits on parameters like the saturation magnetization and coercivity led to the surprising, and to some extent coincidental, equivalence between longitudi nal and perpendicular recording. Recent experimental study of both formats confirms this rough equivalence and supports the idea that magnetic recording is write field limited and not demagnetization limited.3 Furthermore, in the short term, perpendicular recording has a severe disad vantage because the magnetization achieved so far in the recording media in that mode is only half that achieved with longitudinal magnetization. These conclusions, com bined with the mature state of longitudinal recording, make longitudinal recording the proper choice for data recording.
Validation of Results In the course of the HP Labs development, a disc was
designed that could support recording at a linear density of 12,000 flux reversals per inch and a track density of 1000 tracks per inch. The harmful effects of corrosive gases in the environment were mitigated by the use of a sacrificial filter that effectively removed these gases before they could reach the disc surface (see article on page 25). An oxide overcoat provided a substantial degree of wear protection for the recording layer.
A number of discs fabricated in an identical manner were systematically characterized to verify the reproducibility of all properties. The evaluation showed that the discs HP had developed were superior to other available discs in those properties that were defined in the External Reference Specification [ERS). Later developments were to show that additional properties needed to be specified, but the first attempt to meet a set of specifications revealed several important points about sputtered thin-film discs: • These discs can be tailored to match existing heads for
optimum performance. • They can be made with remarkably few defects. • Because the fabrication process replicates the smooth
substrate features, it is possible to achieve much lower head flying heights.
Transfer of the Program The process of transferring the technology to the Disc
Memory Division was initiated when discs fabricated in the in-line deposition system began to meet the ERS routinely. This deposition system, capable of producing one disc at a time, was transferred with the understanding that developing methods for producing multiple discs simultaneously remained a challenge. The critical compo nent of the transfer was a fairly complete understanding of the dependence of disc properties upon process vari ables. Handing off the tools and methods used to evaluate the medium was essential to ensure continuous efficient development. The transfer of the technology from HP Labs to DMD did not mark the completion of the development of the technology; rather it marked the achievement of real benchmarks of performance, quality, and test methods.
References 1. R. Baugh, E. Murdock, and B.R. Natarajan, "Measurement of Noise in Magnetic Media," IEEE Transactions on Magnetics, Vol. MAG-19, September 1983, pp. 1722-1724. 2. D.J. Bromley, "A Comparison of Vertical and Longitudinal Mag netic Recording Based on Analytical Models," ibid, pp. 2239-2244. 3. J.C. MallisonandH.N. Bertram, "A Theoretical and Experimen tal Comparison of the Longitudinal and Vertical Modes of Magnetic Recording," IEEE Transactions on Magnetics, Vol. MAG-20, May 1984, pp 461-467.
Mead Realistic Write
C o n t o u r "
Single Pole Head
Write Contour
(a) (b) Image of the Head F i g . 6 . ( a ) L o n g i t u d i n a l a n d ( b ) perpendicu lar record ing formats.
10 HEWLETT-PACKARD JOURNAL NOVEMBER 1985
© Copr. 1949-1998 Hewlett-Packard Co.
Dynamic Test ing of Thin-Fi lm Magnet ic Recording Discs by John Hodges, Kei th S. Roskel ley. and Dennis R. Edson
DYNAMIC TESTING of parameters is a major func tion required for the development and subsequent production of a disc memory product. The test ap
paratus required for magnetic disc testing must be capable of measuring many electrical and mechanical parameters. The operator interface is of prime importance. Production personnel should be provided with simple, easy-to-use equipment. Design engineers, on the other hand, require test apparatus that has the utmost in flexibility and thoroughness. In either case the measurements must be performed with excellent accuracy and repeatability.
A Modular Approach In the course of developing HP's thin-film magnetic re
cording discs, over a dozen testers were built to measure recording performance in both development and produc tion phases. Developing this equipment was a significant part of the total engineering effort that went into the disc program. We greatly reduced the time and money necessary to build these testers by building each of them out of a handful of functional modules and leveraging the module design across the whole program.
Traditionally at HP's Disc Memory Division tooling de velopment teams have been organized around specific tools, for example, a production disc certifier for a particu lar disc drive. The tool engineers met with the drive design
ers about a year ahead of the anticipated need to set specifi cations for the tool. If a check with outside vendors found no suitable product, design responsibility was turned over to the tool engineering team, which was given freedom over design choices and usually divided the work by dis cipline (electrical, mechanical, and software).
This approach frequently led to redundant design efforts for similar needs. For example, separate teams building research and production testers for a 5-inch disc would each design a test spindle. Requirements would be identi cal, yet the engineers involved would fail to leverage the work of the others because of organizational or communi cation difficulties. In addition, once given the charter to design a tool, engineers often failed to use existing, com mercially available subsystems.
Much of the equipment built in this manner became obsolete earlier than expected. A change in required perfor mance would cause the entire tester to be scrapped and restarted. Tools built to year-old specifications tended to be inflexible in meeting the rapidly changing needs of a technology development program.
At the start of the thin-film disc development program, we recognized that many testers of different specific capa bilities would be needed, yet that there were many similar ities among them. This realization led to the decision to divide the design work by functional units rather than by
HP-IB Series 200 Computer
System Controller
Glide/Burnish or Electrical Test Heads
Disc under Test
Test Bed
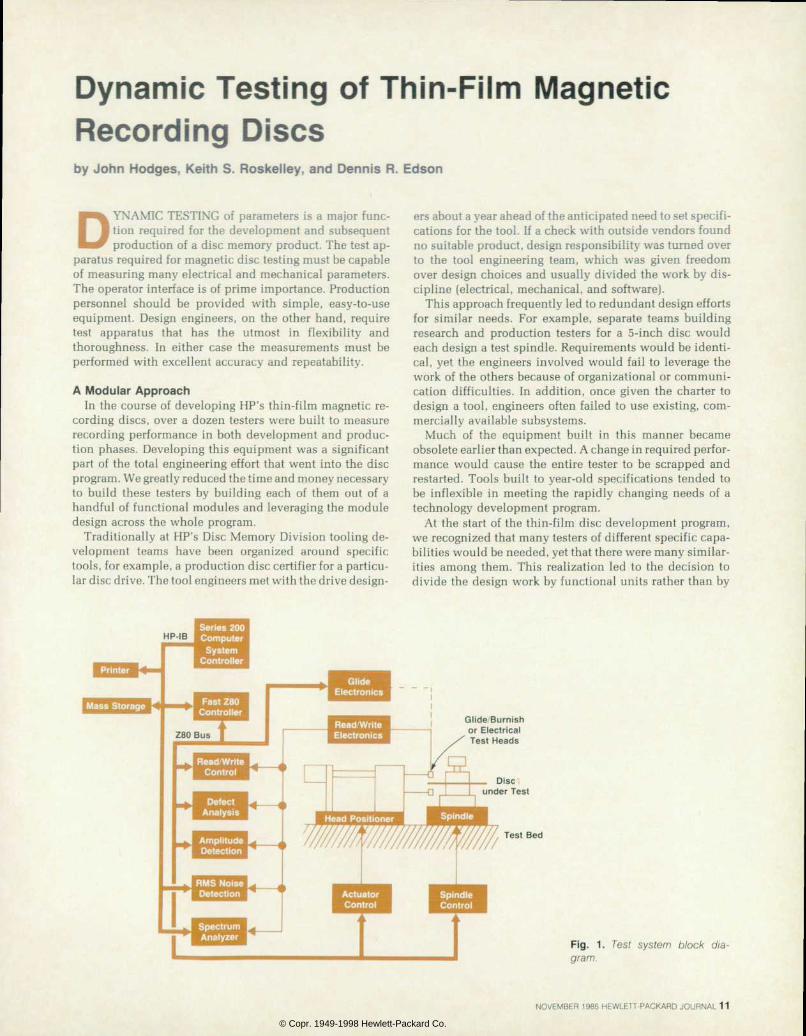
F i g . 1 . 7 e s f s y s t e m b l o c k d i a gram.
N O V E M B E R 1 9 8 5 H E W L E T T - P A C K A R D J O U R N A L 1 1
© Copr. 1949-1998 Hewlett-Packard Co.
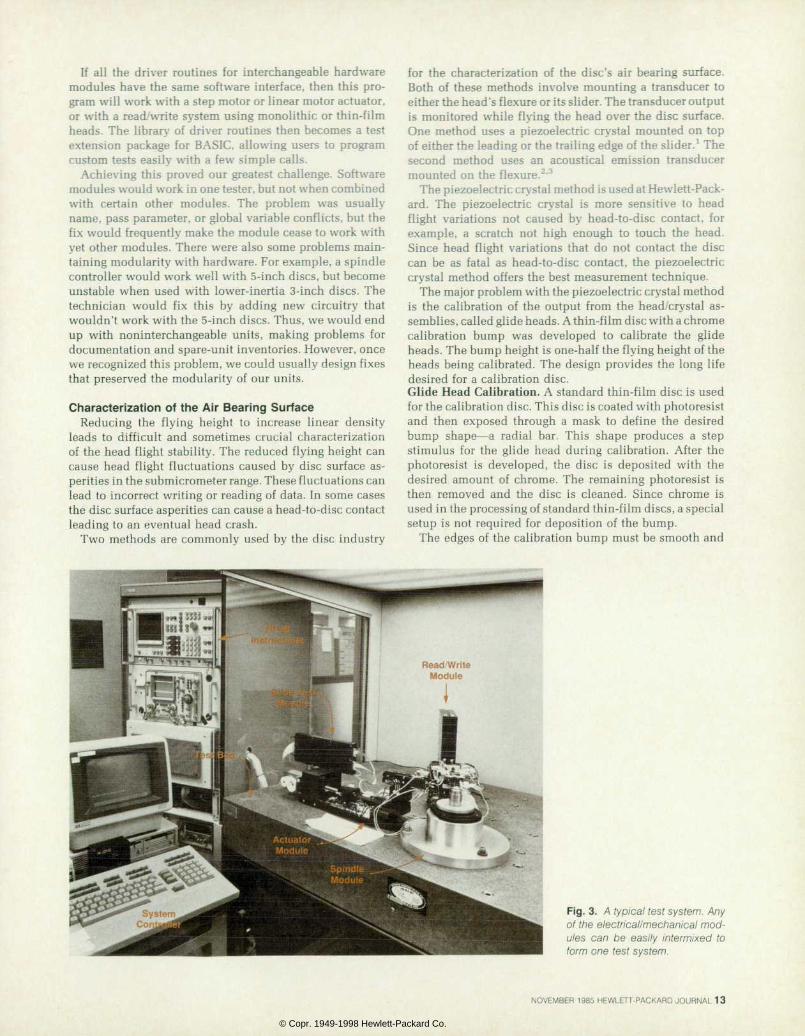
tester application. We divided the disc testing into func tional areas as shown in Fig. 1: disc rotation, head position ing, recording/readback, signal analysis, head flight dynamics measurement, and control. We designed one or more solutions for each of these areas, and defined simple interfaces that allowed the modules to be combined easily into a variety of configurations.
We found numerous advantages to this approach. Primar ily, If of the finished tool was greatly enhanced. If a special experiment called for a second head and read/ write channel on a tester, it could be added with no mod ification to the existing modules. If requirements for read- back signal/noise performance became tighter, the read amplifier could easily be replaced without changing any thing else. Engineering time could be focused on improving the weak unit.
Each module, as it was designed, was treated as a separate product, with a separate tool number, documentation pack age, and specification sheet. Each module, once designed, became part of our catalog of solutions that test engineers could order by tool number.
Fewer designs, each used more widely, lead to savings in several areas. Higher build volumes reduce unit costs. We could predict the needs of several testers and combine part build orders, allowing use of more automated fabrica tion methods. Document preparation work was also re duced. We developed a documentation system that allowed the document package for a tester to be composed of the document packages of its component modules, with cross- references so document revisions could be distributed to all users. Maintenance and operator personnel had fewer systems to learn, reducing training time. It became feasible to keep modules as spares, allowing rapid servicing by swapping out defective modules.
Over time we developed a number of interchangeable sets of functionally equivalent subsystems, optimized around different parameters. For example, we had a low- cost spindle, a high-performance air-bearing spindle, a high-acceleration spindle, and one designed for smooth operation at low speed. Any of these could be installed on any tester in a few minutes without modification. We were able to build an inventory of tester modules, which could be used for maintenance spares, enhancing existing testers, or building new ones. Volume savings on build costs made keeping this inventory inexpensive. In one case, we were able to assemble and use a new tester two weeks after a problem with the disc created a special need for it.
Another goal of the overall system design was to maximize use of commercially available subsystems, spe cifically HP-IB (IEEE 488) instrumentation. To that end, we used HP-IB protocol to interface the test control com puter to all of our specialized test circuitry. This kept the system architecture unified and test sequencing programs simple.
Methods of Implementat ion Achieving these advantages required forethought in es
tablishing interfaces between modules, and discipline in adhering to them throughout the program. The interfaces had to be simple enough not to add complexity to each module, yet general enough not to restrict expandability.
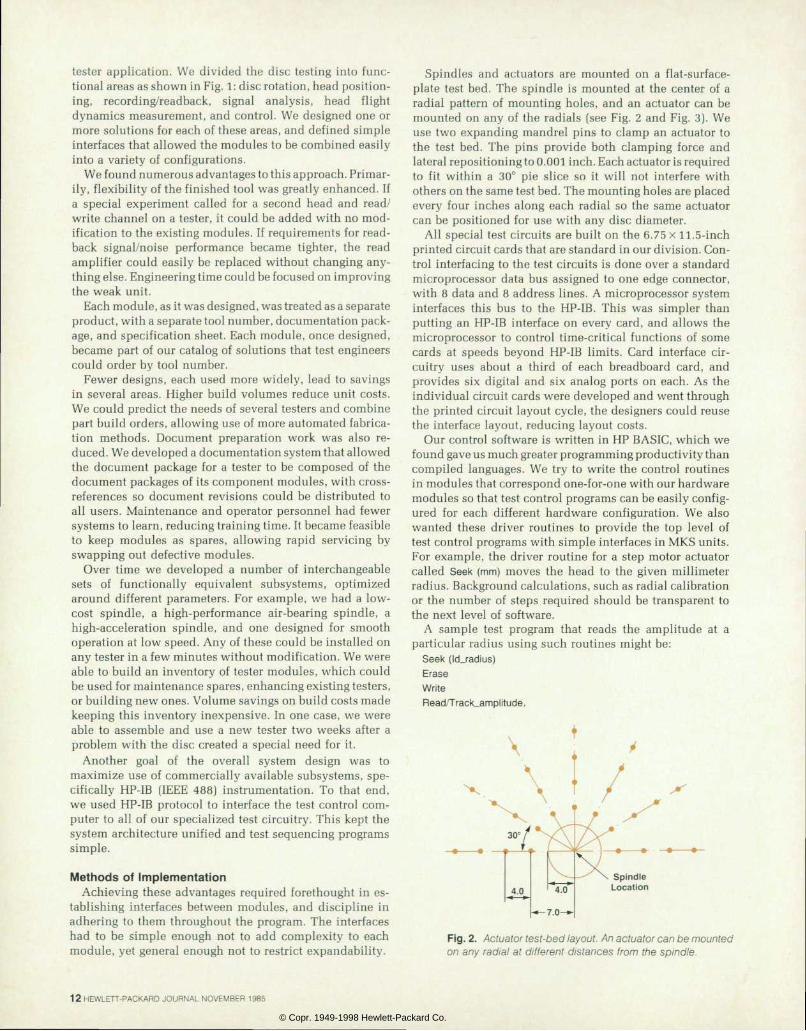
Spindles and actuators are mounted on a flat-surface- plate test bed. The spindle is mounted at the center of a radial pattern of mounting holes, and an actuator can be mounted on any of the radials (see Fig. 2 and Fig. 3). We use two expanding mandrel pins to clamp an actuator to the test bed. The pins provide both clamping force and lateral repositioning to 0.001 inch. Each actuator is required to fit within a 30° pie slice so it will not interfere with others on the same test bed. The mounting holes are placed every four inches along each radial so the same actuator can be positioned for use with any disc diameter.
All special test circuits are built on the 6.75 x 11.5-inch printed circuit cards that are standard in our division. Con trol interfacing to the test circuits is done over a standard microprocessor data bus assigned to one edge connector, with 8 data and 8 address lines. A microprocessor system interfaces this bus to the HP-IB. This was simpler than putting an HP-IB interface on every card, and allows the microprocessor to control time-critical functions of some cards at speeds beyond HP-IB limits. Card interface cir cuitry uses about a third of each breadboard card, and provides six digital and six analog ports on each. As the individual circuit cards were developed and went through the printed circuit layout cycle, the designers could reuse the interface layout, reducing layout costs.
Our control software is written in HP BASIC, which we found gave us much greater programming productivity than compiled languages. We try to write the control routines in modules that correspond one-for-one with our hardware modules so that test control programs can be easily config ured for each different hardware configuration. We also wanted these driver routines to provide the top level of test control programs with simple interfaces in MKS units. For example, the driver routine for a step motor actuator called Seek (mm) moves the head to the given millimeter radius. Background calculations, such as radial calibration or the number of steps required should be transparent to the next level of software.
A sample test program that reads the amplitude at a particular radius using such routines might be:
Seek ( I cL rad ius ) E rase W r i t e ReadATrack_amp l i t ude .
Fig. 2. Actuator test-bed layout. An actuator can be mounted on any radia l at d i f ferent d is tances f rom the spindle.
12 HEWLETT-PACKARD JOURNAL NOVEMBER 1985
© Copr. 1949-1998 Hewlett-Packard Co.
If all the driver routines for interchangeable hardware modules have the same software interface, then this pro gram will work with a step motor or linear motor actuator, or with a read/write system using monolithic or thin-film heads. The library of driver routines then becomes a test extension package for BASIC, allowing users to program custom tests easily with a few simple calls.
Achieving this proved our greatest challenge. Software modules would work in one tester, but not when combined with certain other modules. The problem was usually name, pass parameter, or global variable conflicts, but the fix would frequently make the module cease to work with yet other modules. There were also some problems main taining modularity with hardware. For example, a spindle controller would work well with 5-inch discs, but become unstable when used with lower-inertia 3-inch discs. The technician would fix this by adding new circuitry that wouldn't work with the 5-inch discs. Thus, we would end up with noninterchangeable units, making problems for documentation and spare-unit inventories. However, once we recognized this problem, we could usually design fixes that preserved the modularity of our units.
Characterizat ion of the Air Bearing Surface Reducing the flying height to increase linear density
leads to difficult and sometimes crucial characterization of the head flight stability. The reduced flying height can cause head flight fluctuations caused by disc surface as perities in the submicrometer range. These fluctuations can lead to incorrect writing or reading of data. In some cases the disc surface asperities can cause a head-to-disc contact leading to an eventual head crash.
Two methods are commonly used by the disc industry
for the characterization of the disc's air bearing surface. Both of these methods involve mounting a transducer to either the head's flexure or its slider. The transducer output is monitored while flying the head over the disc surface. One method uses a piezoelectric crystal mounted on top of either the leading or the trailing edge of the slider.1 The second method uses an acoustical emission transducer mounted on the flexure.2'3
The piezoelectric crystal method is used at Hewlett-Pack ard. The piezoelectric crystal is more sensitive to head flight variations not caused by head-to-disc contact, for example, a scratch not high enough to touch the head. Since head flight variations that do not contact the disc can be as fatal as head-to-disc contact, the piezoelectric crystal method offers the best measurement technique.
The major problem with the piezoelectric crystal method is the calibration of the output from the head/crystal as semblies, called glide heads. A thin-film disc with a chrome calibration bump was developed to calibrate the glide heads. The bump height is one-half the flying height of the heads being calibrated. The design provides the long life desired for a calibration disc. Glide Head Calibration. A standard thin-film disc is used for the calibration disc. This disc is coated with photoresist and then exposed through a mask to define the desired bump shape — a radial bar. This shape produces a step stimulus for the glide head during calibration. After the photoresist is developed, the disc is deposited with the desired amount of chrome. The remaining photoresist is then removed and the disc is cleaned. Since chrome is used in the processing of standard thin-film discs, a special setup is not required for deposition of the bump.
The edges of the calibration bump must be smooth and
Fig. 3 . A typ ica l tes t sys tem. Any o f the e lec t r i ca l /mechan ica l mod u les can be eas i l y i n te rm ixed to form one test system.
NOVEMBER 1985 HEWLETT-PACKARD JOURNAL 1 3
© Copr. 1949-1998 Hewlett-Packard Co.
free from chips or flaking. A bump without smooth edges can chip. Chipping can ruin either the glide head or the calibration disc and usually both. Rough edges on the bump will also collect debris and make cleaning of the disc im possible.
During normal glide head calibration, debris collects at the leading edge of the bump on the calibration disc. This requires cleaning at regular intervals, or when evidence of debris is indicated by the glide head output (refer to Fig. 4). To remove the debris, the bump is lightly scrubbed using a lint-free cloth and acetone. The disc is then cleaned ultrasonically in a bath of acetone to remove any residue.
The glide heads are calibrated by flying the heads at a specified radius over the bump on the calibration disc. The maximum output of the glide head as it flies over the cali bration bump is recorded. This measurement is repeated 50 times. The 50 measurements are then averaged to deter mine the mean output of the glide head. The glide head can fail calibration for two reasons: • Head output too high or too low • A large standard deviation of the 50 measurements. Glide Electronics. To detect large head flight variations and head-to-disc contact, the glide electronics system is tuned to amplify the natural resonant frequencies of the
Brass Shim Stock
— Piezoelectric Crystal
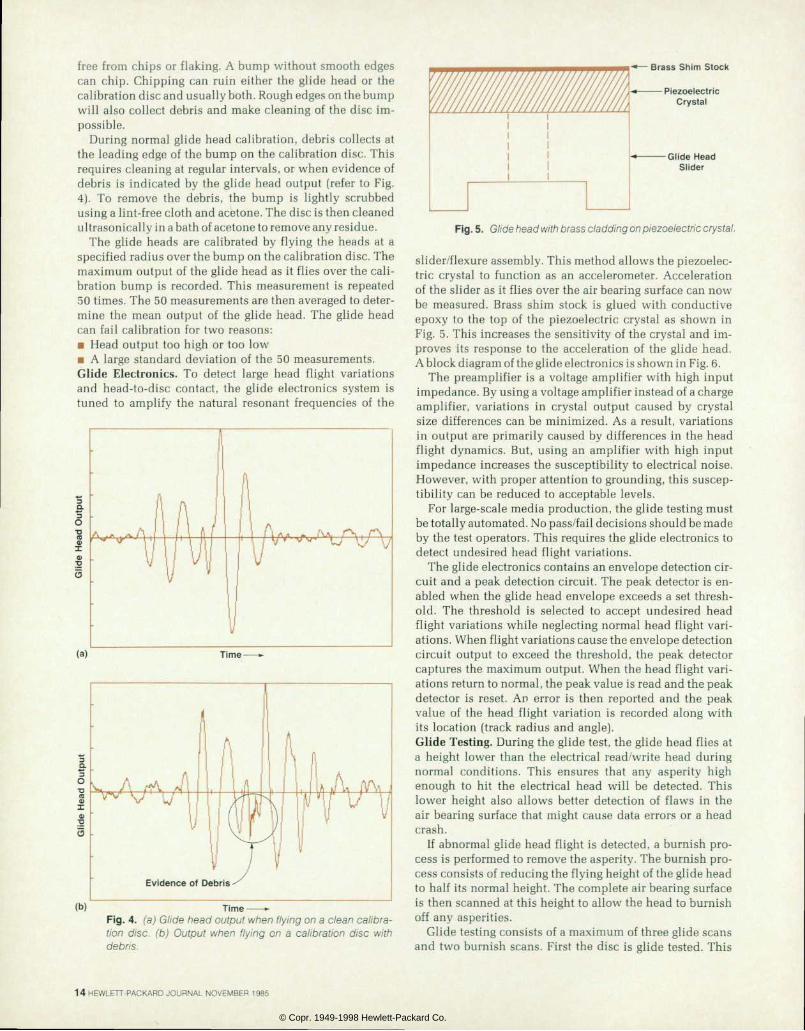
( b ) T i m e - Fig. 4 . (a) Gl ide head output when f ly ing on a c lean ca l ibra t ion d isc , (b ) Outpu t when f l y ing on a ca l ib ra t ion d isc w i th debris.
Fig. 5. Glide head with brass cladding on piezoelectric crystal.
slider/flexure assembly. This method allows the piezoelec tric crystal to function as an accelerometer. Acceleration of the slider as it flies over the air bearing surface can now be measured. Brass shim stock is glued with conductive epoxy to the top of the piezoelectric crystal as shown in Fig. 5. This increases the sensitivity of the crystal and im proves its response to the acceleration of the glide head. A block diagram of the glide electronics is shown in Fig. 6.
The preamplifier is a voltage amplifier with high input impedance. By using a voltage amplifier instead of a charge amplifier, variations in crystal output caused by crystal size differences can be minimized. As a result, variations in output are primarily caused by differences in the head flight dynamics. But, using an amplifier with high input impedance increases the susceptibility to electrical noise. However, with proper attention to grounding, this suscep tibility can be reduced to acceptable levels.
For large-scale media production, the glide testing must be totally automated. No pass/fail decisions should be made by the to operators. This requires the glide electronics to detect undesired head flight variations.
The glide electronics contains an envelope detection cir cuit and a peak detection circuit. The peak detector is en abled when the glide head envelope exceeds a set thresh old. The threshold is selected to accept undesired head flight variations while neglecting normal head flight vari ations. When flight variations cause the envelope detection circuit output to exceed the threshold, the peak detector captures the maximum output. When the head flight vari ations return to normal, the peak value is read and the peak detector is reset. An error is then reported and the peak value of the head flight variation is recorded along with its location (track radius and angle). Glide Testing. During the glide test, the glide head flies at a height lower than the electrical read/write head during normal conditions. This ensures that any asperity high enough to hit the electrical head will be detected. This lower height also allows better detection of flaws in the air bearing surface that might cause data errors or a head crash.
If abnormal glide head flight is detected, a burnish pro cess is performed to remove the asperity. The burnish pro cess consists of reducing the flying height of the glide head to half its normal height. The complete air bearing surface is then scanned at this height to allow the head to burnish off any asperities.
Glide testing consists of a maximum of three glide scans and two burnish scans. First the disc is glide tested. This
14 HEWLETT-PACKARD JOURNAL NOVEMBER 1985
© Copr. 1949-1998 Hewlett-Packard Co.
Glide Preamp
r T Differential Amplifier
Data and Control
Glide * H i t
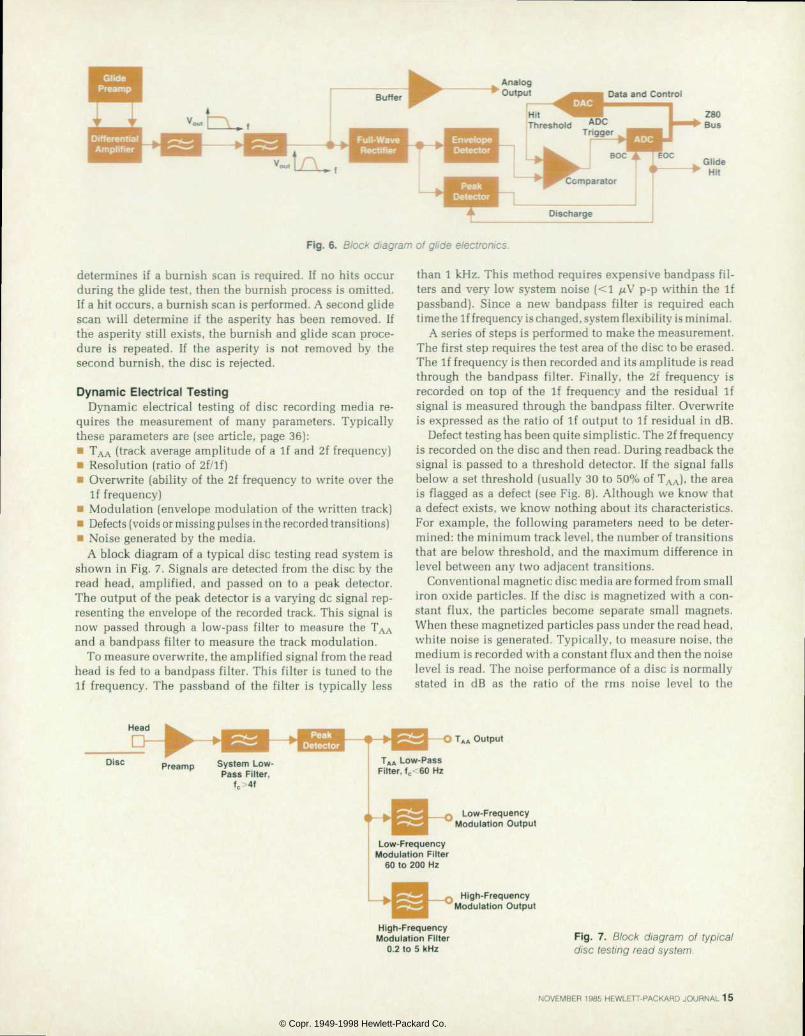
Fig. 6 . B lock d iagram of g l ide e lec t ron ics .
determines if a burnish scan is required. If no hits occur during the glide test, then the burnish process is omitted. If a hit occurs, a burnish scan is performed. A second glide scan will determine if the asperity has been removed. If the asperity still exists, the burnish and glide scan proce dure is repeated. If the asperity is not removed by the second burnish, the disc is rejected.
Dynamic Electr ical Testing Dynamic electrical testing of disc recording media re
quires the measurement of many parameters. Typically these parameters are (see article, page 36): • TAA (track average amplitude of a If and 2f frequency) • Resolution (ratio of 2f/lf) • Overwrite (ability of the 2f frequency to write over the
If frequency) • Modulation (envelope modulation of the written track) • Defects (voids or missing pulses in the recorded transitions) • Noise generated by the media.
A block diagram of a typical disc testing read system is shown in Fig. 7. Signals are detected from the disc by the read head, amplified, and passed on to a peak detector. The output of the peak detector is a varying dc signal rep resenting the envelope of the recorded track. This signal is now passed through a low-pass filter to measure the TAA and a bandpass filter to measure the track modulation.
To measure overwrite, the amplified signal from the read head is fed to a bandpass filter. This filter is tuned to the If frequency. The passband of the filter is typically less
than 1 kHz. This method requires expensive bandpass fil ters and very low system noise (<1 /xV p-p within the If passband). Since a new bandpass filter is required each time the If frequency is changed, system flexibility is minimal.
A series of steps is performed to make the measurement. The first step requires the test area of the disc to be erased. The If frequency is then recorded and its amplitude is read through the bandpass filter. Finally, the 2f frequency is recorded on top of the If frequency and the residual If signal is measured through the bandpass filter. Overwrite is expressed as the ratio of If output to If residual in dB.
Defect testing has been quite simplistic. The 2f frequency is recorded on the disc and then read. During readback the signal is passed to a threshold detector. If the signal falls below a set threshold (usually 30 to 50% of TAA), the area is flagged as a defect (see Fig. 8). Although we know that a defect exists, we know nothing about its characteristics. For example, the following parameters need to be deter mined: the minimum track level, the number of transitions that are below threshold, and the maximum difference in level between any two adjacent transitions.
Conventional magnetic disc media are formed from small iron oxide particles. If the disc is magnetized with a con stant flux, the particles become separate small magnets. When these magnetized particles pass under the read head, white noise is generated. Typically, to measure noise, the medium is recorded with a constant flux and then the noise level is read. The noise performance of a disc is normally stated in dB as the ratio of the rms noise level to the
Head
Disc Preamp System Low- Pass Filter,
fc -4f
TAA Low-Pass Fi l ter , fc 60 Hz
TAA Output
Low-Frequency Modulation Output
Low-Frequency Modulation Filter
60 to 200 Hz
High-Frequency Modulation Output
High-Frequency Modulation Filter
0.2 to 5 kHz F i g . 7 . B l o c k d i a g r a m o f t y p i c a l d isc test ing read system.
NOVEMBER 1985 HEWLETT-PACKARD JOURNAL 15
© Copr. 1949-1998 Hewlett-Packard Co.
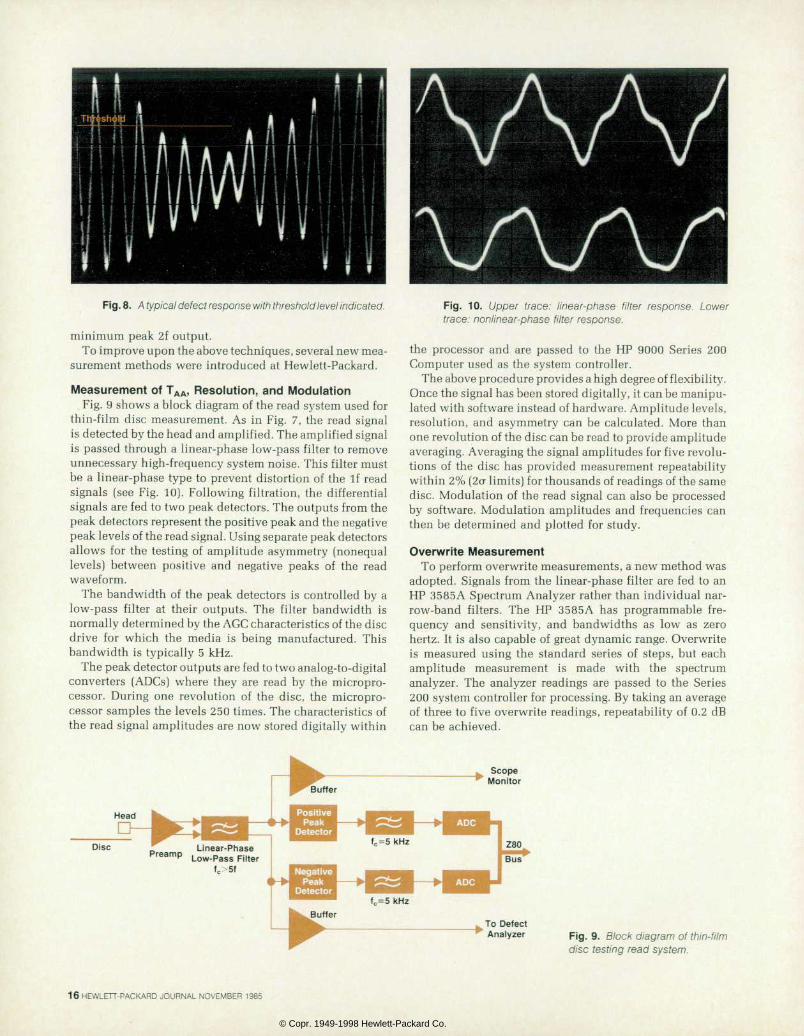
Fig. 8. A typical defect response with threshold level indicated.
minimum peak 2f output. To improve upon the above techniques, several new mea
surement methods were introduced at Hewlett-Packard.
Measurement of TAA, Resolution, and Modulat ion Fig. 9 shows a block diagram of the read system used for
thin-film disc measurement. As in Fig. 7, the read signal is detected by the head and amplified. The amplified signal is passed through a linear-phase low-pass filter to remove unnecessary high-frequency system noise. This filter must be a linear-phase type to prevent distortion of the If read signals (see Fig. 10). Following filtration, the differential signals are fed to two peak detectors. The outputs from the peak detectors represent the positive peak and the negative peak levels of the read signal. Using separate peak detectors allows for the testing of amplitude asymmetry (nonequal levels) between positive and negative peaks of the read waveform.
The bandwidth of the peak detectors is controlled by a low-pass filter at their outputs. The filter bandwidth is normally determined by the AGC characteristics of the disc drive for which the media is being manufactured. This bandwidth is typically 5 kHz.
The peak detector outputs are fed to two analog-to-digital converters (ADCs) where they are read by the micropro cessor. During one revolution of the disc, the micropro cessor samples the levels 250 times. The characteristics of the read signal amplitudes are now stored digitally within
F i g . 1 0 . U p p e r t r a c e : l i n e a r - p h a s e f i l t e r r e s p o n s e . L o w e r trace: nonl inear-phase f i l ter response.
the processor and are passed to the HP 9000 Series 200 Computer used as the system controller.
The above procedure provides a high degree of flexibility. Once the signal has been stored digitally, it can be manipu lated with software instead of hardware. Amplitude levels, resolution, and asymmetry can be calculated. More than one revolution of the disc can be read to provide amplitude averaging. Averaging the signal amplitudes for five revolu tions of the disc has provided measurement repeatability within 2% (2cr limits) for thousands of readings of the same disc. Modulation of the read signal can also be processed by software. Modulation amplitudes and frequencies can then be determined and plotted for study.
Overwri te Measurement To perform overwrite measurements, a new method was
adopted. Signals from the linear-phase filter are fed to an HP 3585A Spectrum Analyzer rather than individual nar row-band filters. The HP 3585A has programmable fre quency and sensitivity, and bandwidths as low as zero hertz. It is also capable of great dynamic range. Overwrite is measured using the standard series of steps, but each amplitude measurement is made with the spectrum analyzer. The analyzer readings are passed to the Series 200 system controller for processing. By taking an average of three to five overwrite readings, repeatability of 0.2 dB can be achieved.
Scope Monitor
Head
To Defect Analyzer Fig. 9 . B lock d iagram of th in- f i lm
disc test ing read system.
16 HEWLETT-PACKARD JOURNAL NOVEMBER 1985
© Copr. 1949-1998 Hewlett-Packard Co.
: F 2 0 . 0 d B n H f l R K E R 1 6 6 8 0 I
1 0 d B / D I V R R N C E 2 0 - 0 d B n - 6 1 . 1 d B n
E F 2 0 . 0 d B n H f l R K E R 1 6 6 8 0 0 0 0 - 0
1 0 d B / D I V R R N C E 2 0 . 0 d B n - 4 9 - 7 d B n
..••¡Ã
CENTER 10 000 000.0 Hz SPRN 20 000 000-0 Hz
R B H 1 0 K H z V 8 H 1 K H z S T ^ . 4 S E C
CENTER 10 000 000.0 Hz SPUN 20 000 000.0 Hz ..„.. . „., ST 6.4 SEC
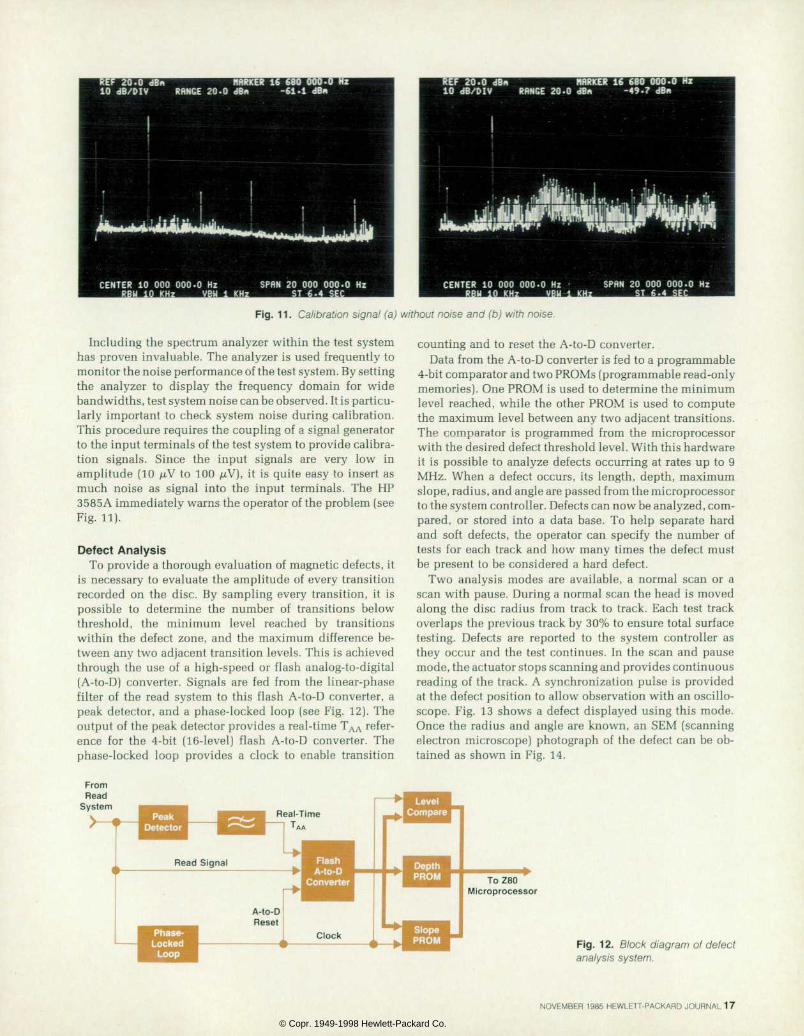
Fig. 1 1 . Cal ibrat ion signal (a) without noise and (b) with noise.
Including the spectrum analyzer within the test system has proven invaluable. The analyzer is used frequently to monitor the noise performance of the test system. By setting the analyzer to display the frequency domain for wide bandwidths, test system noise can be observed. It is particu larly important to check system noise during calibration. This procedure requires the coupling of a signal generator to the input terminals of the test system to provide calibra tion signals. Since the input signals are very low in amplitude (10 ¿uV to 100 /xV), it is quite easy to insert as much noise as signal into the input terminals. The HP 3585A immediately warns the operator of the problem (see Fig. 11).
Defect Analysis To provide a thorough evaluation of magnetic defects, it
is necessary to evaluate the amplitude of every transition recorded on the disc. By sampling every transition, it is possible to determine the number of transitions below threshold, the minimum level reached by transitions within the defect zone, and the maximum difference be tween any two adjacent transition levels. This is achieved through the use of a high-speed or flash analog-to-digital (A-to-D) converter. Signals are fed from the linear-phase filter of the read system to this flash A-to-D converter, a peak detector, and a phase-locked loop (see Fig. 12). The output of the peak detector provides a real-time TAA refer ence for the 4-bit (16-level) flash A-to-D converter. The phase-locked loop provides a clock to enable transition
counting and to reset the A-to-D converter. Data from the A-to-D converter is fed to a programmable
4-bit comparator and two PROMs (programmable read-only memories). One PROM is used to determine the minimum level reached, while the other PROM is used to compute the maximum level between any two adjacent transitions. The comparator is programmed from the microprocessor with the desired defect threshold level. With this hardware it is possible to analyze defects occurring at rates up to 9 MHz. When a defect occurs, its length, depth, maximum slope, radius, and angle are passed from the microprocessor to the system controller. Defects can now be analyzed, com pared, or stored into a data base. To help separate hard and soft defects, the operator can specify the number of tests for each track and how many times the defect must be present to be considered a hard defect.
Two analysis modes are available, a normal scan or a scan with pause. During a normal scan the head is moved along the disc radius from track to track. Each test track overlaps the previous track by 30% to ensure total surface testing. Defects are reported to the system controller as they occur and the test continues. In the scan and pause mode, the actuator stops scanning and provides continuous reading of the track. A synchronization pulse is provided at the defect position to allow observation with an oscillo scope. Fig. 13 shows a defect displayed using this mode. Once the radius and angle are known, an SEM (scanning electron microscope) photograph of the defect can be ob tained as shown in Fig. 14.
F ig . 12 . B lock d iag ram o f de fec t analysis system.
NOVEMBER 1985 HEWLETT-PACKARD JOURNAL 17
© Copr. 1949-1998 Hewlett-Packard Co.
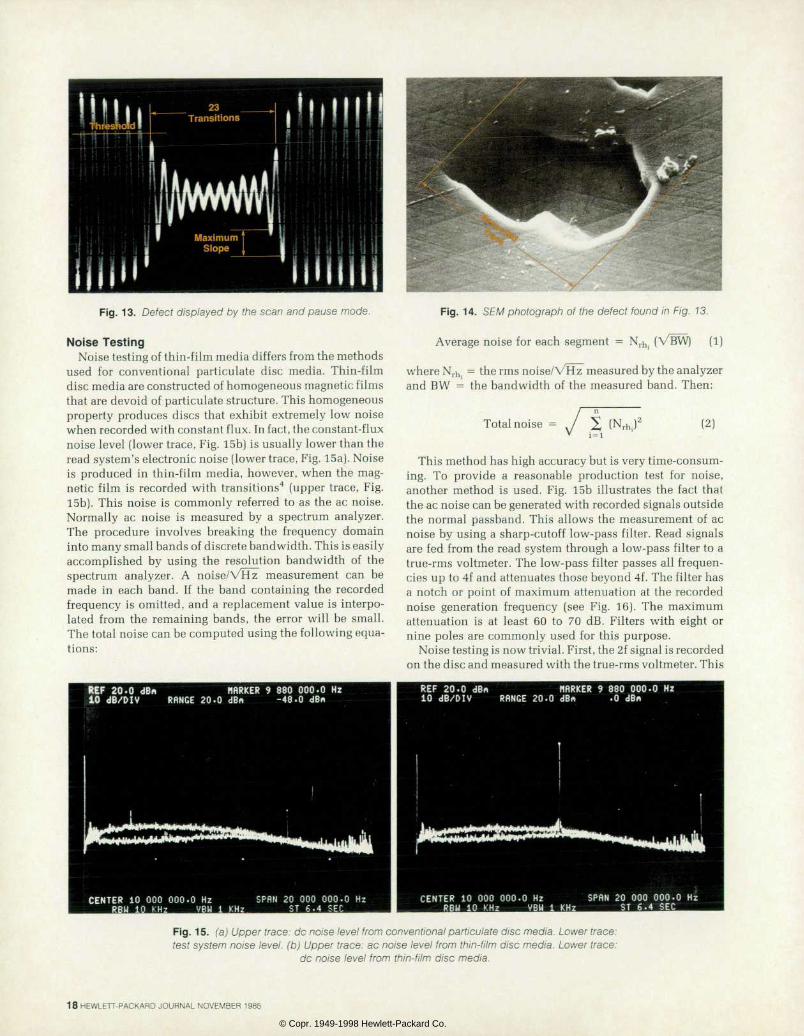
Fig . 13 . Defec t d isp layed by the scan and pause mode.
Noise Testing Noise testing of thin-film media differs from the methods
used for conventional particulate disc media. Thin-film disc media are constructed of homogeneous magnetic films that are devoid of particulate structure. This homogeneous property produces discs that exhibit extremely low noise when recorded with constant flux. In fact, the constant-flux noise level (lower trace, Fig. 15b) is usually lower than the read system's electronic noise (lower trace, Fig. 15a). Noise is produced in thin-film media, however, when the mag netic film is recorded with transitions4 (upper trace, Fig. 15b). This noise is commonly referred to as the ac noise. Normally ac noise is measured by a spectrum analyzer. The procedure involves breaking the frequency domain into many small bands of discrete bandwidth. This is easily accomplished by using the resolution bandwidth of the spectrum analyzer. A noise/VHz measurement can be made in each band. If the band containing the recorded frequency is omitted, and a replacement value is interpo lated from the remaining bands, the error will be small. The total noise can be computed using the following equa tions:
E F 2 0 . 0 d B f l H R R K E R 9 8 8 0 0 0 0 - 0 H z ' d B / D I V R f l N G E 2 0 . 0 d B n - 4 8 . 0 d B n
Fig. 14. SEM photograph of the defect found in F ig . 13.
A v e r a g e n o i s e f o r e a c h s e g m e n t = N r h . ( V B W ) ( 1 )
where Nrh. = the rms noise/ Vl·l z measured by the analyzer and BW = the bandwidth of the measured band. Then:
Total noise = (Nrhl) (2)
This method has high accuracy but is very time-consum ing. To provide a reasonable production test for noise, another method is used. Fig. 15b illustrates the fact that the ac noise can be generated with recorded signals outside the normal passband. This allows the measurement of ac noise by using a sharp-cutoff low-pass filter. Read signals are fed from the read system through a low-pass filter to a true-rms voltmeter. The low-pass filter passes all frequen cies up to 4f and attenuates those beyond 4f. The filter has a notch or point of maximum attenuation at the recorded noise generation frequency (see Fig. 16). The maximum attenuation is at least 60 to 70 dB. Filters with eight or nine poles are commonly used for this purpose.
Noise testing is now trivial. First, the 2f signal is recorded on the disc and measured with the true-rms voltmeter. This
R E F 2 0 . 0 d B f l H R R K E R 9 8 8 0 0 0 0 . 0 H z
1 0 d B / D I V R f i N G E 2 0 . 0 d B n . 0 d B f l
CENTER 10 000 000.0 Hz
R B U 1 0 K H z V B W 1 K H z
SPRN 20 000 000.0 Hz
S T 6 . 4 S E C
C E N T E R 1 0 0 0 0 0 0 0 . 0 H z S P f l N 2 0 0 0 0 0 0 0 . 0 H z
R B U 1 0 K H z V B H 1 K H z S T 6 - 4 S E C
Fig. 1 5. (a) Upper t race: dc noise level f rom convent ional part iculate disc media. Lower trace: test thin-f i lm noise level, (b) Upper trace: ac noise level f rom thin-f i lm disc media. Lower trace:
dc noise level f rom th in- f i lm disc media.
18 HEWLETT-PACKARD JOURNAL NOVEMBER 1985
© Copr. 1949-1998 Hewlett-Packard Co.
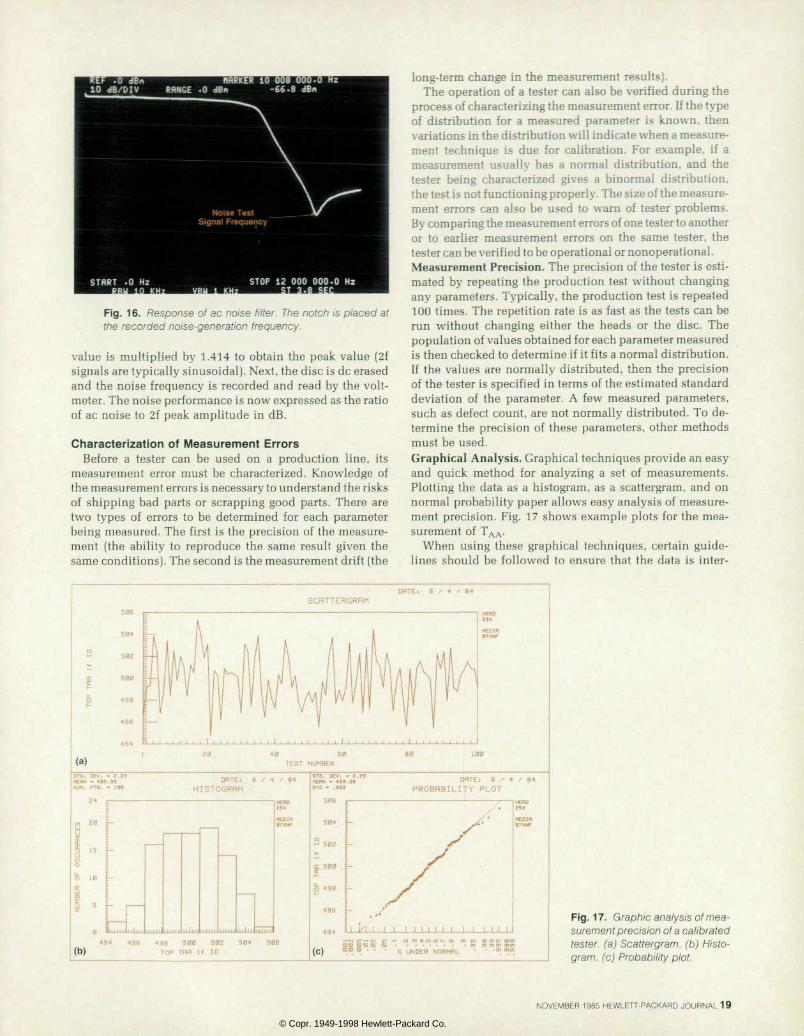
Fig . 16. Response o f ac no ise f i l te r . The notch is p laced a t the recorded noise-generat ion f requency.
value is multiplied by 1.414 to obtain the peak value (2f signals are typically sinusoidal). Next, the disc is dc erased and the noise frequency is recorded and read by the volt meter. The noise performance is now expressed as the ratio of ac noise to 2f peak amplitude in dB.
Character izat ion of Measurement Errors Before a tester can be used on a production line, its
measurement error must be characterized. Knowledge of the measurement errors is necessary to understand the risks of shipping bad parts or scrapping good parts. There are two types of errors to be determined for each parameter being measured. The first is the precision of the measure ment (the ability to reproduce the same result given the same conditions). The second is the measurement drift (the
long-term change in the measurement results). The operation of a tester can also be verified during the
process of characterizing the measurement error. If the type of distribution for a measured parameter is known, then variations in the distribution will indicate when a measure ment technique is due for calibration. For example, if a measurement usually has a normal distribution, and the tester being characterized gives a binormal distribution, the test is not functioning properly. The size of the measure ment errors can also be used to warn of tester problems. By comparing the measurement errors of one tester to another or to earlier measurement errors on the same tester, the tester can be verified to be operational or nonoperational. Measurement Precision. The precision of the tester is esti mated by repeating the production test without changing any parameters. Typically, the production test is repeated 100 times. The repetition rate is as fast as the tests can be run without changing either the heads or the disc. The population of values obtained for each parameter measured is then checked to determine if it fits a normal distribution. If the values are normally distributed, then the precision of the tester is specified in terms of the estimated standard deviation of the parameter. A few measured parameters, such as defect count, are not normally distributed. To de termine the precision of these parameters, other methods must be used. Graphical Analysis. Graphical techniques provide an easy and quick method for analyzing a set of measurements. Plotting the data as a histogram, as a scattergram, and on normal probability paper allows easy analysis of measure ment precision. Fig. 17 shows example plots for the mea surement of TAA.
When using these graphical techniques, certain guide lines should be followed to ensure that the data is inter-
SCRTTERGRHM
( a ) 4 0 6 0
T E S T N U M B E R
S T D . D E V . - 2 . 2 H E R N - 4 9 9 . 9 8 N U M . P T S . - 1 0
DflTE: H I S T O G R R M
(b) 4 9 9 5 0 0 5 0 2
T O P T H H I f I D
S T D . D E V . - 2 . 2 9 M E R N - 4 9 9 . 9 8 f i - 2 - . 9 9 3
D f l T E : 6 X 4 X 8 4 P R O B f l B I L I T Y P L O T
: 50a
; 4 9 B -
4 9 6 -
4 9 4 I ] / \ I I I I I I I I I
( C )
â € ” c v j m i - i n u j r ^ t D m i n m m i n c o o l ' 4 U N D E R N O R M f l L ' â € ¢ - m m m
Fig . 17 . Graph ic ana lys is o f mea surement precision of a cal ibrated tes ter , (a) Scat tergram. (b) H is to gram, (c) Probabi l i ty plot .
NOVEMBER 1985 HEWLETT-PACKARD JOURNAL 19
© Copr. 1949-1998 Hewlett-Packard Co.
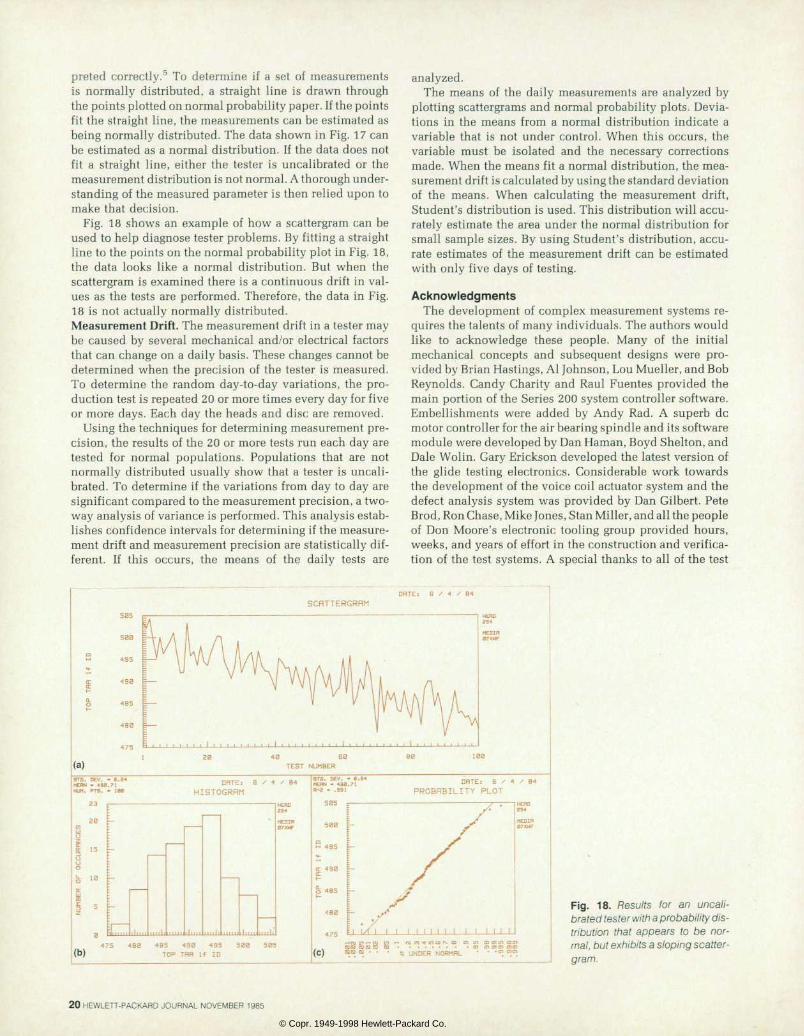
preted correctly.5 To determine if a set of measurements is normally distributed, a straight line is drawn through the points plotted on normal probability paper. If the points fit the straight line, the measurements can be estimated as being normally distributed. The data shown in Fig. 17 can be estimated as a normal distribution. If the data does not fit a straight line, either the tester is uncalibrated or the measurement distribution is not normal. A thorough under standing of the measured parameter is then relied upon to make that decision.
Fig. 18 shows an example of how a scattergram can be used to help diagnose tester problems. By fitting a straight line to the points on the normal probability plot in Fig. 18, the data looks like a normal distribution. But when the scattergram is examined there is a continuous drift in val ues as the tests are performed. Therefore, the data in Fig. 18 is not actually normally distributed. Measurement Drift. The measurement drift in a tester may be caused by several mechanical and/or electrical factors that can change on a daily basis. These changes cannot be determined when the precision of the tester is measured. To determine the random day-to-day variations, the pro duction test is repeated 20 or more times every day for five or more days. Each day the heads and disc are removed.
Using the techniques for determining measurement pre cision, the results of the 20 or more tests run each day are tested for normal populations. Populations that are not normally distributed usually show that a tester is uncali brated. To determine if the variations from day to day are significant compared to the measurement precision, a two- way analysis of variance is performed. This analysis estab lishes confidence intervals for determining if the measure ment drift and measurement precision are statistically dif ferent. If this occurs, the means of the daily tests are
analyzed. The means of the daily measurements are analyzed by
plotting scattergrams and normal probability plots. Devia tions in the means from a normal distribution indicate a variable that is not under control. When this occurs, the variable must be isolated and the necessary corrections made. When the means fit a normal distribution, the mea surement drift is calculated by using the standard deviation of the means. When calculating the measurement drift, Student's distribution is used. This distribution will accu rately estimate the area under the normal distribution for small sample sizes. By using Student's distribution, accu rate estimates of the measurement drift can be estimated with only five days of testing.
A c k n o w l e d g m e n t s The development of complex measurement systems re
quires the talents of many individuals. The authors would like to acknowledge these people. Many of the initial mechanical concepts and subsequent designs were pro vided by Brian Hastings, Al Johnson, Lou Mueller, and Bob Reynolds. Candy Charity and Raul Fuentes provided the main portion of the Series 200 system controller software. Embellishments were added by Andy Rad. A superb dc motor controller for the air bearing spindle and its software module were developed by Dan Haman, Boyd Shelton, and Dale Wolin. Gary Erickson developed the latest version of the glide testing electronics. Considerable work towards the development of the voice coil actuator system and the defect analysis system was provided by Dan Gilbert. Pete Brod, Ron Chase, Mike Jones, Stan Miller, and all the people of Don Moore's electronic tooling group provided hours, weeks, and years of effort in the construction and verifica tion of the test systems. A special thanks to all of the test
S C R T T E R G R f l M 5B5
see
495
490
465
4 0 6 0 T E S T N U M B E R
DEV. - 6.24 - 490.71 P T S . - t e a
DHTE: S HISTOGRHM
23
20
(b) 4 8 5 4 9 0 4 9 5
TOP TRfl If ID
S T D . D E V . - 6 . 2 4 HEf lN - 498 .71
- . 9 9 1
D R T E : 6 /
P R O B R B I L I T Y P L O T
S H 5 j s B K J ( c ) I 3 . t s l . s â € ¢ - - ^ U N D E R N O R M R L
F i g . 1 8 . R e s u l t s f o r a n u n c a l i brated tester with a probabil i ty dis t r i b u t i o n t h a t a p p e a r s t o b e n o r mal, but exhibi ts a sloping scatter gram.
20 HEWLETT-PACKARD JOURNAL NOVEMBER 1985
© Copr. 1949-1998 Hewlett-Packard Co.
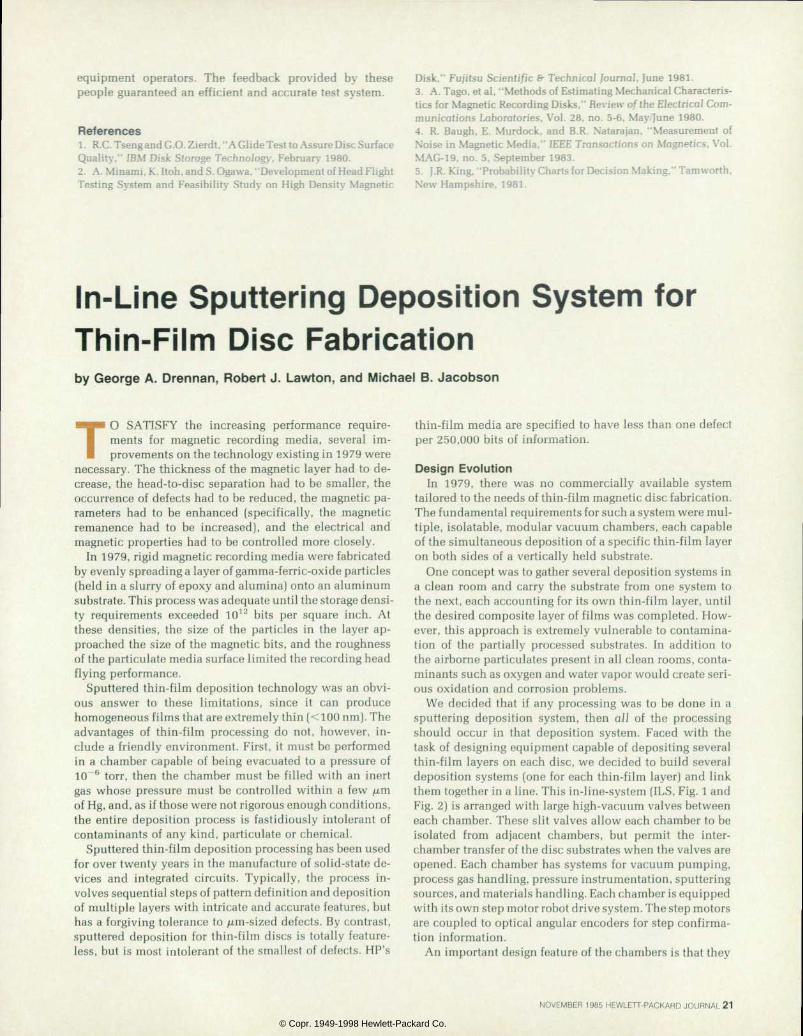
equipment operators. The feedback provided by these people guaranteed an efficient and accurate test system.
References 1 . R.C. Tseng and G.O. Zierdt. "A Glide Test to Assure Disc Surface Quality." IBM Disk Storage Technology. February 1980. 2. A. Minami. K. Itoh. and S. Ogawa. "Development of Head Flight Testing System and Feasibility Study on High Density Magnetic
Disk." Fujitsu Scientific & Technical Journal. June 1981. 3. A. Tago. et al. "Methods of Estimating Mechanical Characteris tics Com Magnetic Recording Disks." Review of the Electrical Com munications Laboratories. Vol. 28. no. 5-6. May/June 1980. 4. R. Baugh. E. Murdock, and B.R. Natarajan, "Measurement of Noise in Magnetic Media." JEEE Transactions on Magnetics, Vol. MAG-19. no. 5, September 1983. 5. J.R. King, "Probability Charts for Decision Making," Tamworth, New Hampshire, 1981.
In-Line Sputtering Deposit ion System for Thin-Fi lm Disc Fabrication by George A. Drennan, Robert J . Lawton. and Michael B. Jacobson
TO SATISFY the increasing performance require ments for magnetic recording media, several im provements on the technology existing in 1979 were
necessary. The thickness of the magnetic layer had to de crease, the head-to-disc separation had to be smaller, the occurrence of defects had to be reduced, the magnetic pa rameters had to be enhanced (specifically, the magnetic remanence had to be increased), and the electrical and magnetic properties had to be controlled more closely.
In 1979, rigid magnetic recording media were fabricated by evenly spreading a layer of gamma-ferric-oxide particles (held in a slurry of epoxy and alumina) onto an aluminum substrate. This process was adequate until the storage densi ty requirements exceeded 1012 bits per square inch. At these densities, the size of the particles in the layer ap proached the size of the magnetic bits, and the roughness of the particulate media surface limited the recording head flying performance.
Sputtered thin-film deposition technology was an obvi ous answer to these limitations, since it can produce homogeneous films that are extremely thin (<100 nm). The advantages of thin-film processing do not, however, in clude a friendly environment. First, it must be performed in a chamber capable of being evacuated to a pressure of 10~6 torr, then the chamber must be filled with an inert gas whose pressure must be controlled within a few /urn of Hg, and, as if those were not rigorous enough conditions, the entire deposition process is fastidiously intolerant of contaminants of any kind, particulate or chemical.
Sputtered thin-film deposition processing has been used for over twenty years in the manufacture of solid-state de vices and integrated circuits. Typically, the process in volves sequential steps of pattern definition and deposition of multiple layers with intricate and accurate features, but has a forgiving tolerance to /¿m-sized defects. By contrast, sputtered deposition for thin-film discs is totally feature less, but is most intolerant of the smallest of defects. HP's
thin-film media are specified to have less than one defect per 250,000 bits of information.
Design Evolution In 1979, there was no commercially available system
tailored to the needs of thin-film magnetic disc fabrication. The fundamental requirements for such a system were mul tiple, isolatable, modular vacuum chambers, each capable of the simultaneous deposition of a specific thin-film layer on both sides of a vertically held substrate.
One concept was to gather several deposition systems in a clean room and carry the substrate from one system to the next, each accounting for its own thin-film layer, until the desired composite layer of films was completed. How ever, this approach is extremely vulnerable to contamina tion of the partially processed substrates. In addition to the airborne particulates present in all clean rooms, conta minants such as oxygen and water vapor would create seri ous oxidation and corrosion problems.
We decided that if any processing was to be done in a sputtering deposition system, then all of the processing should occur in that deposition system. Faced with the task of designing equipment capable of depositing several thin-film layers on each disc, we decided to build several deposition systems (one for each thin-film layer) and link them together in a line. This in-line-system (ILS, Fig. 1 and Fig. 2) is arranged with large high-vacuum valves between each chamber. These slit valves allow each chamber to be isolated from adjacent chambers, but permit the inter- chamber transfer of the disc substrates when the valves are opened. Each chamber has systems for vacuum pumping, process gas handling, pressure instrumentation, sputtering sources, and materials handling. Each chamber is equipped with its own step motor robot drive system. The step motors are coupled to optical angular encoders for step confirma tion information.
An important design feature of the chambers is that they
NOVEMBER 1985 HEWLETT-PACKARD JOURNAL 21
© Copr. 1949-1998 Hewlett-Packard Co.
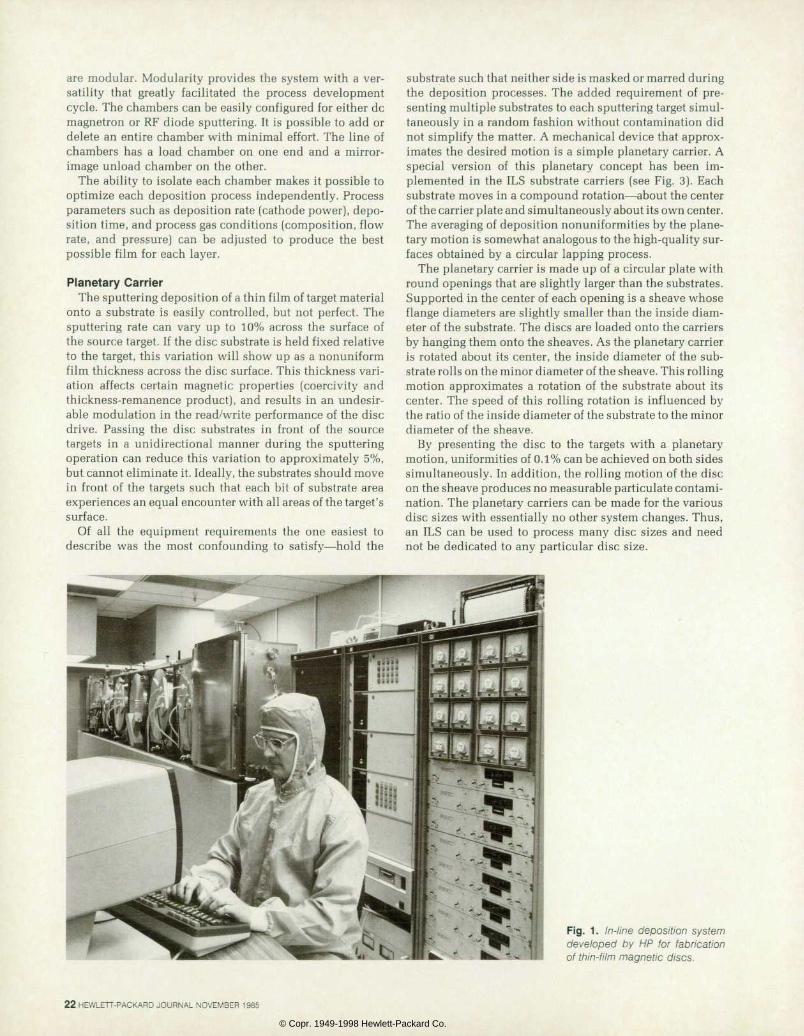
are modular. Modularity provides the system with a ver satility that greatly facilitated the process development cycle. The chambers can be easily configured for either dc magnetron or RF diode sputtering. It is possible to add or delete an entire chamber with minimal effort. The line of chambers has a load chamber on one end and a mirror- image unload chamber on the other.
The ability to isolate each chamber makes it possible to optimize each deposition process independently. Process parameters such as deposition rate (cathode power), depo sition time, and process gas conditions (composition, flow rate, and pressure) can be adjusted to produce the best possible film for each layer.
Planetary Carrier The sputtering deposition of a thin film of target material
onto a substrate is easily controlled, but not perfect. The sputtering rate can vary up to 10% across the surface of the source target. If the disc substrate is held fixed relative to the target, this variation will show up as a nonuniform film thickness across the disc surface. This thickness vari ation affects certain magnetic properties (coercivity and thickness-remanence product), and results in an undesir able modulation in the read/write performance of the disc drive. Passing the disc substrates in front of the source targets in a unidirectional manner during the sputtering operation can reduce this variation to approximately 5%, but cannot eliminate it. Ideally, the substrates should move in front of the targets such that each bit of substrate area experiences an equal encounter with all areas of the target's surface.
Of all the equipment requirements the one easiest to describe was the most confounding to satisfy — hold the
substrate such that neither side is masked or marred during the deposition processes. The added requirement of pre senting multiple substrates to each sputtering target simul taneously in a random fashion without contamination did not simplify the matter. A mechanical device that approx imates the desired motion is a simple planetary carrier. A special version of this planetary concept has been im plemented in the ILS substrate carriers (see Fig. 3). Each substrate moves in a compound rotation — about the center of the carrier plate and simultaneously about its own center. The averaging of deposition nonuniformities by the plane tary motion is somewhat analogous to the high-quality sur faces obtained by a circular lapping process.
The planetary carrier is made up of a circular plate with round openings that are slightly larger than the substrates. Supported in the center of each opening is a sheave whose flange diameters are slightly smaller than the inside diam eter of the substrate. The discs are loaded onto the carriers by hanging them onto the sheaves. As the planetary carrier is rotated about its center, the inside diameter of the sub strate rolls on the minor diameter of the sheave. This rolling motion approximates a rotation of the substrate about its center. The speed of this rolling rotation is influenced by the ratio of the inside diameter of the substrate to the minor diameter of the sheave.
By presenting the disc to the targets with a planetary motion, uniformities of 0.1% can be achieved on both sides simultaneously. In addition, the rolling motion of the disc on the sheave produces no measurable particulate contami nation. The planetary carriers can be made for the various disc sizes with essentially no other system changes. Thus, an ILS can be used to process many disc sizes and need not be dedicated to any particular disc size.
Fig . 1 . In - l ine depos i t ion sys tem deve loped by HP fo r f ab r i ca t i on of th in- f i lm magnet ic discs.
22 HEWLETT-PACKARD JOURNAL NOVEMBER 1985
© Copr. 1949-1998 Hewlett-Packard Co.
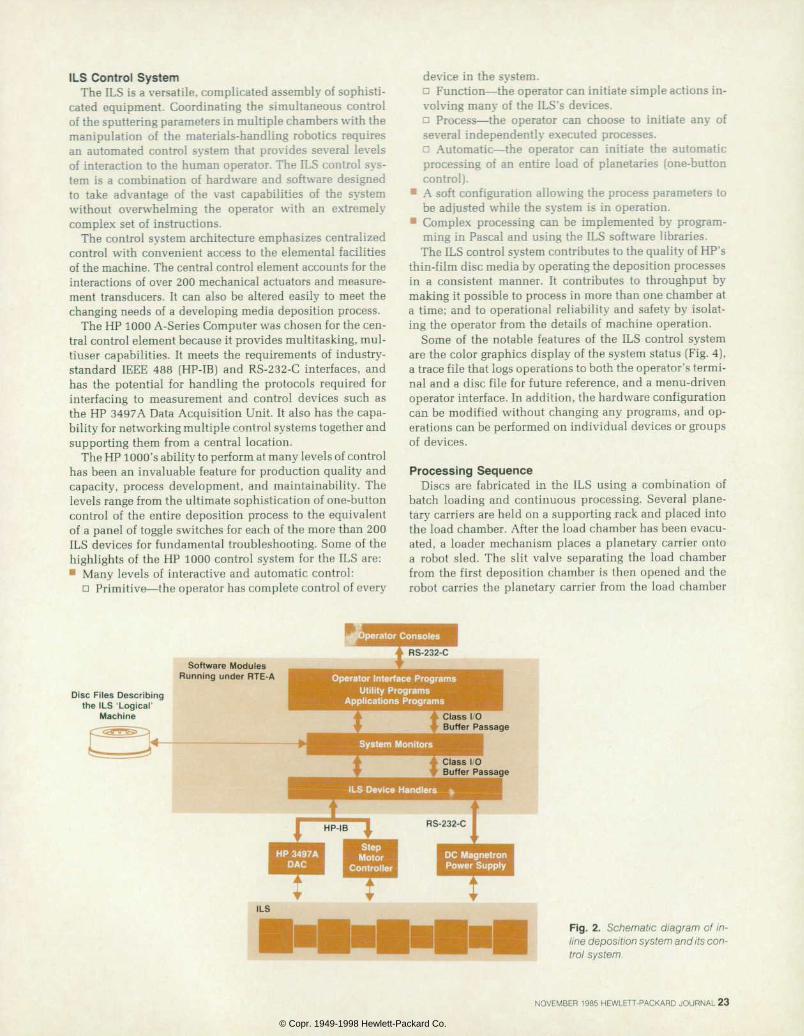
ILS Control System The ILS is a versatile, complicated assembly of sophisti
cated equipment. Coordinating the simultaneous control of the sputtering parameters in multiple chambers with the manipulation of the materials-handling robotics requires an automated control system that provides several levels of interaction to the human operator. The ILS control sys tem is a combination of hardware and software designed to take advantage of the vast capabilities of the system without overwhelming the operator with an extremely complex set of instructions.
The control system architecture emphasizes centralized control with convenient access to the elemental facilities of the machine. The central control element accounts for the interactions of over 200 mechanical actuators and measure ment transducers. It can also be altered easily to meet the changing needs of a developing media deposition process.
The HP 1000 A-Series Computer was chosen for the cen tral control element because it provides multitasking, mul tiuser capabilities. It meets the requirements of industry- standard IEEE 488 (HP-IB) and RS-232-C interfaces, and has the potential for handling the protocols required for interfacing to measurement and control devices such as the HP 3497A Data Acquisition Unit. It also has the capa bility for networking multiple control systems together and supporting them from a central location.
The HP 1000's ability to perform at many levels of control has been an invaluable feature for production quality and capacity, process development, and maintainability. The levels range from the ultimate sophistication of one-button control of the entire deposition process to the equivalent of a panel of toggle switches for each of the more than 200 ILS devices for fundamental troubleshooting. Some of the highlights of the HP 1000 control system for the ILS are: • Many levels of interactive and automatic control:
ü Primitive — the operator has complete control of every
device in the system. - Function — the operator can initiate simple actions in volving many of the ILS's devices. n Process — the operator can choose to initiate any of several independently executed processes. ü Automatic — the operator can initiate the automatic processing of an entire load of planetà ries (one-button control).
• A soft configuration allowing the process parameters to be adjusted while the system is in operation.
• Complex processing can be implemented by program ming in Pascal and using the ILS software libraries. The ILS control system contributes to the quality of HP's
thin-film disc media by operating the deposition processes in a consistent manner. It contributes to throughput by making it possible to process in more than one chamber at a time; and to operational reliability and safety by isolat ing the operator from the details of machine operation.
Some of the notable features of the ILS control system are the color graphics display of the system status (Fig. 4), a trace file that logs operations to both the operator's termi nal and a disc file for future reference, and a menu-driven operator interface. In addition, the hardware configuration can be modified without changing any programs, and op erations can be performed on individual devices or groups of devices.
Processing Sequence Discs are fabricated in the ILS using a combination of
batch loading and continuous processing. Several plane tary carriers are held on a supporting rack and placed into the load chamber. After the load chamber has been evacu ated, a loader mechanism places a planetary carrier onto a robot sled. The slit valve separating the load chamber from the first deposition chamber is then opened and the robot carries the planetary carrier from the load chamber
Software Modules Running under RTE-A
Disc Files Describing the ILS 'Logical-
Machine
faflOperator Consoles
RS-232-C
Operator Interface Programs Utility Programs
Applications Programs t Class I/O
Buffer Passage
Class I 0 Buffer Passage
ILS Device Hand'
HP-IB RS-232-C
HP 3497A DAC
Step Motor
Controller DC Magnetron Power Supply
I L S
F ig . 2 . Schema t i c d i ag ram o f i n l ine deposit ion system and i ts con trol system.
NOVEMBER 1985 HEWLETT-PACKARD JOURNAL 23
© Copr. 1949-1998 Hewlett-Packard Co.
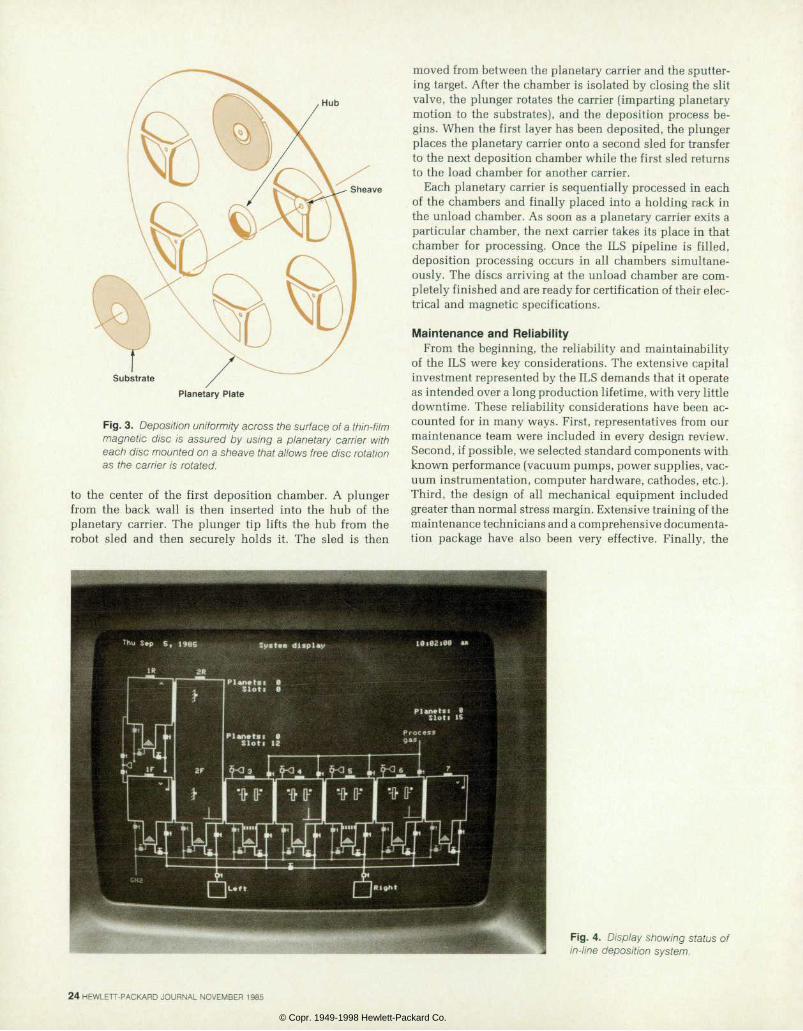
Hub
Sheave
Substrate Planetary Plate
Fig. 3. Deposit ion uni formity across the surface of a thin-f i lm magne t i c d i sc i s assu red by us ing a p lane ta ry ca r r i e r w i th each disc mounted on a sheave that al lows free disc rotat ion as the carr ier is rotated.
to the center of the first deposition chamber. A plunger from the back wall is then inserted into the hub of the planetary carrier. The plunger tip lifts the hub from the robot sled and then securely holds it. The sled is then
moved from between the planetary carrier and the sputter ing target. After the chamber is isolated by closing the slit valve, the plunger rotates the carrier (imparting planetary motion to the substrates), and the deposition process be gins. When the first layer has been deposited, the plunger places the planetary carrier onto a second sled for transfer to the next deposition chamber while the first sled returns to the load chamber for another carrier.
Each planetary carrier is sequentially processed in each of the chambers and finally placed into a holding rack in the unload chamber. As soon as a planetary carrier exits a particular chamber, the next carrier takes its place in that chamber for processing. Once the ILS pipeline is filled, deposition processing occurs in all chambers simultane ously. The discs arriving at the unload chamber are com pletely finished and are ready for certification of their elec trical and magnetic specifications.
Maintenance and Reliabi l i ty From the beginning, the reliability and maintainability
of the ILS were key considerations. The extensive capital investment represented by the ILS demands that it operate as intended over a long production lifetime, with very little downtime. These reliability considerations have been ac counted for in many ways. First, representatives from our maintenance team were included in every design review. Second, if possible, we selected standard components with known performance (vacuum pumps, power supplies, vac uum instrumentation, computer hardware, cathodes, etc.). Third, the design of all mechanical equipment included greater than normal stress margin. Extensive training of the maintenance technicians and a comprehensive documenta tion package have also been very effective. Finally, the
Fig . 4 . D isp lay showing s ta tus o f in- l ine deposit ion system.
24 HEWLETT-PACKARD JOURNAL NOVEMBER 1985
© Copr. 1949-1998 Hewlett-Packard Co.
power of the HP 1000 Computer controller has been used to prevent downtime through fail-safe interlocks and status graphics and to aid troubleshooting by providing system diagnostics and self-test programs.
Acknowledgments The design of the disc deposition system has evolved
over several years and is a composite of the coordinated efforts of many individuals. A special thanks goes to Jim Devine, who has been associated with HP's thin-film disc program since its origin, and has been a consistent source of sputtering system knowledge and insight.
Several others should be singled out for recognition of their contributions: Bill Hutchison for his design and guid ance in defining the control system architecture and soft ware, Cameron Smith for providing the engineering sup port for the system electronics during the transition from
development to manufacturing, Tats Yamamoto for his mechanical design of the cathode assemblies. Glen Bodman for coordinating the design and construction of the special facilities required for the disc processing areas, Mike Wil liams, whose intimate knowledge of the system operation has been extremely valuable in checking out each new system and in training the system operators, Scott Leadbet- ter and Sue Haman for providing the drafting support for the great number of mechanical and electrical drawings that were always accurate and up-to-date, and finally. Deb bie Bennett for orchestrating all of the documentation ef forts and producing a truly comprehensive package.
Credit is also due to our excellent maintenance team of Mike Buckley, Harvey Torres, Herb Jordine, Steve Blan- chard, Jim Feagin, Barry Broom, and Gary Larsen for their design recommendations and technical skills that have kept the deposition system running smoothly.
Thin-Film Disc Reliability — the Conservat ive Approach by Cl i f ford K. Day, C. Girv in Harkins, Stephan P. Howe, and Paul Poorman
WHEN A COMPANY with a reputation for reliable products introduces a new technology, it has the obligation to ensure that this technology
will achieve at least the same level of customer satisfaction through reliable performance as did the technology it re places.
This is particularly important when implementing a new disc memory technology, since data integrity and reliability are primary performance criteria. Hence, when Hewlett-Pack ard undertook the development of thin-film discs for its new memory products, a significant part of the program was con cerned with evaluating and improving the reliability of the new technology.
Reliabi l i ty Goals and Testing Reliability experience was reviewed for HP disc drives
that used the older particulate media head/disc technology. Based on this experience, two goals were established that would represent a considerable improvement in disc relia bility. The first represented the warranty period, which is the easiest measure of reliability success since it can be measured in stressful lab and field environments within a reasonable amount of time. The second was a long-term goal equivalent to ten years of drive use by the customer. These two goals became the focus for our accelerated testing efforts.
Several accelerated tests were devised to simulate differ ent customer environmental stresses. These included:
Wear tests that evaluate effects caused by head takeoff
and landing on the disc surface • Friction tests that evaluate start-up and dynamic head/
disc friction as a function of wear and humidity • Atmospheric pollutant and galvanic corrosion tests • Oxygen diffusion tests • Shock and vibration tests • Thermal stability tests (including some that simulated a
customer transporting the disc drive in the cold trunk of a car and then using the drive in a warm office envi ronment). The major challenge facing the engineer responsible for
qualifying the reliability of a new disc memory materials system is the need for realistic accelerated tests that will establish the failure rate of the disc to various stresses. Typically, one wants a test that can be completed in a few hours, days, or weeks that would simulate ten or more years of customer use. Some environmental stresses, such as atmospheric pollutants, are difficult to simulate in the laboratory. In such cases, extensive field tests are needed to supplement lab results, and additional design precau tions may be required to ensure reliability with a high degree of confidence.
As the thin-film disc testing program unfolded, it became apparent that the major areas that would contribute most to disc failures were wear, friction, and corrosion. The rest of this article will focus on the testing done to ensure that these stresses would not result in problems for Hewlett- Packard's disc drive customers.
NOVEMBER 1985 HEWLETT-PACKARD JOURNAL 25
© Copr. 1949-1998 Hewlett-Packard Co.
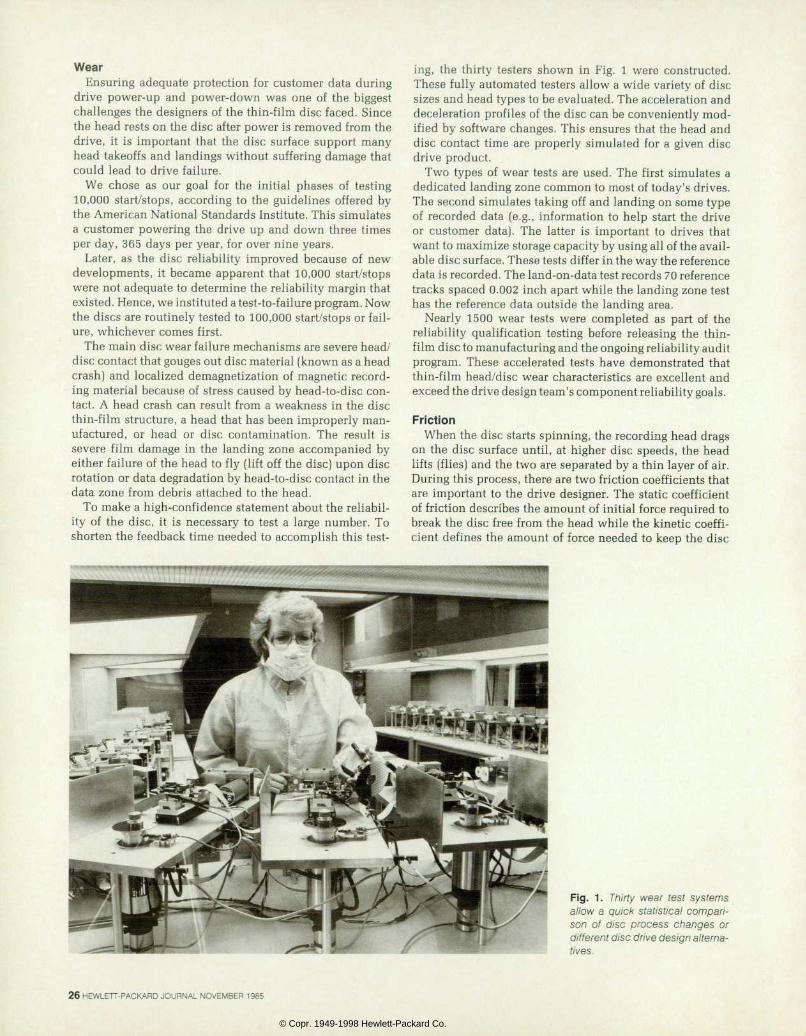
Wear Ensuring adequate protection for customer data during
drive power-up and power-down was one of the biggest challenges the designers of the thin-film disc faced. Since the head rests on the disc after power is removed from the drive, it is important that the disc surface support many head takeoffs and landings without suffering damage that could lead to drive failure.
We chose as our goal for the initial phases of testing 10,000 start/stops, according to the guidelines offered by the American National Standards Institute. This simulates a customer powering the drive up and down three times per day, 365 days per year, for over nine years.
Later, as the disc reliability improved because of new developments, it became apparent that 10,000 start/stops were not adequate to determine the reliability margin that existed. Hence, we instituted a test-to-failure program. Now the discs are routinely tested to 100,000 start/stops or fail ure, whichever comes first.
The main disc wear failure mechanisms are severe head/ disc contact that gouges out disc material (known as a head crash) and localized demagnetization of magnetic record ing material because of stress caused by head-to-disc con tact. A head crash can result from a weakness in the disc thin-film structure, a head that has been improperly man ufactured, or head or disc contamination. The result is severe film damage in the landing zone accompanied by either failure of the head to fly (lift off the disc) upon disc rotation or data degradation by head-to-disc contact in the data zone from debris attached to the head.
To make a high-confidence statement about the reliabil ity of the disc, it is necessary to test a large number. To shorten the feedback time needed to accomplish this test
ing, the thirty testers shown in Fig. 1 were constructed. These fully automated testers allow a wide variety of disc sizes and head types to be evaluated. The acceleration and deceleration profiles of the disc can be conveniently mod ified by software changes. This ensures that the head and disc contact time are properly simulated for a given disc drive product.
Two types of wear tests are used. The first simulates a dedicated landing zone common to most of today's drives. The second simulates taking off and landing on some type of recorded data (e.g., information to help start the drive or customer data). The latter is important to drives that want to maximize storage capacity by using all of the avail able disc surface. These tests differ in the way the reference data is recorded. The land-on-data test records 70 reference tracks spaced 0.002 inch apart while the landing zone test has the reference data outside the landing area.
Nearly 1500 wear tests were completed as part of the reliability qualification testing before releasing the thin- film disc to manufacturing and the ongoing reliability audit program. These accelerated tests have demonstrated that thin-film head/disc wear characteristics are excellent and exceed the drive design team's component reliability goals.
Friction When the disc starts spinning, the recording head drags
on the disc surface until, at higher disc speeds, the head lifts (flies) and the two are separated by a thin layer of air. During this process, there are two friction coefficients that are important to the drive designer. The static coefficient of friction describes the amount of initial force required to break the disc free from the head while the kinetic coeffi cient defines the amount of force needed to keep the disc
F ig . 1 . Th i r t y wea r t es t sys tems a l low a qu ick s ta t i s t i ca l compar i s o n o f d i s c p r o c e s s c h a n g e s o r di f ferent disc dr ive design al terna tives.
26 HEWLETT-PACKARD JOURNAL NOVEMBER 1985
© Copr. 1949-1998 Hewlett-Packard Co.
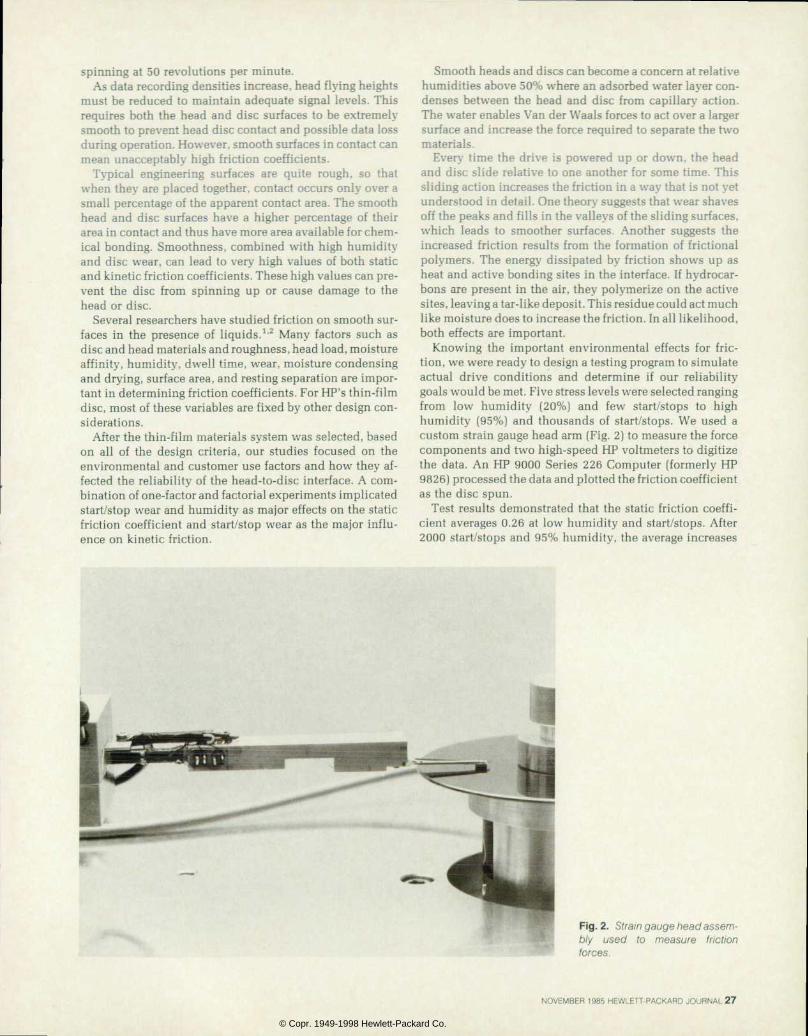
spinning at 50 revolutions per minute. As data recording densities increase, head flying heights
must be reduced to maintain adequate signal levels. This requires both the head and disc surfaces to be extremely smooth to prevent head disc contact and possible data loss during operation. However, smooth surfaces in contact can mean unacceptably high friction coefficients.
Typical engineering surfaces are quite rough, so that when they are placed together, contact occurs only over a small percentage of the apparent contact area. The smooth head and disc surfaces have a higher percentage of their area in contact and thus have more area available for chem ical bonding. Smoothness, combined with high humidity and disc wear, can lead to very high values of both static and kinetic friction coefficients. These high values can pre vent the disc from spinning up or cause damage to the head or disc.
Several researchers have studied friction on smooth sur faces in the presence of liquids.1'2 Many factors such as disc and head materials and roughness, head load, moisture affinity, humidity, dwell time, wear, moisture condensing and drying, surface area, and resting separation are impor tant in determining friction coefficients. For HP's thin-film disc, most of these variables are fixed by other design con siderations.
After the thin-film materials system was selected, based on all of the design criteria, our studies focused on the environmental and customer use factors and how they af fected the reliability of the head-to-disc interface. A com bination of one-factor and factorial experiments implicated start/stop wear and humidity as major effects on the static friction coefficient and start/stop wear as the major influ ence on kinetic friction.
Smooth heads and discs can become a concern at relative humidities above 50% where an adsorbed water layer con denses between the head and disc from capillary action. The water enables Van der Waals forces to act over a larger surface and increase the force required to separate the two materials.
Even- time the drive is powered up or down, the head and disc slide relative to one another for some time. This sliding action increases the friction in a way that is not yet understood in detail. One theory suggests that wear shaves off the peaks and fills in the valleys of the sliding surfaces, which leads to smoother surfaces. Another suggests the increased friction results from the formation of frictional polymers. The energy dissipated by friction shows up as heat and active bonding sites in the interface. If hydrocar bons are present in the air, they polymerize on the active sites, leaving a tar-like deposit. This residue could act much like moisture does to increase the friction. In all likelihood, both effects are important.
Knowing the important environmental effects for fric tion, we were ready to design a testing program to simulate actual drive conditions and determine if our reliability goals would be met. Five stress levels were selected ranging from low humidity (20%) and few start/stops to high humidity (95%) and thousands of start/stops. We used a custom strain gauge head arm (Fig. 2) to measure the force components and two high-speed HP voltmeters to digitize the data. An HP 9000 Series 226 Computer (formerly HP 9826) processed the data and plotted the friction coefficient as the disc spun.
Test results demonstrated that the static friction coeffi cient averages 0.26 at low humidity and start/stops. After 2000 start/stops and 95% humidity, the average increases
Fig . 2 . S t ra in gauge head assem b l y u s e d t o m e a s u r e f r i c t i o n forces.
NOVEMBER 1985 HEWLETT-PACKARD JOURNAL 27
© Copr. 1949-1998 Hewlett-Packard Co.
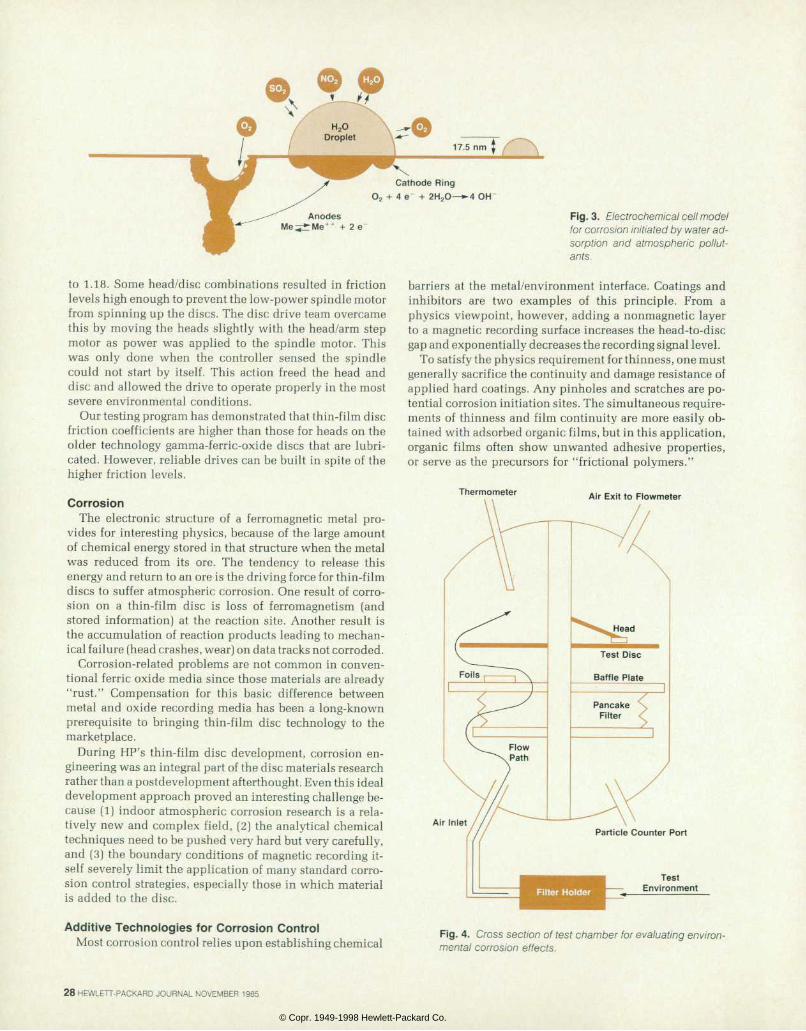
17.5 nm
V Cathode Ring
O2 + 4e - + 2H2O—
Anodes + + + 2 e "
to 1.18. Some head/disc combinations resulted in friction levels high enough to prevent the low-power spindle motor from spinning up the discs. The disc drive team overcame this by moving the heads slightly with the head/arm step motor as power was applied to the spindle motor. This was only done when the controller sensed the spindle could not start by itself. This action freed the head and disc and allowed the drive to operate properly in the most severe environmental conditions.
Our testing program has demonstrated that thin-film disc friction coefficients are higher than those for heads on the older technology gamma-ferric-oxide discs that are lubri cated. However, reliable drives can be built in spite of the higher friction levels.
Corrosion The electronic structure of a ferromagnetic metal pro
vides for interesting physics, because of the large amount of chemical energy stored in that structure when the metal was reduced from its ore. The tendency to release this energy and return to an ore is the driving force for thin-film discs to suffer atmospheric corrosion. One result of corro sion on a thin-film disc is loss of ferromagnetism (and stored information) at the reaction site. Another result is the accumulation of reaction products leading to mechan ical failure (head crashes, wear) on data tracks not corroded.
Corrosion-related problems are not common in conven tional ferric oxide media since those materials are already "rust." Compensation for this basic difference between metal and oxide recording media has been a long-known prerequisite to bringing thin-film disc technology to the marketplace.
During HP's thin-film disc development, corrosion en gineering was an integral part of the disc materials research rather than a postdevelopment afterthought. Even this ideal development approach proved an interesting challenge be cause (1) indoor atmospheric corrosion research is a rela tively new and complex field, (2) the analytical chemical techniques need to be pushed very hard but very carefully, and (3) the boundary conditions of magnetic recording it self severely limit the application of many standard corro sion control strategies, especially those in which material is added to the disc.
Addit ive Technologies for Corrosion Control Most corrosion control relies upon establishing chemical
Fig. 3. Electrochemical cel l model for corrosion ini t iated by water ad so rp t i on and a tmosphe r i c po l l u t ants.
barriers at the metal/environment interface. Coatings and inhibitors are two examples of this principle. From a physics viewpoint, however, adding a nonmagnetic layer to a magnetic recording surface increases the head-to-disc gap and exponentially decreases the recording signal level.
To satisfy the physics requirement f or thinness, one must generally sacrifice the continuity and damage resistance of applied hard coatings. Any pinholes and scratches are po tential corrosion initiation sites. The simultaneous require ments of thinness and film continuity are more easily ob tained with adsorbed organic films, but in this application, organic films often show unwanted adhesive properties, or serve as the precursors for "frictional polymers."
Thermometer Air Exit to Flowmeter
Air Inlet
Fig. 4 . Cross sect /on of test chamber for evaluat ing envi ron mental corrosion effects.
28 HEWLETT-PACKARD JOURNAL NOVEMBER 1985
© Copr. 1949-1998 Hewlett-Packard Co.
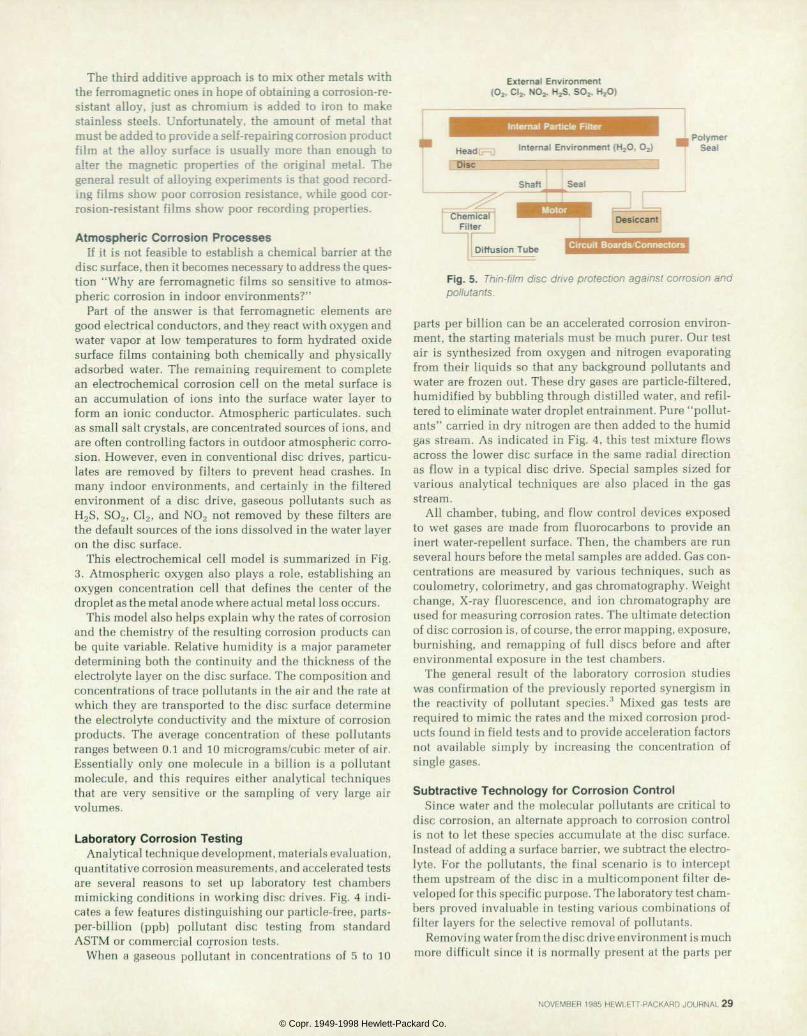
The third additive approach is to mix other metals with the ferromagnetic ones in hope of obtaining a corrosion-re sistant alloy, just as chromium is added to iron to make stainless steels. Unfortunately, the amount of metal that must be added to provide a self-repairing corrosion product film at the alloy surface is usually more than enough to alter the magnetic properties of the original metal. The general result of alloying experiments is that good record ing films show poor corrosion resistance, while good cor rosion-resistant films show poor recording properties.
Atmospheric Corrosion Processes If it is not feasible to establish a chemical barrier at the
disc surface, then it becomes necessary to address the ques tion "Why are ferromagnetic films so sensitive to atmos pheric corrosion in indoor environments?"
Part of the answer is that ferromagnetic elements are good electrical conductors, and they react with oxygen and water vapor at low temperatures to form hydrated oxide surface films containing both chemically and physically adsorbed water. The remaining requirement to complete an electrochemical corrosion cell on the metal surface is an accumulation of ions into the surface water layer to form an ionic conductor. Atmospheric particulates. such as small salt crystals, are concentrated sources of ions, and are often controlling factors in outdoor atmospheric corro sion. However, even in conventional disc drives, particu lates are removed by filters to prevent head crashes. In many indoor environments, and certainly in the filtered environment of a disc drive, gaseous pollutants such as H2S, SO2, C12, and NO2 not removed by these filters are the default sources of the ions dissolved in the water layer on the disc surface.
This electrochemical cell model is summarized in Fig. 3. Atmospheric oxygen also plays a role, establishing an oxygen concentration cell that defines the center of the droplet as the metal anode where actual metal loss occurs.
This model also helps explain why the rates of corrosion and the chemistry of the resulting corrosion products can be quite variable. Relative humidity is a major parameter determining both the continuity and the thickness of the electrolyte layer on the disc surface. The composition and concentrations of trace pollutants in the air and the rate at which they are transported to the disc surface determine the electrolyte conductivity and the mixture of corrosion products. The average concentration of these pollutants ranges between 0.1 and 10 micrograms/cubic meter of air. Essentially only one molecule in a billion is a pollutant molecule, and this requires either analytical techniques that are very sensitive or the sampling of very large air volumes.
Laboratory Corrosion Testing Analytical technique development, materials evaluation,
quantitative corrosion measurements, and accelerated tests are several reasons to set up laboratory test chambers mimicking conditions in working disc drives. Fig. 4 indi cates a few features distinguishing our particle-free, parts- per-billion (ppb) pollutant disc testing from standard ASTM or commercial corrosion tests.
When a gaseous pollutant in concentrations of 5 to 10
E x t e r n a l E n v i r o n m e n t ( O 2 . C I 2 . N O 2 . H 2 S . S O 2 . H 2 O )
I n t e r n a l P a r t i c l e F i l t e r
I n t e r n a l E n v i r o n m e n t ( H 2 O . O 2 ) • Polymer 1 S e a l
C i r c u i t B o a r d s C o n n e c t o r s
Fig. and Thin-f i lm disc dr ive protect ion against corrosion and pollutants.
parts per billion can be an accelerated corrosion environ ment, the starting materials must be much purer. Our test air is synthesized from oxygen and nitrogen evaporating from their liquids so that any background pollutants and water are frozen out. These dry gases are particle-filtered, humidified by bubbling through distilled water, and refil- tered to eliminate water droplet entrainment. Pure "pollut ants" carried in dry nitrogen are then added to the humid gas stream. As indicated in Fig. 4, this test mixture flows across the lower disc surface in the same radial direction as flow in a typical disc drive. Special samples sized for various analytical techniques are also placed in the gas stream.
All chamber, tubing, and flow control devices exposed to wet gases are made from fluorocarbons to provide an inert water-repellent surface. Then, the chambers are run several hours before the metal samples are added. Gas con centrations are measured by various techniques, such as coulometry, colorimetry, and gas chromatography. Weight change, X-ray fluorescence, and ion chromatography are used for measuring corrosion rates. The ultimate detection of disc corrosion is, of course, the error mapping, exposure, burnishing, and remapping of full discs before and after environmental exposure in the test chambers.
The general result of the laboratory corrosion studies was confirmation of the previously reported synergism in the reactivity of pollutant species.3 Mixed gas tests are required to mimic the rates and the mixed corrosion prod ucts found in field tests and to provide acceleration factors not available simply by increasing the concentration of single gases.
Subtract ive Technology for Corrosion Control Since water and the molecular pollutants are critical to
disc corrosion, an alternate approach to corrosion control is not to let these species accumulate at the disc surface. Instead of adding a surface barrier, we subtract the electro lyte. For the pollutants, the final scenario is to intercept them upstream of the disc in a multicomponent filter de veloped for this specific purpose. The laboratory test cham bers proved invaluable in testing various combinations of filter layers for the selective removal of pollutants.
Removing water from the disc drive environment is much more difficult since it is normally present at the parts per
NOVEMBER 1985 HEWLETT-PACKARD JOURNAL 29
© Copr. 1949-1998 Hewlett-Packard Co.
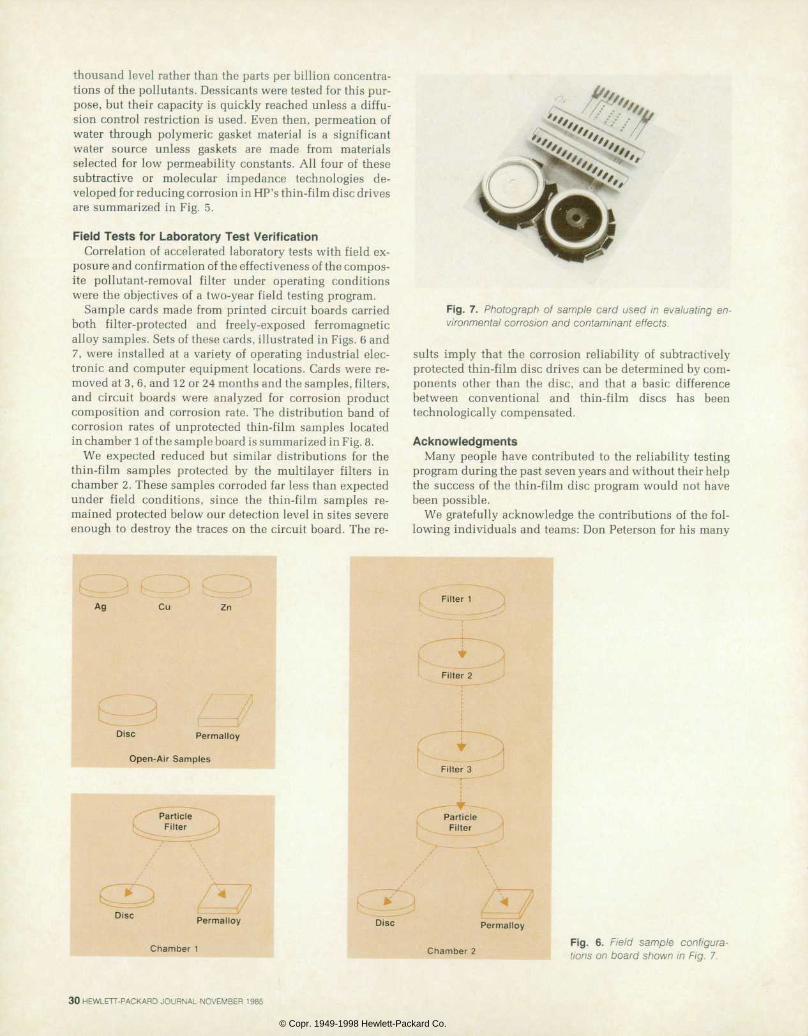
thousand level rather than the parts per billion concentra tions of the pollutants. Dessicants were tested for this pur pose, but their capacity is quickly reached unless a diffu sion control restriction is used. Even then, permeation of water through polymeric gasket material is a significant water source unless gaskets are made from materials selected for low permeability constants. All four of these subtractive or molecular impedance technologies de veloped for reducing corrosion in HP's thin-film disc drives are summarized in Fig. 5.
Field Tests for Laboratory Test Veri f icat ion Correlation of accelerated laboratory tests with field ex
posure and confirmation of the effectiveness of the compos ite pollutant-removal filter under operating conditions were the objectives of a two-year field testing program.
Sample cards made from printed circuit boards carried both filter-protected and freely-exposed ferromagnetic alloy samples. Sets of these cards, illustrated in Figs. 6 and 7, were installed at a variety of operating industrial elec tronic and computer equipment locations. Cards were re moved at 3, 6, and 12 or 24 months and the samples, filters, and circuit boards were analyzed for corrosion product composition and corrosion rate. The distribution band of corrosion rates of unprotected thin-film samples located in chamber 1 of the sample board is summarized in Fig. 8.
We expected reduced but similar distributions for the thin-film samples protected by the multilayer filters in chamber 2. These samples corroded far less than expected under field conditions, since the thin-film samples re mained protected below our detection level in sites severe enough to destroy the traces on the circuit board. The re-
%,<: > O Ã Â £ ' ' / / â € ¢ ' / / f f f . . /
K
F i g . 7 . P h o t o g r a p h o f s a m p l e c a r d u s e d i n e v a l u a t i n g e n v i ronmental corrosion and contaminant ef fects.
suits imply that the corrosion reliability of subtractively protected thin-film disc drives can be determined by com ponents other than the disc, and that a basic difference between conventional and thin-film discs has been technologically compensated.
Acknowledgments Many people have contributed to the reliability testing
program during the past seven years and without their help the success of the thin-film disc program would not have been possible.
We gratefully acknowledge the contributions of the fol lowing individuals and teams: Don Peterson for his many
Cu
D i s c P e r m a l l o y
Open-Air Samples
Chamber 1 C h a m b e r 2 F i g . 6 . F i e l d s a m p l e c o n f i g u r a t ions on board shown in Fig. 7.
30 HEWLETT-PACKARD JOURNAL NOVEMBER 1985
© Copr. 1949-1998 Hewlett-Packard Co.
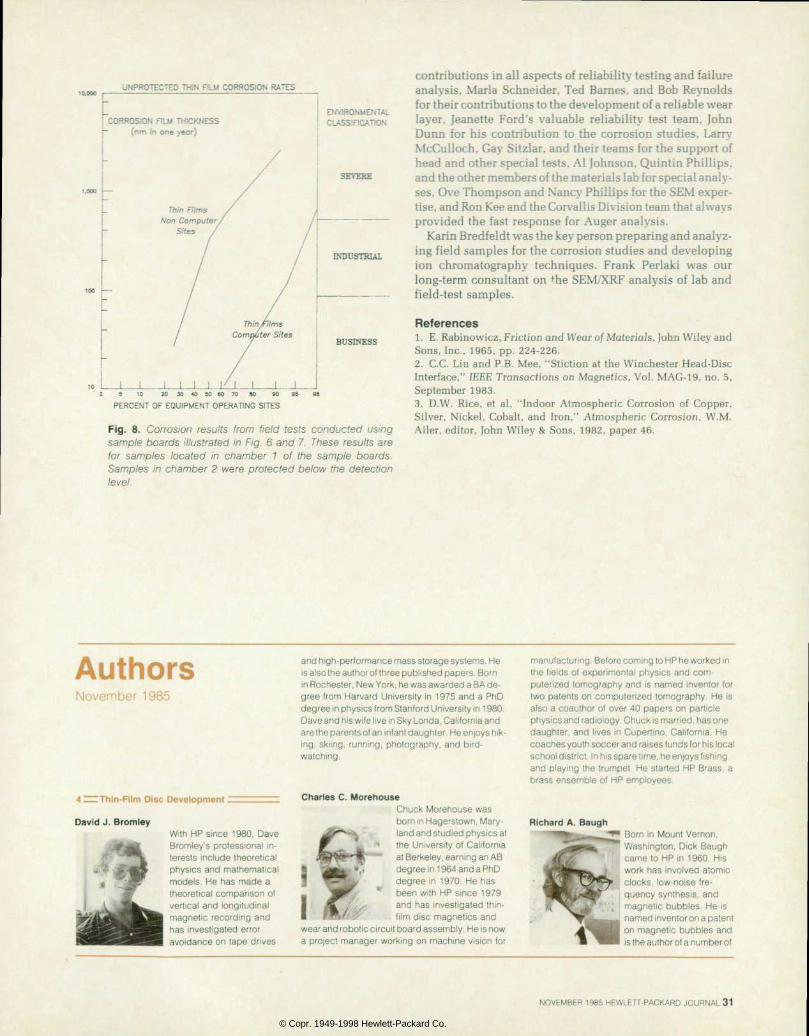
_ . . . . . . 3 0 R R O S M N W O E
' CORROSION FILM THICKNESS j - ( n m i n o n e y e o r )
ENVIRONMENTAL CLASSIFICATION
BUSINESS
5 1 0 2 0 3 0 4 0 5 0 6 0 7 0 8 0 9 0 9 5 9 8
PERCENT OF EQUIPMENT OPERATING SITES
F ig . 8 . Co r ros ion resu l t s f rom f i e ld t es t s conduc ted us ing sample boards i l lus t ra ted in F ig . 6 and 7. These resul ts are f o r s a m p l e s l o c a t e d i n c h a m b e r 1 o f t h e s a m p l e b o a r d s . Samples in chamber 2 were p ro tec ted be low the de tec t ion level.
contributions in all aspects of reliability testing and failure analysis, Maria Schneider, Ted Barnes, and Bob Reynolds for their contributions to the development of a reliable wear layer, Jeanette Ford's valuable reliability test team, John Dunn for his contribution to the corrosion studies, Larry McCulloch, Gay Sitzlar, and their teams for the support of head and other special tests, Al Johnson, Quintin Phillips, and the other members of the materials lab for special analy ses, Ove Thompson and Nancy Phillips for the SEM exper tise, and Ron Kee and the Corvallis Division team that always provided the fast response for Auger analysis.
Karin Bredfeldt was the key person preparing and analyz ing field samples for the corrosion studies and developing ion chromatography techniques. Frank Perlaki was our long-term consultant on the SEM/XRF analysis of lab and field-test samples.
Refe rences 1 . E . and F r i c t i on and Wear o f Ma te r i a l s , John Wi l ey and Sons, Inc., 1965, pp. 224-226. 2. C.C. Liu and P.B. Mee, "Stiction at the Winchester Head-Disc Interface," IEEE Transactions on Magnetics, Vol. MAG-19, no. 5, September 1983. 3. D.W. Rice, et al, "Indoor Atmospheric Corrosion of Copper, Silver, Nickel, Cobalt, and Iron," Atmospheric Corrosion, W.M. Ailer, editor, John Wiley & Sons, 1982, paper 46.
Authors N o v e m b e r 1 9 8 5
4 — Thin-Film Disc Development :
With HP s ince 1980, Dave Bromley 's pro fess iona l in terests include theoret ical phys ics and mathemat ica l mode ls . He has made a theoret ical compar ison of vert ical and longi tudinal magnet ic record ing and has invest igated error avo idance on tape dr ives
and high-performance mass storage systems. He is also the author of three published papers. Born in Rochester, New York, he was awarded a BA de gree f rom Harvard Univers i ty in 1975 and a PhD degree in physics from Stanford University in 1 980. Dave and his wife live in Sky Londa, California and are the parents of an infant daughter. He enjoys hik ing, sk i ing, running, photography, and b i rd- watching.
«H*H|~
Charles C. Morehouse Chuck Morehouse was born in Hagerstown, Mary land and studied physics at the Universi ty of Cal i fornia n Berke • . ear i \a AB
 ¿  ¿ f . , d e g r e e i n 1 9 6 4 a n d a P h D ^ f - d e g r e e i n 1 9 7 0 . H e h a s
been wi th HP s ince 1979 and has invest igated th in- f i lm d isc magnet ics and
wear and robotic circuit board assembly. He is now a pro ject manager work ing on machine v is ion for
manufacturing. Before coming to HP he worked in the f ie lds o f exper imenta l phys ics and com puter ized tomography and is named inventor for two patents on computer ized tomography. He is a lso a coauthor o f over 40 papers on par t ic le physics and radiology. Chuck is married, has one daughter , and l ives in Cupert ino, Cal i forn ia. He coaches youth soccer and raises funds for his local school district. In his spare time, he enjoys fishing and p lay ing the t rumpet . He s tar ted HP Brass, a brass ensemble of HP employees.
Richard A. Baugh Born in Mount Vernon, Washington, D ick Baugh came to HP in 1960. His work has invo lved atomic c locks , low-no ise f re quency synthes is , and magnet ic bubb les . He is named inventor on a patent on magnet i c bubb les and is the author of a number of
NOVEMBER 1985 HEWLETT-PACKARD JOURNAL 31
© Copr. 1949-1998 Hewlett-Packard Co.
technical papers and other published material. An e lec t r i ca l eng ineer w i th a PhD degree f rom Stan ford Univers i ty (1969), he a lso earned BSEE and MSEE degrees from the California Institute of Tech nology in 1 959 and 1 960. Dick is married, lives in Palo Alto, California, and has two children. Off the job, he teaches wi lderness survival and experimen tal archaeology. He also makes hunting bows in the ancient Amer ican Ind ian fashion us ing nat ive materials.
Edward S. Murdock With HP s ince 1980, Ed
r j j f l P ' ^ f c M u r d o c k i s a p r o j e c t l e a d e r at HP Laboratories who has
I " ^ â € ¢ > w o r k e d o n l o n g i t u d i n a l a n d perpendicu lar record ing media for thin-f i lm discs. He was born in Fort Dix, New Jersey and served for
• three years in the U.S. A rmy . He a l so ea rned de
grees in physics from the University of Kansas (BS 1 970) and the University of California at Davis (PhD 1980) . Ed is a member o f the Amer ican Phys ica l Society and author or coauthor of three technical articles. He lives in San Jose, California, is married, and has two children. He is active in teaching adult Bib le c lasses at h is church.
James E. Opfer Manager of the thin-f i lm de pa r tmen t a t HP Labora tories, Jim Opfer has been with HP since 1 976. He has been responsib le for the deve lopment o f c ryogenic dev ices , magnet ic bubb le devices, th in-f i lm discs, and thin-fi lm heads. He was born in Lincoln, Missour i
and received a BSEE degree from Valparaiso Uni versity in 1 959 and a PhD degree in physics from Washington University in 1 966. He was an assistant professor of physics at Stanford Univers i ty and then worked on magnetometer ins t rumentat ion at another company be fore coming to HP. He is the author of 1 1 papers on low-temperature hel ium physics and cryogenic magnetometers and appl i cations and is also named inventor on three patents related to magnetics. He is active in his local IEEE chapter and is the reviews editor for the IEEE Trans actions on Magnetics. Jim lives in Palo Alto, Califor nia, is married, and has one child. His outside in terests inc lude sk i ing, jogging, motorcyc le r id ing, and s tudy ing Japanese.
Bruce F . Spenner Bruce Spenner has been with HP Laboratories since 1978 and cu r ren t l y man ages the app l i ed techno l ogy depar tment , which de ve lops advanced mass s torage systems. He has also worked on th in- f i lm discs and tape storage de v ices. He was born in St
Louis, Missouri and studied electrical engineering at Washington University, receiving a BSEE degree in 1968, an MSEE degree in 1970, and a DScEE in 1976. Before jo in ing HP he was a research as sociate at Washington Universi ty Biomedical Com puter Laboratory . He has wr i t ten a number of pa- person b iomedica l comput ing, medica l ins t rumen tation, and software development tools. A resident of Los Gatos, California, Bruce is married and has s ix ch i ldren. He enjoys swimming and gol f .
Bangalore R. Natarajan 5 N a t u N a t a r a j a n w a s b o r n i n
Bangalore, Ind ia and s tud ied meta l lu rg ica l en gineer ing at the Universi ty of I l l inois, complet ing work for h is MS degree in 1975 and for h is PhD degree in
^ 1979 . He came to HP in I 1979, is now a project man-
m age r , and has worked on th in- f i lm d isc mater ia l research and development and on magnet ic record ing. He is the author or coauthor of several papers on thin-f i lm sputter de posit ion technology and on medium noise in mag netic recording media. Natu and his wife live in San Jose, California and he likes music, traveling, and tennis.
1 1 Â ¡ ^ D y n a m i c T e s t i n g â € ”
John Hodges John Hodges g rew up in Berkeley, Cal i fornia and was educa ted a t t he Mas sachusetts Inst i tute of Technology and at the Uni versity of Cali fornia at Berkeley (BSEE 1977). With HP s ince 1977 , he super vised tester design and im plementation for thin-f i lm
d iscs and heads and is now work ing on indust ry s tandard in ter faces for d isc contro l lers. John and his wife are residents of Meridian, Idaho. He plays gu i tar and pedal s tee l in a count ry rock music band, runs a home recording studio, and is a pri vate pi lot and avid t inkerer.
Dennis R. Edson ^ ^ D e n n i s E d s o n h a s
f ^ ^ U L s p e c i a l i z e d i n e l e c t r o n i c des ign and product ion en g ineer ing s ince jo in ing HP in 1967. He contr ibuted to
! $ ^ t h e d e s i g n o f t h e H P 3 9 6 0 A , HP 3968A, and the HP 7970 Tape Dr ives. He a lso worked on the HP 7900 and HP 7906 Disc Dr ives, has
managed an electronic tool design group, and has des igned au tomated tes t equ ipment . Born in To ronto, Canada, Dennis rece ived a BSEE degree f rom Cal i fornia State Universi ty at Los Angeles in 1 963. He's married, has two children, and lives in Meridian, Idaho. He enjoys computers and photo graphy and is an amateur rad io opera tor (WB7WCR).
'
Ke i th S . Roske l l ey Keith Roskelley was born in Pocate l lo , Idaho and a t tended Utah S ta te Un iver s i ty , f rom which he earned his BSEE degree in 1979. Since jo in ing HP's Disc Memory Div is ion the same year , he has worked on thin-fi lm disc ana head test equ ipment and methods.
Kei th l ives in Boise and enjoys camping, h ik ing, t ravel , and computers dur ing h is le isure t ime.
21 ZH Deposit ion System :
Robert J. Lawton R. J. (Bob) Lawton was born in Elgin, Il l inois and at tended the Univers i ty of I l l inois, where he earned a BSME degree in 1 980. After coming to HP the same year, he worked on the HP 7911, the HP 791 2, and the HP 7935 Disc Dr ives. His work on a vacuum-compat
ib le co l le t sp indle is the subject o f a pending patent . Bob l ives wi th h is wi fe and two sons in Boise, Idaho and l ists bicycl ing, camping, and f ly ing as outside interests.
Michael B. Jacobson ^ ^ ^ ^ - A g r a d u a t e o f W a s h i n g t o n
j M f f l ^ k S t a t e U n i v e r s i t y , M i k e Jacobson earned a BSEE
â € ¢ I * 9 > % V d e g r e e i n 1 9 8 1 a n d c a m e to HP the same year . He has worked on the des ign of the in-line system for pro cessing thin-f i lm discs and is currently working on disc cont ro l le r des ign. He is in
terested in computer systems and sof tware. Mike was born in Yakima, Washington and now lives with h is wi fe in Boise, Idaho. His outs ide in terests in clude music, ski ing, hiking, camping, f ishing, and basketball .
G e o r g e A . D r e n n a n A pro ject leader at HP's
J J j à j à ± ^ D i s c M e m o r y D i v i s i o n , ^ \ G e o r g e D r e n n a n h a s b e e n
responsible for fabr icat ion process and equ ipment design for th in- f i lm discs and heads. S ince coming to HP in 1967 he has a lso worked on a variety of pro jects at both the Microwave
Div is ion (now Stanford Park Div is ion) and HP Laborator ies. He was born in Berkeley, Cal i forn ia and has a BSME degree awarded by the University of California at Santa Barbara in 1 966. He is named inventor on two patents and is the coauthor of two research papers. George is a res ident of Eagle, Idaho and has two sons. He is remodel ing h is house and is interested in Softbal l , ski ing, and gardening.
32 HEWLETT-PACKARD JOURNAL NOVEMBER 1985
© Copr. 1949-1998 Hewlett-Packard Co.
2 5 = D i s c R e l i a b i l i t y :
- '
I
C. Girvin Harkins Born in Colorado Ci ty, Texas, Gin/ in Harkins earned a BA degree f rom McMurry Col lege in 1960 and advanced degrees in physical chemistry f rom Johns Hopkins Univers i ty (MA 1962 and PhD 1964) . Before coming to HP Laborator ies in 1978, he
was an assistant professor at the Southwest Center for Advanced Studies and an adjunct professor of materials science at Rice University. He is currently a pro ject manager for sur face mount technology and teaches corros ion shor t courses in h is spare t ime because he st i l l loves the c lassroom. Girv in is marr ied, has three ch i ldren, and l ives in Sun nyvale. California. A retired Scoutmaster, he enjoys backpack ing and sk i ing.
Stephan P . Howe Stephen Howe is a s t ruc- tura ' ar |d mechanical en- g ineer wi th degrees f rom the University of Cal i fornia at Los Angeles (BS 1971) and the Univers i ty of Cal i fornia at Berkeley (MSME 1973 and MEng in Civil Engineering 1975). He
J * W Ã W P < n ' ; j o i n e d H P i n 1 9 8 5 a f t e r working on mass storage recording technology for a number of other electronics and computer com panies. At HP he has invest igated disc re l iabi l i ty , including corrosion, wear, and glide/burnish issues. Stephan was born in Panama City, Florida and cur rently lives in Boise, Idaho with his wife and two chil dren. His outs ide in terests inc lude sk i rac ing and tennis.
Clifford K. Day A pro jec t manager a t HP's Disc Memory Division, Cliff Day has been with HP since 1979 . H is work has cen tered on disc and head re l iabi l i ty, test system de-
| ve lopment , and product engineer ing. He was born in Caldwel l , Idaho and
• served in the U.S. Air Force before receiving a BSEE degree from the University of Idaho in 1 966. He also earned an MSEE degree f rom Washington State Univers i ty in 1969 and a PhD degree from Iowa State University in 1 971 . Be fore jo in ing HP he worked on ins t rumenta t ion de ve lopment for two other companies. Dur ing h is career he has authored or coauthored a number of technical papers on instrumentat ion systems, and his work has resulted in several patents in the same field. Cliff lives in Meridian, Idaho, is married, and has three children and one grandson. A pilot s ince age 16, he a lso enjoys f ish ing and hunt ing.
Paul Poorman _ B o m i n I v y l a n d , P e n n s y l -
^ f l j ^ ^ t v a n i a . P a u l P o o r m a n graduated from the Univer-
M ^ Â ¿ Ã § : s i t y o f i l l i n o i s w i t h a B S M E g P d e g r e e i n 1 9 7 9 . A f t e r c o m - f i n g t o H P ' s D i s c M e m o r y D i
v is ion the same year he ^ â € ¢ k w o r k e d o n m a g n e t i c h e a d
deve lopment and on the I f r i c t ion and cor ros ion as
pects of disc reliabil ity. He also completed work for an MSME degree from Stanford University in 1 984. Paul is a resident of Mer id ian, Idaho and l ikes bicycling and cross-country skiing. He says he has found out that life on a farm is not filled with leisure.
34 zz Manufactur ing
Darrel R. Bloomquist With HP since 1 980, Darrel B loomquist has worked on al l aspects of the manufac tur ing process for thin-f i lm media. He earned a BA de gree in chemistry in 1975 f rom Northwest Nazarene College and a PhD degree in physical chemistry in 1980 f rom Washington
State University. Several patent applications have resulted from his work on sputtering target design and In- l ine deposi t ion equipment and tool ing. He is also the author often articles on various subjects in chemistry. Darrel was born in Elkhart , Indiana and now lives ¡n Boise, Idaho with his wife and two children . He's a private pilot and enjoys radio-con t ro l led mode l a i rp lanes, camping, and o ther ou t door activit ies.
Richard S. Seymour At HP 's D isc Memory D iv i s ion s ince 1980, Rick Seymour is the sect ion manager for th in-f i lm disc product ion. He has a lso wo rked as an R&D en gineer on dielectr ic th in- f i lm sputtering and ceramic pol ish ing. He was born in Champaign, I l l inois and
earned a BSEE degree from the University of Ill inois in 1980. A resident of Boise, Idaho, he 's marr ied and l ikes high-performance automobiles and auto racing.
Glenn E. Moore, Jr . Manager of HP's Magnetic Record ing Techno logy Center at Boise, Idaho, Glenn Moore has been with HP s ince 1977 . He man aged the thin-f i lm disc pro gram from i ts incept ion in 1 977 and also directed the thin-f i lm head program. He was born in Washington,
D.C. and s tud ied phys ics a t the Univers i ty o f I l linois, receiving a BS degree ¡n 1 963, an MS degree ¡n 1965, and a PhD degree in 1968. Before joining HP he worked on magnet ic t ransducers and I I I -V semiconductors at Bell Laboratories. His work has resulted ¡n a patent on magnetic transducers and he is the author of over ten technical papers. Glenn is marr ied, has three sons, and l ives in Boise, Idaho. One of h is hobbies is growing roses.
3 6 " T h i n - F i l m D i s c s : D e s i g n I ^ ^ ^ Z I ^ ^
Michael C. Allyn Born in Fort Madison, Iowa,
^ j ^ ^ ^ ^ M i k e A l l y n h a s a B S E E d e - ^ r ^ k g r e e a w a r d e d b y I o w a
^ L S t a t e U n i v e r s i t y i n 1 9 8 1 . ^ d " ^ 1 A f t e r c o m i n g t o H P i n 1 9 8 1
f h e w a s a c h a r a c t e r i z a t i o n engineer for th in-f i lm head des ign. More recent ly he
^ S r ( ^ h a s d e v e l o p e d s p e c i f i c a - _ < A l H E ^ * ^ _ t i o n s a n d i n t e r p r e t e d t e s t
da ta wh i le work ing w i th d isc dr ive pro jec t en gineers. His professional interests include magnet ics and circuit design. Mike l ives ¡n Boise, Idaho and is a volunteer at Boise Valley Samaritan Village. He enjoys astronomy, backpacking, kayaking, and ski ing during his leisure t ime.
Peter R. Goglia Peter Gogl ia was born in
a Syracuse, New York and was educated at Cornel l Universi ty (BSME 1975)
- \ ^ _ / a n d a t t h e U n i v e r s i t y o f I l linois (MSME 1 977 and PhD Mechanical Engineer ing 1982). An R&D engineer at HP since 1 982, he has con tr ibuted to the development
of thin-f i lm discs and heads and is currently work ing on head/media technology. He ¡s the author or coauthor of n ine ar t ic les on e lastohydrodynamic lubr icat ion and high-speed rotor balance opt imiza t ion. His professional in terests inc lude disc head f l igh t and f lexure dynamics and d isc mechanica l properties. Peter, his wife, and his son live ¡n Boise, Idaho. He enjoys running, cross-country sk i ing, and touring the Sawtooth Mountains. He is also re s tor ing h is home, which dates f rom 1909
Scott R. Smay Scot t Smay was born in Minneapol is , Minnesota and s tud ied e lec t r i ca l en gineering at Iowa State Uni vers i t y , f rom wh ich he re ce ived a BSEE degree in 1980. After jo ining HP's Disc Memory Div is ion the same year , he contr ibuted
• to the development of thin- f i lm d iscs and heads and he lped des ign the HP 97501 A Disc Drive. Scott l ives in Boise, Idaho, is interested ¡n magnetic recording, and likes to study physics. He a lso enjoys kayaking, sk i ing, and explor ing Idaho.
NOVEMBER 1985 HEWLETT-PACKARD JOURNAL 33
© Copr. 1949-1998 Hewlett-Packard Co.
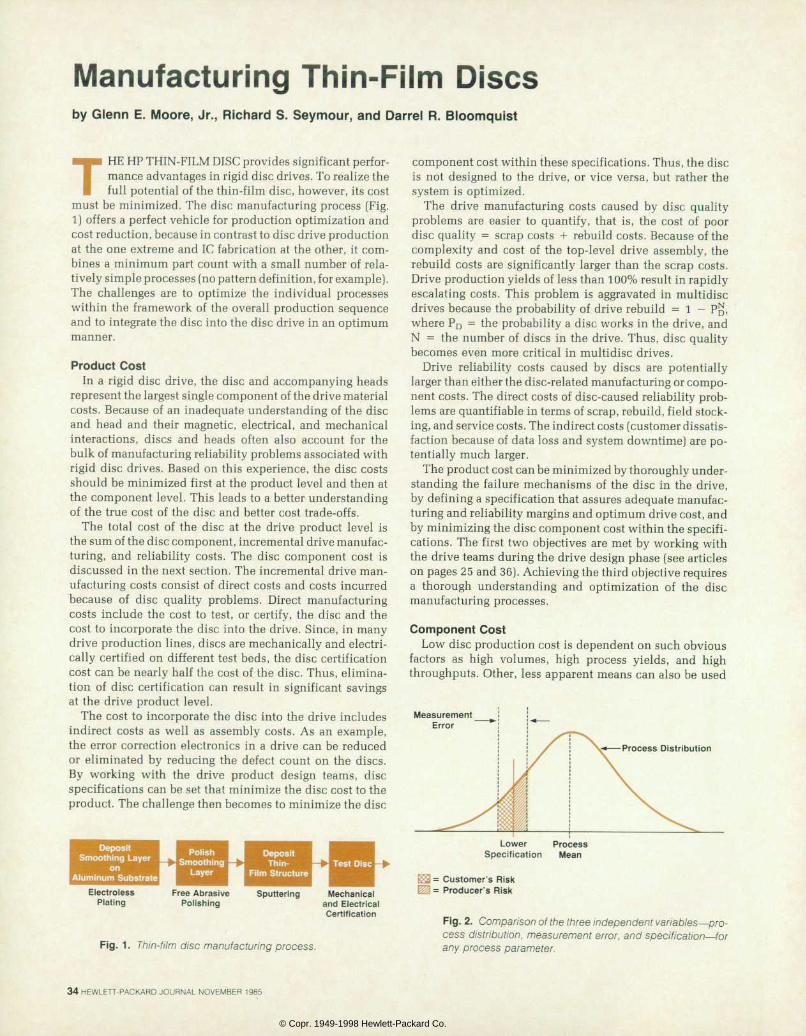
Manufacturing Thin-Film Discs by Glenn E. Moore, Jr . , Richard S. Seymour, and Darrel R. Bloomquist
THE HP THIN-FILM DISC provides significant perfor mance advantages in rigid disc drives. To realize the full potential of the thin-film disc, however, its cost
must be minimized. The disc manufacturing process (Fig. 1) offers a perfect vehicle for production optimization and cost reduction, because in contrast to disc drive production at the one extreme and 1C fabrication at the other, it com bines a minimum part count with a small number of rela tively simple processes (no pattern definition, for example). The challenges are to optimize the individual processes within the framework of the overall production sequence and to integrate the disc into the disc drive in an optimum manner.
Product Cost In a rigid disc drive, the disc and accompanying heads
represent the largest single component of the drive material costs. Because of an inadequate understanding of the disc and head and their magnetic, electrical, and mechanical interactions, discs and heads often also account for the bulk of manufacturing reliability problems associated with rigid disc drives. Based on this experience, the disc costs should be minimized first at the product level and then at the component level. This leads to a better understanding of the true cost of the disc and better cost trade-offs.
The total cost of the disc at the drive product level is the sum of the disc component, incremental drive manufac turing, and reliability costs. The disc component cost is discussed in the next section. The incremental drive man ufacturing costs consist of direct costs and costs incurred because of disc quality problems. Direct manufacturing costs include the cost to test, or certify, the disc and the cost to incorporate the disc into the drive. Since, in many drive production lines, discs are mechanically and electri cally certified on different test beds, the disc certification cost can be nearly half the cost of the disc. Thus, elimina tion of disc certification can result in significant savings at the drive product level.
The cost to incorporate the disc into the drive includes indirect costs as well as assembly costs. As an example, the error correction electronics in a drive can be reduced or eliminated by reducing the defect count on the discs. By working with the drive product design teams, disc specifications can be set that minimize the disc cost to the product. The challenge then becomes to minimize the disc
component cost within these specifications. Thus, the disc is not designed to the drive, or vice versa, but rather the system is optimized.
The drive manufacturing costs caused by disc quality problems are easier to quantify, that is, the cost of poor disc quality = scrap costs + rebuild costs. Because of the complexity and cost of the top-level drive assembly, the rebuild costs are significantly larger than the scrap costs. Drive production yields of less than 100% result in rapidly escalating costs. This problem is aggravated in multidisc drives because the probability of drive rebuild = 1 — P£{, where PD = the probability a disc works in the drive, and N = the number of discs in the drive. Thus, disc quality becomes even more critical in multidisc drives.
Drive reliability costs caused by discs are potentially larger than either the disc-related manufacturing or compo nent costs. The direct costs of disc-caused reliability prob lems are quantifiable in terms of scrap, rebuild, field stock ing, and service costs. The indirect costs (customer dissatis faction because of data loss and system downtime) are po tentially much larger.
The product cost can be minimized by thoroughly under standing the failure mechanisms of the disc in the drive, by defining a specification that assures adequate manufac turing and reliability margins and optimum drive cost, and by minimizing the disc component cost within the specifi cations. The first two objectives are met by working with the drive teams during the drive design phase (see articles on pages 25 and 36). Achieving the third objective requires a thorough understanding and optimization of the disc manufacturing processes.
Component Cost Low disc production cost is dependent on such obvious
factors as high volumes, high process yields, and high throughputs. Other, less apparent means can also be used
Measurement Error
Process Distribution
Lower Spec i f i ca t i on
Fig. 1 . Thin- f i lm disc manufactur ing process.
Customer's Risk Producer's Risk
Fig. 2. Comparison of the three independent variables — pro cess distr ibution, measurement error, and specif ication — for any process parameter .
34 HEWLETT-PACKARD JOURNAL NOVEMBER 1985
© Copr. 1949-1998 Hewlett-Packard Co.
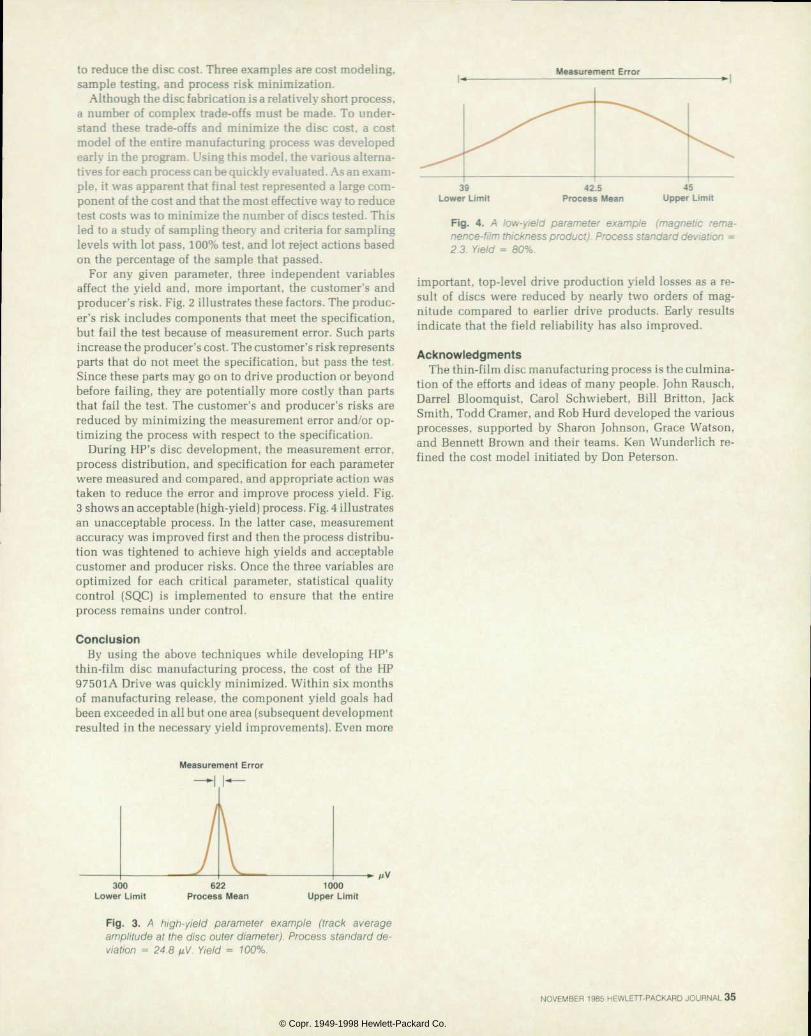
to reduce the disc cost. Three examples are cost modeling. sample testing, and process risk minimization.
Although the disc fabrication is a relatively short process, a number of complex trade-offs must be made. To under stand these trade-offs and minimize the disc cost, a cost model of the entire manufacturing process was developed early in the program. Using this model, the various alterna tives for each process can be quickly evaluated. As an exam ple, it was apparent that final test represented a large com ponent of the cost and that the most effective way to reduce test costs was to minimize the number of discs tested. This led to a study of sampling theory and criteria for sampling levels with lot pass, 100% test, and lot reject actions based on the percentage of the sample that passed.
For any given parameter, three independent variables affect the yield and, more important, the customer's and producer's risk. Fig. 2 illustrates these factors. The produc er's risk includes components that meet the specification, but fail the test because of measurement error. Such parts increase the producer's cost. The customer's risk represents parts that do not meet the specification, but pass the test. Since these parts may go on to drive production or beyond before failing, they are potentially more costly than parts that fail the test. The customer's and producer's risks are reduced by minimizing the measurement error and/or op timizing the process with respect to the specification.
During HP's disc development, the measurement error, process distribution, and specification for each parameter were measured and compared, and appropriate action was taken to reduce the error and improve process yield. Fig. 3 shows an acceptable (high-yield) process. Fig. 4 illustrates an unacceptable process. In the latter case, measurement accuracy was improved first and then the process distribu tion was tightened to achieve high yields and acceptable customer and producer risks. Once the three variables are optimized for each critical parameter, statistical quality control (SQC) is implemented to ensure that the entire process remains under control.
Conclusion By using the above techniques while developing HP's
thin-film disc manufacturing process, the cost of the HP 97501A Drive was quickly minimized. Within six months of manufacturing release, the component yield goals had been exceeded in all but one area (subsequent development resulted in the necessary yield improvements). Even more
Measurement Error
42.5 Process Mean
45 Upper Limit
F i g . 4 . A l o w - y i e l d p a r a m e t e r e x a m p l e ( m a g n e t i c r e m a - nence-f i lm th ickness product) . Process standard deviat ion = 2 .3 . Y ie ld = 80%.
important, top-level drive production yield losses as a re sult of discs were reduced by nearly two orders of mag nitude compared to earlier drive products. Early results indicate that the field reliability has also improved.
Acknowledgments The thin-film disc manufacturing process is the culmina
tion of the efforts and ideas of many people. John Rausch, Darrel Bloomquist, Carol Schwiebert, Bill Britton, Jack Smith, Todd Cramer, and Rob Hurd developed the various processes, supported by Sharon Johnson, Grace Watson, and Bennett Brown and their teams. Ken Wunderlich re fined the cost model initiated by Don Peterson.
Measurement Error
300 Lower Limit
622 Process Mean
1000 Upper Limit
F i g . 3 . A h i g h - y i e l d p a r a m e t e r e x a m p l e ( t r a c k a v e r a g e ampl i tude a t the d isc outer d iameter ) . Process s tandard de v i a t i on = 24 .8 f iV . Y ie l d = 100%.
NOVEMBER 1985 HEWLETT-PACKARD JOURNAL 35
© Copr. 1949-1998 Hewlett-Packard Co.
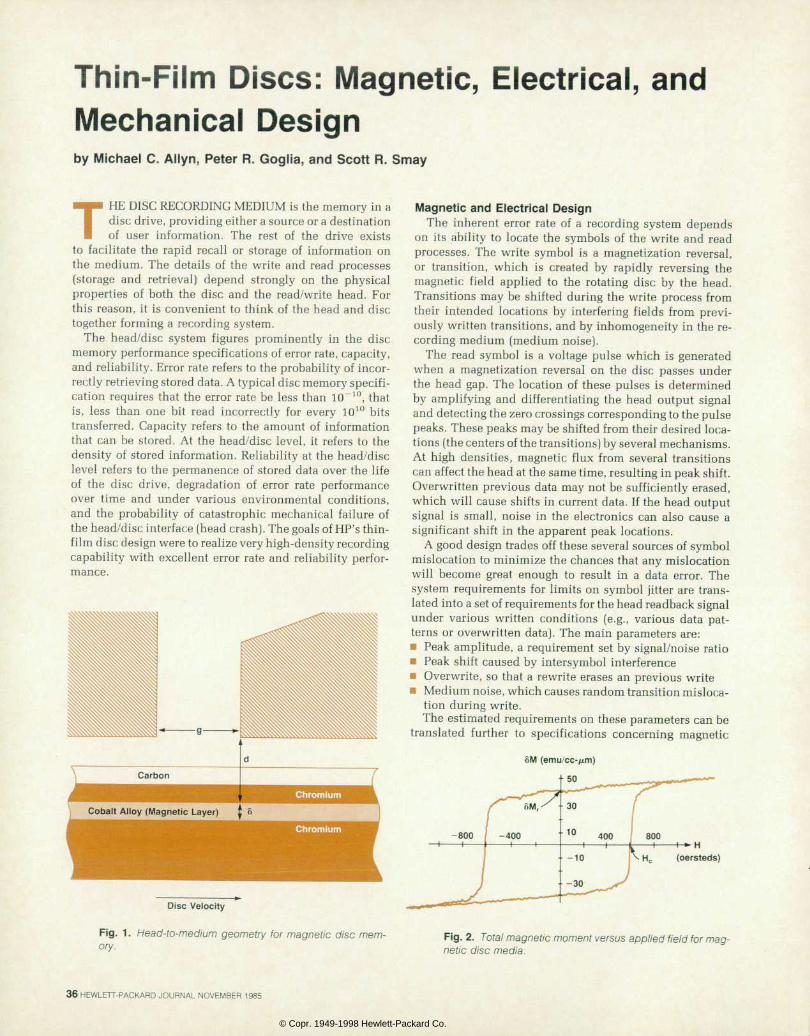
Thin-Film Discs: Magnetic, Electrical, and Mechanical Design by Michael C. Al lyn, Peter R. Gogl ia , and Scott R. Smay
THE DISC RECORDING MEDIUM is the memory in a disc drive, providing either a source or a destination of user information. The rest of the drive exists
to facilitate the rapid recall or storage of information on the medium. The details of the write and read processes (storage and retrieval) depend strongly on the physical properties of both the disc and the read/write head. For this reason, it is convenient to think of the head and disc together forming a recording system.
The head/disc system figures prominently in the disc memory performance specifications of error rate, capacity, and reliability. Error rate refers to the probability of incor rectly retrieving stored data. A typical disc memory specifi cation requires that the error rate be less than 10~10, that is, less than one bit read incorrectly for every 1010 bits transferred. Capacity refers to the amount of information that can be stored. At the head/disc level, it refers to the density of stored information. Reliability at the head/disc level refers to the permanence of stored data over the life of the disc drive, degradation of error rate performance over time and under various environmental conditions, and the probability of catastrophic mechanical failure of the head/disc interface (head crash). The goals of HP's thin- film disc design were to realize very high-density recording capability with excellent error rate and reliability perfor mance.
Cobalt Al loy (Magnetic Layer)
Magnetic and Electr ical Design The inherent error rate of a recording system depends
on its ability to locate the symbols of the write and read processes. The write symbol is a magnetization reversal, or transition, which is created by rapidly reversing the magnetic field applied to the rotating disc by the head. Transitions may be shifted during the write process from their intended locations by interfering fields from previ ously written transitions, and by inhomogeneity in the re cording medium (medium noise).
The read symbol is a voltage pulse which is generated when a magnetization reversal on the disc passes under the head gap. The location of these pulses is determined by amplifying and differentiating the head output signal and detecting the zero crossings corresponding to the pulse peaks. These peaks may be shifted from their desired loca tions (the centers of the transitions) by several mechanisms. At high densities, magnetic flux from several transitions can affect the head at the same time, resulting in peak shift. Overwritten previous data may not be sufficiently erased, which will cause shifts in current data. If the head output signal is small, noise in the electronics can also cause a significant shift in the apparent peak locations.
A good design trades off these several sources of symbol mislocation to minimize the chances that any mislocation will become great enough to result in a data error. The system requirements for limits on symbol jitter are trans lated into a set of requirements for the head readback signal under various written conditions (e.g., various data pat terns or overwritten data). The main parameters are: • Peak amplitude, a requirement set by signal/noise ratio • Peak shift caused by intersymbol interference • Overwrite, so that a rewrite erases an previous write • Medium noise, which causes random transition misloca
tion during write. The estimated requirements on these parameters can be
translated further to specifications concerning magnetic
5M (emu/cc-pm)
50
Disc Velocity
F i g . 1 . H e a d - t o - m e d i u m g e o m e t r y f o r m a g n e t i c d i s c m e m ory.
H (oersteds)
Fig . 2 . Tota l magnet ic moment versus app l ied f ie ld fo r mag net ic d isc media.
36 HEWLETT-PACKARD JOURNAL NOVEMBER 1985
© Copr. 1949-1998 Hewlett-Packard Co.
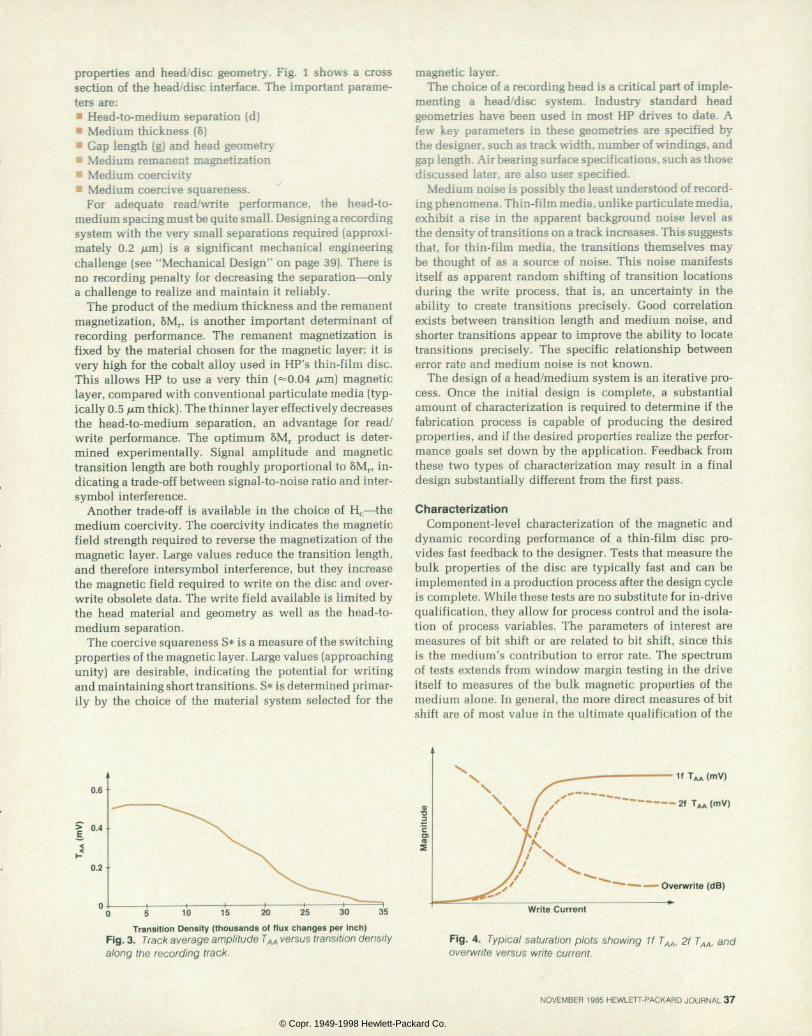
properties and head/disc geometry. Fig. 1 shows a cross section of the head/disc interface. The important parame ters are: • Head-to-medium separation (d) • Medium thickness (8) " Gap length (g) and head geometry • Medium remanent magnetization • Medium coercivity • Medium coercive squareness.
For adequate read/write performance, the head-to- medium spacing must be quite small. Designing a recording system with the very small separations required (approxi mately 0.2 ¿im) is a significant mechanical engineering challenge (see "Mechanical Design" on page 39). There is no recording penalty for decreasing the separation — only a challenge to realize and maintain it reliably.
The product of the medium thickness and the remanent magnetization, 5Mr> is another important determinant of recording performance. The remanent magnetization is fixed by the material chosen for the magnetic layer; it is very high for the cobalt alloy used in HP's thin-film disc. This allows HP to use a very thin («0.04 iJ.ro] magnetic layer, compared with conventional particulate media (typ ically 0.5 ¿im thick). The thinner layer effectively decreases the head-to-medium separation, an advantage for read/ write performance. The optimum 8Mr product is deter mined experimentally. Signal amplitude and magnetic transition length are both roughly proportional to 8Mr, in dicating a trade-off between signal-to-noise ratio and inter- symbol interference.
Another trade-off is available in the choice of Hc — the medium coercivity. The coercivity indicates the magnetic field strength required to reverse the magnetization of the magnetic layer. Large values reduce the transition length, and therefore intersymbol interference, but they increase the magnetic field required to write on the disc and over write obsolete data. The write field available is limited by the head material and geometry as well as the head-to- medium separation.
The coercive squareness S is a measure of the switching properties of the magnetic layer. Large values (approaching unity) are desirable, indicating the potential for writing and maintaining short transitions. S is determined primar ily by the choice of the material system selected for the
magnetic layer. The choice of a recording head is a critical part of imple
menting a head/disc system. Industry standard head geometries have been used in most HP drives to date. A few key parameters in these geometries are specified by the designer, such as track width, number of windings, and gap length. Air bearing surface specifications, such as those discussed later, are also user specified.
Medium noise is possibly the least understood of record ing phenomena. Thin-film media, unlike particulate media, exhibit a rise in the apparent background noise level as the density of transitions on a track increases. This suggests that, for thin-film media, the transitions themselves may be thought of as a source of noise. This noise manifests itself as apparent random shifting of transition locations during the write process, that is, an uncertainty in the ability to create transitions precisely. Good correlation exists between transition length and medium noise, and shorter transitions appear to improve the ability to locate transitions precisely. The specific relationship between error rate and medium noise is not known.
The design of a head/medium system is an iterative pro cess. Once the initial design is complete, a substantial amount of characterization is required to determine if the fabrication process is capable of producing the desired properties, and if the desired properties realize the perfor mance goals set down by the application. Feedback from these two types of characterization may result in a final design substantially different from the first pass.
Characterization Component-level characterization of the magnetic and
dynamic recording performance of a thin-film disc pro vides fast feedback to the designer. Tests that measure the bulk properties of the disc are typically fast and can be implemented in a production process after the design cycle is complete. While these tests are no substitute for in-drive qualification, they allow for process control and the isola tion of process variables. The parameters of interest are measures of bit shift or are related to bit shift, since this is the medium's contribution to error rate. The spectrum of tests extends from window margin testing in the drive itself to measures of the bulk magnetic properties of the medium alone. In general, the more direct measures of bit shift are of most value in the ultimate qualification of the
Trans i t ion Dens i ty ( thousands of f lux changes per inch) F i g . 3 . T r a c k a v e r a g e a m p l i t u d e T A A v e r s u s t r a n s i t i o n d e n s i t y a l o n g t h e r e c o r d i n g t r a c k .
2f
1 f T A A ( m V )
Overwrite (dB)
Write Current
Fig. 4 . Typ ica l saturat ion p lo ts snowing 1f TAA, 2 f TAA, and overwri te versus wri te current.
NOVEMBER 1985 HEWLETT-PACKARD JOURNAL 37
© Copr. 1949-1998 Hewlett-Packard Co.
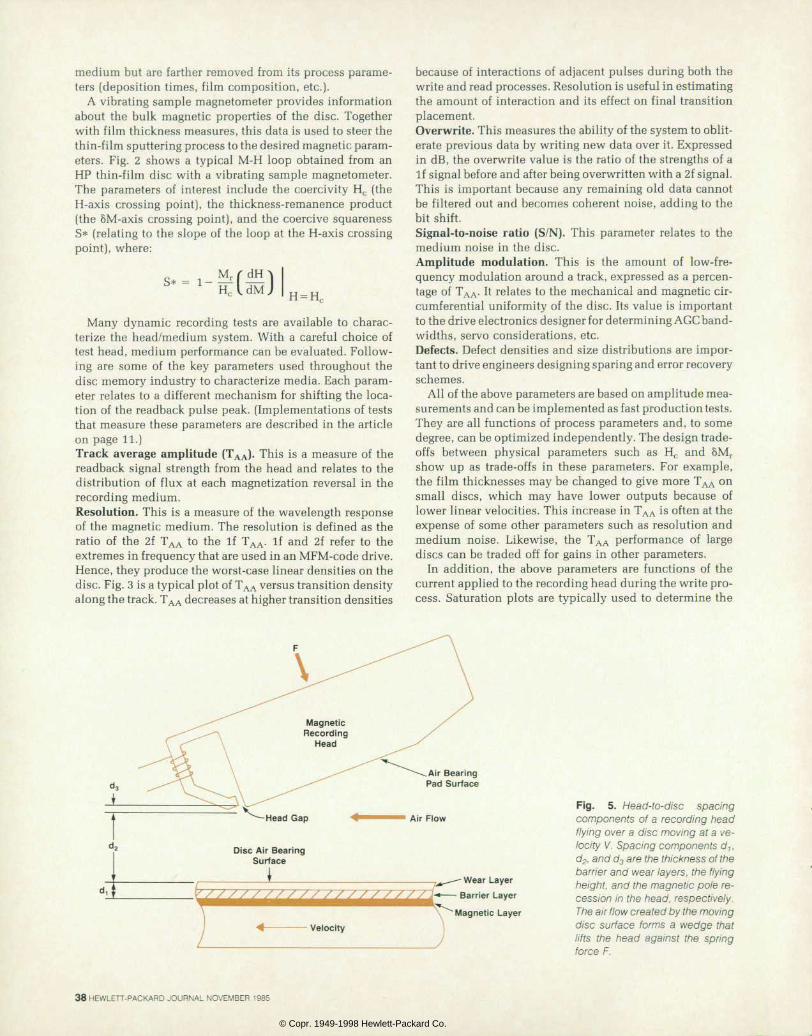
medium but are farther removed from its process parame ters (deposition times, film composition, etc.).
A vibrating sample magnetometer provides information about the bulk magnetic properties of the disc. Together with film thickness measures, this data is used to steer the thin-film sputtering process to the desired magnetic param eters. Fig. 2 shows a typical M-H loop obtained from an HP thin-film disc with a vibrating sample magnetometer. The parameters of interest include the coercivity Hc (the H-axis crossing point), the thickness-remanence product (the SM-axis crossing point), and the coercive squareness S (relating to the slope of the loop at the H-axis crossing point), where:
H = HC
Many dynamic recording tests are available to charac terize the head/medium system. With a careful choice of test head, medium performance can be evaluated. Follow ing are some of the key parameters used throughout the disc memory industry to characterize media. Each param eter relates to a different mechanism for shifting the loca tion of the readback pulse peak. (Implementations of tests that measure these parameters are described in the article on page 11.) Track average amplitude (TAA). This is a measure of the readback signal strength from the head and relates to the distribution of flux at each magnetization reversal in the recording medium. Resolution. This is a measure of the wavelength response of the magnetic medium. The resolution is defined as the ratio of the 2f TAA to the If TAA. If and 2f refer to the extremes in frequency that are used in an MFM-code drive. Hence, they produce the worst-case linear densities on the disc. Fig. 3 is a typical plot of T^ versus transition density along the track. TAA decreases at higher transition densities
because of interactions of adjacent pulses during both the write and read processes. Resolution is useful in estimating the amount of interaction and its effect on final transition placement. Overwrite. This measures the ability of the system to oblit erate previous data by writing new data over it. Expressed in dB, the overwrite value is the ratio of the strengths of a If signal before and after being overwritten with a 2f signal. This is important because any remaining old data cannot be filtered out and becomes coherent noise, adding to the bit shift. Signal-to-noise ratio (S/N). This parameter relates to the medium noise in the disc. Ampli tude modulat ion. This is the amount of low-fre quency modulation around a track, expressed as a percen tage of TAA. It relates to the mechanical and magnetic cir cumferential uniformity of the disc. Its value is important to the drive electronics designer for determining AGC band- widths, servo considerations, etc. Defects. Defect densities and size distributions are impor tant to drive engineers designing sparing and error recovery schemes.
All of the above parameters are based on amplitude mea surements and can be implemented as fast production tests. They are all functions of process parameters and, to some degree, can be optimized independently. The design trade offs between physical parameters such as Hc and 8Mr show up as trade-offs in these parameters. For example, the film thicknesses may be changed to give more T^ on small discs, which may have lower outputs because of lower linear velocities. This increase in TAA is often at the expense of some other parameters such as resolution and medium noise. Likewise, the TAA performance of large discs can be traded off for gains in other parameters.
In addition, the above parameters are functions of the current applied to the recording head during the write pro cess. Saturation plots are typically used to determine the
F
,^, — Wear Layer - Barrier Layer
Magnetic Layer Velocity
F i g . 5 . H e a d - t o - d i s c s p a c i n g componen ts o f a record ing head f l y ing over a d isc mov ing a t a ve loc i ty V. Spacing components d1: d2, and d3 are the thickness of the barr ier and wear layers, the f ly ing he igh t , and the magnet ic po le re cession in the head, respect ively. The air f low created by the moving d i sc su r face fo rms a wedge tha t l i f t s t he head aga ins t t he sp r ing force F.
38 HEWLETT-PACKARD JOURNAL NOVEMBER 1985
© Copr. 1949-1998 Hewlett-Packard Co.
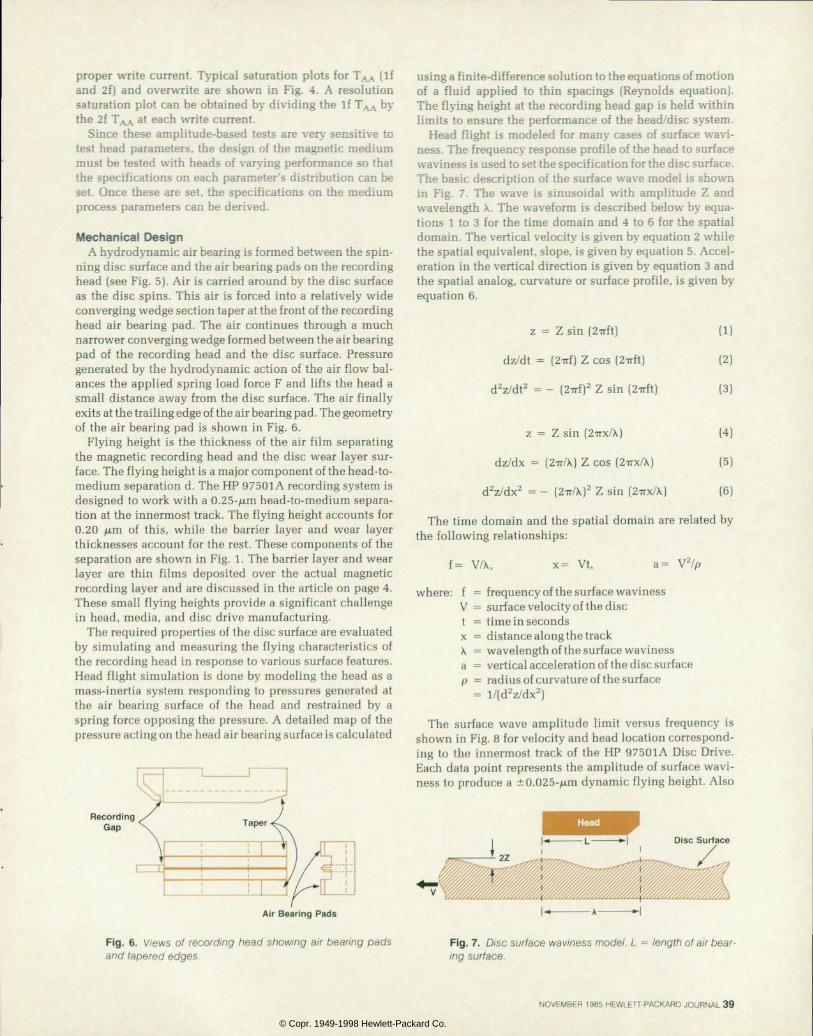
proper write current. Typical saturation plots for TAA (If and 2f) and overwrite are shown in Fig. 4. A resolution saturation plot can be obtained by dividing the If T^A by the 2f TAA at each write current.
Since these amplitude-based tests are very sensitive to test head parameters, the design of the magnetic medium must be tested with heads of varying performance so that the specifications on each parameter's distribution can be set. Once these are set, the specifications on the medium process parameters can be derived.
Mechanical Design A hydrodynamic air bearing is formed between the spin
ning disc surface and the air bearing pads on the recording head (see Fig. 5). Air is carried around by the disc surface as the disc spins. This air is forced into a relatively wide converging wedge section taper at the front of the recording head air bearing pad. The air continues through a much narrower converging wedge formed between the air bearing pad of the recording head and the disc surface. Pressure generated by the hydrodynamic action of the air flow bal ances the applied spring load force F and lifts the head a small distance away from the disc surface. The air finally exits at the trailing edge of the air bearing pad. The geometry of the air bearing pad is shown in Fig. 6.
Flying height is the thickness of the air film separating the magnetic recording head and the disc wear layer sur face. The flying height is a major component of the head-to- medium separation d. The HP 97501A recording system is designed to work with a 0.25-/am head-to-medium separa tion at the innermost track. The flying height accounts for 0.20 (¿m of this, while the barrier layer and wear layer thicknesses account for the rest. These components of the separation are shown in Fig. 1. The barrier layer and wear layer are thin films deposited over the actual magnetic recording layer and are discussed in the article on page 4. These small flying heights provide a significant challenge in head, media, and disc drive manufacturing.
The required properties of the disc surface are evaluated by simulating and measuring the flying characteristics of the recording head in response to various surface features. Head flight simulation is done by modeling the head as a mass-inertia system responding to pressures generated at the air bearing surface of the head and restrained by a spring force opposing the pressure. A detailed map of the pressure acting on the head air bearing surface is calculated
Recording Gap
Air Bearing Pads
F ig . 6 . V iews o f r eco rd ing head show ing a i r bea r i ng pads and tapered edges.
using a finite-difference solution to the equations of motion of a fluid applied to thin spacings (Reynolds equation). The flying height at the recording head gap is held within limits to ensure the performance of the head/disc system.
Head flight is modeled for many cases of surface wavi- ness. The frequency response profile of the head to surface waviness is used to set the specification for the disc surface. The basic description of the surface wave model is shown in Fig. 7. The wave is sinusoidal with amplitude Z and wavelength X. The waveform is described below by equa tions 1 to 3 for the time domain and 4 to 6 for the spatial domain. The vertical velocity is given by equation 2 while the spatial equivalent, slope, is given by equation 5. Accel eration in the vertical direction is given by equation 3 and the spatial analog, curvature or surface profile, is given by equation 6.
z = Z sin (2-nh)
dz/dt = (2irf) Z cos (2irft)
d2z/dt2 = - (2TTÃ)2 Z sin (2irft)
z = Z sin (2-7TX/X)
dz/dx = (21T/X) Z cos (2irx/X)
d2z/dx2 = - (2-JT/X)2 Z sin (2irx/X)
(1)
(2)
(3)
(4)
(5)
(6)
The time domain and the spatial domain are related by the following relationships:
f= V/X, x= Vt, a= V2/p
where: f = frequency of the surface waviness V = surface velocity of the disc t = time in seconds x = distance along the track X = wavelength of the surface waviness a = vertical acceleration of the disc surface p = radius of curvature of the surface
= l/(d2z/dx2)
The surface wave amplitude limit versus frequency is shown in Fig. 8 for velocity and head location correspond ing to the innermost track of the HP 97501A Disc Drive. Each data point represents the amplitude of surface wavi ness to produce a ±0.025-pim dynamic flying height. Also
U L H D i s c S u r f a c e
Fig . 7 . D isc sur face wav iness mode l . L = length o f a i r bear ing surface.
NOVEMBER 1985 HEWLETT-PACKARD JOURNAL 39
© Copr. 1949-1998 Hewlett-Packard Co.
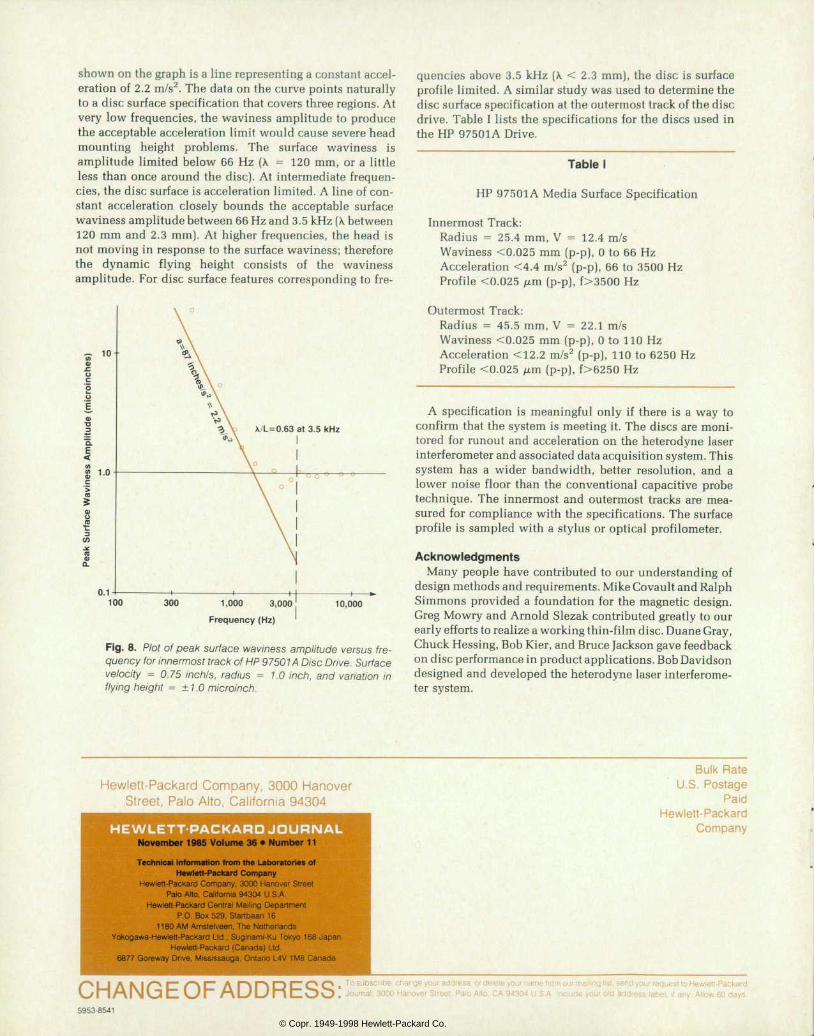
shown on the graph is a line representing a constant accel eration of 2.2 m/s2. The data on the curve points naturally to a disc surface specification that covers three regions. At very low frequencies, the waviness amplitude to produce the acceptable acceleration limit would cause severe head mounting height problems. The surface waviness is amplitude limited below 66 Hz (X = 120 mm, or a little less than once around the disc). At intermediate frequen cies, the disc surface is acceleration limited. A line of con stant acceleration closely bounds the acceptable surface waviness amplitude between 66 Hz and 3.5 kHz (X. between 120 mm and 2.3 mm). At higher frequencies, the head is not moving in response to the surface waviness; therefore the dynamic flying height consists of the waviness amplitude. For disc surface features corresponding to fre-
100 3 0 0 1 , 0 0 0 3 , 0 0 0
Frequency (Hz) 10,000
Fig . 8 . P lo t o f peak sur face wav iness ampl i tude versus f re quency for innermost track of HP 97501 A Disc Drive. Surface ve l oc i t y = 0 .75 i nch / s , r ad i us = 1 .0 i nch , and va r i a t i on i n f ly ing height = ±1.0 microinch.
quencies above 3.5 kHz (K < 2.3 mm), the disc is surface profile limited. A similar study was used to determine the disc surface specification at the outermost track of the disc drive. Table I lists the specifications for the discs used in the HP 97501A Drive.
Table I
HP 97501A Media Surface Specification
Innermost Track: Radius = 25.4 mm, V = 12.4 m/s Waviness <0.025 mm (p-p), 0 to 66 Hz Acceleration <4.4 m/s2 (p-p), 66 to 3500 Hz Profile <0.025 /urn (p-p), f>3500 Hz
Outermost Track: Radius = 45.5 mm, V = 22.1 m/s Waviness <0.025 mm (p-p), 0 to 110 Hz Acceleration <12.2 m/s2 (p-p), 110 to 6250 Hz Profile <0.025 /am (p-p), f>6250 Hz
A specification is meaningful only if there is a way to confirm that the system is meeting it. The discs are moni tored for runout and acceleration on the heterodyne laser interferometer and associated data acquisition system. This system has a wider bandwidth, better resolution, and a lower noise floor than the conventional capacitive probe technique. The innermost and outermost tracks are mea sured for compliance with the specifications. The surface profile is sampled with a stylus or optical profilometer.
Acknowledgments Many people have contributed to our understanding of
design methods and requirements. Mike Covault and Ralph Simmons provided a foundation for the magnetic design. Greg Mowry and Arnold Slezak contributed greatly to our early efforts to realize a working thin-film disc. Duane Gray, Chuck Hessing, Bob Kier, and Bruce Jackson gave feedback on disc performance in product applications. Bob Davidson designed and developed the heterodyne laser interferome ter system.
Hewlet t -Packard Company, 3000 Hanover Street, Palo Alto, Cal i fornia 94304
November 1985 Volume 36 • Number 11
T e c h n i c a l I n f o r m a t i o n f r o m t h e L a b o r a t o r i e s o f H e w l e t t - P a c k a r d C o m p a n y
Hewlet t -Packard Company, 3000 Hanover St reet Palo Alto, Cali fornia 94304 U.S. A
Hewlet t -Packard Centra l Mai l ing Depar tment P.O. Box 529. Star tbaan 16
1180 AM Amste lveen, The Nether lands Yokogawa-Hewlet t -Packard L td . , Sug inami-Ku Tokyo 168 Japan
Hewlet t -Packard (Canada) Ltd. 6877 Goreway Dr ive, Miss issauga, Ontar io L4V 1MB Cana
Bulk Rate U.S. Postage
Paid Hewlett-Packard
Company
/ "> l l A M^^ | "~ (~ \ r~ A r ^ r ^ ^3 C O O • Tosu l : )Scn t ' e ' cha r ' 9eyOL"ac l c l r ess o rde le l eVou rname f romour rT la i l i n9 l i s t ' se r i c | you r r eques t t o Hew le t t -Packa rd \ j I I / \ CA your VJ r~ days. f " / \ \_J \_J r " l I ^ ^ . Journa l , 3000 Hanover St reet . Pa lo A l to . CA 94304 USA Inc lude your o ld address labe l , i f any . A l low 60 days.
59538541
© Copr. 1949-1998 Hewlett-Packard Co.