1987 summary of vital statistics and terminations of pregnancy
TRANSCRIPT


TABLE OF CONTENTS
... Introduction . . . . . . . . . . . . . . . . . . . . . . . . . . . . . . . . . . . . . . . . . . i i i
Map of Washington State . . . . . . . . . . . . . . . . . . . . . . . . . . . . . . . . . . . . . . . 1
Trends . . . . . . . . . . . . . . . . . . . . . . . . . . . . . . . . . . . . . . . . . . . . . . 3
Figure 1 Birth Rates (per 1.,000 population), Washington State, 1915-1987 . . . . . . . . . . . . 6 . . . . . . . . . . . Figure 2 Death Rates (per 1,000 population), Washington State, 19 15- 1987 8
Figure 3 Infant Death Rates (per 1, 000 live births) Washington State, 1915-1987 . . . . . . . . 10 Figure4 Fetal Death Ratios (per 1, 000 live births) Washington State, 1915-1987 . . . . . . . . 12 Figure 5 Total of Induced Abortions per Year, Washington State Residents, 1974-1987 . . . . . 13 Figure 6 Total of Induced Abortions per Year, Washington State Occurrences, 1974-1987 . . . 13 Figure 7 Abortion Occurrences by Age Group, Washington State, 1986 and 1987 . . . . . . . 14 Figure 8 Resident Abortions by Age Group, Washington State,1986 and 1987 . . . . . . . . . 14 Figure 9 Maternal Deaths Attributed to Abortion, Washington State Residents, 1950-1987 . . . 15 Figure 10 Complication Rates by Type and Trimester, Washington State Occurrences, 1987 . . . 16 Figure 11 Complication Rates and Second Trimester Procedures.
Washington State Occurrences, 1982-1987 . . . . . . . . . . . . . . . . . . . . . . . 16 Figure 12 Comparative Rates by Year, Washington State Residents, 1974-1987 . . . . . . . . 17 Figure 13 Abortion Ratio by Year, Washington State Residents, 1974-1987 . . . . . . . . . . . . 17 Figure 14 Age-Specific Fertility Rates, Washington State Residents, 1978- 1987 . . . . . . . . . 18
. . . . . . . . . Figure 15 Age-Specific Abortion Rates, Washington State Residents, 1978-1987 18 . . . . . . . . Figure 16 Abortion Ratios by Age Group, Washington State Residents, 1984-1987 18
Figure 17 Abortion & Fertility Rates for Washington State Counties. Ranked in Order by Abortion Ratio . . . . . . . . . . . . . . . . . . . . . . . . . . . 19
Figure 18 Abortion & Fertility Rates, Women 15-17, for Washington State Counties. Ranked in Order by Pregnancy Rate . . . . . . . . . . . . . . . . . . . . . . . . . . . 20
Figure 19 History of Previous Induced Termination. Percentages by Patient Age Group. Washington State Residents . . . . . . . . . . . . . . . . . . . . . . . . . . . . . . . 21
Figure 20 Pregnancy History Rates & Percentages for Women 15-19 and . . . . . . . . . . . . . . 20-24 Years of Age, Washington State Residents, 198 1-1987 21
. . . . . . . . . . . . . . . . . . . . Figure 21 Abortion Facilities, Washington State, 1982-1987 22 Figure 22 Map Showing Access to Abortion Services for Counties
. . . . . . . . . . . . . . . . . . . . . . . . . . . . with >10, 000, Women Aged 15-44 22
. . . . . . . . . . . . . . . . . . . . . . . . . . . . . . . . . . . . . . . . . . . . . . Tables 23
Summary Table: Numbers with Rates for Live Births. Deaths. Deaths of Infants Under One Year of Age, Maternal Deaths and Fetal Deaths, Washington State, 1920- 1987 . . . . . . . . . . . 24
Natality . . . . . . . . . . . . . . . . . . . . . . . . . . . . . . . . . . . . . . . . . . . . . 27
Table 1 Live Births in Washington State by Selected Topics . . . . . . . . . . . . . . . . . . 28 1A Residence. Sex and Race 1B Residence. Mother's Age Group by Sex 1C Residence. Order of Live Birth to Mother 1 D Residence. Attendant at Birth

1 E Residence, Maternal Smoking 1F Residence, Multiple Live Births 1G Residence and Occurrence, Sex by Birth Weight in Grams 1H Residence and Occurrence, Live Births and Fetal Deaths by Month 1I Occurrence, Method of Delivery 1 J Occurrence, Type of Place
Table 2 Live Births by Race by Birth Weight, Washington State Residents, 1987 . . . . . . . .31
Table 3 Live Births by Mother's Age by Birth Weight, Washington State Residents, 1987 . . .31
Table 4 Live Births by Mother's Age by Month Prenatal Care Began Washington State Residents, 1987 . . . . . . . . . . . . . . . . . . . . . . . . . . . .32
Table 5 Live Births by Number of Prenatal Visits by Month Care Began, Washington State Residents, 1987 . . . . . . . . . . . . . . . . . . . . . . . . . . . .32
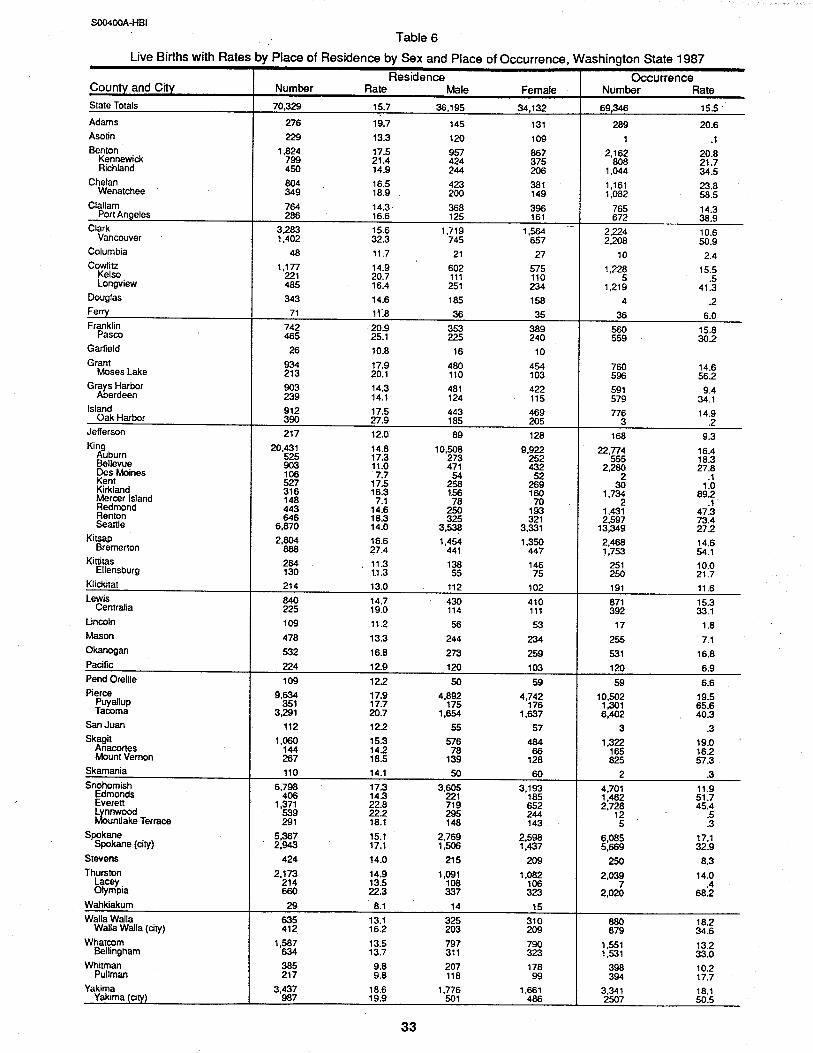
Table 6 Live Births with Rates by Place of Residence by Sex and Place of Occurrence . . . . .33
Table 7 Live Births Intercounty Travel Patterns . . . . . . . . . . . . . . . . . . . . . . . . 34
Table 8 Live Births by Race by Place of Residence . . . . . . . . . . . . . . . . . . . . . . .36
Table 9 Live Births by Mother's Age Group by Place of Residence . . . . . . . . . . . . . . .37
Table 10 Live Births by Month by Place of Residence . . . . . . . . . . . . . . . . . . . . . . .38
Table 1 1 Live Births by Birth Weight in Grams by Place of Residence . . . . . . . . . . . . .39
Table 12 Residence, Multiple Births by Number Born Alive Each Set . . . . . . . . . . . . . .40
Table 13 Live Births with Malformations with Percentof Total Births by Place of Residence . .41
Table 14 Live Births with Maternal Smoking by Mother's Place of Residence . . . . . . . . . .42
Table 15 Live Births to Single Mothers by Place of Residence by Age of Mother . . . . . . . .43
Table 16 Live Births by Institution by Place of Occurrence . . . . . . . . . . . . . . . . . . . .44
Mortality . . . . . . . . . . . . . . . . . . . . . . . . . . . . . . . . . . . . . . . . . . . .45
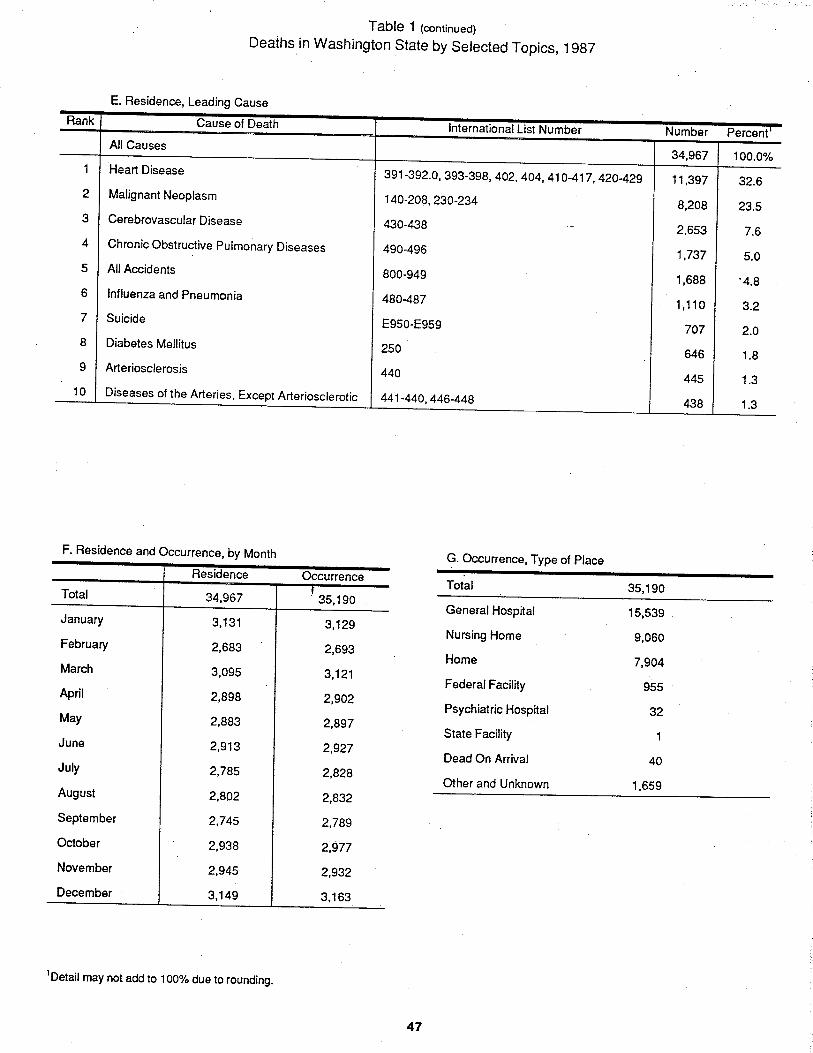
Table 1 Deaths in Washington State by Selected Topics . . . . . . . . . . . . . . . . . . . . .46 1A Residence, Sex and Race 1 B Residence, Infant Deaths by Race 1 C Residence, Age Group by Sex 1D Residence, Marital Status by Sex 1E Residence, Leading Cause 1F Residence and Occurrence, by Month 1G Occurrence, Type of Place
Table 2 Deaths with Rates and Percent by Age Group and Sex by Leading Causes . . . . . . .48

Table 3 Deaths with Rates by Selected Causes by Sex . . . . . . . . . . . . . . . . . . . . . . 50
Table 4 Deaths Due to Malignant Neoplasm by Primary Sight with Rates by Sex . . . . . . . . 52
Table 5 Deaths by Non-Transport Causes by Place of Accident. . . . . . . . . . . . . . . . . . . . . . . . . . . . . . . Washington State Residents .53
. . . . . . . . . . . . . . . . Table 6 Deaths with Rates by Place of Residence and Occurrence 54
Table 7 Deaths by Sex and Race by Place of Residence . . . . . . . . . . . . . . . . . . . . . 55
Table 8 Deaths by Age Group by Place of Residence . . . . . . . . . . . . . . . . . . . . . . 56
. . . . . . . . . . . . . . . . . Table 9 Deaths by Month of Occurrence by Place of Residence 57
Table 10 Deaths with Rates by Selected Causes by Place of Residence Infectious and Parasitic Diseases. Diabetes Mellitus. Alcoholism. Diseases of the Heart, and Cerebrovascular Disease . . . . . . . . . . . . . . . . . . . 58
Table 11 Deaths with Rates by Selected Causes by Place of Residence General Arteriosclerosis. Influenza and Pneumonia. Chronic Obstructive Pulmonary Diseases. Cirrhosis of the Liver. and Nephritis. Nephrotic Syndrome. Nephrosis . . . . . . . . . . . . . . . . . . . . . . . . . . . . . 59
Table 12 Deaths Due to Malignant Neoplasm by Primary Site with Rates by Place of Residence . . . . . . . . . . . . . . . . . . . . . . . . . . . . . . . . . . . 60
Table 13 Deaths Due to Human Immunodeficiency Virus with Rates . . . . . . . . . . . . . . . . . . . . . . . . . . . . . . . . . . . . by Place of Residence 62
Table 14 Deaths with Rates by External Causes by Place of Residence Motor Vehicle, Falls. Drownings, Fires, All Other Accidents . . . . . . . . . . . . . . 63
Table 15 Deaths with Rates by Extemal Causes by Place of Residence . . . . . . . . . . . . . . . . . . . Suicide, Homicide, Undetermined External Injuries 64
Table 16 Deaths by Month by Selected Causes, Washington State Occurrences . . . . . . . . . 65
Table 17 Deaths Due to Human Immunodeficiency Virus with Rates . . . . . . . . . . . . . . . . . . . . . . . . . . . . . . . . . . by Place of Occurrence 66
Table 18 Deaths with Rates by External Causes by Place of Occurrence . . . . . . . . . . . . . . Motor Vehicle. Falls. Drownings,Fires. All Other Accidents 67
Table 19 Deaths with Rates by External Causes by Place of Occurrence . . . . . . . . . . . . . . . . . . . Suicide. Homicide. Undetermined External Injuries 68
. . . . . . . . . . . . . . . . . . . . Table 20 Deaths by Type of Place by Place of Occurrence 69
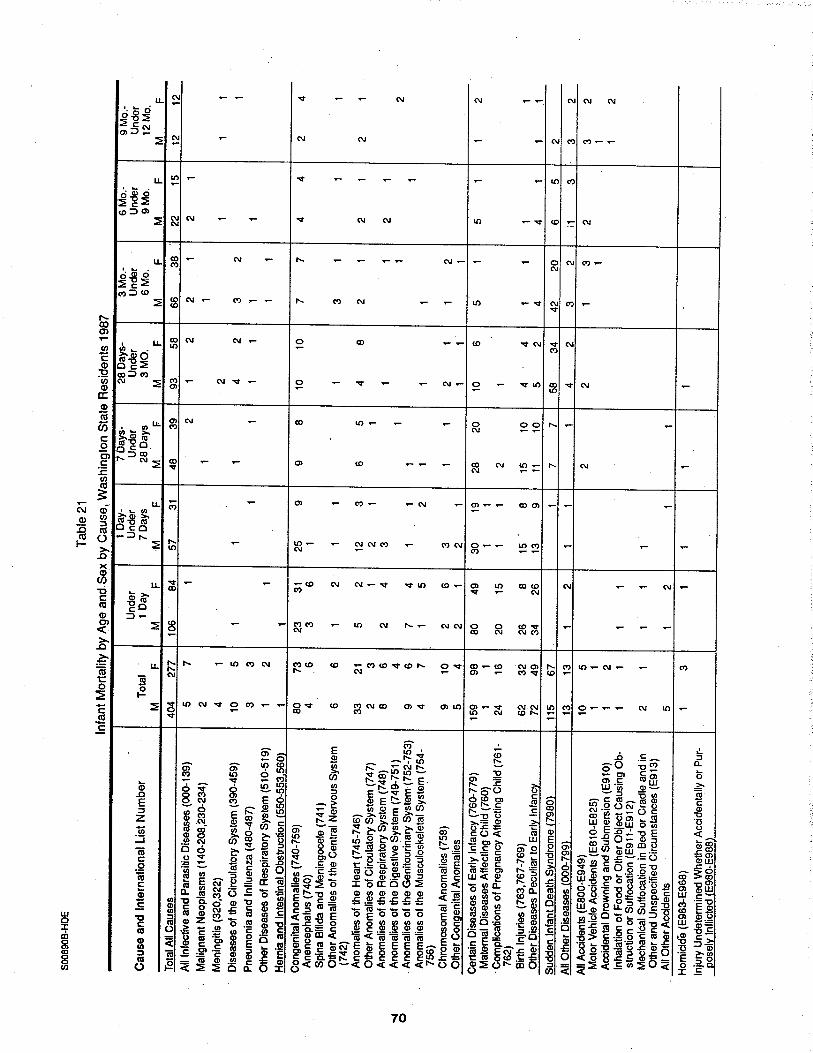
. . . . . . . . . . . . . . . . . . . . . . . . Table 21 Infant Mortality by Age and Sex by Cause 70
. . . . . . . . . . . . . . . . . . . . Table 22 Infant Mortality by Race by Place of Residence 71
vii

Table 23 Infant Mortality by Leading Causes by Place of Residence . . . . . . . . . . . . . . .72
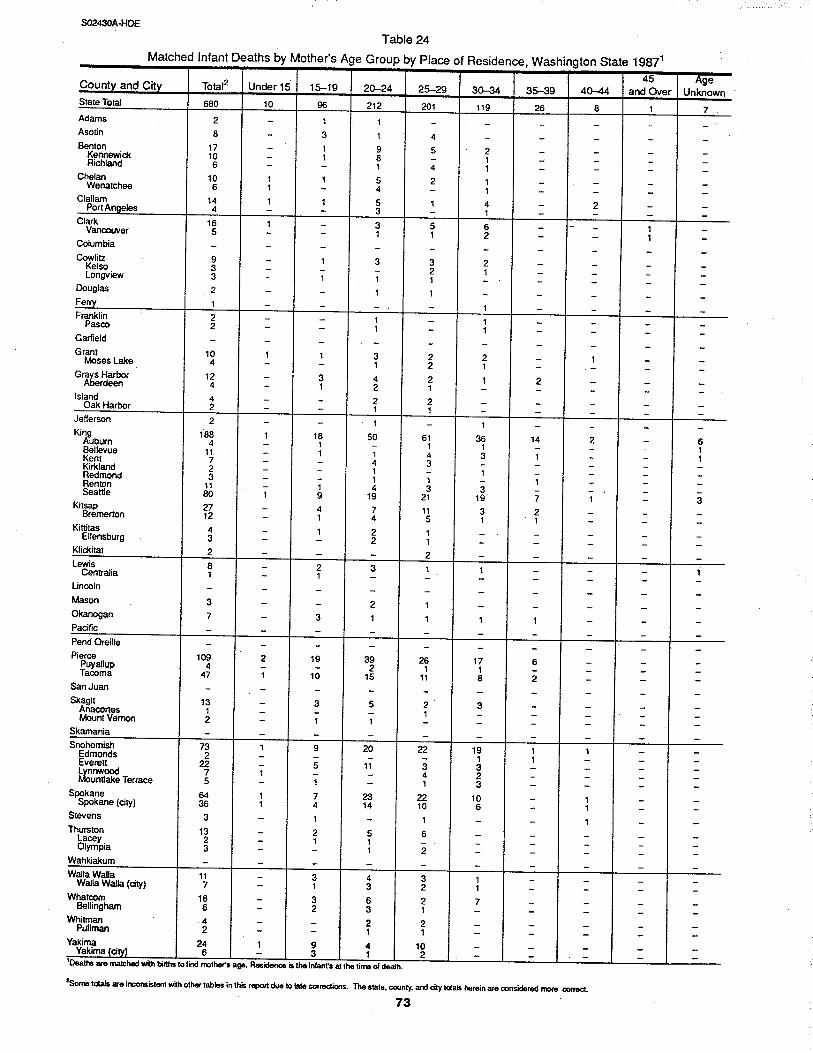
Table 24 Residence, Matched Infant Deaths by Mother's Age Group . . . . . . . . . . . . . . . . . . . . . . . . . . . . . . . . . . by Place of Residence .73
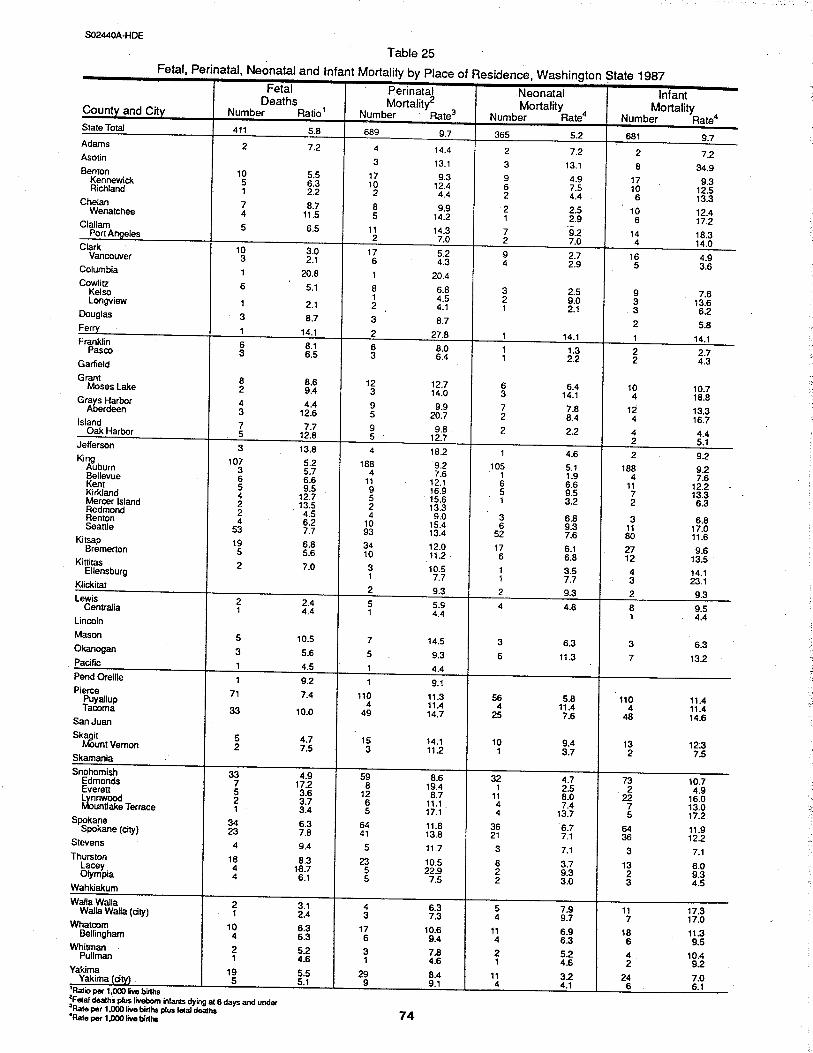
Table 25 Fetal, Perinatal, Neonatal and Infant Mortality by Place of Residence . . . . . . . . .74
Table 26 Fetal, Perinatal, Neonatal and Infant Mortality by Place of Occurrence . . . . . . . . .75
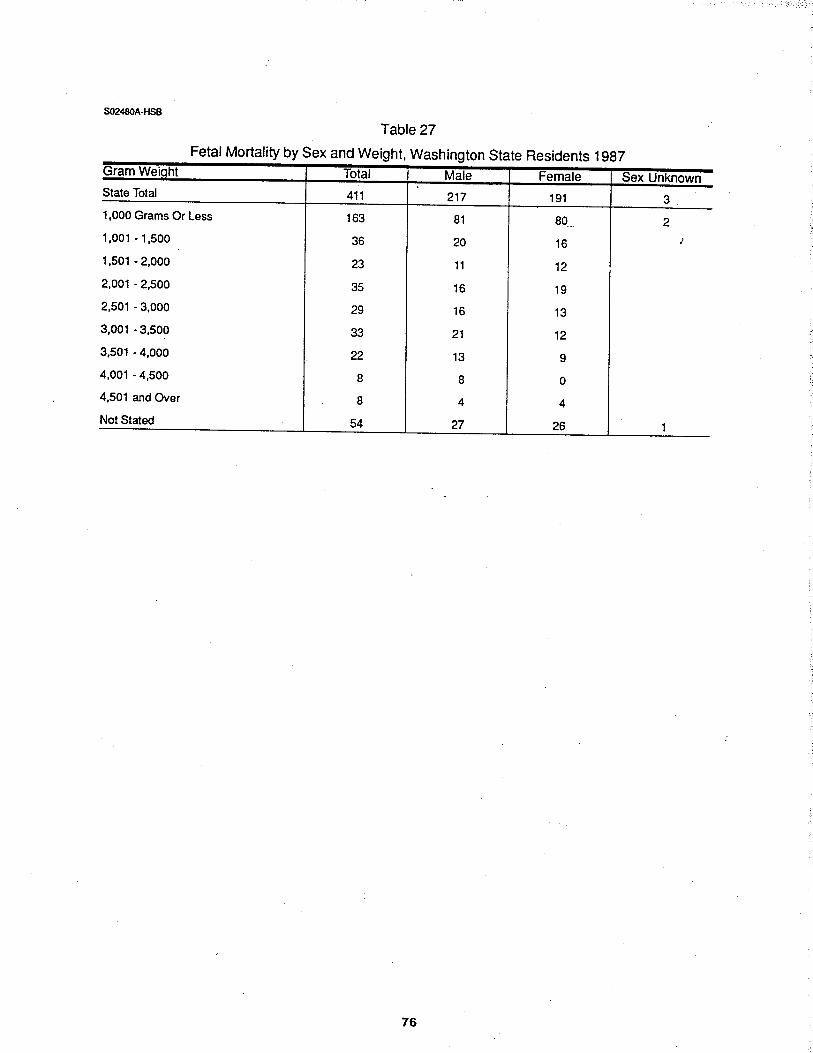
Table 27 Residence, Fetal Mortality by Sex and Weight, Washington State Residents . . . . . .76
Table 28 Fetal Mortality by Cause, Washington State Residents . . . . . . . . . . . . . . . . .77
Table 29 Fetal Deaths by Mother's Age Group by Place of Residence . . . . . . . . . . . . . .78
Induced Terminations of Pregnancy . . . . . . . . . . . . . . . . . . . . . . . . . . . . .79
Table 1 Induced Terminations of Pregnancy by Selected Topics . . . . . . . . . . . . . . . . 80
Residence, Age Group of Patient Residence, Gestational Age Residence, Number of Previous Abortions Residence, Number of Previous Live Births Residence, Number of Previous Pregnancies Residence, Race and Hispanic Origin Residence and Occurrence, Travel Pattern Occurrence, Operative Procedure Occurrence, State or Country of Residence Occurrence, Type of Complication Occurrence, Type of Facility
Table 2 Induced Abortions, Live Births, and Abortion Ratio with Percent Changes, . . . . . . . . . . . . . . . . . . . . . . . . Washington State Residents, 1974-1987 82
Table 3 Reported Pregnancies by Age of Patient and Pregnancy Outcome, Washington State Residents . . . . . . . . . . . . . . . . . . . . . . . . . . . . . . 83
Table 4 Age Group Specific Fertility Rate, Abortion Rate, and Abortion Ratio, Washington State Residents . . . . . . . . . . . . . . . . . . . . . . . . . . . . . . .83
Table 5 Previous Live Births by Age of patient, Washington State Residents . . . . . . . . . .84
Table 6 Previous Induced Abortions by Age of Patient, Washington State Residents . . . . . .84
Table 7 Induced Abortions by Age of Patient by Gestation of Pregnancy, . . . . . . . . . . . . . . . . . . . . . . . . . . . . . . Washington State Residents 85
Table 8 Induced Abortions by Type of Procedure by Gestation of Pregnancy, Washington State Occurrence . . . . . . . . . . . . . . . . . . . . . . . . . . . . . 85
Table 9 Induced Abortions with Complications by Type of Procedure . . . . . . . . . . . . . . by Gestation Of Pregnancy, Washington State Occurrences .86
viii

Table 10 Induced Abortions with Complications by Type by Gestation of Pregnancy, Washington State Occurrences . . . . . . . . . . . . . . . . . . . . . . . . . . . . . . 86
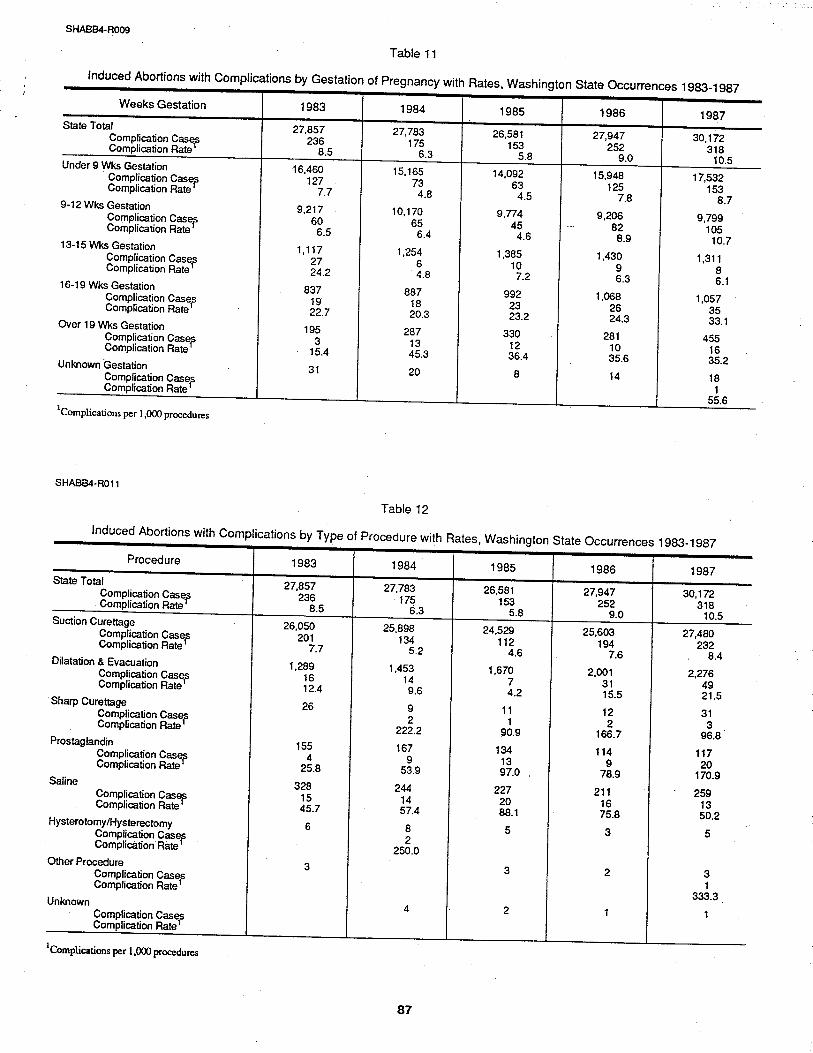
Table 11 Induced Abortions with Complications by Gestation of Pregnancy with Rates, Washington State Occurrences, 1983-1987 . . . . . . . . . . . . . . . . . . . . . . . 87
Table 12 Induced Abortions with Complications by Type of Procedure with Rates, Washington State Occurrences, 1983-1987 . . . . . . . . . . . . . . . . . . . . . . . 87
...
Table 13 Abortion Inter-County Travel Patterns, Washington State Residents and Occurrences . . . . . . . . . . . . . . . . . . . . . . 88
Table 14 Live Births and Abortions. with Rate and Ratio Indicators by Place of Residence . . . . . . . . . . . . . . . . . . . . . . . . . . . . . . . . . . . . 90
. . . . . . . . . . . . . Table 15 Induced Abortions by Age of Patient by County of Residence 91
. . . . . . . . . Table 16 Second Trimester Abortions by Patient's Age by County of Residence 92
Table 17 Repeat Abortions by Patient's Age by County of Residence . . . . . . . . . . . . . . 93
Table 18 Pregnancy Outcome of Adolescents by Age of Patient by Place of Residence . . . . . . . . . . . . . . . . . . . . . . . . . . . . . . . . . . . 94
Table 19 Resident Abortion Rates with Ranks for Washington State Counties, 1983-1987 . . . . . . . . . . . . . . . . . . . . . . . . . 95
Marriages and Dissolutions . . . . . . . . . . . . . . . . . . . . . . . . . . . . . . . . . . 97
. . . . . . . . . . . Table 1 Marriages by County of Marriage by Bride and Groom Age Group 98
Table 2 Dissolutions. Annulments. and Separate Maintenance by County of Decree . . . . . . . . . . . . . . . . . . . . . . . . . . . . . . . . . . . 99
Table 3 Dissolutions by County of Divorce by Husband's and Wife's Age Group . . . . . . 100
Table 4 Dissolutions by Total Living Children by Place of Wife's Residence . . . . . . . . . 101
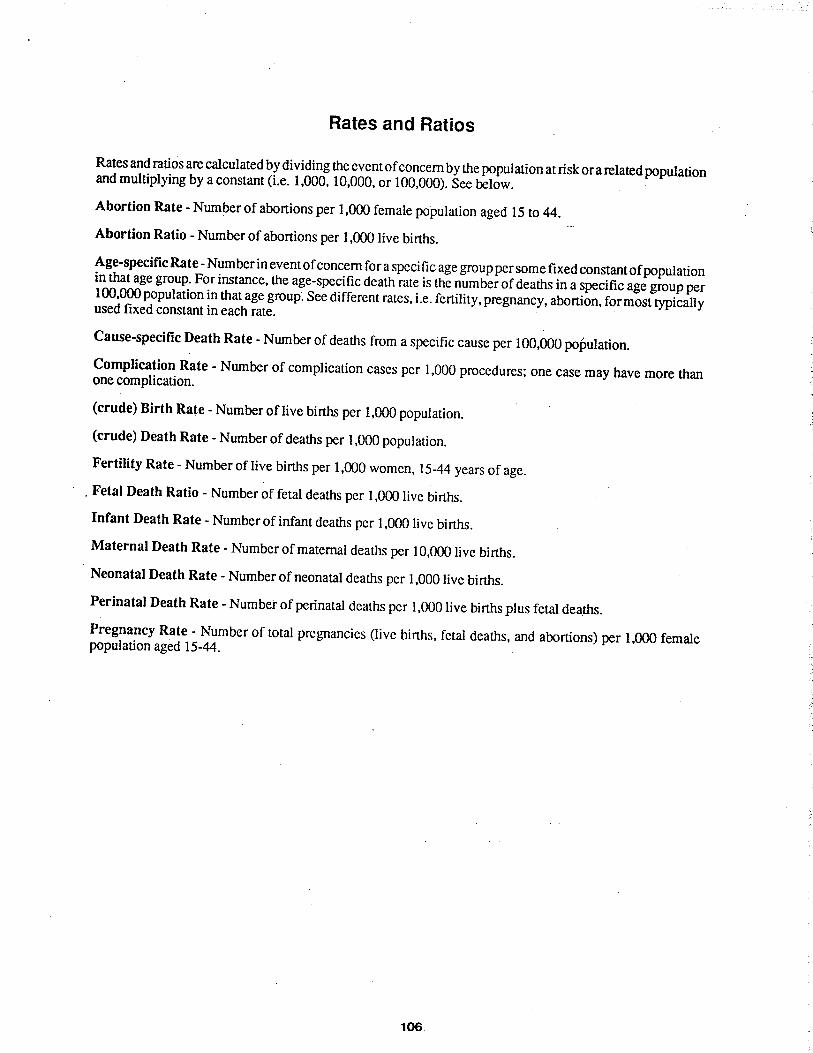
Appendix . . . . . . . . . . . . . . . . . . . . . . . . . . . . . . . . . . . . . . . . . . . 103
B Technical Notes . . . . . . . . . . . . . . . . . . . . . . . . . . . . . . . . . . . . . 107
C Conversion of Birth Weight Groups in Grams to Pounds and Ounces . . . . . . . . 109
D Population of the State of Washington by Age Group, by Sex, April 1, 1987 . . . . . 110
E Population. State of Washington. Counties and Cities of 10, 000 Population and Over, April 1, 1987 . . . . . . . . . . . . . . . . . . . 111
F Reporting Forms . . . . . . . . . . . . . . . . . . . . . . . . . . . . . . . . . . . . 112


TRENDS


TABLES


NATALITY


MORTALITY


INDUCED TERMINATIONS
OF PREGNANCY


MARRIAGES AND
DISSOLUTIONS


APPENDIX