1994 naep u.s. history group assessment
TRANSCRIPT

Research Report September 1998
U.S. Department of EducationOffice of Educational Research and Improvement NCES 98-533
1994 NAEPU.S. HistoryGroup Assessment
NATIONAL CENTER FOR EDUCATION STATISTICS

Honorable Roy RomerGovernor of ColoradoDenver, Colorado
Fannie L. SimmonsMathematics CoordinatorDistrict 5 of Lexington/Richland CountyBallentine, South Carolina
Adam UrbanskiPresidentRochester Teachers AssociationRochester, New York
Deborah VoltzAssistant ProfessorDepartment of Special EducationUniversity of LouisvilleLouisville, Kentucky
Marilyn A. WhirryTwelfth-grade English TeacherMira Costa High SchoolManhattan Beach, California
Dennie Palmer WolfSenior Research AssociateHarvard Graduate School of EducationCambridge, Massachusetts
C. Kent McGuire (Ex-Officio)Assistant Secretary of EducationOffice of Educational Research
and ImprovementU.S. Department of EducationWashington, DC
Roy TrubyExecutive Director, NAGBWashington, DC
What is The Nation�s Report Card?THE NATION�S REPORT CARD, the National Assessment of Educational Progress (NAEP), is the only nationallyrepresentative and continuing assessment of what America�s students know and can do in various subject areas. Since 1969,assessments have been conducted periodically in reading, mathematics, science, writing, history/geography, and other fields.By making objective information on student performance available to policymakers at the national, state, and local levels,NAEP is an integral part of our nation�s evaluation of the condition and progress of education. Only information related toacademic achievement is collected under this program. NAEP guarantees the privacy of individual students and their families.
NAEP is a congressionally mandated project of the U.S. Department of Education�s National Center for EducationStatistics. The Commissioner of Education Statistics is responsible, by law, for carrying out the NAEP project throughcompetitive awards to qualified organizations. NAEP reports directly to the commissioner, who is also responsible forproviding continuing reviews, including validation studies and solicitation of public comment, on NAEP�s conduct andusefulness.
In 1988, Congress established the National Assessment Governing Board (NAGB) to formulate policy guidelines forNAEP. The Board is responsible for selecting the subject areas to be assessed from among those included in the NationalEducation Goals; for setting appropriate student performance levels; for developing assessment objectives and testspecifications through a national consensus approach; for designing the assessment methodology; for developing guidelinesfor reporting and disseminating NAEP results; for developing standards and procedures for interstate, regional, and nationalcomparisons; for determining the appropriateness of test items and ensuring that they are free from bias; and for taking actionsto improve the form and use of the National Assessment.
The National Assessment Governing BoardMark D. Musick, ChairPresidentSouthern Regional Education BoardAtlanta, Georgia
Mary R. Blanton, Vice ChairAttorneySalisbury, North Carolina
Patsy CavazosPrincipalW.G. Love Accelerated SchoolHouston, Texas
Catherine A. DavidsonSecondary Education DirectorCentral Kitsap School DistrictSilverdale, Washington
Edward DonleyFormer ChairmanAir Products & Chemicals, Inc.Allentown, Pennsylvania
Honorable John M. EnglerMember DesignateGovernor of MichiganLansing, Michigan
James E. EllingsonFourth-grade Classroom TeacherProbstfield Elementary SchoolMoorhead, Minnesota
Thomas H. FisherDirector, Student Assessment ServicesFlorida Department of EducationTallahassee, Florida
Michael J. GuerraExecutive DirectorNational Catholic Education AssociationWashington, DC
Edward H. HaertelProfessor, School of EducationStanford UniversityStanford, California
Lynn MarmerPresidentCincinnati Board of EducationCincinnati, Ohio
Honorable William J. MoloneyCommissioner of EducationState of ColoradoDenver, Colorado
Honorable Annette MorganFormer MemberMissouri House of RepresentativesJefferson City, Missouri
Mitsugi NakashimaFirst Vice-ChairpersonHawaii State Board of EducationHonolulu, Hawaii
Michael T. NettlesProfessor of Education & Public PolicyUniversity of MichiganAnn Arbor, Michiganand DirectorFrederick D. Patterson Research InstituteUnited Negro College Fund
Honorable Norma PaulusSuperintendent of Public InstructionOregon State Department of EducationSalem, Oregon
Honorable Jo Ann PottorffKansas House of RepresentativesWichita, Kansas
Honorable William T. RandallFormer Commissioner of EducationState of ColoradoDenver, Colorado
Diane RavitchSenior Research ScholarNew York UniversityNew York, New York

Research Report:
1994 NAEP U.S. History Group Assessment
Madeline GoodmanStephen LazerJohn MazzeoNancy Mead
Amy Pearlmutter
September 1998
NATIONAL CENTER FOR EDUCATION STATISTICS
Prepared by Educational Testing Service under a cooperative
agreement with the National Center for Education Statistics
U.S. Department of EducationOffice of Educational Research and Improvement NCES 98-533

U.S. Department of EducationRichard W. RileySecretary
Office of Educational Research and ImprovementC. Kent McGuireAssistant Secretary
National Center for Education StatisticsPascal D. Forgione, Jr.Commissioner
Education Assessment GroupGary W. PhillipsAssociate Commissioner
September 1998
SUGGESTED CITATION
Goodman, M., Lazer, S., Mazzeo, J., Mead, N., & Pearlmutter, A. (1998).Research report: 1994 NAEP U.S. history group assessment.Washington, DC: National Center for Education Statistics.
FOR MORE INFORMATION
Contact:Arnold A. Goldstein202-219-1741
For ordering information on this report, write:
U.S. Department of EducationED PubsP.O. Box 1398Jessup, MD 20794-1398
or by calling toll free 1-877-4ED Pubs.
or call 1-800-424-1616 (in the Washington, DC, metropolitan area call 202-219-1651).
This report also is available on the World Wide Web: http://nces.ed.gov/naep.
The work upon which this publication is based was performed for the National Center for Education Statistics,Office of Educational Research and Improvement, by Educational Testing Service.
Educational Testing Service is an equal opportunity, affirmative action employer.
Educational Testing Service, ETS, and the ETS logo are registered trademarks of Educational Testing Service.The modernized ETS logo is a trademark of Educational Testing Service.

CONTENTS
Abstract . . . . . . . . . . . . . . . . . . . . . . . . . . . . . . . . . . . . . . . . . . . . . . . . . . . . . . . . . . . . . . . . . . . . . . . 1
Introduction . . . . . . . . . . . . . . . . . . . . . . . . . . . . . . . . . . . . . . . . . . . . . . . . . . . . . . . . . . . . . . . . . . . 3
Chapter 1: Description of Tasks and Group Scoring Procedures . . . . . . . . . . . . . . . . . . . . . . . . 7
Description of Tasks . . . . . . . . . . . . . . . . . . . . . . . . . . . . . . . . . . . . . . . . . . . . . . . . . . . . . . . . . . 7Characteristics of Population of Participants . . . . . . . . . . . . . . . . . . . . . . . . . . . . . . . . . . . . . . . 17
Table 1: Characteristics of Participants in the Immigrants Project . . . . . . . . . . . . . 17Table 2: Characteristics of Participants in the 1890�s School Project . . . . . . . . . . 18
Demographic Characteristics of Groups . . . . . . . . . . . . . . . . . . . . . . . . . . . . . . . . . . . . . . . . . . 18Scoring the Written Tasks . . . . . . . . . . . . . . . . . . . . . . . . . . . . . . . . . . . . . . . . . . . . . . . . . . . . . 19
Table 3: Average Score and Percent of Maximum Scorefor Task 1 of the Immigrants Project . . . . . . . . . . . . . . . . . . . . . . . . . . . . . 21
Table 4: Average Score and Percent of Maximum Scorefor Task 2 of the Immigrants Project . . . . . . . . . . . . . . . . . . . . . . . . . . . . . 21
Table 5: Average Score and Percent of Maximum Scorefor Task 3 of the Immigrants Project . . . . . . . . . . . . . . . . . . . . . . . . . . . . . 22
Table 6: Average Score and Percent of Maximum Scorefor Task 4 of the Immigrants Project . . . . . . . . . . . . . . . . . . . . . . . . . . . . . 22
Table 7: Average Score and Percent of Maximum Scorefor Task 5 of the Immigrants Project . . . . . . . . . . . . . . . . . . . . . . . . . . . . . 22
Table 8: Average Score and Percent of Maximum Scorefor Task 1 of the 1890�s School Project . . . . . . . . . . . . . . . . . . . . . . . . . . 23
Table 9: Average Score and Percent of Maximum Scorefor Task 2 of the 1890�s School Project . . . . . . . . . . . . . . . . . . . . . . . . . . 24
Table 10: Average Score and Percent of Maximum Scorefor Task 3 of the 1890�s School Project . . . . . . . . . . . . . . . . . . . . . . . . . . 24
Table 11: Average Score and Percent of Maximum Scorefor Task 4 of the 1890�s School Project . . . . . . . . . . . . . . . . . . . . . . . . . . 24
Table 12: Average Score and Percent of Maximum Scorefor Task 5 of the 1890�s School Project . . . . . . . . . . . . . . . . . . . . . . . . . . 25
Scoring of Group Process . . . . . . . . . . . . . . . . . . . . . . . . . . . . . . . . . . . . . . . . . . . . . . . . . . . . . 25Table 13: Percent of Exact Agreement for Group
Communication Ratings: Immigrants Task . . . . . . . . . . . . . . . . . . . . . . . . 26Table 14: Average Group Communication Ratings: Immigrants Project . . . . . . . . . 26Table 15: Percent of Exact Agreement on Group
Communication Ratings: 1890�s School Project . . . . . . . . . . . . . . . . . . . . 27
Table 16: Average Group Communication Ratings:1890�s School Project . . . . . . . . . . . . . . . . . . . . . . . . . . . . . . . . . . . . . . . . 27
Table 17: Characteristics of Students FulfillingVarious Roles in the Immigrants Project . . . . . . . . . . . . . . . . . . . . . . . . . . 29
Table 18: Characteristics of Students FulfillingVarious Roles in the 1890�s School Project . . . . . . . . . . . . . . . . . . . . . . . 29
Comparisons of Spoken and Written Responses . . . . . . . . . . . . . . . . . . . . . . . . . . . . . . . . . . . . 30Table 19: Spoken Responses Compared with Written Responses
in the Immigrants Project . . . . . . . . . . . . . . . . . . . . . . . . . . . . . . . . . . . . . 31Table 20: Spoken Responses Compared with Written Responses
in the 1890�s School Project . . . . . . . . . . . . . . . . . . . . . . . . . . . . . . . . . . . 31Amount of Related History Knowledge and Skills . . . . . . . . . . . . . . . . . . . . . . . . . . . . . . . . . . 32
Table 21: Percent of Students in the Immigrants Project withHistory Knowledge or Experiences Related to Immigrants . . . . . . . . . . . 32
Table 22: Frequency of Use of Historical Documents based onStudent and Teacher Reports: Immigrants Project . . . . . . . . . . . . . . . . . . 33
Table 23: Percent of Students in the 1890�s School Project withHistory Knowledge or Experience Related to 19th Century Schools . . . . 34
Table 24: Frequency of Use of Historical Documents based onStudent and Teacher Reports: 1890�s School Project . . . . . . . . . . . . . . . . 34
Amount of Experience Working in Groups . . . . . . . . . . . . . . . . . . . . . . . . . . . . . . . . . . . . . . . . 35Table 25: Percent of Students in the Immigrants Project with
Experience Working on a Group Project . . . . . . . . . . . . . . . . . . . . . . . . . . 35Table 26: Percent of Students in the 1890�s School Project with
Experience Working on a Group Project . . . . . . . . . . . . . . . . . . . . . . . . . . 36
Chapter 2: Development and Operations: Recommendations forImprovement and Lessons Learned . . . . . . . . . . . . . . . . . . . . . . . . . . . . . . . . . . . . . 37
Introduction . . . . . . . . . . . . . . . . . . . . . . . . . . . . . . . . . . . . . . . . . . . . . . . . . . . . . . . . . . . . . . . . 37Task Development . . . . . . . . . . . . . . . . . . . . . . . . . . . . . . . . . . . . . . . . . . . . . . . . . . . . . . . . . . . 37Communication Rating Scales Development . . . . . . . . . . . . . . . . . . . . . . . . . . . . . . . . . . . . . . 39Administration Procedures . . . . . . . . . . . . . . . . . . . . . . . . . . . . . . . . . . . . . . . . . . . . . . . . . . . . . 40Training Assessment Administrators . . . . . . . . . . . . . . . . . . . . . . . . . . . . . . . . . . . . . . . . . . . . . 41Administering Assessments . . . . . . . . . . . . . . . . . . . . . . . . . . . . . . . . . . . . . . . . . . . . . . . . . . . . 42Training Videotape Raters . . . . . . . . . . . . . . . . . . . . . . . . . . . . . . . . . . . . . . . . . . . . . . . . . . . . . 44Conclusion . . . . . . . . . . . . . . . . . . . . . . . . . . . . . . . . . . . . . . . . . . . . . . . . . . . . . . . . . . . . . . . . . 45
Chapter 3: Summary . . . . . . . . . . . . . . . . . . . . . . . . . . . . . . . . . . . . . . . . . . . . . . . . . . . . . . . . . . . 47
Appendix A: Immigrants Project . . . . . . . . . . . . . . . . . . . . . . . . . . . . . . . . . . . . . . . . . . . . . . . . . 49
Appendix B: 1890�s School Project . . . . . . . . . . . . . . . . . . . . . . . . . . . . . . . . . . . . . . . . . . . . . . . 109

1994 NAEP U.S. History Group Assessment 1
ABSTRACT
This report documents the National Assessment of Educational Progress (NAEP) special pilot
study of group assessment. In 1994, NAEP administered U.S. history projects to a limited
number of students. The purpose of this study was to investigate the feasibility of group
assessment, and to gain practical experience in the design, development, administration, and
scoring of such instruments. The report first describes the development and conduct of the
study. It then discusses practical lessons learned, and makes recommendations regarding the
future assessment of groups. Appendices include the testing instruments, scoring guides, and
examples of student work.


1994 NAEP U.S. History Group Assessment 3
1 See, for example, Johnson, D. W., Maruyama, G., Johnson, R.T., Nelson, D., & Skon, L. (1981). Effects ofco-operative, competitive and individualistic goal structures on achievement: A meta-analysis. PsychologicalBulletin, 89, 47-62. Or Johnson, D. W., & Johnson, R. T. (1987). Cooperation and Competition. Hillsdale, NJ:Erlbaum.
2 Hill, S., & Hill, T. (1990). The collaborative classroom: A guide to co-operative learning. Portsmouth, NH:Heinemann, 4-6.
3 See, for example, Linn, R. & Glaser, R. Assessment in transition. (1997). National Academy of Education, 47.
INTRODUCTION
Increasingly, teachers in our nation�s schools are using group learning techniques. Use of
cooperative learning and other heuristic models have led many educators and curriculum
developers to believe that supplementing traditional instruction with activities that require
students to help each other learn is more effective than using individual-based practices
alone. In addition, a number of studies have suggested that cooperative and group learning
experiences are more positively related to higher levels of academic achievement than are
individualistic or competitive instructional settings.1 Many believe that, in addition to being
an optimal means of helping students gain both knowledge and critical-thinking
competencies, group learning provides students with the teamwork and leadership skills
necessary for success in our changing economy.2
Because group instruction occupies an increasingly central place in American
education, several analysts have argued that it is important that educational surveys track the
abilities of students to work in groups.3 However, assessing group work presents special
challenges. The measurement of interpersonal processes has played little role in traditional
large-scale assessments. There is a lack of understanding in the assessment community of the
issues and challenges involved in the measurement of groups rather than of individual
students. For example, assessment developers have little experience in crafting exercises that
simultaneously allow for the real manifestation of group dynamics while remaining
constrained enough to be amenable to standardized administration and scoring. Nevertheless,
as the National Assessment of Educational Progress (NAEP) moves toward the future, the
assessment of groups is likely to become an increasingly pressing concern. Therefore, an
initial study of the procedures and issues involved in group assessment under the auspices of
NAEP seemed appropriate.
When reviewing this report, the reader should keep two general points about this
study in mind. First, the study focuses on the assessment of groups of students, and not on the
importance, efficacy, or form of group and cooperative learning. The educational and
workplace implications of group skills are clearly of great import; however, they are beyond
the scope of this study.

4 1994 NAEP U.S. History Group Assessment
Second, the NAEP U.S. history group assessment research study was initiated to
obtain experience in the design, administration, scoring, and analysis of group assessment
tasks. The intention of this study was not, principally, to obtain reliable results concerning
group performance, but rather to investigate feasibility and operational issues surrounding
group-based assessments. The design of this paper reflects the emphasis on operational
concerns rather than results; it primarily deals with the feasibility of administering and
scoring group assessments, while offering some concrete suggestions for future efforts aimed
at incorporating group tasks into large-scale assessment projects such as NAEP.
The organization of this report is therefore as follows. Chapter One describes the
group assessment tasks, the characteristics of the participants in the study, and the scoring of
group processes. It also presents some results on the level of performance observed on the
tasks, the reliability of ratings, and other characteristics associated with the tasks. Chapter
Two discusses the practical lessons learned about the development, administration, scoring,
and analysis of group history tasks. Chapter Three briefly summarizes the project.
Appendices A and B provide copies of the administration scripts, the materials used for the
tasks, the tasks themselves, and some samples of actual group responses to the written tasks.
Two group assessment projects were developed for students in grade 8. Each project
consisted of a set of structured tasks to be carried out by groups of four or six students.
Groups produced a series of concrete, written products (e.g., charts, lists, descriptions, or
explanations). Each group was also videotaped as it performed the tasks. Tapes were later
analyzed and scored by raters.
Thirty-six of the grade 8 schools that participated in the 1994 NAEP assessment,
representing a range of sizes and types of communities, were recruited to participate in this
special study. In each school, two groups of students were identified, one for each group
project. Students were selected at random from those who participated in the 1994 NAEP
U.S. history assessment, so that the results of the special study could be linked back to the
main assessment findings.
The participants in the NAEP U.S. history group assessment study were not a
statistically representative sample of students. Schools were selected to represent a variety of
settings and types, but they were chosen from a group of schools that volunteered to
participate in the project. Within schools, students were selected at random from those
who participated in the 1994 NAEP U.S. history assessment. However, selected students
could participate only if they returned a form from their parents giving permission to
participate in a videotaped assessment activity. The rate of return of permission slips was
disappointingly low, and the characteristics of the participating students suggest that they are
not a representative group.

1994 NAEP U.S. History Group Assessment 5
Since the group products offered particular challenges not normally associated with
the scoring of individually produced constructed responses, part of the purpose of the study
was to identify new scoring procedures for group assessment work. Two distinct types of
ratings were assigned to each group. The first type was intended to measure the quality of
the written products generated by each group. These ratings were generally related to the
content-specific aspect of the group projects, that is, the extent of and quality of the historical
knowledge that groups of students were able to demonstrate when confronted with the
historical tasks. Each group product was evaluated independently by two trained scorers
according to criteria set forth in standardized scoring rubrics. Criteria used for rating purposes
included quality of historical thinking, historical correctness and accuracy, and completeness of
responses.
The second set of ratings were intended to measure the communicative behavior
exhibited by each group in carrying out the project tasks. Observational protocols were used
to record and evaluate the communication that occurred within the groups. Group
communication was rated in terms of the degree of group participation, the quality of the
discussion related to the content of the task, and the extent to which the group worked in an
organized fashion. Two observers independently evaluated the group communication as it
occurred. Later, two raters independently rated the group communications exhibited on
videotapes made at the time of the administration. Finally, experienced raters reviewed the
videotapes to obtain additional descriptive information, including evidence of a dominant
personality influencing group processes or products, and a comparison of what was said and
what was written on the task sheets.


1994 NAEP U.S. History Group Assessment 7
CHAPTER 1
Description of Tasks andGroup Scoring Procedures
Description of Tasks
Two projects, each consisting of a set of tasks, were designed to assess students� ability to
work in groups to solve historical problems. Both projects required students to demonstrate
their ability to deal with primary source materials and answer the content and historiographic
questions that are associated with these materials. One project focused on different immigrant
experiences in the United States during the nineteenth and twentieth centuries. The second
project dealt with the characteristics of school life in late nineteenth century rural America.
The tasks associated with each project called for different kinds of group activities.
The two tasks were designed to be somewhat different because assessment
developers hoped to determine which type of exercise proved most motivating to students and
provided the most interesting evidence of group work. Each project and its associated task is
briefly described below. Appendices A and B contain the administration scripts used in the
group assessment tasks, copies of materials included in the tasks, copies of the tasks, and
sample group responses.
The use of only two projects relates to the experimental nature of the study. If the
intention had been to gather systematic data on group performance in history, a far greater
number of projects would have been necessary to ensure the generalizability of results.
However, the goals of the study were far more limited.
Immigrants Project
The immigrants project was administered to groups of six students. Initially, students were
asked to work in pairs. Each pair was given a packet containing a dozen pieces of original
historical material about an immigrant group, such as photographs, personal recollections,
newspaper articles, speeches, and legal documents. The materials were selected to depict a
range of salient characteristics of three immigrant groups.
The three immigrant groups chosen for this project � Chinese immigrants from the
1860�s, Jewish immigrants from the 1900�s, and Cuban immigrants from the 1960�s � were
CHAPTER 1
8 1994 NAEP U.S. History Group Assessment
selected because they represented a variety of experiences from different time periods, points
of origin, and points of entry and settlement. One pair of students was given materials about
the Chinese peasants, primarily men, who came to San Francisco and other West Coast ports
during the last half of the nineteenth century to work on the railroads and in other manual
jobs. The second pair received information about the Jews who came from the cities of
eastern Europe during the late nineteenth and early twentieth centuries, entered the United
States through Ellis Island, and worked in trades, particularly the garment industry, in New
York City. The third pair received documents and pictures that described the immigration of
Cuban professionals who fled Castro�s government in the 1960�s and settled in and around
Miami, Florida.
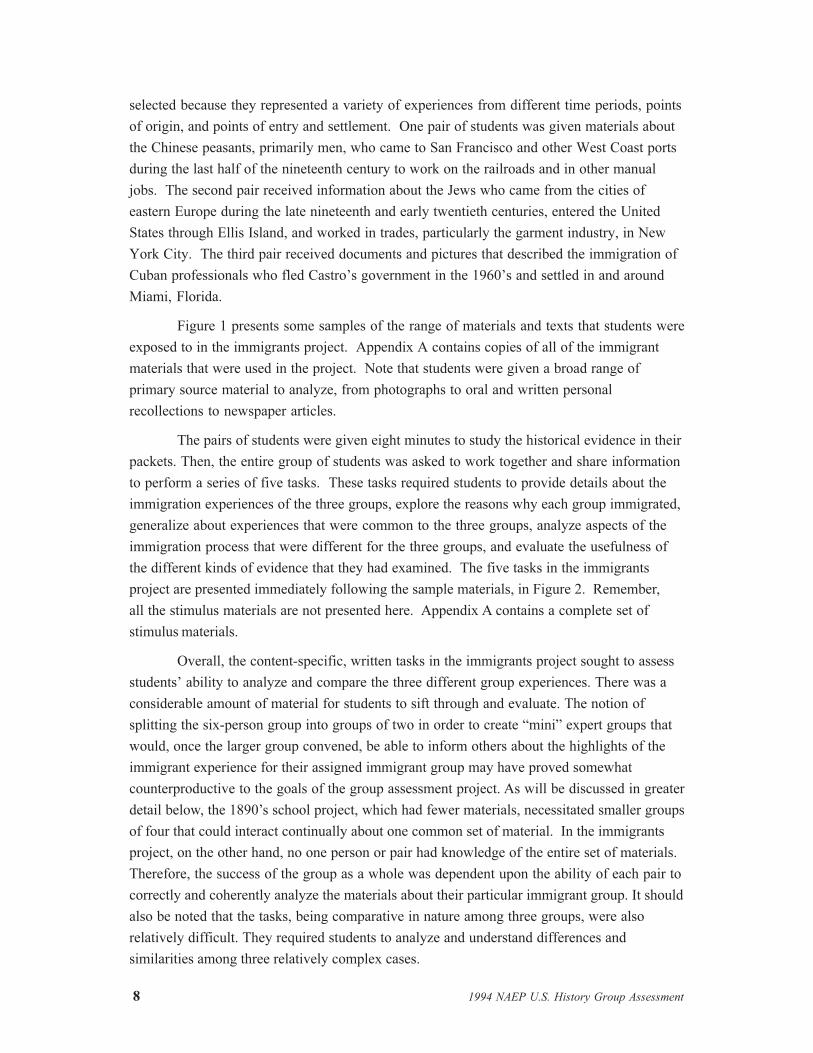
Figure 1 presents some samples of the range of materials and texts that students were
exposed to in the immigrants project. Appendix A contains copies of all of the immigrant
materials that were used in the project. Note that students were given a broad range of
primary source material to analyze, from photographs to oral and written personal
recollections to newspaper articles.
The pairs of students were given eight minutes to study the historical evidence in their
packets. Then, the entire group of students was asked to work together and share information
to perform a series of five tasks. These tasks required students to provide details about the
immigration experiences of the three groups, explore the reasons why each group immigrated,
generalize about experiences that were common to the three groups, analyze aspects of the
immigration process that were different for the three groups, and evaluate the usefulness of
the different kinds of evidence that they had examined. The five tasks in the immigrants
project are presented immediately following the sample materials, in Figure 2. Remember,
all the stimulus materials are not presented here. Appendix A contains a complete set of
stimulus materials.
Overall, the content-specific, written tasks in the immigrants project sought to assess
students� ability to analyze and compare the three different group experiences. There was a
considerable amount of material for students to sift through and evaluate. The notion of
splitting the six-person group into groups of two in order to create �mini� expert groups that
would, once the larger group convened, be able to inform others about the highlights of the
immigrant experience for their assigned immigrant group may have proved somewhat
counterproductive to the goals of the group assessment project. As will be discussed in greater
detail below, the 1890�s school project, which had fewer materials, necessitated smaller groups
of four that could interact continually about one common set of material. In the immigrants
project, on the other hand, no one person or pair had knowledge of the entire set of materials.
Therefore, the success of the group as a whole was dependent upon the ability of each pair to
correctly and coherently analyze the materials about their particular immigrant group. It should
also be noted that the tasks, being comparative in nature among three groups, were also
relatively difficult. They required students to analyze and understand differences and
similarities among three relatively complex cases.
1994 NAEP U.S. History Group Assessment 9
Figure 1 � Sample materials from the Immigrants Project
Figure 1 � Sample materials from the Immigrants Project
Personal Recollections: One Summer Many, Many Years Ago . . .
Chinese Construction Crew
Southern Pacific Railroad

10 1994 NAEP U.S. History Group Assessment
Figure 1 (continued)
Interrogation Question: Ask Them Why They Came . . . Ellis Island (1908)
Steamship Travelling from Rotterdam to New York
Library of Congress
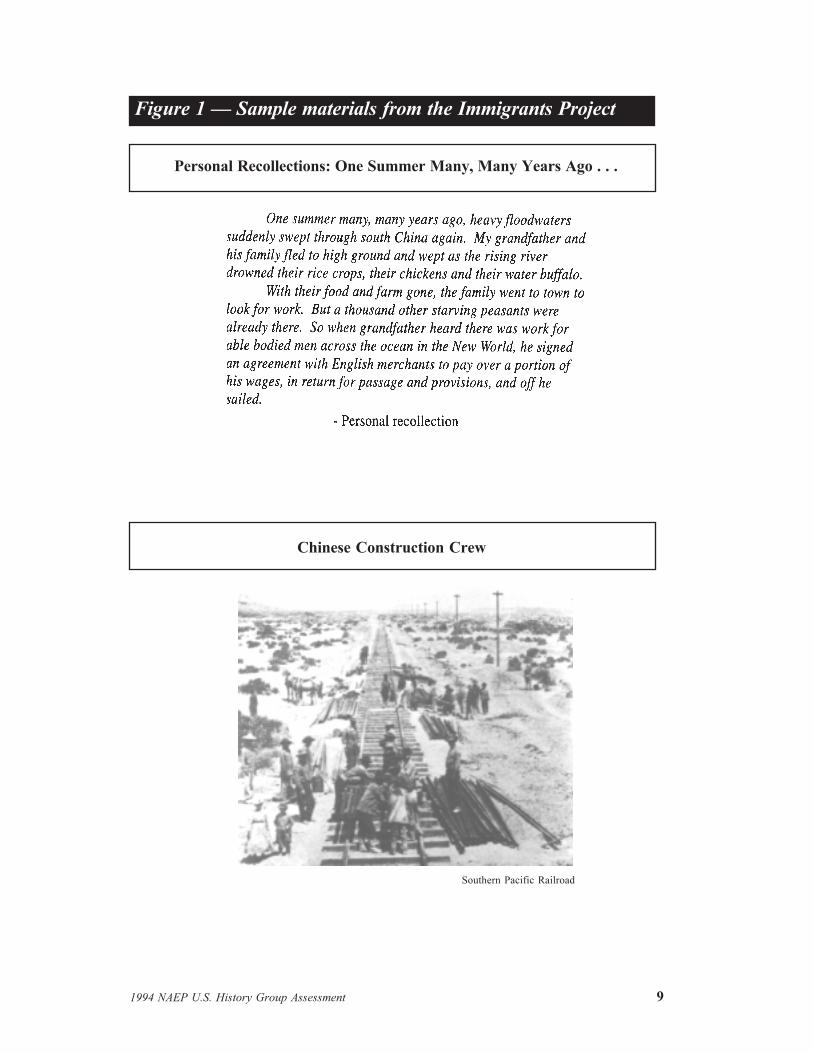
Figure 1 (continued)
1994 NAEP U.S. History Group Assessment 11
Figure 1 (continued)
Newspaper Article: Still They Flee (1961)

12 1994 NAEP U.S. History Group Assessment
Task 2
Why did each immigrant group leave their homeland and come to the United States? Give
reasons why each group immigrated.
Task 3
Even though these three immigrant groups came from different countries at different times,
they faced some common experiences once they arrived in the United States. Describe these
common experiences shared by many people in the three immigrant groups that played an
important role in shaping their immigrant experiences.
Task 4
What was unique about the immigrant experiences of each of these three groups? For each
group, describe one important aspect of their experiences in the United States that was
different from the other two groups.
Task 5
The materials in the envelopes provide some samples of different kinds of evidence about
the experiences of the three groups of immigrants. Some of the important types of evidence
are: (1) photographs, 2) legal documents, 3) speeches, 4) newspaper and magazine articles,
5) oral and written personal accounts. Pick three different types of evidence provided in the
envelopes. For each one, describe the advantages and disadvantages of using that kind of
evidence to get a complete and accurate picture of the immigrant experience.
Figure 2 � Immigrant Project Tasks
ImmigrantsTask 1 � List key facts that describe the immigrant experience for each of the three groups.
Chinese Immigrants Jewish Immigrants Cuban Immigrants
When did they come? Listone or two decades whenmany people from this groupcame to the United States.
How did they travel to theUnited States? List the modeof transportation many peoplefrom this group used.
Where did they settle? Listthe city, state or region in theUnited States where manypeople from this group settled.
What kind of work did peoplefrom this group primarily doin their homeland? List someof the kinds of work they did.
What kind of work did peoplefrom this group get when theyfirst came to the UnitedStates? List some of thekinds of work they did.
1994 NAEP U.S. History Group Assessment 13
1890�s School Project
The 1890�s school tasks were administered to groups of four students. This project had a
decidedly more �narrative� structure than did the immigrants project. Students were given
eight minutes to explore the contents of an old metal box. The box contained a variety of
artifacts and papers from a one-room school in a small town in Iowa. The dates on the
materials suggested that they were roughly 100 years old.
The materials were selected to give a rich description of a small rural school in the
late nineteenth century. The box contained a McGuffy reader and speller, a slate and chalk,
an ink bottle and fountain pen, photographs of the inside and outside of the school and of the
teacher and students, a floor plan of the school and a list of students by grade, a schedule of
classes, a year�s record of attendance, questions from a test, a report card, and a handwriting
assignment. Figure 3 on the following pages contains samples of some of the materials in the
box; a complete list of the materials is in Appendix B.

14 1994 NAEP U.S. History Group Assessment
Floor Plan of Schoolhouse
Inside Classroom
Reprinted by permission
Figure 3 — Sample materials from the 1890’s School Project

1994 NAEP U.S. History Group Assessment 15
Teacher�s Journal
General Duties of Teachers
Figure 3 (continued)

16 1994 NAEP U.S. History Group Assessment
After the group explored the contents of the box, they were asked to work together to
complete a series of five tasks. Note that, in contrast to the immigrants tasks, the 1890�s
tasks asked students to work in one group of four, rather than to break off into groups of two
and then reconvene as a larger group. This approach proved more successful for generating
positive group interaction.
The tasks in the 1890�s school project also differed somewhat from those of the
immigrants project. On the whole, they were more descriptive in nature, measuring students�
ability to provide details about the schoolhouse and classroom as well as the kinds of work that
students in the 1890�s did. The more complex tasks required students to make inferences
about the problems faced by the teachers and students in the school and to identify similarities
and differences between the 1890�s school and their own school. Below are the five tasks in
the 1890�s school project.
Task 1
Using the materials in the box to help you, write a detailed description of what the schoolhouse
and classroom looked like.
Task 2
What kinds of schoolwork did the students do? List three subjects they studied in school. For
each one, give some details about the students� schoolwork, for example, the types of books
they had, the materials they used, or assignments they did.
Task 3
What kinds of problems did the teacher face in school? Give three examples of problems she
might have had based on what you learned from the materials.
What kind of problems did the students face in school? Give three examples of problems the
students might have had based on what you learned from the materials.
Task 4
How have schools changed since the last century? Describe three ways in which the school
in Jewel, Iowa in the 1890�s was different from your school today.
Task 5
The materials in the box are evidence that give information about a school in the past. What
kinds of evidence about your school would you collect to help historians of the future
understand what schools are like now? Make a list of six pieces of evidence you would
collect and briefly explain why you would choose each one.
Figure 4 � 1890�s School Project Tasks
1994 NAEP U.S. History Group Assessment 17
Characteristics of Population of Participants
The special study samples were limited and suffered from problems related to size and the
difficulties of obtaining parental permission. The pilot study was limited to a small number
of students, and one could not expect that the characteristics of each of these two small
samples of students would mirror one another and the population of eighth graders as a
whole, which they did not. Certain problems were obvious. For example, while we would
expect equal representation of females and males for both the projects, female participants
outnumbered males in both the immigrants and 1890�s school task groups. The following
description of the samples of students that participated in the two pilots is provided to give a
context for understanding the results presented in this report.
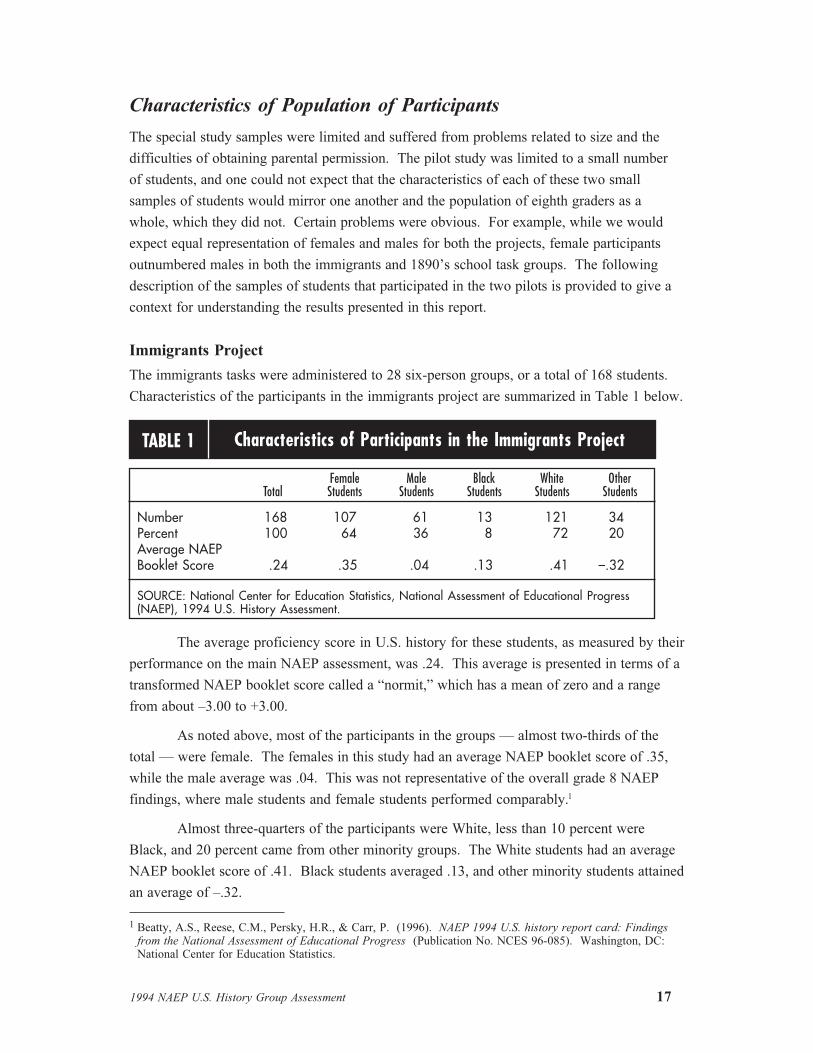
Immigrants Project
The immigrants tasks were administered to 28 six-person groups, or a total of 168 students.
Characteristics of the participants in the immigrants project are summarized in Table 1 below.
TABLE 1
Female Male Black White OtherTotal Students Students Students Students Students
Number 168 107 61 13 121 34Percent 100 64 36 8 72 20Average NAEPBooklet Score .24 .35 .04 .13 .41 �.32
SOURCE: National Center for Education Statistics, National Assessment of Educational Progress(NAEP), 1994 U.S. History Assessment.
Characteristics of Participants in the Immigrants Project
The average proficiency score in U.S. history for these students, as measured by their
performance on the main NAEP assessment, was .24. This average is presented in terms of a
transformed NAEP booklet score called a �normit,� which has a mean of zero and a range
from about �3.00 to +3.00.
As noted above, most of the participants in the groups � almost two-thirds of the
total � were female. The females in this study had an average NAEP booklet score of .35,
while the male average was .04. This was not representative of the overall grade 8 NAEP
findings, where male students and female students performed comparably.1
Almost three-quarters of the participants were White, less than 10 percent were
Black, and 20 percent came from other minority groups. The White students had an average
NAEP booklet score of .41. Black students averaged .13, and other minority students attained
an average of �.32.
1 Beatty, A.S., Reese, C.M., Persky, H.R., & Carr, P. (1996). NAEP 1994 U.S. history report card: Findingsfrom the National Assessment of Educational Progress (Publication No. NCES 96-085). Washington, DC:National Center for Education Statistics.

18 1994 NAEP U.S. History Group Assessment
1890�s School Project
The 1890�s school tasks were field tested with fewer groups of students than the immigrants
task, a total of 23 groups. The normal group size was four; however one of the groups
assessed included only three students, and descriptive data are missing for one student from a
second group. Therefore, the description of the participants in the 1890�s school tasks given in
Table 2 below reflects information on 90 students.
TABLE 2
Female Male Black White OtherTotal Students Students Students Students Students
Number 90 53 37 16 61 13Percent 100 59 41 18 68 14Average NAEPBooklet Score .50 .47 .54 .65 .56 .05
SOURCE: National Center for Education Statistics, National Assessment of Educational Progress(NAEP), 1994 U.S. History Assessment.
Characteristics of Participants in the 1890�s School Project
More females than males participated in the 1890�s school tasks, accounting for 60
percent of the total. About two-thirds of the participants in the 1890�s school tasks were
White, 18 percent were Black, and 14 percent were students from other minority groups.
Black students had an average NAEP booklet score of .65, while the average for White
participants was .56. The remaining students had an average score of .05 on their main
assessment booklet. This pattern of scores shows that the group of students participating on
the 1890�s school task was not representative of the grade 8 population. For example, on the
main NAEP history assessment, White students scored at a higher level, on average, than did
Black students.
Demographic Characteristics of Groups
The limitation in the number of groups studied precluded systematic variation in group
composition. However, researchers did plan to examine differences among groups that
naturally varied in characteristics such as gender and racial/ethnic makeup. Unfortunately, the
distribution of group characteristics did not offer many opportunities for reasonable
comparisons.
1994 NAEP U.S. History Group Assessment 19
Immigrants Project
Of the 28 groups that participated in the immigrants tasks, in 16 all or a majority of the
participants were female, 8 had equal numbers of females and males, and in 4 there were
more males than females. Also, in most of the groups, White students predominated.
Twenty-one groups were totally or predominantly White students, 2 were equally split
between White and minority students, and 5 were totally or predominantly minority students.
1890�s School Project
Of the 23 groups that participated in the 1890�s school tasks, 12 were totally or predominantly
female, 6 had equal numbers of females and males, and 5 were totally or predominantly male.
Again, White students were in the majority in most groups. In 14 of the groups, all or a
majority of the students were White, while 5 groups had equal numbers of White and minority
students, and in 4 groups all or a majority of the students were from minority groups.
Scoring the Written Tasks
For each of the five written tasks, the group was to assign one person to write down the
group�s response. Examples of group task sheets are provided in Appendices A and B. Each
task included one or more parts that were scored according to preestablished scoring guides.
The guides for each part were scored either wrong-right or along a scale with three, four, or
five levels. For example, the three-level scales typically represented incorrect or inadequate
(0), partial (1), and complete (2) responses. Complete score guides can be found in
Appendices A and B.
The task sheets completed by the groups were scored by two subject matter experts.
Any differences in scores were resolved by arbitration. The percentage of agreement between
the first and second scorers across all of the immigrants tasks was 94. The corresponding
percentage of agreement for all of the 1890�s school tasks was 81. The higher level of
agreement for the immigrants tasks is due to particularly high levels of agreement on the first
task, which included 15 parts, all scored wrong-right.
Scoring: Immigrants Project
Task 1 required students to list a number of details about the three immigrant groups. The
task was divided into five parts, and one point was awarded for each part if the students
provided three correct details, one for each of the three groups. Task 2 called for inferences
about why the immigrant groups left their homeland. The task was divided into three parts;
each part was scored separately, and then the three scores were aggregated.

20 1994 NAEP U.S. History Group Assessment
On each part of the question, an inadequate response received zero points, a partially
correct response received one point, and a complete response received two points. Because
there were three parts to the question, a maximum of six points could be earned.
The last three tasks required students to do various analyses. Task 3 asked about
experiences that were common to the three groups, and a complete response was awarded
three points. Responses that were minimally and partially correct were awarded one and two
points respectively, while incorrect responses received no points.
Task 4 asked about the unique characteristics of each of the three immigrant groups.
This task was divided into three parts, each scored on the 0, 1, 2 scale described above. Thus,
a maximum of six points could be scored on this task.
The final task was more abstract and required students to think about the advantages
and disadvantages of the various types of historical evidence they examined. This task was
divided into three parts, and was scored in the same manner as Task 4.
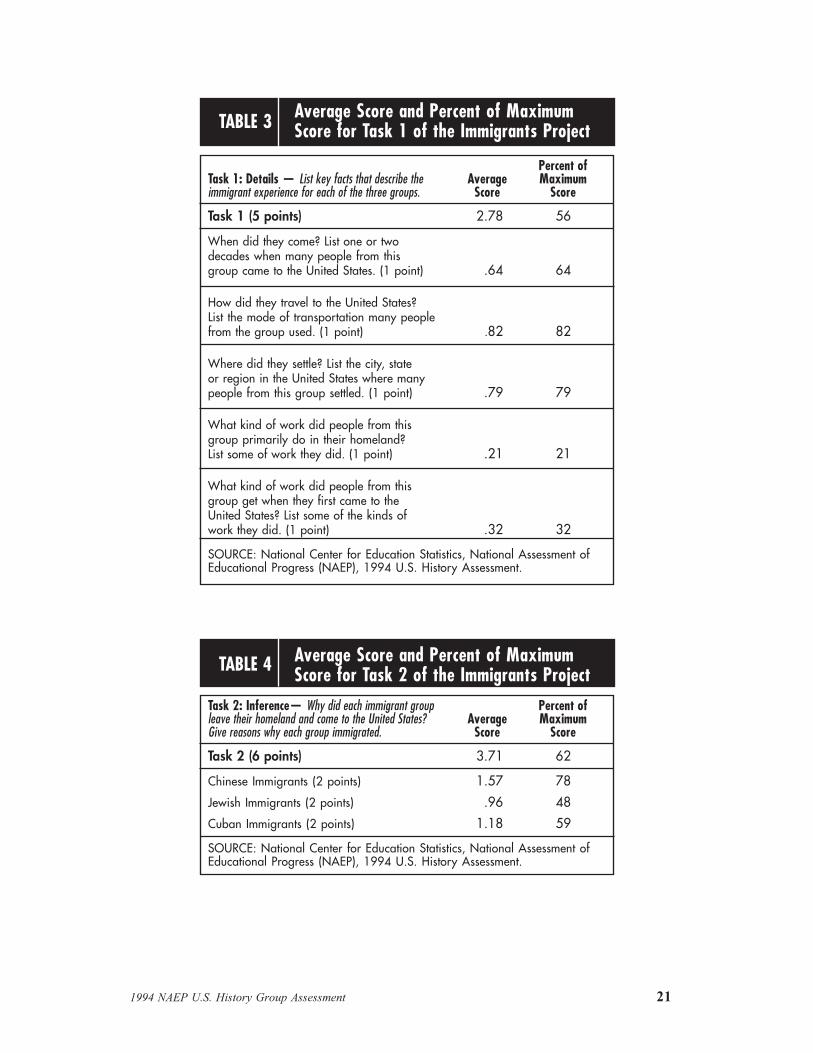
The number of points that could be earned, the average score, and the average score
expressed as a percentage of maximum score for the groups on each of the tasks are
presented in Tables 3 through 7. These data describe only the performance of the small group
of students participating in the study, and should not be assumed to reflect the performance of
the American population. Although the tasks required different types of responses � details,
inferences, and analyses � which might have followed a continuum from easy to hard, the
levels of performance did not vary greatly from task to task. Expressed as a percentage of
the maximum possible score, average task scores ranged from a low of 46 to a high of 62.
While it is impossible to make generalizations based on the limited samples of items and
students in this study, these difficulties are consistent with those one would hope to see in
large-scale educational surveys.
1994 NAEP U.S. History Group Assessment 21
TABLE 3 Average Score and Percent of MaximumScore for Task 1 of the Immigrants Project
Percent ofTask 1: Details � List key facts that describe the Average Maximumimmigrant experience for each of the three groups. Score Score
Task 1 (5 points) 2.78 56
When did they come? List one or twodecades when many people from thisgroup came to the United States. (1 point) .64 64
How did they travel to the United States?List the mode of transportation many peoplefrom the group used. (1 point) .82 82
Where did they settle? List the city, stateor region in the United States where manypeople from this group settled. (1 point) .79 79
What kind of work did people from thisgroup primarily do in their homeland?List some of work they did. (1 point) .21 21
What kind of work did people from thisgroup get when they first came to theUnited States? List some of the kinds ofwork they did. (1 point) .32 32
SOURCE: National Center for Education Statistics, National Assessment ofEducational Progress (NAEP), 1994 U.S. History Assessment.
Task 2: Inference� Why did each immigrant group Percent ofleave their homeland and come to the United States? Average MaximumGive reasons why each group immigrated. Score Score
Task 2 (6 points) 3.71 62
Chinese Immigrants (2 points) 1.57 78
Jewish Immigrants (2 points) .96 48
Cuban Immigrants (2 points) 1.18 59
SOURCE: National Center for Education Statistics, National Assessment ofEducational Progress (NAEP), 1994 U.S. History Assessment.
Average Score and Percent of MaximumScore for Task 2 of the Immigrants ProjectTABLE 4

22 1994 NAEP U.S. History Group Assessment
TABLE 5 Average Score and Percent of MaximumScore for Task 3 of the Immigrants Project
Task 3: Analysis� Even though these three immigrantgroups came from different countries at different times,they faced some common experiences once they Percent ofarrived in the United States. Describe three common Average Maximumexperiences shared by these immigrant groups. Score Score
Task 3 (3 points) 1.82 60
SOURCE: National Center for Education Statistics, National Assessment ofEducational Progress (NAEP), 1994 U.S. History Assessment.
TABLE 6 Average Score and Percent of MaximumScore for Task 4 of the Immigrants Project
Task 4: Analysis� What was unique about the immigrantexperience of each of these three groups? For each group, Percent ofdescribe one important aspect of their experience in the Average MaximumUnited States that was different from the other two groups. Score Score
Task 4 (6 points) 2.74 46
Chinese Immigrants (2 points) 1.14 57
Jewish Immigrants (2 points) .64 32
Cuban Immigrants (2 points) .96 48
SOURCE: National Center for Education Statistics, National Assessment ofEducational Progress (NAEP), 1994 U.S. History Assessment.
TABLE 7 Average Score and Percent of MaximumScore for Task 5 of the Immigrants Project
Task 5: Analysis� The materials in the envelopes provide some samples of different kinds ofevidence about the experiences of the three groups of immigrants. Some of the important typesof evidence are: 1) photographs, 2) legal documents, 3) speeches, 4) newspaper and magazinearticles, 5) oral and written personal accounts. Pick three different types of evidence provided inthe envelopes. For each one, describe the advantages and Percent ofdisadvantages of using that kind of evidence to get a Average Maximumcomplete and accurate picture of the immigrant experience. Score Score
Task 5 (6 points) 3.00 50
Chinese Immigrants (2 points) 1.25 62
Jewish Immigrants (2 points) 1.00 50
Cuban Immigrants (2 points) .75 38
SOURCE: National Center for Education Statistics, National Assessment ofEducational Progress (NAEP), 1994 U.S. History Assessment.

1994 NAEP U.S. History Group Assessment 23
Scoring: 1890�s School Project
Task 1 required students to list a number of details about the 1890�s school and classroom.
The task was scored on a scale in which groups were awarded two points for a complete
response, one point for a partially correct answer, and no points for an inadequate response.
Task 2 asked students to provide details on the types of schoolwork students did in the
1890�s school project. This exercise was scored using a rubric that awarded three points to a
complete response, two to a partially correct response, one to a minimal response, and none to
an inadequate response.
Task 3 was a two-part exercise in which students were asked to discuss problems
that teachers and students faced in the 1890�s. For each part, a complete response was given
three points, a partial response two, and a minimal response one. Inadequate responses were
given no points. Because the exercise had two parts, a total of six possible points might be
awarded on the task.
Task 4 was also a two-part exercise, in which students were asked to describe
similarities and differences between the 1890�s school and modern schools. The scoring
metric was the same as that used in Task 3.
Task 5 required students to design a time capsule that would help future historians
learn about their school. Complete responses were awarded four points, essentially correct
responses three, partially correct answers two, and minimal responses one. Answers viewed
as inadequate were not given points.
For each of the tasks, the number of points that could be earned, the average score,
and that average expressed as a percent of maximum possible score, are shown in Tables 8
through 12. Expressed as a percentage of the maximum possible score, the task averages
ranged from 64 to 90.
TABLE 8Average Score and Percent of Maximum Scorefor Task 1 of the 1890�s School Project
Task 1: Details� Using the materialsin the box to help you, write a detailed Percent ofdescription of what the schoolhouse Average Maximumand classroom looked like. Score Score
Task 1 (2 points) 1.65 82
SOURCE: National Center for Education Statistics, National Assessment ofEducational Progress (NAEP), 1994 U.S. History Assessment.

24 1994 NAEP U.S. History Group Assessment
TABLE 9 Average Score and Percent of Maximum Scorefor Task 2 of the 1890�s School Project
Task 2: Details� What kinds of schoolwork did thestudents do? List three subjects they studied in school.For each one, give some details about the students� Percent ofschoolwork, for example, the types of books they had, Average Maximumthe materials they used, or assignments they did. Score Score
Task 2 (3 points) 1.91 64
SOURCE: National Center for Education Statistics, National Assessment ofEducational Progress (NAEP), 1994 U.S. History Assessment.
TABLE 10Average Score and Percent of Maximum Scorefor Task 3 of the 1890�s School Project
Task 3: Inference� What kinds of problems didthe teacher and the students face in school? Give three Percent ofexamples of problems she might have had based on Average Maximumwhat you learned from the materials. Score Score
Task 3 (6 points) 4.65 78
Part A: Teachers (3 points) 2.43 81Part B: Students (3 points) 2.22 74
SOURCE: National Center for Education Statistics, National Assessment ofEducational Progress (NAEP), 1994 U.S. History Assessment.
TABLE 11
Task 4: Analysis� How have schools changed sincethe last century? Describe three ways in which the schoolin Jewell, Iowa in the 1890�s was different from your school Percent oftoday that show how schools have changed. Describe three Average Maximumways in which the schools are the same. Score Score
Task 4 (6 points) 5.39 90
Part A: Different (3 points) 2.74 91Part B: The Same (3 points) 2.65 88
SOURCE: National Center for Education Statistics, National Assessment ofEducational Progress (NAEP), 1994 U.S. History Assessment.
Average Score and Percent of Maximum Scorefor Task 4 of the 1890�s School Project
1994 NAEP U.S. History Group Assessment 25
Scoring of Group Process
In addition to evaluating the products the groups produced, another important aspect of the
history group assessment study was the ways in which students conducted their group work.
To that end, a rating system was developed to capture the major dimensions of communication
behavior within the groups. These group communication ratings were designed to be used
generically. That is to say, the same rating scales were used for all of the tasks in the
immigrants and the 1890�s school projects.
The group communication ratings were divided into three scales: participation,
process, and content. The first rating quantified the extent to which group members
participated in the task. The process rating focused on aspects of the group activity related to
organizing and managing group interaction; its purpose was to capture the degree to which
process-related discussions and other behaviors helped or hindered work. The content rating
focused on the degree to which task-related discussions demonstrated sound historical thinking
and addressed the requirements of the task. Each rating scale was divided into three levels,
which in general corresponded to low, medium, and high levels of performance.
Assessment administrators were trained to conduct these ratings as they observed the
groups performing the tasks. A second group of raters was trained to conduct similar ratings
of the videotaped records of the group activities. In both cases, two people rated each
performance. It should be noted that the rating guides for the live and videotaped
performances were not identical. In preparation for the ratings of the videotapes, minor
adjustments were made to the definitions of the dimensions and their levels and some decision
rules were added to handle special situations that were not anticipated prior to the pilot testing.
Therefore, it is not possible to examine the levels of agreement for the live and video ratings
and conclude that one method was more reliable than the other.
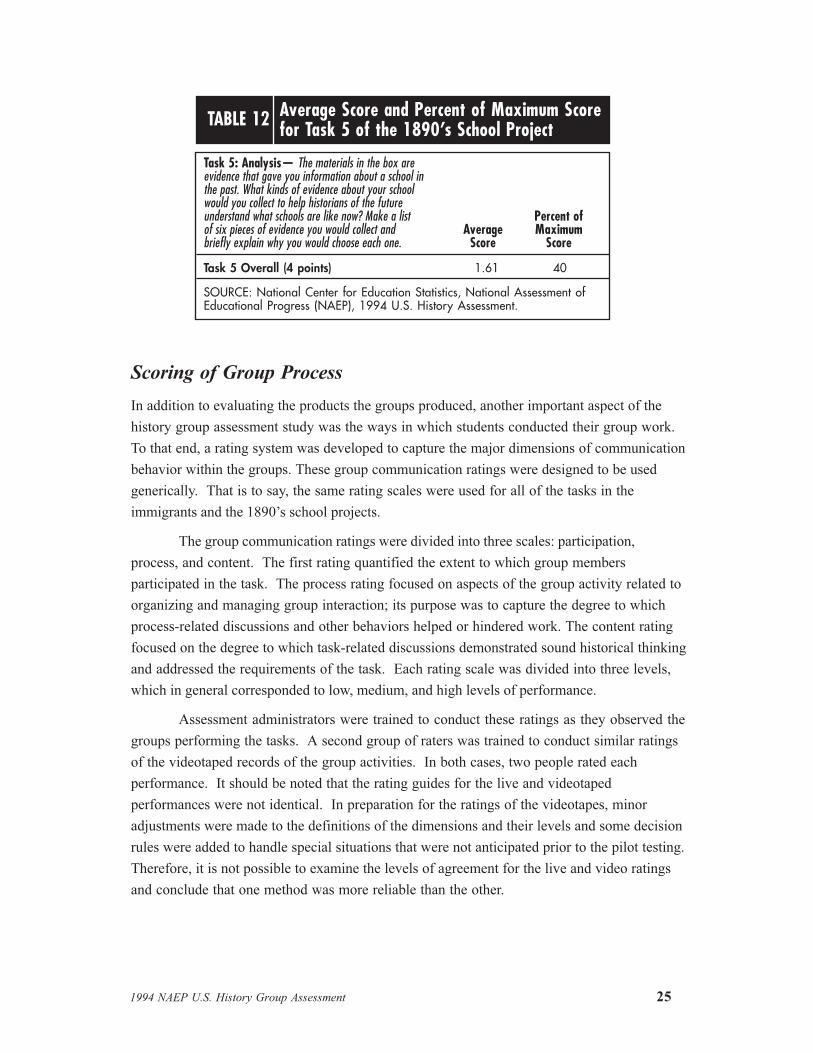
TABLE 12 Average Score and Percent of Maximum Scorefor Task 5 of the 1890�s School Project
Task 5: Analysis� The materials in the box areevidence that gave you information about a school inthe past. What kinds of evidence about your schoolwould you collect to help historians of the futureunderstand what schools are like now? Make a list Percent ofof six pieces of evidence you would collect and Average Maximumbriefly explain why you would choose each one. Score Score
Task 5 Overall (4 points) 1.61 40
SOURCE: National Center for Education Statistics, National Assessment ofEducational Progress (NAEP), 1994 U.S. History Assessment.
26 1994 NAEP U.S. History Group Assessment
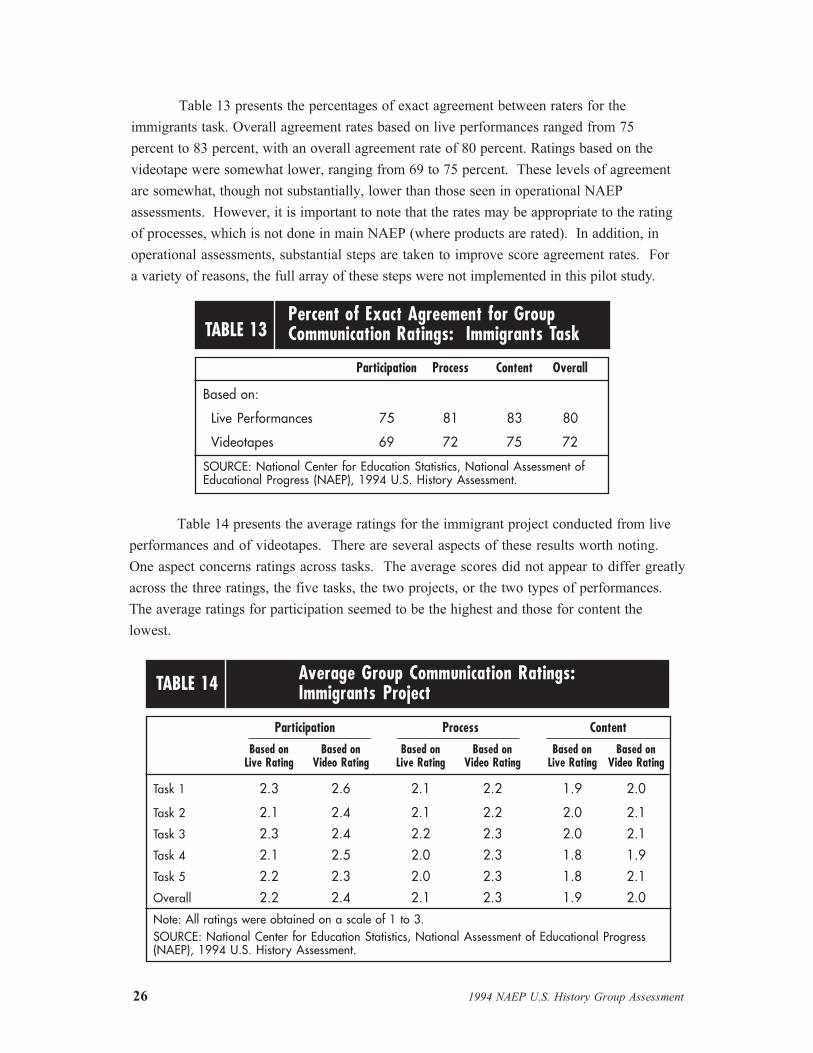
Table 13 presents the percentages of exact agreement between raters for the
immigrants task. Overall agreement rates based on live performances ranged from 75
percent to 83 percent, with an overall agreement rate of 80 percent. Ratings based on the
videotape were somewhat lower, ranging from 69 to 75 percent. These levels of agreement
are somewhat, though not substantially, lower than those seen in operational NAEP
assessments. However, it is important to note that the rates may be appropriate to the rating
of processes, which is not done in main NAEP (where products are rated). In addition, in
operational assessments, substantial steps are taken to improve score agreement rates. For
a variety of reasons, the full array of these steps were not implemented in this pilot study.
Table 14 presents the average ratings for the immigrant project conducted from live
performances and of videotapes. There are several aspects of these results worth noting.
One aspect concerns ratings across tasks. The average scores did not appear to differ greatly
across the three ratings, the five tasks, the two projects, or the two types of performances.
The average ratings for participation seemed to be the highest and those for content the
lowest.
TABLE 13Percent of Exact Agreement for GroupCommunication Ratings: Immigrants Task
Participation Process Content Overall
Based on:
Live Performances 75 81 83 80
Videotapes 69 72 75 72
SOURCE: National Center for Education Statistics, National Assessment ofEducational Progress (NAEP), 1994 U.S. History Assessment.
TABLE 14 Average Group Communication Ratings:Immigrants Project
Participation Process Content
Based on Based on Based on Based on Based on Based onLive Rating Video Rating Live Rating Video Rating Live Rating Video Rating
Task 1 2.3 2.6 2.1 2.2 1.9 2.0
Task 2 2.1 2.4 2.1 2.2 2.0 2.1
Task 3 2.3 2.4 2.2 2.3 2.0 2.1
Task 4 2.1 2.5 2.0 2.3 1.8 1.9
Task 5 2.2 2.3 2.0 2.3 1.8 2.1
Overall 2.2 2.4 2.1 2.3 1.9 2.0
Note: All ratings were obtained on a scale of 1 to 3.SOURCE: National Center for Education Statistics, National Assessment of Educational Progress(NAEP), 1994 U.S. History Assessment.
1994 NAEP U.S. History Group Assessment 27
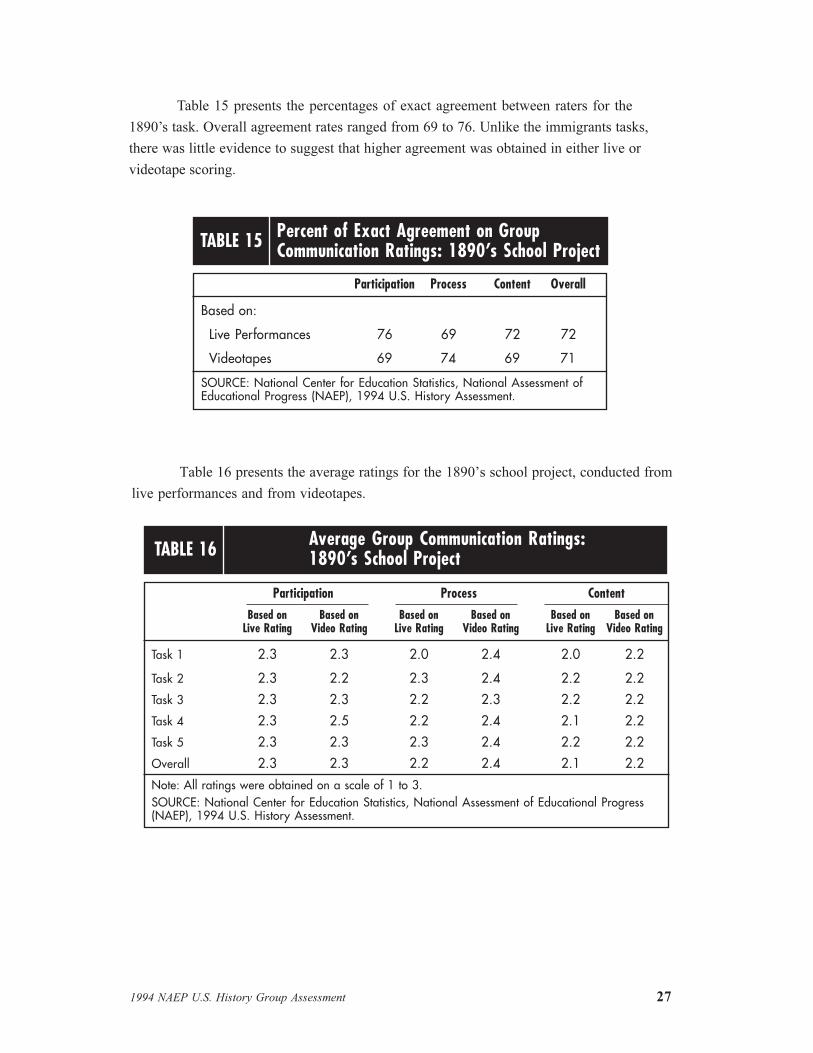
Table 15 presents the percentages of exact agreement between raters for the
1890�s task. Overall agreement rates ranged from 69 to 76. Unlike the immigrants tasks,
there was little evidence to suggest that higher agreement was obtained in either live or
videotape scoring.
Table 16 presents the average ratings for the 1890�s school project, conducted from
live performances and from videotapes.
TABLE 15 Percent of Exact Agreement on GroupCommunication Ratings: 1890�s School Project
Participation Process Content Overall
Based on:
Live Performances 76 69 72 72
Videotapes 69 74 69 71
SOURCE: National Center for Education Statistics, National Assessment ofEducational Progress (NAEP), 1994 U.S. History Assessment.
TABLE 16 Average Group Communication Ratings:1890�s School Project
Participation Process Content
Based on Based on Based on Based on Based on Based onLive Rating Video Rating Live Rating Video Rating Live Rating Video Rating
Task 1 2.3 2.3 2.0 2.4 2.0 2.2
Task 2 2.3 2.2 2.3 2.4 2.2 2.2
Task 3 2.3 2.3 2.2 2.3 2.2 2.2
Task 4 2.3 2.5 2.2 2.4 2.1 2.2
Task 5 2.3 2.3 2.3 2.4 2.2 2.2
Overall 2.3 2.3 2.2 2.4 2.1 2.2
Note: All ratings were obtained on a scale of 1 to 3.SOURCE: National Center for Education Statistics, National Assessment of Educational Progress(NAEP), 1994 U.S. History Assessment.

28 1994 NAEP U.S. History Group Assessment
A review of the videotapes of groups for which raters differed in their ratings
suggested that in most cases the performance seemed to reflect a middle ground between two
ratings. For example, when raters agreed that a group�s content rating was at the �2� level,
that performance represented a clear example of that level. When one rater assigned a group
a �2� rating for content and the other rater the same group a �3,� it was often possible to see
characteristics of both levels in the performance of the group. In summarizing results on
ratings of live performance and of videotapes, it was decided to average the ratings of the two
raters rather than attempt an arbitration rating.
Additional analyses of the videotaped performances were conducted after the initial
ratings of participation, process, and content were made. One of the purposes of these
analyses was to make judgments about the roles that specific individuals played in their
respective groups. For these analyses, raters were not asked to make independent judgments.
Instead, one rater viewed the tapes and described group members according to a
preestablished protocol, and a second rater reviewed the tapes to confirm or to question the
judgments of the first rater. Raters were asked to identify specific individuals who played one
or more of the following roles:
• Extended content: thos ndividuals who made the kinds of content contributions that
helped the group get a high rating in content
• Facilitated process: those individuals who made the kinds of process contributions that
helped the group get a high rating in process
• Dominated discussion: those individuals who spoke a great deal and thereby greatly
influenced the content and process ratings of the group and detracted from the
participation rating
• Did not participate: those individuals who did not speak up in the group.
In cases of disagreement between the two judges, any individual identified by either
judge as extending content, facilitating process, or dominating discussion retained that
classification. On the other hand, an individual was classified as �not participating� only if
both judges agreed on that classification.
It is important to note that not all individual participants in the group assessment study
received one of these ratings. Judges attempted to identify individuals who played one or
more of the three roles, or who did not participate. Many students participated, but were not
judged to have extended content, facilitated process, or dominated discussion.
1994 NAEP U.S. History Group Assessment 29
1 Each student in the History Group Assessment was assigned a �number-correct� test score on the basis of theirperformance on the paper-and-pencil main NAEP assessment. These scores were transformed to be normallydistributed, with mean = 0 and standard deviation = 1 in the full NAEP grade 8 sample.
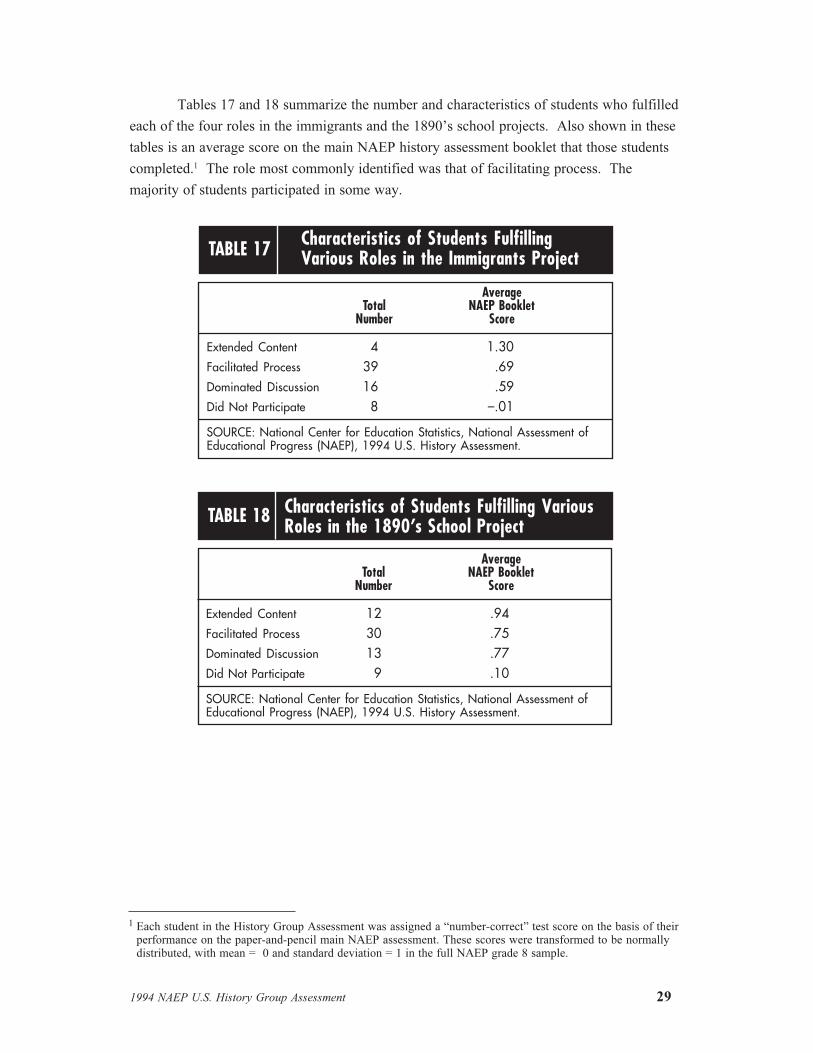
Tables 17 and 18 summarize the number and characteristics of students who fulfilled
each of the four roles in the immigrants and the 1890�s school projects. Also shown in these
tables is an average score on the main NAEP history assessment booklet that those students
completed.1 The role most commonly identified was that of facilitating process. The
majority of students participated in some way.
TABLE 17 Characteristics of Students FulfillingVarious Roles in the Immigrants Project
AverageTotal NAEP Booklet
Number Score
Extended Content 4 1.30Facilitated Process 39 .69Dominated Discussion 16 .59Did Not Participate 8 �.01
SOURCE: National Center for Education Statistics, National Assessment ofEducational Progress (NAEP), 1994 U.S. History Assessment.
TABLE 18 Characteristics of Students Fulfilling VariousRoles in the 1890�s School Project
AverageTotal NAEP Booklet
Number Score
Extended Content 12 .94Facilitated Process 30 .75Dominated Discussion 13 .77Did Not Participate 9 .10
SOURCE: National Center for Education Statistics, National Assessment ofEducational Progress (NAEP), 1994 U.S. History Assessment.
30 1994 NAEP U.S. History Group Assessment
Comparisons of Spoken and Written Responses
Another concern in group assessment has to do with the influence of the group member who
writes the group�s responses to tasks. For each task, groups were asked to identify one
person to act as the recorder and to complete the task sheet for the group. In many cases,
groups chose to rotate this responsibility from task to task. In some instances, particularly
for the immigrants tasks, groups passed the task sheet around the group, and one person from
each pair completed the task sheet for their immigrant group. In a few instances, groups had
the same person record the response for each task. It seemed possible that the person doing
the recording might influence the work on the task sheet, either positively or negatively. A
student with particularly good writing skills or a high level of history competence might take
the responses of group members and weave them into a more coherent and complete answer.
A student with less skills or knowledge might fail to capture or adequately express the
responses provided by group members.
The relationship between what was said in the group and what was written on the
task sheets was examined during the additional analyses of the videotapes. For each task,
raters were asked to evaluate whether the discussion of the content by the group was better,
the same, or worse than what the recorder wrote on the task sheet. The results are shown in
Tables 19 and 20. In the vast majority of cases, the quality level of the spoken responses
matched the written responses. However, 16 percent of the time in the immigrants project
and 25 percent of the time in the 1890�s school project, the quality of the oral conversation
was different from what was written on the task sheets.

1994 NAEP U.S. History Group Assessment 31
TABLE 20 Spoken Responses Compared with Written Responsesin the 1890�s School Project
Spoken Response Spoken Response Spoken ResponseBetter than Same as Worse than
Written Response Written Response Written Response
Percentage of Instances* 13% 76% 12%
*Numbers do not total 100 percent due to rounding
SOURCE: National Center for Education Statistics, National Assessment of Educational Progress(NAEP), 1994 U.S. History Assessment.
TABLE 19 Spoken Responses Compared with Written Responsesin the Immigrants Project
Spoken Response Spoken Response Spoken ResponseBetter than Same as Worse than
Written Response Written Response Written Response
Percentage of Instances 8% 84% 8%
SOURCE: National Center for Education Statistics, National Assessment of Educational Progress(NAEP), 1994 U.S. History Assessment.

32 1994 NAEP U.S. History Group Assessment
Amount of Related History Knowledge and Skills
Both projects, immigrants and 1890�s school, were designed so that students did not need
specific background knowledge about these topics from their school studies or their home
experience to complete the tasks. However, it was thought that relevant school or home
background might enhance their ability to do the tasks.
Probably a more important variable with respect to these tasks is experience in
working with primary documents. It was expected that students who had used historical
letters, diaries, or essays in their history study would be better able to tackle these tasks.
The following describes the amount of relevant history experience the participants
brought to the tasks. The fact that most students had been exposed to knowledge related to
the project topics and few students had experience using source material on a regular basis
made it unproductive to look at the relationship between these factors and student
achievement.
Immigrants Project
The responses of students to specific questions about their knowledge of immigrant topics
indicate that most students brought some background experience to the immigrant tasks, as
shown in Table 21. Virtually all students participating in the immigrants project portion of
the study had studied immigrants at least to some extent during junior high school. The
Chinese and the Jewish immigrants were the more commonly studied groups. In contrast,
few students reported that they had studied Cuban immigrants. Almost half of the students
had also heard about the immigrant experiences of their own families.
TABLE 21Percent of Students in the ImmigrantsProject with History Knowledge orExperiences Related to Immigrants
Percent of Students
Have Studied Immigrants a Lot or Some 98
Have Studied Chinese Immigrants 52
Have Studied Jewish Immigrants 62
Have Studied Cuban Immigrants 14
Have Heard Accounts about FamilyMembers Immigrating 48
SOURCE: National Center for Education Statistics, National Assessment ofEducational Progress (NAEP), 1994 U.S. History Assessment.
1994 NAEP U.S. History Group Assessment 33
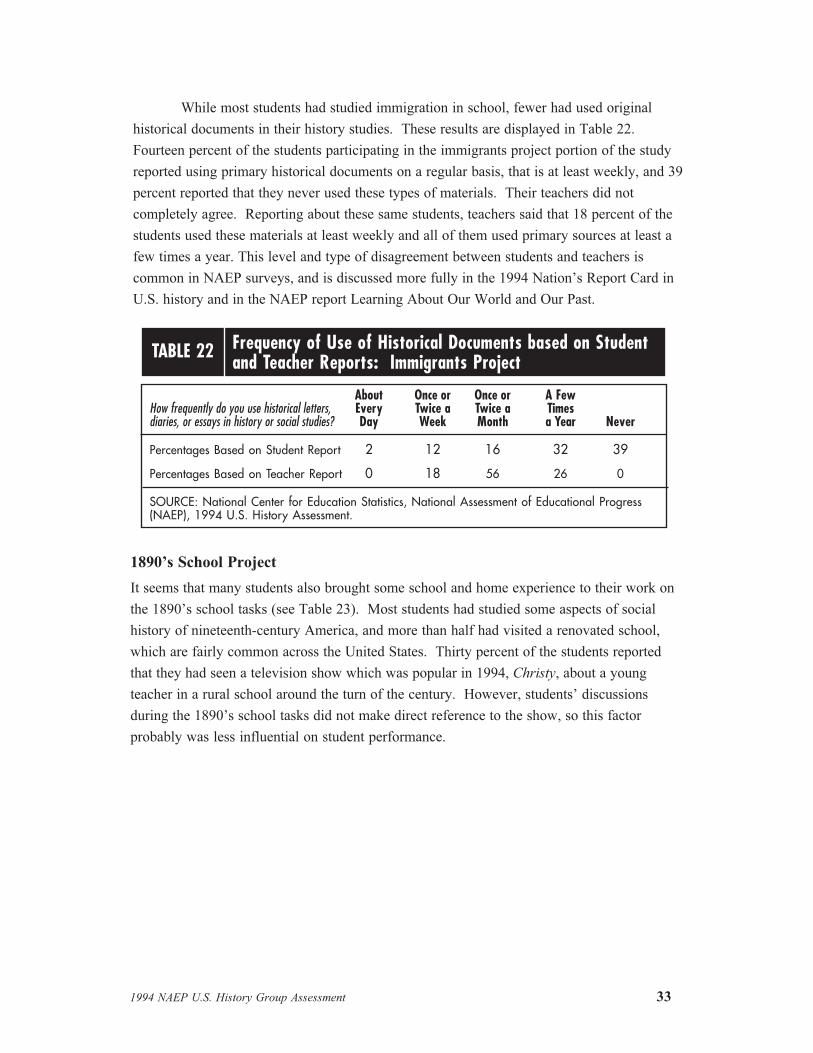
While most students had studied immigration in school, fewer had used original
historical documents in their history studies. These results are displayed in Table 22.
Fourteen percent of the students participating in the immigrants project portion of the study
reported using primary historical documents on a regular basis, that is at least weekly, and 39
percent reported that they never used these types of materials. Their teachers did not
completely agree. Reporting about these same students, teachers said that 18 percent of the
students used these materials at least weekly and all of them used primary sources at least a
few times a year. This level and type of disagreement between students and teachers is
common in NAEP surveys, and is discussed more fully in the 1994 Nation�s Report Card in
U.S. history and in the NAEP report Learning About Our World and Our Past.
1890�s School Project
It seems that many students also brought some school and home experience to their work on
the 1890�s school tasks (see Table 23). Most students had studied some aspects of social
history of nineteenth-century America, and more than half had visited a renovated school,
which are fairly common across the United States. Thirty percent of the students reported
that they had seen a television show which was popular in 1994, Christy, about a young
teacher in a rural school around the turn of the century. However, students� discussions
during the 1890�s school tasks did not make direct reference to the show, so this factor
probably was less influential on student performance.
TABLE 22 Frequency of Use of Historical Documents based on Studentand Teacher Reports: Immigrants Project
About Once or Once or A FewHow frequently do you use historical letters, Every Twice a Twice a Timesdiaries, or essays in history or social studies? Day Week Month a Year Never
Percentages Based on Student Report 2 12 16 32 39
Percentages Based on Teacher Report 0 18 56 26 0
SOURCE: National Center for Education Statistics, National Assessment of Educational Progress(NAEP), 1994 U.S. History Assessment.

34 1994 NAEP U.S. History Group Assessment
Students participating in the 1890�s school tasks had relatively little experience using
original historical materials, as shown in Table 24. According to the reports of students,
14 percent used original historical sources at least weekly, and 36 percent never used these
types of materials. The teachers of these same students reported that 12 percent of the
students used primary documents once or twice a week, and all of them used these types of
materials at least a few times a year.
TABLE 23Percent of Students in the 1890�s SchoolProject with History Knowledge orExperience Related to 19th Century Schools
Percent of Students
Have Studied Everyday Lives ofPeople During the 1800�s 87
Have Visited a Museum thatShows What an Old School was Like 61
Have Watched the TelevisionShow Christy 30
SOURCE: National Center for Education Statistics, National Assessment ofEducational Progress (NAEP), 1994 U.S. History Assessment.
TABLE 24 Frequency of Use of Historical Documents based onStudent and Teacher Reports: 1890�s School Project
About Once or Once or A FewHow frequently do you use historical letters, Every Twice a Twice a Timesdiaries, or essays in history or social studies? Day Week Month a Year Never
Percentages Based on Student Report 2 12 34 16 36
Percentages Based on Teacher Report 0 12 65 23 0
SOURCE: National Center for Education Statistics, National Assessment of Educational Progress(NAEP), 1994 U.S. History Assessment.
1994 NAEP U.S. History Group Assessment 35
Amount of Experience Working in Groups
Students� performance on the two group history tasks, particularly the process ratings, might
be influenced by their experience in working in groups. Both students and teachers were
therefore asked how often students worked on group projects as a part of their history
instruction. One would assume that students with more of this type of experience would do
better at group history tasks. However, it must be kept in mind that in the pilot study students
were assigned to groups at random. They may not have known each other well and did not
have the benefit of working together on other projects over the course of a school year.
Because the groups tended to have a mix of students with more and less group experience,
analyses of the relationship between group experience and achievement were not pursued.
Immigrants Project
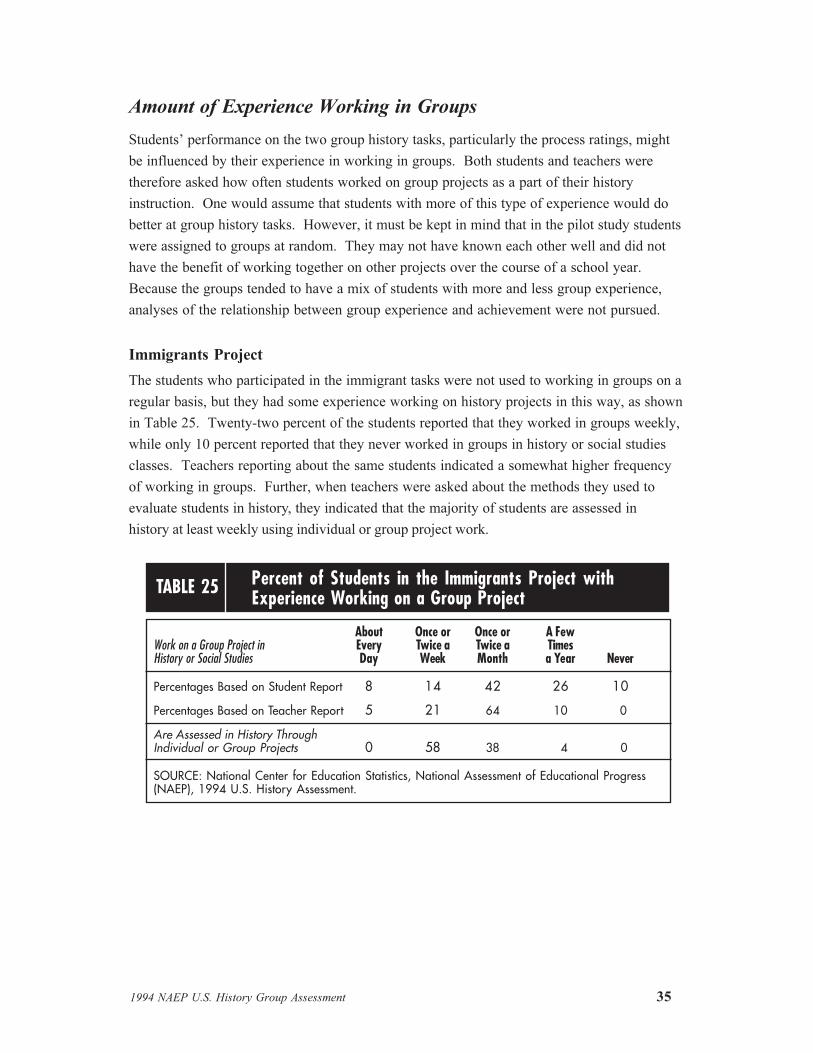
The students who participated in the immigrant tasks were not used to working in groups on a
regular basis, but they had some experience working on history projects in this way, as shown
in Table 25. Twenty-two percent of the students reported that they worked in groups weekly,
while only 10 percent reported that they never worked in groups in history or social studies
classes. Teachers reporting about the same students indicated a somewhat higher frequency
of working in groups. Further, when teachers were asked about the methods they used to
evaluate students in history, they indicated that the majority of students are assessed in
history at least weekly using individual or group project work.
TABLE 25 Percent of Students in the Immigrants Project withExperience Working on a Group Project
About Once or Once or A FewWork on a Group Project in Every Twice a Twice a TimesHistory or Social Studies Day Week Month a Year Never
Percentages Based on Student Report 8 14 42 26 10
Percentages Based on Teacher Report 5 21 64 10 0
Are Assessed in History ThroughIndividual or Group Projects 0 58 38 4 0
SOURCE: National Center for Education Statistics, National Assessment of Educational Progress(NAEP), 1994 U.S. History Assessment.
36 1994 NAEP U.S. History Group Assessment
1890�s School Project
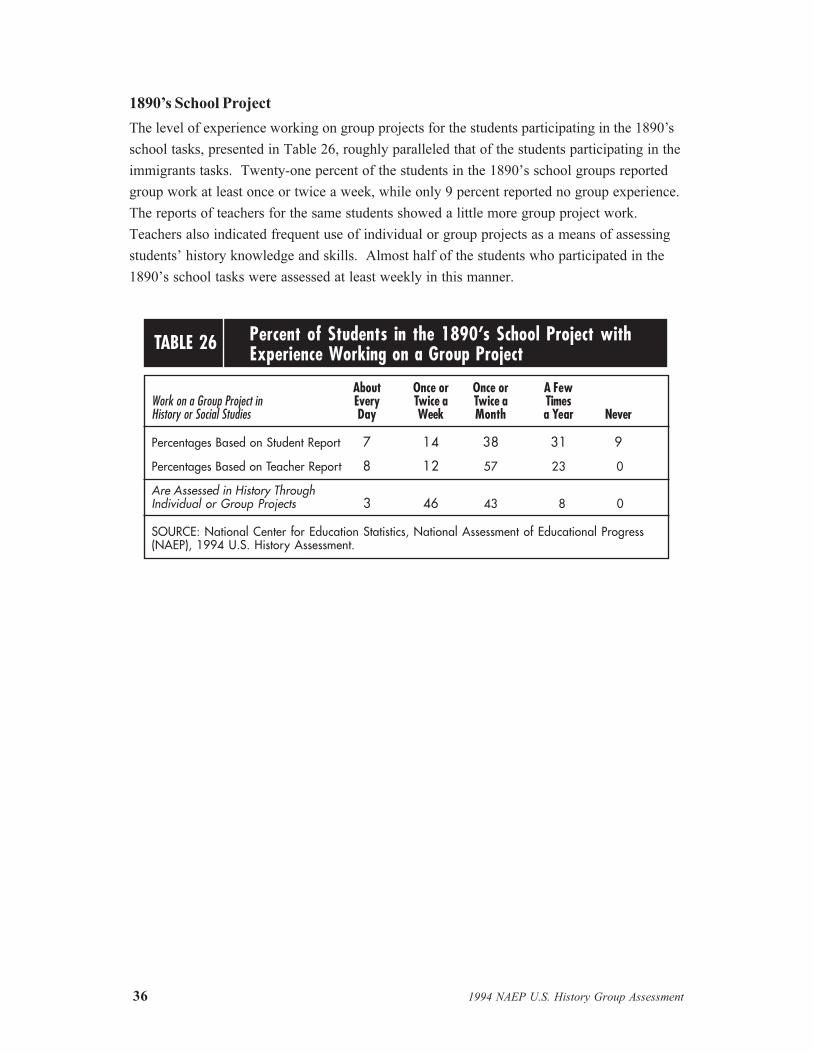
The level of experience working on group projects for the students participating in the 1890�s
school tasks, presented in Table 26, roughly paralleled that of the students participating in the
immigrants tasks. Twenty-one percent of the students in the 1890�s school groups reported
group work at least once or twice a week, while only 9 percent reported no group experience.
The reports of teachers for the same students showed a little more group project work.
Teachers also indicated frequent use of individual or group projects as a means of assessing
students� history knowledge and skills. Almost half of the students who participated in the
1890�s school tasks were assessed at least weekly in this manner.
TABLE 26 Percent of Students in the 1890�s School Project withExperience Working on a Group Project
About Once or Once or A FewWork on a Group Project in Every Twice a Twice a TimesHistory or Social Studies Day Week Month a Year Never
Percentages Based on Student Report 7 14 38 31 9
Percentages Based on Teacher Report 8 12 57 23 0
Are Assessed in History ThroughIndividual or Group Projects 3 46 43 8 0
SOURCE: National Center for Education Statistics, National Assessment of Educational Progress(NAEP), 1994 U.S. History Assessment.

1994 NAEP U.S. History Group Assessment 37
CHAPTER 2
Development and Operations:Recommendations for Improvement and
Lessons Learned
Introduction
As has been stated above, the purpose of the group assessment project was to evaluate the
feasibility of assessing groups of students, and to gain experience in the design,
administration, analysis, and scoring of such assessments. The purpose of this chapter is to
document some of the lessons that were learned as a result of the group assessment study, and
to make suggestions for how future studies might be better designed and implemented.
We focus, in this chapter, on areas of the group assessment that are different from
those found in individual student assessment. For example, the scoring of written products
was accomplished through methods identical to those used to score responses written by
individuals; the fact that they were produced by a group in no way affected scoring
methodology. Hence we have not discussed that issue here. Rather we have focused on
lessons we learned that would help improve future group projects. 1
Task Development
The 1890�s school task and the immigrants task were intentionally designed in somewhat
different fashions. The former task asked students to work as an integrated group, while the
latter broke them into pairs. The 1890�s school task relied solely on materials that might have
been present in a school of this era, and students worked on this single topic area. This task
also made extensive use of authentic (and often nontext-based) artifacts. The immigrants task
focused students on the similarities and differences between different groups, and thus
required students to work in a variety of historical periods. This task had authentic textual
materials and photographs, but fewer other artifacts than the 1890�s school task. The
assessment developers hoped that the contrast between tasks might shed some light on which
motivated students more highly, and which elicited both good historical thinking and vibrant
group interaction.
1Before beginning, we should mention that the lessons described below have already been put to productive use:They informed the development, administration, and scoring of the group assessments conducted as part of theNAEP Arts Education Assessment in theater in 1997. The theater assessment had a high participation rate, andresults of the group projects are being included as part of the Nation�s Report Card in the Arts.

38 1994 NAEP U.S. History Group Assessment
Since the two projects were designed using different types of materials and formats
for group interaction, they understandably did generate different types of student responses
and different group behaviors. Students seemed to display more enthusiasm and interest in
the 1890�s school project than they did in the immigrants project. Three factors appeared to
contribute to this: First, being able to handle real artifacts in the 1890�s school project was
clearly more stimulating for students. Second, the initial pairs format used in the immigration
project seemed to discourage students from interaction once the larger groups of six were
reconvened. This may be due to some combination of factors: The students were asked to
work in pairs and were then required, when they came back into a large group, to synthesize
the different and independent sets of information with which each pair had worked (in other
words, two students worked on Chinese immigrants, another two worked on Cuban
immigrants, and were then asked to synthesize and compare what they had learned). In the
case of the 1890�s school project, students worked together throughout the project and worked
in a single topical area. Third, students seemed implicitly able to identify with the Iowa school
and to understand comparisons that were made with their own school; this task was open to
students regardless of the specific curriculum that they had been taught. Field administrators
noted that students who participated in the immigrants task often seemed stymied and
confused by materials relating to a specific immigrant group of whom they had no specific
knowledge.
The experience with the special study suggests several changes in task development
that would enable the group assessment to run more smoothly and produce better results.
● Students should be given tasks related to their personal experience or knowledge,
which could be achieved by tying tasks to a known curriculum.
● Groups should be small enough [about four students] so students can communicate
without needing to break off into subgroups.
● Students should work in a single topical area, rather than being forced to work in
groups in different topical areas.
● Students should be presented with an overall problem to solve or product to
produce. Then students should be given task sheets to structure the answers and
standardize the evaluation. These procedures worked well in the pilot study, and
should be used in future assessments of group performance.

1994 NAEP U.S. History Group Assessment 39
Communication Rating Scales Development
Communication rating scales were developed for the purpose of compiling descriptive
information concerning aspects of group interaction that might affect achievement on the
tasks. Group processes were scored in three areas: participation, process, and content. As
described in Chapter 1, the communications ratings were conducted both during live
assessment sessions and based on a review of the videotapes of those sessions.
Communications ratings were assigned reliably; that is, there were high rates of agreement
among raters. These scales provided useful information and should be used as part of any
group assessment study.
The scales evolved from five points to three points because it was difficult to
articulate and find clear examples of such complex processes for five levels. We thus
recommend that a three-point scale, rather than a five-point scale, be used to rate
communication processes among groups. Terms and descriptive statements that defined the
scale points were drawn both from previous research and from observations of actual student
performance during pilot testing.
A special issue arose in the communication rating of the �historical content� of the
discussion. In the majority of cases the quality of the products documented by the group
recorder �matched� the quality of the group discussion; that is, discussions that showed �good
historical content� were held by groups that produced �good� products. However, in about 15
to 25 percent of the cases the content quality was not the same; i.e., the recorder�s response
was either better or worse than the content embodied in the group discussion. Thus, the
written response may not fully reflect all the group knew or could do, or conversely, may give
a falsely high picture of group performance. The reasons for this may be several. On the one
hand, if a strong student were the recorder, he or she might put more into the written response
than resulted from the discussion. On the other hand, an inattentive recorder might have
missed some of the important portions of the conversation, or may have been unable to
accurately reproduce them in writing.
This issue might be dealt with in a couple of ways. If the goal of the assessment is to
measure the history achievement of individual students as a result of a group interaction, then
one might design a group project that asks individual students to complete task sheets on their
own. If the goal of the assessment is to measure the collective achievement of the group,
then one might eliminate the written work altogether and score only the oral discussion.
However, it is important to note that the relationship between discussion and written products
may be an important piece of information to be gathered by a group assessment study.
Therefore, the current version, in which both discussions and written work were evaluated,
may hold the best promise.

40 1994 NAEP U.S. History Group Assessment
Three general recommendations emerge in the area of group communications scales.
These are:
● Communications ratings are an important source of information in this type of
assessment and should be included. The general communications categories used
in this study � participation, process, and content � provided valuable information
and should be used in future studies.
● It was not possible for judges to reliably divide communications and group
processes into five ratings categories. Three-point scales proved more effective.
● In the area of content, it became clear that, in a number of cases, written products
were either notably better or worse than the content of the discussion indicated that
they should be. However, such information seems, on its face, to be an important
part of such a study.
Administration Procedures
Administration of the group projects included the usual NAEP procedures for identifying
eligible students and monitoring and timing the assessment. These procedures did not pose
any problems. However, other operational aspects did add obstacles in the field. Parental
permission for videotaping proved difficult to obtain. In addition, setting up and operating
video equipment, reading an administration script that demanded some level of interaction
with the students, and completing communication ratings during the project all presented real
challenges to field administrators.
As mentioned previously, obtaining enough students for the study presented a major
obstacle. In a limited number of cases, school coordinators made some mistakes in
identifying eligible students. However, the major problem was an extremely low return rate
for parental permission forms (38 percent). Although many more students were identified
than needed, out of 72 sessions planned, only 48 were conducted. If videotaping is required, it
is clear that more time and effort needs to be devoted to obtaining parental permission forms.
The following steps could be taken to increase the response rate:
● The field administrator, rather than the school coordinators, might identify the
eligible students.
● More information might be given to parents about the purposes and uses of the
study.
● Parental permission forms could be both mailed to parents and given to students
with a more informative letter about the project.
1994 NAEP U.S. History Group Assessment 41
Problems with video equipment could be reduced by giving administrators more time
to practice with the equipment and make trial tapes. The video cameras need to be equipped
with headphones so that sound may be checked at each session. Better packaging is also
needed for the equipment so that it will not be damaged in shipping.
The difficulties that administrators experienced in reading the script and completing
the communication ratings could be addressed by improved training, as discussed below.
Training Assessment Administrators
Assessment administrators participated in two days of training. They received a manual that
outlined all phases of the administration. The sections on preparing the paperwork for the
assessment and post-assessment recordkeeping were reviewed and were well understood, as
these procedures were familiar to experienced administrators.
The bulk of training time concentrated on the group communications ratings.
Remember, administrators were expected to both set up the session and to give
communications ratings as they watched the students (These ratings were also given by a
later set of judges watching the videotape.). Administrators were shown examples of group
performance assembled from videotapes of task tryouts. The first rating scale, participation,
was explained. Then a videotaped example of a level 3 performance was viewed and
discussed, followed by a videotaped example of level 2, and then an example of level 1.
Administrators then viewed three more tapes and practiced making ratings. This sequence
was repeated for both the process and content ratings. The examples were drawn from
different tasks from both projects. For the final practice exercise, administrators rated a
videotape of a complete administration of the immigrants project and completed all three
scales for all five tasks. Their work on this final practice was used to determine the reliability
of their ratings and to identify those who were experiencing difficulty. As a group, the raters
agreed with preestablished ratings 80 percent of the time.
In addition to the rating training, administrators had an opportunity to observe a live
administration of each of the projects. Administrators were also each given their own set of
video equipment and were walked through the instructional manual and actual setup of their
equipment.
After training, each administrator was given a complete copy of the training tape and
its corresponding ratings and was encouraged to use the tape as a refresher course when
needed.

42 1994 NAEP U.S. History Group Assessment
Although the training session went smoothly, the field experiences of the
administrators indicated that the following modifications would improve its usefulness:
● There should be a mechanism to deal with situations where administrators do not
demonstrate proficiency with the rating scales.
● The difference between the training and the field experience was too large. Much
time was spent on learning to assign ratings, and relatively less on learning to
administer the assessment tasks. In addition, there were few authentic videotapes
of field administrations to be used in training. In future trainings, administrators
should view and rate more tapes that more closely resemble the actual field
experience.
● Administrators should actually do the tasks and receive some instruction in U.S.
history. This would enable them to understand the project in depth and to make
better judgments when doing the communication ratings (as these involve
assessing, among other things, content knowledge).
● All administrators should be required to review the training tapes at regular
intervals.
● Administrators need the opportunity to practice the script. They need to be so
familiar with the script that they can �speak it� to the students in a relaxed and
personable manner.
Administering Assessments
Overall, project administrations ran smoothly. Problems did arise, however, as described
below.
Sampling of student participants was to be performed on the day of the
administration. There was often difficulty in obtaining enough students to do both projects,
however, so that in many cases sampling was unnecessary. It should be noted that in a larger
assessment, sampling would have to be completed prior to the day of assessment.
The most pervasive problem in the sessions was that students did not speak loudly
enough. Ability to hear students was crucial for rating the live group performances and even
more important for rating the videotapes. Some aspects of the sessions seemed to exaggerate
this problem. Students came into the room with little knowledge about why they were there,
creating confusion. Further, due to the random sampling, students did not know the other
students in the group with whom they were instructed to work �together.� Some
administrators conducted brief warm-up activities with the students and these appeared to
improve group interaction.
The presence of a video camera did not seem to affect students, but the number of

1994 NAEP U.S. History Group Assessment 43
observers did. In a few sessions there were as many adult observers as there were students.
Field administrators uniformly believed that this was clearly an intimidating situation that
should be avoided.
The tentativeness of the group interaction might also have been due to the fact that
the students were not used to working in groups and/or not used to working with one another.
Students were selected at random from those who participated in the main NAEP assessment.
They were drawn from across all the eighth-grade classes in their school and they may or may
not have worked in groups on a regular basis. An alternative strategy might be to sample
students from existing history classes. Then a particular group of students would be used to
interacting with one another in a history class context. Depending on their teacher�s
instructional style, they might or might not be used to working on group projects, but that
level of experience would be known and relatively consistent across the group members.
Using randomly formed groups in the study allowed for measurement of the abilities
of students to work in groups formed for a specific purpose. This situation mirrors many
group interactions that occur in the workplace and also allows one to form a sample that is, in
principle, representative of the population as a whole. However, putting students in groups
with others whom they do not know may prevent them from performing as well in groups as
they might. This might in turn lead to underestimates of group performance and to
generalizations about group behaviors that do not reflect the best practices available.
Lack of adequate space in some schools also contributed to some logistical problems
in conducting the administration. When rooms were small, it was difficult to set up the video
camera with a full view of the students. The off-site raters therefore did not always have a
clear view of all students. Although efforts were made to minimize distractions, the amount
of noise from students in the hall, people working in outer offices, and the outside was
considerable. The noise did not always distract the students, but it did affect the audio on the
tapes.
Another aspect of administration that needs modification is the reading of the script.
Administrators had been trained to read the script verbatim, as is generally the practice in the
administration of NAEP assessments. In practice, however, this instruction was interpreted in
different ways. Some administrators simply read, others tried to read and make some contact
with students, still others felt a need to read and include extra instructions to encourage
interaction. Strict protocols are needed for how much and what type of encouragement or
intervention are allowed. Protocols should also be used if �warm-up� activities are
administered with each group before introducing the tasks. In addition, administrators should
be carefully trained during the training session as to whether and how they can deviate from
the script.

44 1994 NAEP U.S. History Group Assessment
The last problems with conducting sessions are easily remedied. Administrators
should have timers that are silent. Headphones for monitoring sound on videotapes are
needed, and the quality of the blank videotapes should be upgraded.
To summarize, the general findings regarding field administration of the group
assessment tasks are as follows:
● This was a small-scale study. In a larger study, sampling needs to be conducted
well ahead of the assessment.
● Students must be encouraged to speak loudly and clearly and to work together.
Appropriate instructions in the administration scripts and warm-up exercises seem
to help markedly in these situations.
● The number of adult observers in sessions should be limited.
● This study used groups to which students had been randomly assigned. This would
allow generalization to the overall population and is an authentic situation found in
the workplace, but may have resulted in some tentativeness in group interaction
and underestimates of how well some students can work in groups. Using students
from intact classrooms may help ameliorate these problems, but will result in
difficult sampling problems.
● Group assessments involve space, and adequate space was often difficult to find in
schools. Field staff must negotiate space availability at an early point in the
process.
● Issues relating to standardization need to be revisited. Whether scripts should be
read verbatim, or some deviations allowed, should be the subjects of further study.
Training Videotape Raters
In addition to the ratings of live group performances by the assessment administrators, two
other scorers independently rated videotapes of the group communication. In considering the
implementation of this part of the study, the project advisory committee discussed whether
the second set of raters rating videotapes should be given the same training and protocols as
the observers rating live performances. It would be necessary to keep the training and
protocols the same in order to compare the agreement of videotape and live ratings.
However, the field experience yielded information that would be useful for revising the
training and protocols. Since it is felt that such information would probably increase the
reliability of the videotape raters and it seemed likely that revisions would be made in
the future, the committee decided to include some of those revisions in the training of
videotape raters.
1994 NAEP U.S. History Group Assessment 45
The videotape raters were trained using the same training tapes as in the training of
assessment administrators, but the following changes were made. The content rating was
revised to incorporate evidence of historical thinking, and a list of characteristics of historical
thinking was included. The process rating was revised so that it incorporated both
establishing procedures and managing human interaction, and the list of characteristics of
process behaviors was expanded. Decision rules were added for rating special circumstances
� for example, when you could not hear the students or when students passed the task
sheets around the group instead of talking.
Conclusion
The group assessment study in history served its stated purpose, that is, to gain experience in
and investigate issues related to the assessment of groups of students. Many of the issues
related to administration are seemingly simple, such as permission slips, but in practice led to
great difficulties. Other issues related to design choices must clearly be made, for example,
the advantages and disadvantages of using randomly assigned groups. Overall, we found that
assessing groups of students is both possible and productive, but that further experience is
likely to prove necessary before group assessment can be a routine part of large-scale
surveys.

1994 NAEP U.S. History Group Assessment 47
CHAPTER 3
Summary
The purpose of the NAEP U.S. history group assessment special study was to obtain
experience in the design, administration, scoring, and analysis of group assessment tasks.
The study provided an opportunity to develop group assessment tasks, group communication
rating scales, and assessment procedures; train assessment administrators and raters;
administer assessments to students who had also participated in the main NAEP U.S. history
assessment; and analyze and examine the results.
The study provided both statistical and experiential data. By analyzing the results of
groups composed of different types of students responding to two different sets of tasks, it
was possible to explore some of the important factors that influence group assessments: the
relationship between academic knowledge and skills, group experience, personality, and other
characteristics of group members and group achievement. The experience of a small but
complete implementation of two group assessment projects also provided a wealth of
information regarding assessment development and operational issues.
The study showed that obtaining parental permission can be a major impediment to a
videotape study. Since the study results show that it is possible to reach about the same level
of reliability rating live performances as rating videotapes, future studies should not preclude
the option of conducting all ratings on the spot. This would eliminate problems associated
with obtaining parental permission. However, this would only be feasible in studies that use
teams of administrators. In addition, no videotapes would be available for secondary
analyses.
A second set of issues raised by the study involved getting students to speak loudly
enough and to interact with one another. The experience of the study suggests that task
design strongly influences the amount of interaction within the group. Some of the
characteristics of the 1890�s school project that might be emulated in future task development
include the selection of topics that are personally relevant to students, the addition of an
engaging story line, inclusion of a wide variety of stimulus materials and artifacts, and an
opportunity for all students to examine all the materials. Also, field experience indicated that
tasks involving the whole group worked better than those requiring the group to break up into
pairs at various stages. In debriefing sessions, assessment administrators suggested the
addition of warm-up activities and other mechanisms to encourage student interaction that
could be standardized and incorporated into protocols for administrators.
C H

48 1994 NAEP U.S. History Group Assessment
The results suggest that students who helped their groups achieve high content ratings
also tended to do well on the NAEP U.S. history assessment. Those who did not participate in
the group tasks tended to do less well on the assessment. Much more research in the area of
group assessment is required. However, this special study provided many insights and
practical experiences that can inform future work. As teachers respond to the challenge of
building critical thinking and teamwork skills among their students, they will be expanding
their use of complex, integrated group activities. It will then be important for the assessment
community to support these efforts by providing guidance and strategies for assessing group
learning and appropriately interpreting the results of group assessments.
1994 NAEP U.S. History Group Assessment 49
APPENDIX A
Immigrants Project
This appendix contains copies of the various materials used in administering the immigrants
tasks, as well as the tasks themselves and sample responses. Specifically, the following
sections present:
l the Administration Script which assessment administrators read to each group ofstudents that received the immigrants tasks;
l the Group Communication Ratings Sheet used by administrators to rate eachgroup�s live performance;
l a questionnaire used to gather contextual information from assessed students;
l the historical materials on Chinese, Cuban, and Jewish immigrants which weregiven to the student groups who participated in this project;
l the five immigrants tasks and the scoring guides for these tasks; and
l sample responses to the tasks.
Each section of this appendix begins with a brief description of the material that follows.

50 1994 NAEP U.S. History Group Assessment
Administration Script and Related Materials
Administration Script
The first item in this section is the Administration Script that assessment administrators read
to each group of students participating in the immigrants project. The script summarized the
purpose of the study, noted that the group�s work would be videotaped, explained the nature of
the immigrants project, introduced the materials to be distributed, and described the five tasks
to be performed. The script also specified the length of time to be provided for each task and
guided administrators in distributing and collecting the assessment materials from students.
Attached to the script was a list of answers to questions commonly asked by students
participating in the assessment.
Group Communication Ratings Sheet
The second item in this section is the ratings sheet used by administrators to evaluate the work
of each group of students participating in the immigrants project. The form provided criteria
for evaluating group participation (i.e., full, moderate, limited), process (i.e., facilitative,
adequate, unproductive), and content (i.e., extended, minimal, limited). Administrators used
these criteria to rate group work for each of the five immigrants tasks.
Immigrants Reaction Sheet
The third item in this section is a questionnaire that students were asked to complete at the
end of the group assessment session. It gathered information about their previous study of
immigrant groups, their experience working in groups at school, and their perceptions of the
group work in which they had just participated.

1994 NAEP U.S. History Group Assessment 51

52 1994 NAEP U.S. History Group Assessment
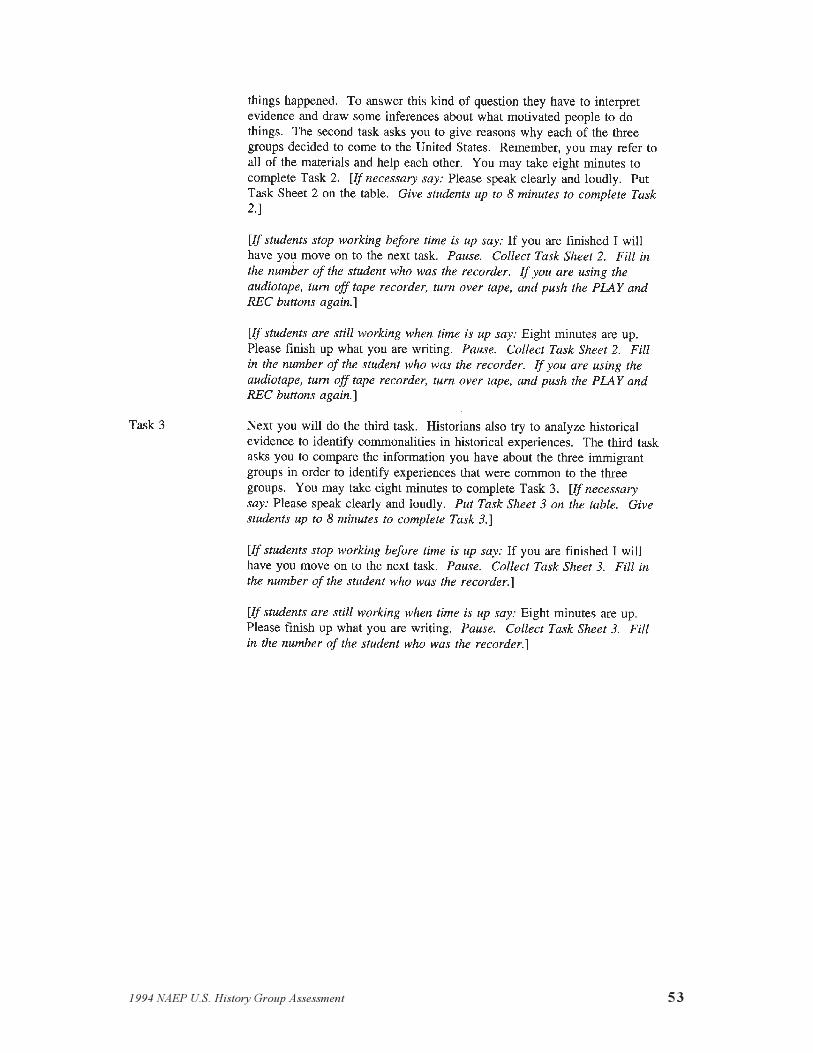
1994 NAEP U.S. History Group Assessment 53

54 1994 NAEP U.S. History Group Assessment

1994 NAEP U.S. History Group Assessment 55

56 1994 NAEP U.S. History Group Assessment

1994 NAEP U.S. History Group Assessment 57

58 1994 NAEP U.S. History Group Assessment

1994 NAEP U.S. History Group Assessment 59
Materials for Immigrants Tasks
What follows are copies of the historical materials that were given to student groups to use in
the immigrants project tasks. There are three groups of materials, one for each of the three
immigrant groups represented in the tasks. A list of the materials precedes the documents
themselves.
Chinese ImmigrantsCH-1 Personal recollections: One summer many, many years ago...
CH-2 Agreement signed by Chinese immigrants (1849)
CH-3 Photo: Clipper ship
CH-4 Newspaper clipping: A Living Stream... (1877)
CH-5 Photo: Chinese railroad workers camp
CH-6 Photo: Chinese construction crew
CH-7 Speech on completion of Central Railroad: In the midst of rejoicing...(May 1869)
CH-8 Picture: Anti-Chinese cartoon
CH-9 Newspaper clipping: No Rights for Chinese... (1876)
CH-10 Photo: Chinese market, San Francisco
CH-11 Photo: Chinese New Year�s procession, San Francisco
CH-12 The U.S. Congress Enacts the Exclusion Law (1882)

60 1994 NAEP U.S. History Group Assessment
CH-1 � Personal Recollection: One Summer Many, Many Years Ago. . .
CH-2 � Agreement Signed by Chinese Immigrant (1849)
Bancroft Library
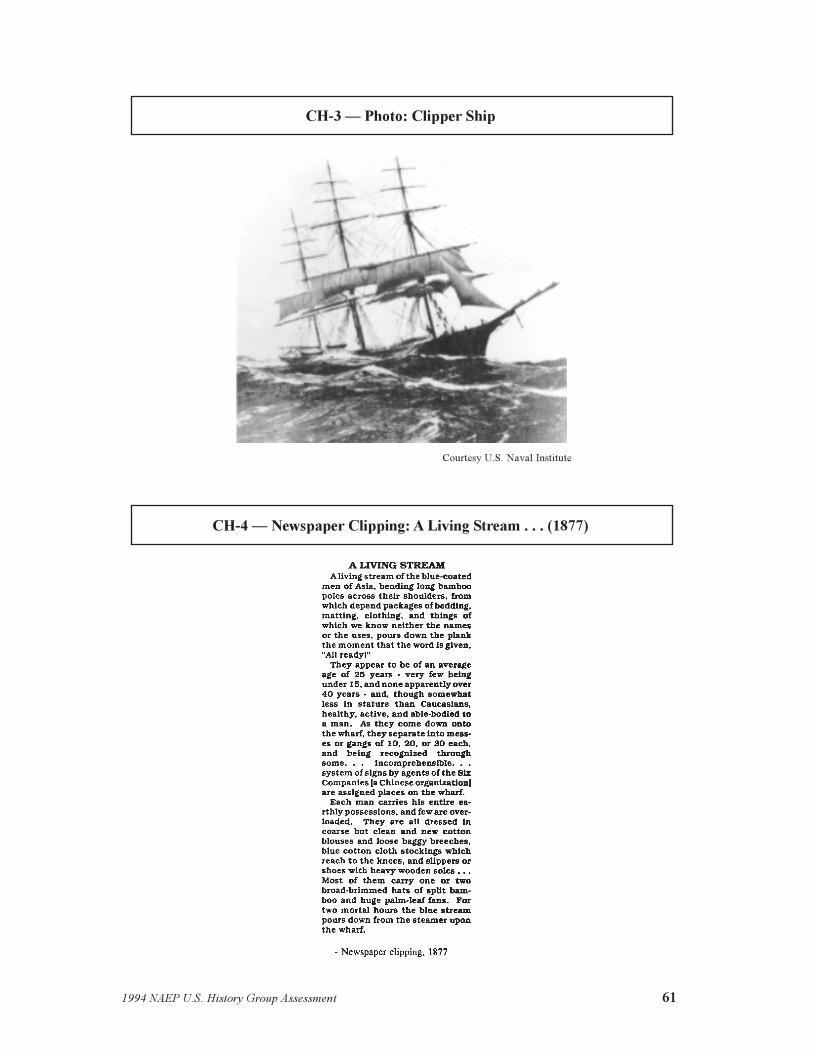
1994 NAEP U.S. History Group Assessment 61
CH-3 � Photo: Clipper Ship
Courtesy U.S. Naval Institute
CH-4 � Newspaper Clipping: A Living Stream . . . (1877)
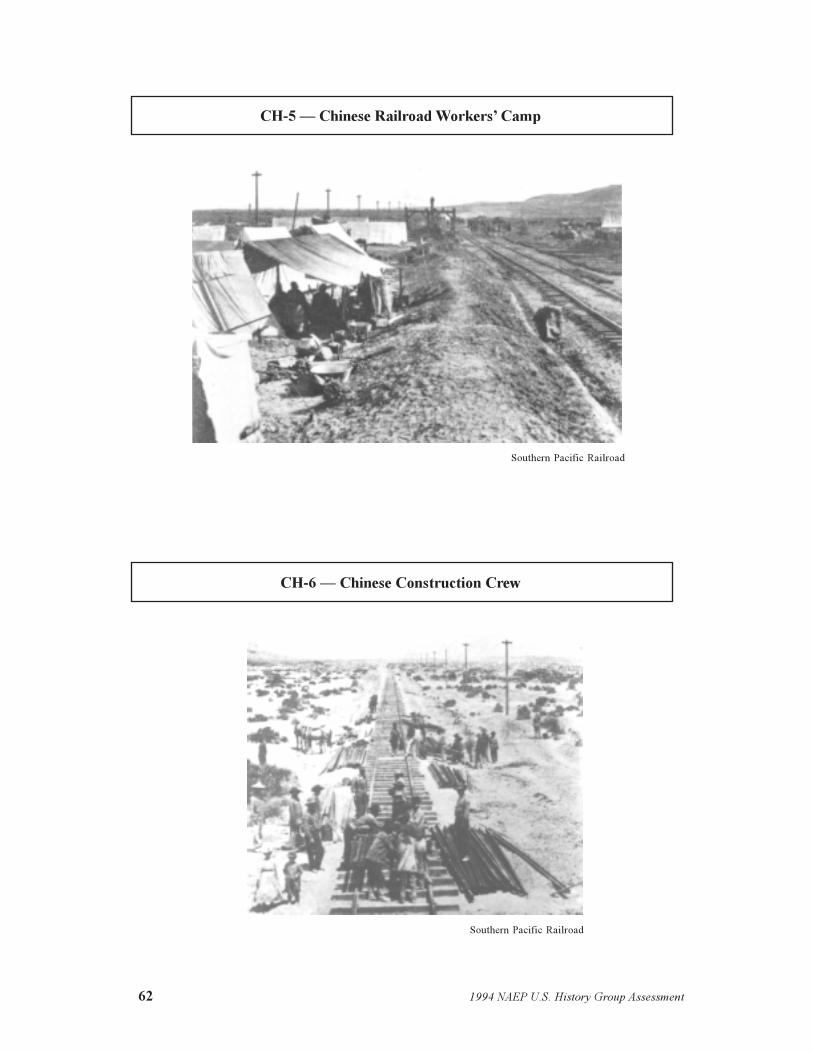
62 1994 NAEP U.S. History Group Assessment
CH-5 � Chinese Railroad Workers� Camp
Southern Pacific Railroad
CH-6 � Chinese Construction Crew
Southern Pacific Railroad

1994 NAEP U.S. History Group Assessment 63
CH-7 � Speech on Completion of Central Railroad: In the Midst of Rejoicing . . .
CH-8 � Anti-Chinese Cartoon
Bancroft Library

64 1994 NAEP U.S. History Group Assessment
CH-9 � Newspaper Clipping: No Rights for Chinese . . . (1876)
CH-10 � Photo: Chinese Market, San Francisco
Bancroft Library

1994 NAEP U.S. History Group Assessment 65
CH-11 � Photo: Chinese New Year�s Procession, San Francisco
Culver Pictures

66 1994 NAEP U.S. History Group Assessment
CH-12 � The U.S. Congress Enacts the Exclusion Law (1882)
Reprinted by permission

1994 NAEP U.S. History Group Assessment 67
Jewish Immigrants
J-1 Personal recollection: For some years after they got upon their feet again...(1908)
J-2 Picture: The Jewish Market, Cracow, Poland (1880)
J-3 Photo: Jewish Bread Market, Polotsk, Poland (1900)
J-4 Photo: Steamship travelling from Rotterdam to New York
J-5 Personal recollection: To me, [Ellis Island] was like the House of Babel�(1921)
J-6 Personal recollection: We naturally were in steerage�(1908)
J-7 Photo: The Great Examination Hall, Ellis Island (1904)
J-8 Interrogation, Question: Ask them why the came� Ellis Island (1908)
J-9 Personal recollection: In America, it was no disgrace�(1910)
J-10 Photo: Garment Factory, New York City (1912)
J-11 Personal recollection: We work here, very long hours�(1912)
J-12 Photo: Hester Street, circa (1910)

68 1994 NAEP U.S. History Group Assessment
J-1 � Personal Recollection: For Some Years After They GotUpon Their Feet Again . . . (1908)
J-2 � Picture: The Jewish Market, Cracow, Poland (1880)
New York Public Library
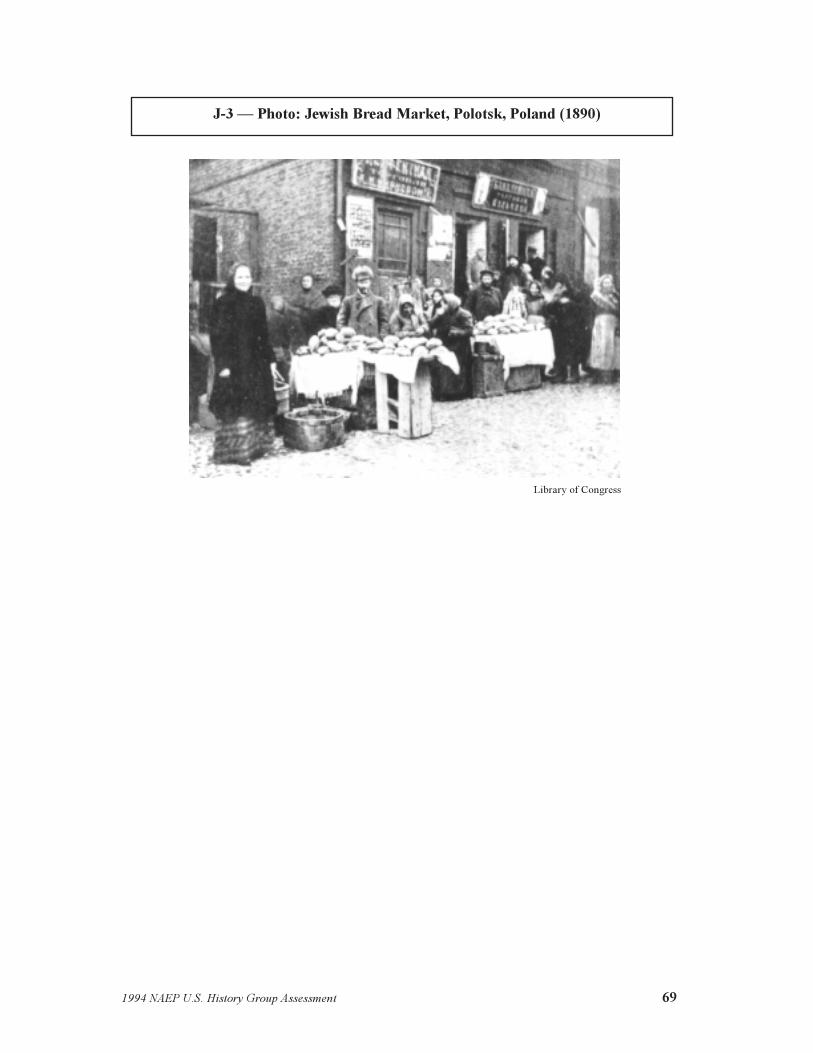
1994 NAEP U.S. History Group Assessment 69
J-3 � Photo: Jewish Bread Market, Polotsk, Poland (1890)
Library of Congress

70 1994 NAEP U.S. History Group Assessment
J-5 � Personal Recollection: To Me, [Ellis Island] Was Likethe House of Babel . . . (1921)
J-4 � Photo: Steamship Travelling from Rotterdam to New York
Library of Congress

1994 NAEP U.S. History Group Assessment 71
J -7 � Photo: The Great Examination Hall, Ellis Island (1940)
J-6 � Personal Recollection: We Naturally Werein Steerage . . . (1908)
Library of Congress

72 1994 NAEP U.S. History Group Assessment
J-8 � Interrogation, Question: Ask Them Why They Came . . . Ellis Island (1908)

1994 NAEP U.S. History Group Assessment 73
J-9 � Personal Recollection : In America, It Was No Disgrace . . . (1910)
J-10 � Photo: Garment Factory, New York City (1912)
Museum of the City of New York. The Byron Collection.

74 1994 NAEP U.S. History Group Assessment
J-11 � Personal Recollection: We Worked Here, Very Long Hours . . . (1912)
J-12 � Photo: Hester Street, circa (1910)
National Archives
1994 NAEP U.S. History Group Assessment 75
Cuban Immigrants
CU-1 Newspaper article: Still They Flee (1961)
CU-2 Photo: First Step
CU-3 Personal recollection: People began to be a little more careful to whom
they talked�(1961)
CU-4 Personal recollection: My husband and I were both successful in our
professions�(1962)
CU-5 Photo: Cuban physicians receive training
CU-6 Photo: Communication
CU-7 Personal recollection: I fled to Miami with my thirteen-year-old
daughter�(1963)
CH-8 Photo: Cuban-American neighborhood
CU-9 Personal recollection: If El Caballo (Fidel) tried to help us�(1962)
CU-10 Personal recollection: We had been promised a government controlled by the
people�(1962)
CU-11 Photo: Anti-Castro protesters in the U.S.
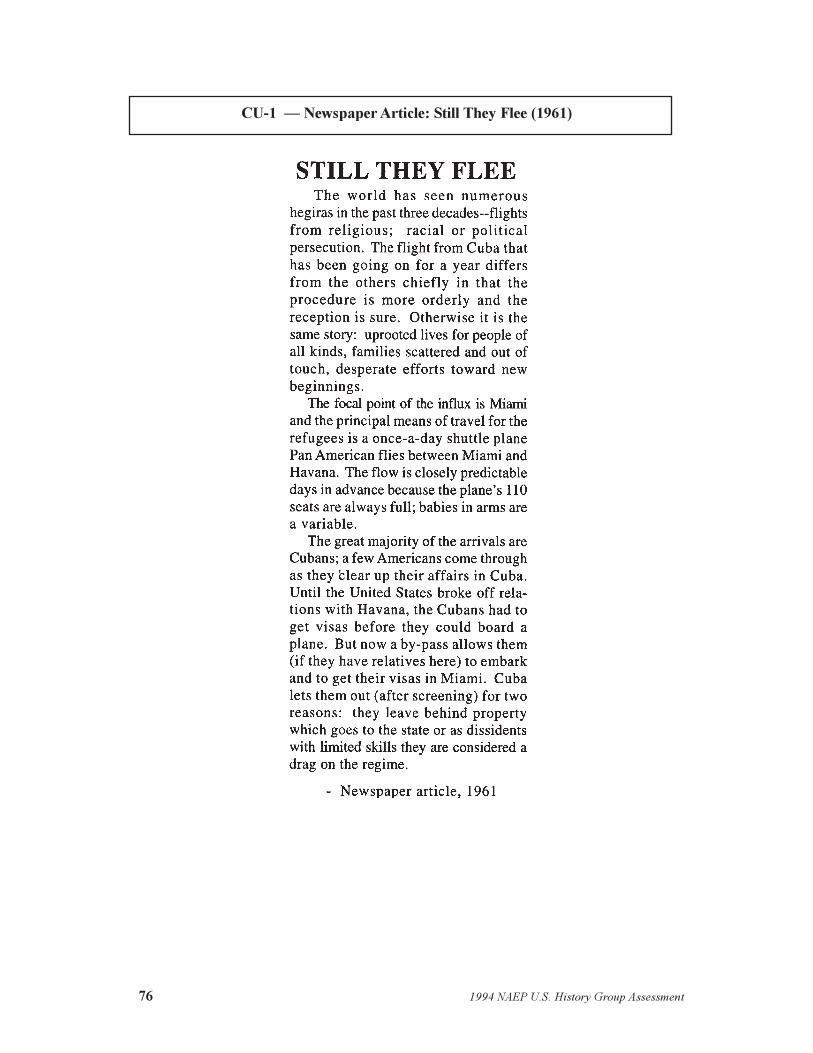
76 1994 NAEP U.S. History Group Assessment
CU-1 � Newspaper Article: Still They Flee (1961)

1994 NAEP U.S. History Group Assessment 77
CU-2 � Photo: First Step
Reprinted by permission

78 1994 NAEP U.S. History Group Assessment
CU-3 � Personal Recollection: People Began to Be a Little MoreCareful to WhomThey Talked . . . (1961)
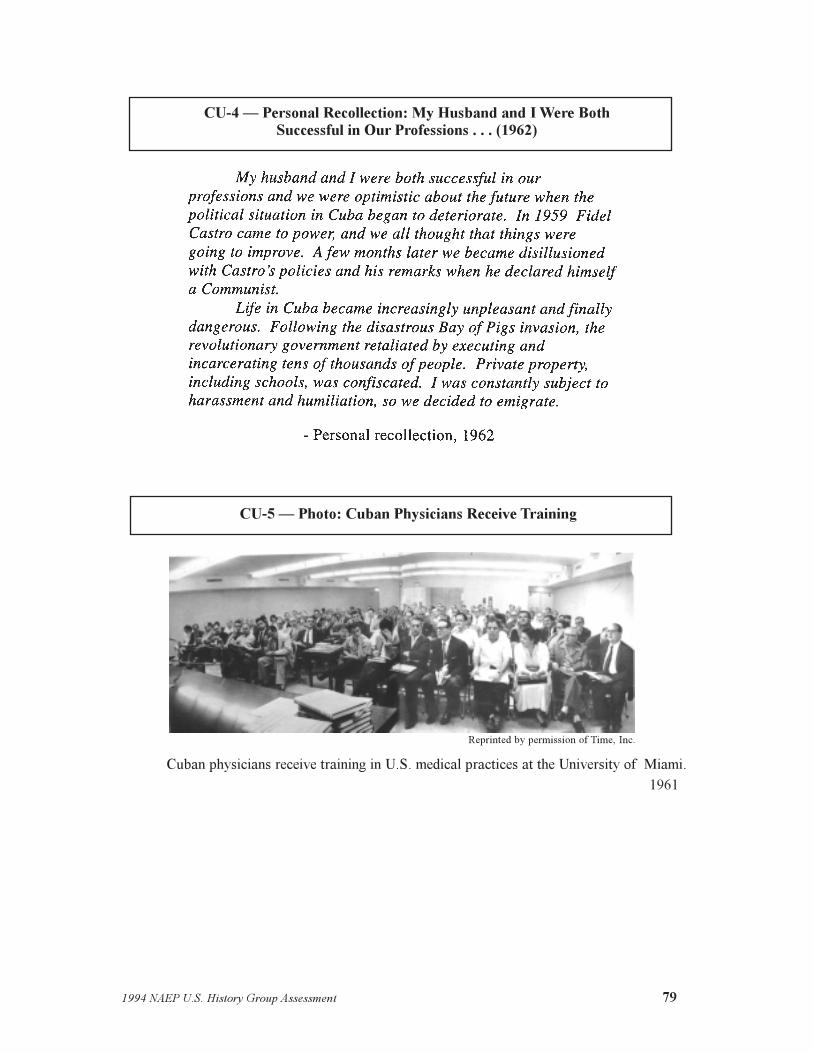
1994 NAEP U.S. History Group Assessment 79
Cuban physicians receive training in U.S. medical practices at the University of Miami.
CU-4 � Personal Recollection: My Husband and I Were BothSuccessful in Our Professions . . . (1962)
CU-5 � Photo: Cuban Physicians Receive Training
Reprinted by permission of Time, Inc.
1961

80 1994 NAEP U.S. History Group Assessment
CU-6 � Photo: Communication
COMMUNICATION - In a public school in the Miami area, youngsters attend special classes in
English. Courses for adults are also taught. 1961
Reprinted by permission

1994 NAEP U.S. History Group Assessment 81
CU-7 � Personal Recollection: I Fled to Miami withmy Thirteen-Year-Old Daughter . . . (1963)

82 1994 NAEP U.S. History Group Assessment
Cuban-American Neighborhood
CU-8 � Photo: Cuban-American Neigborhood
Catherine Noren
CU-9 � Personal Recollection: If El Calballo (Fidel) Triedto Help . . . (1962)

1994 NAEP U.S. History Group Assessment 83
CU-10 � Personal Recollection: We had Been Promised aGovernment Controlled by the People . . . (1962)

84 1994 NAEP U.S. History Group Assessment
CU-11 � Photo: Anti-Castro Protesters in the U.S.
UPI/Bettmann Archive

1994 NAEP U.S. History Group Assessment 85
Immigrants Tasks and Scoring Guides
The following are copies of the five tasks presented to students who participated in the
immigrants project component of the 1994 U.S. history group assessment. After each task is the
scoring guide developed to score the written responses to the tasks.

86 1994 NAEP U.S. History Group Assessment

1994 NAEP U.S. History Group Assessment 87

88 1994 NAEP U.S. History Group Assessment
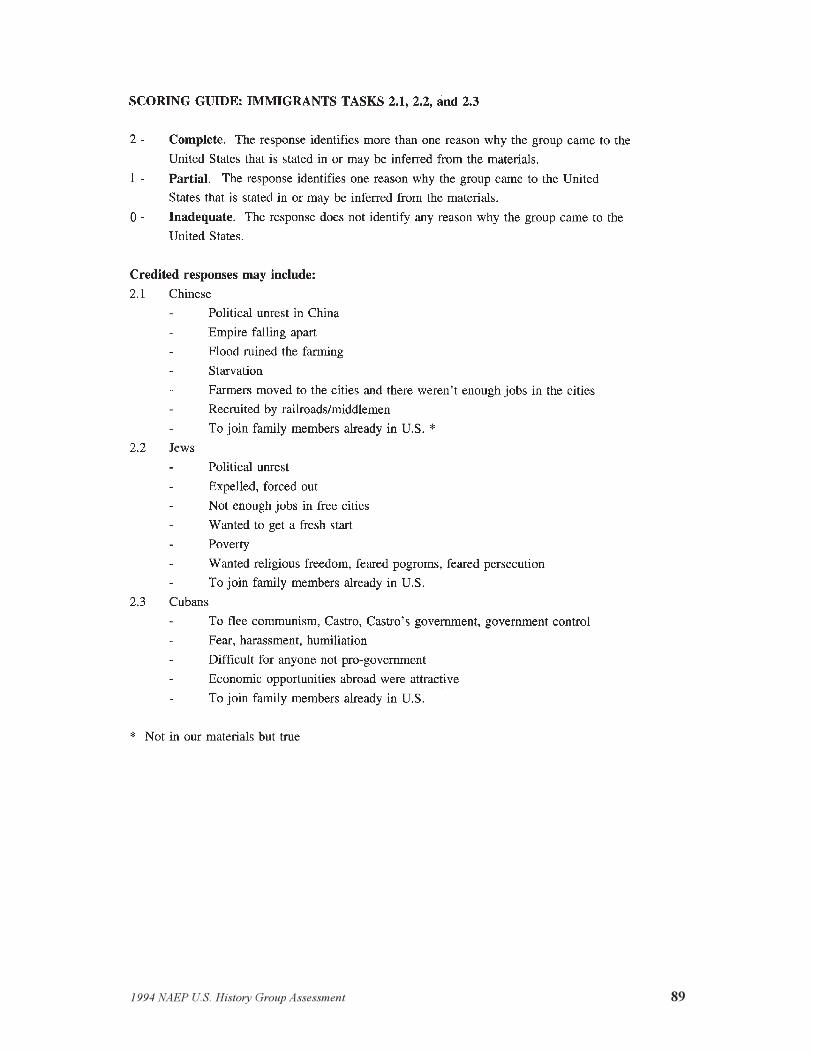
1994 NAEP U.S. History Group Assessment 89

90 1994 NAEP U.S. History Group Assessment

1994 NAEP U.S. History Group Assessment 91
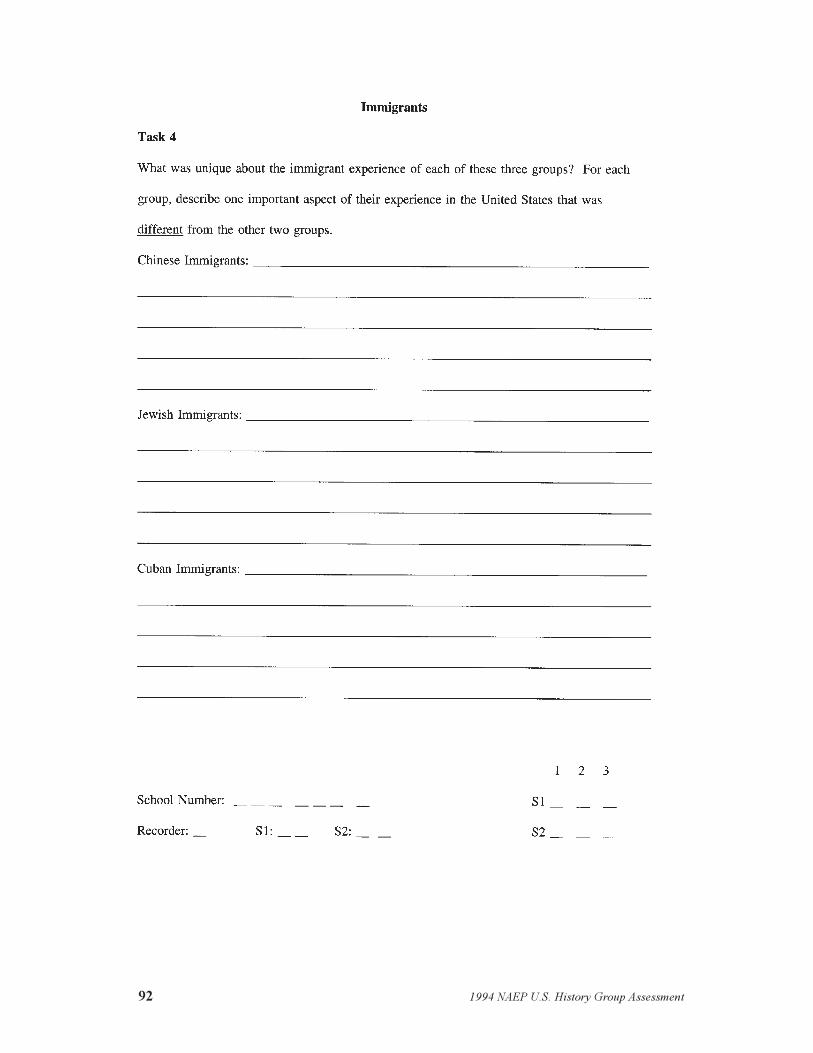
92 1994 NAEP U.S. History Group Assessment

1994 NAEP U.S. History Group Assessment 93
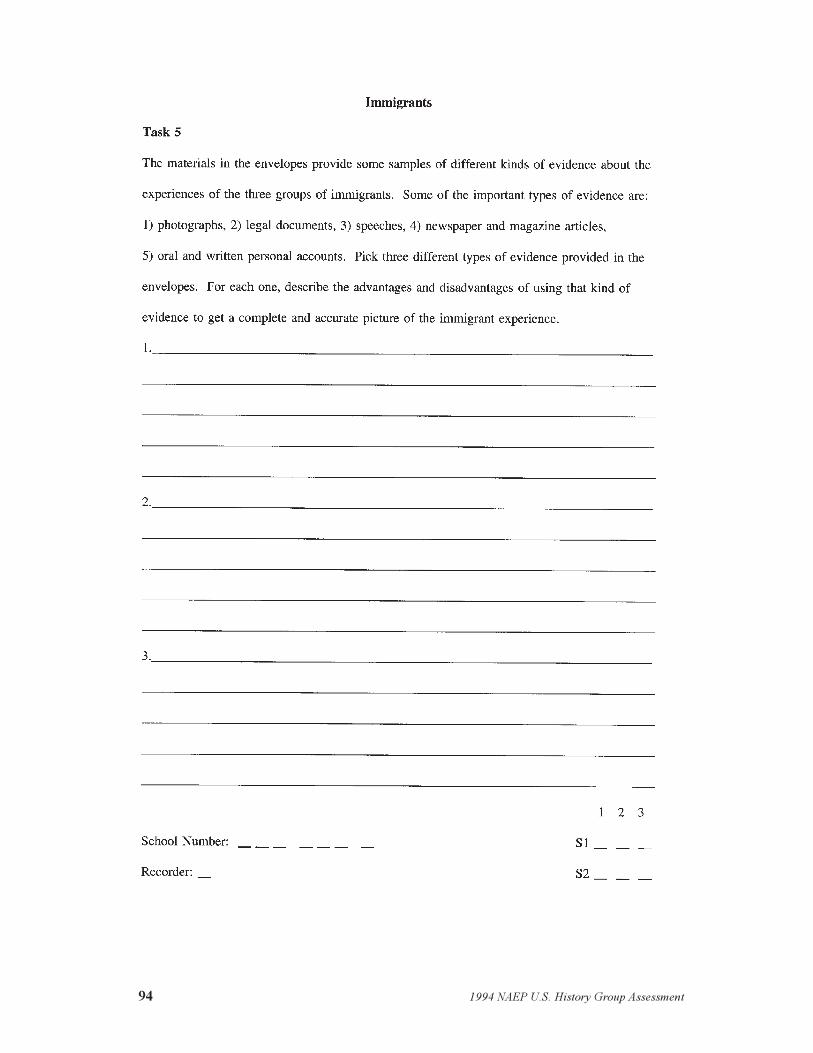
94 1994 NAEP U.S. History Group Assessment
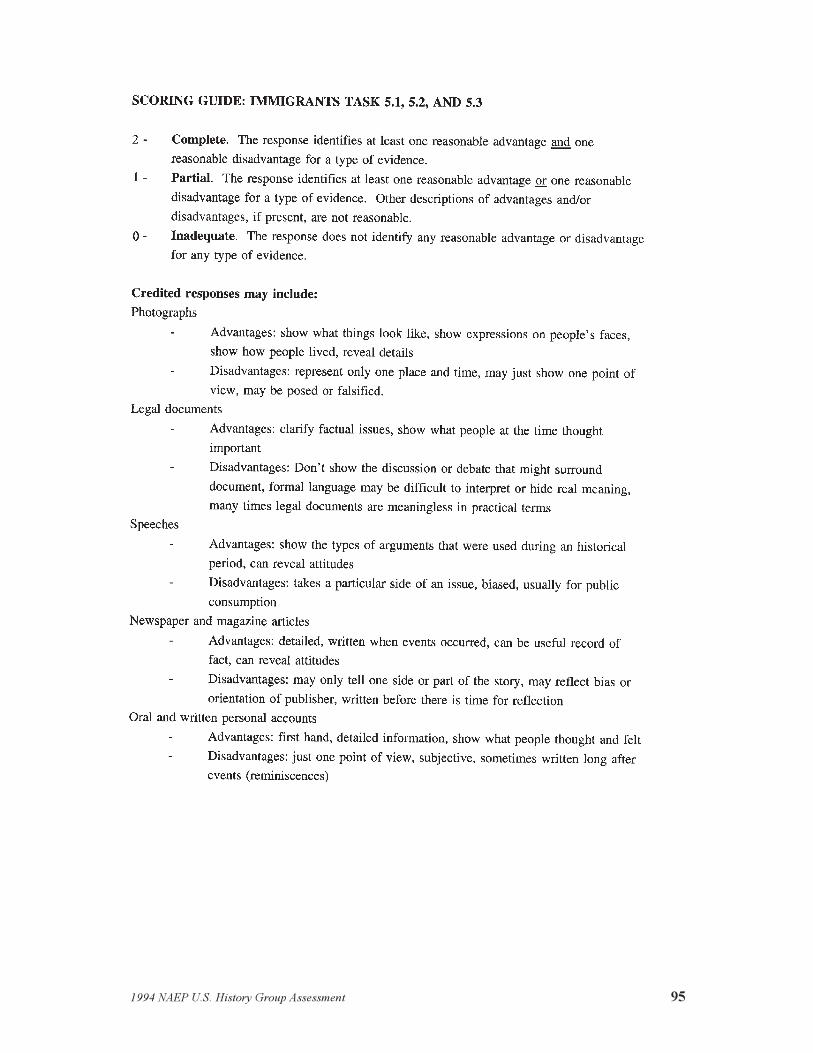
1994 NAEP U.S. History Group Assessment 95


1994 NAEP U.S. History Group Assessment 97
Sample Responses
The following are sample group responses to the five immigrants tasks. The score each response
received is located in the upper right-hand corner.

98 1994 NAEP U.S. History Group Assessment
1.1
A =
21.
3 A
= 3
1.1
B =
21.
3 B
= 2
1.1
C =
21.
3 C
= 2
1.2
A =
21.
4 A
= 2
1.2
B =
21.
4 B
= 2
1.2
C =
21.
4 C
= 2
1.5
A =
21.
5 B
= 2
1.5
C =
2
Sco
res
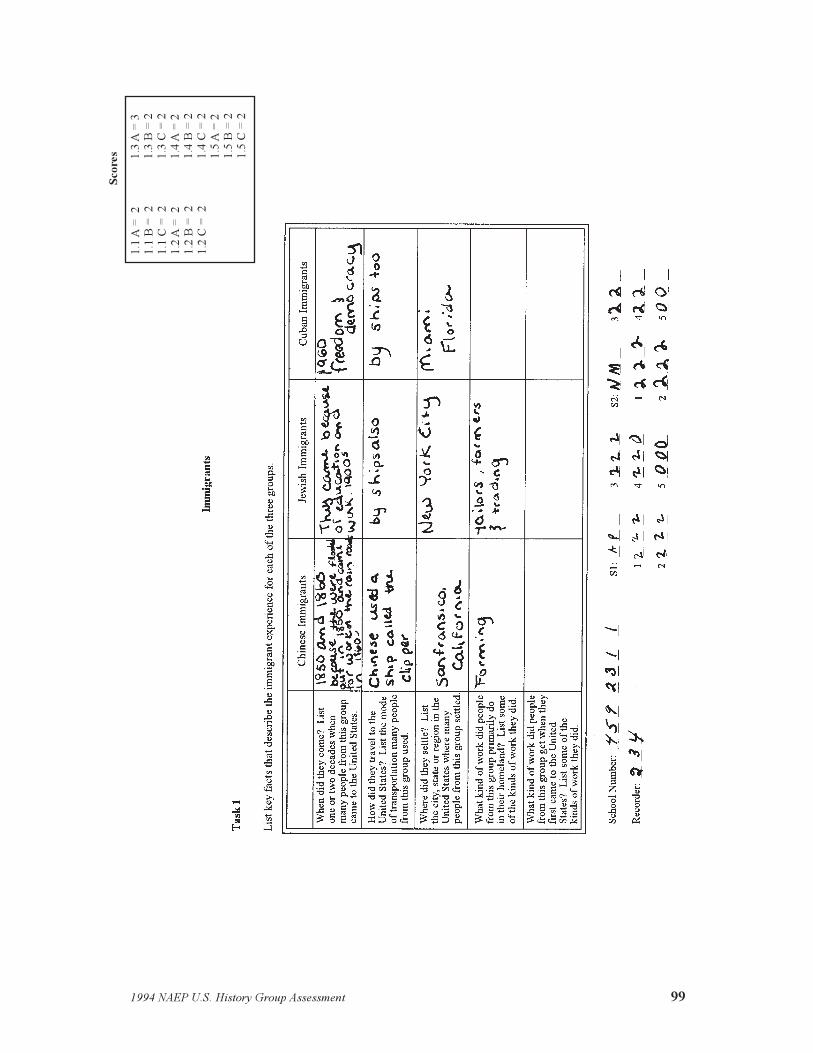
1994 NAEP U.S. History Group Assessment 99
Sco
res
1.1
A =
21.
3 A
= 3
1.1
B =
21.
3 B
= 2
1.1
C =
21.
3 C
= 2
1.2
A =
21.
4 A
= 2
1.2
B =
21.
4 B
= 2
1.2
C =
21.
4 C
= 2
1.5
A =
21.
5 B
= 2
1.5
C =
2

100 1994 NAEP U.S. History Group Assessment
Scores
2.1 = 32.2 = 32.3 = 2
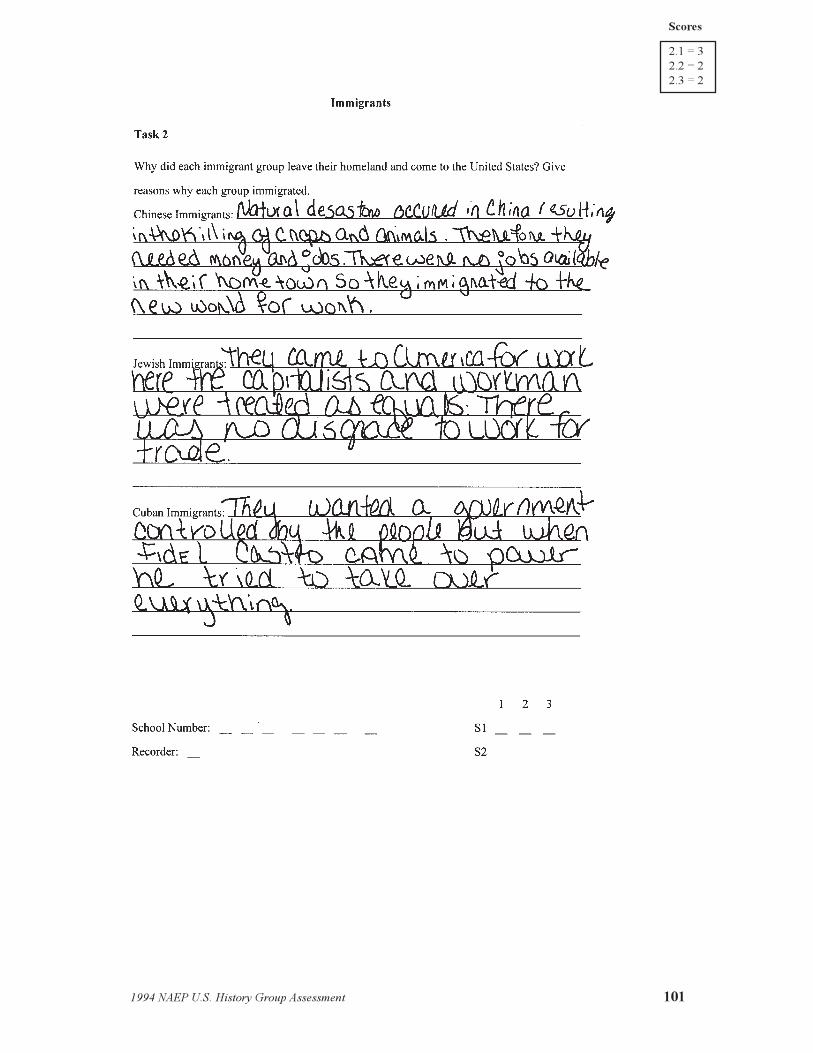
1994 NAEP U.S. History Group Assessment 101
Scores
2.1 = 32.2 = 22.3 = 2

102 1994 NAEP U.S. History Group Assessment
Score = 4

1994 NAEP U.S. History Group Assessment 103
Score = 4

104 1994 NAEP U.S. History Group Assessment
Scores
4.1 = 24.2 = 34.3 = 3

1994 NAEP U.S. History Group Assessment 105
Scores
4.1 = 34.2 = 14.3 = 3

106 1994 NAEP U.S. History Group Assessment
Scores
5.1 = 35.2 = 35.3 = 2

1994 NAEP U.S. History Group Assessment 107
Scores
5.1 = 25.2 = 35.3 = 3


1994 NAEP U.S. History Group Assessment 109
APPENDIX B
1890�s School Project
This appendix contains copies of the various materials used in administering the 1890�s school
tasks, as well as the tasks themselves and sample responses. Specifically, the following
sections present:
l the Administration Script which assessment administrators read to each group of
students that received the 1890�s school tasks;
l the Group Communication Ratings Sheet used by administrators to rate each
group�s live performance;
l a questionnaire used to gather contextual information from assessed students;
l the historical materials given to the student groups who participated in this project;
l the five 1890�s school tasks and the scoring guides for these tasks; and
l sample responses to the tasks.
Each section of this appendix begins with a brief description of the material that follows.

110 1994 NAEP U.S. History Group Assessment
Administration Script and Related Materials
Administration Script
The first item in this section is the Administration Script that assessment administrators read
to each group of students participating in the 1890�s school project. The script summarized
the purpose of the study, noted that the group�s work would be videotaped, explained the
nature of the project, introduced the materials to be distributed, and described the five tasks
to be performed. The script also specified the length of time to be provided for each task and
guided administrators in distributing and collecting the assessment materials from students.
Group Communication Ratings Sheet
The second item in this section is the ratings sheet used by administrators to evaluate the
work of each group of students participating in the 1890�s school project. The form provided
criteria for evaluating group participation (i.e., full, moderate, limited), process (i.e.,
facilitative, adequate, unproductive), and content (i.e., extended, minimal, limited).
Administrators used these criteria to rate group work for each of the five 1890�s school tasks.
1890�s School Reaction Sheet
The third item in this section is a questionnaire given to students at the end of the group
assessment session. The questionnaire asked students whether they had previously studied
about the lives of people during the 1800�s, whether they had ever visisted a museum that
showed what an old school was like, and whether they had seen a television show about a
young woman who taught in a rural one-room school. It also asked students about their
experience working in groups at school and their perceptions of the group work in which
they had just participated.
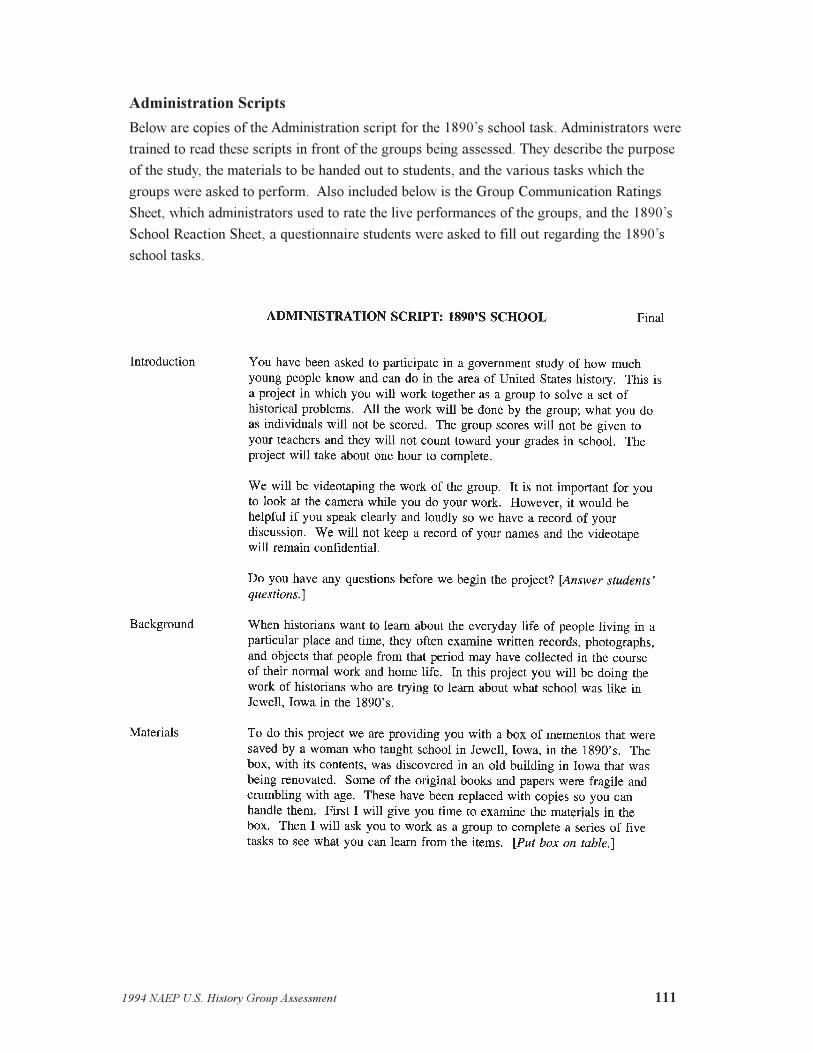
1994 NAEP U.S. History Group Assessment 111
Administration Scripts
Below are copies of the Administration script for the 1890�s school task. Administrators were
trained to read these scripts in front of the groups being assessed. They describe the purpose
of the study, the materials to be handed out to students, and the various tasks which the
groups were asked to perform. Also included below is the Group Communication Ratings
Sheet, which administrators used to rate the live performances of the groups, and the 1890�s
School Reaction Sheet, a questionnaire students were asked to fill out regarding the 1890�s
school tasks.
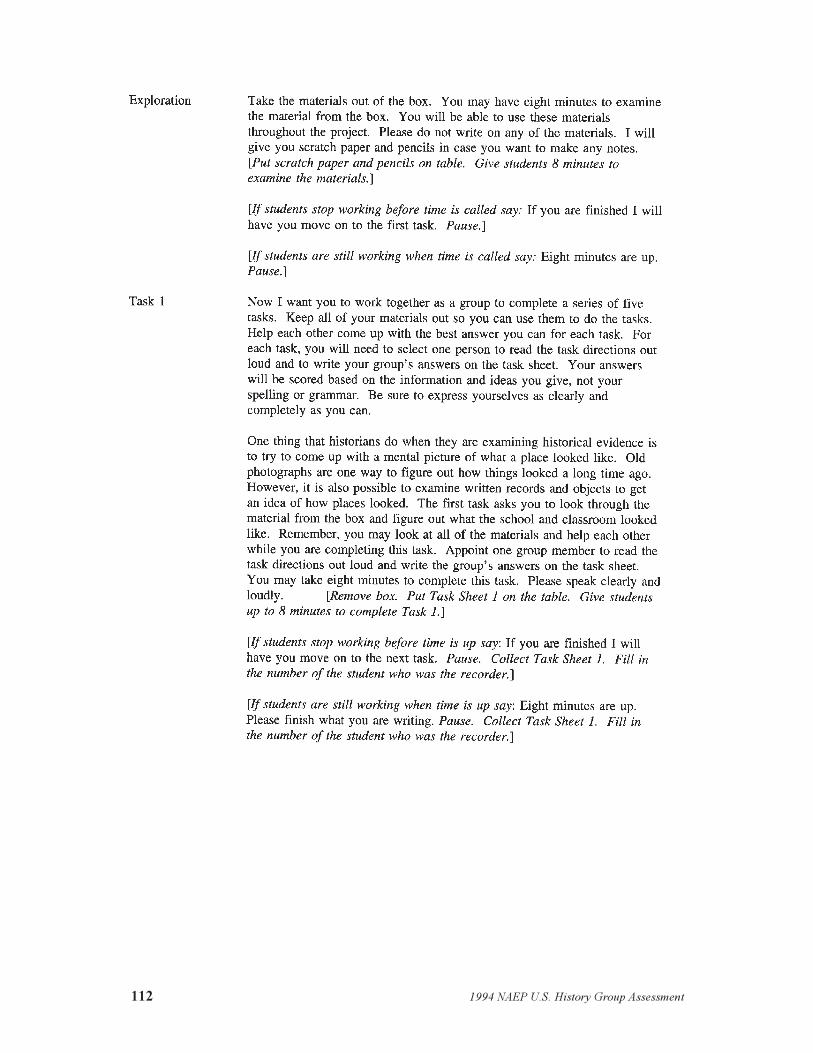
112 1994 NAEP U.S. History Group Assessment

1994 NAEP U.S. History Group Assessment 113
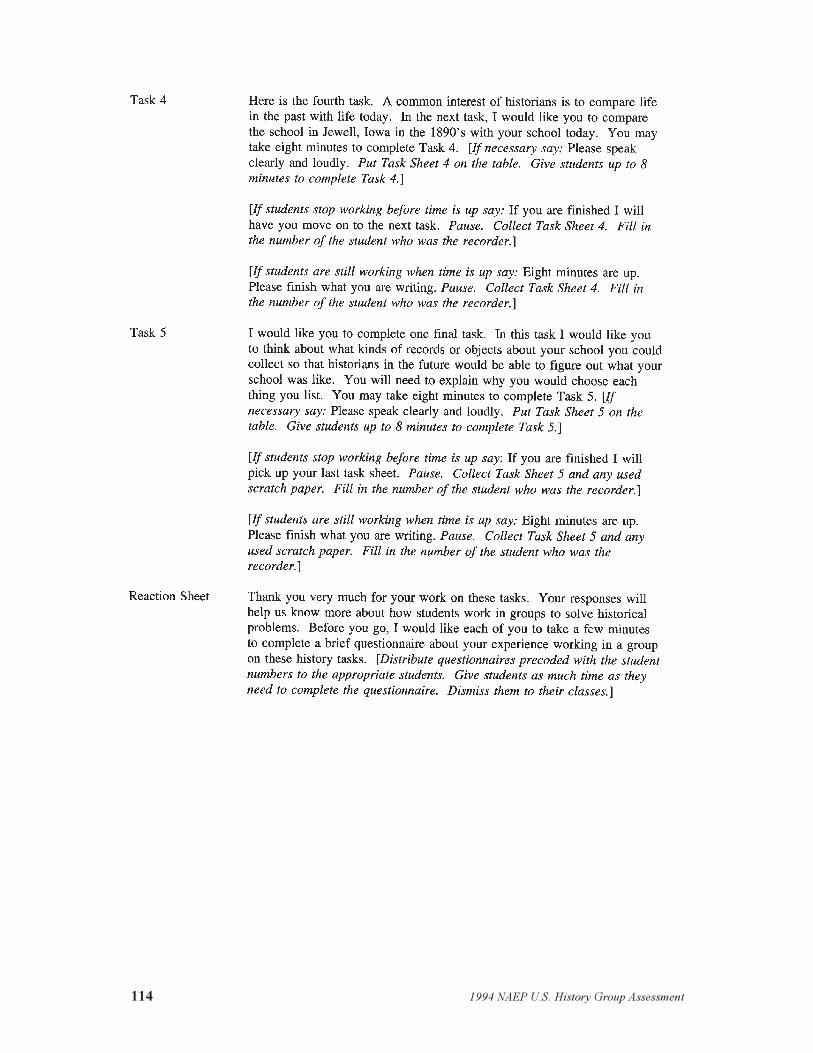
114 1994 NAEP U.S. History Group Assessment

1994 NAEP U.S. History Group Assessment 115

116 1994 NAEP U.S. History Group Assessment
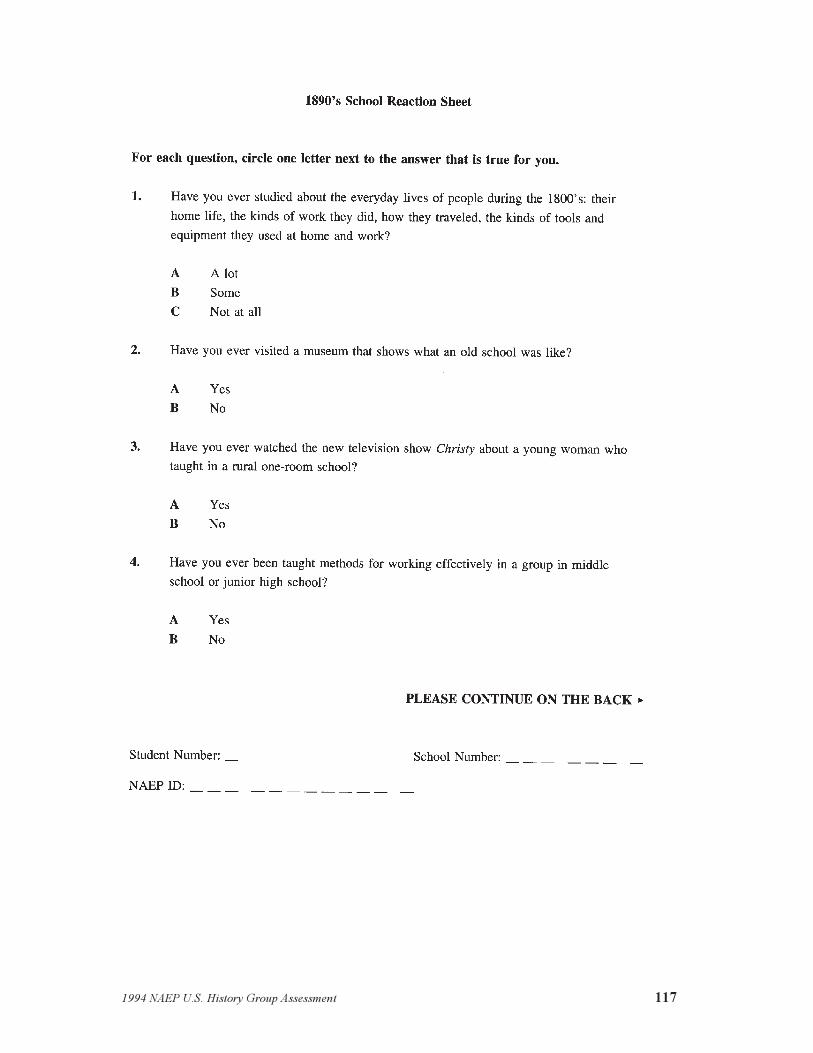
1994 NAEP U.S. History Group Assessment 117

118 1994 NAEP U.S. History Group Assessment

1994 NAEP U.S. History Group Assessment 119
Materials for 1890�s School Tasks
What follows are copies of the historical materials that were given to student groups to use in
the 1890�s school tasks. A list of the materials precedes the documents themselves.
*Box
*Chalk
*Pen
*Ink bottle
*Slate
*McGuffy�s Eclectic Spelling Book
*McGuffy�s Sixth Eclectic Reader
S-1 Photo: Class members outside school
S-2 Photo: Inside classroom
S-3 Floor plan of school house
S-4 Grading for primary, intermediate, and grammar
S-5 Schedule beginning with opening exercises
S-6 General Duties of Teachers
S-7 Rules for Teachers
S-8 Teacher�s journal (two pages)
S-9 Key to Correct Pen-Holding
S-10 Helen Brown: Penmanship Practice
S-11 Report of Mary Anderson
S-12 Questions for the Seventh Grade
S-13 Certificate of Promotion
S-14 Monthly attendance records
S-15 Duties of Pupils
S-16 Rules for Students
S-17 Photo: Coming to school
S-18 Photo: Outdoor games
S-19 Class Members Outside School
S-20 Our lunches
S-21 Mary Anderson: It is wrong to tell a lie
S-22 Joe Thompson: I will try to be quiet
*Not included in Appendix

120 1994 NAEP U.S. History Group Assessment
S-1 � Photo: Class Members Outside School
Reprinted by permission
S-2 � Photo: Inside Classroom
Reprinted by permission
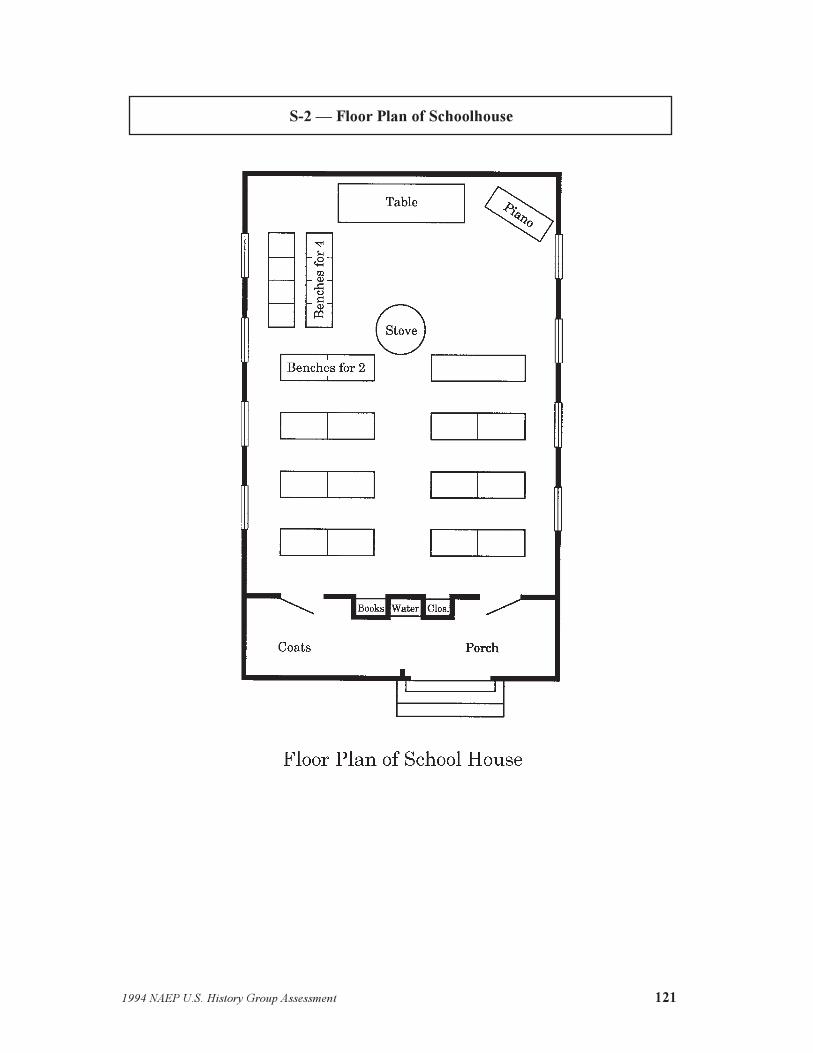
1994 NAEP U.S. History Group Assessment 121
S-2 � Floor Plan of Schoolhouse

122 1994 NAEP U.S. History Group Assessment
S-4 � Grading for Primary, Intermediate, and Grammar
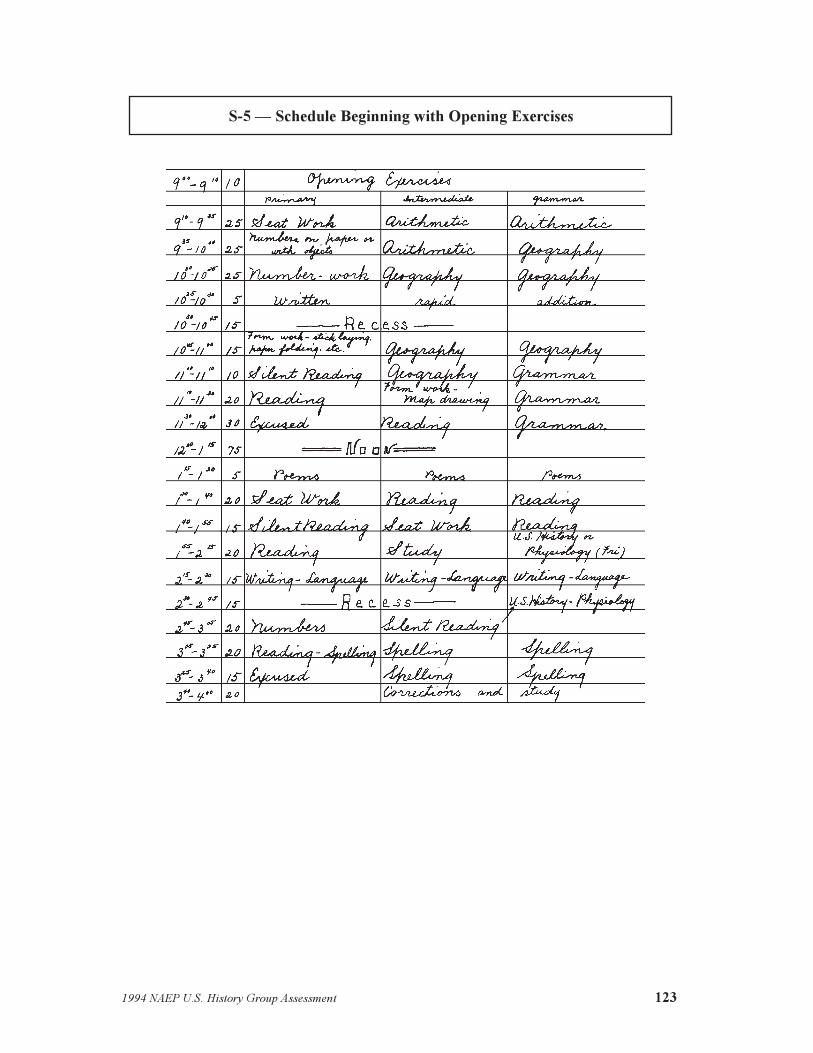
1994 NAEP U.S. History Group Assessment 123
S-5 � Schedule Beginning with Opening Exercises

124 1994 NAEP U.S. History Group Assessment
S-6 � General Duties of Teachers
S-7 � Rules for Teachers

1994 NAEP U.S. History Group Assessment 125
S-8 � Teacher�s Journal
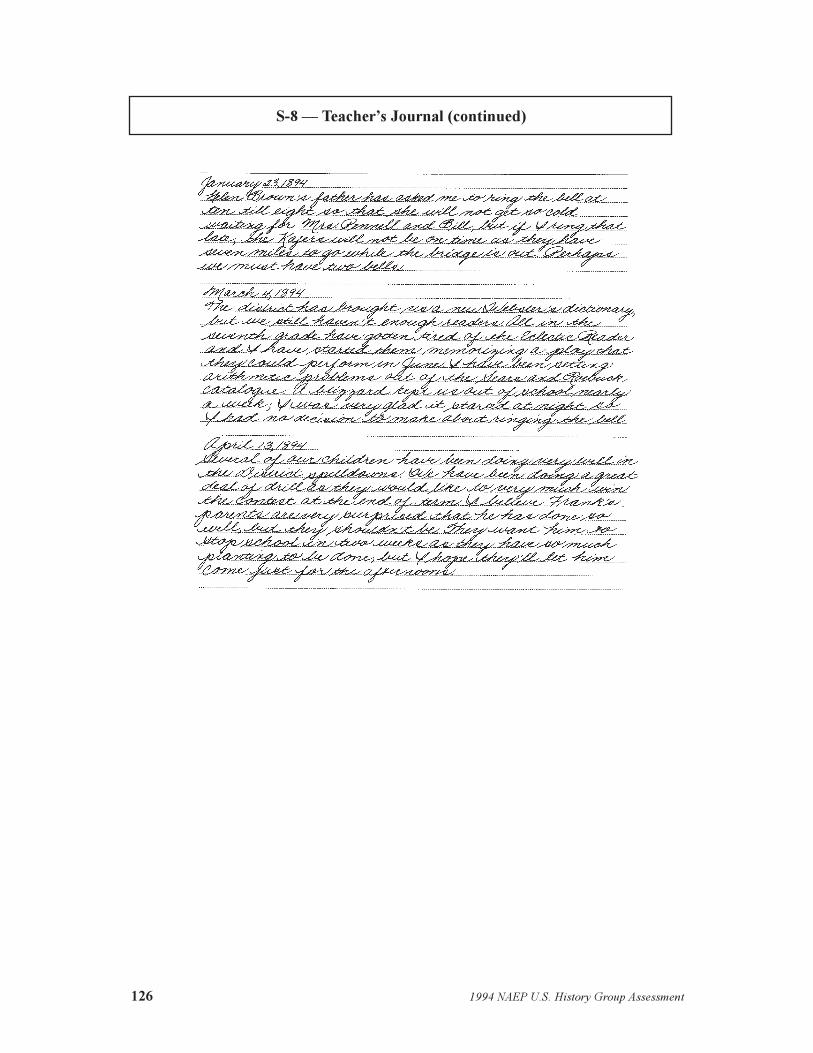
126 1994 NAEP U.S. History Group Assessment
S-8 � Teacher�s Journal (continued)

1994 NAEP U.S. History Group Assessment 127
S-9 � Key to Correct Pen Holding
S-10 � Helen Brown: Penmanship Practice

128 1994 NAEP U.S. History Group Assessment
S-11 � Report of Mary Anderson

1994 NAEP U.S. History Group Assessment 129
S-12 � Questions for the Seventh Grade
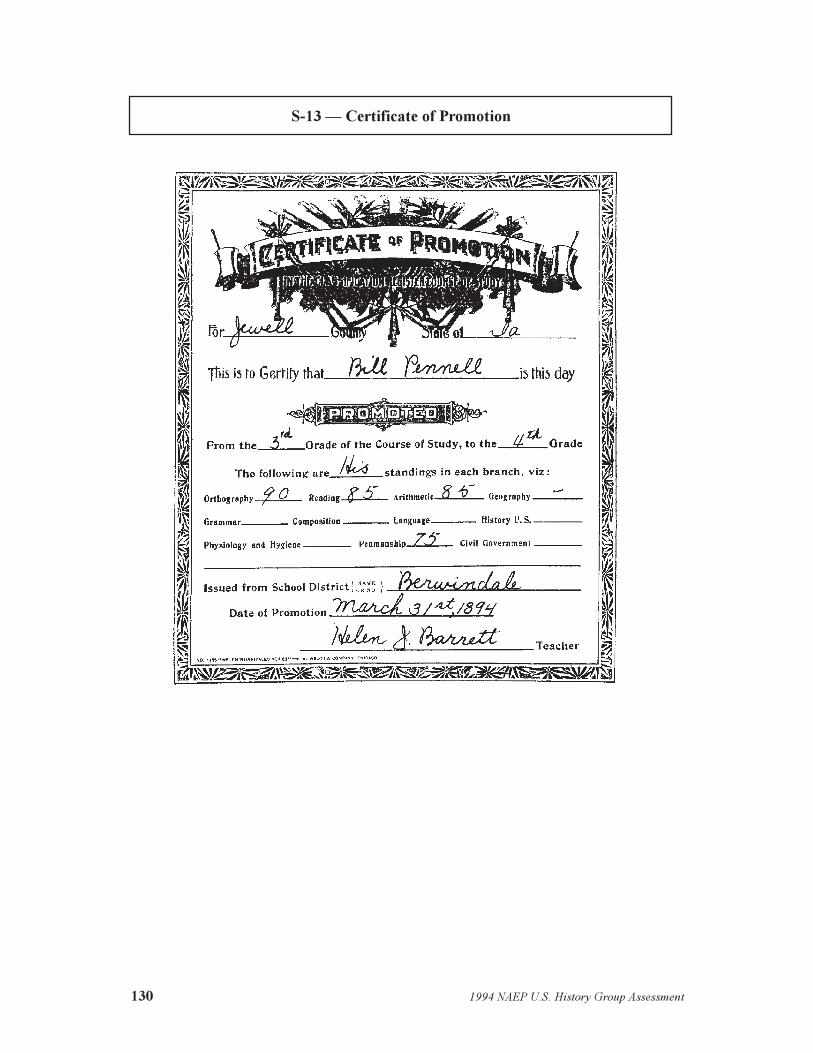
130 1994 NAEP U.S. History Group Assessment
S-13 � Certificate of Promotion

1994 NAEP U.S. History Group Assessment 131
S-14 � Monthly Attendance Records
S-15 � Duties of Pupils
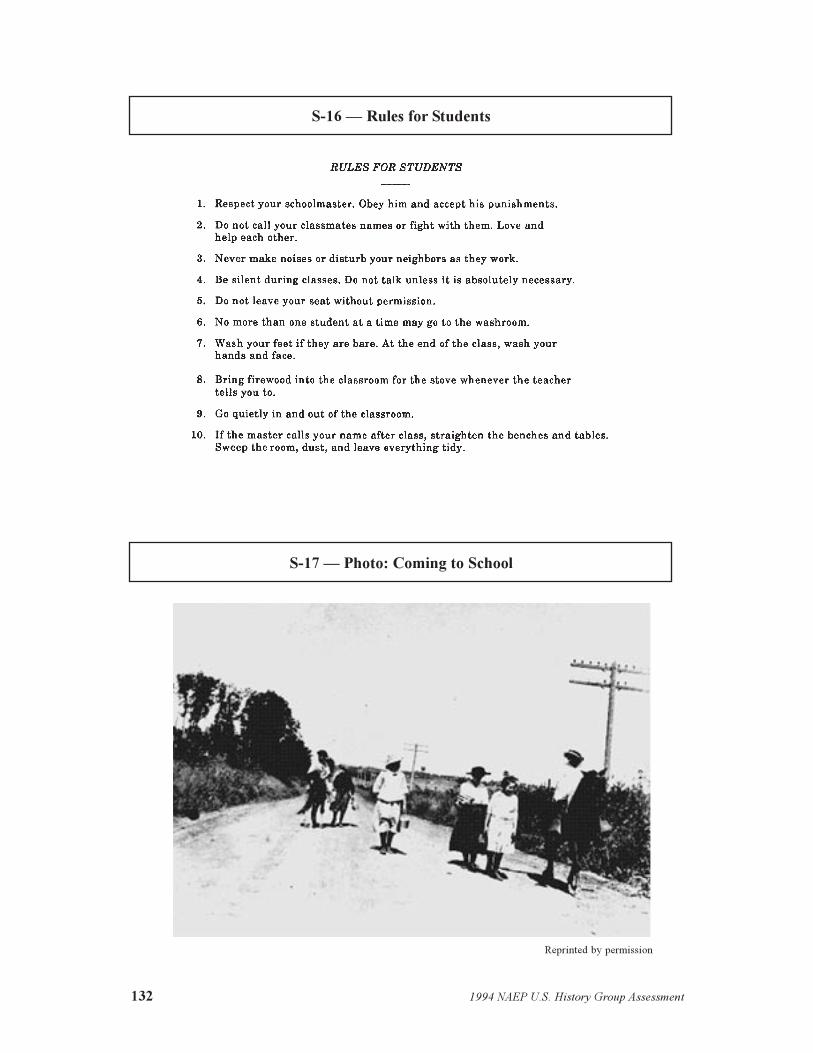
132 1994 NAEP U.S. History Group Assessment
S-16 � Rules for Students
S-17 � Photo: Coming to School
Reprinted by permission

1994 NAEP U.S. History Group Assessment 133
S-18 � Photo: Outdoor Games
Reprinted by permission
S-19 � Class Members Outside School
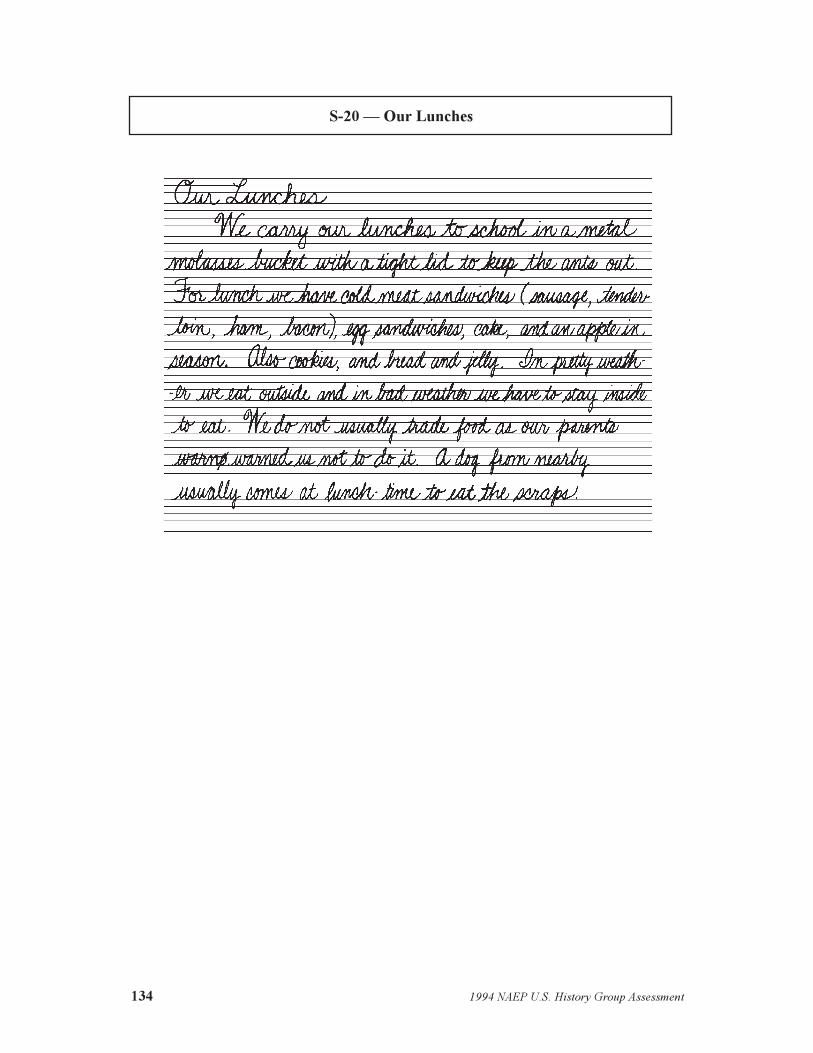
134 1994 NAEP U.S. History Group Assessment
S-20 � Our Lunches
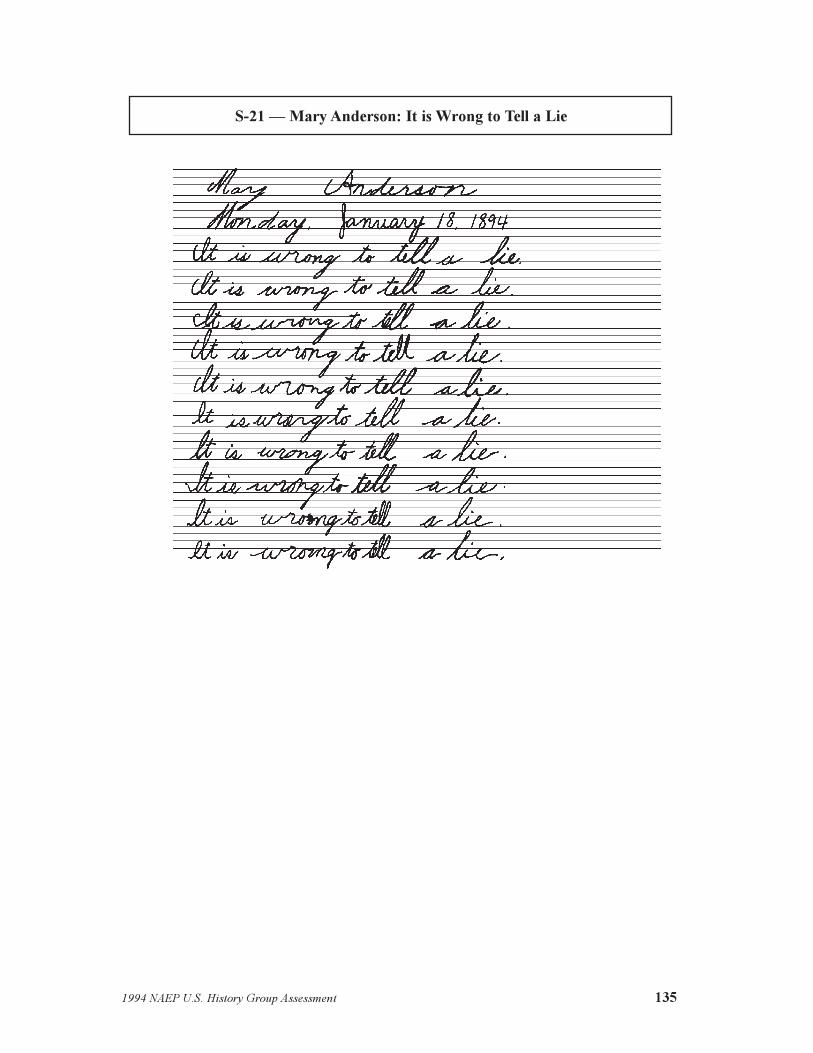
1994 NAEP U.S. History Group Assessment 135
S-21 � Mary Anderson: It is Wrong to Tell a Lie

136 1994 NAEP U.S. History Group Assessment
S-22 � Joe Thompson: I Will Try to Be Quiet

1994 NAEP U.S. History Group Assessment 137
1890�s School Tasks and Scoring Guides
The following are copies of the five tasks presented to students who participated in the 1890�s
school project component of the 1994 U.S. history group assessment. After each task is the
scoring guide developed to score the written responses to the tasks.

138 1994 NAEP U.S. History Group Assessment
1890�s School
Task 1
Using the materials in the box to help you, write a detailed description of what the
schoolhouse and classroom looked like.
School Number: __ __ __ __ __ __ __ S1:__ __ S1__

1994 NAEP U.S. History Group Assessment 139

140 1994 NAEP U.S. History Group Assessment

1994 NAEP U.S. History Group Assessment 141

142 1994 NAEP U.S. History Group Assessment

1994 NAEP U.S. History Group Assessment 143

144 1994 NAEP U.S. History Group Assessment

1994 NAEP U.S. History Group Assessment 145
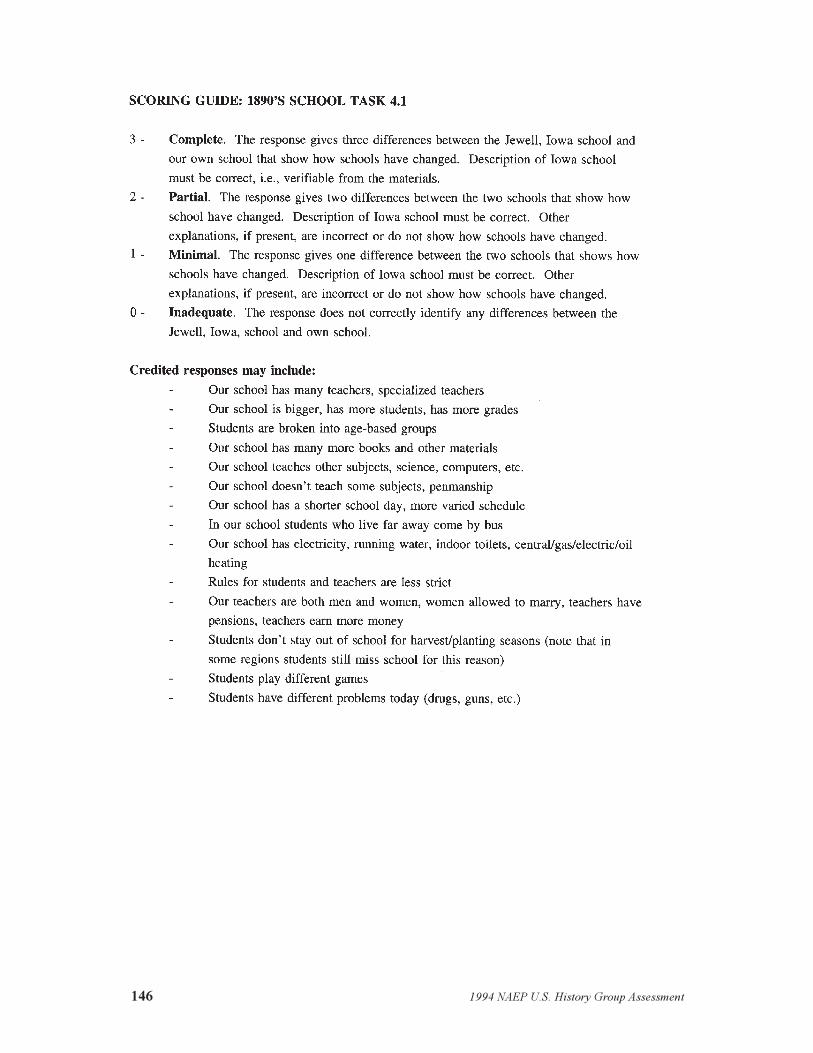
146 1994 NAEP U.S. History Group Assessment

1994 NAEP U.S. History Group Assessment 147

148 1994 NAEP U.S. History Group Assessment

1994 NAEP U.S. History Group Assessment 149


1994 NAEP U.S. History Group Assessment 151
Sample Responses
The following are sample group responses to the five tasks. The score each response received is
located in the upper right-hand corner.

152 1994 NAEP U.S. History Group Assessment
Score = 3

1994 NAEP U.S. History Group Assessment 153
Score = 2

154 1994 NAEP U.S. History Group Assessment
Score = 4

1994 NAEP U.S. History Group Assessment 155
Score = 3
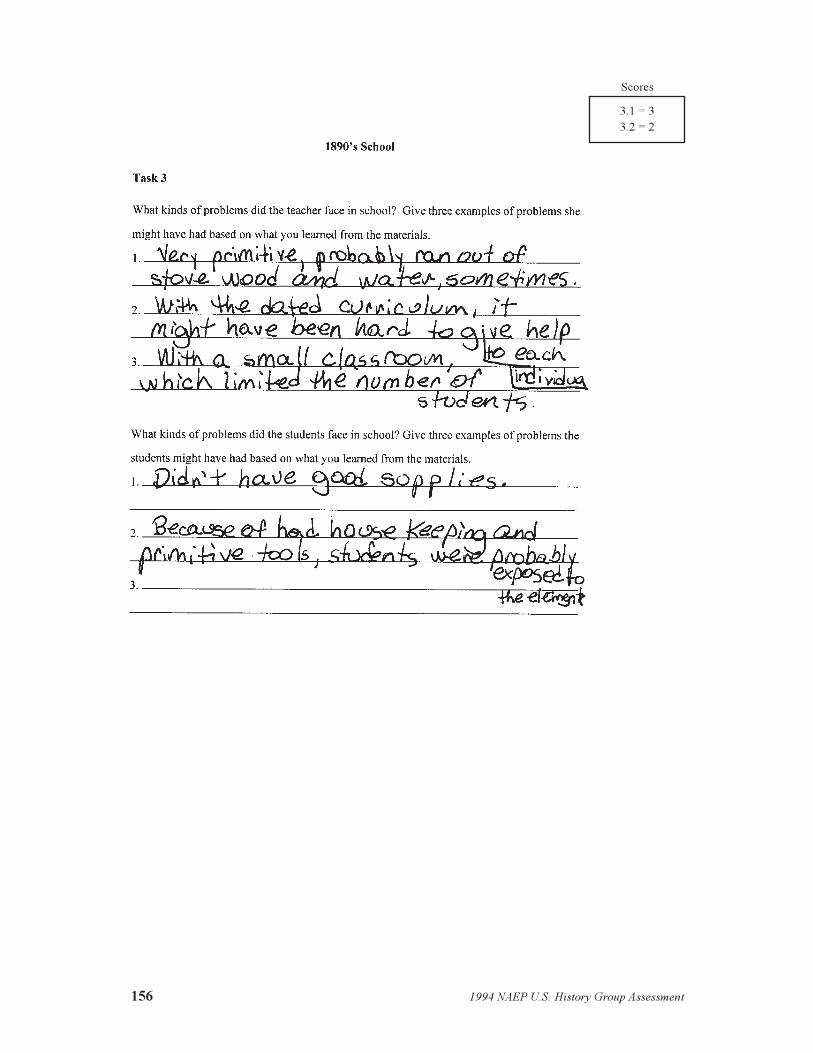
156 1994 NAEP U.S. History Group Assessment
Scores
3.1 = 33.2 = 2

1994 NAEP U.S. History Group Assessment 157
Scores
3.1 = 43.2 = 2

158 1994 NAEP U.S. History Group Assessment
Scores
4.1 = 44.2 = 4

1994 NAEP U.S. History Group Assessment 159
Scores
4.1 = 34.2 = 3

160 1994 NAEP U.S. History Group Assessment
Score = 5

1994 NAEP U.S. History Group Assessment 161
Score = 2

ACKNOWLEDGMENTS
The NAEP 1994 History assessment was a collaborative effort among staff from the NationalCenter for Education Statistics (NCES), the National Assessment Governing Board (NAGB),Educational Testing Service (ETS), Westat, and National Computer Systems (NCS). Theprograms benefited from the contributions of hundreds of individuals at the state and locallevels � governors, chief state school officers, state and district test directors, statecoordinators, and district administrators � who tirelessly provided their wisdom, experience,and hard work. Most importantly, NAEP is grateful to students and school staff who madethe assessment possible.
The assessment was funded through NCES, in the Office of Educational Researchand Improvement of the U.S. Department of Education. The Commissioner of EducationStatistics, Pascal D. Forgione, and current and former NCES staff members � particularlyJeanne Griffith, Gary Phillips, Steve Gorman, Susan Ahmed, Peggy Carr, Sharf Shakrani,Suzanne Tripplet, Arnold Goldstein, Lawrence Ogle, Janis Brown, Andrew Kolstad, MaureenTreacy, and Kelly Weddel � worked closely and collegially with ETS, Westat, and NCS staffand played a crucial role in all aspects of the program. The NAEP 1994 assessments andreports also benefited from the consistent support and guidance of Emerson Elliott, pastcommissioner of NCES. The members of the National Assessment Governing Board(NAGB) and the NAGB staff, in particular Mary Crovo, provided invaluable advice andguidance throughout. NAEP also owes a debt of gratitude to the numerous panelists andconsultants who provided their expertise and worked so conscientiously on developing theassessment. This particular report also benefited greatly from reviews by Mary Crovo,Steve Gorman, Andrew Kolstad, Arnold Goldstein, Frank Johnson, Marilyn MacMillen,Lawrence Ogle, John J. Patrick, Holly Spurlock, and Maris Vinovskis.
The NAEP project at ETS is housed in the Center for the Assessment of EducationalProgress (CAEP) under the direction of Paul Williams. The project at ETS is directed byStephen Lazer and John Mazzeo. Alexandra Beatty, Nancy Mead, Amy Pearlmutter (allformerly of ETS), Hilary Persky, and Madeline Goodman worked with the HistoryDevelopment committee to develop the assessment instruments. Sampling and datacollection activities were carried out by Westat under the direction of Rene Slobasky, NancyCaldwell, Keith Rust, and Dianne Walsh.
The principal statistical and psychometric activities for the 1994 History assessmentwere conducted by ETS. Overall direction was provided by Eugene Johnson, Jim Carlson,Nancy Allen, and John Barone. The main scaling analyses for this assessment wereconducted by Eiji Muraki, Dave Freund, Bruce Kaplan, and Steve Wang. Additional analysesrequired specifically for this report were carried out by Bruce Kaplan. Carol Errickson,Larry Bataille, Sharon Davis-Johnson, Kelly Keiser, and Barbette Tardugno oversaw theproduction aspects.

United StatesDepartment of Education
Washington, DC 20208–5653
Official BusinessPenalty for Private Use, $300
Postage and Fees PaidU.S. Department of Education
Permit No. G-17
Standard Mail (B)