1996 annual report - world banksiteresources.worldbank.org/intpensionadmin/559278... · 1996 annual...
TRANSCRIPT

The World Bank Group
Staff Retirement Plan 1996 Annual Report
Contents
Review of the Plan Performance Appendix 1 Committee memberships Appendix 2 Actuarial valuation Appendix 3 Financial statements
Note: In this report the terms World Bank and Bank refer to the IBRD, IFC, and MIGA.
Plan profile (millions of U.S. dollars) 1996 1995
Contributionsa 158.8 169.2 Bank 101.3 113.2 Staff 55.7 55.3 Otherb 1.8 0.6 Paymentsa 166.7 142.6 Pensions 110.0 95.3 Commutations 47.0 38.7 Lump sum withdrawals 7.8 7.6 Death benefits 1.8 0.9
a. Totals may not add due to rounding. b. Receipts (payments) from (to) other plans for transferred participants.
Review of the Plan This report covers the funding information and performance summary of the Staff Retirement Plan for 1996. Audited financial statements and actuarial valuation are appended.
Funding
The Staff Retirement Plan is a defined benefit plan. Benefits payable are determined by formulas in the Plan, not by the amount of contributions or the return on assets held in the Retirement Fund. The contribution for participants is fixed at 7 percent of pensionable salary. The contribution rate for the Bank is determined by the Pension Finance Committee (Committee), based on the recommendations of the actuaries, who conduct an annual valuation of the Plan's assets and liabilities. The Bank is obligated to fund the liabilities of the Plan not otherwise funded by participant contributions or the assets in the Retirement Fund. Thus, the Bank assumes the entire investment risk for the assets held in the Retirement Fund and for making whatever contributions are required to fund liabilities. The Pension Finance Committee periodically reviews the Plan's funding and strategic asset allocation methodology, and did so as part of its fiscal 1997 work program.
The Bank's contribution rate depends on a number of

assumptions, including staffing patterns, salary growth, and asset returns. These assumptions have generally been conservative. Thus, the Bank has contributed larger amounts than it might have under less conservative assumptions. A sustained period of strong market returns, much higher than assumed, has also led to a large build-up of assets in the Retirement Fund. As a result, the Plan has become well funded by any reasonable measure.
Based on the actuaries' valuation, the Pension Finance Committee unanimously determined that the Bank does not need to make a contribution in fiscal 1998. In arriving at their decision, the Committee explicitly considered the views of external actuaries that such action would be warranted when high market returns have led to a strongly funded Plan. The letter from Buck Consultants (Buck) providing these results is contained in Appendix II. Staff representatives on the Committee based their decision primarily on the fact that the current value of the Plan's assets is adequate to pay all benefits to current participants, and that a human resource strategy review would be undertaken by June 1997. Staff representatives also considered that there was a strong possibility that the Plan could be closed to new entrants as alternative retirement benefits are introduced. Since SRP contributions made by the Bank cannot be reclaimed, these PFC members considered it inappropriate to commit additional Bank funding to the SRP now that would not be needed to meet the SRP's obligations to current participants. The staff representatives indicated that, in the event that the Plan remains open, they would expect that future contributions to the SRP would take into account the need to fund benefits for new participants.
When Plan experience, particularly asset returns, differs from the assumptions, the Bank contribution changes accordingly. Since the Plan is a defined benefit plan, the Bank must bear the entire investment risk and the volatility arising from investment performance. For example, the Bank's contribution rate has ranged from a high of 19.04 percent for fiscal 1982 to a low of 7.14 percent for fiscal 1990, and has averaged 14.43 percent since fiscal 1981. Participants' contributions have remained at 7 percent. Thus, the Bank's ability to forgo a contribution is a result of favorable market performance over a sustained period. Of course, future returns could be unfavorable, in which case the Bank's contribution would have to increase.

Benchmark asset mix (percent) Asset class Benchmark Range
Equities 69 62-77 U.S. equities 30 15-47
Non-U.S. equities
39 15-54
Quasi-equities 13 5-20
Real estate 6 3-8
Venture capital 5 2-7
High-yield bonds
2 0-10
Fixed income 18 18
U.S. fixed income
7 0-18
Non-U.S. fixed income
11 0-18
Performance
Market performance
The global economic environment in 1996: solid economic expansion, low inflation rates, and declining interest rates. There was continued strength in virtually all equity markets, with the exception of Japan and some of Asia's emerging markets. European equity markets were strongest, followed closely by the U.S. equity markets.
The U.S. equity market continued 1995's momentum with major gains in 1996, driven by low inflation, respectable corporate profits, and record mutual fund inflows, with the Wilshire 5000 Index returning 21.2 percent. Market gains were highly concentrated, however, with six stocks (Intel, Microsoft, GE, Coca Cola, IBM, and Exxon) contributing 25 percent of the advance in the S&P 500.
Non-U.S. developed market equity performance differed widely, with the broad market index (EAFE) returning 6.4 percent, Europe advancing 21.6 percent, the Pacific Basin (ex-Japan) gaining 21.0 percent, and Japan declining by 15.4 percent. For the third consecutive year, emerging equity markets underperformed world equity markets. The MSCI Emerging Markets Global Index showed a modest increase of 6.0 percent. Latin America was the top performing region, gaining 22.2 percent, while Asia lagged with a return of only 2.9 percent.
Median results for all hedge funds were positive for 1996, though they fell short of the 23 percent return for the S&P 500. For the year, 65.9 percent of funds had positive returns and 24 percent outpaced the S&P.
Following 1995's stellar gains, 1996 was a difficult year for the U.S. fixed-income markets. Nonetheless, the year ended with good returns, and bonds recovered from their poor performance earlier in the year. The Salomon Broad Market Index returned 3.6 percent in 1996, the bulk of that (3 percent) being in the fourth quarter. Cash outperformed the broad fixed-income market for the year, with the 90-day T-Bill returning 5.3 percent.

Where the money is
$ millions Percent
Equitiesa 4,968.5 65.6 U.S. equities 2,058.2 27.2 Non-U.S. equities 2,910.3 38.4 Quasi-equitiesa 1,329.3 17.6 Hedge funds 85.1 1.1 Private equity 143.8 1.9 Real estate 534.4 7.1 High-yield bonds 408.2 5.4 Emerging markets fixed income 157.8 2.1 Fixed income and casha 1,280.5 16.9 U.S. fixed income 333.9 4.4 Non-U.S. fixed income 776.1 10.2 Global fixed income 163.8 2.2 Cash 6.7 0.1 Total 7,578.2 100.0
Note: Actual portfolio as of Dec. 31, 1996. a. Totals may not add due to rounding.
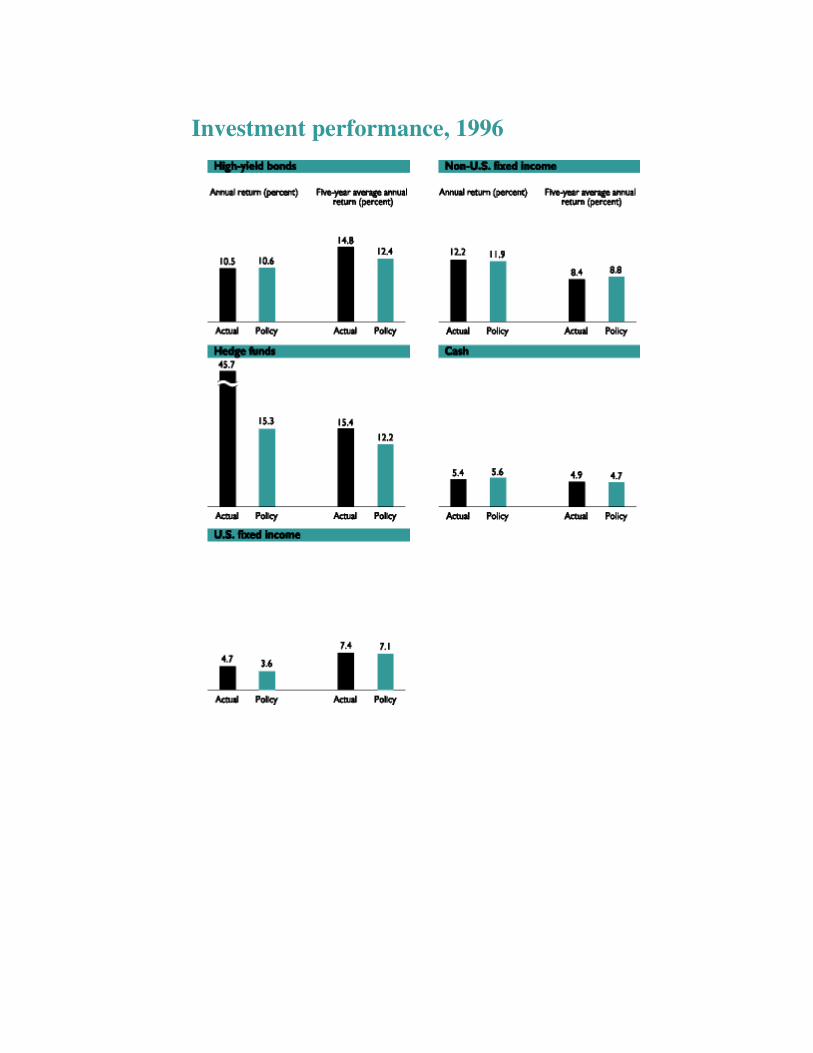
Interest rates declined in all international fixed-income markets except the U.K. International bond markets experienced a profitable year, with the index up 11.8 percent in dollar-hedged terms. The high-yielding European markets of Italy, Spain, and Sweden continued to lead the global markets, outperforming the core European markets and the dollar bloc. Monetary easing and optimism about EMU convergence sustained the market rally. Yield spreads between the high-yield European markets and Germany tightened considerably throughout the year; the Italian 10-year bond traded 171 basis points over the 10-year German bond at year-end, compared with a spread of 485 basis points at the start of the year.
The high-yield market continued to outperform the investment grade sectors, with the Salomon High Yield Index gaining 10.6 percent. The buoyant economy coupled with attractive interest rates fostered a favorable environment for the high-yield sector, which sustained relatively low defaults.
Emerging market debt performed strongly, with the J.P. Morgan Emerging Markets Bond Plus Index gaining 39.3 percent in 1996. Markets benefited from positive fundamentals and the Fed's decision to leave interest rates unchanged. Russia was the best performing market, returning 114.3 percent.
Private equity fundraising exceeded 1995 levels, with some partnerships closing heavily oversubscribed at the end of the year. Total market commitments to private equity amounted to $32.1 billion (145 fund closings), up 13.0 percent on commitments of $28.4 billion to 165 funds in 1995. This is the third consecutive annual record.
The recovery in the U.S. real estate market that began in 1994 continued through 1996. The market is approaching equilibrium as the supply of space is relatively fixed and demand continues to strengthen for most properties. This is generally reflected in increasing occupancy, rising rents, and stable property values. The exception is the regional mall sector.

Total Plan assets by region (market value in $ millions)
Note: United States includes all U.S.-based assets, as well as U.S. dollars held by non-U.S. equity and fixed income managers at year-end 1996. EAFE is Europe, Australia, and the Far East.
The Plan's performance
The benchmark portfolio (which defines the Plan's neutral asset mix and long-term investments based on expected returns, risk tolerance, and investment horizon) remained unchanged last year. The Plan is similar to a long-term investor, with a benchmark portfolio that emphasizes equities globally, diversified among many different markets and types of investments.
The fund totaled $7.6 billion as of December 31, 1996, up from $6.5 billion a year earlier. The Plan's total performance exceeded the benchmark by 40 basis points, 17.1 percent versus 16.7 percent, for the year. Excluding real estate and venture capital, the Plan outperformed the benchmark for the year by 130 basis points. The portfolio's 1996 return of 17.1 percent exceeded the TUCS median return of 14.7 percent and placed the Plan in the second decile of large U.S. plans. In the past five years, the Plan's average return has been equal to the benchmark return of 12.0 percent.
U.S. equity returns exceeded the benchmark returns by 80 basis points. Non-U.S. equities outperformed the benchmark by 240 basis points. Hedge funds, a tactical allocation away from U.S. equities, were the best performing assets in 1996, with gains of 45.7 percent.
In quasi-equities, returns on private equity were significantly below the benchmark. Real estate returns exceeded the benchmark by 470 basis points, while the returns of the high-yield sector were close to the benchmark.
The U.S. fixed-income stocks outperformed the benchmark by 110 basis points, while the non-U.S. fixed-income stocks exceeded the benchmark by about 30 basis points.

Performance measures
Asset class Benchmark
U.S. equity Wilshire 5000 Index
Non-U.S. equity
Morgan Stanley Capital International: EAFE (excluding Japan), 77%; Japan, 17.7%; Canada, 2.65%; and emerging markets, 2.65%
Real estate National Council of Real Estate Investment Fiduciaries Property Index
Venture capital
Brinson VCSS Partnership Indicator
High-yield bonds
Salomon Brothers High-Yield Cash Pay Index
Hedge funds Consumer Price Index + 6.5%, 50%; Wilshire 5000 Index, 45%; non-U.S. equity benchmark, 5%
U.S. fixed income
Salomon Brothers Broad Investment-Grade Index
Non-U.S. fixed income
Salomon Brothers Hedged Ex-U.S., Ex-Japan World Government Bond Index, 80%, and Hedged Japan Government Bond Index, 20%
Cash 3-month LIBOR
Currency exposure
50% hedged on actual non-U.S. equity exposure; 100% hedged on actual non-U.S. fixed income exposure
Note: EAFE is Europe, Australia, and the Far East.

Investment performance, 1996
Investment performance, 1996

Appendix 1 Committee memberships
Pension Finance Committee*
Mrs. Jessica P. Einhorn Managing Director, Finance and Resource Mobilization, Chair
Mr. Gary L. Perlin Vice President and Treasurer, Vice Chair
Mr. Khalid M. Al-Saad Executive Director
Mrs. Dorothy Hamachi Berry Vice President, Human Resources, ex-officio
Mr. Stephen Eccles Retiree, 1818 Society Member
Mr. Lawrence E. Hinkle Lead Specialist, Macroeconomics 3, Africa Technical Family, Staff Association Member
Mr. Luc Hubloue Executive Director
Mrs. Farida Khambata Director, Capital Markets Department, IFC
Mr. George L. Perry Senior Fellow, Brookings Institution, External Member
Mr. John Poulsen Senior Investment Officer, Investment Department, Staff Association Member
Mrs. Afsaneh Mashayekhi Beschloss Plan Administrator, Secretary
* As of December 31, 1996.

Pension Benefits Administration Committee*
Mrs. Dorothy Hamachi Berry Vice President, Human Resources, Chair
Mr. Richard S. Becker Operating Engineer, General Services Department, Staff Association Member
Mrs. Jessica P. Einhorn Managing Director, Finance and Resource Mobilization, ex-officio
Mr. Donald D. Fowler Retiree, 1818 Society Member
Ms. Ann Hammond Internal Communications Officer, External Affairs Department, Staff Association Member
Mrs. Eva Meigher Assistant General Counsel, Administration and Institutional Affairs, Legal Department
Mr. Franco Passacantando Executive Director
Mr. Jorge Terrazas Executive Director
Mrs. Afsaneh Mashayekhi Beschloss Plan Administrator, Secretary
• As of December 31, 1996.

Appendix 2 Actuarial valuation
June 16, 1997
Mr. Robert Katz Senior Actuary The World Bank Group 1818 H Street, NW Washington, DC 20433
Re: Actuarial Valuation of the Staff Retirement Plan as of January 1, 1997
Dear Mr. Katz:
We are writing to provide the final results of the actuarial valuation of the Staff Retirement Plan of the International Bank for Reconstruction and Development as of January 1, 1997, based on final asset information.
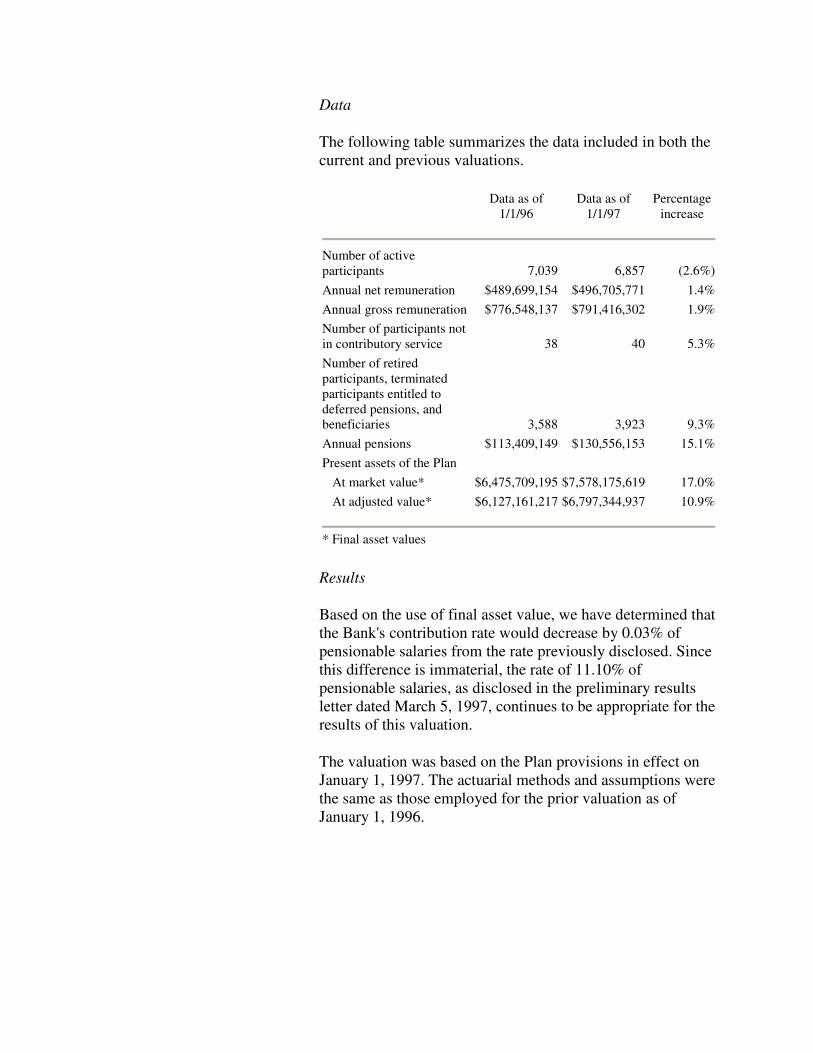
Data
The following table summarizes the data included in both the current and previous valuations.
Data as of 1/1/96
Data as of 1/1/97
Percentage increase
Number of active participants 7,039 6,857 (2.6%) Annual net remuneration $489,699,154 $496,705,771 1.4% Annual gross remuneration $776,548,137 $791,416,302 1.9% Number of participants not in contributory service 38 40 5.3% Number of retired participants, terminated participants entitled to deferred pensions, and beneficiaries 3,588 3,923 9.3% Annual pensions $113,409,149 $130,556,153 15.1% Present assets of the Plan At market value* $6,475,709,195 $7,578,175,619 17.0% At adjusted value* $6,127,161,217 $6,797,344,937 10.9%
* Final asset values
Results
Based on the use of final asset value, we have determined that the Bank's contribution rate would decrease by 0.03% of pensionable salaries from the rate previously disclosed. Since this difference is immaterial, the rate of 11.10% of pensionable salaries, as disclosed in the preliminary results letter dated March 5, 1997, continues to be appropriate for the results of this valuation.
The valuation was based on the Plan provisions in effect on January 1, 1997. The actuarial methods and assumptions were the same as those employed for the prior valuation as of January 1, 1996.
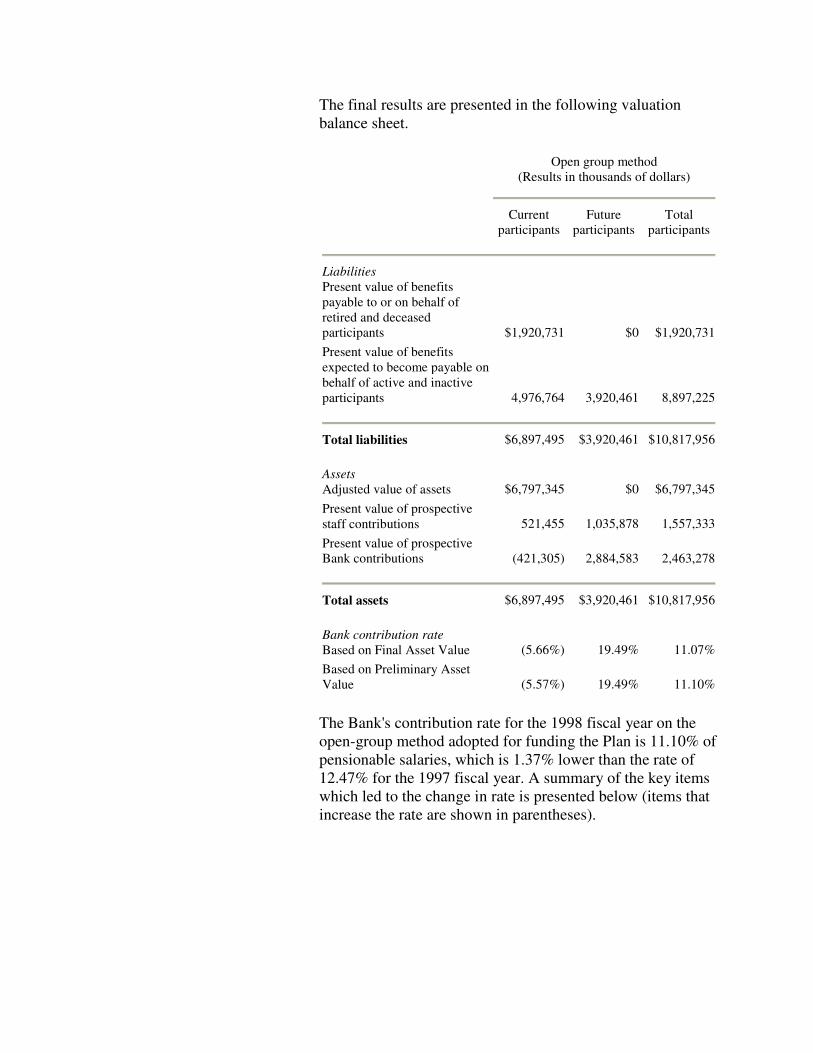
The final results are presented in the following valuation balance sheet.
Open group method (Results in thousands of dollars)
Current
participants Future
participants Total
participants
Liabilities Present value of benefits payable to or on behalf of retired and deceased participants $1,920,731 $0 $1,920,731 Present value of benefits expected to become payable on behalf of active and inactive participants 4,976,764 3,920,461 8,897,225
Total liabilities $6,897,495 $3,920,461 $10,817,956 Assets Adjusted value of assets
$6,797,345
$0
$6,797,345
Present value of prospective staff contributions 521,455 1,035,878 1,557,333 Present value of prospective Bank contributions (421,305) 2,884,583 2,463,278
Total assets $6,897,495 $3,920,461 $10,817,956 Bank contribution rate Based on Final Asset Value
(5.66%)
19.49%
11.07%
Based on Preliminary Asset Value (5.57%) 19.49% 11.10%
The Bank's contribution rate for the 1998 fiscal year on the open-group method adopted for funding the Plan is 11.10% of pensionable salaries, which is 1.37% lower than the rate of 12.47% for the 1997 fiscal year. A summary of the key items which led to the change in rate is presented below (items that increase the rate are shown in parentheses).

Key items of gain (loss)*
Current
participants Total
participants
Investment gain 1.70% 0.57% Salary increases 1.21% 0.40% Transferees and entrants during the year (0.47%) (0.16%) Cost-of-living adjustment for current pensioners 0.51% 0.17% Other sources 1.43% 0.39%
Total 4.38% 1.37%
* Based on final asset values
The item "Other sources," in the gain/loss analysis, represents all of the detailed gains/losses attributable to the decremental assumptions used in the model and other miscellaneous items, and will be disclosed in full in our formal report. With regard to the "Investment gain" item, we would note that this was calculated based on the three-year moving average asset value. Because of the averaging process, only portions of the investment gain that occurred during 1996 and 1995 are reflected in the adjusted value of assets and hence in the calculation of the Bank's contribution rate.
The Bank's contributions to the SRP are determined under an open-group aggregate valuation method. As explained in our 1990 report on the adoption of this method, the funded status must be monitored to ensure that the Plan does not become significantly over- or underfunded. Accordingly, we have followed a practice of including in our annual valuation reports an analysis of the funded status of the Plan as of each valuation date. The table on the following page contains a summary of the funded status on an Accumulated Benefit Obligation (ABO) and Projected Benefit Obligation (PBO) basis, for each of the prior five valuations and this year's valuation, based on a 3% real rate-of-return assumption. Also shown are the open-group funded ratios (i.e. the ratios of current assets to total projected open-group liabilities) for each of the valuations computed under the valuation assumptions. These funded ratios indicate a trend towards increasing well fundedness under the Plan.

Funded status, 1992-97
January 1, in year ABO
funded ratio* PBO
funded ratio* Open-group
funded ratio*
1992 1.55 1.02 0.54 1993 1.62 1.09 0.54 1994 1.82 1.17 0.62 1995 1.64 1.08 0.56 1996 1.85 1.20 0.62 1997 2.05 1.33 0.70
* The ABO and PBO funded ratios are derived as described in the actuarial valuation reports using a 3% real rate-of-return. The open-group funded ratio is based on the 4% funding assumption.
A further indication of the funded status of the Plan is provided by the level of the closed-group contribution rate. Under the actuarial valuation for the prior year, this rate for the first time became negative. The rate has declined further over the inter-valuation year and now stands at a negative 5.57% as compared with a negative 1.19% disclosed last year.
Last year, in view of the strong funded status of the Plan, we had advised the Bank that it could forego its contributions to the Plan over the short term without there being a material risk to the security of participants' benefits. This year, given that the funded position had grown stronger since the prior valuation, we had again advised the Bank that it could forego its contributions to the Plan. This matter was discussed at the Pension Finance Committee meeting of April 8, 1997 and it
was concluded that the Bank should forego its contributions for the fiscal year commencing July 1, 1997.
Please call us if you should have any questions regarding this matter.
Sincerely, Raymond E. Sharp, F.I.A., F.S.A. Principal and Consulting Actuary

Appendix 3 Financial statements
Report of independent accountants
June 13, 1997
To the Pension Finance Committee of the Staff Retirement Plan of the International Bank for Reconstruction and Development
In our opinion, the accompanying statements of net assets available for benefits and of accumulated plan benefits, and the related statements of changes in net assets available for benefits and of changes in accumulated plan benefits present fairly, in all material respects, the financial status of the Staff Retirement Plan of the International Bank for Reconstruction and Development at December 31, 1996 and 1995 (January 1, 1997 and 1996 for accumulated plan benefits), and the changes in its financial status for the years then ended, in conformity with generally accepted accounting principles in the United States and with International Accounting Standards. These financial statements are the responsibility of the Plan Administrator; our responsibility is to express an opinion on these financial statements based on our audits. We conducted our audits of these statements in accordance with generally accepted auditing standards, including International Standards on Auditing, which require that we plan and perform the audit to obtain reasonable assurance about whether the financial statements are free of material misstatement. An audit includes examining, on a test basis, evidence supporting the amounts and disclosures in the financial statements, assessing the accounting principles used and significant estimates made by the Plan Administrator, and evaluating the overall financial statement presentation. We believe that our audits provide a reasonable basis for the opinion expressed above.

Statements of net assets available for benefits (in thousands)
December 31,
1996 1995
Assets Investments, at fair value (Note B(2)) U.S. government securities $255,569 $284,257 U.S. corporate and convertible bonds 425,305 635,758 Non-U.S. government securities 780,835 724,015 Non-U.S. corporate and convertible bonds 97,387 49,163 Short-term investments 413,859 464,322 U.S. common and preferred stocks 2,188,618 1,506,612 Non-U.S. common and preferred stocks 2,803,804 2,297,234 Real estate 498,331 478,624 Venture capital and special situations 143,762 113,868
Total investments 7,607,470 6,553,853
Receivables Securities sold 860,316 126,255 Accrued interest and dividends 50,003 48,305 Other receivables 986 2,174
Total receivables 911,305 176,734
Cash 50,334 30,244
Total assets 8,569,109 6,760,831
Liabilities Accounts payable Securities bought (990,070) (284,559) Other payables (108) 0 Benefits due but unpaid (755) (563)
Total liabilities (990,933) (285,122)
Net assets available for benefits $7,578,176 $6,475,709 The accompanying notes are an integral part of these financial statements.

Statements of changes in net assets available for benefits (in thousands)
Year ended December 31,
1996 1995
Investment income Net appreciation in fair value of investments $809,008 $694,402 Interest and dividends 301,391 233,163
Total investment income 1,110,399 927,565
Contributions (Note C) Contributions by Bank/IFC/MIGA 101,337 113,217 Contributions by participants 55,651 55,341 Net receipts from pension plans of other international organizations on behalf of transferred participants 1,768 640
Total contributions 158,756 169,198
Total additions 1,269,155 1,096,763
Benefit payments Pensions (110,034) (95,299) Commutation payments (47,041) (38,736) Contributions, withdrawal benefits, and interest paid to former participants on withdrawal (7,810) (7,625) Lump sum death benefits (1,803) (899)
Total deductions (166,688) (142,559)
Net increase 1,102,467 954,204
Net assets available for benefits Beginning of year 6,475,709 5,521,505 End of year $7,578,176 $6,475,709
The accompanying notes are an integral part of these financial

statements.
Statements of accumulated plan benefits (in thousands)
January 1,
1997 1996
Actuarial present value of accumulated plan benefits (Note B(3)) Vested benefits Participants currently receiving payments $1,781,518 $1,533,776 Other participants 1,450,746 1,483,640
Subtotal 3,232,264 3,017,416 Nonvested benefits 27,050 31,597
Total actuarial present value of accumulated plan benefits $3,259,314 $3,049,013
Statements of changes in accumulated plan benefits (in thousands)
Year ended January 1,
1997 1996
Actuarial present value of accumulated plan benefits at beginning of year $3,049,013 $2,800,527 Increase during the year attributed to: Changes in actuarial assumptions 0 6,826 Interest accrued 274,411 252,047 Benefits accrued and actuarial gains and losses 102,578 132,172 Benefits paid (166,688) (142,559)
Net increase 210,301 248,486
Actuarial present value of accumulated plan benefits at end of year $3,259,314 $3,049,013
The accompanying notes are an integral part of these financial statements.
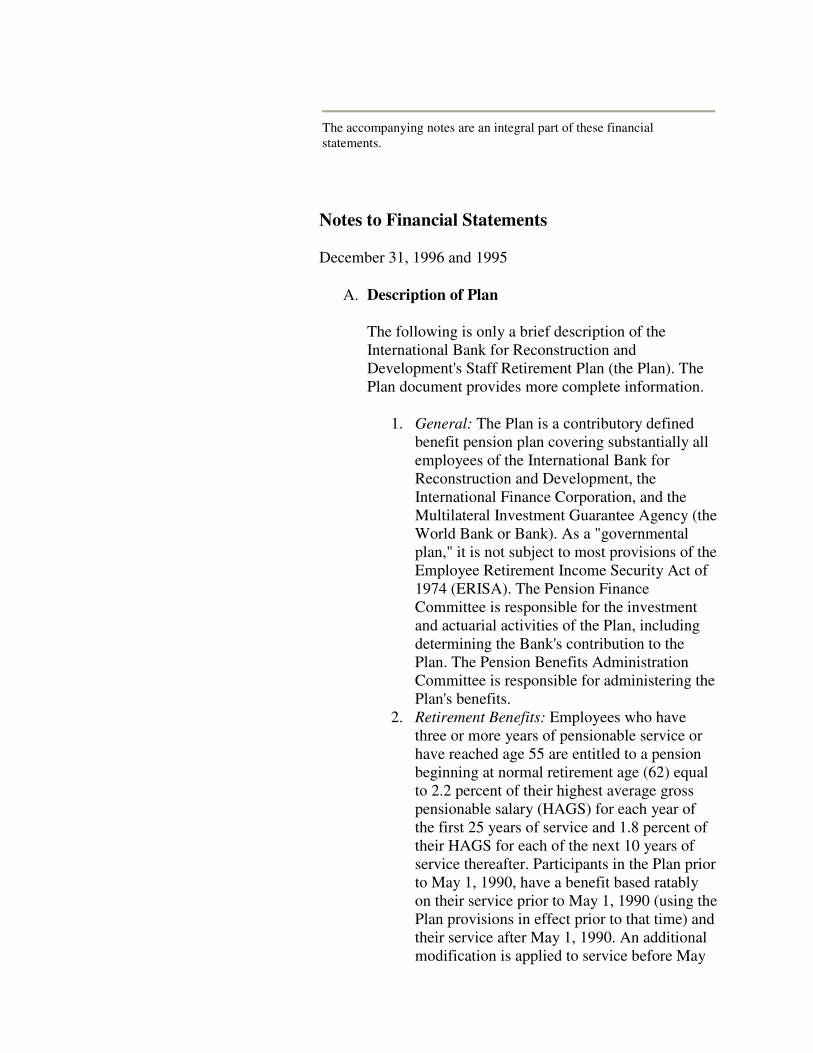
Notes to Financial Statements
December 31, 1996 and 1995
A. Description of Plan
The following is only a brief description of the International Bank for Reconstruction and Development's Staff Retirement Plan (the Plan). The Plan document provides more complete information.
1. General: The Plan is a contributory defined benefit pension plan covering substantially all employees of the International Bank for Reconstruction and Development, the International Finance Corporation, and the Multilateral Investment Guarantee Agency (the World Bank or Bank). As a "governmental plan," it is not subject to most provisions of the Employee Retirement Income Security Act of 1974 (ERISA). The Pension Finance Committee is responsible for the investment and actuarial activities of the Plan, including determining the Bank's contribution to the Plan. The Pension Benefits Administration Committee is responsible for administering the Plan's benefits.
2. Retirement Benefits: Employees who have three or more years of pensionable service or have reached age 55 are entitled to a pension beginning at normal retirement age (62) equal to 2.2 percent of their highest average gross pensionable salary (HAGS) for each year of the first 25 years of service and 1.8 percent of their HAGS for each of the next 10 years of service thereafter. Participants in the Plan prior to May 1, 1990, have a benefit based ratably on their service prior to May 1, 1990 (using the Plan provisions in effect prior to that time) and their service after May 1, 1990. An additional modification is applied to service before May

1, 1974. The Plan permits retired employees who have reached age 55 (and with sufficient service, age 50) to receive a reduced early retirement pension commencing before age 62. Employees who terminate before becoming entitled to a pension (that is, before age 55 and with less than three years of service) receive a lump sum distribution based on their HAGS and service. Employees who terminate after becoming entitled to a pension may elect, subject to certain conditions, the lump sum distribution instead of their pension rights.
3. Disability Benefits: Employees who become totally and permanently disabled are retired on a disability pension normally equal to the pension they would have received based on actual service and HAGS, but with no reduction for start of payments before normal retirement age 62; provided such pension is at least equal to the lesser of 50 percent of HAGS or the normal pension that the employees would have received had they continued to be employed to normal retirement age with no change in HAGS.
4. Death Benefits: If a married employee dies in active service, the spouse normally receives a pension based on the pension the employee would have received in the event of disability retirement. If the disability pension would have been more than 60 percent of HAGS, the spouse's pension would be equal to 50 percent of that pension; if the disability pension would have been between 30 percent and 60 percent of HAGS, the spouse's pension would be equal to 30 percent of HAGS; and if the disability pension would have been less than 30 percent of HAGS, the spouse's pension would be equal to the disability pension. If death occurs after the employee has retired and has become entitled to receive a pension, the spouse would normally receive 50 percent of such pension. Upon the death of a single employee, active or retired, a lump sum benefit is paid to the employee's designated beneficiary. The benefit is determined as follows:
Death in active service: normally 200 percent

(100 percent if less than two years service) of the employee's final annual gross salary.
Death after retirement and becoming entitled to receive a pension: in general, excess of accumulated contributions over any benefit payments, plus a percentage of annual pension, maximum 200 percent on death at or before age 65, minimum 50 percent on death at or after age 73.
Death after retirement but before becoming entitled to receive a pension: in general, a lump sum withdrawal benefit determined as of the date of death.
5. Children's Benefits: Eligible children of a deceased employee or a deceased retired employee who was receiving or entitled to receive a pension at the time of death receive annual benefits normally at the rate of $3,982 per child, maximum $11,946 for all eligible children. Similar benefits are payable to the eligible children of a retired employee who is receiving a disability pension. Eligible children are unmarried children under age 19 (22 for full time students) or unmarried disabled children whose disability started before age 22.
6. Cost-of-Living Increases in Pensions: The Plan contains provisions for cost-of-living increases in pensions and children's benefits as of May 1 of each year.
7. Options: The Plan permits the election of the following options:
a. converting up to 1/3 of pension into an actuarially equivalent lump sum payment;
b. reducing the pension in order to provide a survivor annuity to a designated person;
c. receiving the pension in the currency of the country of principal residence instead of in U.S. dollars, or partly in the currency of the country of principal residence and the remainder in U.S. dollars;
d. reducing the pension after payments
commence to provide a survivor annuity to a spouse married or children born after retirement.
8. Administrative Expenses: The Plan's assets are held by the Bank in a separate fund (the Retirement Fund) used solely to provide the benefits and pay the expenses of the Plan. For the years ended December 31, 1996 and 1995, administrative expenses were paid by the Bank.
B. Summary of accounting policies
The preparation of financial statements in conformity with generally accepted accounting principles requires management to make estimates and assumptions that affect the reported amounts of assets and liabilities and disclosure of contingent assets and liabilities at the date of the financial statements and the reported amounts of revenues and expenses during the reported period. Such estimates include, but are not limited to, accumulated benefit obligations and fair value of investments. Actual results could differ from those estimates.
The following are the significant accounting policies followed by the Plan:
1. Basis of Accounting: The financial statements of the Plan have been prepared using the accrual basis of accounting.
2. Valuation of Investments: If available, quoted market prices are used to value investments. The values for securities that have no quoted market price are stated at their estimated fair values, determined as follows:
a. Real estate investments, representing shares in commingled real estate investment funds, are valued on the basis of the fair market value (as established by independent appraisers, Board of Directors, or Trustees) of the investments held by such funds.
b. Some investments representing shares in private equity or real estate partnerships are valued on the basis of the quoted market prices of the net assets of the partnerships if such prices

are available. If the assets in the partnerships have no quoted market value, they are valued at either the latest price at which stock has been issued for the asset, or, if the general partners of the private equity partnership believe it is appropriate, a discount from this latest price.
3. Actuarial Present Value of Accumulated Plan Benefits: Accumulated plan benefits are those future periodic payments, including lump sum distributions, that are attributable under the Plan's provisions to the service employees have rendered. Accumulated plan benefits include benefits to be paid to: (a) retired or terminated employees or their beneficiaries; (b) beneficiaries of employees who have died; and (c) present employees or their beneficiaries. Benefits under the Plan are based on employees' highest average salary during any consecutive three years of credited service. The accumulated plan benefits for active employees are based on their highest average salary on the date as of which the benefit information is presented (the valuation date).
Benefits payable under all circumstances-retirement, death, disability and termination of employment-are included, to the extent they are deemed attributable to employee service rendered to the valuation date.
The actuarial present value of accumulated plan benefits (which does not take into account future salary increases) is determined by the actuarial firm of Buck Consultants, Inc. (the Plan's Actuary) and is that amount that results from applying actuarial assumptions to adjust the accumulated plan benefits to reflect the time value of money (through discounts for interest) and the probability of payment (by means of decrements such as for death, disability, withdrawal, or retirement) between the valuation date and the expected date of payment. The significant actuarial assumptions used in the valuations as of January 1, 1997 and 1996 were: (a) life expectancy of

participants (1993 United Nations Joint Staff Pension Fund mortality table); (b) retirement age assumptions (assumed probabilities of retirement at each age from 55 to 65 were used); (c) cost-of-living increases in pensions; and (d) investment return. Both the January 1, 1997 and 1996 valuations used an assumed annual rate of 5 percent for cost-of-living increases in pensions and 9 percent for investment return, which also serves as the discount rate for liabilities.
The foregoing actuarial assumptions are based on the presumption that the Plan will continue. Were the Plan to be terminated, different actuarial assumptions and other factors might be applicable in determining the actuarial present value of accumulated plan benefits.
C. Funding policy
As a condition of participation, employees are required to contribute 7 percent of their pensionable gross equivalent salaries to the Plan. Present employees' accumulated contributions at December 31, 1996 were $615,581,000, including interest credited (currently at an interest rate of 5 percent compounded annually). The Bank's funding policy is to make contributions to the Plan at an annual rate, expressed as a percentage of employees' gross salaries (12.47 percent for the fiscal year ending June 30, 1997) which, when combined with employees' contributions, is estimated to be sufficient to fully provide for all employees' benefits by the time they retire.
Effective for the January 1, 1991 actuarial valuation, the actuarial methodology used to calculate the Plan's liabilities and resultant Bank contribution rate has been changed to the "Open Group" method. This method takes into account the liabilities of both current participants and projected future participants. A three-year asset averaging method was used for the January 1, 1997 valuation. Under this valuation method, the Bank's contribution rate, effective July 1, 1997, would be 11.10 percent. However, based on the well-funded status of the Plan, the Pension Finance

Committee determined that no Bank contribution need be made for the period July 1, 1997 through June 30, 1998.
Although it has not expressed any intention to do so, the Bank has the right under the Plan to discontinue at any time part or all of its contributions toward the cost of benefits based on future service, in which event all such benefits will be reduced to such amounts as can actuarially be provided by future contributions, if any. The Bank also has the right to terminate the Plan at any time.
D. Plan termination
In the event that the Plan is terminated, the net assets of the Plan will be used for the purpose of paying or providing for all accumulated Plan benefits as of the date of Plan termination and the Bank will be liable for any additional funds that may be required for this purpose. Any Plan assets remaining after paying or providing for all such benefits will be returned to the Bank.
E. Net appreciation (depreciation) in fair value of investments
During 1996 and 1995, the Plan's investments (including gains and losses on investments bought and sold during the year) appreciated in value by $809,008,000 and $694,402,000, respectively, as follows:
Year ended
December 31,
(in thousands) 1996 1995
Net (depreciation) appreciation in fair value of investments as determined by quoted market price U.S. government securities $ (4,680) $ 29,753 Non-U.S. government securities 29,014 81,058 U.S. corporate and convertible bond 2,479 78,067 Non-U.S. corporate and convertible bonds 6,730 6,211 Short-term investments 21,617 (28,742)

U.S. common and preferred stocks 341,874 369,618 Non-U.S. common and preferred stocks 367,353 149,995
Total 764,387 685,960 Net appreciation in fair value of investments at estimated fair value Real estate 27,961 3,795 Private equity 16,660 4,647
Total 44,621 8,442 Net appreciation $809,008 $694,402
F. Investment commitments
In the normal course of investing in real estate and private equity, several agreements have been entered into which have resulted in undisbursed investment commitments at December 31, 1996 of $164,600,000.
G. Financial instruments
As part of its overall portfolio management strategy, the Plan invests in equities, including U.S. equity and non-U.S. equity; private equity; real estate; and fixed income investments, including U.S. fixed income and non-U.S. fixed income. As part of the Plan's risk management process, the Plan's assets are invested in financial futures, forward contracts and equity swaps.
Forward and futures contracts are commitments to either purchase or sell a financial instrument at a future date for a specified price and may be settled in cash or through delivery of the underlying financial instrument. Forward rate agreements settle in cash at a specified future date based on the differential between agreed interest rates applied to a notional amount. Most of the contracts have terms of less than one year. Futures contracts are traded on exchanges that require daily cash settlement of the net change in the value of open contracts. On the other hand, forwards are transacted over the counter with counterparties and generally do not require daily cash settlement of the net change in value. As such, the credit risk on futures

is lower than that of forwards. Equity swaps are commitments to exchange the returns arising from one equity portfolio with the returns of another for a specified time period based on a notional amount invested. The credit risk of the equity swap contract depends on the specific agreement and the counterparty involved.
Use of futures contracts. Futures contracts are used for hedging and to take investment positions. They are used primarily for purposes of transactional efficiency and not for leveraging the portfolio. The latter is ensured by requiring managers to hold cash investments equal to the face value of the futures contracts. The face value of open futures contracts is limited to 20 percent of the market value of the Plan's net assets. Contracts with an offsetting position in a same or similar contract are not counted in this limit. Futures transactions are accounted for on a mark-to-market basis (that is, changes in the value of such contracts are recognized immediately in asset values). Because the futures positions are fully collateralized, there would be no accounting loss in the event of counterparty default. The market value of such contracts held was $30,600,000 and $31,564,000 at December 31, 1996 and 1995, respectively. These amounts are included in non-U.S. common and preferred stocks.
Use of forward contracts. Forward contracts are used to hedge the currency exposure of non-U.S. dollar assets. The face value of open forward contracts is limited to the market value of the Plan's non-U.S. equity and non-U.S. fixed income investments. The original contract value of open forward contract purchases and sales totaled $2,033,479,000 and $2,039,248,000 at December 31, 1996 and 1995, respectively. Since forward contracts are accounted for on a mark-to-market basis at month-end, changes in the value of such contracts are recognized in asset values. As these contracts are not collateralized, the mark-to-market value of these contracts represent the maximum accounting loss that the Plan would be exposed to in the event of counterparty default. The value of the unrealized losses of such contracts held was ($512,000) and ($2,769,000) at December 31, 1996 and 1995, respectively. These amounts are

included in non-U.S. fixed income investments and non-U.S. common and preferred stocks.
Use of equity swaps. An equity swap is used in implementing a market-neutral strategy for the Plan in the U.K. market. The strategy involves holding long positions in securities with positive characteristics while shorting stocks of equivalent starting value with unattractive characteristics, and posting collateral, in the form of an interest-bearing U.K. Treasury gilt, equal to about 15% of the value of the short positions. The net gains or losses on this swap were marked to market and settled each quarter, with the Plan having the right to mark the position to market and settle it at any time. The potential accounting loss, in the event that a counterparty were financially unable to satisfy its obligations under the equity swap, was limited to any unrealized gains during a given quarter, plus the value of the posted collateral. The book value of such positions was $19,652,000 at inception. The equity swap positions outstanding at the end of December 31, 1995, were closed out in 1996. Thus, at December 31, 1996, and December 31, 1995, the market values of the underlying long positions were $0 and $20,043,000, respectively. The market values of the underlying short positions were $0 and $20,590,000 at December 31, 1996, and December 31, 1995, respectively. The mark-to-market value of the contract was $0 and $2,354,000 (including the value of the posted collateral) at December 31, 1996, and December 31, 1995, respectively. This amount was included in non-U.S. common and preferred stocks.