1997- asm handbook- conceptual and configuration design · pdf filekevin n. otto kristin l....
TRANSCRIPT
Chapter 1-C: Conceptual and Configuration Design of Products and Assemblies
Kevin N. Otto Kristin L. Wood
Engineering Design Research Laboratory
Department of Mechanical Engineering
Massachusetts Institute of Technology The University of Texas 77 Massachusetts Avenue, Room 3-449 ETC 5.160
Cambridge, Massachusetts 02139 [email protected]
Austin, TX 78712-1063 [email protected]
ASM International Handbook Volume 20, Materials Selection and Design

ASM International ASME Handbook, Otto and Wood Volume 20, Materials Selection and Design
1
“I want to know God’s thoughts...the rest are details.” — Einstein
Section I. Product Development — A Perspective of Exponential Competition
Competitive design of new products is the key battleground that companies must master to
remain in business. It is a set of activities that involves more than engineering, it is fraught with
risks and opportunities, and it requires effective judgment over technology, the market, and time.
A study of recent business decisions gives insight to these claims:
To avoid losing market share, all U.S. commercial airplane manufacturers have offered contracts to deliver aircraft at prices that are below current cost (Wall Street Journal, 1995). The companies are betting they can remain profitable through improvement of their products and processes.
In the early 1980’s, Sony offered an improved magnetic videotape recording technology, the Betamax system. While technologically offering better magnetic media performance, it did not satisfy the customers, who rather were more concerned with low cost, large selection of entertainment, and standardization.
In 1996, both Ford and Toyota launched new family sedans. Three years earlier, each had torn down each other’s car. Ford decided to increase the options in its Taurus, matching Toyota’s earlier Camry, while Toyota decided to decrease the options in its Camry, matching Ford’s earlier Taurus.
To avoid such pitfalls, there is clearly a need to apply statistically sound measurement methods
of a product’s intended customer population. It is equally important to functionally architect
what is required to meet the customer demands, applying rigorous methods for incorporating the
best technologies.
To address this need, we present here an integrated set of structured methods, as outlined in
Fig. 1, developed in conjunction with a host of industrial partners. We start with the customer
population for the product, and develop a representation of the feature demands of this group.
Based on this representation, a functional architecture is established for the new product,
defining what it must do and how it must functionally interconnect. We then explore
competitive products in the marketplace, and present methods for tearing down these products
with the intent of establishing function -- how these products perform as they do. Competitive
benchmarking of this type, in conjunction with customer needs and the functional architecture, is
then used to create a customer-driven specification for the product, known as quality function
ASM International ASME Handbook, Otto and Wood Volume 20, Materials Selection and Design
2
deployment. From this specification, different technologies and components can be
systematically explored and selected through functional models. With a preliminary concept
selected, the functional model can be refined into a physically based parametric model that can
be optimized to establish geometric and physical targets. This model may then be detailed, and
instantiated as the first alpha prototype of a new product.
As shown in Fig. 1, our approach focuses on conceptual and configuration design of
products and assemblies. The process begins with a design task and generates a functional
model that culminates in a product specification. Later chapters build upon the functional model
and specification to execute the product development process to fruition.
Section II. Task Clarification: What Avenues Exist for Market/Technical Improvements? What Development Path Should Be Pursued?
Conceptual and configuration design of products, as depicted by the global process in Fig. 1,
begins and ends with the customer, emphasizing quality processes and artifacts throughout.
Intertwined with a customer and quality focus are a number of technical and business concerns.
We thus initiate the conceptual design process with task clarification: understanding the design
task and mission, questioning the design efforts and organization, and investigating the business
and technological market. Task clarification sets the foundation for solving a design task, where
the foundation is continually revisited to find weak points and to seek structural integrity of a
design team approach. In this sense, it is a pervasive activity that does not occur simply at the
beginning of the process, but is employed throughout.
Mission Statement and Technical Questioning
A mission statement and technical clarification of the task are important first steps in the
conceptual design process. They are intended to:
focus design efforts define goals (goals must be stated before they can be met) provide schedule for tasks (define time-lines for task completion) provide guidelines for the design process and to prevent conflicts within the design
team and concurrent engineering organization
ASM International ASME Handbook, Otto and Wood Volume 20, Materials Selection and Design
3
The first step in task clarification is usually to gather additional information. In so doing, the
following questions need to be asked and answered, not once but continually through the life
cycle of the design process:
What is the problem really about? What implicit expectations and desires are involved? Are the stated customer needs, functional requirements, and constraints truly
appropriate? What avenues are open for creative design? What avenues are limited or not open for creative design? Limitations on scope? What characteristics / properties must the product have? What characteristics / properties must the product not have? What aspects of the design task can and should be quantified (now!!)? Do any biases exist with the chosen task statement or terminology? Has the design
task been posed at the appropriate level of abstraction? What are the technical and technological conflicts inherent in the design task?
(Altshuller, 1984)
It is surprising how often failing to take time at the front end of a project to really
“understand” what the problem is causes a great deal of time (and money) to be wasted later in
the design process. To obtain this understanding, the design of any product or service must
begin with a complete understanding of the customers’ needs, as discussed in Section III. It does
no good to create a product that can not, or will not be used. It is equally important to ask and
answer, on a continual basis, the technical questions given above. By so doing, vitality of the
design will always be questioned and, hopefully, maintained.
The tangible result of this questioning procedure is a clear statement of the design team’s
mission. Fig. 2 shows an example template for a mission statement (Ulrich and Eppinger, 1995).
This template should not be used as a mere statement of “parenthood;” instead it should be used
as a “passport,” “calling card,” and “banner,” stating the design team’s intentions. When
interviewing customers, meeting with potential suppliers, or carrying out design reviews, the
calling card should be the lead item of discussion, clarifying and equalizing the playing field of
negotiation, debate, and probing questioning.
Business Case Analysis: Understanding the Financial Market
Technical questioning is only one-side of the proverbial design coin. Understanding the business
market represents the other side, especially to complete the mission statement of Fig. 2. During
ASM International ASME Handbook, Otto and Wood Volume 20, Materials Selection and Design
4
any conceptual and configuration design effort, a product’s market must be clarified through the
development of a business case analysis. A number of financial assessment techniques exist at
varying levels of detail. Two notable and generic techniques are the “Economics of Product
Development Projects” in (Ulrich and Eppinger, 1995) and the Harvard business case method
(Ronstadt, 1988; McNair, 1954; Ratliff, et al., 1993). By example, this section presents the
Harvard business case method to understand the potential impact of a product development
through fabrication. A summary of the Harvard business case methodology is shown in Table 1.
Application of the methodology is briefly described below, with context provided by a simple
mechanical product: a finger nail clipper.
Finger nail clipper devices are widely used consumer products, with markets of the everyday
consumer (primary), professional salons, and domestic pet manicurists. For the purposes of this
section, let’s assume that our corporation seeks to improve its current product offering in the
primary finger nail clipper market, a complimentary product to our finger nail polish product
line. The mission, following Fig. 2, is to design a finger nail clipper for comfortable use by
either the left or right hand. It is assumed that comfort, cost, reliability (consistently remove
nails with a simple finger force throughout the product’s life), and stowage compactness are the
driving market needs (to be confirmed or revised through customer interviews). The corporation
also seeks only a 30% gross margin, since the goal is to compliment and increase the market
share of finger nail polish.
A number of solutions exist for addressing both the technical and process issues associated
with a finger nail clipper product development. A business (financial) case may be derived for
each of the possible solutions. However, the intent during the early stages of conceptual and
configuration design is not to study all possible alternatives in detail, but to determine if a
minimal benefit to the business will be realized by improving the clipper problem, i.e., comfort,
cost, reliability, and compactness. As such, we concentrate here on steps five and six of the
Harvard business case method (Table 1), where only one generic alternative is considered. A
device solution, i.e., a new, generic, and hypothetical clipper design, is the alternative
considered, emphasizing the possibilities of reduced cost and higher reliability through
compactness and fewer components.

ASM International ASME Handbook, Otto and Wood Volume 20, Materials Selection and Design
5
These possible benefits call for a “break-even” financial analysis for the clipper problem.
This analysis answers the question: “is a hypothetical clipper concept with less materials
(compactness) and fewer components feasible as a business venture?”, and begins with a
summary of the current costs for finger nail clipper development (as projected for from the
current product). Because these costs continually change with new technology and market
forces, actual-absolute cost values are not shown in this section. The actual costs have been
multiplied by a random factor. The important issue is the relative cost of the current clipper
operations versus a proposed, hypothesized solution.
The current costs for clipper development are listed in Table 2. These cost projections are
based on 750,000 clippers, with a product distribution of 80% small clippers, for finger nails, and
20% large clippers, for toe nails. The average cost for this distribution is $0.31 per product for
fabrication, $0.17 for labor, and $0.23 for engineering time.
For the purpose of comparison, the adopted concept for this analysis is a “generic,”
hypothesized clipper with reduced parts. It is assumed that there exists suitable component and
fabrication technology for this concept. Such a device would require less materials, piece-parts,
assembly, and labor; however, tool costs would potentially increase due to higher precision in the
cutter alignment. Based on this new fixture concept, Table 3 lists the expected costs for 750,000
products (same distribution of small and large clippers and, as with the current costs, multiplied
by a random factor). One-time development (engineering) costs account for $187,000 (increase
in tooling design), and projected on-going fabrication and engineering costs account for
$231,000 ($154.5k fabrication + $76.5k labor), compared with current product on-going costs of
$352,500.
The necessary information is developed for a break-even analysis. A comparison between
the current and proposed generic clipper costs is carried out to determine the payback period and
cost savings. Table 4 shows the results of the break-even analysis. The payback period is 6
months, with a potential savings of $121,500 for 750,000 products. These results are extremely
encouraging. Significant cycle time and cost savings may be achieved for the business if suitable
finger nail clipper concept can be developed. Because of these potential savings, the project
should be carried to the next stage of conceptual design and prototype build.

ASM International ASME Handbook, Otto and Wood Volume 20, Materials Selection and Design
6
Implications
While only a subset of the Harvard business case method is illustrated above, the potential
impacts are impressive. A “go/no-go” decision may be made early in the product development
process, provided that financial information exists for the current market and that projected costs
may be readily assumed for hypothesized concepts. Such decisions should be made in parallel
with technical and industrial design clarifications. Also, they should continually be reviewed
and updated as new information becomes available, especially as concrete product configurations
are derived.
An important caveat of the Harvard Business Case approach is the existence of past
financial information for a product family or the existence of analogous product data. While a
business case should be developed before or during concept generation, cost data are needed to
predict a product’s potential return on investment. If an entirely new product or family of
products is under development, cost data may not exist directly. The Harvard Business Case
methodology still applies in this case, where data are obtained from a similar or analogous
product, or very rough estimates of preliminary product layouts.
Section III. The Organizing Backbone of Product Design: Understanding and Satisfying the Customer
Now, having clarified what might make a technical and business opportunity, a firm should
determine if there is actual demand, before expending large resources to develop a new or
revised product. Many new technology development initiatives are undertaken with no basis for
market acceptance, other than management belief. If the developer thinks the technology is
amazing and valuable, then everyone else should also. This is the technologist's problem, and is
unfortunately very common in the engineering community. Akia Morita, founder of Sony
Corporation, boasts “Our plan is to lead the public to new products rather than ask them what
they want. The public does not know what is possible, we do.” (Barabba and Zaltman, 1991).
The result is products such as the Betamax. The fallacy inherent to such thinking is a prime
market rejection of otherwise innovative products. They fail to satisfy the customer. While the
fortunate technology-push approach can and does work, it is also clear that considering the
customer’s desires will pull product development into better directions and amplify success.

ASM International ASME Handbook, Otto and Wood Volume 20, Materials Selection and Design
7
It is important to recognize that “the customer” is a statistical concept, there are numerous
potential product buyers. Therefore, there are several tasks that must be completed to develop a
statistically valid customer needs list. A short discussion is given below on different methods
espoused to do each task, in addition to a detailed discussion of some preferred methods.
Methods to Gather the Voice of the Customer
Different techniques developed and applied to construct a customer needs list include: directly
using the product, circulating questionnaires, holding focus group discussions, and conducting
interviews. Urban and Hauser (1993) provide an excellent management science reference on
customer requirements. Shiba (1995) also provides a Total Quality Management perspective.
The first method available to understand the customer is “to be the customer” and to use the
product directly. Here a design teams goes to the locations where their or their competitor’s
product is used, and completes the customer’s tasks with the product. If the customer tasks can
be easily understood and undertaken by the design team, and the design team is small, then this
approach is effective. It is costly, though, for projects with either large design teams or highly
skilled customer tasks that require training. Further, it does not directly address documenting the
customer needs, which will still require an effort similar to that discussed here.
Another customer need identification method is to circulate questionnaires. A criteria list is
developed that a design team believes is relevant to the customers’ concerns, and the customers
rank the product on these criteria. Alternatively, the design team forms a question list for the
customers to answer. In either case, the team examines the responses provided, and from this
examination forms a customer needs list. The problem here is that the design team will hear
back what it has already determined to be important. The customers only provide answers to the
posed questions, which are not necessarily the same as what are most important to the customer.
Another method is to hold discussions with multiple customers as a focus group. Here, a
moderator facilitates a session with a group of customers who examine, use, and discuss the
product. Usually this is done in the design team’s environment, typically a room with a two-way
mirror so that the design team can observe the customers during the session. This session can be
video or audio taped for later examination.
A final method often applied is to interview the customers. Here, an interviewer discusses
the product with a single customer, one at a time. This is typically done in the customer’s
environment where the product is used by the customer. The customer is observed and
ASM International ASME Handbook, Otto and Wood Volume 20, Materials Selection and Design
8
questioned with the product. Again, the interview can be video or audio taped for later
examination.
Both the interview and focus group approach can provide customer need information when
the design team has limited intimate product knowledge as a customer. Griffin and Hauser
(1993) found that conducting interviews is more effective in uncovering information per amount
of effort. They also report that for consumer product sized design projects, properly interviewing
9 customers for one hour each provides over 90% of the customer needs, which experience also
bears out. Assuming a homogeneous market segment, interviews beyond the tenth subject tend
to uncover very few new customer needs. Exceptions exist for this approach when multiple
segments exist. More interviews would need to be conducted to discover the unique customer
needs per segment. Overall, however, interviews should stop when little new information is
being with respect to customer needs.
These propositions, however, assume the design team has placed a proper design scope over
the customer interview activities. Typically the interviewer allows the interviewed subjects to
begin and end in an ad hoc manner. This scope may not be sufficient for the design teams’
informational needs. To address this needs, a method is reviewed below for establishing
customer use patterns, beginning with methods for uncovering customer needs.
Conducting Interviews
There are different approaches to interviewing. Using an interview sheet with canned questions
does not work well for eliciting customer needs. It is much better to bring nothing other than the
following single request:
“Walk me through a typical session using the product.”
Then the customer should articulate what they are doing with every action. Typically the
interview starts with the customer making their approach to the product in storage, before even
using it. Where is it stored? How is it unpacked new from the box and assembled? What must
they do to attain it from storage and prepare it for use? Ideally, when the customer does any
motion or thought processing at all, the customer should state what they are doing. This should
be continued through the product use, followed by cleanup and re-storage. Some prompts that
are useful to periodically pose during silent moments include (Ulrich and Eppinger, 1995):
What do you like about the existing product? What do you dislike about the existing product?
ASM International ASME Handbook, Otto and Wood Volume 20, Materials Selection and Design
9
What issues do you consider when purchasing the product? What improvements would you make to the product?
In cases where a business entity is contemplating the development of a new product (e.g., a new
technology with no existing products on the market), the above questions work well as a starting
point. Because the customer can not walk through an actual product’s use, analogous devices
should be used, even a blob of clay, so that customer can manipulate a substance when
describing their desires. In this case or when a product is being evolved, some general hints for
effective customer interaction include (Ulrich and Eppinger, 1995):
Go with the flow. Do not try to stick to any interview guide, including this one. Use visual stimuli and props. Bring any tangentially related product, and ask about it. Suppress preconceived notions about the product technology. The customers will
make assumptions about the technology, but the interviewer should avoid biasing the discussion with any assumptions about how the product will be designed or used. It leads to speculation, not facts.
Have the customer demonstrate. It usually unveils new information. Be alert for surprises and latent needs. One should pursue any surprise answer with
follow-up questions. This usually uncovers latent needs - ones that the customer does not know they have and are hard to find.
Watch for non-verbal information. Words cannot communicate all product sensations. Each should be explained.
A form for collecting customer data, developed both in industrial projects for clients and in
academic design project courses, is shown in Fig. 3, completed for the fingernail clipper
example. The first two columns are completed during the actual interviews. The first column
documents any interviewer’s prompts to the customer, what might have been said to get the
response, if anything. The second column documents the raw data, what the customer said in
their words. No interpretation should occur by the interviewer when filling these columns.
The latter columns are completed after the interview. The third and fourth columns are
completed as soon as possible after the customer interview. The second column, containing
customer statements, are interpreted into third column interpretations, in a structured noun-verb
format (though not rigidly so). When making these interpretations, it is important to express
them in terms of what the product must do, not how the product might do it. Also, positive,
rather than negative phrasing should be used. This keeps the interpretations focused on the
actual needs, not on how a product may not be satisfying them. Finally, one should not include
“must” or “should” in the statement. Rather, these qualifications should be incorporated into
subsequent importance ratings, which constitute the fourth column.
ASM International ASME Handbook, Otto and Wood Volume 20, Materials Selection and Design
10
Subjective importance is generally not modeled directly in current interview methods. To
address this deficiency, the following has been proposed (Otto, 1995). In the fourth column, the
customer’s subjective need importance is interpreted linguistically using five ordered ratings,
MUST, GOOD, SHOULD, (Eq 1) NICE, NOT.
A MUST is used when a customer absolutely must have this feature, generally when it is the
determining criteria in purchasing the product. MUST ratings will act as constraints. The NOT
rating is for needs that the customer expressed only because it was observed that the product
could do it, but that the customer also never use and do not care about. Note that more rating
levels can be used for a more refined resolution, depending on the subjects’ abilities.
Customer Needs List Formation
Having formed multiple interpreted needs lists, the information must be compiled into a single
interpreted Customer Needs List and their relative importance, to which the product will be
designed. The needs list is the surrogate representation of the entire customer population for the
design team.
To carry out this compilation, the design team should copy each interpreted need onto an
index card, as shown in Fig. 4. Then, examining the index cards, the team places the first card
on a large white board. Next, the second card is compared with the one on the board, and if it is
different, it is put in a new column on the board. If however the second card statement concerns
the same need as on the first card, the second card is placed under the first into a column. This
process is repeated for all the hundreds of cards. This affinity diagram approach results in sorted
customer need statements, one customer need per column, as shown in Fig. 5.
Rather than have the design team conduct the sorting, an alternative approach is to have a
few customers carry out this activity. This prevents the customer data from being biased by the
development team. A common approach is to provide each customer sorter with a small index
card stack that each sorts as above. Next, a matrix is created with each interpreted need
statement down each row and column. The matrix is filled by each entry (i,j) containing the
number of times interpreted need i appears in a stack with interpreted need j. With this filled
matrix, a statistical hierarchical cluster analysis is performed, thereby converting the matrix into
a tree structure, where each interpreted need statement is arranged next to interpreted need

ASM International ASME Handbook, Otto and Wood Volume 20, Materials Selection and Design
11
statements or clusters that are “closest.” The development team then parses the tree into a two or
three level structure with exemplar labels for the branches. Urban and Hauser (1993) provide
details, but basically this approach is believed a more complete way to parse the need statements,
though more costly.
Customer Need Importance
Having represented the actual customer needs, numerical importance rankings must be
established. A design team should take care, however, as the typical customer population will be
multi-modal, with segments that have different importance weightings. Multi-modal populations
present systems-level choices on the product option variety to offer. Architecting a product
family to meet such demands remains active research (Ulrich 1995; Fisher et al. 1995).
A traditional approach to forming customer importance ratings is to first compare the
number of subjects who mention a need to the total number of subjects, using the original small
set of customers with no further questionnaire activity. For example,
CRi
# times mentioned
#subjects (Eq 2)
where CRi is the ith interpreted customer need importance rank. This ranking is flawed, as it
includes a measure of need obviousness, as opposed to need importance. A need may not be
important but may be very obvious, and so every subject mentions it. Because of this concern,
the design team typically reviews the different statements in column 2 of the customer response
sheets (Fig. 4) to raise and lower the result from (Eq 2). This approach is less than quantitative,
takes excessive time, and is hard to justify.
A good approach to forming an importance ranking for a population is to send a
questionnaire to a random customer sample, using the uncovered customer needs list and asking
for importance on each need. This approach can provide a sound statistical sample (generally at
least 100 randomly sampled customers) for ascertaining importance.
We believe, however, that any statistical importance determination must incorporate two
phases. First, a decision must be made as to whether the customer need is a hard constraint that
must be satisfied, or an objective that can be traded off versus the other customer needs, and so
carries a degree of relative importance. The former must be separated from the latter and
accounted for differently by the design team. The latter can then be profitably modeled with
importance weightings (or more generally preferences or utilities) in a second phase. To
separate out any customer needs that are hard constraints that must be met, each need is
ASM International ASME Handbook, Otto and Wood Volume 20, Materials Selection and Design
12
examined one at a time, and the number of MUST responses compared to the total number of
subjects. Clearly, if every subject flags the need as a MUST, than that need must be satisfied.
But if only a fraction of the subjects indicate the product must satisfy a need, a decision must be
made over what fraction should be used before interpreting the customer need as a constraint.
To answer this question, statistical outlier analysis (John, 1990) can be applied to determine
when a “few” MUSTs are outlier responses not worth flagging. We define a MUST-confidence
percentage level CMUST as the desired customer response percentage about the median needed to
switch the customer need from an objective to a constraint. CMUST is bounded between zero and
one. Note that though CMUST is a confidence percentage level, the approach here does not presume
normally distributed data. Confidence intervals have not been mentioned, only confidence
percentages. Often engineers feel comfortable with CMUST 0. 999, corresponding to 3 confidence
intervals when operating with normally distributed data. Such a value of CMUST is excessive here,
as it can create a very constrained design space for the design team. It will force many customer
needs to carries infinite importance as MUSTs.
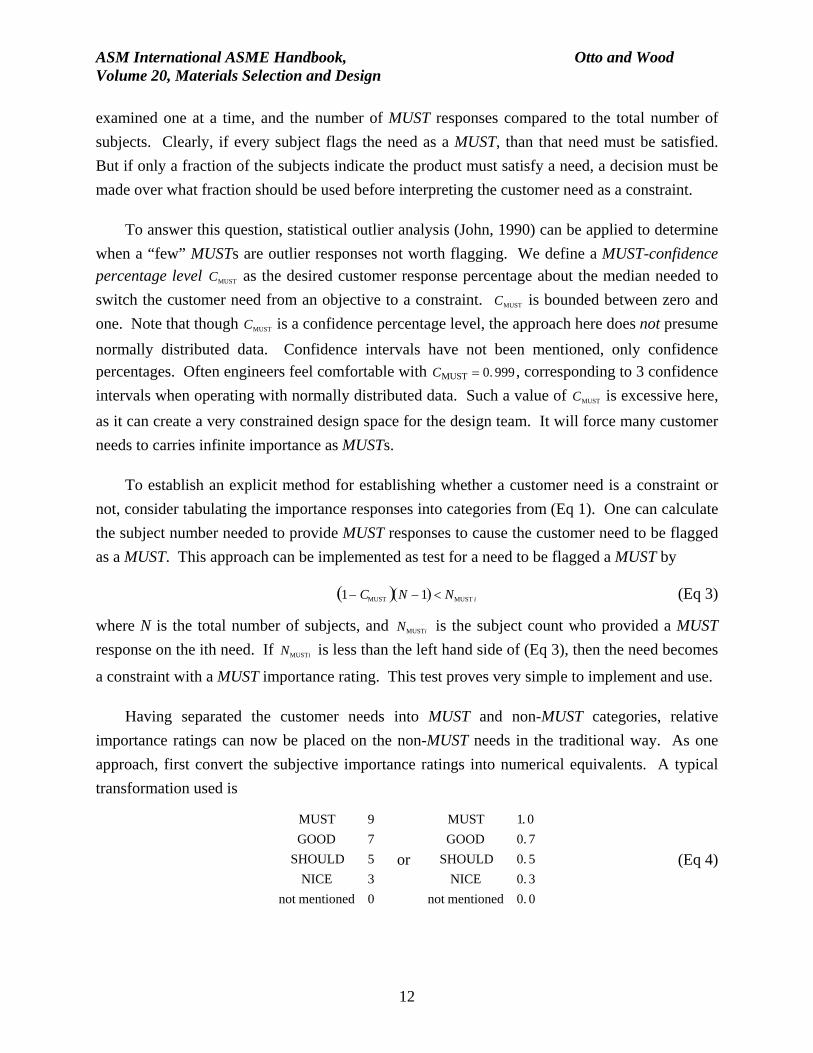
To establish an explicit method for establishing whether a customer need is a constraint or
not, consider tabulating the importance responses into categories from (Eq 1). One can calculate
the subject number needed to provide MUST responses to cause the customer need to be flagged
as a MUST. This approach can be implemented as test for a need to be flagged a MUST by
1 CMUST N 1 NMUST i (Eq 3)
where N is the total number of subjects, and NMUSTi is the subject count who provided a MUST
response on the ith need. If NMUSTi is less than the left hand side of (Eq 3), then the need becomes
a constraint with a MUST importance rating. This test proves very simple to implement and use.
Having separated the customer needs into MUST and non-MUST categories, relative
importance ratings can now be placed on the non-MUST needs in the traditional way. As one
approach, first convert the subjective importance ratings into numerical equivalents. A typical
transformation used is
MUST 9
GOOD 7
SHOULD 5
NICE 3
not mentioned 0
or
MUST 1. 0
GOOD 0. 7
SHOULD 0. 5
NICE 0. 3
not mentioned 0. 0
(Eq 4)
ASM International ASME Handbook, Otto and Wood Volume 20, Materials Selection and Design
13
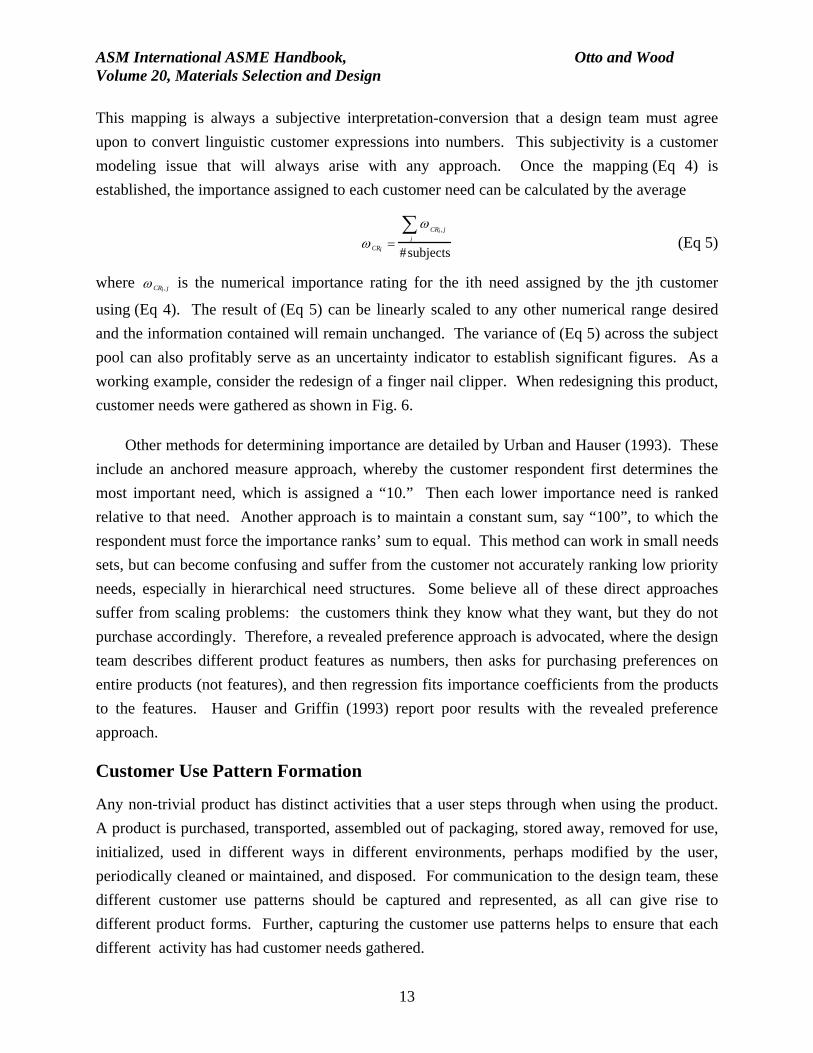
This mapping is always a subjective interpretation-conversion that a design team must agree
upon to convert linguistic customer expressions into numbers. This subjectivity is a customer
modeling issue that will always arise with any approach. Once the mapping (Eq 4) is
established, the importance assigned to each customer need can be calculated by the average
CRi
CRi , j
j
#subjects
(Eq 5)
where CRi , j is the numerical importance rating for the ith need assigned by the jth customer
using (Eq 4). The result of (Eq 5) can be linearly scaled to any other numerical range desired
and the information contained will remain unchanged. The variance of (Eq 5) across the subject
pool can also profitably serve as an uncertainty indicator to establish significant figures. As a
working example, consider the redesign of a finger nail clipper. When redesigning this product,
customer needs were gathered as shown in Fig. 6.
Other methods for determining importance are detailed by Urban and Hauser (1993). These
include an anchored measure approach, whereby the customer respondent first determines the
most important need, which is assigned a “10.” Then each lower importance need is ranked
relative to that need. Another approach is to maintain a constant sum, say “100”, to which the
respondent must force the importance ranks’ sum to equal. This method can work in small needs
sets, but can become confusing and suffer from the customer not accurately ranking low priority
needs, especially in hierarchical need structures. Some believe all of these direct approaches
suffer from scaling problems: the customers think they know what they want, but they do not
purchase accordingly. Therefore, a revealed preference approach is advocated, where the design
team describes different product features as numbers, then asks for purchasing preferences on
entire products (not features), and then regression fits importance coefficients from the products
to the features. Hauser and Griffin (1993) report poor results with the revealed preference
approach.
Customer Use Pattern Formation
Any non-trivial product has distinct activities that a user steps through when using the product.
A product is purchased, transported, assembled out of packaging, stored away, removed for use,
initialized, used in different ways in different environments, perhaps modified by the user,
periodically cleaned or maintained, and disposed. For communication to the design team, these
different customer use patterns should be captured and represented, as all can give rise to
different product forms. Further, capturing the customer use patterns helps to ensure that each
different activity has had customer needs gathered.

ASM International ASME Handbook, Otto and Wood Volume 20, Materials Selection and Design
14
To form the possible use patterns, it is important to first capture the serial activity sequence
for each customer. To do this, the last column of the customer data sheets, Fig. 3, is completed.
Typically, a sequence of customer statements will have one associated activity. Activities differs
from customer needs in that activities label what the customer is doing (not the product) when a
group of needs are expressed about the product. Upon completing column 4 of the customer data
sheets, the activities are transcribed onto index cards and combined into a network Activity
Diagram using another affinity exercise, as shown in Fig. 7. The number of cards for each
activity can indicate how typical each is, which can be recorded by the line width connecting the
activities. The initial and final activity are also highlighted, scoping the customer requirement
gathering activity. This can help system-engineer the environment within which the product is
used, if that is a topic for a larger scope team.
The important uses of the resulting Activity Diagram are two-fold. First, the Activity
Diagram can communicate to any new and different design team members what the customer
does with the product. It helps ensure that a design team is aware of all customer lifecycle
product needs. Note that the Activity Diagram can also be expanded upstream to capture sales,
distribution and manufacturing activities. Similarly, downstream activities such as disposal can
be represented. Incorporating such lifecycle and manufacturing concerns remains an active
research area.
The second important result of the exercise is that the activity list creates a useful
categorization for the Customer Needs List, Fig. 6. Typically, the customer needs are grouped
into more abstract categories based upon the design team or customer interpretation. This is
usually arbitrary. Experience has shown that the activities list provides a more meaningful
interpreted customer needs grouping. To each activity, the new customer needs introduced in
that activity are listed under it, as shown in Fig. 6. This provides a clearer understanding of the
customer needs’ context, and may help alleviate the need for a customer sort.
Customer Need Summary
The customer need gathering effort is complete, and so must be summarized into a document that
the design team can reference. A form for presenting the interpreted needs is given in Fig. 6.
Among other items, the header information contains a brief, typical customer description. The
customer description should be a very brief target market description. This description should
have been given to the product development team from management originally or through the
mission statement, but it should also be refined now based upon the customer needs. An
example for a fingernail clipper is

ASM International ASME Handbook, Otto and Wood Volume 20, Materials Selection and Design
15
Male/Female, age 20-60 Carries clipper on the run Not in the beauty industry
Basically, the customer description includes the core demographic description applied when
selecting customers to interview, and any relevant product particular information. This
information is particularly important for segmented customer populations.
When tabulating the customer needs down the chart, again they are listed by activity. The
activities are arranged in serial order, with parallel activities ordered by importance. Within each
activity group, the customer needs should be similarly arranged. The numerical importance
rating for each need should also be included in the second column. Customer needs which are
MUSTs should have this indicated in the second column. The scale (0 to 1, 1 to 10, etc.) and
normalization (relative to most important goal, relative to a sum, etc.) should also be indicated on
the top of the form, if there is no company standard. (Eq 5) reflects a relative scale as compared
to the most important goal.
In addition to customer needs, there are also other requirements that a product must satisfy,
typically legislative or manufacturing. These can be represented as additional requirements in
the customer needs list. Typically all have MUST constraint importances, since indeed they must
be met for the product to be legally sold or physically produced. Other non-customer
requirements can be incorporated in the customer needs list as deemed appropriate.
Alternatively, a specification sheet may be added for non-customer requirements, organizing the
requirements according to topic. (Pahl and Beitz, 1991) and (Cross, 1994) provide detailed
examples of how to create a specification sheet.
Section IV. Functional Decomposition: Modeling, Analysis, and Structure
Having a representation of what the customer wants from the product, a model of how the
product functions to satisfy the customer is needed. Functionally, all products do something.
Products, therefore, accept “inputs” and operate to produce “outputs,” i.e., the desired
performance. We can model any product, assembly, subassembly, or component as a system,
with inputs and outputs that traverse a system boundary. The essence of such a model is the
need-function-form definition of engineering design. In the sections below, we construct the
necessary machinery for understanding and representing design function, according to a system
ASM International ASME Handbook, Otto and Wood Volume 20, Materials Selection and Design
16
perspective. This machinery will aid us in synthesizing form solutions, with greater breadth, less
bias, and greater technical understanding than ad hoc approaches.
Why Functional Decomposition?
While methods to carry out market studies or to gather customer needs are widely accepted,
methods to generate concepts are typically allocated to the whims of the design team. The
transition from customer needs to concrete solutions is seen more as an art than a science or
method (Dixon, 1995). In fact for many consumer products, our experience has shown a
tendency to seek form solutions directly based on the previous experience of the design team
members.
With ever shrinking cycle times and budgets, and with ever expanding demands for quality,
this approach has a number of limitations. Most notably, the links between customer needs and
design concepts are, at best, indirect or implicit. They exist only in the minds of the designers.
As such, customer needs are relegated to the criteria for evaluating concepts, not the direct
catalysts for generating concepts.
Over the last twenty years, new methods for engineering design have emerged that focus
first on mapping customer needs to functional descriptions, or mapping these descriptions to sets
of technologies that satisfy the underlying functional requirements (Pahl and Beitz, 1991; Cross,
1994; Ullman, 1992; Hubka, 1984; Ulrich, 1995). When combined, these methods have a
number of intrinsic advantages:
Concentration is on “what” has to be achieved by a new concept or redesign, and not
“how” it is to be achieved. By so doing, a component- and form-independent
expression of the design task may be achieved to comprehensively search for
solutions.
Creativity is enhanced by the ability to decompose problems and manipulate partial
solutions (Ullman, 1992). By first decomposing a design task into its functional
elements, solutions to each element are more apparent due to the reduction of
complexity and extraneous information.
ASM International ASME Handbook, Otto and Wood Volume 20, Materials Selection and Design
17
Functions or sets of functions may be derived or generated directly from customer
needs. These functions define clear boundaries to associate assemblies or
subassemblies of the final design solutions. These boundaries provide a basis for
allocating resources to concurrent engineering efforts and for seeking modular
concepts.
Functional modeling provides a natural forum for abstracting a design task. Many
levels of functional abstractions may be created, from a very high level single
function statement to alternative detailed functional statements for a design’s
subsystems.
By mapping customer needs first to function and then to form, more solutions may be
systematically generated to solve the design problem. “If one generates one idea it
will probably be a poor idea; if one generates twenty ideas, one good idea might exist
for further development” (Ullman, 1992).
Needs mapped to function and then to form promote set-based concurrent engineering
processes (Sobek and Ward, 1996). Feasible regions of technology may be explicitly
defined based on functional requirements, not implicitly. Trade-offs may also be
explored in parallel among a wide array of radical and known solutions since a
common functional description is driving the design effort directly from the voice of
the customer.
Fig. 1 illustrates the role of functional decomposition in conceptual design process. The next
section describes a systematic approach for establishing functionality of a new design or
redesign. The finger nail clipper provides a running example to clarify the approach.
Establishing Functionality and Product Architecture
The previous section provides us with a clear statement of the customer needs, organized to
establish priorities for the design efforts. Functional modeling begins the systematic process of
transforming these needs to a clear specification of the design task. It also initiates the
conceptual design phase, wherein a breadth of solutions are sought.
ASM International ASME Handbook, Otto and Wood Volume 20, Materials Selection and Design
18
Phase 1 — Develop Process Descriptions as Activity Diagrams
Functional modeling includes developing a process description, here as represented with the
Activity Diagram, and eventually forming a function structure, as summarized in Fig. 8. To start
the function modeling process, an important tool is to specify the process by which the product
being designed will be functionally implemented. A process or process description, in this sense,
includes three phases: preparation, execution, and conclusion (Hubka, et al. 1988; Otto, 1996;
Otto and Wood, 1996). Within each phase, we network high-level user activities to show the full
lifecycle of a product, from purchase to recycling or disposal. By listing the high-level activities
in each phase, a number of product characteristics are chosen, including the product’s system
boundary, parallel (independent) and sequential paths of functional, process choices, and
interactions between user and device functions. These choices are documented by the Activity
Diagram, and so can be more fully considered.
To see this, consider Fig. 7, which illustrates the Activity Diagram for the finger nail clipper
design. To focus on product usage, the system boundary chosen includes all of the customer
activities. Fig. 7 does not include manufacturing related activities such as packaging and
transport, sales functions such as unpackaging, nor the disposal. Depending on the scope of the
design task, it could have. This modeling boundary defines the product system, receiving inputs
from and producing outputs to the user and environment. Parallel and sequential activities are
given by the Activity Diagram structure. Parallel customer activities will likely lead to parallel
product or device functions (since they are needed as such by the customer), providing implicit
subsystems or assemblies for each parallel path. Besides the system boundary and parallel paths,
the Activity Diagram clearly shows a number of choices of what will be the customer process,
and clearly that will influence the final design. For example, the activities of “picking” and
“filing” are process choices for improving the customer’s finger nail appearance through
mechanical contact. Chemical “soaking” process choices or others might be chosen as
alternatives. They would lead to different activities, functional descriptions, and, ultimately,
product architectures and components.
Phase 2 — Formulate Subfunctions Through Task Listing and Black Box Modeling
Using the customer process description (Activity Diagram) and customer needs, a function
structure for the product is next formulated (Fig. 8), where a function structure is defined as an

ASM International ASME Handbook, Otto and Wood Volume 20, Materials Selection and Design
19
input-output model that maps energy, material, and signal flows to a transformed and desired
state. Function structure modeling (Pahl and Beitz, 1984; Miles, 1972; Hubka, et al. 1988;
Ullman, 1993; Shimomura, et al. 1995; Ulrich and Eppinger, 1995; Cross, 1994) has historically
been used to create a form-independent product expression. We extend common function
structure modeling to include a mapping of customer needs to subfunction sequences (called task
listing), a method for aggregating subfunctions, and a comparison of a functional decomposition
with customer needs (Fig. 8).
The first step is to identify primary flows associated with the customer needs of the product
activities. A flow is a physical phenomenon, i.e., material, energy, or signal (information),
intrinsic to a product operation or subfunction. In the context of input-output modeling, a flow
enters an operation or subfunction, is manipulated by the subfunction, and exits in a new state.
For example, an operation may be to pressurize a fluid. Two critical flows for this operation are
an energy to execute pressure change and the fluid material being operated upon. A list of some
common energy flows are given in Table 5 (Hundal, 1990; Little, 1997).
Considering the finger nail clipper example, a subset of the customer needs are given as:
Need Effect Importance cost Not inexpensive 4 compact Not compact 4 files well Does not file well 2 cuts well Does not cut well must easy open/close Not easy open/close 4 easy hold Not easy to hold 3 comfortable Not comfortable 3 sharp cutting surface Not a sharp surface 3
We now translate the customer needs to energy, material, or signal flows of the product
when effects are exhibited or are expected to be exhibited during product use. Cost is not
something that deals with dynamic use of the product. So we do not model “not inexpensive”
functionally. Primary flows associated with “not compact” are the user’s hands, the finger nail
dimensions, and storage compartments, e.g., pants pockets, wallets, or purses. These flows are
material in nature and capture capacity in terms of “volume.” Primary flows for the remaining
customer needs include:
“Does not file well” — hand motion (energy), finger nail (material), finger nail roughness (signal).

ASM International ASME Handbook, Otto and Wood Volume 20, Materials Selection and Design
20
“Does not cut well” — generated cutting force (energy), finger force (energy), and finger nail (material).
“Not easy open/close” — hand movements (energy) and hand (material). “Not easy to hold” — finger force (energy) and hand (material). “Not comfortable” — finger force (energy) and hand (material). “Not a sharp cutting surface” — generated cutting force (energy) and finger nail
(material).
To document the mapping of customer needs to flows, a “black-box” model of the product
is developed. A black box model lists all input and output flows for the primary, high-level
function of the design task, stated in an active verb-noun phrase. Fig. 9 illustrates a black box
model for the finger nail clipper task. This model must now be refined and decomposed to
identify the basic product or device functions that will satisfy the overall function and needs.
For each of the flows, the next step (Fig. 8) is to identify a sequence of subfunctions and
specific user operations that when linked represent the product when interfacing with the
customer during the customer activities. A subfunction, in this case, is an active verb paired with
a noun that represents the causal reason behind a product behavior. An operation is a specific
action by the user needed to complete the function structure, typically a switch selection decision
making node. Miles (1972), Hundal (1990), Little (1996), and Ullman (1992) provide lists of
appropriate verbs and nouns to use in functional analysis, where Table 6 summarizes typical
classes of engineering functions (as defined in Table 7). A useful approach for generating
subfunctions is to trace the flow as it is transformed from it initial creation state to its final
expected state when it leaves the product’s system boundary. This approach may be executed by
play acting the flow (becoming the flow) or brainstorming a hierarchy of functions that must
process the flow.
For example, a customer need, expressed in the customers’ voice, may exist for “Cuts nail
well.” A suitable flow for addressing this need is a force flow that ultimately acts on the nail
material flow. Through play acting these flows, a subfunction sequence may be of the form:
capture force, apply force, transform to larger force, transmit force as motion, guide motion, cut
material, stop motion, release force, dampen reaction to force, etc.
Returning to the finger nail design task, Fig. 10 illustrates the task listing results for a subset
of the customer needs and corresponding flows. Each function chain in the figure (a-c)
ASM International ASME Handbook, Otto and Wood Volume 20, Materials Selection and Design
21
represents a functional decomposition of the functions needed to “cut nail well.” Customer
needs directly lead to each of these function chains, a tactical advantage of the method.
Phase 3 — Aggregate Subfunctions into a Refined Function Structure
Each sequence of subfunctions for the full set of customer needs are aggregated (combined) to
represent the functions of the entire product. This step is accomplished by appropriately
connecting flows between each sequence and adding subfunctions that interact or provide control
states.
Aggregation and refinement of the function structure ends based on two criteria: (1) are the
subfunctions “atomic,” i.e., can they be fulfilled by a single, basic solution principle that satisfies
the function, and (2) is the level of detail sufficient to address the customer needs? The first
criterion provides a basis for choosing the depth of functional analysis, e.g., a sub-function of
“control motion in 3D” should obviously be refined to control in three rotations and translations
since a single, basic form solution in finger nail clipper technology does not provide 3D control.
On the other hand, the second criterion assures that time is not wasted refining a function
structure to the level of miscellaneous and secondary product components, such as fastening.
For the finger nail clipper design effort, an aggregated function structure is shown in Fig. 11.
Notice that subfunctions and flows are combined for overlapping or redundant functionality from
Fig. 10. User functions are also listed outside of the system boundary for clarity.
Phase 4 — Validate the Functional Decomposition
Once the design team completes the subfunction aggregation, functional modeling and analysis
comes to a closure through two verification steps. First, all major flows between the
subfunctions are labeled and checked according to their state of transformation. By labeling the
flows, validity and continuity is ensured, perhaps leading to the addition of further functional
representations. Table 8 lists the pertinent questions, checks, guidelines, and actions
implemented at this stage. Second, the customer needs list is reviewed, and the subfunction or
sequence of subfunctions are identified that satisfy each customer need. Needs not covered by
the function structure require further analysis, and sub-functions not satisfying a need require
confirmation of their incorporation. This verification typically adds more subfunctions to the
network, while simplifying or removing others that really do not apply.
ASM International ASME Handbook, Otto and Wood Volume 20, Materials Selection and Design
22
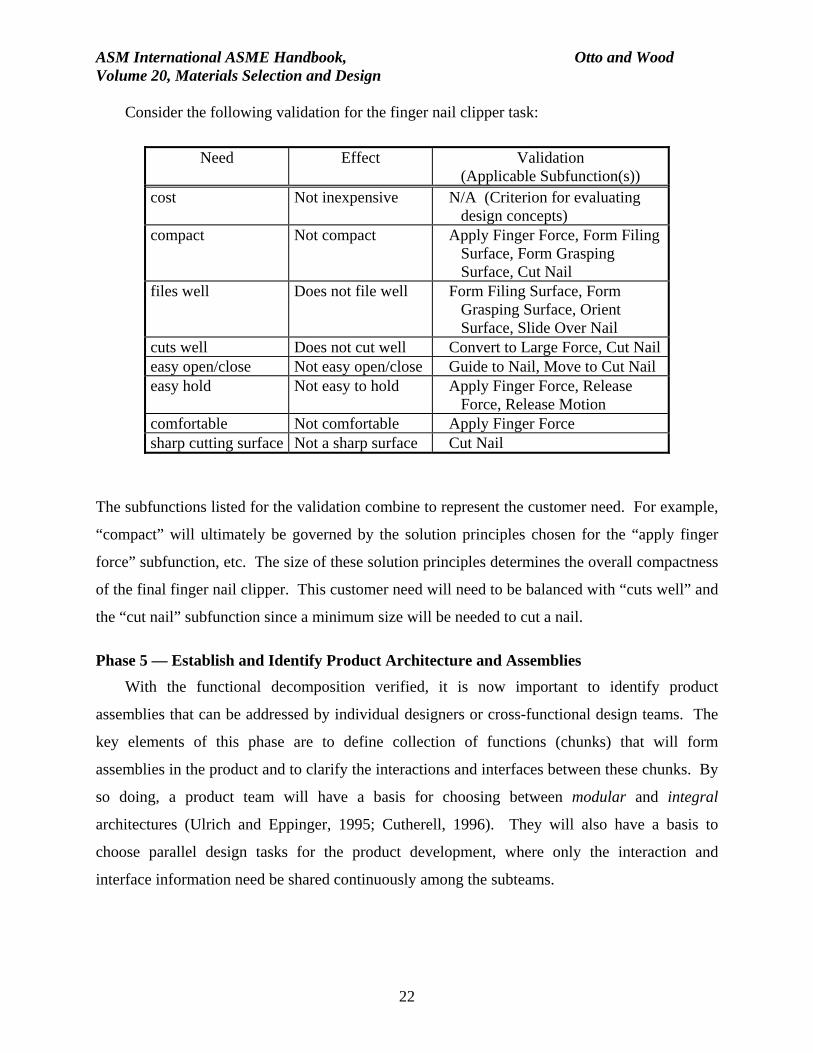
Consider the following validation for the finger nail clipper task:
Need Effect Validation (Applicable Subfunction(s))
cost Not inexpensive N/A (Criterion for evaluating design concepts)
compact Not compact Apply Finger Force, Form Filing Surface, Form Grasping Surface, Cut Nail
files well Does not file well Form Filing Surface, Form Grasping Surface, Orient Surface, Slide Over Nail
cuts well Does not cut well Convert to Large Force, Cut Nail easy open/close Not easy open/close Guide to Nail, Move to Cut Nail easy hold Not easy to hold Apply Finger Force, Release
Force, Release Motion comfortable Not comfortable Apply Finger Force sharp cutting surface Not a sharp surface Cut Nail
The subfunctions listed for the validation combine to represent the customer need. For example,
“compact” will ultimately be governed by the solution principles chosen for the “apply finger
force” subfunction, etc. The size of these solution principles determines the overall compactness
of the final finger nail clipper. This customer need will need to be balanced with “cuts well” and
the “cut nail” subfunction since a minimum size will be needed to cut a nail.
Phase 5 — Establish and Identify Product Architecture and Assemblies
With the functional decomposition verified, it is now important to identify product
assemblies that can be addressed by individual designers or cross-functional design teams. The
key elements of this phase are to define collection of functions (chunks) that will form
assemblies in the product and to clarify the interactions and interfaces between these chunks. By
so doing, a product team will have a basis for choosing between modular and integral
architectures (Ulrich and Eppinger, 1995; Cutherell, 1996). They will also have a basis to
choose parallel design tasks for the product development, where only the interaction and
interface information need be shared continuously among the subteams.

ASM International ASME Handbook, Otto and Wood Volume 20, Materials Selection and Design
23
A simple process for establishing the product architecture and assemblies includes the
following steps:
Using the functional decomposition of a product, cluster the subfunctions or
elements in the function structure. Dashed boxes around the clusters of subfunctions and
a title will serve as an appropriate representation. These clusters are chosen by
identifying parallel subfunction chains (each parallel track is a candidate cluster),
subfunction chains that have common energy types as flows, and subfunction chains that
only have simple interactions between each other.
Create a rough spatial layout (block diagram with a reference frame) for the
product. This layout is meant to show the relative position of each cluster to understand
spatial interactions and clarify interfaces.
Define Interactions, Interfaces, and Performance Characteristics between each
cluster. Given that interfaces are the boundaries between clusters, four types of
interactions exist as flows across interfaces: spatial (geometry), energy, information, and
material interactions. These interactions represent what must be shared across interfaces
within the performance requirements.
Fig. 11 shows the application of the first of these steps to the finger nail product. Three
primary assemblies are identified: the base, force amplifier, and file. Important interactions
include the hand flow of the user, attachments to allow relative motion for opening and closing
activities, etc. These assemblies may now be designed relatively independently, if a modular
architecture is chosen. Reference (Cutherell, 1996) studies further examples, including spatial
layouts. In particular, an HP1200C printer product is studied with respect to its basic
architecture.
Summary
Functional decomposition provides an abstract, yet direct, method for translating customer needs
to a functional specification of a design task. Fig. 8 illustrates a systematic five phase process
for executing a functional decomposition. Using the results of the method, quantitative
specifications may be formulated for customer needs, based on the applicable subfunctions. The
ASM International ASME Handbook, Otto and Wood Volume 20, Materials Selection and Design
24
next sections describe an approach for creating such a quantitative specification, based, in part,
on competitive benchmarking. In addition, a designer is tactically situated for generating and
then combining concepts for each subfunction (Fig. 1), a far simpler task compared to the
complexity and potential enormity of an overall design problem without decomposition.
Section V. Competitive Benchmarking: Know Your Enemy to Know Yourself
To remain competitive, a design team must compare any proposed concept with the competition
(Fig. 1). Typically a corporate group exists to tear down the competitor’s product, estimate
costs, plot trends, make predictions on requirements, and work with the design teams. These
efforts uncover the clever things that the competition has spent effort on, uncover the principles
behind how they work, and predicts costs.
An overview of an effective benchmarking process is given in Fig. 12. A functional product
teardown is far more than disassembly of a product to see how it is put together. One must
analyze the systems, and transform this analysis into information which can be used as a part of
the new concept, configuration, or redesign. (Note: Benchmarking is a dynamic activity. It may
be more appropriate to benchmark products before customer needs analysis and functional
decomposition. Alternatively, a team may not wish to bias these initial analyses, but update the
results with the benchmarking data.)
Related Work
Ingle (1994) presents methods and an overview of a reverse engineering methodology at a large
company. Thornton and Meeker (1995) present an approach and a case study from the computer
industry. Camp (1989) presents a ten step approach to benchmarking company operational
practices. We present a method here that is focused upon product design, using the customer
demands and the product functions.
Form a List of Design Issues
First it must be clear what problems the design team is facing on the current project. If this is a
new project, the technical form issues may be unknown, and so information about the customer
market, competitors, and competitive products are worth investigating. If this is a redesign
project, an investigation can ask of the previous design team:

ASM International ASME Handbook, Otto and Wood Volume 20, Materials Selection and Design
25
What was difficult for them? What design problem did they solve which they are proud of? What related technologies are they interested in?
The deliverable from this step is a list of keywords with explanations on topics to gather
information.
Form a List of Competitive or Related Products
Knowing the product function, one must examine the sales outlets for products which address
these functions. For consumer products, sales outlets are typically retail stores. For the product,
one must list all competitors and their different product models, and all related products in their
portfolio. If the competitors have a family of products under a common product architecture
(they use identical components for some aspects of each product, but different components for
niche demands), one should detail this information, as it can indicate the competitor’s preferred
market segments.
This step should only be an identification of the competitors, as company names and product
names. With a complete set of different products, vendors, and suppliers to examine, the list
should be screened by highlighting the particular ones that appear most crucial for the design
team to fully understand. This approach work feeds the next step, conducting a information
search.
Conduct an Information Search
The importance of this step cannot be overstated. The wealth of information available about all
business operations across the globe is amazing. Before starting any design activity, a team must
understand the market demand for product features, and what the competition is doing to meet it.
A design team should gather information on the products and related products, the functions they perform, the targeted market segments.
All keywords associated with these three categories should be formed from Step 2 (Fig. 12), and
used in informational searches.
Sources of information are varied and as common as the library. Most business persons are
perfectly happy to discuss the market and non-competitive business units. Though most will not
provide strategic information about their own companies, many people are happy to tell all about
their competitors. Suppliers will usually discuss their customers, if it appears you might provide
an additional sale. The key is to always be open and honest about your questioning for

ASM International ASME Handbook, Otto and Wood Volume 20, Materials Selection and Design
26
information. Once people understand you are designing or redesigning a new product, they
naturally want to get involved with new orders, and will help you up to the point they legally
can. Pursuit of information beyond that point is unethical, and not necessary. Most people are
happy to share information, and so simple honesty and a friendly attitude can get you a long way.
Public sources of information include the library and electronic wire services. University
libraries are filled with technical engineering modeling references. Also, librarians have
expertise in uncovering obtuse references with limited initial information. Particular references
of interest include: Thomas Register of Companies. This is a “yellow pages” for manufacturing related
businesses. The Thomas Register lists vendors by product. Market Share Reporter. Published every year by International Thomson Publishers,
this book summarizes the market research of Gale Research Inc. It comprises market research reports from the periodicals literature. It includes corporate market shares, institutional shares (not-for-profits), and brand market shares.
U.S. Dept. of Commerce and NIST. This U.S. government branch provides, among other things, national labor rates for all major countries. This proves very useful for determining competitors' manufacturing costs.
As another source, professional market survey companies now provide their results in on-
line databases (World Wide Web) that can be searched using keywords, for a small fee. In the
U.S., these include: Lexis/Nexis. These two databases are the most comprehensive full text on-line news
and business information source. Lexis provides legal information, and Nexis focuses upon business. Both comprise a database that provides abstracts and full text from public news sources including newspapers, magazines, wire services, newsletters, journals, company and industry analyst reports, and broadcast transcripts.
Dialog Information Services Databases. Dialog is the world’s largest on-line information research service containing millions of documents. These include databases with simple abstracts as well as the full article text. For the most part, the articles come from business journals and include information on company histories, competitive intelligence, new product development efforts, sales and earnings forecasts, market share projections, R&D expenditures, financial activities, demographics, socio-economic activities, government regulations, and events that impact the business environment.
There are other sources of information about competitive products. Most major
manufacturers have a presence on the world wide web. Much information can be gathered
simply and at no cost, particularly technical information. Material properties of industrial brand
plastics and metals, for example, are easily found. This resource will only grow, and topical
search engines are readily available.

ASM International ASME Handbook, Otto and Wood Volume 20, Materials Selection and Design
27
After examining trade journals and uncovering which competitors have bragged about new
innovations, gathering the patents on these new innovations also explains much. Patent searches
based upon company names are difficult, however, since typically companies “bury” their
patents by filing under the individual names of designers. Uncovering the individual patents is
usually by refined topical searches. Therefore absolutely as much information as possible should
be supplied to the person searching the patents.
Vendors of OEM components also are a valuable source of information. Cost quotes using
the competition’s ordering quantities is effective at uncovering OEM part costs. Usually one can
also obtain unsolicited information about the competition. Persons in the industry can provide
good pointers on non-obvious cost, technical, and market drivers. Particular overseas labor rates,
shipping rates, reliability of supply from geographic areas, etc., are all “inside knowledge” that
might be uncovered from other public sources only when one knows what to look for.
University faculty specializing in a technical area that is exercised by the product can also
provide invaluable assistance in design, or simply as consultants to participate as design
reviewers. All of these and other sources must be leveraged to determine as much as possible
about what customers want, what competitors are supplying, and what the dynamics of the
market are.
Prepare for Product Tear Downs
From the previous efforts, a list of products that are worth spending time tearing apart and
analyzing should be formed. This list should contain products that can provide technical
solutions to design needs. Typically, this list includes the least expensive model on the market,
the most expensive model, the most popular model, and models which have particular technical
features.
Next, one must clarify the criteria on which data are required. Typically, these criteria
include: Quantity of parts per product unit Dimensional measurements Maximum, minimum, and average material thicknesses Weight Material Color/Finish Manufacturing process, including sufficient information for a Design for
Manufacturing analysis Primary function Other notes

ASM International ASME Handbook, Otto and Wood Volume 20, Materials Selection and Design
28
Next, one should identify all tools that will be required to complete teardown. Also, identify all
sensors and test equipment required. Camera? Videotape (of product operating)? Multi-meter?
Hardness tester? Optical sensor? Flow meter? etc. Typically, one documents this information
into a written or electronic report, similar to professional laboratory experiments.
Examine the Distribution
Important factors in the product development decision making process that must not be
overlooked are the means used to acquire parts, contain them, ship, distribute, and market the
product. These must also be examined as a part of the benchmarking process. The distribution
packaging of the product should be examined and reported to the design team, often it can be
quite expensive. Consumer installation instructions and procedures should be examined for costs
and effectiveness.
Disassemble and Measure by Assemblies
Disassembly is the obvious step commonly pictured when thinking of reverse engineering.
However, to be effective, this must be coordinated with measurements. First, take pictures and
measurements on the whole assembly before disassembly. Then, Take apart the assembly. Take pictures in an exploded view. Take measurements on the parts and assemblies to complete the data sheets.
Form a Bill of Materials
Complete a written form which details the product. A good format is shown in Fig. 13, where
each column consists of the data analysis criteria of Step 5 (Fig. 12). Also, the sequence of
photos and an exploded view CAD drawing should be completed.
Plot Industry Trends
Having uncovered a wealth of information from such sources, the next problem is to arrange and
transform it for clear understanding of implications for the design or redesign task. This process
should include:
Categorization of the market Categorization of Technical solutions Benchmarking of Technical solutions Benchmarking of competitors
The market categorization is typically by socio-economic status and percentage of the market.

ASM International ASME Handbook, Otto and Wood Volume 20, Materials Selection and Design
29
The technical solution categorization is more difficult, and should be categorized by the
function structure modeling. This often poses difficulty, however, since the competitors may
include functionality you choose not to. The function structure modeling could be completed for
all of the competitive products, and provide a means to list all known technical solutions to
particular sub-functions.
The benchmarking of technical solutions and companies is more readily completed, but
requires a time history of product measurements. All technological innovations manifest
themselves into the market along an “s-curve” timeline behavior, as shown in Fig. 14. That is,
consider examining any important product metric, for example, clock speed for microprocessors.
For all of the different products (microprocessors) in the market, one can plot each product’s
metric value (clock speed) as a function of the time when each product was introduced. The
metric values will naturally fall as an “s-curve” in time. First, the values are low and widely
spaced: not much innovation is occurring in the market. Next, a rapid profusion of innovation
occurs, and many products are launched in time. The lower leg of the “s” is forming. The new
technology, however, eventually tops out, physical laws of the process dominate, and engineers
cannot extract more performance. The slope of the “s” tops out again, and the curve becomes
flatter.
These trends are critical for a competitive company to understand for their industry. If the
market is becoming more competitive, the company must understand that to invest in product
and process quality, or lose. One can tell this immediately as the point at which the lower leg of
the “s” starts to form. If the market technology is topping out (the top of the “s”), the company
should again know this to begin to investing in a new technology, to “jump” to the next s-curve,
higher on the scale of the metric. Plotting trends provides all of this information. Clearly
trending of competitive data is a necessary and culminating business consideration as a part of
product benchmarking.
Section VI. Forming Quantitative Specifications: Quantitative Consensus
Introduction
Having established the function structure/architecture and understood competitive product
performance (Fig. 1), each sub-function must now be associated to at least one line item in a
product functional Specification Sheet. These are functional specifications of what the product

ASM International ASME Handbook, Otto and Wood Volume 20, Materials Selection and Design
30
must do, not necessarily form specifications for purchasing components. The specification list
should include both the specifications and also an importance rank of each specification.
Related Work
Approaches taken to forming specifications most often include Total Quality Management
methods (Ishikawa, 1992, Clausing, 1994, Shiba, 1995), and in particular Quality Function
Deployment (Akao, 1990) and the House of Quality (Hauser and Clausing, 1988). For the most
part, these methods provide a means to verify and agree upon a proposed list of specifications,
and a means to set target values on the variables. What these and other tools do not provide is a
means to identify what variables should be used as specifications. How does one identify the
measurable variables that are to be ensured?
Many researchers and practicing engineers have developed methods for forming
specifications. Ulrich and Eppinger (1995) provide an excellent chapter where they discuss
forming product specifications and using the House of Quality. Hauser and Clausing (1988) also
provide a popular article on the House of Quality. Akao (1990) provides a text on Quality
Function Deployment complete with case studies. Alternatively, Urban and Hauser (1993) also
present several methods for selecting among different variables to find those which make most
sense to use for specifications. Yet, in all of these methods, the approach for generating
variables on which to make specifications is simply to be creative. We review here methods to
generate and track specification variables.
Specifications
First, what is meant by an engineering specification must be precisely established. Typical
definitions state that a specification is a dependent evaluation including both a metric and a value
(Ulrich and Eppinger, 1995). A metric is the quantity of discussion. The value is a target for the
metric, and can be a particular number, a range, or an inequality.
These statements clearly have meaning when operating with numerically real-valued
metrics. It is not the case that all specifications must be real-valued, however. A specification
can be generated using a collection of colors, smells, or other sets of elements that are hard to
quantify. In general, every specification that is made will always have an associated informal
ASM International ASME Handbook, Otto and Wood Volume 20, Materials Selection and Design
31
subjective interpretation by each design team member. All design team members interpret the
metric target values into a subjective connotative meaning from past experience.
To be valid, a specification must have the following three characteristics that all team
members implicitly or explicitly agree upon. The specification must come from a set of possible
different elements (or values), and these elements must collectively be comprehensive and
measurable. A set is comprehensive if, by knowing the value, the extent of achievement of the
associated informal reason for setting the specification can be interpreted by members of the
design team. For example, if a numerical specification of “20” for machinability is not agreed
upon or understood by the design team, it is not a good specification of machinability. The
specification must be grounded with understood points (Otto, 1995), such as associating “50”
with 1020 steel.
A specification must also be measurable. Formal definitions of measurability exist (Otto,
1995), but essentially the design team must be able to at least partially order the set of values,
otherwise the set is no more formal than a person’s subjective connotations. It must be
understood that “30” is better than or equal to “20”, for example. This is not an issue with
quantitative numbers, but is with non-numeric datasets.
Identifying Specification Metrics
To establish an initial set of engineering specifications, a design team should begin by listing
each subfunction. Then to each subfunction, a relevant product subsystem (either architectural
assembly or physical subsystem of a redesign) is examined. From these sources, a means to
“instrument” the product subsystem to measure the functional flows in and out of the sub-
function should be considered. Depending on the product, this instrumentation can rely on
engineering data acquisition, or can be as simple as touch, feel, or look. This depends on the
comprehensive nature of the metric. A partial list for the finger nail clipper is shown in Fig. 15,
with the process assumption of a mechanical cutting surface (a blade).
This approach generally produces better results than other approaches, in that the sub-
functions are more quantified than customer needs. The approach still clearly relies on the
creativity of the design team. On the other hand, the creativity is decomposed into two stages,
ASM International ASME Handbook, Otto and Wood Volume 20, Materials Selection and Design
32
conceiving of the function structure itself and conceiving of how the flows of each sub-function
can be “instrumented” for measurement on the product sub-system. It is less a conceptual leap to
generate measurable metrics for an independently generated set of sub-functions, each associated
with a subsystem, than to generate measurable metrics for each customer need directly.
Next, the metrics generated must have target values assigned to each. This assignment is
completed by examining the relevant customer needs associated to each metric. In general,
establishing a target may require some calibration of the metric. For example, once it is
understood that handle temperature is a good metric to represent comfort of the customer, it may
be required to test different handle temperatures with the customers to determine the highest
acceptable temperature value.
After these steps, a relevant hierarchical set of functional specifications is completed. It can
be collected into a House of Quality matrix, for example, to verify and communicate how the
customer needs are being met. The House of Quality can be used to document the product
design targets of the different team members working in concert.
Forming Specification Importance Ranks
Finally, the importance of each specification can be calculated through the House of Quality.
This calculation is carried out in the usual manner by inserting relationship values in the House
of Quality matrix to relate customer needs with engineering specifications. Then a suitable
algebra is used to combine these relationship ratings with the customer need importance ratings
to establish importance ratings on the individual specifications.
The first step is to create the mapping from the customer needs to the specifications. In a
typical House of Quality manner, the relationships are captured by a set of symbols:
( , O, , ‘ ’ Eq 6
There is always a question concerning how to make these assignments. In this development, the
problem is more complex with the additional MUST constraints. When some of the customer
needs have MUST ratings and others do not, how should these be propagated through
symbols (Eq 6) onto a importance rating for any particular specification?
ASM International ASME Handbook, Otto and Wood Volume 20, Materials Selection and Design
33
To answer this question, the following interpretation is proposed when making causality
assignments to relate the customer needs to the specifications. One considers each specification
one at a time, and then for a given specification considers each customer need. One assigns a ,
O, or based upon the following subjective rules:
indicates that attaining the target on this one specification will totally
cover the customer need,
O indicates that attaining this specification will cause at least half
satisfaction of the customer need, (Eq 7)
indicates that attaining the target on this specification will cause less
than half satisfaction of the customer need,
‘ ’ A blank indicates that attaining the target on this specification will do
nothing towards causing satisfaction of the customer need.
This interpretation of the assignments creates least misunderstanding. The linguistic values of
“half” and “nothing” used define both the subjective weighting criteria and the level of resolution
that the design team must take care to agree upon. Doing so establishes the mapping (Eq 7).
The next step is to map the MUST importance ratings on the customer needs into MUST
importance assignments on the specifications. The specifications with MUST ratings then act as
functional constraints for the design team — they must be met.
It is not immediately clear what an appropriate overall algebra is for mapping the customer
importance ratings (Eq 3) and (Eq 5) through the causality assignments (Eq 7) into importance
ratings on the specifications. In particular, the means to combine MUST and non-MUST
importances is not obvious. On the other hand, it is clear that if a MUST customer need has a
relationship with a specification using (Eq 7), then that specification deserves a MUST rating.
Also, for the remaining specifications that map from that covered MUST customer need, the
MUST on that covered customer need is not required to be treated as a MUST, since it is
“covered” with a specification. That covered customer need can be assigned the highest
numerical importance rating in (Eq 5) for use in determining the remaining non-MUST
specification importances.

ASM International ASME Handbook, Otto and Wood Volume 20, Materials Selection and Design
34
Given these insights, experience shows that the best approach is to insist that every customer
need MUST constraint have at least one entry in its mappings to the specifications. Then that
specification can serve as a direct proxy measurement for the MUST customer need.
If there is no such specification that can directly -map the MUST customer need
constraint, it is an indication to the design team that the specification list needs re-examination.
If the condition persists, the team must agree upon the set of specifications that predominantly
map to the customer need constraint. All of these specification must then be assigned MUST
importance ratings. An excessive number of MUST assignments, though, places excessive
demands of a design team.
Once the specifications that act as constraints are identified, the subsequent specifications
can be assigned numerical importance ratings. This process is usually a simple exercise of
multiplication and addition. The causality values (Eq 7) are given numerical equivalents,
typically
or . (Eq 8)
Any MUST customer needs are assigned the maximum importance value, typically 5 out of 5 or
1.0 out of 1.0. Then the numerical importance of each specification is determined through a
weighted sum across the needs
i Tij CR jj
,
where Tij is given by (Eq 8). The results can then be linearly normalized to any selected scale.
The results for the finger nail clipper are shown and summarized in Fig. 16, the House of
Quality matrix for the clipper. Note the propagation of the MUST importance assignments onto
the engineering specifications. These can now be readily modeled into hard constraints for the
design team. The other numerically rated specifications become objectives that can be traded off
in design decision making, with importance as indicated.
9
O 5
3
' ' 0
1. 0
O 0. 5
0. 3
' ' 0. 0
ASM International ASME Handbook, Otto and Wood Volume 20, Materials Selection and Design
35
Section VII. Preview — Generating Design Configurations and Form Concepts
Fig. 16 illustrates a crisp, quantitative specification for product design. Its roots are grounded in
customer needs, and its structure is interwoven by the established product functionality.
This specification, however, does not complete the conceptual design process (Fig. 1).
Form solutions must be generated for the decomposed subfunctions, combined into a finite set of
concept variants, and then selected using the quantified specifications exemplified by Fig. 16.
Subsequent chapters/articles in this handbook document detailed methods for executing these
tasks. As a preview, however, let’s consider the finger nail example, and generate solutions that
may be derived as a direct consequence of our systematic approach.
Various methods for concept generation are documented in the literature (Pahl and Beitz,
1991; Ulrich and Eppinger, 1995; Ullman, 1992; Cross, 1992; Greenwood, 1982; French, 1985;
Hubka, 1984; Pugh, 1991; Dixon and Poli, 1995; Altshuller, 1984). For the purpose of the finger
nail clipper design, we seek to develop concepts according to a four step process: (1) generate as
many solution principles to each of the subfunctions (Fig. 11) as possible, (2) qualitatively prune
the number of solution principles using the criteria of Fig. 16, (3) combine the remaining
solution principles into a number of feasible concept variants that satisfy the entire set of product
functions, and (4) identify avenues for function sharing in each concept variant to reduce part
count and complexity.
Figs. 17 and 18 illustrate a subset of the results from this four-step process. The
morphological matrix contained in Fig. 17 shows a breadth of form solutions to the decomposed
functions. In turn, Fig. 18 shows some possible combinations into concept variants. Because the
concepts are generated directly from the functional specification, the likelihood of satisfying the
customer needs is high, something that is not afforded by ad hoc approaches. Fig. 19 confirms
this statement. A number of current finger nail clippers are shown in the figure. The concept
generation, summarized in part by Figs. 17 and 18, covers these product ideas at a fundamental
functional level. In fact, the “molded scissors” concept does not currently exist on the market, a
potential product evolution following the business case of Table 4.

ASM International ASME Handbook, Otto and Wood Volume 20, Materials Selection and Design
36
Section VIII. Product Applications
Fig. 1 illustrates, at a high level, the entire product development process. The finger nail clipper
design task is used throughout this chapter to focus attention on conceptual and configuration
design. As such, it provides a broad list of customer needs and functional issues, while
maintaining a level of familiarity and simplicity.
Building upon this example, this section presents two brief product applications. The first
application, referred to as “batter up,” concentrates on original design (Faulkner, et al., 1995). It
carves out a new market, initiating the first data point on an s-curve innovation. Alternatively,
the second alternative, an electric wok consumer product, represents a redesign task, wherein a
market is already established. The focus of this example is to create a conceptual framework for
product evolution and improvement.
Batter Up! Application
Leisure and recreation are vital for people’s physical and mental health. “Evidence indicates that
what an individual does during leisure time significantly affects illness, disease, and even
longevity” (Wankel, 1994, p. 29). Persons with disabilities in primary and secondary education
need recreational opportunities and skills as part of their educational development so they can
carry skills into adulthood and into life in their communities (Auxter, 1993). This general need
leads to the mission statement “to design a device and/or process that will enhance the
recreational activities of students with severe mental and physical disabilities.”
After initial clarification and high-level customer interviews at Rosedale School in the
Austin Independent School District (Faulkner, et al., 1995), the mission statement is refined to
“the design of a product that would enhance tee ball for the students, while maintaining their
integration in the community.” The primary market for the device is educational institutions as
an assistive technology. Initial business case analysis demands that the product cost less than
$100 as a one-off device produced by the institutions.
Customer needs analysis (10 customers) for this application gives the results shown in
Table 9. The final product must adapt for changing skill levels for educational development, and
it must guide the bat to consistently hit the ball, providing the primary function for integrating

ASM International ASME Handbook, Otto and Wood Volume 20, Materials Selection and Design
37
the students into community activities. Beyond these “musts,” critical needs for a successful
product include the ability to adjust the height of the ball for persons in wheel chairs and persons
of various sizes, assure that the student uses the device independently (not hand-over-hand),
provide auditory stimulation for cause-effect learning, and reduce the size for storage and
transportation (separation of function in time and space). It must also be “Easy to
build/duplicate” since the institutions will be fabricating the device themselves.
Through the specification of a process description and task listing of these customer needs,
the black box model and refined function structure are shown in Fig. 20. The system boundary
for this functional analysis includes only the operational phase tee ball. Notice in the function
structure the convergence of both an external energy source and the human energy from the user.
These energy flows, in addition to guidance functions, provide the primary means of satisfying
the operational needs of students with disabilities.
A House-of-Quality for the “Batter Up!” includes measurements of the volume, mass, and
number of piece parts. In addition, the length of bat grips, operating noise, range of bat height,
range of handle movement, and range of bat speeds provide a quantified specification of the
functions in Fig. 20.
This specification leads to concept generation of a tee ball assistive technology. Table 10
shows a partial morphological analysis of the main functions in the function structure. Solution
principles are listed discursively according to energy domain. A wide variety of mechanical and
electro-mechanical solutions are shown for the application, especially for the external energy
source. These solution principles lead to a number of concept variants. Fig. 21 illustrates the
selected concept. This concept, based on a pneumatic energy source and a guide line, was
produced from basic hardware supplies to satisfy the fabrication requirements of wood shops in
secondary school systems. After prototype testing, this successful concept was installed in the
Austin Independent School District as a regular recreational activity.
Electric Wok Application
This redesign project was initiated through the perception of a need: the inadequacy of current
electric woks to satisfy the demands of the young urban dweller desiring to conveniently cook
ASM International ASME Handbook, Otto and Wood Volume 20, Materials Selection and Design
38
authentic Chinese food (Pan and Otto, 1995; Otto and Wood, 1996). The original product is a
six quart Electric Wok, shown in Fig. 22.
A competitive product is a traditional wok, used over a gas flame and heated by convective
and radiative modes of heat transfer. Heating occurs uniformly across the entire wok surface,
rather than in a concentrated ring. This method thus lends itself to uniformly cooking the food
placed within it.
Important customer needs, gathered and organized using interviews and importance ratings,
include: temperature — “temperature uniform across the inner surface,” “heat and cool quickly,”
“maintain uniform temperature in time,” etc.; size — “compact wok for countertop and storage”;
cleanable — “prevent food from sticking” and “allow the removal of cooking surface from
heating unit”; etc. Table 11 provides the list of customer needs and priorities, including
background information that supports this list.
Task listing is applied to the customer needs and activities listed in Table 11. An example
of the flow of electric energy, related to the cooking and temperature control activities and needs,
is illustrated in Fig. 23. The resulting function chain for each of the customer needs leads to the
aggregated function structure and black box model shown in Fig. 24. In turn, an analysis of the
subfunctions leads to the quantified specification shown in Fig. 25. This specification and
functional modeling provides the basis for concept generation, concept selection, design
modeling and analysis, and design-of-experiments prototyping (these topics are covered in
subsequent chapters).
Table 12 shows a partial morphological matrix for the electric wok redesign. Solution
principles are listed for the critical subfunctions from the customer needs analysis. Through
combinations of principles, concept selection, and design analysis, this matrix leads to the alpha
prototype shown in Fig. 26. The final alpha prototype for the redesigned wok includes many
advances: a removable bowl for washing, a large handle, an on/off switch, removable cord,
simple/visible power control, uniform power control in time, compactable volume for storage,
and a wide view radiant surface. No electric wok on the market yet incorporates all of these
customer requested features.

ASM International ASME Handbook, Otto and Wood Volume 20, Materials Selection and Design
39
Section IX. Closure: The Conceptual and Configuration Design Process
Product concepts begin and end with the customer. A concise and quantified specification is an
essential element for developing suitable concepts. This chapter presents a systematic method
for creating such a specification. We begin with the technical and business market, probing the
design task for legitimacy. Customer needs analysis, functional decomposition, and competitive
benchmarking are then presented as methods for directly mapping customer statements to
functional requirements, in the context of competitors’ products. Results of these methods lead
to a House-of-Quality, forming the product specification and setting the playing field for concept
generation. Later chapters continue this theme with conceptual design of parts and creativity.
A common design methodology criticism is that it is explanatory and thought provoking, but
not relevant to actual practice. This criticism is becoming an antiquated view. We find leading
industrial companies to be constantly seeking more structured approaches to their product
development processes, especially in the era of concurrent development, intensive computing,
and downsizing of workforces. An effective structured method allows not just one expert to
understand and complete a task, but many others as well, documenting all decisions for
subsequent redesign. In our opinion, conceptual design skills can be learned and fostered with
structured methods. We encourage the reader to seriously formulate their systematic
methodology, similar to those presented in this handbook. We predict that the rewards of doing
so will be endless and dramatic, overcoming the psychological and bureaucratic inertia that tends
to infiltrate our business lives.
X. References
Akao, Y. Quality Function Deployment: Integrating Customer Requirements into Product Design. Productivity Press, Cambridge, 1990.
Altshuller, G., Creativity as an Exact Science, Gordon & Breach Publishers, NY, 1984.
Auxter, D., et al. Principles and Methods of Adapted Physical Education and Recreation, 7th Ed., Mosby-Year Book, Inc., St. Louis, 1993.
Barabba, V. and G. Zaltman. Hearing the Voice of the Market Competitive Advantage through the Creative Use of Market Information. Harvard Business School Press, Boston, MA, 1991.
Camp, K. Reverse Engineering. McGraw-Hill, New York, 1989.
ASM International ASME Handbook, Otto and Wood Volume 20, Materials Selection and Design
40
Camp, R. Benchmarking: The Search for Industries Best Practices that Lead to Superior Performance. Quality Press, 1989.
Clausing, D. Total Quality Development, ASME Press, New York, 1994.
Cross, N. Engineering Design Methods — Strategies for Product Design, 2nd Ed., John Wiley & Sons, Chichester, 1994.
Cutherell, D. A., “Product Architecture,” In The PDMA Handbook of New Product Development, M. D. Rosenau, ed., John Wiley and Sons, Inc., New York, 1996.
Dixon, J and C. Poli. Engineering Design and Design for Manufacturing — A Structured Approach, Field Stone Publishers, Conway, MA, 1995.
Faulkner, G., et al. “Designing Fun and Independence into Tee Ball,” ME 392M Project Report, The University of Texas, Dept. of Mechanical Engineering, Austin, TX, 1995, Contact: Prof. Kristin L. Wood, “http://shimano.me.utexas.edu.”
Fisher, M., Jain, A., and J. MacDuffie, “Strategies for Product Variety: Lessons from the Auto Industry,” Designing the Firm, E. Bowen and B. Kogut, eds., Oxford Press, New York, 1995.
French, M. Conceptual Design for Engineers, Springer-Verlag, London, 1985.
Griffin and J. Hauser, “The Voice of the Customer,” Marketing Science. 12(1), Winter 1993.
Hauser, J. and Clausing, D., “The House of Quality,” Harvard Business Review, May-June, pp. 63-73, 1988.
Hubka, V., Andreason, M., and W. Eder, Practical Studies in Systematic Design, Butterworths, London, 1988.
Hubka, V. and W. Ernst Eder. Theory of Technical Systems, Springer-Verlag, Berlin, 1984.
Hundal, M. “A Systematic Design Method for Developing Function Structure, Solutions, and Concept Variants,” Mechanism and Machine Theory, 25(3):243-256, 1990.
Ingle, K. Reverse Engineering. McGraw-Hill, Inc., New York, 1994.
Ishikawa, K. Guide to Quality Control. 10th ed. Asian Productivity Org., Hong Kong, 1992.
Little, A. A Reverse Engineering Toolbox for Functional Product Disassembly and Measurement, Master’s Thesis, The University of Texas, Dept. of Mechanical Engineering, Austin, TX, 1997.
McNair, M. P., The Case Method at the Harvard Business School, McGraw-Hill, New York, 1954.
Miles, L., Techniques of Value Analysis and Engineering, McGraw-Hill, New York, 1972.
Otto, K. “Forming Product Design Specifications,” in Proceedings of the 1996 ASME Design Theory and Methodology Conference, San Diego, CA, 1996, to appear.

ASM International ASME Handbook, Otto and Wood Volume 20, Materials Selection and Design
41
Otto, K. “Measurement Methods for Product Evaluation,” Research in Engineering Design, 7:86-101, 1995.
Otto, K. and K. Wood. “A Reverse Engineering and Redesign Methodology for Product Evolution,” in Proceedings of the 1996 ASME Design Theory and Methodology Conference, Irvine, CA, August, 1996.
Pahl, G. and W. Beitz, Engineering Design: A Systematic Approach, Springer Verlag, 1984.
Pan, C. and K. Otto. “Optimal Re-Design of an Electric Wok,” EDRL Technical Report 95-5, Massachusetts Institute of Technology, 1995. http://design.mit.edu/~knotto/papers.
Ratliff, R., Wood, K. L., et al., “A Conceptual Design Study of the EVT Process of In-Circuit Tests,” IBM Technical Report, IBM ECAT, Austin, TX, May, 1993.
Ronstadt, R. The Art of Case Analysis: A Guide to the Diagnosis of Business Situations, Lord Publishing, Inc., Natick, MA, 1988.
Shiba, S., Graham, A. and D. Walden. A New American TQM. Productivity Press, Cambridge, MA, 1995.
Shimomura, Y., et al. “Representation of Design Object Based on the Functional Evolution Process Model,” Proceedings of the ASME DTM Conference, Boston, MA, Sept. 1995.
Sobek, D. and A. Ward. “Principles from Toyota’s Set-Based Concurrent Engineering Process,” Proceedings of the ASME Design Theory and Methodology Conf., Irvine, CA, Aug., 1996.
Thornton, A. and D. Meeker. Benchmarking within the Product Development Process. Proceedings of the 1995 Design Technical Conferences, DE-Vol. 83, pp. 639-648, 1995.
Ullman, D., The Mechanical Design Process, McGraw-Hill, NY, 1992.
Ulrich, K. “The Role of Product Architecture in the Manufacturing Firm,” Research Policy, 24, 1995.
Ulrich, K. and S. Eppinger. Product Design and Development. McGraw-Hill, 1995.
Urban, G. and J. Hauser. Design and Marketing of New Products, 2nd ed. Prentice-Hall, Englewood Cliffs, NJ, 1993.
Wall Street Journal, 4/24/95, p.1.
Wankel, L. “Health and Leisure: Inextricably Linked,” Journal of Physical Education, Recreation, and Dance, 64(4), pp. 28-31, 1994.
Suggested SourcesAsimow, M., Introduction to Design, Prentice Hall, Englewood Cliffs, NJ, 1962.
Ashley, S., “If at First you Don’t Succeed, Redesign,” Mechanical Engineering, 116(3), 1994.
Asthana, P. “Jumping the Technology S-Curve,” IEEE Spectrum, June 1995, 49-54.
ASM International ASME Handbook, Otto and Wood Volume 20, Materials Selection and Design
42
Clausing, D. Total Quality Development, ASME Press, New York, NY, 1994.
Dieter, G. Engineering Design, 2nd Ed., McGraw-Hill, Inc., New York, 1991.
Hubka, V. Principles of Engineering Design, Butterworth & Co. Ltd., London, 1982.
Lefever, D. “Integration of Design for Assembly Techniques into Reverse Engineering,” Masters’ Report, Dept. of Mechanical Engineering, The Univ. of Texas, Aug., 1995.
Lefever, D. and K. Wood, “Design for Assembly Techniques in Reverse Engineering and Redesign,” Proceedings of the 1996 Design Theory and Methodology Conference, ASME, Irvine, CA, August, 1996.
Love, S. Planning and Creating Successful Engineered Designs, Advanced Professional Development, Los Angeles, CA, 1986.
Miller, J., “New Shades of Green,” M.S. Thesis, The Univ. of Texas, Austin, TX, 1995.
Nevins, J. and D. Whitney. Concurrent Design of Products and Processes, McGraw-Hill, New York, 1989.
Pugh, S. Total Design, Addison-Wesley, New York, NY, 1991.
Ullman, D., “A New View of Function Modeling,” International Conference on Engineering Design, ICED ‘93, The Hague, August 17-19, 1993.
Warfield, J. Societal Systems, Intersystems Publications, Salinas, CA, 1989.

ASM International ASME Handbook, Otto and Wood Volume 20, Materials Selection and Design
43
Fig. 1. The Concept and Configuration Development Process.
BusinessMarket
NewTechnologies
CustomerGroup &
Demographics
Establish Need
ConceptDevelopment
SystemDesign
DetailDesign
ProductionRamp-Up
LaunchProduct
Iterate
Pervasive
StateMission
Gather &Organize
Customer Needs
EstablishProduct
Functionality
DetermineProduct
Activities
ConductInterviews
EvaluateImportance
FormQuantitative
Specifications
PerformCompetitive
Benchmarking
GenerateProduct
Concepts
SelectProduct
Concept(s)
Testing &Refinement
Clarification:Understand Design
Task
PlanDevelopment
Project
PerformBusiness Case
Analysis
Concept and Configuration Design
This ASM Chapter/Article Next 3 ASMChapters/Articles
MissionStatement
ProductSpecification

ASM International ASME Handbook, Otto and Wood Volume 20, Materials Selection and Design
44
Fig. 2. Mission statement template.
Mission Statement: XXXX Product
Product Description
Key Business or
Humanitarian Goals
Primary Market
Secondary Market
Assumptions
Stakeholders
Avenues for Creative Design
Scope Limitations
one concise and focused sentence • schedule • gross margin/profit or break-even point • market share • advancement of human needs • brief phrase of market sector/group • list of secondary markets, currently or perceived • key assumptions or uncontrolled factors, to be confirmed by customer(s) • 1-5 word statements of customer sets • identify key areas for innovation • list of limitations that will reign back the design team from "solving the world"

ASM International ASME Handbook, Otto and Wood Volume 20, Materials Selection and Design
45
Fig. 3: Customer Need Collection Form, completed for the fingernail clipper example.
Clipper Project Customer Data
Customer: Interviewer: KNO Customer ID: KNO5 Date: 9/3/95Willing to Follow Up? No Location: Cambridge, MAType of User: Middle class, white, male, traveing
Question/Prompt Customer Statement Interpreted Need Weight Activity
When usually use? In the evening in hotel
Keep in my shaving bag Reasonably Compact Must StoreHow big is that? About 3" x 2" x 6", and I have alot of
things in it, it is always fullSize of things is important? Very important. I look for the
smallest size of everything.
So I dig it out of my bag, and carry Striking appearance Nice Prepare for filing it to the bed, where I usually clip Lightweight Nice my nails.
Spin handle and rotate simultaneously Easy to open file Should
Do you file? Yes, I file at an angle, with a vertical File at an angle Must Files nails and a angular motion
With file between thumb and index finger, and clipper body in fist
Easy to close file Should Unprepare for filingRotate file back in place
Easy to open clipper Should Prepare for clippingRotate handle into position Easy to hold clipper ShouldGrab in hand using thumb and index finger, with tail up against middle finger edge
Position nail to be cut on bottom Easy to align clipper Nice Clipping blade Low clipping squeeze force NiceSqeeze finger and thumb to cut Blade shape curved NiceReposition blades and make a 2nd cut Clips nails Must
Reposition blades for final cut Nail falls predictably NiceCatch cut nail
Toss in garbage Dispose of nails
Rotate handle back Easy to close clipper Should Return from clippingSpin handle to closed position
Put back in bag
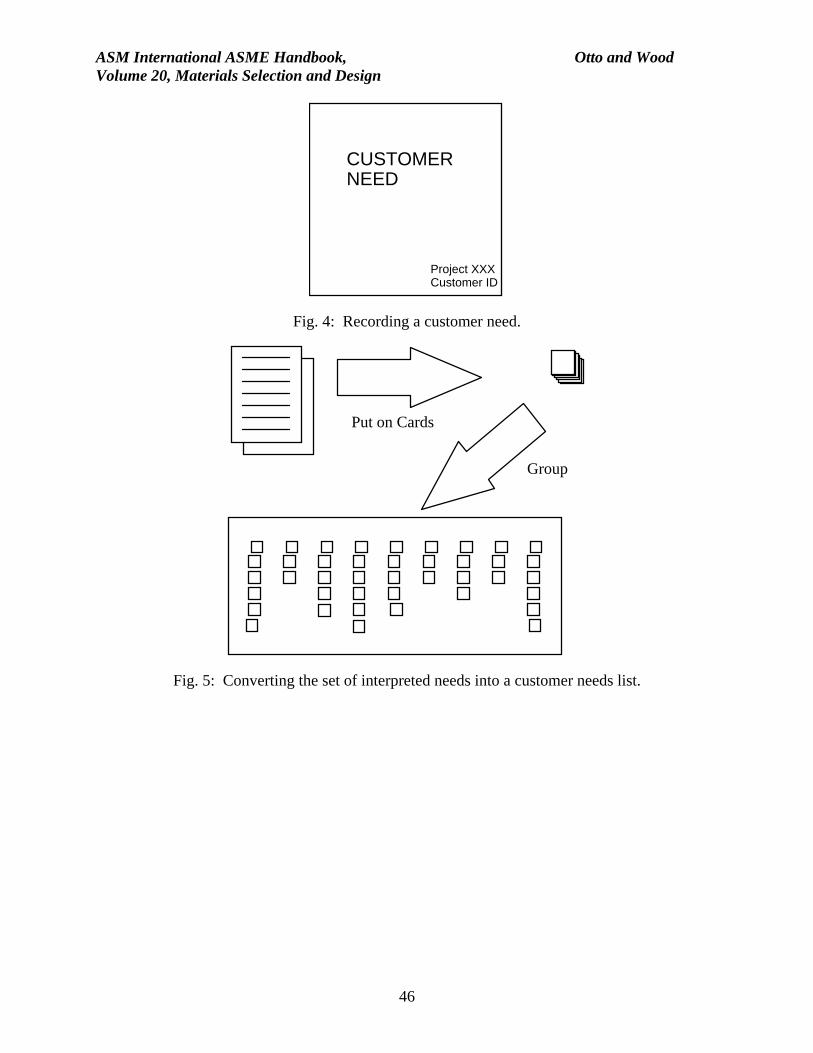
ASM International ASME Handbook, Otto and Wood Volume 20, Materials Selection and Design
46
Fig. 4: Recording a customer need.
Fig. 5: Converting the set of interpreted needs into a customer needs list.
CUSTOMER NEED
Project XXX Customer ID
Put on Cards
Group

ASM International ASME Handbook, Otto and Wood Volume 20, Materials Selection and Design
47
Fig. 6: Partial Customer Needs List.
Clipper ProjectCustomer Requirements
Interviewer(s): KNODate: 9-7-95
5 Number of Customers0 5 Weighting Scale75% Must Confidence
Average Customer:Male/Females, age 20-60, Middle ClassNot in the hair or nail industry
Customer Requirement WT
• Purchase - Cost 4
• Transport in package
• Unpackage
• Chain Keys
- Act as keychain 0
• Store - Compact storage 4
- Non-snag storage 1
- Lightweight 2
- Striking appearance 3
• Prepare to File/Pick - Easy to open file 2
• Filing/Picking - Files nails 2
- Picks nails must
- File rough 1
- File holds filed dust 0
- File has a picking tip must
• Return from Filing/Picking - Easy to close file 2
• Prepare for clipping - Easy to open clipper 4
• Clip nails - Easy to align clipper 2
- Easy to hold clipper 3
- Body contoured to hold 3
- Curved blade shape 3
- Wide handle 2
- Low squeeze force 1
- Blade can act as pusher 1
- Blade can act as a file 1
- clips nails must
- clips toe nails 1
- clips hang nails 1
- sharp blade 1
- Nails fall predictably 1
- Stores cut nails 1
- Easy to clean 0
• Return from clipping - Easy to close clipper 4
• Throw away

ASM International ASME Handbook, Otto and Wood Volume 20, Materials Selection and Design
48
Fig. 7: Completed activity diagram for the finger nail clipper.
Purchase Transport in Package
Unpackage
Chain Keys
Store
Throw Away
Pick NailsClip Nails File Nails
Prepare to Clip
Prepare to
File/Pick
Return from
File/Pick
Return from
Clipping

ASM International ASME Handbook, Otto and Wood Volume 20, Materials Selection and Design
49
Fig. 8. Function modeling and analysis process.
Fig. 9. Black box model of the finger nail clipper design task.
GenerateFunctionHierarchy
CreateProcess
Description
CreateTask
Listing
AggregateSubfunctions,
RefineFunctionStructure
Label/CheckFlows
Comparew/Customer
Requirements
CreateAlternativeFunctionStructures
Prob. Defn.ClarificationBlack Box ModelCustomer Reqs.
IdentifyProduct
Architectureand
Assemblies
Remove Excess Length on Finger Nails
Finger Force, Kinetic (hand motion)
Finger nail Hands, DebrisLong nail, Hang Nail, Rough Nail
sound kinetic energy in nail
Cut nail, Hands, DebrisGood appearing nail
Energy Material Signal (information)

ASM International ASME Handbook, Otto and Wood Volume 20, Materials Selection and Design
50
Fig. 10. Finger Nail Clipper Task Listing for Each Customer Need.
Open System
Finger Force
Execute Cutting
Finger nail
Nail uncut
Clipped nail
Close Systemclipper
openfinger clipped
Cover Cutting Surface
HandHand
Store Nail
Finger Nail
Clipped Nail Clean finger
Stop motion
Release Force
Release Motion
motion
high force force
Kinetic Energyin nail, sound
Apply Finger Force
Finger Force
Convert to large force
force Guide to cut nail
large force
down motion
Move to Cut Nail
Cut Nail
Hands
HandsHands
Kinetic Energy
(a) CN: Cut Well, Easy to Hold, Comfortable; Flows: Finger Force, Nail, Hands
(b) CN: File Well ; Flows: Nail, Hand Motion, Roughness Signal
(c) CN: Open/close easily; Flows: Nail, Hand
Reaction Force
Form Filing
Surface
Hand Motion (Finger Force)
Slide Over Finger Nail
file in place
Rough Nail
Rough
roughness
Rough
Clean nail, Nail filings, Hands
Determine roughness
Hands, Nail
Hand
Moving Hand
HandReset Filing
SurfaceForm Grasping Surface
Orient Filing
Surface
Hand
Reaction Force
Reaction Force
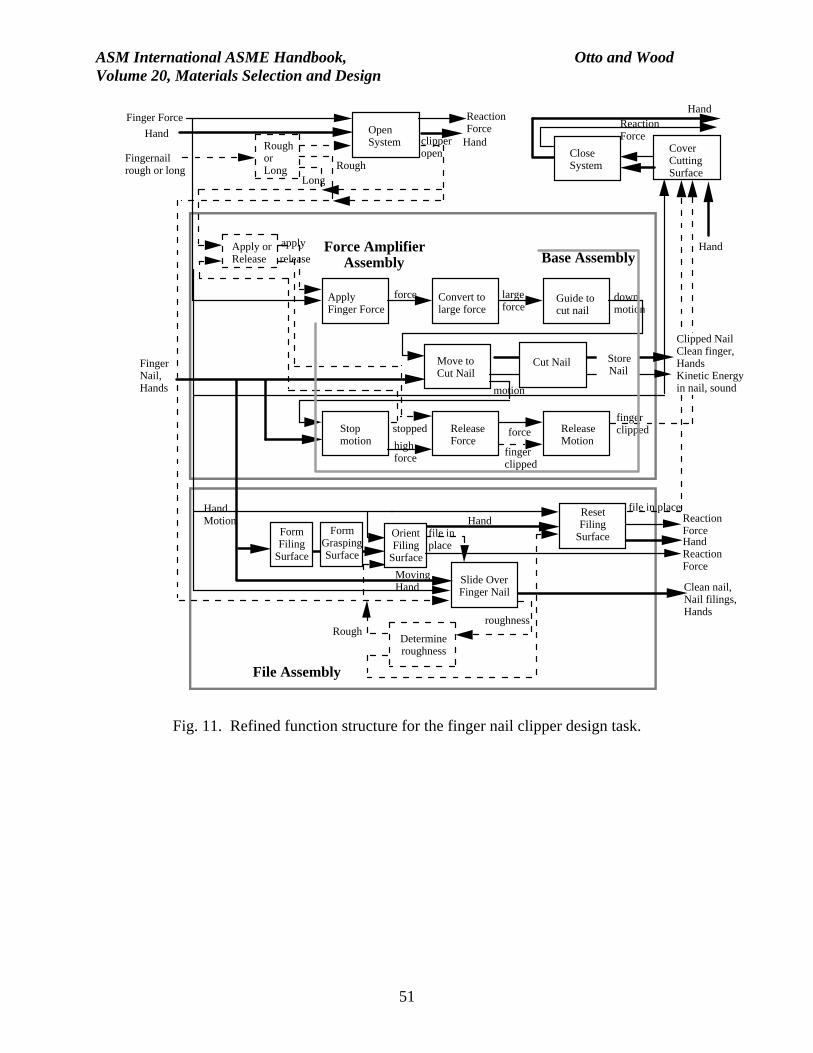
ASM International ASME Handbook, Otto and Wood Volume 20, Materials Selection and Design
51
Fig. 11. Refined function structure for the finger nail clipper design task.
Move to Cut Nail
Finger Nail, Hands
Stop motion
Release Force
Release Motion
motion
high force
forcestopped
Apply Finger Force
apply
Convert to large force
force Guide to cut nail
large force
down motion
release
Open System
Finger Force
clipper open Close
System
finger clipped
finger clipped
file in place
LongRough
Fingernail rough or long
Rough or Long
Apply or Release
Cover Cutting Surface
Clipped Nail Clean finger, HandsKinetic Energy in nail, sound
Hand
Hand
Cut Nail
Reaction Force
Reaction Force
Hand
Hand
Store Nail
Hand Motion
Form Filing
Surface
Slide Over Finger Nail
file in place
roughnessRough
Clean nail, Nail filings, Hands
Determine roughness
Hand
Moving Hand
HandReset Filing
SurfaceForm
Grasping Surface
Orient Filing
Surface
Reaction Force
Reaction Force
File Assembly
Force Amplifier Assembly Base Assembly

ASM International ASME Handbook, Otto and Wood Volume 20, Materials Selection and Design
52
Fig. 13. Reverse Engineering Bill-of-Materials.
Fig. 14. Technological innovations plot as S-curves.
Part # Part Name Quantity Finish Function Physical Parameters
A1 Arm Assembly001 Actuator arm 1 Chrome Transmit finger force 2", shaped
Input from finger .25" pivot002 Pin 1 Chrome pivot .13" round
A2 Cutter Assembly003 Blade arms 2 Chrome Cut nails 2.00 x .44 x .13
Spring action .13" blade gapA3 File Assembly
004 File 1 Chrome File nail Scored1.50 x .25 x .06
005 Pivot rivet 1 Chrome Attach file .19 rivet
metric
timeFirst Technology
New Technology
An individual product
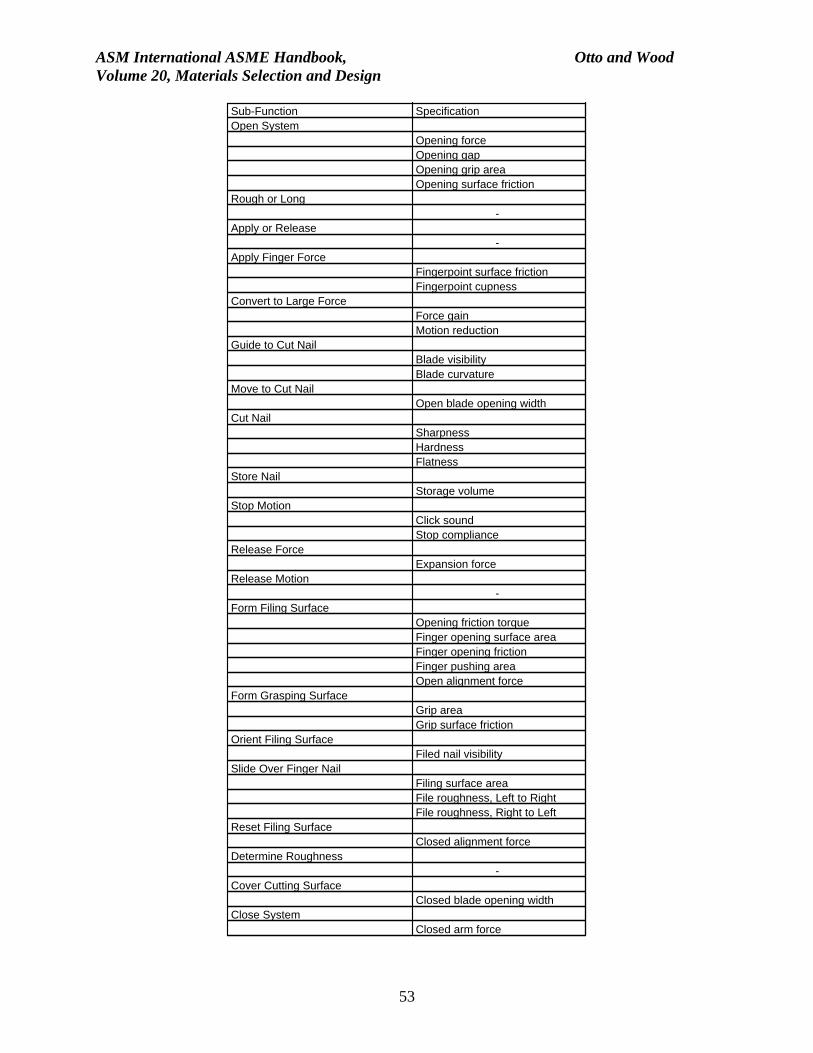
ASM International ASME Handbook, Otto and Wood Volume 20, Materials Selection and Design
53
Sub-Function SpecificationOpen System
Opening forceOpening gapOpening grip areaOpening surface friction
Rough or Long -
Apply or Release -
Apply Finger ForceFingerpoint surface frictionFingerpoint cupness
Convert to Large ForceForce gainMotion reduction
Guide to Cut NailBlade visibilityBlade curvature
Move to Cut NailOpen blade opening width
Cut NailSharpnessHardnessFlatness
Store NailStorage volume
Stop MotionClick soundStop compliance
Release ForceExpansion force
Release Motion -
Form Filing SurfaceOpening friction torqueFinger opening surface areaFinger opening frictionFinger pushing areaOpen alignment force
Form Grasping SurfaceGrip areaGrip surface friction
Orient Filing SurfaceFiled nail visibility
Slide Over Finger NailFiling surface areaFile roughness, Left to RightFile roughness, Right to Left
Reset Filing SurfaceClosed alignment force
Determine Roughness -
Cover Cutting SurfaceClosed blade opening width
Close SystemClosed arm force

ASM International ASME Handbook, Otto and Wood Volume 20, Materials Selection and Design
54
Fig. 15. Generating metrics for sub-functions, finger nail clipper example.

ASM International ASME Handbook, Otto and Wood Volume 20, Materials Selection and Design
55
Open System
- Opening force
- Opening gap
- Opening grip area
- Opening surface friction
Rough or Long
- Apply or Release
- Apply Finger Force
- Fingerpoint surface friction
- Fingerpoint cupness
Convert to Large Force
- Force gain
- Motion reduction
Guide to Cut Nail
- Blade visibility
- Blade curvature
Move to Cut Nail
- Open blade opening width
Cut Nail
- Sharpness
- Hardness
- Finger squeeze area
- Flatness
Store Nail
- Storage volume
Stop Motion
- Click sound
- Stop compliance
Release Force
- Expansion force
Release Motion
- Form Filing Surface
- Opening friction torque
- Finger opening surface area
- Finger opening friction
- Finger pushing area
- Open alignment force
Form Grasping Surface
- Grip area
- Grip surface friction
Orient Filing Surface
- Filed nail visibility
Slide Over Finger Nail
- Filing surface area
- File roughness, Left to Right
- File roughness, Right to Left
Reset Filing Surface
- Closed alignment force
Determine Roughness
- Cover Cutting Surface
- Closed blade opening width
Close System
- Closed arm force
Material FInish
Keychain
Weight
Material Cost
Pur
chas
e -
C
ost
4²
O²
Tra
nspo
rt in
pac
kage
Unp
acka
ge
Cha
in K
eys
-A
ct a
s ke
ycha
in0
Sto
re -
Com
pact
sto
rage
4²
²
²²
²²
²
-N
on-s
nag
stor
age
1O
-Li
ghtw
eigh
t2
²²
²
-S
trik
ing
appe
aran
ce3
²²
Pre
pare
to F
ile/P
ick
-E
asy
to o
pen
file
2
OO
OO
O
Fili
ng -
File
s na
ils2
O
O -
File
rou
gh1
O
Ret
urn
from
Fili
ng/P
icki
ng
-E
asy
to c
lose
file
2
OO
OO
O
Pre
pare
for
clip
ping
-E
asy
to o
pen
clip
per
4
OO
O
Clip
nai
ls
-E
asy
to a
lign
clip
per
2O
OO
-E
asy
to h
old
clip
per
3O
-B
ody
cont
oure
d to
hol
d3
-
Cur
ved
blad
e sh
ape
3 -
Wid
e ha
ndle
2
-Lo
w s
quee
ze fo
rce
1
-B
lade
can
act
as
push
er1
-
Bla
de c
an a
ct a
s a
file
1O
O
O -
clip
s na
ilsm
ust
O
O -
clip
s to
e na
ils1
O
O -
clip
s ha
ng n
ails
1 -
shar
p bl
ade
1
-N
ails
fall
pred
icta
bly
1
-S
tore
s cu
t nai
ls1
-E
asy
to c
lean
0O
Ret
urn
from
clip
ping
-E
asy
to c
lose
clip
per
4
OO
O²
Thr
ow a
way

ASM International ASME Handbook, Otto and Wood Volume 20, Materials Selection and Design
56
Fig. 16. House of Quality for the finger nail clipper.
Subfunction Current Solution Principles
Opening Open clipper Spin and flip
Determine rough or Long
Clip nail Determine apply or release Apply finger force shaped top,
bent bottom shaped top and
bottom hand grip finger holes
Convert to large force pivot linkage concentrate it pliers
Stop motion teeth hit peg
Release force spring of bent body
linear spring coil spring leaf spring
File nail Move file into place pivot out file file on arm slide arm out flip out file
Slide over nail Determine roughness Return file in place pivot back file (file on top
arm)
Closing Close clipper Flip and spin
Hold shut spring of bent body
Fig. 17. Partial morphological matrix (subset) for the finger nail clipper.
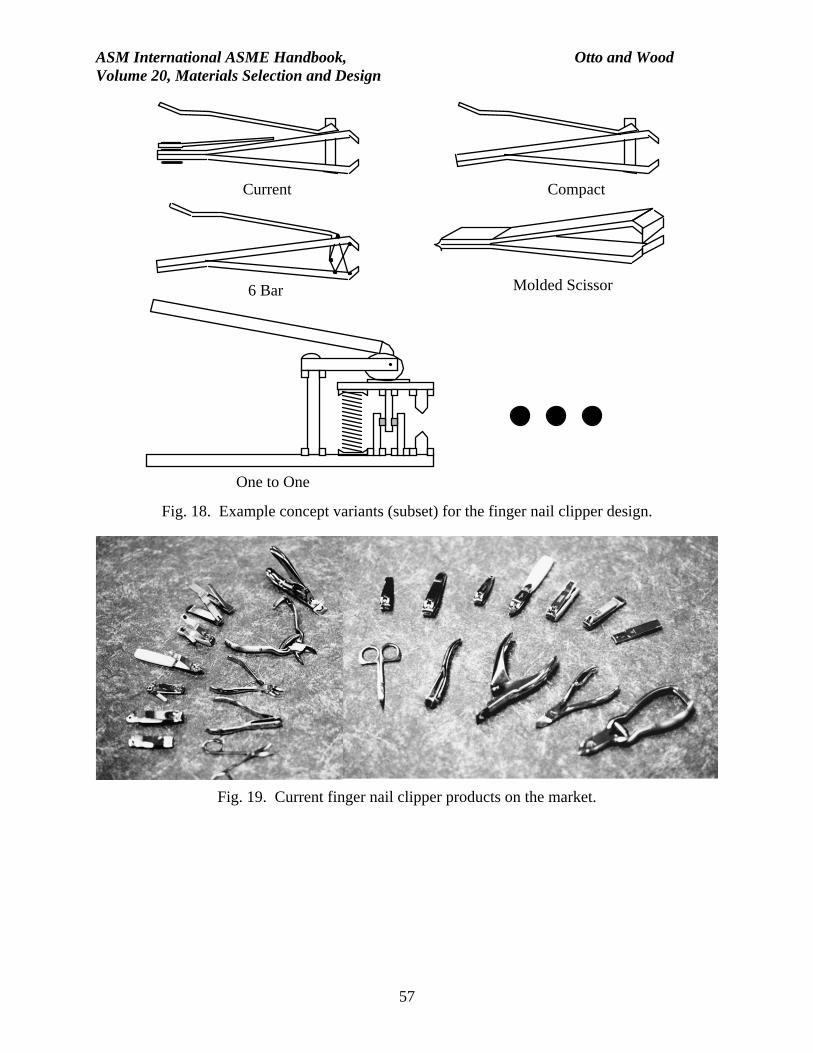
ASM International ASME Handbook, Otto and Wood Volume 20, Materials Selection and Design
57
Fig. 18. Example concept variants (subset) for the finger nail clipper design.
Fig. 19. Current finger nail clipper products on the market.
Compact
6 Bar
Current
Molded Scissor
One to One
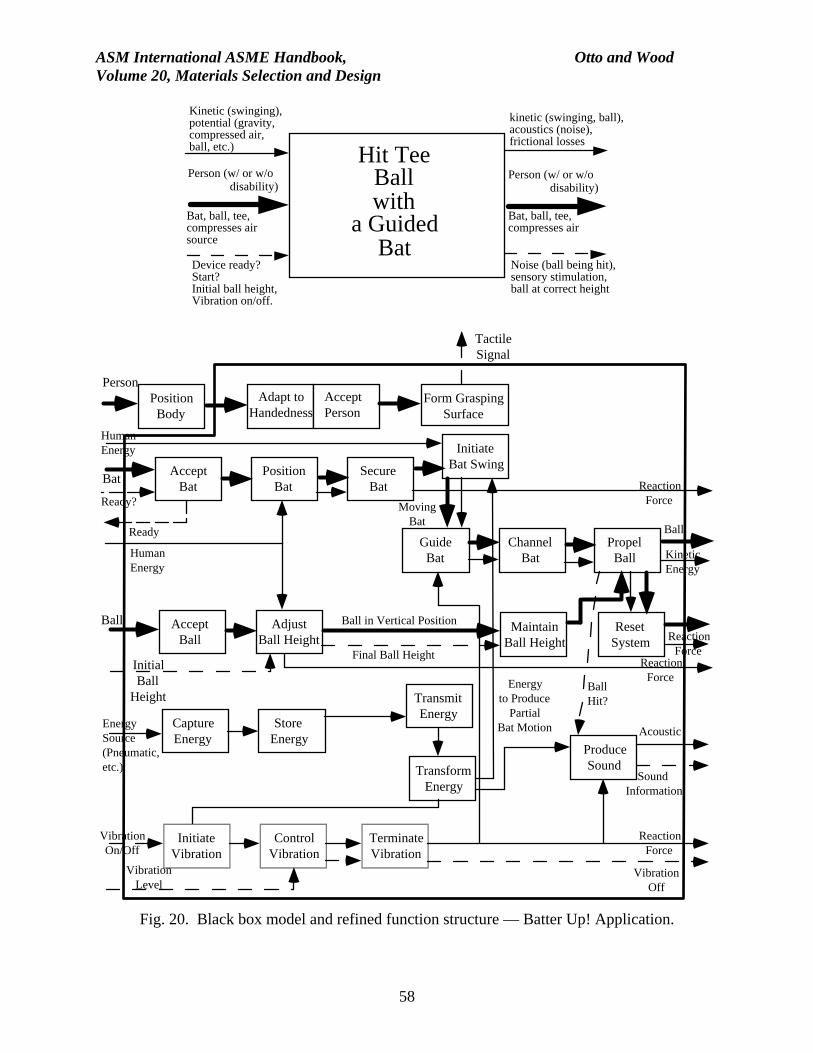
ASM International ASME Handbook, Otto and Wood Volume 20, Materials Selection and Design
58
Fig. 20. Black box model and refined function structure — Batter Up! Application.
Hit TeeBallwith
a GuidedBat
Person (w/ or w/o disability)
Kinetic (swinging),potential (gravity,compressed air,ball, etc.)
kinetic (swinging, ball),acoustics (noise),frictional losses
Device ready?Start?Initial ball height,Vibration on/off.
Noise (ball being hit),sensory stimulation,ball at correct height
Bat, ball, tee,compresses airsource
Person (w/ or w/o disability)
Bat, ball, tee,compresses air
PositionBody
PersonAdapt to
HandednessAcceptPerson
Form GraspingSurface
TactileSignal
AcceptBat
PositionBat
SecureBat
InitiateBat Swing
GuideBat
ChannelBat
PropelBall
AcceptBall
AdjustBall Height
MaintainBall Height
ResetSystem
CaptureEnergy
StoreEnergy
TransmitEnergy
TransformEnergy
InitiateVibration
ControlVibration
TerminateVibration
ProduceSound
HumanEnergy
Bat
Ready?
Ready
HumanEnergy
Ball
InitialBall
Height
EnergySource(Pneumatic,etc.)
VibrationOn/Off
VibrationLevel
Final Ball Height
BallHit?
ReactionForce
ReactionForce
ReactionForce
Acoustic
SoundInformation
ReactionForce
VibrationOff
MovingBat
Energyto Produce
PartialBat Motion
Ball in Vertical Position
Ball
KineticEnergy

ASM International ASME Handbook, Otto and Wood Volume 20, Materials Selection and Design
59
Fig. 21. Selected Design Concept for Beta Functional Prototype — Batter Up! Application.
5 Gal.Air Tank
Valve
Regulator
HeightAdjustment
Bat
Ball
CoatedGuide Line
CollapsibleSupport
Structure
AirJet
2 Degreesof Freedom
Eyelet &Swivle
Location forRemovable Tactile
Grips
Hose
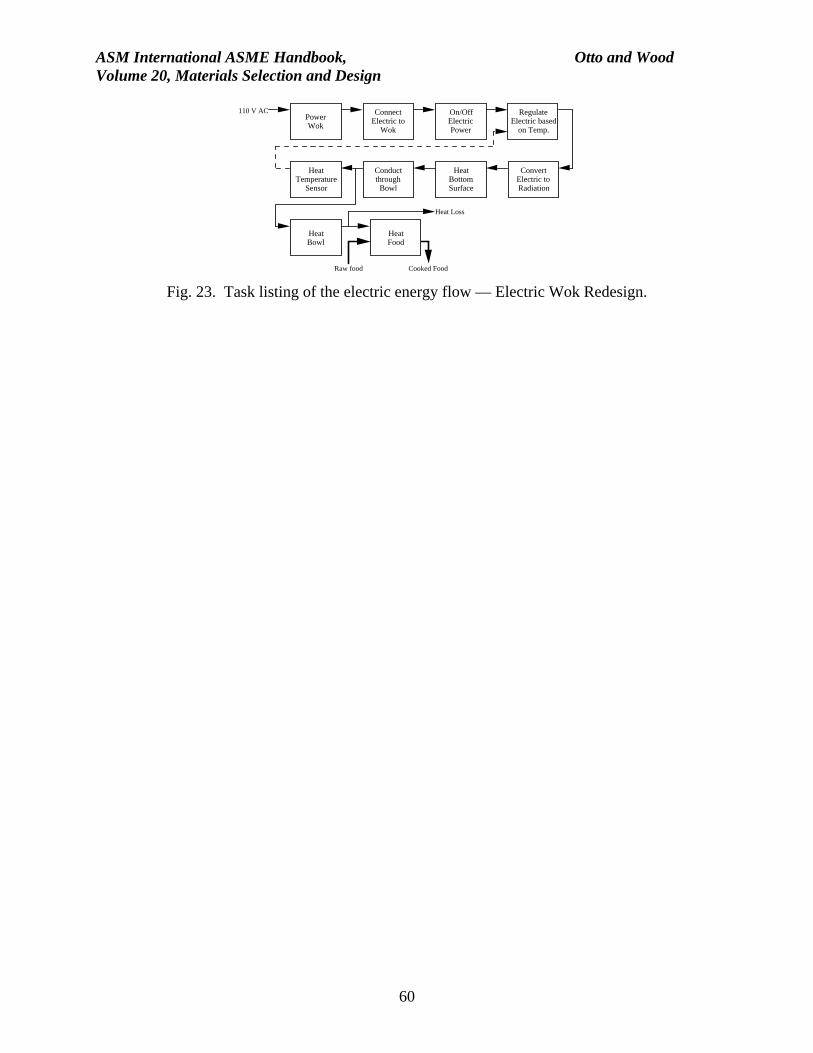
ASM International ASME Handbook, Otto and Wood Volume 20, Materials Selection and Design
60
Fig. 23. Task listing of the electric energy flow — Electric Wok Redesign.
110 V AC
Heat Loss
Raw food Cooked Food
Power Wok
Connect Electric to
Wok
On/Off Electric Power
Regulate Electric based
on Temp.
Convert Electric to Radiation
Heat Bottom Surface
Conduct through
Bowl
Heat Temperature
Sensor
Heat Bowl
Heat Food
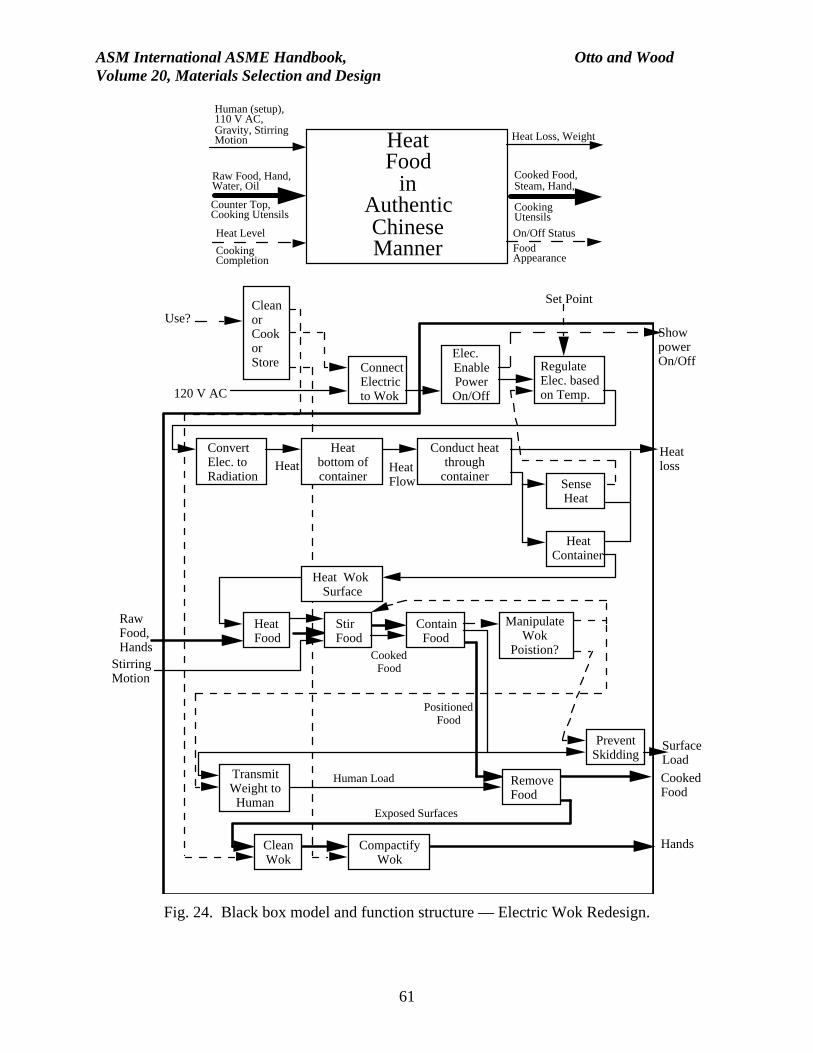
ASM International ASME Handbook, Otto and Wood Volume 20, Materials Selection and Design
61
Fig. 24. Black box model and function structure — Electric Wok Redesign.
HeatFood
inAuthenticChineseManner
Raw Food, Hand,Water, Oil
Cooked Food,Steam, Hand,
CookingUtensils
Human (setup),110 V AC,Gravity, StirringMotion Heat Loss, Weight
Heat Level On/Off Status
CookingCompletion
FoodAppearance
Counter Top,Cooking Utensils
Stirring Motion
Clean or Cook or Store Connect
Electric to Wok
Use?
120 V AC
Elec. EnablePower On/Off
Regulate Elec. based on Temp.
Convert Elec. to Radiation
Show power On/Off
Heat bottom of container
Conduct heat through
container
Heat loss
SenseHeat
Heat Container
Heat Wok Surface
Heat Food
Raw Food, Hands
Stir Food
Contain Food
Manipulate Wok
Poistion?
Transmit Weight to Human
Prevent Skidding
Surface Load
Cooked Food
Clean Wok
Remove Food
Compactify Wok
Hands
Heat
Cooked Food
Exposed Surfaces
Human Load
Set Point
Heat Flow
Positioned Food
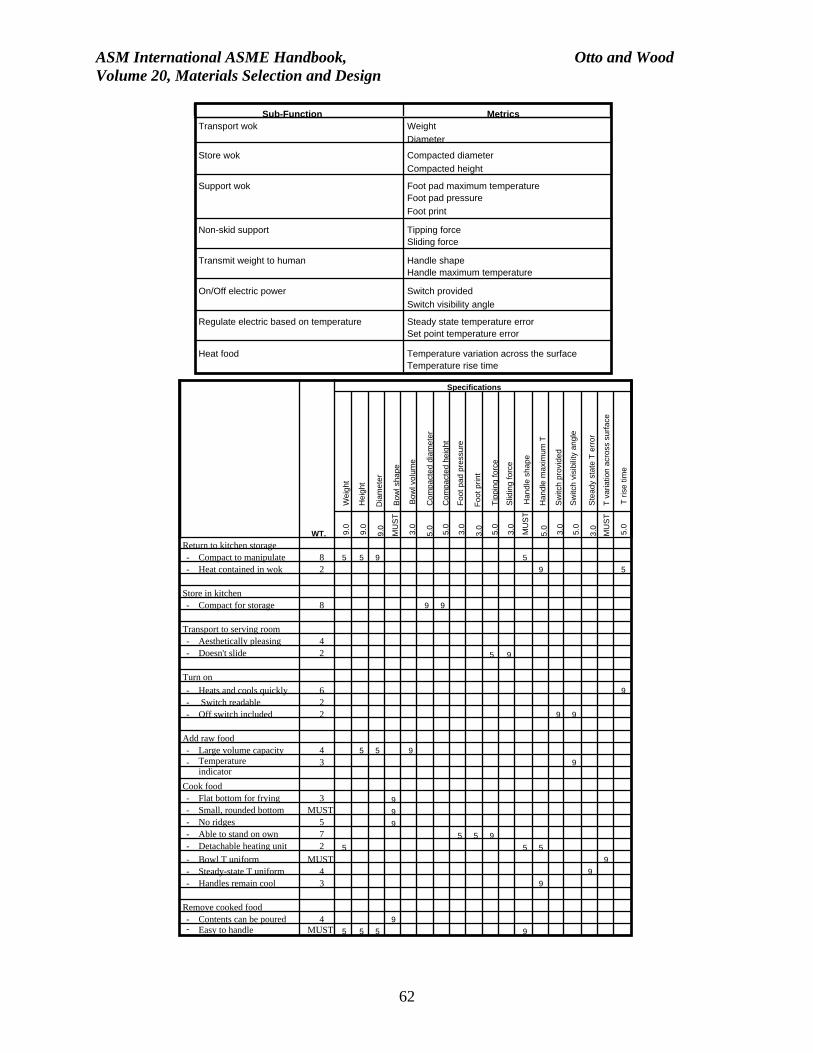
ASM International ASME Handbook, Otto and Wood Volume 20, Materials Selection and Design
62
Sub-Function MetricsTransport wok Weight
Diameter
Store wok Compacted diameter
Compacted height
Support wok Foot pad maximum temperatureFoot pad pressure
Foot print
Non-skid support Tipping forceSliding force
Transmit weight to human Handle shapeHandle maximum temperature
On/Off electric power Switch provided
Switch visibility angle
Regulate electric based on temperature Steady state temperature errorSet point temperature error
Heat food Temperature variation across the surfaceTemperature rise time
Specifications
We
igh
t
He
igh
t
Dia
me
ter
Bo
wl s
ha
pe
Bow
l vol
ume
Co
mp
act
ed
dia
me
ter
Co
mp
act
ed
he
igh
t
Fo
ot
pa
d p
ress
ure
Fo
ot
prin
t
Tip
pin
g f
orc
e
Slid
ing
forc
e
Ha
nd
le s
ha
pe
Ha
nd
le m
axi
mu
m T
Sw
itch
pro
vid
ed
Sw
itch
visi
bilit
y an
gle
Ste
ad
y st
ate
T e
rro
r
T v
aria
tion
acro
ss s
urfa
ce
T r
ise
time
WT. 9.0
9.0
9.0
MU
ST
3.0
5.0 5.0
3.0
3.0 5.0
3.0
MU
ST
5.0 3.0
5.0
3.0
MU
ST
5.0
Return to kitchen storage - Compact to manipulate 8 5 5 9 5
- Heat contained in wok 2 9 5
Store in kitchen - Compact for storage 8 9 9
Transport to serving room - Aesthetically pleasing 4 - Doesn't slide 2 5 9
Turn on
- Heats and cools quickly 6 9
- Switch readable 2 - Off switch included 2 9 9
Add raw food - Large volume capacity 4 5 5 9
- Temperature indicator
3 9
Cook food - Flat bottom for frying 3 9 - Small, rounded bottom MUST 9 - No ridges 5 9 - Able to stand on own 7 5 5 9 - Detachable heating unit 2 5 5 5
- Bowl T uniform MUST 9
- Steady-state T uniform 4 9
- Handles remain cool 3 9
Remove cooked food - Contents can be poured 4 9 - Easy to handle MUST 5 5 5 9

ASM International ASME Handbook, Otto and Wood Volume 20, Materials Selection and Design
63
Fig. 25. Quantified specification — Electric Wok Redesign.

ASM International ASME Handbook, Otto and Wood Volume 20, Materials Selection and Design
64
Table 1. Summary of the Harvard Business Case Method.
Process Step Description 1. Problem Statement What market problem are you addressing, fixing, improving,
making more efficient, etc.? This should be limited to ONE sentence, two at the most. Only one problem can be addressed. If the problem is complex, with many interrelated subproblems, the problem should be clarified and refined to the basic (atomic) or kernel problems.
2. Assumptions: Discuss any limiting assumptions made in preparing the business case proposal, such as product costs, direction of the industry/department, etc. This step provides a clear statement of the scope of work.
3. Major Factors: List, briefly, major factors of the environment which affect the decision. This may be the state of the business (capital constraint) critical business needs or directions (strategies), etc.
4. Minor Factors: List, briefly, factors that should be considered, but are perceived as not significantly impacting the problem
5. Alternatives: List concrete or hypothesized alternatives (minimum of three) to address the problem or opportunity defined by the problem statement, assumptions, and major factors. Two or three sentences should be sufficient. Under each alternative list the advantages and disadvantages of each.
6. Discussion of Alternatives: Review each of the alternatives with respect to the stated problem, assumptions, major and minor factors. Compare alternatives and discuss the relative merits of each (in terms of cost savings/avoidance, cycle time reduction, increase in quality, and head count reduction). From this discussion, a clear leader among the alternatives, i.e., the most feasible alternative, should be identified.
7. Recommendation: State your recommendation. There should be no need to defend it; this should have been covered in the last section. If needed, elaborate on the recommendation to add clarity.
8. Implementation: Describe the implementation plan. Include resource requirements: financial, human, space, etc. Describe the time frame requirements, control and measurements that will be needed to ensure goals are met. Measurements should be tied directly to solving the problem, and adequate tracking mechanisms such as ROA, decrease in cycle time, or NPV should be used to quantify the success of the project. Contingency plans should be developed which address any high risk aspects of the solution

ASM International ASME Handbook, Otto and Wood Volume 20, Materials Selection and Design
65
Table 2. Current costs scenario — application to a finger nail clipper development.
Category Projected Cost ($)
Cost per Product ($/clipper)
Labor Costs Small Clipper:
Assembly Handling
Large Clipper Assembly Handling
Total
60,000 36,000
16,500 10,500 123,000
0.10 0.06
0.11 0.07
0.17 (avg. clipper) Fabrication Costs
Small Clipper: Materials Piece-Parts Tooling
Large Clipper Materials Piece-Parts Tooling
Total
96,000 72,000 6,000
30,000 21,000 4,500
229,500
0.16 0.12 0.01
0.20 0.14 0.03
0.31 (avg. clipper) Subtotal (on-going costs) 352,500
Engineering Costs: Avg. 10 weeks per product
173,600
0.23
Total Cost 526,100 0.71 (avg. clipper)
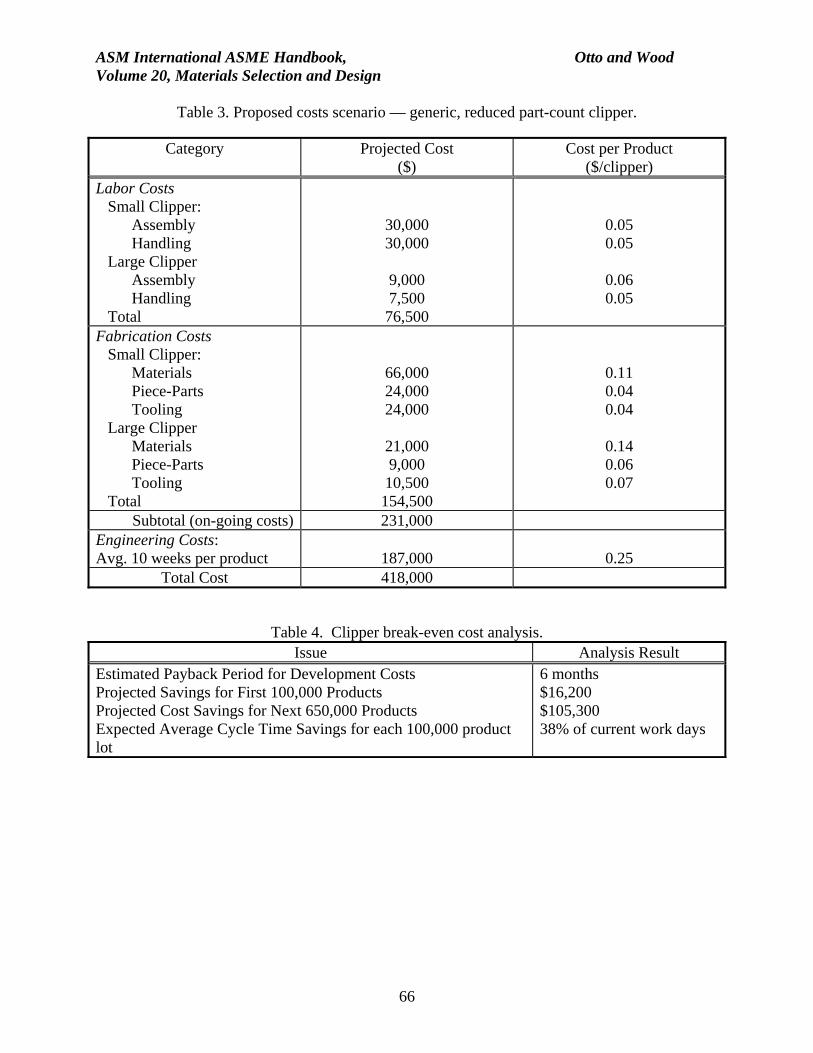
ASM International ASME Handbook, Otto and Wood Volume 20, Materials Selection and Design
66
Table 3. Proposed costs scenario — generic, reduced part-count clipper.
Category Projected Cost ($)
Cost per Product ($/clipper)
Labor Costs Small Clipper:
Assembly Handling
Large Clipper Assembly Handling
Total
30,000 30,000
9,000 7,500 76,500
0.05 0.05
0.06 0.05
Fabrication Costs Small Clipper:
Materials Piece-Parts Tooling
Large Clipper Materials Piece-Parts Tooling
Total
66,000 24,000 24,000
21,000 9,000 10,500 154,500
0.11 0.04 0.04
0.14 0.06 0.07
Subtotal (on-going costs) 231,000 Engineering Costs: Avg. 10 weeks per product
187,000
0.25
Total Cost 418,000
Table 4. Clipper break-even cost analysis. Issue Analysis Result
Estimated Payback Period for Development Costs Projected Savings for First 100,000 Products Projected Cost Savings for Next 650,000 Products Expected Average Cycle Time Savings for each 100,000 product lot
6 months $16,200 $105,300 38% of current work days

ASM International ASME Handbook, Otto and Wood Volume 20, Materials Selection and Design
67
Table 5. Examples of common energy flows. displacement rotation linear force
power time stress deflection/strain vibration torque
electricity magnetism heat human force pneumatic noise friction force oscillating force hydraulic solar energy sound (acoustic) pressure
light
Table 6. Basic device/product function (active verb) classes.
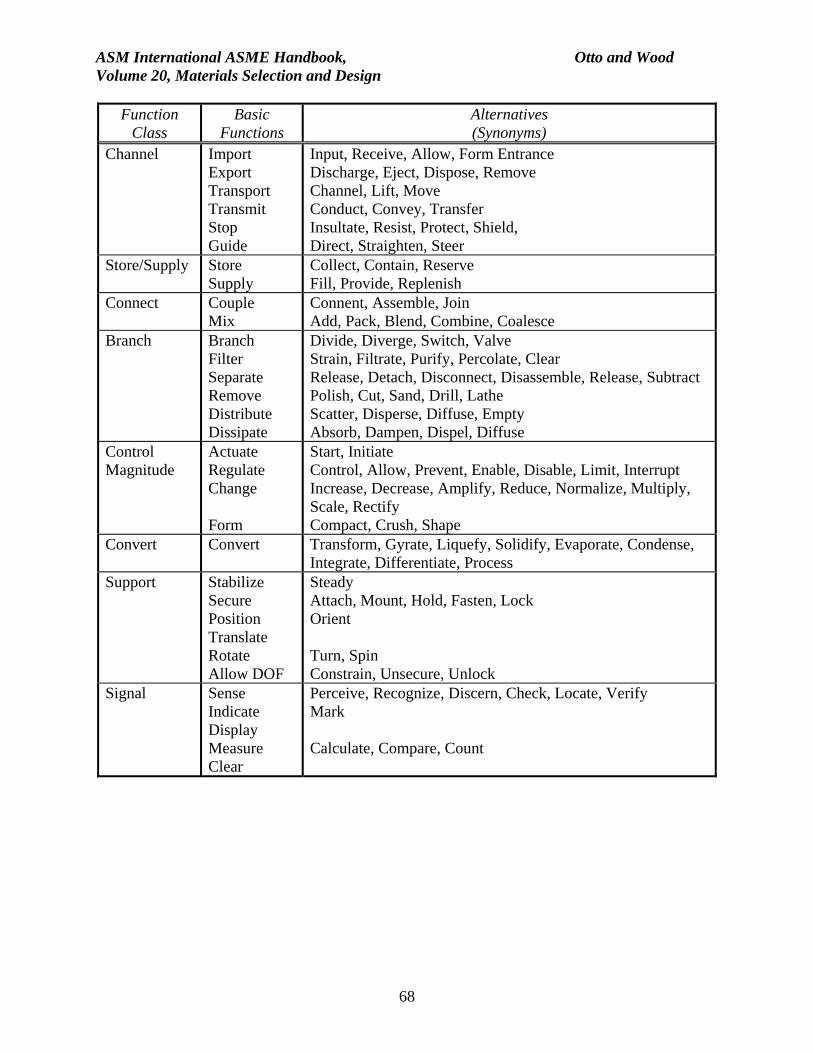
ASM International ASME Handbook, Otto and Wood Volume 20, Materials Selection and Design
68
Function Class
Basic Functions
Alternatives (Synonyms)
Channel Import Export Transport Transmit Stop Guide
Input, Receive, Allow, Form Entrance Discharge, Eject, Dispose, Remove Channel, Lift, Move Conduct, Convey, Transfer Insultate, Resist, Protect, Shield, Direct, Straighten, Steer
Store/Supply Store Supply
Collect, Contain, Reserve Fill, Provide, Replenish
Connect Couple Mix
Connent, Assemble, Join Add, Pack, Blend, Combine, Coalesce
Branch Branch Filter Separate Remove Distribute Dissipate
Divide, Diverge, Switch, Valve Strain, Filtrate, Purify, Percolate, Clear Release, Detach, Disconnect, Disassemble, Release, Subtract Polish, Cut, Sand, Drill, Lathe Scatter, Disperse, Diffuse, Empty Absorb, Dampen, Dispel, Diffuse
Control Magnitude
Actuate Regulate Change Form
Start, Initiate Control, Allow, Prevent, Enable, Disable, Limit, Interrupt Increase, Decrease, Amplify, Reduce, Normalize, Multiply, Scale, Rectify Compact, Crush, Shape
Convert Convert
Transform, Gyrate, Liquefy, Solidify, Evaporate, Condense, Integrate, Differentiate, Process
Support Stabilize Secure Position Translate Rotate Allow DOF
Steady Attach, Mount, Hold, Fasten, Lock Orient Turn, Spin Constrain, Unsecure, Unlock
Signal Sense Indicate Display Measure Clear
Perceive, Recognize, Discern, Check, Locate, Verify Mark Calculate, Compare, Count

ASM International ASME Handbook, Otto and Wood Volume 20, Materials Selection and Design
69
Table 7. Definitions of device/product function classes. Function Class Definition
Channel to cause a direction of travel or path for a material or energy.
Store/Supply to accumulate or provide material or energy.
Connect to join two or more flows (materials or energies).
Branch to cause a material or energy to no longer be joined or mixed.
Control
Magnitude
to alter or maintain the size or amplitude or material or energy.
Convert to change from one form of flow type to another (e.g., one energy type to another energy type).
Support to secure firmly a material or energy path into a defined location.
Signal to provide information to, within, or out of the system boundary.
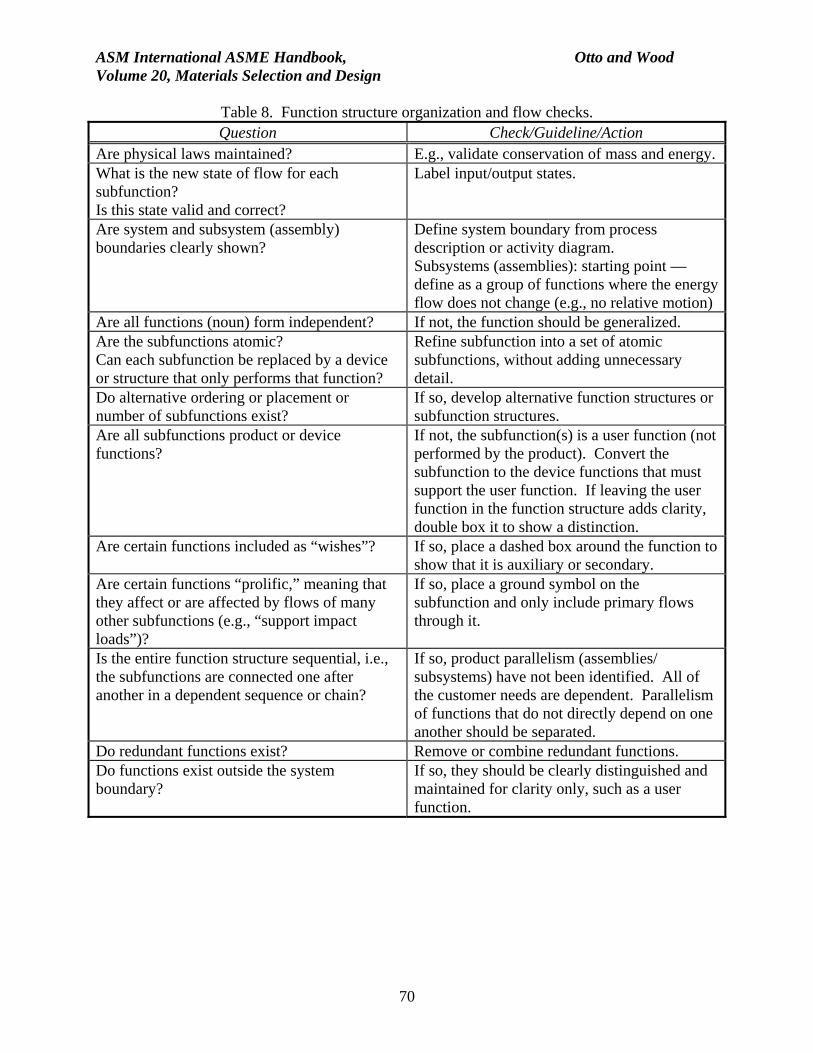
ASM International ASME Handbook, Otto and Wood Volume 20, Materials Selection and Design
70
Table 8. Function structure organization and flow checks. Question Check/Guideline/Action
Are physical laws maintained? E.g., validate conservation of mass and energy. What is the new state of flow for each subfunction? Is this state valid and correct?
Label input/output states.
Are system and subsystem (assembly) boundaries clearly shown?
Define system boundary from process description or activity diagram. Subsystems (assemblies): starting point — define as a group of functions where the energy flow does not change (e.g., no relative motion)
Are all functions (noun) form independent? If not, the function should be generalized. Are the subfunctions atomic? Can each subfunction be replaced by a device or structure that only performs that function?
Refine subfunction into a set of atomic subfunctions, without adding unnecessary detail.
Do alternative ordering or placement or number of subfunctions exist?
If so, develop alternative function structures or subfunction structures.
Are all subfunctions product or device functions?
If not, the subfunction(s) is a user function (not performed by the product). Convert the subfunction to the device functions that must support the user function. If leaving the user function in the function structure adds clarity, double box it to show a distinction.
Are certain functions included as “wishes”? If so, place a dashed box around the function to show that it is auxiliary or secondary.
Are certain functions “prolific,” meaning that they affect or are affected by flows of many other subfunctions (e.g., “support impact loads”)?
If so, place a ground symbol on the subfunction and only include primary flows through it.
Is the entire function structure sequential, i.e., the subfunctions are connected one after another in a dependent sequence or chain?
If so, product parallelism (assemblies/ subsystems) have not been identified. All of the customer needs are dependent. Parallelism of functions that do not directly depend on one another should be separated.
Do redundant functions exist? Remove or combine redundant functions. Do functions exist outside the system boundary?
If so, they should be clearly distinguished and maintained for clarity only, such as a user function.
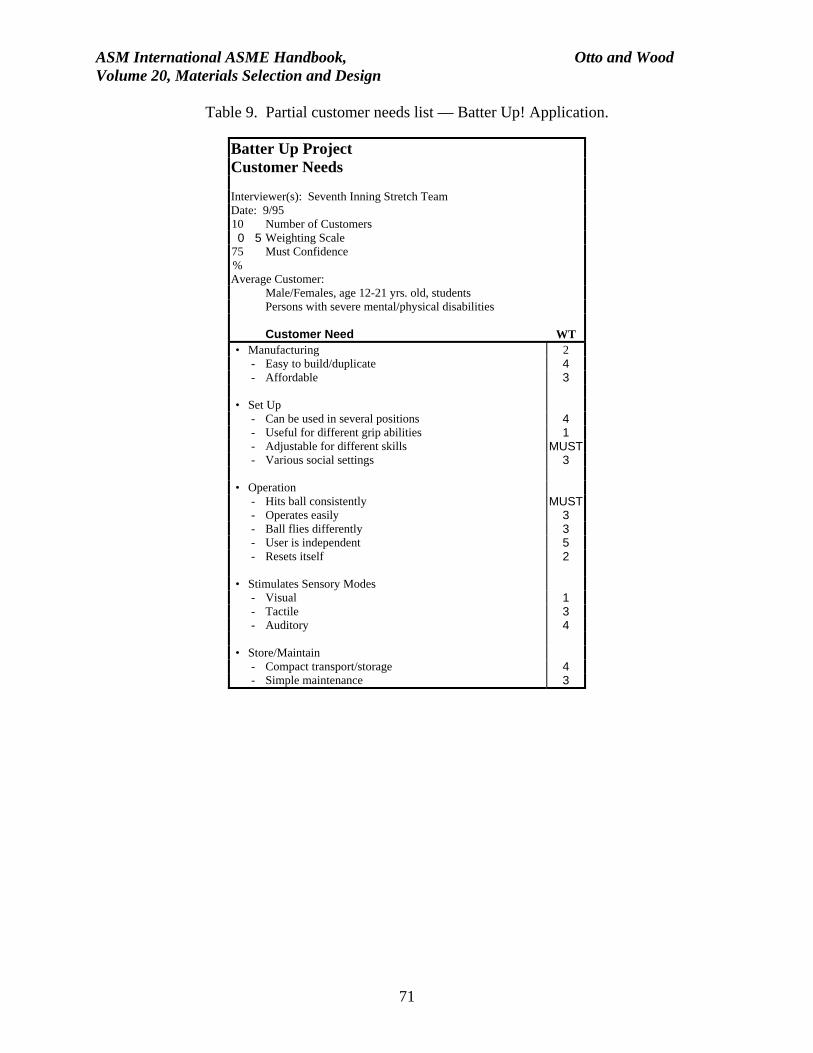
ASM International ASME Handbook, Otto and Wood Volume 20, Materials Selection and Design
71
Table 9. Partial customer needs list — Batter Up! Application.
Batter Up Project
Customer Needs
Interviewer(s): Seventh Inning Stretch Team Date: 9/95 10 Number of Customers 0 5 Weighting Scale
75%
Must Confidence
Average Customer: Male/Females, age 12-21 yrs. old, students Persons with severe mental/physical disabilities
Customer Need WT • Manufacturing 2 - Easy to build/duplicate 4 - Affordable 3 • Set Up - Can be used in several positions 4 - Useful for different grip abilities 1 - Adjustable for different skills MUST - Various social settings 3 • Operation - Hits ball consistently MUST - Operates easily 3 - Ball flies differently 3 - User is independent 5 - Resets itself 2 • Stimulates Sensory Modes - Visual 1 - Tactile 3 - Auditory 4 • Store/Maintain - Compact transport/storage 4 - Simple maintenance 3

ASM International ASME Handbook, Otto and Wood Volume 20, Materials Selection and Design
72
Table 10. Partial morphological matrix — Batter Up! Application.
Functions Mechanical Hydraulic Electrical Misc. Adapt to
Handedness Gears, Pulleys, Wheels, Pegs, Pins
Water / Air Pressure
Solenoid, Servo Motor
Accept Person Walking, Rolling to Product
Riding a Water Wave, Flying
Accept Bat Slot, Groove, Hole, Guide Rail, Ridge
Fluid Suction Magnetic Attraction
Position Bat Pegs, Axis Movement
Piston Cylinder Solenoid, Servo Motor
Magnets
Secure Bat Clamp, Vice, Belt, Brace, Latch
Fluid Suction Electrical Charge (Static Cling)
Velcro, Magnets, Adhesion
Initiate Bat Swing Conveyor, Lift, Mechanical Impulse, Catapult
Water Jet, Piston Cylinder
Electrical Impulse Magnetic Repulsion
Guide Bat Guide Rails, Parallel Plates, Friction, Loop on Bat, String, Hole in Bat
Jet Stream Magnetic Restriction / Attraction
Channel Bat Human Input, Gravity, String
Air Flow, Water Pressure
Magnets, Explosion
Accept Ball Mount, Cartridge, Hoop
Tube
Adjust Ball Height Jack, Pegs, Pulley System, Lever
Air Pressure Electric Current Magnets, Explosion
Maintain Ball Height
Clamp, Mount Air Pressure, Fluid Suction
Magnets, Adhesion
Propel Ball Loop, Impact Air Suction, Jet Stream, Water Pressure
Magnetic Attraction, Explosion
Accept Energy Lever, Four Bar, Crankshaft, Rope
Tube, Pipe, Fan, Windmill,
Electrical Inlets Metal Surfaces, Panels, Fuses
Store Energy Translational / Rotational Spring, Material Deformation, Rubber Band, Pendulum, Bat Movement
Fluid Column, Compressed Air (Balloon, Bladder)
Batteries, Capacitor
Magnetic Field, Solar Panels, Chemical
Transform Energy Gears, Belt / Sprocket, Lever, Four Bar, Cam, Rack and Pinion, Universal Joint
Piston Cylinder Motor, Generator
Transmit Energy Linkages Bearings Pipe, Volume Deformation
Wires, Volt Potential Energy
Magnetic Field
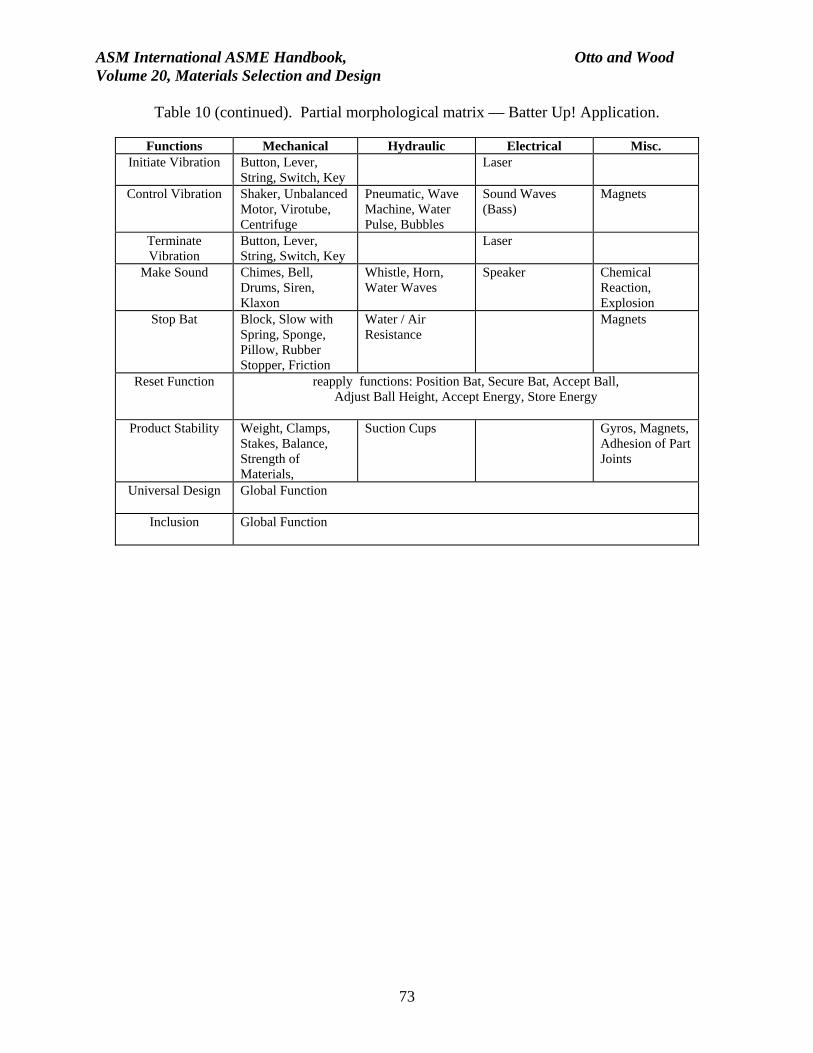
ASM International ASME Handbook, Otto and Wood Volume 20, Materials Selection and Design
73
Table 10 (continued). Partial morphological matrix — Batter Up! Application.
Functions Mechanical Hydraulic Electrical Misc. Initiate Vibration Button, Lever,
String, Switch, Key Laser
Control Vibration Shaker, Unbalanced Motor, Virotube, Centrifuge
Pneumatic, Wave Machine, Water Pulse, Bubbles
Sound Waves (Bass)
Magnets
Terminate Vibration
Button, Lever, String, Switch, Key
Laser
Make Sound Chimes, Bell, Drums, Siren, Klaxon
Whistle, Horn, Water Waves
Speaker Chemical Reaction, Explosion
Stop Bat Block, Slow with Spring, Sponge, Pillow, Rubber Stopper, Friction
Water / Air Resistance
Magnets
Reset Function reapply functions: Position Bat, Secure Bat, Accept Ball, Adjust Ball Height, Accept Energy, Store Energy
Product Stability Weight, Clamps,
Stakes, Balance, Strength of Materials,
Suction Cups Gyros, Magnets, Adhesion of Part Joints
Universal Design Global Function
Inclusion Global Function

ASM International ASME Handbook, Otto and Wood Volume 20, Materials Selection and Design
74
Table 11. Partial customer needs list — Electric Wok Redesign.
PROJECT: ELECTRIC WOKCustomer Needs
Interviewer(s): Date: Number of Customers: 9Weighting Scale: 1 - 10Average Customer:
Male/Females, age 20-30, Attending college, Small apartment kitchen, No automatic dishwashing equipment
Customer Need WT
• Purchase - Cost 7
• Transport in package
• Unpackage
• Clean - Non-stick surface 7 - Watertight 3
Detachable from the heating unit
3
• Return to kitchen storage - Compact for easy manipulation 8 - Heat contained in wok 2 - Impact resistant 5
• Store in kitchen - Compact for small
storage8
• Remove from kitchen storage
• Transport to serving room - Aesthetically pleasing 4 - Doesn't slide on tabletop 2
• Turn on - Heats and cools quickly 6 - Long extension cord 6 - Temperature switch readable 2 - Off switch included 2
• Add raw food - Large volume capacity 4 - Temperature indicator 3 - Temperature controls remain cool/don't get
hot2
• Cook food - Flat bottom for frying 3 - Small, rounded bottom for stir-fry MUST - No ridges on inner surface 5 - Able to stand on own 7 - Detachable heating unit to remove heat when cooking 2 - Temperature uniform across inner surface MUST - Steady-state temperature uniform 4 - Capable of high temperature 1 - Handles remain cool/don't get hot 3
• Remove cooked food - Contents can be poured out 4 - Easy to handle MUST
• Throw out
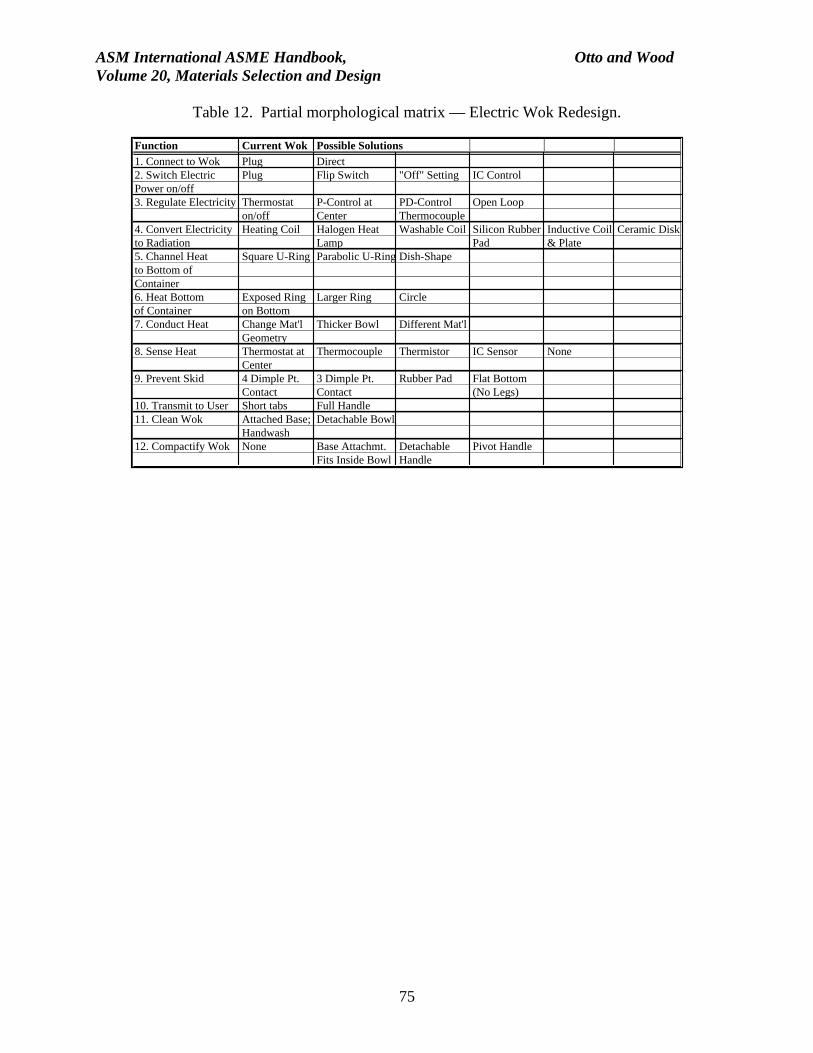
ASM International ASME Handbook, Otto and Wood Volume 20, Materials Selection and Design
75
Table 12. Partial morphological matrix — Electric Wok Redesign.
Function Current Wok Possible Solutions
1. Connect to Wok Plug Direct2. Switch Electric Plug Flip Switch "Off" Setting IC ControlPower on/off3. Regulate Electricity Thermostat P-Control at PD-Control Open Loop
on/off Center Thermocouple4. Convert Electricity Heating Coil Halogen Heat Washable Coil Silicon Rubber Inductive Coil Ceramic Diskto Radiation Lamp Pad & Plate5. Channel Heat Square U-Ring Parabolic U-Ring Dish-Shapeto Bottom ofContainer6. Heat Bottom Exposed Ring Larger Ring Circleof Container on Bottom7. Conduct Heat Change Mat'l Thicker Bowl Different Mat'l
Geometry8. Sense Heat Thermostat at Thermocouple Thermistor IC Sensor None
Center9. Prevent Skid 4 Dimple Pt. 3 Dimple Pt. Rubber Pad Flat Bottom
Contact Contact (No Legs)10. Transmit to User Short tabs Full Handle11. Clean Wok Attached Base; Detachable Bowl
Handwash12. Compactify Wok None Base Attachmt. Detachable Pivot Handle
Fits Inside Bowl Handle