1997 data book - ed
TRANSCRIPT
ED 422 097
AUTHORTITLEINSTITUTIONISBNPUB DATENOTEAVAILABLE FROM
PUB TYPE
EDRS PRICEDESCRIPTORS
IDENTIFIERS
ABSTRACT
well-being ofracial/ethnicchildren, thepercentage of1,000 births;
DOCUMENT RESUME
PS 026 787
Cunningham, Michelle DoucetteConnecticut's Children: A Cause for Hope. 1997 Data Book.Connecticut Association for Human Services, Hartford.ISBN-1-885144-12-11997-00-00138p.
Connecticut Association for Human Services, 110 BartholomewAvenue, Suite 4030, Hartford, CT 06106; phone: 860-951-2212.Numerical/Quantitative Data (110) Reports Descriptive(141)
MF01/PC06 Plus Postage.Academic Achievement; Adolescents; Age Differences; BirthWeight; Child Abuse; *Child Health; Child Neglect; ChildWelfare; Children; Crime; Demography; Dropouts; EarlyParenthood; Elementary Secondary Education; Family(Sociological Unit); High School Students; Incidence;Mortality Rate; One Parent Family; *Poverty; Prenatal Care;*Social Indicators; State Surveys; Statistical Surveys;Tables (Data); Trend Analysis; Violence; Welfare Services;*Well Being; Youth ProblemsArrests; Child Mortality; *Connecticut; *Indicators
This KIDS COUNT data book examines statewide trends in theConnecticut's children. After listing the regional population,background, poverty status, and family setting of Connecticut'sstatistical report examines 13 indicators of well-being: (1)
children receiving welfare benefits; (2) low birth weight per(3) infant mortality rate; (4) percentage of births with late
or no prenatal care; (5) percentage of all births to teen mothers; (6) childdeath rate; (7) percentage of students meeting Connecticut Mastery Testgoals; (8) percentage of tenth graders well below the Connecticut AcademicPerformance Test standard; (9) percentage of all students grades 9-12 who arehigh school dropouts; (10) juvenile violent crime arrest rate; (11) childabuse/neglect rates; (12) teen death rate; and (13) child poverty. Section 1of the report summarizes recent brain development research and the waysdevelopment is hindered or helped by the environment. Sections 2 and 3present child well-being indicators, organized by indicator and region,respectively. The document concludes with an explanation of terms andmethodology. Findings indicate that about 19 percent of children live inpoverty. In the last 10 years, there has been a slight worsening of the lowbirth weight rate, improvements in infant mortality, an increase in thepercentage of mothers receiving prenatal care, and a decrease in thepercentage of all births to teenage mothers. In 1995-96, 30 percent of sixthgraders met state goals on the Connecticut Mastery Test. The dropout rateimproved slightly during the past 5 years. The juvenile violent crime arrestrate per 100,000 increased from 1991-92 to 1995-96. (Contains 22 references.)(KB)
U.S
. DE
PA
RT
ME
NT
OF
ED
UC
AT
ION
Offi
ce o
f Edu
catio
nal R
esea
rch
and
Impr
ovem
ent
ED
UC
AT
ION
AL
RE
SO
UR
CE
SIN
FO
RM
AT
ION
CE
NT
ER
(E
RIC
)%
Thi
s do
cum
ent h
as b
een
repr
oduc
edas
rece
ived
from
the
pers
on o
r orga
niza
tion
orig
inat
ing
it.
0 M
inor
cha
nges
hav
e be
enm
ade
toim
prov
e re
prod
uCtiO
n qu
ality
.
Poi
nts
of v
iew
or
opin
ions
sta
ted
inth
isdo
cum
ent d
o no
t nec
essa
rily
reP
rese
ntof
ficia
l OE
RI p
ositi
on o
rpo
licy.
wr
Con
nect
icut
s L
nuar
en:
A C
ause
for
Hop
e
.r17
,1,
-
2
hi$
//ii
iftf,
CA
HS
1997
Dat
a B
ook
1
PE
RM
ISS
ION
TO
RE
PR
OD
UC
E A
ND
DIS
SE
MIN
AT
E T
HIS
MA
TE
RIA
L H
AS
BE
EN
GR
AN
TE
D B
Y
?CA
VA
GXcm
-C\-
TO
TH
E E
DU
CA
TIO
NA
L R
ES
OU
RC
ES
INF
OR
MA
TIO
N C
EN
TE
R (
ER
IC)
3

Con
nect
icut
Ass
ocia
tion
for
Hum
an S
ervi
ces
Exe
cutiv
e B
oard
Pres
iden
tC
orne
ll Sc
ott,
New
Ha
Vel
lE
xecu
tive
Dir
ecto
rH
ill H
ealth
Cen
ter
1st V
ice
Pres
iden
tR
ober
t A. S
olom
on, E
sq.,
Ham
den
Ass
ocia
te P
rofe
ssor
Yal
e U
nive
rsity
Law
Sch
ool
Secr
etar
yPa
mel
a A
. Kop
row
ski,
Stam
ford
Dir
ecto
r, P
ublic
Aff
airs
Cha
mpi
on I
nter
natio
nal C
orpo
ratio
n
Tre
asur
erJo
hn G
. Pol
k, E
asto
nPr
inci
pal
Polk
Con
sulti
ng
Kay
e E
. Bar
ker,
Dar
ien
Soci
al W
orke
r, P
sych
olog
ist
Will
iam
J. C
ibes
, Jr.
, Wes
t Har
tfor
dC
hanc
ello
rC
onne
ctic
ut S
tate
Uni
vers
ity S
yste
m
June
Goo
dman
, Dan
bury
Pres
iden
tM
aria
n A
nder
son
Aw
ards
Mic
hael
R. R
ion,
Wes
t Har
tfor
dPr
inci
pal
Res
ourc
es f
or E
thic
s an
d M
anag
emen
t
Dor
othy
Wei
ss, E
ast H
ampt
onC
omm
unity
Lea
der
Staf
fPa
ul G
ionf
ridd
o, E
xecu
tive
Dir
ecto
rM
illi S
anch
ez A
rnol
dJu
dy B
lei
Mic
hele
Car
lson
Judi
th C
arro
llM
iche
lle D
ouce
tte C
unni
ngha
mJu
dy D
emar
est
Lyn
ne D
ykst
raA
ntoi
nette
M. E
lliso
nSh
elle
y S.
Jer
ige
Dor
othy
Kav
anag
hD
iane
Lew
isC
ecile
J. M
artin
Susa
n L
. McC
lain
Mir
anda
McG
uire
-Sch
war
tzSa
ra P
arke
r M
cKer
nan
Mar
tha
L. R
enni
eK
ate
Rob
inso
nSu
san
Schu
lthei
ssM
icha
el S
ulliv
anSa
rah
J. T
erri
llC
athe
rine
Ver
rent
iSh
anno
n W
ilson
5

7 ....tit, *0'444 W:..VtiT4,4 ...
.44Nt 'pf`ftN,54( !,;
"f*"
As 5
t
r,
V,
'
. t tt ' g v. ''.. / i 0 , 'ii7
0 4W ii
i.4 , 4qtr INted,. . 14 ' 1 ;./1 0 , itietr %....1111b 1ii .0 i ,06yzog..- ..-m.....
' ''"..' %**figg"... _....f /1 I" 1.7 ...-
A
"a" il, 1.,
.:).,qt
. 1'o
,_
AL.
45.
:0041";
°
4"ir.to"
at,
.11111111r.

Connecticut's Children:A Cause for Hope
1997 Data Book
Michelle Doucette Cunningham
Helen Ward. Consultant
CAHSPublished by
THE CONNECTICUT ASSOCIATION FOR HUMAN SERVICESPaul Gionfriddo, Executive Director
0
Acknowledgments
First and foremost, we would like to thank the Annie E. Casey Foundation for the multi-year commitment it has made to supporting the development of this book and our entireKIDS 2000 initiative. In particular, thanks go to Doug Nelson, for his leadership, Betty Kingfor her insight, and Jennifer Baratz and Bill O'Hare for their dedication to the KIDS COUNTmission.
Many people within the Connecticut Departments of Children and Families, Education,Public Health, Public Safety, and Social Services were incredibly helpful in their provisionof data and technical advice. Special thanks go to them as well.
This book would not have been possible without the professional guidance :Ind personalsupport of the staff at CAHS. They are the best group of people with whom one couldever hope to work. Their sense of humor, the depth of their caring for each other, andtheir commitment to making the world a better place is inspiring. Each of them hasearned our undying admiration and gratitude. Extra special thanks go to Lynne Dykstrawho did an amazing job on the design and layout for the 1997 book.
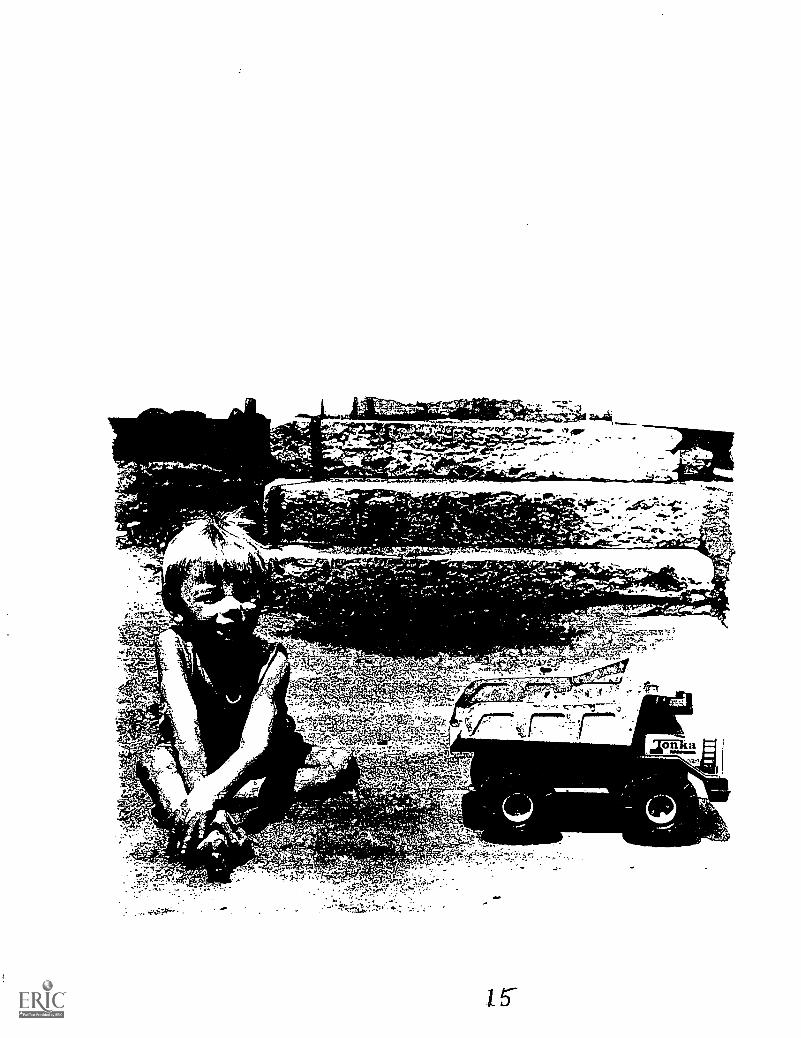
Photographs byLynne Dykstra -Cover lower left
Frances Havilland -Cover upper right, opposite title page and page 64All other photographs by Sandy Hale
Printed in the United States of AmericaSeptember 1997, First Edition
The photographs in this book are used for illustrative purposes only and are not imended to imply anyrelationship between the persons photographed and the subject matter discussed.
ISBN 1-885144-12-1Copyright 1997. Connecticut Association for Human Services
110 Bartholomew Avenue, Suite 4030 Hartford. Connecticut 06106 - (860) 951-2212
Permission to copy, disseminate, or otherwise use information from this hook is granted as long asConnecticut's children: cause fbr Hope. 1997 Data Book. Connecticut Association for Human Services is credited.
BEST COPY AVAILABLE

Overview ofContents
This book is divided into five sections:
The Introduction by CAHS's Executive Director, PaulGionfriddo.
The Development of the Human Brain: NewKnowledge and New Implications is a summary of thelatest research on the development of children, and howthe physical development of their brains is helped orhindered by their environments.
The Child Well-Being Indicators section is made up of15 important indicators of the well-being of children andtwo demographic measures. Each indicator is aseparate table, comparing different cities and regions ofthe state. Regions with rates worse than the statewiderate are highlighted. Indexes to the towns and regions,and a map of these regions, are included at thebeginning of this section.
In the Regional Indicators section the same child well-being information is presented, but it is organized byregion instead of by indicator. Where possible, the ratefor the region is shown as a percentage better or worsethan the statewide rate. This section allows readers tosee, at a glance, how well children are faring in theirregion of the state.
An explanation of the Terms and Methodology used inthe indicators sections appears at the back of the book.
1 0
:

11^-kt,.14ia. d ;:..1,
1 'f-7. '
/,
'
,
44

Introduction
For all of us who care about children and the world in which they grow, this is proving to be anextraordinary time
in unfortunately negative ways. The state and federal welfare reforms of 1995 and 1996 have become harsh
reminders to children that their safety nets are in tatters. Because of the neglect of parents or government orboth, some children will need to fend for themselves as they grow up.
In recent years, the expansions of Medicaid eligibility for children and the promise of new health insuranceprograms have been wonderful news to Connecticut's 80,000 uninsured children. These programs carry thepromise of more access to health care and more money to pay for it. With some exceptions, however,government's
willingness to answer the needs of children has been curiously absent at a time when the most sustained economic
recovery in recent memory has yielded state and federal balanced budgets and plenty of opportunity to "grow
the economy."
This edition of Connecticut's Children calls attention to the irony of our neglect of children. As policies take onharder edges, a new field of brain research has blossomed which entwines tightly together the growth and
development of children with investments in children at the state and federal levels.
In a way, this book is about that research, but it is decidedly not just a book for researchers. It is a book for
children's policy makers, policy thinkers, and policy advocates, because it summarizes that research and ties it to
real programs and practices that make a difference in children's lives.
This book invites the reader to ask questions about this new and exciting research. What does it mean for policy
makers? What can government do to address risk factors in our children's lives? What can policy leaders do to
prevent children from suffering from a lack of stimulation and nurturing care and to ameliorate the damage done
when parent or society neglects the child?

Lately, some policy leaders have claimed that government can do very littlethat the responsibility is squarelyand securely on the shoulders of families and friends. Now, however, we can all actually see the physical proof inbrain research of the cost to children of poverty and neglect. As concern over the emotional and cognitive abilitiesof our children grows, and as evidence mounts that interventions with families and children can have lastingeffects, it is impossible to argue that the government should not be more active.
It is impossible to say that government should not dedicate itself anew to creating an environment in which ournext generation can thrive from birth to death.
This book may not be comfortable to read this year. The data charts on children still show too many risk factors.and too few improvements over time. The research newly cited in the text shows that our continuing neglect isexacting a great toll. These things are bound to make a compassionate reader distressed, and perhaps a littlefrustrated.
However, there are wonderful hints in both the data and the text that the actions of a civil society can and willmake a difference. For that reason, we subtitled this edition A Cause For Hope. If we seize the opportunities tolearn about, to promote, and to carry out best practices in nurturing our children, we will reap the fruits of ourlabors. But (and this is a big but) we must act togethercondemning neither parent nor government for theirprior neglectfor our efforts to succeed.
Paul GionfriddoExecutive DirectorSeptember 1997

1 4
I
,sr).
1
t)
-f ;;-
-
.
n- "
.1';;'
i,I
S''':
.'s'
' f1
h.s
,k
, el .-
.;,.
-1S '
si
:I;
..1
tf
t...,r ^,
..4111t ';.:
,..,.1."';
sto
) :,'!;, 1%.1 i
11.9
) y:;lifiti4' .
.
it',)
? '''t '
lec.t17ik
-;
,..1k '.
)'Z
"-;
4,04
Y.,
V
41.1-
1,44zi:

The Development of the Human Brain:New Knowledge and New Implications
By now, millions of Americans have peered at themysterious images called PET scans that compare thebrain of a child who has been neglected with that of achild who is developing normally. We have come tounderstand that the differences they see in these blurrypicturesthe visual evidence of lower electrical activityin some sectors of the brainare indicators of seriousemotional and cognitive problems resulting fromdeprivation. These PET scans are, in effect, physicalevidence for the, arguments child development andchild care policy experts have been making for yearsthat children who fail to receive adequate stimulationand positive interactions with their adult care givers,whether at home or in a child care setting, risk losingthe opportunity to acquire the cognitive and emotionalskills needed to be successful in life.
Represented in these eerie pictures are a whole host ofpolicy implications which should be important toanyone-concerned with children's well-being and withthe future of Our state and our nation. They point to theimportance of early interventions, parent education andsupport, economic support, adequate family leavepolicies, higher standards and adequate funding forquality child care programs, efforts to address the
stresses associated with poverty that can chemicallyaffect the brains of children and place them at adisadvantage later in life. The list goes on and on.
This new research into how brains develop in the earlyyears has changed the tenor of the debate over nurtureand nature. The Families and Work Institute recentlypublished a report, Rethinking the Brain: New InsightsInto Early Development, which summarized thediscussions at its national conference on this newresearch and provided additional information on thesubject. This report is the primary source of informationfor our summary of the new brain research here) RimaShore, author of the report, described this complexrelationship between genetics and the environment:
Today, most experts on early development,whether neurobiologists or psychologists, tendto view brain development as a dynamicprocess, described by Dr. Stanley Greenspan(Clinical Professor of Psychiatry at GeorgeWashington University Medical Center) as "anelaborate dance between biology and theenvironment." But which partner leads andwhen? Is it the genetic endowment that mostseverely limits an individual's capacities? Or isit the environment?2
16

While we still don't know which plays a greater role atwhat stage in a child's development, we do know thatboth heredity and experience affect the actual physicalstructure of the brain and play a critical role in thecapacity of children to develop their cognitive andemotional abilities. What scientists now recognize is that
the kind of care parents and other care givers provideto a child has an even more important impact on thatchild's development than was previously understood.
Influences on the PhysicalStructure of the Brain
The brain of a newborn baby is made up of billions ofbrain cells or neurons. Each simple interaction with acare giver, whether a parent, relative or teacher in achild care program, sets off electrical impulses creatingsynapses (connections between brain cells) in a child'sbrain which, when repeated over time, form neural"pathways" (synapses linked together). These are thepassageways through which we learn and processinformation throughout life.
These electrical connections are created at the highestrate during the early years. By age three, a child's brainhas many more of these connections than does an adultbrain. By about age eleven, however, the brain begins
----evi"/ JiaWa lerTb e
to focus more heavily on the process of organization byshedding connections that have not been used. Neuralconnections tend to survive this winnowing process andbecome permanent only if they are repeated oftenenough during childhood through the variedexperiences provided to a child. Other connections, notactivated often enough by experience, may not survive.Early experiences, therefore, whether positive ornegative, heavily influence this process and eitherenhance or undermine the ability of children to gain ahealthy foundation for lifelong thinking, learning andsocial interaction.
The attachment between a child and parent is especiallypivotal to a child's capacity to control emotionsacritical skill for success in life. In 1991, developmental

psychologist Urie Brofenbrenner summed up theimportance of this relationship when he wrote, "[For achild to develop normallyd somebody has to beirrationally crazy about that kid."3 New research on the
brain gives Brofenbrenner's observations about theemotional development of children even greatermeaning. Healthy and secure relationships with adultshave been found to help children handle stress moreeffectively. Stress produces a hormone called cortisolwhich directly affects the brain's chemistry. If excessive
amounts of this hormone are released, alterations inthe brain can lead to fewer of those important electricalconnections being forged. Brain cells can even bedestroyed. Children who have very high levels of cortisol
are more likely to have developmental delays. Childrenwho receive primarily warm, nurturing care and aresecure in their attachments to their primary care givers,have been found to be better able to handle dailystresses and to learn from these experiences. They arealso better able to recover from major trauma. In short,loving care seems to nurture resiliency in children.4
Conditions that interfere with parents' ability to develop
these strong attachments may have a profound impacton the brain development of children. Certainly a prime
example of these conditions is clinical depression.Researchers are finding that the emotional tone of theexchanges between mother and childwhether
mothers are predominantly engaged or distant, calm orirritable, patient or impatient with their babiesaffectshow their babies' brains develop. When the babies'brain waves were monitored, those whose motherswere depressed had less activity in the frontal lobe oftheir brainsthe center for expressing and regulatingfeelings such as joy and anger. These babies had higherlevels of cortisol and were more likely to show latercognitive and behavioral problems.'
Continuing research on the development of the brainalso has led to a greater understanding of thephysiological effects of risk factors during pregnancy.These include undernutrition of the mother andexposure in utero to toxic substances such as drugs,alcohol and nicotine.
What Does a Child Learn fromHis Experiences with Adults?
The technical language used to describe this researchand the seriousness of its implications might paralyzesome parents. They may be unsure what this newknowledge means for their everyday life with theirchildren. They might ask, "Am I doing the right thing inmeeting my child's needs?" And, with even greater fear,"Have I done the right thing?" Yet what sparks the

electricity in a child's brain are really the most ordinaryacts of parentingexchanging funny faces with a tinyinfant, imitating a baby's sounds while changing herdiapers, being a willing participant in a drama aboutcastles and monsters, or giving encouragement while achild clambers up a jungle gym. However, relying onsome innate ability of parents to provide regularstimulation to their children may not be enough. Someparents may know how to nurture their children andhow to provide for their basic physical needs but maynot know how to talk to them, or play with them, orhow important those activities are.
Zero to Three: The National Center for Infants andToddlers, a Washington, D.C. organization that promotes
the importance of the first three years of life,commissioned a national survey of parents to gauge thelevel of their knowledge about child development.6 Thesurvey found that most parents do not fully understandhow their daily interactions with their children influencetheir development. When it came to learning, the vastmajority of parents surveyed (87%) did not know thattoo much stimulation could be harmful to children. They
believed that more stimulation was always better forbabies. They were not aware that the amount and kindof stimulation a baby gets should vary by his/her levelof development. A majority of parents also said theywere the least informed about the emotional
development of their children.
Parents not only need more knowledge about how toprovide for the needs of their childrenthey also needstress-free time to do so. The same survey found thathalf of the parents surveyed felt that they were-not ableto spend enough time with their children. It's the needto enable parents and child care providers, througheducation and support, to offer those experiences dayin and day out, that raises the important policy questions
discussed in the sections below.
Through vignettes, Zero to Three tries to bridge the gapbetween science and the daily life of parents and childcare providers by educating themin everyday terms,about the ways in which the quality of their interactionswith the children in their care can affect both how andwhat those children learn. The contrast between theexamples they give, especially of the approaches tocaring for the tiniest of infants, are illuminating andchilling at the same time:
At home, a young mother hears a cry from her5 week old baby in the nearby crib. It is 3 a.m.The mother's initial dismay quickly turns toanticipation of the feeding that Will now begin.The baby senses the light turned on, feels thetouches and cradling of her body and, thoughhungry, begins immediately to calm from the
19

cues that tell her that her discomfort is aboutto end. For half-an-hour the baby nurses,pausing between bursts of sucking and gazingup into her mother's eyes, woozily but withwhat the mother feels is pleasure andrecognition. During the pauses the motherspeaks softly to her new daughter. The babysmiles, watching her mother's shiftingexpressions. "Hi, Emilysweet Emilyyou arevery pretty. Were you hungry? Do you wantmore? Do you need a burp? I am glad to seeyou even if it is 3 a.m." The baby slowly beginsto drift off. Her mother puts her in the crib,kisses her, covers her, and says, "Sweetdreams."
[By contrast, another mother, ] hearing the criesfrom her baby, tenses. She has just fallen asleepafter a fight with the baby's father. The baby'scries rapidly intensify. "Oh be quiet," says themother exhaustedly. "I can't take one more
20
thing." The baby cries more and more loudly...She rolls out of bed and approaches the crib."I'm comingI'm coming..." She lifts the babyup and he quiets a bit. "Already think you canjust cry and get what you want, don't you? Thatwon't last long, I can tell you. Come onlet'sget it over with." As the baby begins to nurse,the mother stares fixedly ahead, going over therecent angry fight. The mother grows moreagitated as she recalls the details. The babyresponds to his mother's tension by squirmingrestlessly. Finally, the baby stiffens, arches,draws back from his mother's nipple and yelps."You don't want to eat? Fine, don't eat," saysthe mother, and abruptly puts the still hungrybaby back into the crib. The baby cries andthe mother feels a surge of anger. "Shut upjust shut up." The mother leaves the bedroom,shuts the door and in the kitchen turns up theradio loudly enough so that she cannot hearthe baby cry. He cries until he falls into anexhausted sleep.'
In the first scenario, the authors describe what the baby
is learning:
What is happening is utterly ordinary; a motheris feeding her baby. But what is happening tothe baby is extraordinary. Because while beingfed, she is learning about gentleness, aboutcries being answered, about her ability to makegiants come running. She is beginning to feeleffective and secure. She is beginning to sensethe subtle rhythm of exchange with her mother.

It is the beginning of learning that she is worthresponding to. that she is important, and thatsomething or someone can be counted uponS'
What is being learned in the second exchange, as theauthors describe, is very different:
This baby is also learning. He is learning thatto be handled and held can be uncomfortableand distressing; that desperate crying may leadonly to a sharp and angry voice; that his needsand wants are not important and that there isno one to count on."
Parents reading these examples might panicremembering a time when they might have been short-tempered with their child or were too preoccupied tobe fully responsive to their child's needs. That happensto all parents now and then. What matters is whetherthe relationship is predominantly positive, whether theinteraction between parent and child is typically warm,responsive and engaging.
The same contrasts can occur in a child care setting.Children can be profoundly affected by theseexperiences when they spend a substantial amount oftime in out-of-home care. In providing advice to childcare programs about care giving. Zero to Three providessimilar examples of positive and negative interactions
between children and their care givers in a child caresetting. The lessons learned by the baby are the same.
Appropriate Practice: In a child care center ayoung infant, being fed his bottle, pats his handon the bottle and looks at the care giver's face.His care giver smiles, stroking his hand and leggently. She lets him push the bottle away whenhe wants a break but she holds the bottle withinhis reach. When he is ready, he reaches forthe bottle and pulls it to his mouth. Theyresume their peaceful rocking, touching andlooking into each other's eyes.
Inappropriate Practice: A care giver holds thebaby without looking at him. He has to turn hishead to take a breath. She doesn't respond tohis patting. The baby looks up at her, but she iswatching other children.w
Ikr,,
"'",v--4,

Is the Damage Reversible?
For those children damaged by a predominantly negative
experience with adults, what is not fully known is thedegree to which the frightening effects of thisdeprivation can be reversed when parents and childrenget help. The researchers who studied the children ofdepressed mothers found that the brain waves of thechildren returned to normal, provided the mothersreceived treatment by the time their children were sixmonths old. A brief period of postpartum depressionthat lasted only a few months appeared not to adverselyaffect babies. However, if the depression continued intowhat researchers found to be the most vulnerable period
for childrensix to eighteen months of agethe babiestended to show later cognitive and behavioral problems."
Experts acknowledge that the process of developmentin the human brain is complexthat different parts ofthe brain develop at different times and that certainstimuli are therefore required according to a setschedule. As Rima Shore writes,
The brain's circuitry is not formed at a steadypace; rather, brain development proceeds inwaves, with different parts of the brainbecoming active "construction sites" atdifferent times and with different degrees ofintensity.''
Some researchers believe that these critical periods areso rigidly predetermined that past a certain age, a kindof "locking in" occurs if certain stimuli needed at thosetimes are not provided.13 Others caution that thesecritical periods may last longer and that there simply isnot enough information yet to provide a definitiveanswer to this difficult question. Some children dosurvive early neglect and abuse and go on to becomesuccessful. Some are helped to do so through intensiveprograms of nurturing care and behavior management.In her report, Rethinking the Brain, Rima Shore writes,
Risk is not destiny. The medical, psychological,and educational literatures contain a sufficientnumber of examples of people who developor recover significant capacities after criticalperiods have passed to sustain hope for everyindividual."
What is important for policy makers to understand isthat, in either case, interventions need to occur as earlyand as intensively as possible if children are to be given
the best chance possible to grow up healthy. Theconclusion from these PET scan images must be tomake a greater investment in helping at-risk familiesbefore a birth occurs and when their children are veryyoung. It is foolish to wait until the kindergarten or earlyelementary school years to provide enrichment to at-risk children. Yet Connecticut's investment during the
22

early years is disproportionately low compared to statespending on education. In the early 1990s Connecticutspent $78 for children under age five, and in the same
years, $7,800 on children age five and above. In otherwords, for every dollar that we invested in children under
age five, we invested $100 in children age five and above.
Recent increases in state spending for child care do not
come close to closing this gap.'5
At the same time we increase investment in the earlyyears, however, we need to be careful that this is notdone at the expense of older children who need help.This new research should not be interpreted asdetermining their destiny. We know that older children,too, can and should be helped to turn around, even ifthe task may prove to be more difficult.
The Link Between Poverty and Risk
As this ground-breaking research continues across thecountry, each new twist helps to complete the pictureof how certain adverse conditions place children at risk.
While we have long known that these factors werecorrelated with developmental problems in children,we now are learning about this "right down to thecellular level," as Rima Shore puts it. At this moretangible level, we are beginning to be able to see and
understand the physiological effects when children areplaced at risk. What are these risk factors? Parentaldepression, lack of knowledge about childdevelopment, exposure to toxins during pregnancy,undernutrition, abuse and trauma, lack .of stimulation,poor quality child carethese have all been identified
as leading directly to physical alterations in thedevelopment of the brain that can stunt the emotionaland cognitive growth of children.
All of these factors have also been found to be closelylinked to poverty. While emotional neglect andexcessive stress can occur in families at every incomelevel and in child care settings across the economicspectrum, children living in poverty are especiallyvulnerable. Poor children live in environments in which
survival is a constant struggle; where violence at homeand in the community is more frequent; whereenvironmental hazards are more common; where someparents are too overwhelmed to provide their childrenwith the care, stimulation and sense of security theyneed; and where child care quality is often lacking. It islittle wonder that poor children are more likely to sufferfrom learning difficulties and emotional and behavioralproblems. The cumulative impact of these various riskfactors on children's well-being can be devastating.According to a report by the Children's Defense Fund,"Poverty's effects accumulate so forcefully that some
2 3

researchers believe that the number of problems shapes
a child's future at least as much as what those problems are." 6
Intervention Can Make A Difference
While seeing physical evidence of the harmful effectsof deprivation may make them seem more frightening,what researchers are finding about the plasticity of thebrain, and the impact of early intervention, should alsobe a cause for greater hope. These are not intractableproblems. Despite the risks associated with poverty,some children do thrive, and more and more is beinglearned about why they do. And evidence is mountingabout the benefits of comprehensive programs toeducate and support parents before childbirth and
during the first years of their child's life. Earlyinterventions are even proving effective, at least in some
cases, in mitigating the effects of neurological conditionssuch as autism and mental retardation once regardedas hopeless.''
As we approach the next century, and as the dizzyingpace of research in the field of neuroscience providesus with more guidance on how to meet the needs ofchildren, there may come a greater understanding ofthe fact that families, particularly those who live inpoverty, cannot raise their children without support fromall of usthe government, the private sector and thecommunity at large. Urie Bronfenbrenner wrote of thisinterdependence, "A child requires public policies andpractices that provide opportunity, status, example,encouragement, stability and, above all, time forparenthood . . . And unless you have those externalsupports, the internal systems [in a family] can't work.They fail."8
There is ample evidence that government-supportedprograms can make a significant difference in helpingchildren at risk. In the following pages, we will providea few examples of the impact of government programs inaddressing the particular risks facing childrenrisk factorsthat have been identified and studied in recent effortsto better understand the workings of the human brain.

Inadequate Nutrition
Chronic hunger is directly related to poverty and candirectly affect the development of the brain. In a survey
of low-income families at sites across the country,children suffering from hunger were reported by theirparents to be between 2 and 11 times more likely toexperience dizziness, irritability, frequent headachesand ear infections, fatigue, concentration problems,unwanted weight loss and frequent colds.'9
Iron deficiency is a serious effect of inadequate nutrition.
Low iron, with or without anemia, can impair problemsolving, motor coordination, attention, concentrationand long-term IQ scores. Low-income preschoolers arethree to four times more likely to suffer from irondeficiency.2° From 1989 to 1990, over one-quarter ofchildren, most from poor families, seen at a Boston,Massachusetts hospital clinic were deficient in iron.2'Poor nutrition during pregnancy can lead to a greaterlikelihood of infant mortality and low birthweight, andan insufficient intake of certain nutrients can causeserious birth defects such as spina bifida andanencephaly (being born with part of the brainmissing)." New research on the brain, focusingparticularly on the first few days after conception whenthe cerebral cortex of the brain of a fetus begins todevelop, has revealed that inadequate nutrition during
this stage of pregnancy may result in seriousneurological disorders such as infantile epilepsy. autism,
or schizophrenia:2'
Poor families have been found to purchase more valuefor their food dollar than do upper-income families.Nevertheless, with so many families living below thepoverty level, and with the poverty level not evenrepresenting an adequate income with which topurchase basic necessities, many families simply lackthe necessary means to feed their children adequately.Research has shown that parents in low-income families
limit their own meals before cutting back on food fortheir children." Insufficient funds with which to buy food
25
.q311,:,.,!:..411-;`-4;*.boteemT

is certainly the major reason why poor children gohungry. But other effects of poverty such as chronichealth problems, stress, crowded living conditions (with
all the distraction and lack of order and calm whichthat entails) and, in a small number of cases, neglect,can contribute to the problem of undernutrition bymaking it more difficult for poor children to eat.25
In the late 1960s, Senator Robert Kennedy toured theSouth and Appalachia and witnessed the bloatedstomachs of children who were suffering frommalnutrition. News coverage of this tour promptedCongress to enact a series of measures to combatchildhood hunger which either created or expandedsuch federal programs as School Breakfast, the FoodStamp Program, the Special Supplemental FoodProgram for Women, Infants and Children (WIC) andthe Child Care Food Program. These efforts virtuallyeliminated gross malnutrition among children. Specificstudies of these programs support their effectiveness inaddressing the problem of hunger. For example, in afive state study of WIC which involved 105,000 Medicaid
births, researchers found that every dollar spent on theprenatal component of WIC saved $1.77 to $3.13 inMedicaid costs during the first 60 days after birth. Other
studies have associated WIC with decreases in lowbirthweight rates, reduced prevalence of anemia andimproved cognitive skills for children.''
...
Some thirty years after Senator Kennedy toured theSouth, national surveys of children in the U.S. have found
that a large proportion suffer from chronic hunger dueto welfare benefits and wages losing ground to inflation,
and an inadequate level of food assistance.27 Whilegovernment efforts to provide nutrition support havebeen highly successful in staving off gross malnutrition,new research on the development of the brain hasunderscored the importance of the more subtle butnevertheless devastating impacts of undernutrition onthe physical structure of the brain and its capacity todevelop cognitive and emotional skills. This researchshould be an impetus for government to address theshortfalls in these programs, as well as other benefitprograms for the poor, in order to insure that thedevelopment of our children is not jeopardized.
Lack of Early Stimulation,Child Abuse and Neglect
While child abuse and neglect occurs in families at every
income level, poverty does place children at higher risk.New research on the development of the brainunderscores the profound impact maltreatment canhave on the ability of a child to develop the skillsnecessary to learn in school and form healthy humanrelationships. The stress and depression so often relatedto poverty (and the substance abuse problems that

sometimes result) can make it difficult for some parents
to provide the nurturing care their children need.
According to a report by the Children's Defense Fund,
"While maltreatment is not 'entirely, or even primarily,
a poverty phenomenon.' a recent literature reviewconcludes, 'poverty is perhaps the single mostpredictable risk factor for child abuse and neglect.' "28
While most children living in poverty are not neglected
or abused, many still do not receive the stimulation day-
in and day-out that is needed to fully develop theircognitive and emotional skills. A lack of stimulationmeans that critical neural pathways needed to processinformation effectively later in life are not made. A lack
of adequate stimulation can be attributed to manyfactors associated with poverty: parental preoccupationof the parents with survival issues, greater family stress,lower educational levels and a lack of basic knowledge
about child development.
Some of the most important and successful models ofcommunity-based intervention have been programsproviding support to at-risk families to enable them tobetter care for their children. Some of these programsbegin to serve families even before a child is born. Some
have been monitored long enough to provide us with
follow-up data on their impact on the lives of children
as they grow into adolescence and adulthood.
Two of these examples are among the modelsdescribed in the Families and Work Institute report,Rethinking the Brain.29
The Carolina Abecedarian Project: Beginning at six
weeks and ending at age five, low-income children
participating in this project attended a full-time earlyeducation program of high quality. Their parents were
also in a parent involvement program when theirchildren were ages five to eight.
At age 12, children in the program group had IQ scoresthat measured 5.3 points higher than the comparisongroups. At age 15, children receiving services aspreschoolers earned significantly higher scores inreading and math; 31.2% of participants wereretained in grades, as opposed to 54.5% in thecomparison group, and 24% required specialeducation services compared with 48% of those inthe control group.
Parents as Teachers Program: Begun by the MissouriDepartment of Education, and still operating, thisprogram provides information about childdevelopment to parents of children from birth to agefive through home visits, parent groups and referralsfor needed services. Children also receive regularhealth screenings.
27

Participating children at age three scored significantlyhigher than national norms on measures of intellectualand language abilities. Most children from minority families
did better than average on achievement and languagemeasures. In first grade, 55% of the participating children
were rated above average by their teachers. Teachers also
reported higher levels of parent involvement-74% ofparents who participated, according to the teachers, always
assisted the children with their homework. The curriculum
for this program has been provided to other states, andthe program has trained some 8.000 parent educators who
go out on home visits once a month.
Healthy Start/Healthy Families America: Another model
that is also attracting a great deal of attention is Hawaii's
Healthy Start Program. Designed to prevent incidencesof child abuse and neglect, the program involves ascreening process to identify families at risk when a child
is born. Visits are then made to these mothers after they
return home. The visits involve providing emotionalsupport, modeling good parenting skills and makingreferrals for other services where needed. Preventivehealth care is also emphasized. The frequency of homevisits is individualized based on need and the degree ofrisk. The effectiveness of the screening process used isdemonstrated by the fact that among the families thatwent through the process and were determined not tobe at risk, follow-up data showed that almost all (99.5%)
had no abuse. The effectiveness of the comprehensiveservices provided is borne out by data showing that, among
the families that were identified as high-risk and whoreceived these services, child abuse and neglect wasprevented in 99.8% of the cases. In studies of comparable
at-risk groups, up to 20% have reports of child abuse and
neglect.m
0 !-
,PT7T-N,
(11.110311.1
at
-I I,
,tr 6
.
02;:er
This program has been so successful that the NationalCommittee for the Prevention of Child Abuse andNeglect is promoting an initiative called Healthy Families
America to encourage its replication around the country.It has now spread to 265 sites in 37 states, plus the District
of Columbia:" In Connecticut, the program is currentlyoperating at four sites serving over 131 families. Two
more sites are being added this year.32
Head Start and OtherEarly Education Programs
High quality child care and early education can do muchto stimulate children and help them acquire all-important
cognitive and emotional skills. And, for low- income children,
it can actually offset some of the disadvantages thatresult from living in poverty. A review of studies on the
effectiveness of comprehensive early stimulation andearly education programs, including Head Start,conducted by a committee of the U.S. House ofRepresentatives, found that they increase the chancesof success in school. For those children who attended,benefits included better grades, fewer failing marks,lower retention-in-grade rates and fewer absences.Attendance was associated with less need for specialeducation, improved literacy, and a greater likelihoodof completing high school and continuing educationpast the high school level. It was also linked to increasedemployability, decreased dependence on publicassistance, and decreased criminal activity.33
These benefits do not emerge, however, unless the careis of high quality. Unfortunately, child care in the U.S. isa patchwork, under-funded system which does not, forthe most part, provide the kind of care children need tothrive. Studies have found that between 12% and 21%of children in child care are in settings that are unsafe
and compromise their development. Only 12% to 14%
of kids are in settings that nurture their growth andlearning. The findings are even worse for children during
their most vulnerable years as infants and toddlers.Among this age group of children in care, over one-third
(35 -40%) are in settings considered unsafe and harmful
to their health and development.34
Research has demonstrated that government can beeffective in improving this dismal picture. Children wholive in states with tougher regulatory standards for childcare receive better quality care than children in stateswith weaker standards. A study by the Families and Work
Institute found that when states adopt stricter standardsfor staff/child ratios and for the education and trainingrequirements of staff, children are more securelyattached, have better cognitive, social and languageskills and fewer behavior problems.35
AdIMIL
2 9

Yet the cost of good quality child care is high. Theamount parents can afford to pay is not enough to coverthe cost. Compared to other countries, our governmentdoes very little to subsidize our system of child care.Research shows that when child care salaries remainso lowwhen we ask teachers in effect to subsidizethe system with their low compensationhigh rates ofstaff turnover result. Children in centers with high staffturnover have been found to have fewer social skillsand to be less competent in language.36
Equally frightening, according to the Zero to Threesurvey, is the fact that half of parents think these constant
changes in staff are good for children. They believe that
many changes in care-givers will make children betterable to cope with change. The truth is that early, stablerelationships with a small number of caregivers cancushion children so that they are actually better able tocope with change later in life."
We know that government support and regulation domake a difference in improving quality. We also knowthat most child care programs in this nation are not ofhigh quality. Given the tangible evidence we now havethat the physical-structure of the brain can be altered
_-_
and brain functioris "Mgnificantly impaired when children
do not receive adequate care, it is foolish to continueshortchanging our child care system. In view of this new
research on the brain, the large numbers of poorchildren about to enter the child care system becauseof new time limits under welfare reform representenormous risk and enormous opportunity. If thisresearch, coming as it does on the heels -of majorchanges in our welfare system, can compel policymakers to invest in enriched care for our most at-riskchildren, we are likely to see the benefits for years tocome. lf, on the other hand, welfare reform is cause foreven more children to be warehoused in inferior care,we will see, and pay for, the damage for years to come.
Lack of Prenatal Care andExposure to Toxins In Utero
New research on the brain has focused on how certainrisks during pregnancyexposure to toxins such asdrugs, alcohol or nicotine, and inadequate nutritionincrease the chances that babies will be born at lowbirthweight, will have neurological problems or otherdisabilities, and will exhibit behavioral problems atpreschool and later ages.38
Here again, government-supported programs toincrease the chances of a healthy birth outcome havebeen effective. Medicaid coverage and its recentexpansions, and other government sources of funding
.3 a

for maternal and child health services, haveincreased the proportion of poor women receivingregular prenatal care.
Early and adequate prenatal care has been associatedwith reductions in infant mortality, low-weight andpremature births, and the prevention of diseases anddisorders in children. The Institute of Medicinecalculated that for every $1 spent on prenatal care, anestimated $3.38 is saved in the medical costs of caringfor a low birthweight infant.39
When a pregnantwoman receivesprenatal care, she isable to receive helpin addressing the risk
factors to a healthybirth outcome. Forexample, womenwho smoke canreceive counseling to
help them stop theiraddiction throughstructured smokingcessation programs.These have beenfound to result in
significant quit rates among pregnant women.Reductions in smoking during pregnancy have beenassociated with reduced risk of fetal and infant deaths,lower rates of low-weight births, and fewer neurologicalproblems in babies.4° Women in prenatal care can alsobe referred to the WIC Program discussed earlier. WICnutritional benefits can help to stave off the devastating
effects of undernutrition during pregnancy.
Environmental Hazards
Low-income children are at greater risk of harm fromenvironmental hazards than other children. Forexample, inadequate heat, excessive dampness, andcockroach infestationconditions often found whenlow-income families are forced to live in substandardhousingcan cause asthma and other upper respiratoryconditions. Unprotected windows in high-riseapartment buildings, a lack of safety equipment suchas stair gates, and living in high-traffic areas with a lack
of outdoor play space can make children morevulnerable to physical injury.4'
Lead poisoning is another environmental risk faced bypoor children. Both during pregnancy and after birth,exposure to lead places a child at greater risk ofdeveloping serious neurological problems. While lead
3 1

7447.:
1
poisoning remains a grave problem, government hasmade remarkable progress in addressing this health risk.
According to the Centers for Disease Control,government actions twenty years ago in banning leadin gasoline, as well as in food and drink cans, plumbingsystems and household paint, have decreased bloodlead levels dramatically in all segments of thepopulation. For example, among children ages 1-5,average blood lead levels decreased from 1 5.0 to 2.7micrograms per deciliter according to surveysconducted between 1976-1980 and 1991-1994.42
However, the remaining risks from peeling lead paintin older homes and contaminated dust and soil frompast emissions of leaded gasoline are still causing adisproportionate number of low-income children tohave elevated blood lead levels. Efforts to screen,identify and treat these children, and address the leadhazards in their homes and communities, need tocontinue if the severe neurological damage resultingfrom lead exposure is to be prevented."
Poor Health Status
Poor children are at greater risk for a whole host ofserious health conditions, including asthma, upperrespiratory infection, pneumonia, frequent diarrhea and
colitis, and anemia." If left untreated,these ailmentscan be life threatening. They also can sap children oftheir strength, affect their dietary intake and harmtheir overall development. Providing health carecoverage can make a difference. Medicaid coverageand the screening and treatment services offeredunder its Early and Periodic Screening, Diagnosis andTreatment Program (EPSDT) have been associatedwith fewer abnormalities at periodic -exams andsignificantly lower medical costs than for childrenwho do not receive these benefits."
Parents living in poverty also are at_greater risk forserious health problems. Low-income- wornell, forexample, generally are at greater risk for hYpertension,diabetes, anxiety and depression." As the newresearch on the brain suggests, conditions such asdepression can interfere with the ability of mothersto form warm, secure attachments to their children,and can rob them of the energy they need day to dayto provide their children with adequate care andstimulation. As discussed earlier, research on theeffect of maternal depression on babies alsodemonstrates that if the mother is treated earlyenough, the damage to her children can be reversed.
Even with significant expansions in Medicaidcoverage, a shocking number of families with
3 '

children still go without health coverage. InConnecticut, an estimated 80,000 children areuninsured." We remain the only Western industrializedcountry that does not have universal health care coverage.
To date, efforts to guarantee coverage, at least for pregnant
women and children, have failed in Congress. Depriving
children of basic health care means missing critical times,
including the prenatal period, during which researchershave found that intervention can make the most dramatic
difference. Risks to healthy birth outcomes are notaddressed, developmental problems in children are notidentified, and opportunities for treatment during"prime times" of brain development are missed.Depriving parents of adequate health care coveragemeans that serious health conditions are left untreated,
hampering their ability to provide their children withadequate care.
Disabilities That Impair Cognitiveand Emotional Functioning
In addition to children who live in poverty, children with
neurological disabilities also face greater risks and needsupport. Research on the human brain points to similarconclusions about the importance of earlyintervention for these children. When diagnoses ofthese biologically-based neurological problems aredone very early in a child's life, and comprehensiveprograms of stimulation, individualized therapy andfamily education and support are begun immediately,researchers are finding that remarkable results can beachieved in many children. Discoveries about theplasticity and flexibility of a child's brain, especially in the
first years of life, are influencing experts to direct their efforts
to affecting the environment of these children at the very
earliest stages of life.
Complementing this research are new discoveriesabout how to identify problems earlier than was everthought possible. For example, researchers are now ableto identify auditory processing problems in children asyoung as six to nine months. This is a critical step toward
developing programs for children to aid their
3 3

development of language so that they will be lesslikely to need special education later for language-based
learning disabilities." All of these developments giveparents new hope that their children may be able tolive happier, more independent and productive lives.
The federally-funded Birth to Three Program under Part
H of the Individuals with Disabilities Education Actprovides children with early identification ofdevelopmental problems and treatment of theseconditions. The design of this program is based on theexperiences gained from earlier interventionprograms for infants identified as high risk. For example,
the Infant Health and Development Program addressedthe needs of babies born at low birthweighta factorthat greatly increases their risk of disability. The program
provided low birthweight, pre-term babies and theirfamilies with a combination of developmentally-basedchild care and education, family support and pediatricfollow-up care. Results found that participating childrenhad higher IQ scores and exhibited fewer behavioralproblems than children from a comparable group thatonly received the pediatric care.49 Government supportfor the Birth to Three programs around the country hasmade it possible for many more children to receivetreatment earlier than ever before. In Connecticut, 3,335
children are currently receiving Birth to Three services.
The new research on the brain should underscore the
importance of this public investment in reachingchildren with developmental problems as early in lifeas possible.
Poverty and its Stresses
Researchers have found that poverty has a significant,negative impact on children's development and that itsimpact intensifies as children grow older.5' In additionto its other harmful effects, poverty can damage thequality of the relationship between children and theirparents. Economic deprivation and financial hardshipcause enormous stress in parents of young children.Low-income parents are more likely to suffer fromdepression and stress-related illnesses. Concerns overeconomic problems are compounded by thepsychological toll on parents when they feel that, despite
their love for their children, they are not able to keepthem safe or adequately fed and housed. Parentsexperiencing this kind of stress are less able to havepositive interactions with their children and this, as thenew brain research demonstrates, harms theirchildren's cognitive and emotional growth. Parentalstress is associated with lower IQ scores and pooreremotional adjustments in children.52
It is important to recognize that, for all of its flaws, oursafety net of government benefit programs has reduced

the incidence of poverty among children. In 1995,according to a study by the Center for Budget and PolicyPriorities, government benefits reduced child povertyby one third, meaning that one-third of the children whowere poor before receipt of government benefits were
lifted out of poverty by those benefits.53Benefits used in
the Center's calculations included means-testedassistance, tax policies such as the Earned Income TaxCredit, and social insurance such as unemploymentcompensation. Most of the children who were lifted outof poverty were in working families. The study alsoconcluded that these programs were effective inreducing the severity of poverty among children andcushioning some of the effects of recession on families
with children.
Other studies point to the importance of a single sourceof assistance, such as housing subsidies, as making thedifference for some families in meeting basicnecessities. At Boston Medical Center, Dr. Alan Meyersstudied the health status of children coming to thehospital for care. An earlier study conducted by Dr.Meyers had shown significant differences in theincidence of iron deficiency among children whosefamilies received housing subsidies and those whosefamilies did not. In his most recent study comparingthese groups, he found that only 3.3% of those childrenin families with subsidized housing were underweight
for their age compared with a 22.6% among those whose
families were on the waiting list for housing assistance.While the sample sizes were not large and the studywas based in only one hospital, these results certainlysuggest that housing subsidies may help to protectchildren from undernutrition, especially in high-rentareas .54
While our safety net has helped save many families fromtruly desperate poverty, low levels of assistance,restrictive eligibility guidelines, and insufficient supports
for parents who work have meant that anunconscionable proportion of our children are still livingin poverty. Nationally, one in four children under six lives
in poverty.s5
The authors of the study by the Center on Budget andPolicy Priorities warn that even more children couldbecome poor as a result of new welfare reforms whichwill reduce federal funding for the safety net by $54billion over the next six years. Greater flexibility for thestates could lead to a reduction in state support for theseprograms of $40 billion. The study's authors bolster theirclaim about the impact of a weakened safety net onchild poverty by contrasting what happened during therecession of the early 1980s and that of the early 1990s.
In the early 1980s, cuts in many benefit programs hadweakened the safety net. By the early 1990s, however,
35

.1
;"' 4:1:7t. C'
measures had been adopted to make it stronger. Beforecounting receipt of government benefits, the authorsfound that the number of people who became poor during
each of these recessions was about the same-10 million.However, when benefits were taken into account, theeffects of a strengthened safety net were evident. Twiceas many people were thrown into poverty in the earlyeighties compared with the recession of a decade later.In short, a stronger safety net cushioned the effects ofthe recession for families with children.
In 1991, the National Commission on Childrenrecommended that our system of support for familiesbe bolstered to address the disturbing proportion of ourchildren who still live in poverty Specifically, they called
for a combination of temporary assistance when parentsare unable to work and measures similar to thoseadopted in western European countries: a strengtheningof our child support system and child support assurance,child allowances in the form of refundable tax creditsand support services to enable parents to work and stilladequately care for their children.
Since the Commission issued its report, revolutionarychanges have been -adbpted in our welfare system.These reforms raise difficult questions. Their aim is topromote work and compel more welfare mothers toenter the workforce. But how that is done will have amajor impact on children's development. The NationalCommission believed that their recommendations, ifadopted, would be sufficient to change the tenor of thewelfare system to a temporary source of assistance tofamilies by making work more financially beneficial. Yet
the welfare reform measures that have been enactedare much more extreme and have not beenaccompanied by strong measures to help workingfamilies make ends meet. How will time limits whichlimit families to only a maximum of five years ofassistance in a lifetime affect children when parents are

unable to find employment? Will the allowance forhardship exceptions under the new law be adequate to
protect children, especially if the economy suffersanother downturn?For those mothers who do find jobs and may be joining
the ranks of the working poor, will there be sufficientincome and supports to enable them to adequately care
for their children? Without bolder measures to support
working poor families, will parents have to work two or
three jobs in order to make ends meet? Will children in
working poor families continue to be robbed of theparenting time, free of stress, that the new research on
the brain has found so critical to children's healthydevelopment?
The new research on the brain identifies risk factorsthat directly influence the physical structure of the brain
in ways that stunt the potential of children. All of these
factors have been associated with poverty. Theunderlying issue is economics. We know from theexperience of other countries that government canmake families more secure so that they can devote their
energy and attention to enriching the lives of theirchildren instead of worrying over issues of basic survival.
Providing that support, in combination with otherintervention measures, can have a dramatic impact on
the healthy development of the next generation.
Conclusion
What we have provided here are only a few examples
of the many ways in which government, often inpartnership with business and community groups, has
helped families nurture their children. There are manyothers. Unfortunately, however, the multiple needs of
families at risk and the tendency of policy makers toaddress these problems in fits and starts have spawned
an often confusing, largely patchwork system of health
and social services. Programs are created to target this
population or that problem, compelling serviceproviders to undertake the frustrating task of patchingtogether these funding streams in order to serve families
in any kind of comprehensive way. Eligibility rules differ
from program to program because little of what we fund
3 7

to support families is universal. Many programs arediscretionary instead of entitlement programs so thateven if families meet the eligibility guidelines, they canbe turned away when funding runs out. Despite theproven efficacy of many of these programs, such asHead Start and WIC. they are not able to serveeveryone who qualifies. Lastly, even for those familieswho are served, benefit levels are often too low toenable many programs to fulfill their intendedpurpose.
The difficulty we encountered in organizing a discussion
of early interventions came to reflect for us both thedisjointed nature of our support system for children andthe importance of comprehensive. integrated servicesfor families at risk. Early interventions that set out tofulfill one purpose ended up serving others as well. Aprogram designed primarily to curb child abuse andneglect also had a positive impact on immunizationrates and school performance. A program to help low-income teen parents acquire good parenting skillsalso helped these mothers to improve their economicfutures. What seems clear from these experiences andfrom the new research on the brain is that because somany risk factors are involved, supporting families mustbe done in a comprehensive way if children are to beadequately nurtured and stimulated.
uEST COPY AVAILABLE
-P9.
This long-term, comprehensive view of how andwhere to make investments in our children has beenlacking. What was written almost ten years ago is,sadly, still valid today:
There is no more important contradiction insocial policy than this: From child developmentresearch we now know that the first few yearsof life play a crucial role in shaping a person'slifelong mental, emotional, and physicalabilities. And yet it is for this stage of life thatwe seem to make our social investments mostgrudgingly and tolerate the greatestdeprivation.. . Although scientific knowledgeabout early childhood years has mushroomed,it is during these years that Americans are mostlikely to live in poverty. Simply put, ourknowledge is not being applied.56
Children need time with their parents. Parents needthe balance between work and family necessary toprovide that time to their children. And they need to doso armed with a basic knowledge of child developmentand free of the stresses of poverty and the struggle tosurvive. They need to know that when they can't work,there will be an adequate safety net to catch them whenthey fall. And when they do work, they need to knowthat their sons and daughters are being nurtured andstimulated by caring, knowledgeable care givers.

Despite the complexity of the new discoveries inneuroscience, knowing what to do to help children isnot rocket science. As a nation, we needn't wait forfurther developments in the scientific arena to act. Whatthis new research shows is simply the physicalmanifestation of the observations made by experts foryears about the harm of childhood deprivation. This
research can help us fine tune our efforts to preventthat harm, but we have long known enough to justifybolder action than we have taken.
France has a system of comprehensive supports forfamilies, including universal early education, healthcare, paid parental leave and child allowances. A groupof Americans who toured France to examine this system
asked a policy maker there how support was garneredfor establishing these measures. Bewildered by thequestion, he answered, "We just took your research andapplied it!"" For the sake of our children and our future,
it is time we did the same.
33
a
Endnotes
1. Rima Shore, Rethinking the Brain, New Insights into EarlyDevelopment (New York, New York: Families and Work Institute,1997).
2. Ibid., 63.
3. National Commission on Children, Beyond Rhetoric, .4 NewAmerican Agenda for Children and Families, Final Report of theNational Commission on Children (Washington D.C.: NationalCommission on Children, 1991), 122.
4. Shore, Rethinking, 27-29.
5. Ibid., 42. The author summarizes these findings as they werereported at the Families and Work institute conference byGeraldine Dawson and colleagues at the University ofWashington. For this and other discussions of specific riskfactors, Shore cautions that there is some controversyregarding whether the specific behavior or factor studied canbe isolated from the impact of other risk factors on thedevelopment of the child.
6. Zero to Three: The National Center for Infants andToddlers, "Parents of Babies and Toddlers Face 'InformationDeficit' on Healthy Child Development" (Washington, D.C.:Zero to Three, press release, http://www.zerotothree.org/private/pr-041797.html)
7. Zero to Three: The National Center for infants and Toddlers,Heart Start, The Emotional Foundations of School Readiness(Washington, D.C.: Zero to Three: National Center for Infants andToddlers, 1992), 8.
8. Ibid.
9. Ibid.
10. Zero to Three: The National Center for Infants and Toddlers.Caring for Infants and Toddlers in Groups, DevelopmentallyAppropriate Practice (Washington, D.C.: Zero to Three: TheNational Center for infants and Toddlers. 1995). 59.
11. Shore. Rethinking, 43.
12. Ibid., 39.
13. Ibid., 63.
14. Ibid., 61.
15. Gina Adams and Jodi Sandford. State Investment in Child Careand Early Education (Washington, D.C.: Children's Defense Fund,1992), and "School Spending Per Child in the State ofConnecticut," The Washington Post, April 14, 1992, A19.
16. Children's Defense Fund, Wasting America's Future, TheChildren's Defense Fund's Report on the Costs of Child Poverty(Boston, MA.: Beacon Press, 1994), 53.
17. Shore, Rethinking, 49.
18. Children's Defense Fund, Wasting, xxvii.
19. Food Research and Action Center, Community ChildhoodHunger Identification Project: A Survey of Childhood Hunger inthe United States (Washington, D.C.: Food Research and ActionCenter, 1995).
20. Children's Defense Fund, Wasting, 62.
21. Ibid., 15.
22. Ibid., 17.
23. Shore, Rethinking, 23.
24. Food Research and Action Center, Community, xiii.
25. Children's Defense Fund. Wasting, 16.
26. House Select Committee on Children, Youth and Families.Opportunities for Success: Cost Effective Programs for Children,Update. 1.9.90 (Washington. D.C.: 101st Congress. 2nd session.October 1990), 14.
27. Children's Defense Fund, Wasting, 15.
28. Ibid.. 85.
29. Shore, Rethinking. 76.
30. Robert D. O'Connell, "Healthy Beginnings, Statistics You Can'tIgnore on Abuse and Neglect Prevention Based on Hawaii'sHealthy Start Program Model," Caring (Summer, 1992), 22.
31. Figures are from the National Committee for Prevention ofChild Abuse and Neglect, August 5, 1997.
32. University of Hartford, "First Year Evaluation of Healthy FamiliesConnecticut Sites," (Hartford, CT: University of Hartford, 1997).
33. House Select Committee, Opportunities, 60.
34. Shore, Rethinking, 59. See studies cited in sources for herdiscussion of child care quality, 86.
35. Ibid.
36. Marcy Whitebrook, Caro Ilee Howes and Deborah Phillips,Who Cares? Child Care Teachers and the Quality of Care inAmerica, Executive Summary, National Child Care Staffing Study(Oakland, California.: Child Care Employee Project, 1989), 10.
37. Zero to Three, "Parents of Babies," 2.
38. Shore, Rethinking, 23, 43-46.
39. House Select Committee, Opportunities, 26.
40. Ibid., 132.
41. Children's Defense Fund, Wasting, 20.
42. U.S. Department of Health and Human Services, Centers forDisease Control, "Blood Lead Levels Keep Dropping; NewGuidelines Proposed for Those Most Vulnerable," Press Release(Atlanta, Georgia: Centers for Disease Control and PreventionPress Office, February 20, 1997, http://www.cdc.gov/leadhhs.html).
43. Ibid.
44. Children's Defense Fund, Wasting, 62.
45. House Select Committee, Opportunities, 39.
46. Alina Salganicoff, "Medicaid and Managed Care: Implicationsfor Low-Income Women" submitted to the Journal of theAmerican Medical Women's Association. March 9, 1997.Salganicoff is Associate Director of the Kaiser Commission onthe Future of Medicaid.
47. U.S. Bureau of the Census, Current Population Reports, HealthInsurance Coverage: 1995, 60-195 (September 1996).
48. Shore, Rethinking, 54.
49. Ibid., 79.
50. Personal communication with Eileen McMurrer, Birth to ThreeProgram, Connecticut Department of Mental Retardation, August5, 1997. Service figures are for June, 1997.
51. Shore, Rethinking, 48.
52. Children's Defense Fund, Wasting, 30-32.
53. Wendell Primus et al., The Safety Net Delivers: The Effects ofGovernment Benefit Programs in Reducing Poverty, (Washington,D.C.: Center on Budget and Policy Priorities, 1996), 3.
54. Alan Meyers et al., "Housing Subsidies and PediatricUndernutrition," Archives of Pediatrics and Adolescent Medicine,149 (October, 1995), 1079.
55. National Center for Children in Poverty, One in Four: America'sYoungest Poor, (New York, New York: Columbia University, 1996).
56. The Ford Foundation Project on Social Welfare and theAmerican Future, The Common Good (New York, New York: TheFord Foundation, 1989) cited in House Select Committee,Opportunities, 3.
57. Conference proceedings, A Welcome for Every Child: TheFrench Child Care System and New Directions for Connecticut,Connecticut Association for Human Services, Middletown, CT,September 14, 1991.
41

A.,
4
411
40'tov.

ChildWell-BeingIndicators
Town Index
Region Map ()I:Connecticut
Region Index
School District Exceptions
Number of Children 3S
Racial/ Ethnic Background 39
Child Poverty 10
Children Receiving
Welfare Benefits
Low Birthweight II
Infant Morhdity
Prenatal Care IS
Births to Teen Alothers 51)
Child Deaths
Connecticut Mastery Test
Above Goal 5 I
Connecticut Academic
Performance Test
High School Dropouts 58
Juvenile Violent Crime Arrests 60
Teen Deaths 62
Child.Abuse 6=1
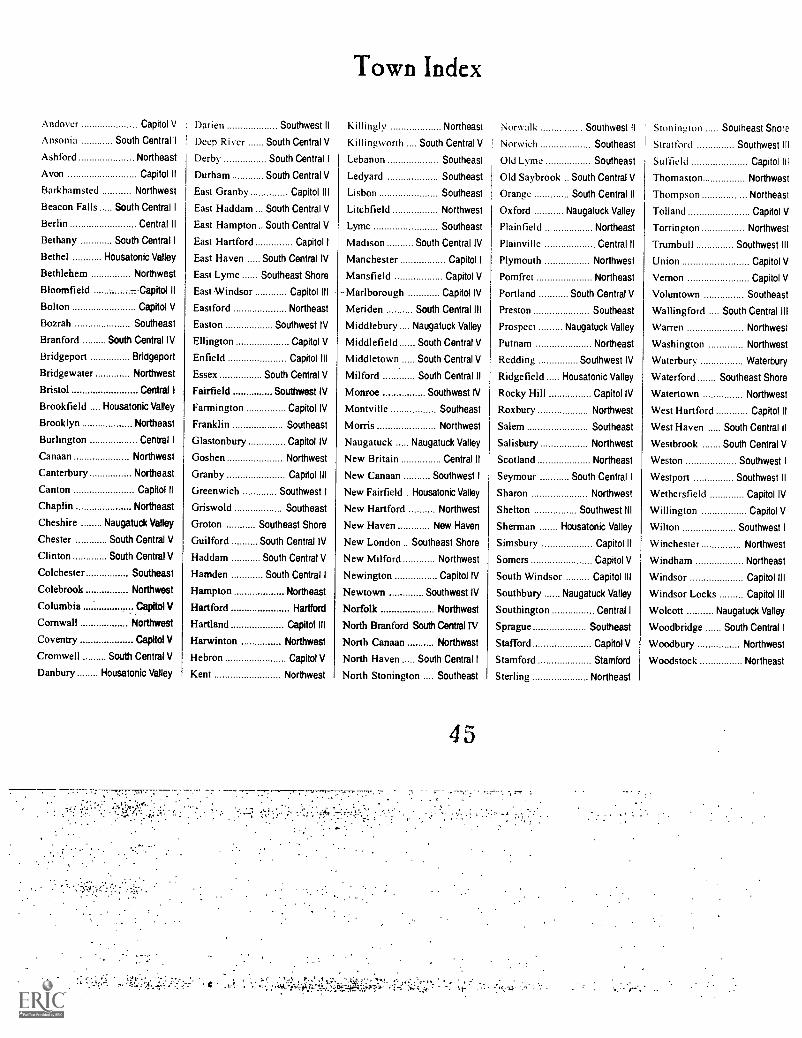
Town Index
Andover Capitol V Darien Southwest II Killingly Northeast Norwalk Southwest II Stonington Southeast ShoreAnsonia South Centre It Deep River South Central V Ki II ingworth . South Central V I Norwich Southeast Strat ford Southwest IllAsh ford Northeast Derby South Central I Lebanon Southeast Old Lyme Southeast Suffield Capitol IllAvon Capitol ll Durham South Central V Ledyard Southeast Old Saybrook South Central V Thomaston NorthwestBarkhamsted Northwest East Granby Capitol Ill Lisbon Southeast Orange South Central II Thompson NortheastBeacon Falls South Central I East Haddam . South Central V Litchfield Northwest Oxford Naugatuck Valley Tolland Capitol VBerlin Central ll East Hampton .. South Central V Lyme Southeast Plainfield Northeast Torrington NorthwestBethany South Central I East Hartford Capitol I Madison South Central IV Plainville Central II Trumbull Southwest IIIBethel Housatonic Valley East Haven South Central IV Manchester Capitol I Plymouth Northwest Union Capitol VBethlehem Northwest East Lyme Southeast Shore Mansfield Capitol V Pomfret Northeast Vernon Capitol VBloomfield --Capitol II -East Windsor Capitol III Marlborough Capitol IV Portland South Central V Voluntown SoutheastBolton Capitol V Eastford Northeast Meriden South Central III Preston Southeast Wallingford .... South Central IIIBozrah Southeast Easton Southwest IV Middlebury Naugatuck Valley Prospect Naugatuck Valley Warren NorthwestBranford South Central IV Ellington Capitol V Middlefield South Central V Putnam Northeast Washington NorthwestBridgeport Bridgeport Enfield Capitol III Middletown South Central V Redding Southwest IV Waterbury WaterburyBridgewater Northwest Essex South Central V Milford South Central ll Ridgefield Housatonic Valley Waterford Southeast ShoreBristol Central I Fairfield Southwest IV Monroe Southwest IV Rocky Hill Capitol IV Watertown NorthwestBrookfield .... Housatonic Valley Farmington Capitol IV Montville Southeast Roxbury Northwest West Hartford Capitol IIBrooklyn Northeast Franklin Southeast Morris Northwest Salem Southeast West Haven South Central IIBurlington Central I Glastonbury Capitol IV Naugatuck Naugatuck Valley Salisbury Northwest Westbrook South Central VCanaan Northwest Goshen Northwest New Britain Central II Scotland Northeast Weston Southwest ICanterbury Northeast Granby Capitol III New Canaan Southwest I Seymour South Central I Westport Southwest IICanton Capitol II Greenwich Southwest I New Fairfield . Housatonic Valley Sharon Northwest Wethersfield Capitol IVChaplin Northeast Griswold Southeast New Hartford Northwest Shelton Southwest III Willington Capitol VCheshire Naugatuck Valley Groton Southeast Shore New Haven New Haven Sherman Housatonic Valley Wilton Southwest IChester South Central V Guilford South Central IV New London .. Southeast Shore Simsbury Capitol II Winchester NorthwestClinton South Central V Haddam South Central V New Milford Northwest Somers Capitol V Windham NortheastColchester Southeast Hamden South Central I Newington Capitol IV South Windsor Capitol III Windsor Capitol IIIColebrook Northwest Hampton Northeast Newtown Southwest IV Southbury Naugatuck Valley Windsor Locks Capitol IIIColumbia Capitol V Hartford Hartford Norfolk Northwest Southington Central I Wolcott Naugatuck ValleyCornwall Northwest Hartland Capitol III North Branford South Central IV Sprague Southeast Woodbridge South Central ICoventry Capitol V Harwinton Northwest North Canaan Northwest Stafford Capitol V Woodbury NorthwestCromwell South Central V Hebron Capitol V North Haven South Central I Stamford Stamford Woodstock NortheastDanbury Housatonic Valley Kent Northwest North Stonington . . Southeast Sterling Northeast
4 5

Central I
Central II
Waterbury
NaugatuckValley
HousatonicValley
Southwest IV
Southwest I
NorthwestCapitol II Capitol ill
Capitol IV Hartford Capitol I Capitol V Northeast
CANAAN
CCRSWALL ,
EARANAMSTEADAANKCSTER
.RNCSOR AS4ORDTOWPET
'CR-D.6T
EAST \HAPT,C,RD MANCHESTER
WARREN LacxnEtonAPWINIGN PURLI G ON
FARIAAGTOI
.500AA56705
4C9P1S
NETMENER
5 WETALERS
FIELD GLASTONBURYCOLOMBIA
EPSTelROOD, NILE
WATERTOWN
. BRIDGE.
WATERLI SOLE
FIELD
FROSFECT
HAMAR/OA ANDA.11NOMA
STONING TOT
NORTH !
BRANFORD
k, WESTON
AMON
CRIT
F AIROEI
New South Central IVHaven
South Central III
sT DOOR,
WESTPORT
*PAOLA
Bridgeport,SREE
Stamford
Southwest II
South Central I
South Central II
Southwest III
BEST COPY AVAILABLE 46
South Central V
Southeast Shore
Southeast

BridgeportBridgeport
East HartfordCapitol I
ill
and Manchester
Avon, Bloomfield,
andCanton,
Simsbury
Capitol II
West Hartford
Capitol IIIEast Granby,
East Windsor,
Enfield, Granby,
Hartland, South Windsor, Suffield,
Windsor and Windsor Locks
Capitol IVFarmington,
Glastonbury,
Marlborough,
Newington, Rocky Hill and
Wethersfield
Capitol VAndover, Bolton,
Columbia,
Coventry,
Ellington, Hebron, Mansfield,
Somers, Stafford, Tolland, Union,
Vernon and Willington
Region Index
Central IBristol,
Burlington and
Southington
Central IIBerlin,
New Britain
and Plainville
HartfordHartford
Housatonic ValleyBethel, Brookfield; _
Danbury,
New Fairfield,
Ridgefield and
Sherman
Naugatuck ValleyChesire,
Middlebury,
Naugatuck,
Oxford,
Prospect, Southbury and Wolcott
New HavenNew Haven
NortheastAshford, Brooklyn,
Canterbury,
Chaplin, Eastford,
Hampton, Killingly, Plainfield,
Pomfret, Putnam, Scotland,
Sterling, Thompson, Windham and
Woodstock
NorthwestBarkhamstead,
Bethlehem,
Bridgewater,
Canaan, Colebrook, Cornwall,
Goshen, Harwinton, Kent,
Litchfield, Morris, New Hartford,
New Milford, Norfolk:NorthCanaan, Plymouth, Roxbury,
Salisbury, Sharon, Thomaston,
Torrington, Warren, Washington,
Watertown, Winchester and
Woodbury
South Central IAnsonia, Beacon
Falls, Bethany,
Derby, Hamden,
North Haven, Seymour and
Woodbridge
sip South Central IIMilford, Orange
and West Haven
47
South Central IIIMeriden and
Wallingford
South Central IVBranford,
East Haven,
Guilford,
Madison and North Branford
South Central VChester, Clinton,
Cromwell,
Deep River,
Durham,
East Haddam, East Hampton,
Essex, Haddam, Killingworth,
Middlefield, Middletown,
Old Saybrook, Portland
and Westbrook
SoutheastBozrah,
Colchester,Franklin,
Griswold, Lebanon, Ledyard,
Lisbon, Lyme, Montville, North
Stonington, Norwich,Old Lyme,
Preston, Salem, Sprague andVoluntown

outheast Shoreast Lyme, Groton,
ew London,
:onington and
'aterford
outhwest Ireenwich,
ew Canaan,
'eston and
'ilton
Southwest IIDarien, Norwalk
and Westport
Southwest IIIShelton, Stratford
and Trumbull
Southwest IVEaston,Fairfield,
Monroe, Newtown
and Redding
StamfordStamford
School District Exceptions
Region Students from Other TownsCapitol V includes Ashford students
who attend Region 19Capitol V includes Marlborough students
who attend Region 8Central I includes Harwinton students
who attend Region 10Housatonic Valley includes Sherman students who
attend BrookfieldNortheast includes Columbia and Willington
students who attend WindhamNaugatuck Valley includes students from Beacon
Falls who attend NaugatuckNorthwest includes Hartland students who
attend GilbertNorthwest includes Sherman students who
attend New MilfordNorthwest includes Oxford students who
attend Region 14South Central I includes Oxford and Prospect
students who attend Seymour andOrange students who attendRegion 5
Southeast includes Canterbury students whoattend Norwich or Griswold
Southeast Shore includes Salem students whoattend East Lyme
Region RegionalSchool
DistrictsCapitol V Region 8
Region 19Central I Region 10Naugatuck Valley Region 15Northeast Region 11Northwest Region 1
Region 6Region 7
Region 12Region 14
South Central I Region 5South Central V Region 4
Region 13Region 17
Southeast Region 18Southwest IV Region 9
Region Private/PublicSchools
Northwest Gilbert SchoolNortheast Woodstock AcademySoutheast Norwich Free Academy
4 3.-^
WaterburyWaterbury
Region Vocational-Technical
'SchoolsBridgeport Bullard-HavensCapitol I Howell CheneyCentral II E.C. GoodwinHartford A.I. PrinceHousatonic Valley Henry AbbottNortheast H.H. EllisNorthwest Oliver WolcottSouth Central I Eli Whitney
Emmett O'BrienSouth Central II PlattSouth Central Ill H.C. WilcoxSouth Central V VinalSoutheast NorwichSoutheast Shore E.T. GrassoStamford J.M. WrightWaterbury W.F. Kaynor
Note: These exceptions only affect thedata for high school dropouts. They donot affect the data for the ConnecticutMastery Test Results or the ConnecticutAcademic Performance Tests.

Number of Children and Percent of Total Population - 1970, 1980, 1990
Northwest
Housatonic Valley
StamfordSouthwest I
Southwest II
BridgeportSouthwest III
Southwest IV
WaterburyNaugatuck Valley
South Central I
New HavenSouth Central IlSouth Central IllSouth Central IV
South Central VCentral I
Central II
HartfordCapitol I
Capitol II
Capitol III
Capitol IV
Capitol V
Northeast
Southeast
Southeast Shore
CONNECTICUT
49,000 34.0 42,643 27.2
36,278 37.0 36,569 29.7
35,903 33.0 25,053 24.5
33,619 34.2 26,469 26.2
44,202 34.8 31,855 26.1
47,276 30.2 39,803 27.9
37,107 34.3 30,038 26.2
33,441 34.9 27,687 27.4
34,354 31.8 26,678 25.8
28,288 35.8 26,693 28.1
43,417 32.6 32,162 24.0
39,246 28.5 31,863 25.3
39,641 33.8 29,247 24.9
31,878 34.8 25,140 26.6
28,573 36.6 25,171 27.6
38,746 33.7 33,748 26.2
33,346 36.8 28,188 28.2
34,790 30.4 23,689 22.5
48,353 30.6 39,530 29.0
34,245 32.4 24,779 24.2
38,867 32.7 29,181 24.3
51,183 40.2 36,453 28.3
34,267 33.6 27,992 24.4
35,791 34.6 30,171 26.4
29,070 34.4 26,750 29.0
41,589 36.0 35,051 29.1
38,532 33.6 _30,316 25.7
1,021,002 33.7 822,919 26.5
40,719 23.4
31,826 23.8
21,773 20.1
22,217 22.0
25,128 20.8
36,992 26.1
25,325 21.7
23,864 22.7
25,561 23.5
26.146 24.1
28,721 20.9
30,936 23.7
25,131 21.5
23,517 23.4
22,606 22.1
31,401 21.9
24,524 23.1
23.375 21.3
38,390 27.5
20,992 20.6
25,984 21.0
33,495 23.1
25,583 20.4
29,006 22.5
26.363 25.7
32,940 25.1
_27.066 21.8.
749,581 22.8
-31
-36
-39
-36
-40
-14
-37
-35
-26
-33
-36
-17
-36
-33
-39
-35
-37
-30
-10
-37
-36
-42
-39
-35
-25
-30
-35
-32
Sources: U.S. Bureau of the Census, Census of Population and Housing, 1970, 1980 and 1990.

REGION NAME
Northwest
Housatonic Valley
StamfordSouthwest I
Southwest II
BridgeportSouthwest III
Southwest IV
WaterburyNaugatuck Valley
South Central I
New HavenSouth Central II
South Central III
South Central IV
South Central Shore
Racial/Ethnic Background of Connecticut's Children - 1990
Central I
Central II
HartfordCapitol I
Capitol ll
Capitol III
Capitol IV
Capitol V
Northeast
Southeast
Southeast Shore
CONNECTICUT
WHITENumber Rate
BLACKNumber Rate
ALL OTHER RACES HISPANIC.ORIGINNumber Rate Number Rate
39,488 97.0 472 1.2 759 1.9 607 1.5
28,674 90.1 1,289 4.1 1,863 5.9 1,759 5.5
14,139 64.9 5,908 27.1 1,726 7.9 2,780 12.8
20,695 93.1 413 1.9 1,109 5.0 792 3.6
20,142 80.2 3,483 13.9 1,503 6.0 2,465 9.8
16,643 45.0 12,617 34.1 7,732 20.9 14,134 38.2
23,043 91.0 1.468 5.8 814 3.2 1,016 4.0
23,044 96.6 242 1.0 578 2.4 576 2.4
17,722 69.3 4.618 18.1 3,221 12.6 5,781 22.6
25,103 96.0 432 1.7 611 2.3 615 2.4
25,771 89.7 2,017 7.0 933 3.2 846 2.9
10,530 34.0 15,969 51.6 4,437 14.3 6,692 21.6
22,046 87.7 2,236 8.9 849 3.4 973 3.9
20,845 88.6 1.009 4.3 1,663 7.1 3,503 14.9
21,978 97.2 226 1.0 402 1.8 430 1.9
28,520 90.8 1,998 6.4 883 2.8 1,078 3.4
23,431 95.5 538 2.2 555 2.3 795 3.2
17,914 76.6 1,946 8.3 3,515 15.0 5,217 22.3
9,487 24.7 16,978 44.2 11,925 31.1 17,930 46.7
17,716 84.4 2.087 9.9 1,189 5.7 1,409 6.7
22,147 85.2 2,701 10.4 1,136 4.4 947 3.6
30,470 91.0 1.911 5.7 1,114 3.3 855 2.6
24,236 94.7 457 1.8 890 3.5 697 2.7
27,684 95.4 479 1.7 843 2.9 612 2.1
24,709 93.7 333 1.3 1,321 5.0 1,796 6.8
30,820 93.6 1.115 3.4 1,005 3.1 931 2.8
22,607 83.5 2,581 9.5 1,878 6.9 2,105 7.8
609,604 81.3 85,523 11.4 54,454 II7.3 77,341 10.3
Note: People of Hispanic origin may be of any race.
Sources: U.S. Bureau of the Census. Census of Population and Housing, 1990.
50
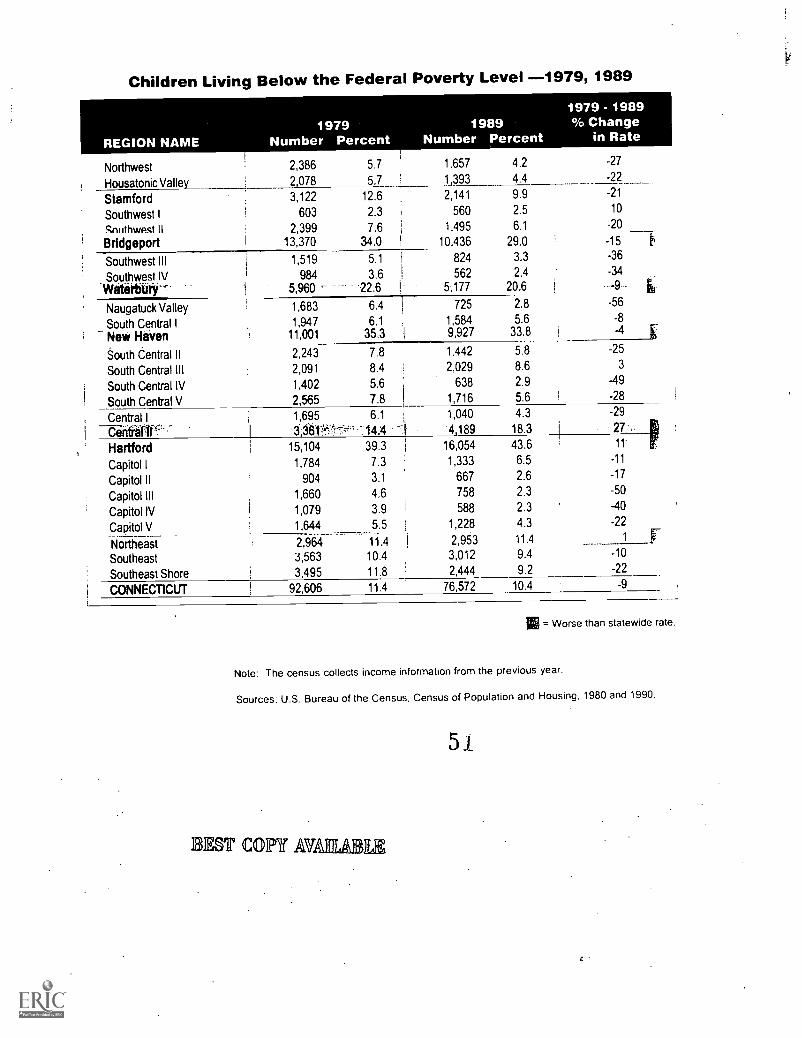
Children Living Below the Federal Poverty Level -1979, 1989
REGION NAME1979
Number Percent1989
Number Percent
1979 - 1989% Change
in Rate
Northwest 2,386 5.7 1.657 4.2 -27
Housatonic Valley 2,078 5.7 1 393 4.4 -22
Stamford 3,122 12.6 2,141 9.9 -21
Southwest I 603 2.3 560 2.5 10
Sni ithwpst II 2,399 7.6 1,495 6.1 -20
Bridgeport 13,370 34.0 10,436 29.0 -15 E.
Southwest III 1,519 5.1 824 3.3 -36
Southwest IV 984 3.6 562 2.4 -34
WMèrbury 5,960 22.6 5,177 20.6 -9
Naugatuck Valley 1,683 6.4 725 2.8 -56
South Central I 1,947 6.1 1,584 5.6 -8
Nevi HaVen 11,001 35.3 9,927 33.8 4
'outh Central II 2,243 7.8 1,442 5.8
South Central III 2,091 8.4 2,029 8.6 3
South Central IV 1,402 5.6 638 2.9 -49
South Central V 2,565 7.8 1,716 5.6 -28
Central I 1,695 6.1 1,040 4.3 -29
14.'4 4,189 18.3 27
Hartford 15,104 39.3 16,054 43.6 1 1
Capitol I 1,784 7.3 1,333 6.5 -11
Capitol II 904 3.1 667 2.6 -17
Capitol Ill 1,660 4.6 758 2.3 -50
Capitol IV 1,079 3.9 588 2.3 -40
Capitol V 1,644 5.5 1,228 4.3 -22
Northeast 2,964 11.4 2,953 11.4 1
Southeast 3,563 10 4 3,012 9.4 -10
Southeast Shore 3,495 11 8 2,444 9.2 -22
CONNEC11CUT 92,606 11 4 76,572 10.4 -9
IV
= Worse than statewide rate.
Note: The census collects income information from the previous year.
Sources: U.S. Bureau of the Census, Census of Population and Housing, 1980 and 1990.
EST COPY AU
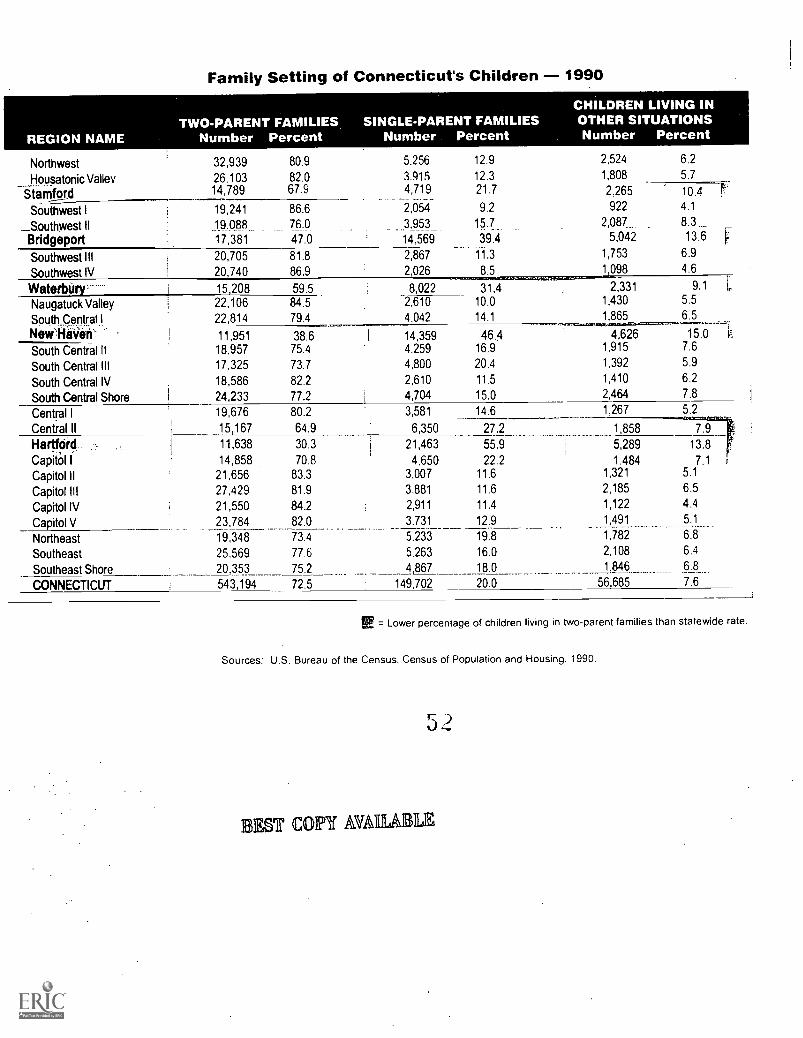
Family Setting of Connecticut's Children - 1990
Northwest
Housatonic Valley
32,939
26.10314,789
80.9
82.067.9
5,256
419,71159
2,054
3.953
14.569
12.9
12.321.7
9.2
1.7_.39.4
11.3
8.5
2,524
1,808
6.2
5.7
_Stamford 2,265
922
2,087_1,575,0342
1,098
10.44.1
8.313.6
6.9
4.6
Southwest I
__Southwest IIBridgeport
19,241
19.08817,381
86.676.0
47.0
Southwest IIISouthwest IV
20,705
20,740
81.8
86.9
2,867
2,026
Waterbtiry----- 15,208 59.5 8,022 31.4 2,3311,430
1,865
9.1
5.5
6.5..---__.--i15.0 r.
7.6
5.9
6.2
7.8
Naugatuck ValleySouth_Central INevi:NE.1.4k:-
22,10622,814
84.5
79.4
-2,610
4.042
10.0
14.1 _11,95118,957
17,325
18,586
24,233
38.675.4
73.7
82.2
77.2
1
1
14,3594.259
4,800
2,610
4,704
46.416.9
20.4
11.5
15.0
4,6261,915
1,392
1,410
2,464
South Central II
South Central III
South Central IV
South Central Shore
Central ICentral II
19, 676
15,167
11,638
14,85821,65627,429
21,55023,784
19,348
25.569
20,353
543,194
80.2
64.9
30.3
70.883.3
81.9
84.2
82.0
73.4
77.6
75.2
j
3,581
6,350
21,463
4.6503,007
3.881
2,911
3.731
5.233
5.263
4 867
14.6 1,267 5.2
27.2
55.9
22.211.6
11.6
11.4
12.9
19.8
16.0
18.0
1,858
5,289
1.4841,321
2,185
1,122
1,491
1,782
2,108
1,846
7.9
13.8
7.15.1
6.5
4.4
5.1
6.8
6.4
6.8
HartfOrd.CapitOl I
Capitol II
Capitol III
Capitol IVCapitol VNortheast
Southeast
Southeast Shore
CONNECTICUT 72.5 149,702 20.0 56,685 7.6
E = Lower percentage of children living in two-parent families than statewide rate.
Sources: U.S. Bureau of the Census, Census of Population and Housing. 1990.
31EST COPY AMIABLE

Children Receiving Welfare Benefits
From the 1990 census we know that in Connecticut, children are almosttwice as likely to be poor as adults. We know that our youngest childrenare more likely to live in poverty than older children. We know thatchildren living with only their mother are sixteen times more likely to bepoor than those living with two parents. Over the past 25 years, Connecti-cut has seen its children get poorer, while the income of its elderly hasgrown. The Center on Budget and Policy Priorities analysis of census dataof 1992-94 indicated that 18.7% of Connecticut's children live in poverty.
120,000
I 100,000
80,000
60,000
40,000
Beyond the harmful physical effects of poverty described earlier (see 20,000
page 12), poverty in childhood places children at risk for many otherproblems, including poor mental health, school failure, teenage childbear-ing, child abuse and neglect, crime, and delinquency. The data throughout this book are testament to the link between growing up inpoverty and experiencing the other problems examined here, such as infant mortality, child deaths, teen violence and teen pregnancy.
Children .RecelvIngMelfare Benefits
ioe our-- 111'510_,
1992 1993 1994 1995 1998
There are few local measures of child poverty other than the national census conducted every ten years. The number of children whoreceive welfare benefitspreviously Aid to Families with Dependent Children (AFDC) and now Temporary Assistance to Needy Families(TANF)is the best measure available in Connecticut to supplement the poverty data from the 1990 census. On average, one in sevenchildren in Connecticut relied on TANF in 1996, down more than 7,000 children from a year earlier. This decrease in program participation is ipart due to a decrease in Connecticut's unemployment rate during this timethe public assistance caseload has historically paralleled tho
unemployment rateas well as to changes in the welfare system such as time limits and the earned income disregard, which makes work pz
Yet, these statistics underestimate the number of poor children in our state. The number of children receiving welfare benefits is less thaithe total number of children who are poor. This is partially because the high cost of living in Connecticut is not taken into account byfederal and state welfare programs. For example, the federal poverty level of $13,330 per year for a family of three is not even enough topay for an average two-bedroom apartment in our state.
Poor children are disproportionately concentrated in Connecticut's four largest citiesmore than half of the AFDC caseload (53%) live inHartford, New Haven, Bridgeport or Waterbury. Poverty is not exclusively an urban problem, however; there are children in every town inConnecticut living below a subsistence level.
Note: The numbers shown here are the total number of children receiving benefits on June 30th of that year. It is a snapshot in time and does not represent the total numbr
of children who received benefits at any time during that year. The annual average number is calculated by adding the number of children receiving benefits on June 30th of
each year, and dividing by two. The annual average rate is calculated by dividing the annual average number by the total number of children in that region. The number of
children used to calculate the rates is based on applying the percentage of population under 18 for each region from the 1990 Census to the Connecticut Department of Hea
estimate of population by town for the years 1992 and 1994. The estimate of the costs of child poverty is based upon a direct estimate of the total impact of childhood poven
on future annual earnings including effects on work hours and unemployment and effects related to quality of schooling, poor health and other factors.

1995-96ANNUAL AVERAGENumber Percent
1,974 4.7
% BetterChange orin Rate Worse
4
2,143 6.5 0
3,035 13.6 -1
301 1.3 8
2.347 9.2 1
13,684 38.3 3
1,167 4.7 9
346 1.4 0
Children Receiving AFDC Benefits - 1992-1993, 1995-1996(Aid to Families with Dependent Children)
REGION NAME
Northwest
1992-93ANNUAL AVERAGENumber
1,835
Percent
4.5
2,093 6.5
2,980 13.8
260 1.2
2,301 9.1
13,559 37.3
1,077 4.3
341 1 4_
7,913 31.5
Housatonic Valley
StamfordSouthwest I
Southwest IIBridgeportSouthwest Ill
Southwest IV
WaterburyNaugatuck ValleySouth Central I
New Haven
South Central IIsOtithttififffili.South Central IV
South Central VCentral ICentral II
HartfordCapitol I
-Capitol II
Capitol IIICapitol IVCapitol V
Northeast
Southeast
Southeast Shore
CONNECTICUT
8,327 33.C'
893
2,01513,807
2,499
"3rSitfw:4,416:1).
3.4
7.0
45.5
958
2,34713,711
3.6
8.3
46.8
11.8
17.1
.10.0 2,882
4,012
853 3.7 950 4.1
1,935 6.1 2,040 6.3
1,771 7.2 2,025 8.35,440 23.7 6,086 27.0
23,193 60.3 21,549 57.8I 2,792 13.4 3,763 18.4
1,028 4.0 1,357 5.4
1,342 4.0 1,605 4.8
613 2.4 729 2.9
1.377 .4.7 1,500 5.1
3.424 12.9 3,494 13.0
2,665 8.1 2,657 8.1
3,008 11.2 3 021 11.5
104,545 14.0 I 108,009 14.5
5
6
19
3
18
14
11
3
15
14
ireitak4
35
20
21
9
1 -0 03 -4
_ Worse than statewide rate.
urces: Table data from unpublished data from the Connecticut Department of Social Services and Estimated Populations in Connecticut from the Connecticut Departmentlealth. Text also includes information from the Children's Defense Fund, Wasting America's Future. 1994: U.S. Bureau of the Census. Census of Population 1970 and90 National Commission on Children. Beyond Rhetoric. 1991: and Legal Assistance Resource Center. The New Welfare Law: Issues and Options lor Connecticut. 1997.
4
5 4
EST COPY MIRA

Low Birthweight Rate
In 1995, 7.1% of all babies born in Connecticut had a low birthweight (under 2,500 grams, about 5 1/2pounds). This translates to 3,129 ofthe more than 44,000 babies born that year. During the last decade there has been a slight worsening of this rate as seen on the graph
below.
.; 8.0
17 6.46
-0
c 5
t"8 3-8
LT 2Z2 Ic
0
6.6
Percentage of Low Birthweight Births
6.7 6.6 6.7 6.8 6.9 6 6 6.9 6.9 6.9 6 9 7.1
1983 1984 1983 1988 1997 1988 1989 1990 1991 1992 1993 1994 1995
Low birthweight is a measure of the immediate risk to a newborn; low birthweight babies account for about 60% of all infant deaths. It is
also a measure of future risks to the child; low birthweight babies who survive are about three times more likely to experience serious
health and developmental problems, such as sight and hearing deficiencies, chronic respiratory problems and learning difficulties. Thes(
children may require special medical and educational services throughout their lives.
Although researchers do not know all the factors that cause low birthweight, the health of the mother and the care she receives wh(
pregnant are the two most important factors for a healthy baby. Smoking, inadequate nutrition, alcohol or other drug use, and streduring pregnancy all increase the likelihood that a mother will have a low birthweight baby. Similarly, mothers who receive late ot
infrequent prenatal care are also much more likely to have a low birthweight baby.
INote: The rates are calculated by dividing the number of low birthweight births by the total number of births in that region. then multiplying that by 1.000 to obtain a low
birthweight rate per 1,000 births.
5 ,)

Low Birthweight Rate - 1985, 1990, 1995(per 1,000 births)
Northwest
Housatonic Valley
108
96
52.3
54.7
127
91
52.4
42.7
119
111
132
60.0
54.875.3
55.6
65.7
'
15 -28 -
-1 +24 -
5 -Southwest I
Southwest UBridgeportSouthwest III
Southwest IVWaterbury
Naugatuck Valley
South Central I
L...._
.
I
.
, .
.
..
,
- _ _ __. _
83 54.2 | 146 76.3I'
31
259-
76
50125
36.4
63.3941 I
51
118286
45.0
62.493.5 I
70
128202 89.5
57.6
46.0
I -4 +12 --3 4/-
57.9
43.772.4
73
59171
51.6
47.583.0
!,
75
66190 108.3 30
27 -19 -
13 --6.--- -----;-
-10
-10
5g
81
107
26581
66
57
103
65.563.1
59
103
237
96
98
74
120
43.2
55.6
i
I
I
68
101
201
86
78
63
11270
55.0V 9108.6
_ __.
61.5
54.9
48.2
59.2gn g
New HavenSouth Central 11
South Central III
South Central IV
South Central V
117.8
52 1
46.5
49.2
59.1
96.3
57.8
60.7
53.5
56.4cA 7
Central II 111 76.5 129 75.6 124 89.9 19 -Hartford 326 115.6 421 129.7 309 133.9 3 -
:, 85., -; 87 I, - -,:4_,....,,,,,_,,,,,f4.-i:I:i.
''''.''.6--f-'. ,. -.80Ii.:;c,;.;::AF-, :-'''
53.4,,,,.., ,. .
'''-125. .. 89.6.., 68 -
CipitotlI 63 30 -Capitol'111. 101 5177 10 49:4 i 105- 57.1 16
Capitol IV 57 45.9 74 49.4 71 48.5 -2
Capitol V 85 50.7 83 49.0 97 63.7 30
Northeast 95 68.7 98 65.5 101 70.2 7
Southeast 104 54.7 125 62.0.. _
120 67.6 9
Southeast Shore 106 55.4 114 56.6 I 90 52.1 -8 +CONNECTICUT I 2,915 66.6 i 3,294 66.2 I 3,129 71.0 : 7 -
er = Worse tnan statewide rate.
irces: Table data from the Connecticut Department of Public Health and Addiction Services, unpublished data, and Registration Reports. 1983 through 1995. Text alsoJ des information from the Institute of Medicine. Preventing Low Birthweight. 1985: Schorr. L.B., Within Our Reach: Breaking the Cycle of Disadvantage. 1988: National
nmission on Children, Beyond Rhetoric. 1993.
EST COPY AVAIIIIABILE

Infant Mortality
The infant mortality rate compares the number of children who die before their first birthday with the number of live births. In 1995, the
infant mortality rate was 7.3 per 1,000 live births (or 0.73%).
This continues a steady but slow decline as seen on the graph below. State officials attribute this decline in infant mortality to improve-ments in expensive medical technologies used to keep premature and low birthweight babies alive, as well as to improvements in acces.
to preventive health care for infants and prenatal care for women of childbearing age.
However, this progress has not been even across the state. When compared to ten years ago, 23 of the 27 regions showed an improve-ment in infant mortality rates, but four regions became worse. The South Central IV region had the largest improvement during the past
five years, with a 55% decrease in rates.
1210.0 10.3
10
Infant Mortality Rate
9.0 8.7 8.8 8.97.9 7.6 7.9
8 7.2 7.1 7.3
6
4
2
01983 1984 1985 1988 1987 1988 1989 1990 1991 1992 1993 1994 1995
Note: The annual average infant deaths shown here is the total number of babies who die before their first birthday over a three year period, divided by three. The annual
average rate is the total number of infant deaths over three years, divided by the total number of live births over the same three years. then multiplied by 1.000 to obtain an
infant mortality rate per 1.000 live births.

Infant Mortality Rate - 1986-88, 1991-93, 1993-1995(per 1,000 live births)
REGION NAME
1986-1988ANNUAL AVERAGEDeaths Rate
1991-1993ANNUAL AVERAGEDeaths Rate
1993-1995ANNUAL AVERAGE
Deaths Rate
Northwest 15 7.6 12 4.9 11 5.1
Housatonic Valley_ 9 5.6 11 5.5 12 5.8
Stamford 15 10.1 17 9.1 10 5.2
Southwest I 5 5 5 6 5.0 4 3.2
Southwest II 14 9.0 13 7.1 11 5 7
Bridgeport : 39 14.5 40 13.2,
.28 11.8
-Southwest ill 12 -0.4 f 417- 8 6.1
Southwest IV 9 8.3 6 4.9 6_ _ .... .
15
4.1 _8.2Waterbury 17 10.6 20
_10.0
....
,
Naugatuck Valley 8 7.0 10 7.4 7 5.7
South Central I 14 8.6 11 5.9 9 5.4New Haven 39 18.0 38 15.3 23 11.8
South Central II '43:9 12 7.5 1 -12'. 8.4
South Central II 7.3 14 8-.5 10 6.-7 I
South Central IV 5 4.6 7 5.5 3 2.5
South Central V 16 9.3_ 1.4. 6.8 15 7.4 :
Central I 10 7 6 12 8.1 5 4.0
1521 A -7 1 A 0 C n
Hartford 18.6 50 15.8 42Capitol I 9 7.6 13 8.7 11
Capit60I'' 10 8.6 9 6.7 15s-Capitol Ill 17 9.8 16 7.6 15
Capitol IV 7 6.2 13 8.8 6Capitol V 13 7.9 10 5.7 13
Nortneat 16 .12.0,
11 7.5 11
Southeast 18 9.5 i
i14 7.1 12
Southeast Shore 18 9.7 ! 22 10.9 , 12
CONNECTICUT 427 10.1 I 421 8.6,
i
339
% BetterChange orin Rate Worse
1
_30 -
-16 +_______.___. ---. -18 +
-23 +-8 +-23 +12
C 1 CI
16.3 3
7.9 -9
10.3 54
8.4 11
4.2 -52 +8.4 47 -8.1 1 8 -
6.6i
6.9 !
17.4
;ources: Table data from the Connecticut Department of Public Health, unpublished data. and Registration Reports, 1984 through 1995.
EST COPY AVAILME
-4 +-37 +-14 +
= Worse than statewide rate.

Late or No Prenatal Care
One of every eight babies born in our state (12.3%) in 1995 was born to mothers who received late or no prenatal care (carebeginning after the first three months, or trimester, of pregnancy). Yet early prenatal care is a cost-effective means to reduceproblems later in life which are associated with early birth and health problems. The Institute of Medicine estimates that for
every $1 invested in prenatal care, $3.38 will be saved in expenditures for the care of low birthweight babies in their first year
of life.
The good news is that the percentage of babies receiving prenatal care is increasing. In 1989, one in six babies got late or noprenatal care, but in 1993, the rate had improved to one of every eight. The bad news is that the 1995 rate is worse than it was
in 1994.
The babies of women who receive early prenatal care have lower risks of low birthweight, infant illness, and infant mortality.
Women who do not receive routine care are approximately three times as likely to deliver low birthweight infants as those
who do. The positive effects of early care are greatest for those women who are at the highest risk of poorbirth outcomes:
black women, women of Hispanic origin, poor women, very young women, and poorly educated women. Unfortunately,these women are also the least likely to receive that care. Barriers to seeking prenatal care include a lack of knowledge about
the importance of care and a lack of health care insurance and access.
18-16.516 /Mm...._ 15.1
Births with late or no prenatal care
13.714 12.6 12.5 12.312
11.5
1 0
8
6
4
2
0 1989 1990 1991 1992 1993 1994 1995
Note: The annual averaoe number shown here is the total number of births with late or no prenatal care over a two-year period, divided by two. The annual
average rate is the total number of births with late or no prenatal care over two years. divided by the total number of births where the status of prenatal care has
been determined.

Births with Late or No Prenatal Care - 1989-90, 1994-95
Northwest
Housatonic Valley
323
194
14.5
10.0
178
115
8.9
5.7Stiffin 396 213.. -I8-.6
Southwest I 85 8.3 54 5.1Southwest II 322 18.5 238 13.8Bridgeport 699 29.7 354 17.4
Southwest III 104 8.7 70 5.5Southwest IV 80 7.3 44 3.5
Waterbury 700 40.4 531 31.3-7
Naugatuck Valley 199 15.9 134 11.0South Central I 198 12.5 138 8.8New .Haven 540 32.5 367. .22.3Snnth Central Il
South Central III,168
22012.4
15.1
117
221
8.5
15.2.;
1
South Central IV 88 8.0 I 69 5.5South Central V 174 9.1 I 195- 10.2Central I 144
'18710.7 91 8.1
'Central II 11.6 195 14.b
Hartford 645 24.4 I 362 17.5
Capitol I 143 10.6 Ik------. 10.4Capitol ll 70 5.5 60 4.5Capitol III 127 6.5 104 6.0Capitol IV 62 4.5 68 4.9Capitol V 140 8.5 159 10.1
Northeast 217 15.2 137 -9-.9Southeast 279- 15.8 247 13.7
Southeast Shore 402 20.8 300 17.1
CONNECTICUT 6,899 15.8 4,998 11.9
-
-38 +-43 +-17 .,'.-.?..:4+.::'4-,-,
-39 +-25 ....!4-,.--'-41 +
-37 +-52 +-23 +-31 +-30 + .
-31 . . +-31
1
-31
13
-24Lb
I -29 ;.+-3
-20
-9
7
19
-35-13
-18
-25 +
= Worse than statewide rate.
jrces: Table data from the Connecticut Department of Public Health, unpublished data, and Registration Reports, 1989-1995 Text also includes information from thetitute of Medicine, Preventing Low Birthweight. 1985; and National Commission on Children. Beyond Rhetoric, 1993
60
EST COPY AVM \

Births to Teenage Mothers
There are three important ways to look at teen pregnancy. One is to look at the absolute number of teen births. Another is to compare thinumber to the total number of births to mothers of all ages in that yearthis would tell us something about the risks to that generation of
babies. The third way to look at teen pregnancy is to compare the number of teen births to the number of teenage girls, the "teen birth
rate"this would tell us something about the sexual activity and risk of teen pregnancy among teenage girls.
The table on the right displays the first two of these measures, which focuses on the risk to our youngest generation. Researchindicates that children of teen mothers are more likely to grow up poor, relying on public assistance. They are also at greater risk olower intellectual and academic achievement, behavior problems, and early childbearing than are children of older mothers. Both thrate and the number of all births to teenage mothers have decreased over the past ten years, which shows some improvement for th .
generation of children being born today.
1 0
9
876543
21
0
Births to mothers under age 209.9
1983 1984 1985 loss 1987 1988 1989 1990 1991 1992 1993 1994 1995
The teen birth rate, that is the number of teen births compared to the number of teenage girls, is no longer increasing in Connecticut or th
United States. Nevertheless, with 40 births for every 1,000 girls and a large increase in the number of teenagers over the next ten years. w.
can expect an increase in the total number of births to teen mothers in Connecticut in the near future.
The teen birth rate is a function of teens' capacity and motivation to prevent pregnancy. If girls believe they have alternative life options
such as college or a career, they are much more likely to delay parenthood. Thus, being poor and without these hopes increases thelikelihood of teen pregnancy. Teens who exhibit problem behavior in school are more likely to end up teen mothers; girls whose friends
and siblings are already mothers are also more likely to become teenage mothers.
Note: The number of teen births shown here is the total number of babies born to mothers age 19 or younger. The rate is the total number of teen births divided by the total
number of births, then multiplied by 100 to get a percentage. The percentage shown here measures the risks to the generation of babies being born today. The teen binhr
,vhich compares the number of teen births to the number of teenage giris, is not available at a local level. This is because of a lack of reliable data for the number of teenaor
girls to use as a denominator and the inability to make estimates because of the narrow age range. The teen birth rate of 40 births per 1000 girls is based on the number of
owls ages 15-19.

Percent of All Births That Are to Teenage Mothers - 1985, 1990, 1995
Northwest
Housatonic Valley_Ste m-foiaSouthwest I
Southwest II
BridgeportSouthwest III
Southwest IV'Waterbury
Naugatuck Valley
South Central I
New HavenSouth Central II
SoUth Central IIISouth Central IV
South Central V
Central I
_Central IIHartford.:
Capitol IICapitol III
Capitol IV
Capitol V
Northeast_Southeas-t
Southeast.Shore..,':
CONNECTICUT
143
82
127
11
124
539
I
6.9
4 6
8.1
1.2
7.6
19.7
119
87
119
14
103
544
4.9
4.0
6.1
1.1
5.3
17.8
.
114
118
112
5
93
428
5.7
5.8
6.2
0.4
4.6
18.9 I
. :
s
16
45
2
-64
-13
6
'
--
++
64 4.9 53 3.7 52 4.0 8
17 1.5 12 1.0 15 1:0 n n
274 15.9 314 15.2 283 16.1 6
4b 3./ 55 4.0 45 3.6 -10
64
432
3.8
19.2
80
392
4.3
15.9
85
320
5.2
17.3
21.
9
__
112 7.2 93 5.6 89 6.3 13 -127 8.9 146 -970 150 10.6 I 18
39 3.4 44 3.2 49 3.7 16
126 7.2 88 4.1 82 4.3 5 -77 5.7 101 6.8 102. 7.8 15 -
157 10.8 207 12.1 186 13.5 12
637 22.5 747 23.0 598 25.9 13
81 6.4 108 7.2 127 9.1 26
40 3.2 45 3.4 66 4.6 35 -75 4.3 88 4.3 97 5.3 23 -33 2.7 19 1.3 38 2.6 100 -86 5.1 85 5.0 49 3.2 -36
158 -1i 4. -141- 9.4- { 1.75 1-2:2 I jo197 10.4 1.49 7 4 153 8.6 16 -185 9.7 168 8.3 175 10.1 22
4,053 9.2 4,121 8.2 3,806 8.6 5 -
= Worse than statewide rate.
:Jrces: Table data from the Connecticut Department of Public Health, unpublished data. and Registration Reports. 1983 through 1995. Text also includes information
n National Center for Health Statistics. "Recent Declines in Teenage Birth Rates in the United States: Variations by State. 1990-94 1996: Child Trends. Facts at a Glance
)3: National Research Council, Risking the Future: Adolescent Sexuality. Pregnancy. and Childbearing. 1987: and National Commission on Children. Beyond Rhetoric. 1993
4.
62
EST COPY AVAIDIABLE

Child Deaths
There are approximately 146 deaths each year to children ages 1-14. For every death, there are 41 hospitalizations. The majority of death:to children between the ages of one and fourteen are due to injuries, most of them unintentional.
Child Deaths (ages 1-14)
16518016014012010080604020
0
148140
125
1991 1992 1993 1994 1995
The primary causes are different for injury deaths and hospitalizations and vary by the age of the child. For children ages 1-4, pedestrianinjuries (21%), burns (20%), and drowning (18%) account for most of the injury deaths, while falls (30%), poisoning (27%), and burns
(10%) account for most of the hospitalizations.
The three leading causes of injury deaths for children ages 5-9 are pedestrian injuries (27%), drowning (17%), and motor vehicle occupani
injuries (10%), while falls (37%), bicycle injuries (14%), and pedestrian injuries (11%) account for the majority of hospitalizations.
For children ages 10-14, pedestrian injuries (16%), homicide (12%), and motor vehicle occupant injuries (11%) account for most of the
injury deaths. Falls (26%), bicycle-related injuries (14%), and being struck by an object (12%) account for mostof the hospitalizations for
this preteen age group.
Note: The annual average number of child deaths shown here is the total number of deaths to children ages 1 to 14 over a three-year period, divided by three. The annual
average rate is the total number of child deaths over three years, divided by the total number of children ages 1-14 in 1994. then multiplied by 100,000 to get a rate per 100.01
children in that age group. The number of children used to calculate the rates is based on applying the percentage of population ages 1-14 for each region from the 1990
Census to the Connecticut Department of Public Health estimate of population by town for 1994.
63

19951993-95
ANNUAL AVERAGEDeaths Deaths Rate
25.1
19.8
1 4 21.1
3 4 23.2
4 3 15.1
6 12 43.2
1 3 15.3
3 3 15 9
Child Death Rate 1993-95(per 100,000 children ages 1-14)
REGION NAME1991
Deaths
I 4
7-7---HotiS-atoriic.
Northwest
!Valley
! Stamford
! Southwest I
: Southwest II
4
3
410 IBridgeport I
-Sotithwest.iil 4
Southwest IV 5Waterbury 3
I Naugatuck Valley 71
I 7.$outh.centralNew Haven I 12
, South Central II 7
1 '§ruitriWariffSouth Central IV 3
South Central V 4
Central I 5
Central IIHartford I 11
Capitol I 2
Capitol II 5
Capitol III 4
Capitol IV 2
Capitol V 3
NortheastI
3
Southeast 4
Southeast Shore 5
CONNECTICUT 140
1992Deaths
1993 1994Deaths Deaths
6 6 13
5 5
1 5 5
3 4 5
3 4 1
13 I 21 I 10 I
3 4 4
2 3 i 3
1
2 11 10
5 4 5
3 7 4I 9 I 12 13
4 3 ! 3
6. I 5
4 1 4
3 4 7
6
3
46 I
9
4
510
44.9
19.1
22.443.3
I
5 4 18.9
I 6 30.4
5 3 18.4
3 5 18.5
1 4 20.6
6 16
2 2
3 3
4 11
2 6
16
1
2
0
2
3 6 2
3 4_ 5
109 165 148
6._ 3.1,4
15 i 16 52.7 I
5 3 16.7
3 3 13.0
4 5 18.8
1 3 15.2
3 4 15.7
8 2g.1
7 5 19.4
5 5 22.2
125 ! 146 24.8
= Worse than statewide rate.
urces: Table data from the Connecticut Department of Public Health, unpublished data, and Registration Reports. 1991-1994. Text also includes information from themecticut Department of Public Health. "Childhood Injuries in Connecticut. Selected Statistics," and unpublished data; hospitalization information from an analysis of hospital;charge data, 1986-1990, and causes of death analysis of 1988-1992 Vital Statistics data, both by the Connecticut Childhood Injury Prevention Center.
64
EST COPY AVMILA 3,
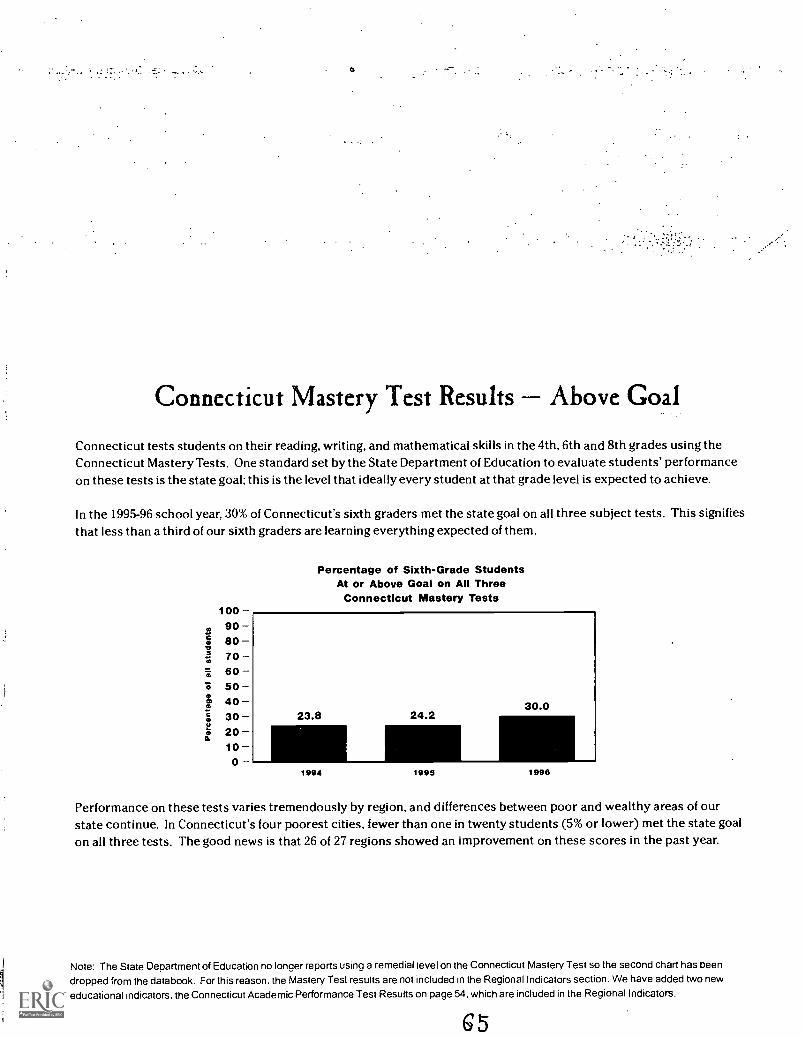
Connecticut Mastery Test Results Above Goal
Connecticut tests students on their reading, writing, and mathematical skills in the 4th, 6th and 8th grades using theConnecticut Mastery Tests. One standard set by the State Department of Education to evaluate students' performanceon these tests is the state goal; this is the level that ideally every student at that grade level is expected to achieve.
In the 1995-96 school year, 30% of Connecticut's sixth graders met the state goal on all three subject tests. This signifiesthat less than a third of our sixth graders are learning everything expected of them.
100908070605040302010
0
Percentage of Sixth-Grade StudentsAt or Above Goal on All Three
Connecticut Mastery Tests
1994 1995 1998
Performance on these tests varies tremendously by region, and differences between poor and wealthy areas of ourstate continue. In Connecticut's four poorest cities, fewer than one in twenty students (5% or lower) met the state goalon all three tests. The good news is that 26 of 27 regions showed an improvement on these scores in the past year.
Note: The State Department of Education no lonaer reports using a remedial level on the Connecticut Mastery Test so the second chart has beendropped from the databook. For this reason, the Mastery Test results are not included in the Regional Indicators section. We have added two neweducational indicators. the Connecticut Academic Performance Test Results on page 54, which are included in the Regional Indicators.

At or Above State Goal on All Three Connecticut Mastery TestsSixth Grade Students - 1994-95, 1995-96 and 1996-97 School Years
REGION NAME1994
Number Percent1995
Number Percent1996
Number Percent
BetterChange orIn Rate Worse
Northwest 523 25.0 589 27.7 811 35.7 29
Housatonic Valley 460 29.1 423. 28.1 500 31.3 11 4.
Stamford 129 15.1 89 11.1 146 16.5 49
Southwest I 409 42.2 436 42.4 499 46.5 16 +Southwest II 326 29.1 288 25.1 375 30.9 23 +Bridgeport I 48 3.6 49 3.3 67 4.7 i 42 +
Southwest III 327 26.2 362 28.4 464 36.1 27 +Southwest IV 453 36.5 407 32.7 538 41.2 26 +Waterbury 43 5.0 44 5.0 31 3.3 -34
Naugatuck Valley 432 29.7 507 34.5 546 35.0 1 +South Central I 369 26.1 294 20.7 518 34.4 66 +New Haven 36 3.1 31 2.7
. ._._59 5.2._________...
93 +_ ______________
South Central II - - .SoutlitAINAVI:5,;,..7,
264,.
--""1"6-i--22.6_
1'5.4
318
213-
26.3f9.6
425277
32.924.8 I
25 4.27 +
soutn uentrai Iv 393 32.1 378 30.7 457 36.2 18 +South Central V 467 28.6 570 33.9 680 40.7 20
Central I 349 28.8,
266 21.6 400 31.7:
_+__ ____47 .1.
Central ll 118 13.0 179 17.4 209 19.8 14
Hartford 36 2.2 52 3.2 53 3.5 9 + r
Capitol I 174 18.9 240 23.7 239 24.1 2 +
Capitol II 611 43.6 600 41.1 671 4.7.4 15 +Capitol III 452 25.0 424 23.4 609 33.9 45 +Capitol IV 468 34.6 593 39.8 675 45.2 14 +Capitol V 402 27.1 453 30.3 573 35.7 18 +Northeast 246 18.4 280 20.0 300 21.6 8 +Southeast 431 -24-.9 470 26.7 561 32.1 20 +Southeast Shore 276 22.8 236 19.8 418 33,5.
CONNECTICUT 8,394 23.8 8,791 24.2 11,101 30.0 24 +
Sources Table data from the Connecticut State Department of Education. Connecticut Mastery Test Results. 1994 1995. and 1996.
6
BEST COrr AVM1 kw,
= Worse than statewide rate.
..
Connecticut Academic Performance Test
The State Department of Education tests tenth grade students using the Connecticut Academic Performance Test. Eachtest consists of four major subtests: language arts, mathematics, science and an interdisciplinary task, and involveswriting an explanation or response in addition to multiple choice questions. The Department has set a goal standard foreach subtest to certify students' mastery of an area.
In May 1997, only one in eight Connecticut tenth graders (12.3%) was above the mastery level on all four subtests.
The Connecticut State Department of Education also determines two distinct levels below mastery: below standard andwell below standard. About one in three students (37.9%) was well below standard on one or more subtests. This, -indicates that two-thirds of students are failing to learn even the basics which are expected for their age group.
The differences between poor and wealthy areas of our state is particularly striking when looking at education scores. InConnecticut's four poorest cities, more than two-thirds of tenth graders (70.5% or higher) scored well below standard onat least one subtest, more than three times the rate of the wealthiest regions. Even more alarming is that less than 2% ofthe students in these four cities were above mastery in all four areas.
Note: These two measures of the well-being of our state's children are new to this year's databook.
G 7

Connecticut Academic Performance Test ResultsTenth Grade Students - 1996-97 School Year
'
-
lo . -
. -
Northwest 263 14 7 560 31.3Housatonic Valley 267 .395 2R 1
Stamford 49 7.0 376 53.8
Southwest I 244 25.4 180 18.8Southwest II 156 15.3 363
803 75.8Br.009.pOrt 15 1.4
South West III 140 12.0 407- 34.9southwest IV 190 18.3 211 20.3Wittetbdry . 10 1.5 459 70.5
Naugatuck Valley 138 11.3 371 30.4
Southtentral I 104 9.5 436 39.7
Neiqfiven 13 1.6 663 79.1
South Central II 89 9.3 397 41.5
Soitih Central Ill 54 6.4 351 41.3
South Central IV 147 13.8 317 29.7South Central V 172 14.5 361 30.3CentTatl 124 11.9 336 32.2
tehtral 69 8.3 389 46.6Hartford 7 0.7 830 82.6
86 11:1 300 38.9
Capik3i II 331 27.0 289 23.6Capitol III 198 13.6 428 29.4Capitol IV 212 17.3 263 21.4Capitol VNortheast
224 16.2 366 26.5
103_
7.8 546 41.4Southeast 136 9.3 484 33.0Southeast Shore 124 11.8 395 37.7CONNECTICUT 3.665 12.3 11,277 37,9
_
Sources: Table data from the Connecticut State Department of Education, Connecticut Mastery Test Results. 1994 and 1995.
68
BEST COPY AMU
r = Worse than statewide rate.

High School Dropouts
Each year, one in every 22 students (4.6%) in Connecticut drops out of high school. Three cities have dropout ratesthat are more than double the state averageWaterbury (13.1%), New Haven (10.3%), and Hartford (21.0%).
The dropout rate improved only slightly during the past five years, although the total number has increased (mostlydue to the fact that there are more kids enrolled in high school). Thirteen of the twenty-seven regions showed noimprovement during this time.
Applying the state dropout rate to a hypothetical class of 100 students entering ninth grade, only 82 would graduatefrom high school in a typical Connecticut town. In Hartford, only 51 would graduate.
The consequences of dropping out of high school can be severe. For example, in any given year, the likelihood ofslipping into poverty is about three times higher for high school dropouts than for those who have finished high school.Changes in the economy have made the financial outlook of dropouts even worsethe average hourly wage of highschool dropouts (adjusted for inflation) fell by 23% between 1973 and 1995.
Note: Dropout rates used here are only for high school students. They do not include the number of children who drop out of school before ninth
grade. The calculation of dropouts of a typical class in Hartford paints an optimistic picture of the dropout problem in Hartford because it does nottake into account the high dropout rate for students in grades 7 and 8. The dropout figures calculated by the State Department of Education includestudents who officially withdraw from school, those who enter a non-educational program (e.g. truck driving school or GED classes), and thosewhose status is unknown. Students transferring to another school are not counted as dropouts. These figures do not include the one percent ofstudents who are enrolled in ungraded classes.
G9
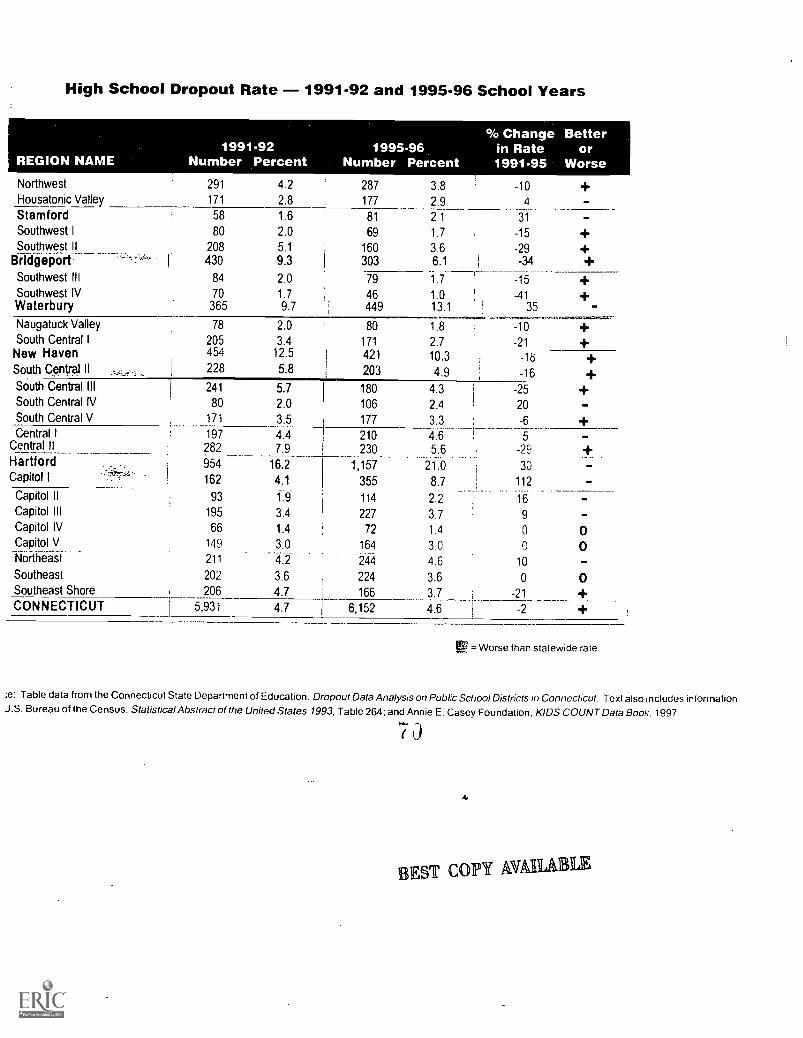
High School Dropout Rate - 1991-92 and 1995-96 School Years
REGION NAME1991-92
Number Percent1995-96
Number Percent
% Changein Rate1991-95
Betteror
WorseNorthwest 291 4.2 287 3.8 -10Housatonic Valley 171 2.8 177 2.9 4
Stamford 58 1.6 81 2.1 31
Southwest I 80 2.0 69 1.7 -15Southwest II 208 5.1 160 3.6 -29
Bridgeport I 430 9.3 303 6.1 -34
Southwest III 84 2.0 79 1.7 -15Southwest IV 70 1.7 46 1.0 -41Waterbury 365 9.7 449 13.1 35
Naugatuck Valley 78 2.0 80 1.8 -10South Central I 205 3.4 171 2.7 -21New Haven 454 12.5 421 10.3 -18South Central II 228 5.8
1203 4.9 -16
South Central III 241 5.7 180 4.3 -25South Central IV 80 2.0 106 2.4 20South Central V 171 3.5 177 3.3 -6Central I 197 4.4 210 4.6 5
Central II 282 7.9 230_ 5.6 -29HartfordCapitol I -,57.--;;;-- .
954
162
16.2
4.1
-1-,-157
355
_
21.0
8.7
30
112
Capitol II 93 1.9 114 2..2 16Capitol III 195 3.4 227 3.7 9Capitol IV 66 1.4 72 1.4 0
Capitol V.. 149 3.0 164 3.0Northeast 211 .--4.2 244 4.6 10Southeast 202 3.6 224 3.6 0 0Southeast Shore 206 4.7 166 3.7 -21CONNECTICUT 5,931 4.7 I 6,152 4.6 -2
= Worse than statewide rate
;e: Table data from the Connecticut State Department of Education, Dropout Data Analysis on Public School Districts in Connecticut. Text also includes informationJ.S. Bureau of the Census, Statistical Abstract of the United States 1993, Table 264: and Annie E. Casey Foundation, KIDS COUNT Data Book. 1997.
7
4
EST CO1191 AWL& a
Juvenile Violent Crime
Children under 18 make up one in five arrests for violent crimes in Connecticut. The vast majority of those youths arrested are boys.However, only a relatively small percentage of youths are violent. Less than one-half of one percent of juveniles in the U.S. are arrested fora violent offense in any given year.
Juvenile crime is somewhat different than adult crime. Violent crimes committed by juveniles peak at the close of the school day anddecline throughout the evening hours. In contrast, violent crimes committed by adults increase steadily from early morning throughmidnight. Similarly, juveniles are more likely to commit crimes in groups than are adults.
Most homicides committed by youth are committed with a firearm, occur during an argument, and occur among people who know eachother. Although teenage boys have always had fights, the consequences of the violence have become more extreme. Guns turn whatmight have been a fist fight thirty years ago into a homicide today. In 1995, 690 arrests of people under the age of 18 weremade in Con-necticut on weapons charges, mostly guns. This represents a decrease of 277 arrests compared with two years before.
Overall, children are disproportionately the victims of violent crime. In 1994, about a third of all victims of violent crimes were ages 12-19.Other youth are the most likely victims of crimes committed by young people; juvenile offenders account for nearly three-quarters ofviolent crimes against youth. The National Victimization Study shows that teenagers are more than twice as likely to be victims of all formsof crime than people age 20 or older, and more than three times as likely to be victims of violent crime than adults. Yet the vast majority ofjuvenile victimization is hidden from public view because only 30% of the crimes are reported to police.
Even children who are not direct victims of crime are still profoundly affected by it. Exposure to violence affects children's emotionalstability, their ability to function in school, and their sense of hope about the future. A 1992 survey of sixth, eighth, and tenth grade studenbin New Haven found that over 40% had witnessed violence in the past year.
Note: Violent crimes include murder, rape, robbery and aggravated assault. Because of the large difference in the number of arrests each year, all five years'data are shownseparately. The annual average number of arrests is a total for the two-year period divided by two. The annual average rate is the annual average number divided by thenumber of children age 10-17, multiplied by 100,000 to get a rate per 100,000 children of this age group. The number of children used to calculate the rates is based onapplying the percentage of population age 10-17 for each region from the 1990 Census to the Connecticut Department of Health estimate of population by town for the years1992 and 1995. The number of arrests of children for violent crimes includes arrests made by local and state police. Unfortunately, the data are not reported identically forthese agencies. Approximately 85% of all juvenile arrests for violent crimes are made by local police, and these data are reported by the town in which the arrest was made.The 15% of arrests made by the state police are reported by the town in which the child lives. State police arrests are important to include because many rural regions do nothave municipal police departments, and the majority of the arrests in these regions are made by the state police. Therefore, one should exercise caution when using this databecause the total number of juvenile arrests for each region includes data from these two sources. Despite these limitations, given the limited mobility of childrenages 10-17.police experts believe that these data are still valid.
71
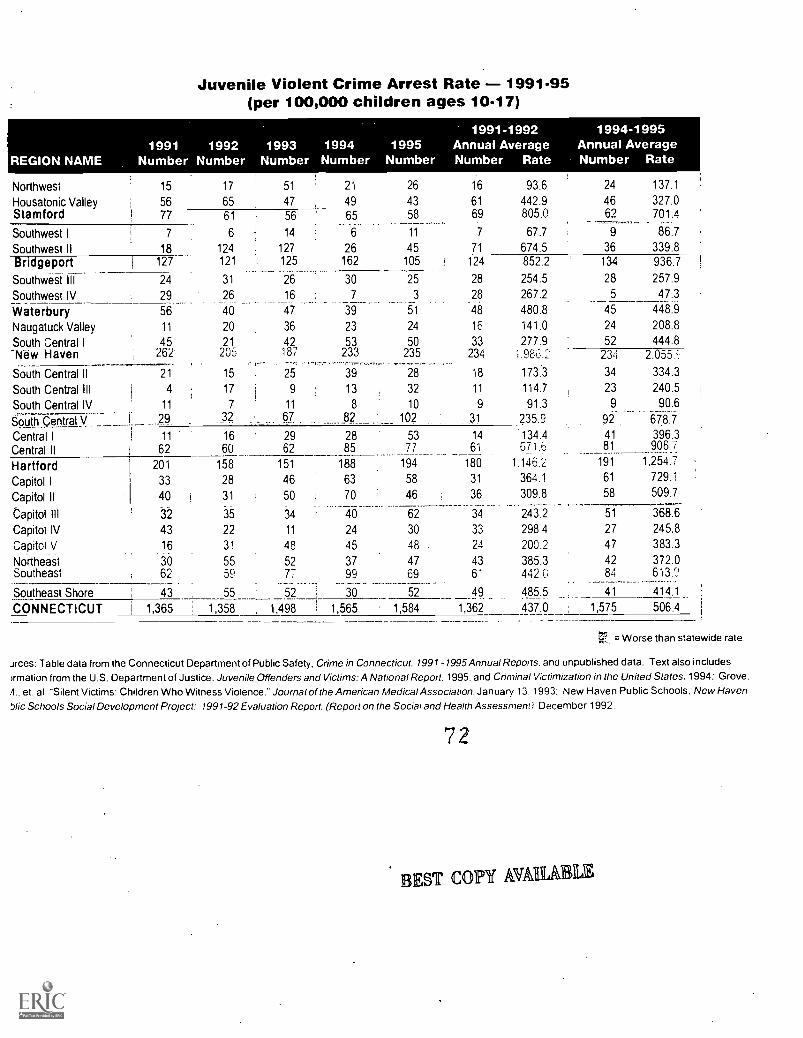
Juvenile Violent Crime Arrest Rate - 1991-95(per 100,000 children ages 10-17)
REGION NAME1991 1992
Number Number1993
Number1994Number
1995Number
1991-1992Annual AverageNumber Rate
1994-1995Annual AverageNumber Rate
Northwest 15 17 51 21 26 16 93.6 24 137.1
Housatonic Valley 56 65 47 49 43 61 442.9 46 327.0Stamford 77 61 56 65 58 69 805.0 69 701.4
Southwest I 7 6 14 6 11 7 67.7 9 86.7
Southwest II 18 124 127 26 45 71 674.5 36 339.8
Bridgeport 127 121 125 162 105 124 852.2 134 936.7
Southwest Ill 24 31 26 30 25 28 254.5 28 257.9
Southwest IV 29 26 16 7 3 28 267.2 5 47.3
Waterbury 56 40 47 39 51 48 480.8 45 448.9
Naugatuck Valley 11 20 36 23 24 16 141.0 24 208.8
South Central I 45 21 42 53 50 33 277.9 52 444.8-N-ew Haven 262 205 187 233 235 234 1.986.1 234 2.055.6
South Central ll 21 15 25 39 28 18 173:3 34 334.3
South Central III 4 17 9 13 32 11 114.7 23 240.5
South Central IV__ 11 7 11 8 10 9 91.3 9 90.6
s]cLV 29 32 67... _._.. . ....82: 102 31 235.9 92 678.7
Central I 11 16 29 28 53 14 .134.4 41 396.3
Central II 62 60 62 85 77 61 671.6 81 908.7
Hartford 201 158 151 188 194 180 1,146.2 191 1,254.7
Capitol I 33 28 46 63 58 31 364.1 61 729.1
Capitol II 40 31 50 70 46 36 309.8 58 509.7
Capitol IH .32 35 34 40 62 34 243.2 51 368.6
Capitol IV 43 22 11 24 30 33 298.4 27 245.8
Capitol 16 31 48 45 48 . 24 200.2 47 383.3
Northeast ab 55 52 37 47 43 385.3 42 372.0Southeast 62 59 77 99 69
-5-
61 442.6 84 613.0
Southeast Shore , 43 55 52 30 2 49 485.5 4-1 414.1
CONNECTICUT 1 1,365 1,358 1,498 1,565 1,584 1,362 437.0 , 1,575 506.4
= Worse than statewide rate.
jrces: Table data from the Connecticut Department of Public Safety, Crime in Connecticut. 1991-1995 Annual Reports, and unpublished data. Text also includeswmation from the U.S. Department of Justice, Juvenile Offenders and Victims: A National Report. 1995. and Criminal Victimization in the United States, 1994: Grove.
.4., et. al. "Silent Victims: Children Who Witness Violence." Journal of the American Medical Association. January 13. 1993: New Haven Public Schools. New Havenhlic Schools Social Development Project: 1991-92 Evaluation Report, (Report on the Social and Health Assessment). December 1992.
7 2
BEST COPY AVAIL&

Teen Deaths
The vast majority of teen deaths are caused by injury rather than disease. For teens age 15-19, unintentional injuries caused 45% of alldeaths in 1995. In most regions of the state, these injuries are unintentional; they are mostly due to car crashes, the leading cause of deatThis is not true, however, in Connecticut's three largest cities, where teen homicides are more than twice as likely as deaths from unintentional injuries.
The risk of injury-related deaths increases with age teens ages 15-19 are more likely to die of injuries than are children ages 1-14. Also.teen injury deaths are much more likely to be to teen boys than teen girls.
Homicide and suicide are the second and third single leading causes of death for 15-to-19-year-olds in our state. In 1995, 24 teenagerswere homicide victims (the lowest number in five years), accounting for one-fifth of all deaths for this age group. Eleven teens committcsuicide in 1995, also the lowest in five years.
Teen Deaths (ages 15-19)
Unint'l Injury Homicide Suicide Other Total1991 64 29 21 22 136
1992 47 33 12 24 116
1993 52 34 14 38 138
1994 55 40 19 29 143 1
1995 57 24 11 33 125
Total 275 160- 77 146 658
Young males are more likely to be victims of homicide than females. Girls are more likely to attempt suicide than boys, but boys are morlikely to be successful in their suicide attempts.
Note: Because of the small number of teen deaths in any given year. the chart shows only five-year total numbers of deaths by cause, notan annual average as in the other
charts. For the same reason, rates could not be calculated by region, and therefore this data is not shown on the regional pages.
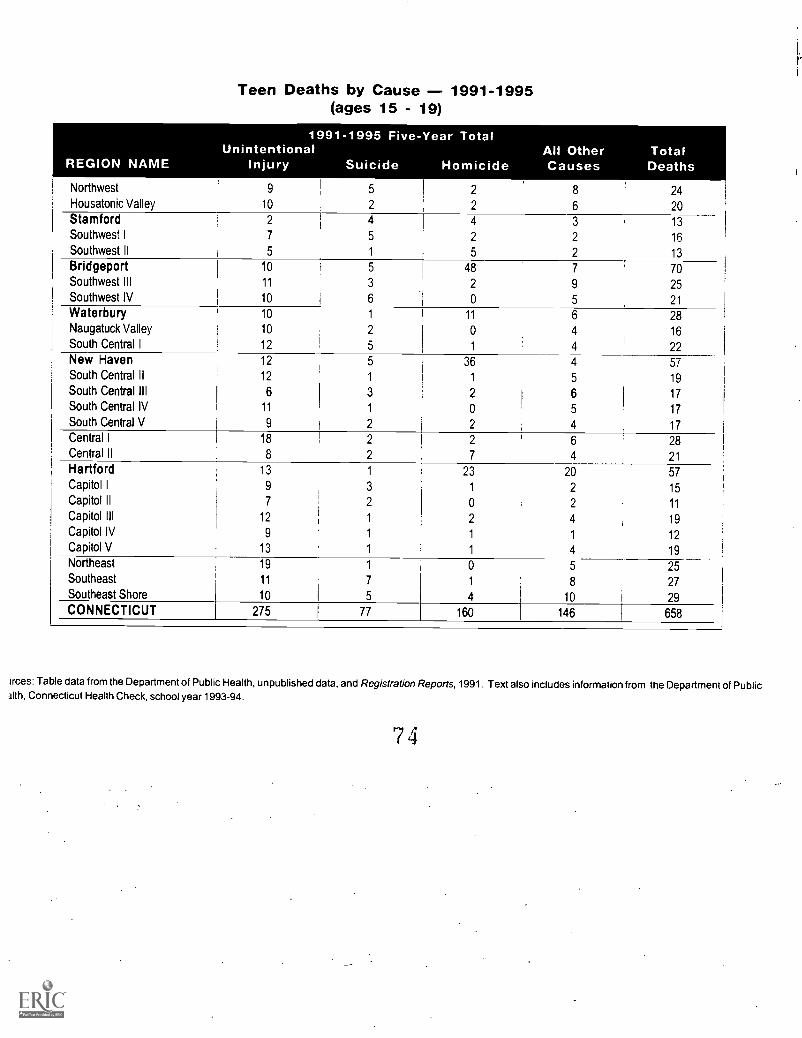
REGION NAME
Teen Deaths by Cause 1991-1995(ages 15 - 19)
1991-1995 Five-Year TotalUnintentional All Other Total
Injury Suicide Homicide Causes Deaths
Northwest 9 2 8 24Housatonic Valley 10 2 2 6 20Stamford 2 4 4 3 13Southwest I 7 5 2 2 16
Southwest II 5 1 5 2 13
Bridgeport 10 5 48 7 70Southwest III 11 3 2 9 25Southwest IV 10 6 0 5 21
Waterbury 10 1 11 6 28Naugatuck Valley 10 2 0 4 16South Central I 12 5 1 4 22New Haven 12 5 36 4 57South Central II 12 1 1 5 19
South Central III 6 3 2 6 17South Central IV 11 1 0 5 17South Central V 9 2 2 4 17Central I 18 2 2 6 28Central II 8 2 7 4 21
Hartford 13 1 23 20 57Capitol I 9 3 1 2 15Capitol ll 7 2 0 2 11
Capitol III 12 1 2 4 19Capitol IV 9 1 1 1 12Capitol V 13 1 1 4 19Northeast 19 1 0 5 25Southeast 11 7 1 8 27Southeast Shore 10 I 5 4 10 i 29CONNECTICUT 275 77 160 I 146 I 658
irces: Table data from the Department of Public Health, unpublished data, and Registration Reports, 1991. Text also includes information from the Department of Public3Ith, Connecticut Health Check, school year 1993-94.
7 4

Child Abuse
Child abuse occurs in all socioeconomic groups and in all types of families. No town in Connecticut is left untouched. The number ofchildren who are abused is considered to be substantially higher than the numbers which are reported to the authorities. In Connecticut,4.3% of all children are found to be abused or neglected, yet officials estimate between 8% and 10% of all children may be seriouslymaltreated.
10,00D
8,000
6,000 5,349
4,000
2,000
0
9,630
Child Maltreatment ReportsSFY 1995-96
930 424 187
8,046
1,735
e '0 e
Ng,
People who are victims of child abuse or neglect are more likely than other adolescents or adults to get into trouble later in life. Beingabused or neglected as a child increases the likelihood of arrest as a juvenile by 53%, as an adult by 38%, and for a violent crime by 38%.Research also suggests that the long-term consequences of childhood abuse include poor educational performance, health problems, andlow levels of achievement in adult life. Although most people who were abused as children do not grow up to abuse their own children,one characteristic that abusers have been found to share is a history of abuse in their own childhoods.
Note: The table to the right shows the number of children who were confirmed as abused or neglected, meaning that their case was reported to DCF, investigated, andevidence of maltreatment found, although if children were substantiated as abused twice in one year they have been counted twice. Even so, the number ofchildren who areabused or neglected is higher than the numbers shown here not every case of child abuse is reported, and sometimes those that are reported are not substantiated. Therate is the total number of children who were abused between July 1, 1995 and June 30, 1996, divided by the total number of childrenages 1L18 in 1995, then multiplied by100 to get a percentage. The number of children used to calculate the rates is based on applying the percentage of population under 18 foreach region from the 1990 Censusto the Connecticut Department of Public Health estimate of population by town for 1995.

Children Confirmed as Abused/NeglectedSFY 1994-95 and 1995-96
REGION NAME1994-95
Number Percent1995-96
Number Percent
% Changein Rate1995-96
Betteror
Worse
Northwest 1,007 2.4 990 2.4 0 0Housatonic Valley 1,051 3.2 1,150 3.5 9 IM1
Stamford 421 1.9 357 1.6 -16
Southwest I 106 0.5 67 0.3 -40 +Southwest II 368 1.4 564 2.2 57 -BridgeOort 1,460 4.1 1 1,769 5.0 22 -Southwest III 287 1.1
. 403 1.6
,1
45
Southwest IV 180 0.7 229 0.9 1 29 -Waterbury 1,218 4.8 1,547 6.1 27 -Naugatuck Valley 352- 1.3 377 1.4 8 -South Central I 814 2.9 1,010 3.6 24 -Nfir-Haven 3,164 10.7 3,408 11.6 8
South Central H 879 3.6 1,026 4.2 17Waterbury 1,218 4.8 1,547 6.1 27
South Central IV 681 3.0 608 2.6 -13 +South Central V 1.105 3.4 1,041 3.2 -6 +Central I
Central.11i
954
1,3283.9
5.8
1,341
2,132
5.5
9.4
41
62 -Hartford 3,724 10.0 5,065 13.6 36 -Capitol I 1,014 5.0 1,011 4.9 -2 +Capitol ll , 384 1.5 646 2.6 73 -Capitol III 674 2.0 765 2.3 15
Capitol IV 316 1.2 493 1.9 58
Capitol V 793 2.7 809 2.7 0 0Northeast 1,928 7.2 1,884 7.0 -3 +Southeast 1,321 4.1 1,197 3.7 -10
Southeast Shore 1 1,236 4.7 1,155 4.4 -6
CONNECTICUT 1
i27,726 3.7 32,147 4.3 16
= Worse than statewide rate.
Sources: Table data from the Department of Children and Families. Text also includes information from the Children's Division of the American Humane Association, ChildProtection Leader, March 1994: Department of Children and Families. Strategic Plan 1993-1998: Caring for Connecticut's Future, 1993; National Institute of Justice, TheCycle of Violence, September 1992: and National Center on Child Abuse and Neglect. National Child Abuse and Neglect Data System (NCANDS).
76
lEST COPY AVM

-
"14.
4
,1/--
5
4
':377
,,
C?'
ti,'
TZ
-1.

RegionalIndicators
Northwest
I-loos:111
Stailifor(l
Solithxyest I
Soul luvest II
Ilridgeport
Southwest III
Southwest IV
\\later [miry
N;Illganick
South Central I
New I LIVt'll
SiiiItiiIitIISouth Central III
South Central IV
South ('elitral V
CculnaI I
Central ll
Hart for(I
Capitol I
Capitol II
Capitol III
Capitol IV
capitol V
Nitntlicast
Sinitlicast
Southeast Shore

Nor
thw
est
Bar
kham
stea
d
Bet
hleh
em
Brid
gew
ater
Can
aan
Col
ebro
ok
Indi
cato
r
Cor
nwal
lR
oxbu
ry
Gos
hen
Sal
isbu
ry
Har
win
ton
Sha
ron
Ken
tT
hom
asto
n
Litc
hfie
ldT
orrin
gton
Mor
risW
arre
n
New
Har
tford
Was
hing
ton
New
Milf
ord
Wat
erto
wn
Nor
folk
Win
ches
ter
Nor
th C
anaa
nW
oodb
ury
Ply
mou
th
Wel
fare
Ben
efits
perc
ent o
f all
child
ren
rece
ivin
g be
nefit
s, a
vg. 1
995-
96
Low
Birt
hwei
ght
per
1,00
0 bi
rths
, 199
5
Infa
nt M
orta
lity
per
1.00
0 liv
e bi
rths
. avg
. 199
3-95
Late
or
No
Pre
nata
l Car
epe
rcen
t of a
ll bi
rths
, avg
. 199
4-95
Birt
hs to
Tee
n M
othe
rspe
rcen
t of a
ll bi
rths
, 199
5
Chi
ld D
eath
spe
r 10
0,00
0 ch
ildre
n ag
es 1
-14,
avg
. 199
3-95
Mee
ting
CA
PT
Goa
lpe
rcen
t of a
ll te
nth
grad
e st
uden
ts. 1
996-
97
Wel
l Bel
ow C
AP
T S
tand
ard
perc
ent o
f all
tent
h gr
ade
stud
ents
, 199
6-97
Hig
h S
choo
l Dro
pout
spe
rcen
t of a
ll st
uden
ts g
rade
s 9-
12, 1
995-
96
Juve
nile
Vio
lent
Crim
e A
rres
tspe
r 10
0,00
0 ch
ildre
n ag
es 1
0-17
. avg
. 199
4-95
Chi
ld A
buse
/Neg
lect
perc
ent o
f all
child
ren,
SF
Y 1
995-
96
Tot
al N
umbe
r of
Chi
ldre
n40
,71(
)
Per
cent
of T
otal
Pop
ulat
ion
23.-
I
Per
Cap
ita In
com
e$1
9,97
Chi
ld P
over
ty4.
2%,
Livi
ng W
ith T
wo
Par
ents
Chi
ldre
n's
Rac
ial/E
thni
c B
ackg
roun
d
Whi
te
Bla
ck1
Oth
er R
aces
His
pani
c (m
ay b
e of
any
rac
e)
Reg
ion
aie
No.
Rat
eW
orse
Tha
n S
tate
Rat
e.p
ate
Bet
ter
Tha
n S
tate
Rat
e
1,97
44.
7
119
60.0
115.
1
178
8.9
114
5.7
825
.1
263
14.7
560
31.3
287
3.8
2413
7.1
990
2.4
100%
75%
50%
25%
00
25%
50%
75%
14.5
71.0 7.4
11.9 8.6
1%24
.8
12.3
7 )
6_8%
15% 31
%
25%
E34
%
30
I 000
f
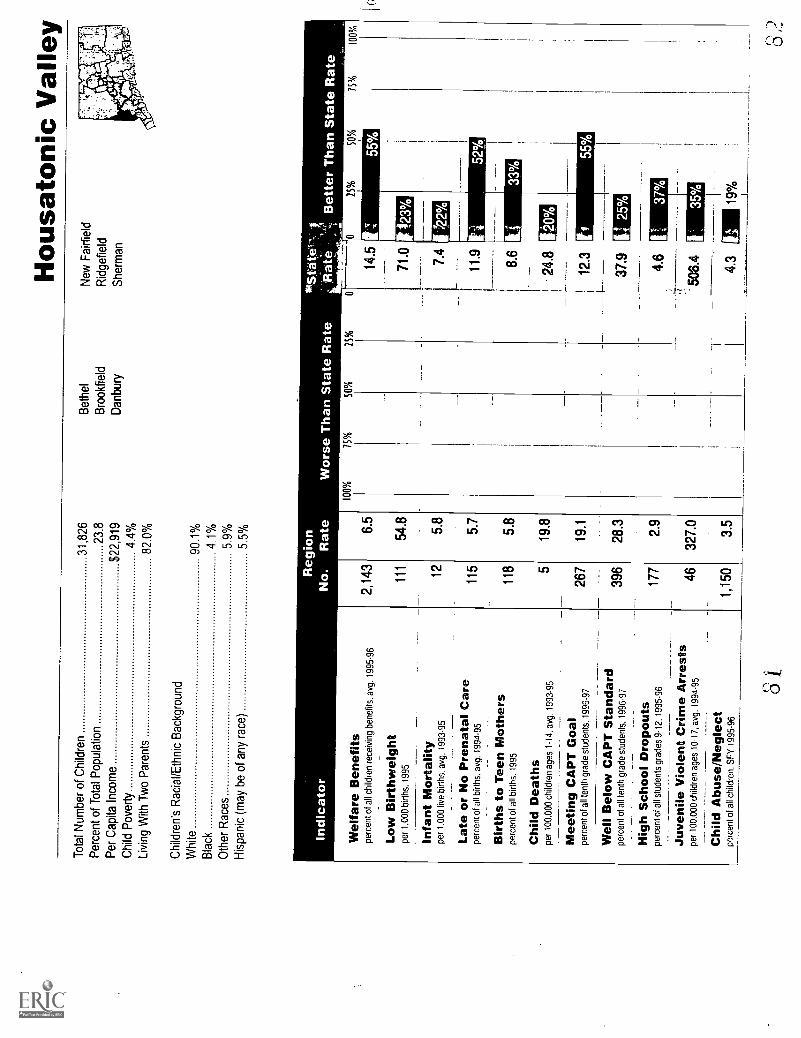
Hou
sato
nic
Val
ley
Tot
al N
umbe
r of
Chi
ldre
n31
,826
Bet
hel
New
Fai
rfie
ldP
erce
nt o
f Tot
al P
opul
atio
n23
.8B
rook
field
Rid
gefie
ldP
er C
apita
Inco
me
$22,
919
Dan
bury
She
rman
Chi
ld P
over
ty4.
4%Li
ving
With
Tw
o P
aren
ts82
.0%
Chi
ldre
n's
Rac
ial/E
thni
c B
ackg
roun
dW
hite
90.1
%B
lack
4.1%
Oth
er R
aces
5.9%
His
pani
c (m
ay b
e of
any
rac
e)5.
5%
Indi
cato
r
Wel
fare
Ben
efits
perc
ent o
f all
child
ren
rece
ivin
g be
nefit
s. a
vg. 1
995-
96
Low
Birt
hwei
ght
per
1,00
0 bi
rths
. 199
5
Infa
nt M
orta
lity
per
1.00
0 liv
e bi
rths
, avg
. 199
3-95
Late
or
No
Pre
nata
l Car
epe
rcen
t of a
ll bi
rths
. avg
. 199
4-95
Birt
hs to
Tee
n M
othe
rspe
rcen
t of a
ll bi
rths
. 199
5
Chi
ld D
eath
spe
r 10
0.00
0 ch
ildre
n ag
es 1
-14.
avg
. 199
3-95
Mee
ting
CA
PT
Goa
lpe
rcen
t of a
ll te
nth
grad
e st
uden
ts, 1
996-
97
Wel
l Bel
ow C
AP
T S
tand
ard
perc
ent o
f all
tent
h gr
ade
stud
ents
. 199
6-97
Hig
h S
choo
l Dro
pout
spe
rcen
t of a
ll st
uden
ts g
rade
s 9-
12, 1
995-
96
Juve
nile
Vio
lent
Crim
e A
rres
tspe
r 10
0.00
0 ch
ildre
n ag
es 1
0-17
, avg
. 199
4-95
Chi
ld A
buse
/Neg
lect
perc
ent o
f all
child
ren.
SF
Y 1
995-
96
Reg
ion
*Sta
te"'
%I,
- R
ate
,:,,
Bet
ter
Tha
n S
tate
Rat
e _
No.
Rat
eW
orse
Tha
n S
tate
Rat
e10
0%75
%50
%25
%
2,14
36.
5
111
54.8
125.
8
115
5.7
118
5.8
519
.8
267
19.1
396
28.3
177
2.9
4632
7.0
1,15
03.
5
14.5
71.0
7.4
11.9
8.6
24.8
12.3
37.9
4.6
25%
50%
75%
100%
Ii33
%
Uo%
tl 25
%
4.3
Al 1
9%
813,
2

Sta
rnfo
rd
Indi
cato
r
Wel
fare
Ben
efits
perc
ent o
f all
child
ren
rece
ivin
g be
nefit
s, a
vg. 1
995-
96
Low
Birt
hwei
ght
per
1,00
0 bi
rths
, 199
5
Infa
nt M
orta
lity
per
1,00
0 liv
e bi
rths
, avg
. 199
3-95
Late
or
No
Pre
nata
l Car
epe
rcen
t of a
ll bi
rths
, avg
. 199
4-95
Birt
hs to
Tee
n M
othe
rspe
rcen
t of a
ll bi
rths
, 199
5
Chi
ld D
eath
spe
r 10
0,00
0 ch
ildre
n ag
es 1
-14,
avg
. 199
3-95
Mee
ting
CA
PT
Goa
lpe
rcen
t of a
ll te
nth
grad
e st
uden
ts, 1
996-
97
Wel
l Bel
ow C
AP
T S
tand
ard
perc
ent o
f all
tent
h gr
ade
stud
ents
, 199
6-97
Hig
h S
choo
l Dro
pout
spe
rcen
t of a
ll st
uden
ts g
rade
s 9-
12, 1
995-
96
Juve
nile
Vio
lent
Crim
e A
rres
tspe
r 10
0,00
0 ch
ildre
n ag
es 1
0-17
, avg
. 199
4-95
Chi
ld A
buse
/Neg
lect
perc
ent o
f all
child
ren,
SF
Y 1
995-
96
Tot
al N
umbe
r of
Chi
ldre
n21
,773
Per
cent
of T
otal
Pop
ulat
ion
20.1
Per
Cap
ita In
com
e$2
7,09
2
Chi
ld P
over
ty9.
9%
Livi
ng W
ith T
wo
Par
ents
67.9
%
Chi
ldre
n's
Rac
ial/E
thni
c B
ackg
roun
d
Whi
te64
.9%
Bla
ck27
.1%
Oth
er R
aces
7.9%
His
pani
c (m
ay b
e of
any
rac
e)12
.8%
Reg
ion
No.
3,03
5
Rat
e
13.6
100%
Wor
se 75%
Tha
n
50%Sta
te R
ate
25%
Sta
te
14.5
132
75.3
6%0
71.0 7.4
105.
2
320
18.6
11.9
112
6.2
8.6
421
.124
.8
497.
012
.343
%
376
53.8
37.9
812.
14.
6
6270
1.4
506.
439
°0tj
357
1.6
4.3
--
Bet
ter
Tha
n S
tate
Rat
eoo [1
6%
25%
50%
75%
100%
30%
28 k
15%
54%

Sou
thw
est I
Tot
al N
umbe
r of
Chi
ldre
n22
,217
Gre
enw
ich
Wes
ton
Per
cent
of T
otal
Pop
ulat
ion
22.0
New
Can
aan
Wilt
onP
er C
apita
Inco
me
$46,
670
Chi
ld P
over
ty2.
5%Li
ving
With
Tw
o P
aren
ts86
.6%
Chi
ldre
n's
Rac
ial/E
thni
c B
ackg
roun
dW
hite
93.1
%B
lack
1.9%
Oth
er R
aces
5.0%
His
pani
c (m
ay b
e of
any
rac
e)3.
6%
Indi
cato
rR
egio
nN
o.R
ate
Wel
fare
Ben
efits
perc
ent o
f all
child
ren
rece
ivin
g be
nefit
s, a
vg. 1
995-
96
Low
Birt
hwei
ght
per
1,00
0 bi
rths
, 199
5
Infa
nt M
orta
lity
per
1,00
0 liv
e bi
rths
, avg
. 199
3-95
301 70
Late
or
No
Pre
nata
l Car
epe
rcen
t of a
ll bi
rths
, avg
. 199
4-95
Birt
hs to
Tee
n M
othe
rspe
rcen
t of a
ll bi
rths
. 199
5
Chi
ld D
eath
spe
r 10
0,00
0 ch
ildre
n ag
es 1
-14,
avg
. 199
3-95
Mee
ting
CA
PT
Goa
lpe
rcen
t of a
ll te
nth
grad
e st
uden
ts, 1
996-
97
Wel
l Bel
ow C
AP
T S
tand
ard
perc
ent o
f all
tent
h gr
ade
stud
ents
, 199
6-97
_H
igh
Sch
ool D
ropo
uts
perc
ent o
f all
stud
ents
gra
des
9-12
, 199
5-96
Juve
nile
Vio
lent
Crim
e A
rres
tspe
r 10
0,00
0 ch
ildre
n ag
es 1
0-17
, avg
. 199
4-95
Chi
ld A
buse
/Neg
lect
perc
ent o
f all
child
ren,
SF
Y 1
995-
96
244
180
69 9 67
1.3
55.6
3.2
5.1
0.4
23.2
25.4
18.8
1.7
86.7 0.3
14.5
71.0
7.4
11.9
8.6
24.8
1 6%
12.3
107%
37.9 4.6
506.
4
4.3
50%
8 5
0 11

Sou
thw
est I
ID
arie
nW
estp
ort
Tot
al N
umbe
r of
Chi
ldre
n25
,128
Nor
wal
kP
erce
nt o
f Tot
al P
opul
atio
n20
.8
Per
Cap
ita In
com
e$3
1,96
6
Chi
ld P
over
ty6.
1%
Livi
ng W
ith T
wo
Par
ents
76.0
%
Chi
ldre
n's
Rac
ial/E
thni
c B
ackg
roun
d
Whi
te80
.2%
Bla
ck13
.9%
Oth
er R
aces
6.0%
His
pani
c (m
ay b
e of
any
rac
e)9.
8%
Indi
cato
rR
egio
nN
o.R
ate
Wel
fare
Ben
efits
perc
ent o
f all
child
ren
rece
ivin
g be
nefit
s. a
vg. 1
995-
96
Low
Birt
hwei
ght
per
1,00
0 bi
rths
. 199
5
Infa
nt M
orta
lity
per
1.00
0 hv
e bi
rths
. avg
. 199
3-95
Late
or
No
Pre
nata
l Car
epe
rcen
t of a
ll bi
rths
. avg
. 199
4-95
Birt
hs to
Tee
n M
othe
rspe
rcen
t of a
ll bi
rths
. 199
5
Chi
ld D
eath
spt
:r 1
00,0
00 c
hild
ren
I14
, avg
. 199
3 95
Mee
ting
CA
PT
Goa
lpe
rcen
t of a
ll te
nth
grad
e st
uden
ts. 1
996-
97
Wel
l Bel
ow C
AP
T S
tand
ard
perc
ent o
f all
tent
h gr
ade
stud
ents
, 199
6-97
Hig
h S
choo
l Dro
pout
spe
rcen
t of a
ll st
uden
ts g
rade
s 9-
12, 1
995-
96
Juve
nile
Vio
lent
Crim
e A
rres
tspe
r 10
0,00
0 ch
ildre
n ag
es 1
0-17
, avg
. 199
4-95
Chi
ld A
buse
/Neg
lect
perc
ent o
f all
child
ren.
SF
Y 1
995-
96
2,34
79.
2
128
65.7
115.
7
238
13.8
934.
6
315
.1
156
15.3
363
35.6
160
3.6
3633
9.8
564
2.2
24.8
12.3
37.9 4.6
83

Brid
gepo
rtT
otal
Num
ber
of C
hild
ren
36,9
92P
erce
nt o
f Tot
al P
opul
atio
n26
.1
Per
Cap
ita In
com
e$1
3,15
6C
hild
Pov
erty
29.0
%Li
ving
With
Tw
o P
aren
ts47
.0%
Chi
ldre
n's
Rac
ial/E
thni
c B
ackg
roun
dW
hite
45.0
%B
lack
34.1
%O
ther
Rac
es20
.9%
His
pani
c (m
ay b
e of
any
rac
e)38
.2%
Indi
cato
r
Wel
fare
Ben
efits
perc
ent o
f all
child
ren
rece
ivin
g be
nefit
s. a
vg. 1
995-
96
Low
Birt
hwei
ght
per
1.00
0 bi
rths
, 199
5
Infa
nt M
orta
lity
per
1.00
0 liv
e bi
rths
. avg
. 199
3-95
Late
or
No
Pre
nata
l Car
epe
rcen
t of a
ll bi
rths
, avg
. 199
4-95
Birt
hs to
Tee
n M
othe
rspe
rcen
t of a
ll bi
rths
. 199
5
Chi
ld D
eath
spe
r 10
0,00
0 ch
ildre
n ag
es 1
-14,
avg
. 199
3-95
Mee
ting
CA
PT
Goa
lpe
rcen
t of a
ll te
nth
grad
e st
uden
ts, 1
996-
97
Wel
l Bel
ow C
AP
T S
tand
ard
perc
ent o
f all
tent
h gr
ade
stud
ents
, 199
6-97
Hig
h S
choo
l Dro
pout
spe
rcen
t of a
ll st
uden
ts g
rade
s 9-
12, 1
995-
96
Juve
nile
Vio
lent
Crim
e A
rres
tspe
r 10
0,00
0 ch
ildre
n ag
es 1
0-17
, avg
. 199
4-95
----
Chi
ld A
buse
/Neg
lect
perc
ent o
f all
child
ren.
SF
Y 1
995-
96
ion
Rat
eW
orse
Tha
n S
tate
Rat
e-
Rat
eB
ette
r T
han
Sta
te R
ate
100%
15%
SO
%25
%0
13,6
8438
.3
202
89.5
2811
.8
354
17.4
428
18.9
1243
.2
151.
4
803
75.8
303
6.1
134
936.
7
1,76
95.
0
14.5
71.0
7.4
11.9
8.6
24.8
12.3
37.9 4.6
.
506.
4
16%
1IF
F4.
3
25%
50%
1
15%
100%

Sou
thw
est H
I
Indi
cato
r
She
lton
Tru
mbu
llT
otal
Num
ber
of C
hild
ren
25,3
25S
trat
ford
Per
cent
of T
otal
Pop
ulat
ion
21.7
Per
Cap
ita In
com
e$2
0,85
5C
hild
Pov
erty
3.3%
Livi
ng W
ith T
wo
Par
ents
81.8
%
Chi
ldre
n's
Rac
ial/E
thni
c B
ackg
roun
dW
hite
91.0
%B
lack
5.8%
Oth
er R
aces
3.2%
His
pani
c (m
ay b
e of
any
rac
e)4.
0%
Reg
ion
Sta
teN
o.R
ate
Wor
se T
han
Sta
te R
ate
RaV
eB
ette
r T
han
Sta
te R
ate
'
Wel
fare
Ben
efits
perc
ent o
f all
child
ren
rece
ivin
g be
nefit
s, a
vg. 1
995-
96
100%
75%
50%
25%
00
25%
50%
75%
100%
Low
Birt
hwei
ght
per
1,00
0 bi
rths
, 199
5
infa
nt M
orta
lity
per
1,00
0 liv
e bi
rths
, avg
. 199
3-95
Late
or
No
Pre
nata
l Car
epe
rcen
t of a
ll bi
rths
, avg
. 199
4-95
Birt
hs to
Tee
n M
othe
rspe
rcen
t of a
ll bi
rths
, 199
5
Chi
ld D
eath
spe
r 10
0,00
0 ch
ildre
n ag
es 1
-14,
avg
. 199
3-95
eetin
g C
AP
T G
oal
perc
ent o
f all
tent
h gr
ade
stud
ents
, 199
6-97
Wel
l Bel
ow C
AP
T S
tand
ard
perc
ent o
f all
tent
h gr
ade
stud
ents
, 199
6-97
Hig
h S
choo
l Dro
pout
spe
rcen
t of a
ll st
uden
ts g
rade
s 9-
12, 1
995-
96
Juve
nile
Vio
lent
Crim
e A
rres
tspe
r 10
0,00
0 ch
ildre
n ag
es 1
0-17
, avg
. 199
4-95
Chi
ld A
buse
/Neg
lect
perc
ent o
f all
child
ren,
SF
Y 1
995-
96
9
1,16
74.
7
7557
.6 6.1
705.
5
524.
0
15.3
140
12.0
407
34.9
1.7
2825
7.9
1.6
14.5
71.0
18%
7.4
18%
11.9
68%
24.8
2% [
12.3
37.9
8%
4.6
506.
4
63%
49%
(1 )
63%

Sou
thw
est I
VT
otal
Num
ber
of C
hild
ren
23,8
64E
asto
nN
ewto
wn
Per
cent
of T
otal
Pop
ulat
ion
22.7
Fai
rfie
ldR
eddi
ng
Per
Cap
ita In
com
e$2
6,38
8M
onro
e
Chi
ld P
over
ty2.
4%
Livi
ng W
ith T
wo
Par
ents
86.9
%
Chi
ldre
n's
Rac
ial/E
thni
c B
ackg
roun
dW
hite
96.6
%
Bla
ck1.
0%
Oth
er R
aces
2.4%
His
pani
c (m
ay b
e of
any
rac
e)2.
4%
Wel
fare
Ben
efits
perc
ent o
f all
child
ren
rece
ivin
g be
nefit
s, a
vg. 1
995-
96
Low
Birt
hwei
ght
per
1,00
0 bi
rths
, 199
5
Infa
nt M
orta
lity
per
1.00
0 liv
e bi
rths
, avg
. 199
3-95
_
Late
or
No
Pre
nata
l Car
epe
rcen
t of a
ll bi
rths
, avg
. 199
4-95
Birt
hs to
Tee
n M
othe
rspe
rcen
t of a
ll bi
rths
. 199
5
Chi
ld D
eath
spe
r 10
0,00
0 ch
ildre
n ag
es 1
-14,
avg
. 199
3-95
Mee
ting
CA
PT
Goa
lpe
rcen
t of a
ll te
nth
grad
e st
uden
ts, 1
996-
97
Wel
l Bel
ow C
AP
T S
tand
ard
perc
ent o
f all
tent
h gr
ade
stud
ents
, 199
6-97
Hig
h S
choo
l Dro
pout
spe
rcen
t of a
ll st
uden
ts g
rade
s 9-
12. 1
995-
96
.
ion
,Sta
tc;
Rat
eW
orse
Tha
n S
tate
Rat
eR
ate
Bet
ter
Tha
n S
tate
Rat
e10
0%75
%S
O%
25%
Juve
nile
Vio
lent
Crim
e A
rres
tspe
r 10
0,00
0 ch
ildre
n ag
es 1
0-17
, avg
. 199
4-95
Chi
ld A
buse
/Neg
lect
perc
ent o
f all
child
ren,
SF
Y 1
995-
96
1.4
46.0
4.1
3.5
1.0
15.9
18.3
20.3 1.0
47.3 0.9
14.5
71.0
7.4
11.9 8.6
24.8
12.3
37.9
25%
50%
15%
100%
90%
I35
% 45%
71%
88%
,
214

Wat
erbu
ry
Wel
fare
Ben
efits
perc
ent o
f all
child
ren
rece
Mng
ben
efits
, avg
. 199
5-96
Low
Birt
hwei
ght
per
1,00
0 bi
rths
, 199
5
Infa
nt M
orta
lity
per
1,00
0 liv
e bi
rths
, avg
. 199
3-95
Late
or
No
Pre
nata
l Car
epe
rcen
t of a
ll bi
rths
, avg
. 199
4-95
Birt
hs to
Tee
n M
othe
rspe
rcen
t of a
ll bi
rths
, 199
5
Chi
ld D
eath
spe
r 10
0,00
0 ch
ildre
n ag
es 1
-14,
avg
. 199
3-95
Mee
ting
CA
PT
Goa
lpe
rcen
t of a
ll te
nth
grad
e st
uden
ts, 1
996-
97
Wel
l Bel
ow C
AP
T S
tand
ard
perc
ent o
f all
tent
h gr
ade
stud
ents
, 199
6-97
Hig
h S
choo
l Dro
pout
spe
rcen
t of a
ll st
uden
ts g
rade
s 9-
12, 1
995-
96
Juve
nile
Vio
lent
Crim
e A
rres
tspe
r 10
0,00
0 ch
ildre
n ag
es 1
0-17
, avg
. 199
4-95
Chi
ld A
buse
/Neg
lect
perc
ent o
f all
child
ren,
SF
Y 1
995-
96
Tot
al N
umbe
r of
Chi
ldre
n25
,561
Per
cent
of T
otal
Pop
ulat
ion
23.5
Per
Cap
ita In
com
e$1
4,20
9
Chi
ld P
over
ty20
.6%
Livi
ng W
ith T
wo
Par
ents
59.5
%
Chi
ldre
n's
Rac
ial/E
thni
c B
ackg
roun
d
Whi
te69
.3%
Bla
ck18
.1%
Oth
er R
aces
12.6
%
His
pani
c (m
ay b
e of
any
rac
e)22
.6%
Reg
ion
Sta
teN
o.R
ate
Wor
se T
han
Sta
te R
ate
Rat
eB
ette
r T
han
Sta
te R
ate
163%
87% 81
%
88%
86%
185%
1232
111
.506
A 1
1111
%
4.3
:3 6

Nau
gatu
ck V
alle
yT
otal
Num
ber
of C
hild
ren
26,1
46C
hesh
ireP
rosp
ect
Per
cent
of T
otal
Pop
ulat
ion
24.1
Mid
dleb
ury
Sou
thbu
ryP
er C
apita
Inco
me
$20,
010
Nau
gatu
ckW
olco
tt
Chi
ld P
over
ty2.
8%O
xfor
d
Livi
ng W
ith T
wo
Par
ents
84.5
%
Chi
ldre
n's
Rac
ial/E
thni
c B
ackg
roun
d
Whi
te96
.0%
Bla
ck1.
7%
Oth
er R
aces
2.3%
His
pani
c (m
ay b
e of
any
rac
e)2.
4%
Wel
fare
Ben
efits
perc
ent o
f all
child
ren
rece
ivin
g be
nefit
s. a
vg. 1
995-
96
Low
Birt
hwei
ght
per
1.00
0 bi
rths
, 199
5
Infa
nt M
orta
lity
per
1.00
0 liv
e bi
rths
, avg
. 199
3-95
Late
or
No
Pre
nata
l Car
epe
rcen
t of a
ll bi
rths
. avg
. 199
4-95
Birt
hs to
Tee
n M
othe
rspe
rcen
t of a
ll bi
rths
. 199
5
Chi
ld D
eath
spe
r 10
0.00
0 ch
ildre
n ag
es 1
-14.
avg
. 199
3-95
Mee
ting
CA
PT
Goa
lpe
rcen
t of a
ll te
nth
grad
e st
uden
ts, 1
996-
97
Wel
l Bel
ow C
AP
T S
tand
ard
perc
ent o
f all
tent
h gr
ade
stud
ents
, 199
6-97
Hig
h S
choo
l Dro
pout
spe
rcen
t of a
ll st
uden
ts g
rade
s 9-
12, 1
995-
96
Juve
nile
Vio
lent
Crim
e A
rres
tspe
r 10
0.00
0 ch
ildre
n ag
es 1
0-17
. avg
. 199
4-95
Chi
ld A
buse
/Neg
lect
perc
ent o
f all
child
ren.
SF
Y 1
995-
96
958
3.6
6855
.0
75.
7
134
11.0
453.
6
419
.1
138
11.3
371
30.4
801.
8
2420
8.8
377
1.4
ion
Sta
te. *
?R
ate
Wor
se T
han
Sta
te R
ate
Rat
e-
Bet
ter
Tha
n S
tate
Rat
e10
0%75
%50
%25
%
8%
100%

Sou
th C
entr
al I
Indi
cato
r
Ans
onia
Ham
den
Tot
al N
umbe
r of
Chi
ldre
n28
,721
Bea
con
Fal
lsN
orth
Hav
enP
erce
nt o
f Tot
al P
opul
atio
n20
.9B
etha
nyS
eym
our
Per
Cap
ita In
com
e$1
9,85
5D
erby
Woo
dbrid
geC
hild
Pov
erty
5.6%
Livi
ng W
ith T
wo
Par
ents
79.4
%
Chi
ldre
n's
Rac
ial/E
thni
c B
ackg
roun
d
Whi
te89
.7%
Bla
ck7.
0%O
ther
Rac
es3.
2%H
ispa
nic
(may
be
of a
ny r
ace)
2.9%
Wel
fare
Ben
efits
perc
ent o
f all
child
ren
rece
ivin
g be
nefit
s, a
vg. 1
995-
96
Low
Birt
hwei
ght
per
1.00
0 bi
rths
, 199
5
Infa
nt M
orta
lity
per
1,00
0 liv
e bi
rths
, avg
. 199
3-95
Late
or
No
Pre
nata
l Car
epe
rcen
t of a
ll bi
rths
, avg
. 199
4-95
Birt
hs to
Tee
n M
othe
rspe
rcen
t of a
ll bi
rths
. 199
5
Chi
ld D
eath
spe
r 10
0,00
0 ch
ildre
n ag
es 1
-14.
avg
. 199
3-95
Mee
ting
CA
PT
Goa
lpe
rcen
t of a
ll te
nth
grad
e st
uden
ts, 1
996-
97
Wel
l Bel
ow C
AP
T S
tand
ard
perc
ent o
f all
tent
h gr
ade
stud
ents
, 199
6-97
Hig
h S
choo
l Dro
pout
spe
rcen
t of a
ll st
uden
ts g
rade
s 9-
12, 1
995-
96
Juve
nile
Vio
lent
Crim
e A
rres
tspe
r 10
0,00
0 ch
ildre
n ag
es 1
0-17
, avg
. 199
4-95
Chi
ld A
buse
/Neg
lect
perc
ent o
f all
child
ren,
SF
Y 1
995-
96
7R
egio
nS
ta'te
No.
Rat
eW
orse
Tha
n S
tate
Rat
eR
ate
Bet
ter
Tha
n S
tate
Rat
e
2,34
78.
3
101
62.2
95.
4
138
8.8
855.
2
522
.4
104
9.5
436
39.7
171
2.7
5244
8.8
1,01
03.
6
100%
75%
50%
25%
5%
99
14.5
71.0 7.4
11.9
8.6
24.8
12.3
37.9
4.6
506.
4
4.3
100
25%
50%
75%
100%
43%
12%
27%
"
26%
40%
10% 12% 16
%

New
Hav
enT
otal
Num
ber
of C
hild
ren
30,9
36P
erce
nt o
f Tot
al P
opul
atio
n23
.7P
er C
apita
Inco
me
$12,
968
Chi
ld P
over
ty33
.8%
Livi
ng W
ith T
wo
Par
ents
38.6
%
Chi
ldre
n's
Rac
ial/E
thni
c B
ackg
roun
dW
hite
34.0
%B
lack
51.6
%O
ther
Rac
es14
.3%
His
pani
c (m
ay b
e of
any
rac
e)21
.6%
Wel
fare
Ben
efits
perc
ent o
f all
child
ren
rece
ivin
g be
nefit
s. a
vg. 1
995-
96
Low
Birt
hwei
ght
per
1.00
0 bi
rths
, 199
5
Infa
nt M
orta
lity
per
1,00
0 liv
e bi
rths
. avg
. 199
3-95
Late
or
No
Pre
nata
l Car
epe
rcen
t of a
ll bi
rths
, avg
. 199
4-95
Birt
hs to
Tee
n M
othe
rspe
rcen
t of a
ll bi
rths
. 199
5
Chi
ld D
eath
spe
r 10
0,00
0 ch
ildre
n ag
es 1
-14,
avg
. 199
3-95
Mee
ting
CA
PT
Goa
lpe
rcen
t of a
ll te
nth
grad
e st
uden
ts, 1
996-
97
.R
egio
nrS
tate
No.
Rat
eW
orse
Tha
n S
tate
Rat
eR
ate
.B
ette
r T
han
Sta
te R
ate
100%
15%
SO
%25
%0
UM
046
.814
.5
53%
108.
671
.0
11.8
7.4
22.3
11.9
25%
50%
75%
100%
Wel
l Bel
ow C
AP
T S
tand
ard
perc
ent o
f all
tent
h gr
ade
stud
ents
, 199
6-97
Hig
h S
choo
l Dro
pout
spe
rcen
t of a
ll st
uden
ts g
rade
s 9-
12, 1
995-
96
Juve
nile
Vio
lent
Crim
e A
rres
tspe
r 10
0,00
0 ch
ildre
n ag
es 1
0-17
, avg
. 199
4-95
Chi
ld A
buse
/Neg
lect
perc
ent o
f all
child
ren,
SF
Y 1
995-
96
13,7
11
201 23 367
320
10 131.
6
663
79.1
421
10.3
234
2,05
5.9
3,40
8
17.3
43.3
11.6
109%
124%
306%
8.6
24.8
12.3
37.9
4.6
1
506.
4
4.3
0110
2
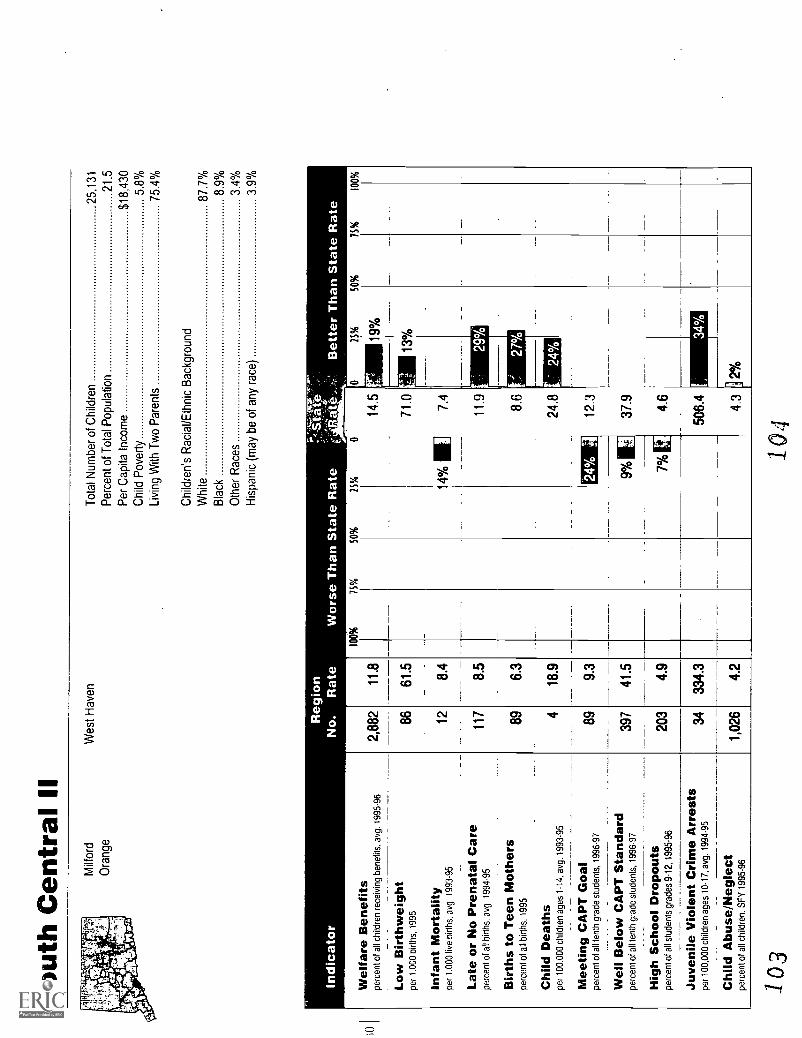
Sou
th C
entr
al II
Milf
ord
Wes
t Hav
enT
otal
Num
ber
of C
hild
ren
25,1
31O
rang
eP
erce
nt o
f Tot
al P
opul
atio
n21
.5P
er C
apita
Inco
me
$18,
430
Chi
ld P
over
ty5.
8%Li
ving
With
Tw
o P
aren
ts75
.4%
Chi
ldre
n's
Rac
ial/E
thni
c B
ackg
roun
dW
hite
87.7
%
Bla
ck8.
9%
Oth
er R
aces
3.4%
His
pani
c (m
ay b
e of
any
rac
e)3.
9%
Indi
cato
r
Wel
fare
Ben
efits
perc
ent o
f all
child
ren
rece
ivin
g be
nefit
s, a
vg. 1
995-
96
Low
Birt
hwei
ght
per
1.00
0 bi
rths
, 199
5
Infa
nt M
orta
lity
per
1.00
0 liv
e bi
rths
, avg
. 199
3-95
Late
or
No
Pre
nata
l Car
epe
rcen
t of a
ll bi
rths
. avg
. 199
4-95
Birt
hs to
Tee
n M
othe
rspe
rcen
t of a
ll bi
rths
, 199
5
Chi
ld D
eath
spe
r 10
0,00
0 ch
ildre
n ag
es 1
-14,
avg
. 199
3-95
Mee
ting
CA
PT
Goa
lpe
rcen
t of a
ll te
nth
grad
e st
uden
ts, 1
996-
97
Wel
l Bel
ow C
AP
T S
tand
ard
perc
ent o
f all
tent
h gr
ade
stud
ents
, 199
6-97
Hig
h S
choo
l Dro
pout
spe
rcen
t of a
ll st
uden
ts g
rade
s 9-
12, 1
995-
96
Juve
nile
Vio
lent
Crim
e A
rres
tspe
r 10
0,00
0 ch
ildre
n ag
es 1
0-17
, avg
. 199
4-95
Chi
ld A
buse
/Neg
lect
perc
ent o
f all
child
ren,
SF
Y 1
995-
96
2,88
211
.8
8661
.5
128.
4
117
8.5
896.
3
418
.9
899.
3
397
41.5
203
4.9
3433
4.3
1,02
64.
2
71.0
14%
7.4
11.9
8.6
24.8
103
104

Sou
th C
entr
al Il
lT
otal
Num
ber
of C
hild
ren
23,5
17
Per
cent
of T
otal
Pop
ulat
ion
23.4
Per
Cap
ita In
com
e$1
6,68
4
Chi
ld P
over
ty8.
6%Li
ving
With
Tw
o P
aren
ts73
.7%
Chi
ldre
n's
Rac
ial/E
thni
c B
ackg
roun
dW
hite
88.6
%B
lack
4.3%
Oth
er R
aces
7.1%
His
pani
c (m
ay b
e of
any
rac
e)14
.9%
Wel
fare
Ben
efits
perc
ent o
f all
child
ren
rece
ivin
g be
nefit
s, a
vg. 1
995-
96
Low
Birt
hwei
ght
per
1,00
0 bi
rths
, 199
5
Infa
nt M
orta
lity
per
1.00
0 liv
e bi
rths
. avg
. 199
3-95
Late
or
No
Pre
nata
l Car
epe
rcen
t of a
ll bi
rths
. avg
. 199
4-95
Birt
hs to
Tee
n M
othe
rspe
rcen
t of a
ll bi
rths
. 199
5
Chi
ld D
eath
spe
r 10
0,00
0 ch
ildre
n ag
es 1
-14,
avg
. 199
3-95
Mee
ting
CA
PT
Goa
lpe
rcen
t of a
ll te
nth
grad
e st
uden
ts, 1
996-
97
Wel
l Bel
ow C
AP
T S
tand
ard
perc
ent o
f all
tent
h gr
ade
stud
ents
, 199
6-97
Hig
h S
choo
l Dro
pout
spe
rcen
t of a
ll st
uden
ts g
rade
s 9-
12, 1
995-
96
Juve
nile
Vio
lent
Crim
e A
rres
tspe
r 10
0,00
0 ch
ildre
n ag
es 1
0-17
, avg
. 199
4-95
Chi
ld A
buse
/Neg
lect
perc
ent o
f all
child
ren,
SF
Y 1
995-
96
4,01
217
.1
7854
.9
106.
7
221
15.2
150
10.6
630
.4
546.
4
351
41.3
180
4.3
2324
0.5
1,10
34.
7
100%
Wor
se T
han
Sta
te R
ate
75%
50%
25%
18%
Mer
iden
Wal
lingf
ord
25%
SO
%75
%10
0%
14.5
71.0 7 41
1 9%
11.9
8.6
24.8
12.3
37.9 4.6
506.
4
9.A
.4.
3
106
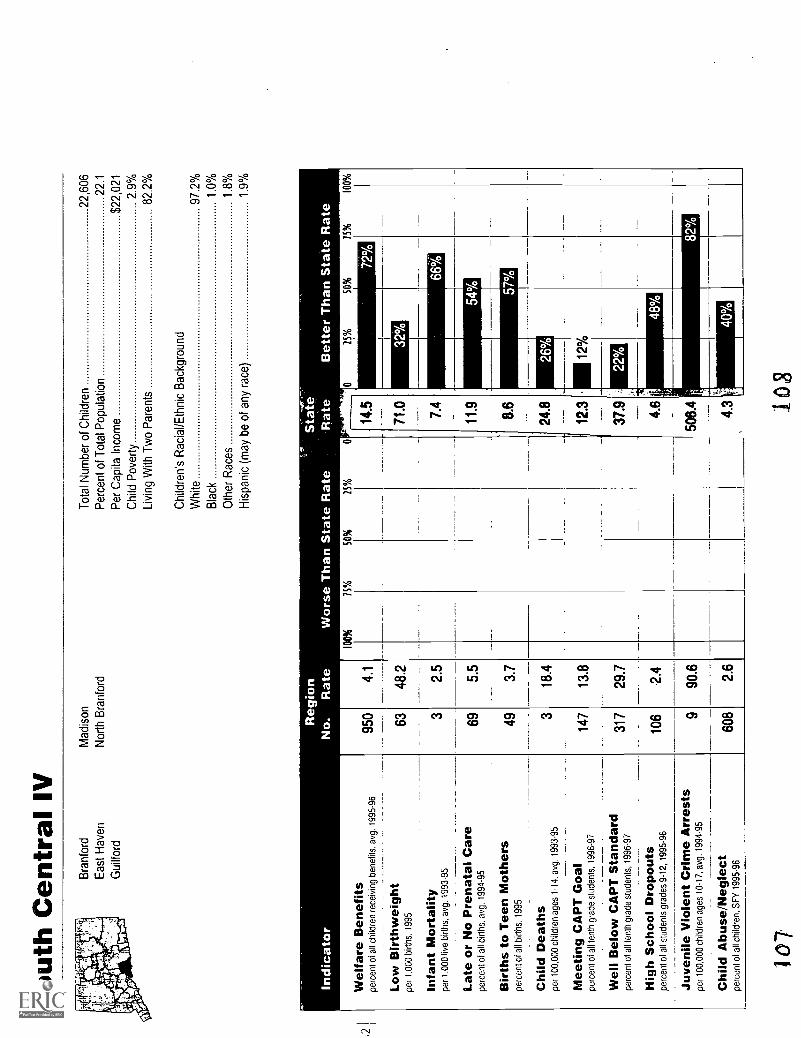
Sou
th C
entr
al IV
Bra
nfor
dM
adis
onT
otal
Num
ber
of C
hild
ren
22,6
06E
ast H
aven
Nor
th B
ranf
ord
Per
cent
of T
otal
Pop
ulat
ion
22.1
Gui
lford
Per
Cap
ita In
com
e$2
2,02
1
Chi
ld P
over
ty2.
9%
Livi
ng W
ith T
wo
Par
ents
82.2
%
Wel
fare
Ben
efits
perc
ent o
f all
child
ren
rece
ivin
g be
nefit
s, a
vg. 1
995-
96
Low
Birt
hwei
ght
per
1.00
0 bi
rths
, 199
5
Infa
nt M
orta
lity
per
1.00
0 liv
e bi
rths
, avg
. 199
3-95
Late
or
No
Pre
nata
l Car
epe
rcen
t of a
ll bi
rths
, avg
. 199
4-95
Birt
hs to
Tee
n M
othe
rspe
rcen
t of a
ll bi
rths
, 199
5
Chi
ld D
eath
spe
r 10
0,00
0 ch
ildre
n ag
es 1
-14.
avg
. 199
3-95
Mee
ting
CA
PT
Goa
lpe
rcen
t of a
ll te
nth
grad
e st
uden
ts, 1
996-
97-
--W
ell B
elow
CA
PT
Sta
ndar
dpe
rcen
t of a
ll te
nth
grad
e st
uden
ts, 1
996-
97
Hig
h S
choo
l Dro
pout
spe
rcen
t of a
ll st
uden
ts g
rade
s 9-
12, 1
995-
96
Chi
ldre
n's
Rac
ial/E
thni
c B
ackg
roun
dW
hite
97.2
%
Bla
ck1.
0%
Oth
er R
aces
1.8%
His
pani
c (m
ay b
e of
any
rac
e)1.
9%
Reg
ion
Sta
teN
o.R
ate
Wor
se T
han
Sta
te R
ate
Rat
e
100%
75%
SO
%25
%
Bet
ter
Tha
n S
tate
Rat
e
25%
50%
75%
100%
Juve
nile
Vio
lent
Crim
e A
rres
tspe
r 10
0,00
0 ch
ildre
n ag
es 1
0-17
, avg
. 199
4-95
Chi
ld A
buse
/Neg
lect
perc
ent o
f all
child
ren,
SF
Y 1
995-
96
950
4.1
6348
.2 2.5
695.
5
493.
7
18.4
147
13.8
317
29.7
106
2.4
90.6
608
2.6
32%
- 66
%
54% 57
%
107
joS

Sou
th C
entr
al V
Tot
al N
umbe
r of
Chi
ldre
n31
,401
Che
ster
Ess
exP
erce
nt o
f Tot
al P
opul
atio
n21
.9C
linto
nH
adda
mP
er C
apita
Inco
me
$19,
660
Cro
mw
ell
Kill
ingw
orth
Chi
ld P
over
ty5.
6%D
eep
Riv
erM
iddl
efie
ldLi
ving
With
Tw
o P
aren
ts77
.2%
Dur
ham
Mid
dlet
own
Eas
t Had
dam
Old
Say
broo
kC
hild
ren'
s R
acia
l/Eth
nic
Bac
kgro
und
Eas
t Ham
pton
Por
tland
Whi
te90
.8%
Bla
ck6.
4%O
ther
Rac
es2.
8%H
ispa
nic
(may
be
of a
ny r
ace)
3.4%
Indi
cato
r
Wel
fare
Ben
efits
perc
ent o
f all
child
ren
rece
ivin
g be
nefit
s, a
vg. 1
995-
96
Low
Birt
hwei
ght
per
1,00
0 bi
rths
, 199
5
Infa
nt M
orta
lity
per
1,00
0 liv
e bi
rths
. avg
. 199
3-95
Late
or
No
Pre
nata
l Car
epe
rcen
t of a
ll bi
rths
, avg
. 199
4-95
Birt
hs to
Tee
n M
othe
rspe
rcen
t of a
ll bi
rths
. 199
5_
.
Chi
ld D
eath
spe
r 10
0,00
0 ch
ildre
n ag
es 1
-14,
avg
. 199
3-95
Mee
ting
CA
PT
Goa
lpe
rcen
t of a
ll te
nth
grad
e st
uden
ts, 1
996-
97
Wel
l Bel
ow C
AP
T S
tand
ard
perc
ent o
f all
tent
h gr
ade
stud
ents
, 199
6-97
Hig
h S
choo
l Dro
pout
spe
rcen
t of a
ll st
uden
ts g
rade
s 9-
12, 1
995-
96
Juve
nile
Vio
lent
Crim
e A
rres
tspe
r 10
0,00
0 ch
ildre
n ag
es 1
0-17
, avg
. 199
4-95
Chi
ld A
buse
/Neg
lect
perc
ent o
f all
child
ren.
SF
Y 1
995-
96
Reg
ion
Sta
te-
,
No.
Rat
eW
orse
Tha
n S
tate
Rat
eR
ate
Bet
ter
Tha
n S
tate
Rat
e4
2,04
06.
3
112
59.2
157.
4
195
10.2
824.
3
518
.5
172
14.5
361
30.3
177
3.3
9267
8.7
1,04
13.
2
100%
75%
50%
25%
25%
SO
%75
%10
0%
57%
109
26%
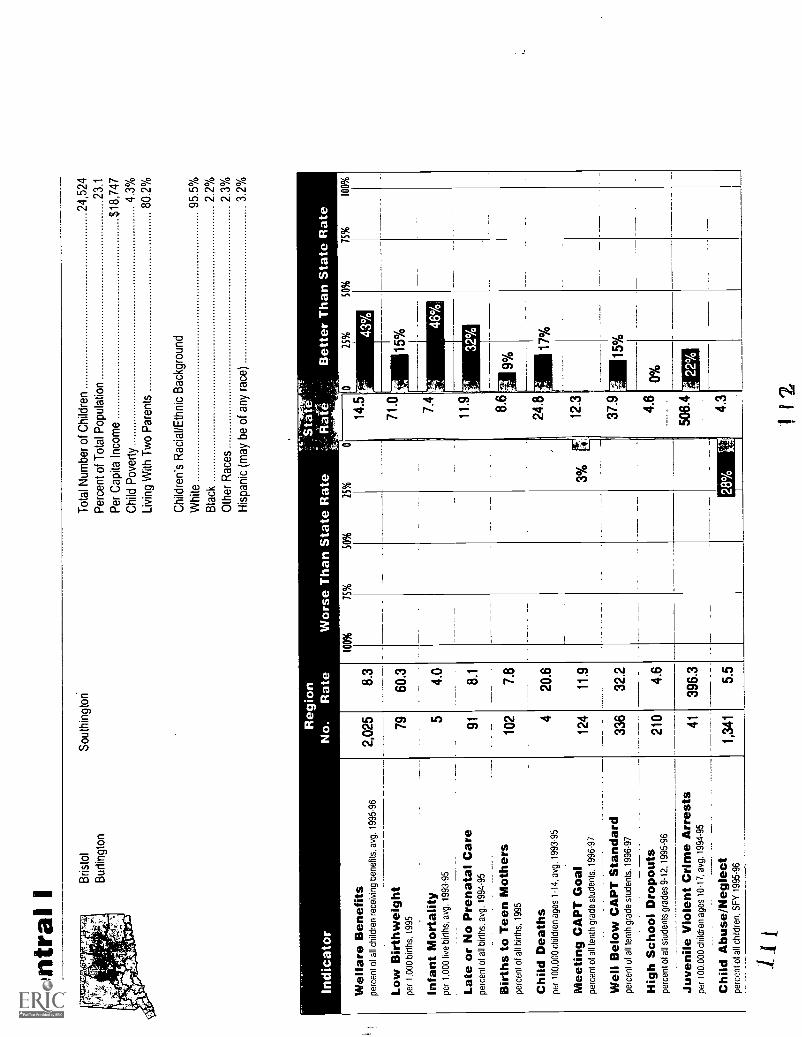
Cen
tral
IB
risto
l
Bur
lingt
on
Wel
fare
Ben
efits
perc
ent o
f all
child
ren
rece
ivin
g be
nefit
s, a
vg. 1
995-
96
Low
Birt
hwei
ght
per
1,00
0 bi
rths
, 199
5
Infa
nt M
orta
lity
per
1,00
0 liv
e bi
rths
, avg
. 199
3-95
Late
or
No
Pre
nata
l Car
epe
rcen
t of a
ll bi
rths
, avg
. 199
4-95
Birt
hs to
Tee
n M
othe
rspe
rcen
t of a
ll bi
rths
, 199
5
Chi
ld D
eath
spe
r 10
0,00
0 ch
ildre
n ag
es 1
-14,
avg
. 199
3 95
Mee
ting
CA
PT
Goa
lpe
rcen
t of a
ll te
nth
grad
e st
uden
ts, 1
996-
97
Wel
l Bel
ow C
AP
T S
tand
ard
perc
ent o
f all
tent
h gr
ade
stud
ents
, 199
6-97
Hig
h S
choo
l Dro
pout
spe
rcen
t of a
ll st
uden
ts g
rade
s 9-
12, 1
995-
96--
----
- --
Juve
nile
Vio
lent
Crim
e A
rres
tspe
r 10
0.00
0 ch
ildre
n ag
es 1
0-17
, avg
. 199
4-95
--
Chi
ld A
buse
/Neg
lect
perc
ent o
f all
child
ren.
SF
Y 1
995-
96
Sou
thin
gton
Tot
al N
umbe
r of
Chi
ldre
n24
,524
Per
cent
of T
otal
Pop
ulat
ion
23.1
Per
Cap
ita In
com
e$1
8,74
7
Chi
ld P
over
ty4.
3%
Livi
ng W
ith T
wo
Par
ents
80.2
%
Chi
ldre
n's
Rac
ial/E
thni
c B
ackg
roun
d
Whi
te95
.5%
Bla
ck2.
2%
Oth
er R
aces
2.3%
His
pani
c (m
ay b
e of
any
rac
e)3.
2%
ion
Sta
teR
ate
Wor
se T
han
Sta
te R
ate
Rat
eB
ette
r T
han
Sta
te R
ate
100%
75%
50%
25%
2,02
5 79
5
91 102 4
124
336
14.5
71.0 7.4
11.9 8.6
24.8
12.3
37.9
25%
SO
%75
%10
0%
43%
210
41
1,34
1

Cen
tral
IIT
otal
Num
ber
of C
hild
ren
23,3
75B
erlin
Pla
invi
lleP
erce
nt o
f Tot
al P
opul
atio
n21
.3N
ew B
ritai
n
Per
Cap
ita In
com
e$1
5,91
6
Chi
ld P
over
ty18
.3%
Livi
ng W
ith T
wo
Par
ents
64.9
%
Chi
ldre
n's
Rac
ial/E
thni
c B
ackg
roun
d
Whi
te76
.6%
Bla
ck8.
3%
Oth
er R
aces
15.0
%
His
pani
c (m
ay b
e of
any
rac
e)22
.3%
Wel
fare
Ben
efits
perc
ent o
f all
child
ren
rece
ivin
g be
nefit
s, a
vg. 1
995-
96
Low
Birt
hwei
ght
per
1,00
0 bi
rths
, 199
5
Infa
nt M
orta
lity
per
1,00
0 liv
e bi
rths
. avg
. 199
3-95
Late
or
No
Pre
nata
l Car
epe
rcen
t of a
ll bi
rths
, avg
. 199
4-95
Birt
hs to
Tee
n M
othe
rspe
rcen
t of a
ll bi
rths
. 199
5
Chi
ld D
eath
spe
r 10
0,00
0 ch
ildre
n ag
es 1
-14,
avg
. 199
3-95
Mee
ting
CA
PT
Goa
lpe
rcen
t of a
ll te
nth
grad
e st
uden
ts, 1
996-
97
Wel
l Bel
ow C
AP
T S
tand
ard
perc
ent o
f all
tent
h gr
ade
stud
ents
, 199
6-97
Hig
h S
choo
l Dro
pout
spe
rcen
t of a
ll st
uden
ts g
rade
s 9-
12, 1
995-
96
Juve
nile
Vio
lent
Crim
e A
rres
tspe
r 10
0,00
0 ch
ildre
n ag
es 1
0-17
, avg
. 199
4-95
Chi
ld A
buse
/Neg
lect
perc
ent o
f all
child
ren,
SF
Y 1
995-
96
ion
''"S
't at
eR
ate
Wor
se T
han
Sta
te R
ate
.Rat
es'-
Bet
ter
Tha
n S
tate
Rat
e
6,08
627
.0
124
89.9
106.
9
195
14.8
186
13.5
631
.4
698.
3
389
46.6
230
5.6
8190
8.7
2,13
29.
4
100%
75%
50%
25%
00
25%
50%
75%
100%
14.5
119%
86%
27%
1
57%
27%
33%
79%
71.0
7.4
11.9
8.6
24.8
12.3
37.9 4.6
506.
4
4.3
113
114

Har
tford
Indi
cato
r
Wel
fare
Ben
efits
perc
ent o
f all
child
ren
rece
ivin
g be
nefit
s, a
vg. 1
995-
96
Low
Birt
hwei
ght
per
1,00
0 bi
rths
, 199
5
Infa
nt M
orta
lity
per
1,00
0 liv
e bi
rths
, avg
. 199
3-95
Late
or
No
Pre
nata
l Car
epe
rcen
t of a
ll bi
rths
, avg
. 199
4-95
Birt
hs to
Tee
n M
othe
rspe
rcen
t of a
ll bi
rths
, 199
5
Chi
ld D
eath
spe
r 10
0,00
0 ch
ildre
n ag
es 1
-14,
avg
. 199
3-95
Mee
ting
CA
PT
Goa
lpe
rcen
t of a
ll te
nth
grad
e st
uden
ts, 1
996-
97
Wel
l Bel
ow C
AP
T S
tand
ard
perc
ent o
f all
tent
h gr
ade
stud
ents
, 199
6-97
Hig
h S
choo
l Dro
pout
spe
rcen
t of a
ll st
uden
ts g
rade
s 9-
12, 1
995-
96
Juve
nile
Vio
lent
Crim
e A
rres
tspe
r 10
0,00
0 ch
ildre
n ag
es 1
0-17
, avg
. 199
4-95
Chi
ld A
buse
/Neg
lect
perc
ent o
f all
child
ren,
SF
Y 1
995-
96
Tot
al N
umbe
r of
Chi
ldre
n38
,390
Per
cent
of T
otal
Pop
ulat
ion
27.5
Per
Cap
ita In
com
e$1
1,08
1
Chi
ld P
over
ty43
.6%
Livi
ng W
ith T
wo
Par
ents
30.3
%
Chi
ldre
n's
Rac
ial/E
thni
c B
ackg
roun
dW
hite
24.7
%
Bla
ck44
.2%
Oth
er R
aces
31.1
%
His
pani
c (m
ay b
e of
any
rac
e)46
.7%
Reg
ion
Sta
teN
o.R
ate
Wor
se T
han
Sta
te R
ate
Rat
eB
ette
r T
han
Sta
te R
ate
21,5
4957
.8
309
133.
9
4216
.3
362
17.5
598
25.9
1652
.7
100%
75%
SO
%25
%
299%
89%
120%
47%
201%
357% UM
=11
1111
11
148%
216%
115.
14.5
71.0 7.4
11.9 8.6
24.8
12.3
37.9 4.6
508.
4
4.3
hiG
25%
SO
%75
%10
0%

Cap
itol I
Tot
al N
umbe
r of
Chi
ldre
n20
,992
Per
cent
of T
otal
Pop
ulat
ion
20.6
Per
Cap
ita In
com
e$1
7,62
7C
hild
Pov
erty
6.5%
Livi
ng W
ith T
wo
Par
ents
70.8
%
Chi
ldre
n's
Rac
ial/E
thni
c B
ackg
roun
d
Whi
te84
.4%
Bla
ck9.
9%
Oth
er R
aces
His
pani
c (m
ay b
e of
any
rac
e)6.
7%
Eas
t Har
tford
Man
ches
ter
indi
cato
r
Wel
fare
Ben
efits
perc
ent o
f all
child
ren
rece
Mng
ben
efits
. avg
. 199
5-96
.
3,76
3
gion Rat
e
18.4
100%
Wor
se 75%
Tha
nS
tate
Rat
e25
%
tSta
te.
R-
ate
SO
%
27%
14'5
1
Low
Birt
hwei
ght
per
1.00
0 bi
rths
, 199
512
589
.626
%71
.01
Infa
nt M
orta
lity
per
1,00
0 liv
e bi
rths
, avg
. 199
3-95
117.
97%
I7.
4
Late
or
No
Pre
nata
l Car
epe
rcen
t of a
ll bi
rths
. avg
. 199
4-95
135
10.4
11.9
16
Birt
hs to
Tee
n M
othe
rspe
rcen
t of a
ll bi
rths
. 199
512
7 3
9.1
16.7
11.1
6% I
8.6
24.8
Chi
ld D
eath
spe
r 10
0,00
0 ch
ildre
n ag
es 1
-14,
avg
. 199
3-95
I
_
I
Mee
ting
CA
PT
Goa
lpe
rcen
t of a
ll te
nth
grad
e st
uden
ts, 1
996-
9786
10%
11
12.3
3% 0
37.
9W
ell B
elow
CA
PT
Sta
ndar
dpe
rcen
t of a
ll te
nth
grad
e st
uden
ts, 1
996-
9730
0
355
38.9 8.7
729.
1
Hig
h S
choo
l Dro
pout
spe
rcen
t of a
ll st
uden
ts g
rade
s 9-
12, 1
995-
9689
%II
4.6
Juve
nile
Vio
lent
Crim
e A
rres
tspe
r 10
0,00
0 ch
ildre
n ag
es 1
0-17
, avg
. 199
4-95
6144
%II
506.
4
Chi
ld A
buse
/Neg
lect
perc
ent o
f all
ch il
dren
, SF
Y 1
995-
961,
011
4.9
14%
4.3
117
25%
50%
75%
100%
3%
118

Cap
itol I
I Avo
nS
imsb
ury
Tot
al N
umbe
r of
Chi
ldre
n25
,984
Blo
omfie
ldW
est H
artfo
rdP
erce
nt o
f Tot
al P
opul
atio
n21
.0
Can
ton
Per
Cap
ita In
com
e$2
7,07
7
Chi
ld P
over
ty2.
6%
Livi
ng W
ith T
wo
Par
ents
83.3
%
Chi
ldre
n's
Rac
ial/E
thni
c B
ackg
roun
d
Whi
te85
.2%
Bla
ck10
.4%
Oth
er R
aces
4.4%
His
pani
c (m
ay b
e of
any
rac
e)3.
6%
Wel
fare
Ben
efits
perc
ent o
f all
child
ren
rece
ivin
g be
nefit
s, a
vg. 1
995-
96
Low
Birt
hwei
ght
per
1,00
0 bi
rths
, 199
5
Reg
ion
No.
Rat
e
Infa
nt M
orta
lity
per
1,00
0 liv
e bi
rths
, avg
. 199
3-95
Late
or
No
Pre
nata
l Car
epe
rcen
t of a
ll bi
rths
, avg
. 199
4-95
Birt
hs to
Tee
n M
othe
rspe
rcen
t of a
ll bi
rths
, 199
5
Chi
ld D
eath
spe
r 10
0,00
0 ch
ildre
n ag
es 1
-14,
avg
. 199
3-95
Mee
ting
CA
PT
Goa
lpe
rcen
t of a
ll te
nth
grad
e st
uden
ts, 1
996-
97
Wel
l Bel
ow C
AP
T S
tand
ard
perc
ent o
f all
tent
h gr
ade
stud
ents
, 199
6-97
Hig
h S
choo
l Dro
pout
spe
rcen
t of a
ll st
uden
ts g
rade
s 9-
12, 1
995-
96
Juve
nile
Vio
lent
Crim
e A
rres
tspe
r 10
0,00
0 ch
ildre
n ag
es 1
0-17
, avg
. 199
4-95
Chi
ld A
buse
/Neg
lect
perc
ent o
f all
child
ren,
SF
Y 1
995-
96
1,35
75.
4
106
73.2
1510
.3
604.
5
664.
6
313
.0
331
27.0
289
23.6
114
2.2
5850
9.7
646
2.6
Sta
te'
Rat
e I..
Bet
ter
Tha
n S
tate
Rat
e
1 1
912
0

Ca
p ito
I I
I I
Tot
al N
umbe
r of
Chi
ldre
n33
,495
Eas
t Gra
nby
Sou
th W
inds
orP
erce
nt o
f Tot
al P
opul
atio
n23
.1E
ast W
inds
orS
uffie
ldP
er C
apita
Inco
me
$19,
233
Enf
ield
Win
dsor
Chi
ld P
over
ty2.
3%G
ranb
yW
inds
or L
ocks
Livi
ng W
ith T
wo
Par
ents
81.9
%H
artla
nd
Chi
ldre
n's
Rac
ial/E
thni
c B
ackg
roun
dW
hite
91.0
%B
lack
5 7%
Oth
er R
aces
3.3%
His
pani
c (m
ay b
e of
any
rac
e)2.
6%
Wel
fare
Ben
efits
perc
ent o
f all
child
ren
rece
ivin
g be
nefit
s. a
vg. 1
995-
96
Low
Birt
hwei
ght
per
1,00
0 bi
rths
. 199
5
Infa
nt M
orta
lity
per
1.00
0 liv
e bi
rths
. avg
. 199
3-95
Late
or
No
Pre
nata
l Car
epe
rcen
t of a
ll bi
rths
, avg
. 199
4-95
Birt
hs to
Tee
n R
Aot
hers
perc
ent o
f all
birt
hs. 1
995
Chi
ld D
eath
spe
r 10
0,00
0 ch
ildre
n ag
es 1
-14.
avg
. 199
3-95
Mee
ting
CA
PT
Goa
lpe
rcen
t of a
ll te
nth
grad
e st
uden
ts. 1
996-
97
Wel
l Bel
ow C
AP
T S
tand
ard
perc
ent o
f all
tent
h gr
ade
stud
ents
, 199
6-97
Hig
h S
choo
l Dro
pout
spe
rcen
t of a
ll st
uden
ts g
rade
s 9-
12. 1
995-
96
Juve
nile
Vio
lent
Crim
e A
rres
tspe
r 10
0,00
0 ch
ildre
n ag
es 1
0-17
. avg
. 199
4-95
Chi
ld A
buse
/Neg
lect
perc
ent o
f all
child
ren.
SF
Y 1
995-
96
1,60
5
105 15
104 97
5
198
428
227
51 765
ion
Sta
teR
ate
Wor
se T
han
Sta
te R
ate
WB
ate
-B
ette
r T
han
Sta
te R
ate
4.8
57.1 8.4
6.0
5.3
18.8
13.6
29.4 3.7
368.
6
2.3
100%
75%
SO
%25
%25
%50
%
2 1_
14.5
71.0
7.4
11.9
8.6
24.8
12.3
37.9 4.6
506.
4
4.3
20%
50%
38%
U24
%,
11%
IL22
%
E20
%
IN27
%
47%
67%
.
15%
122
100%

Cap
itol I
V Far
min
gton
New
ingt
onT
otal
Num
ber
of C
hild
ren
25,5
83
Gla
ston
bury
Roc
ky H
illP
erce
nt o
f Tot
al P
opul
atio
n20
.4
Mar
lbor
ough
Wet
hers
field
Per
Cap
ita In
com
e$2
3,42
6
Chi
ld P
over
ty2.
3%
Livi
ng W
ith T
wo
Par
ents
84.2
%
Chi
ldre
n's
Rac
ial/E
thni
c B
ackg
roun
d
Whi
te94
.7%
Bla
ck1.
8%
Oth
er R
aces
3.5%
His
pani
c (m
ay b
e of
any
rac
e)2.
7%
Wel
fare
Ben
efits
perc
ent o
f all
child
ren
rece
ivin
g be
nefit
s, a
vg. 1
995-
96
Low
Birt
hwei
ght
per
1,00
0 bi
rths
, 199
5
Infa
nt M
orta
lity
per
1.00
0 liv
e bi
rths
. avg
. 199
3-95
Late
or
No
Pre
nata
l Car
epe
rcen
t of a
ll bi
rths
, avg
. 199
4-95
Birt
hs to
Tee
n M
othe
rspe
rcen
t of a
ll bi
rths
. 199
5
Chi
ld D
eath
spe
r 10
0,00
0 ch
ildre
n ag
es 1
-14,
avg
. 199
3-95
Mee
ting
CA
PT
Goa
lpe
rcen
t of a
ll te
nth
grad
e st
uden
ts, 1
996-
97
Wel
l Bel
ow C
AP
T S
tand
ard
perc
ent o
f all
tent
h gr
ade
stud
ents
, 199
6-97
Hig
h S
choo
l Dro
pout
spe
rcen
t of a
ll st
uden
ts g
rade
s 9-
12, 1
995-
96
Juve
nile
Vio
lent
Crim
e A
rres
tspe
r 10
0,00
0 ch
ildre
n ag
es 1
0-17
, avg
. 199
4-95
Chi
ld A
buse
/Neg
lect
perc
ent o
f all
child
ren,
SF
Y 1
995-
96
Reg
ion
No.
Rat
e
100%
75%
50%
729
2.9
7148
.5
64.
2
684.
9
382.
6
315
.2
212
17.3
263
21.4
721.
4
2724
5.8
493
1.9
25%
8.6
24.8
12.3
37.9 4.6
608.
4
4.3
123
124

Cap
itol V
Tot
al N
umbe
r of
Chi
ldre
n29
,006
And
over
Som
ers
Per
cent
of T
otal
Pop
ulat
ion
22.5
Bol
ton
Sta
fford
Per
Cap
ita In
com
e$1
7,84
9C
olum
bia
Tol
land
Chi
ld P
over
ty4.
3%C
oven
try
Uni
onLi
ving
With
Tw
o P
aren
ts82
.0%
Elli
ngto
nV
erno
nH
ebro
nW
illin
gton
Chi
ldre
n's
Rac
ial/E
thni
c B
ackg
roun
dM
ansf
ield
Whi
te95
.4%
Bla
ck1.
7%O
ther
Rac
es2.
9%H
ispa
nic
(may
be
of a
ny r
ace)
2.1%
Indi
cato
r
Wel
fare
Ben
efits
perc
ent o
f all
child
ren
rece
ivin
g be
nefit
s. a
vg. 1
995-
96
Low
Birt
hwei
ght
per
1.00
0 bi
rths
, 199
5
Infa
nt M
orta
lity
per
1.00
0 liv
e bi
rths
. avg
. 199
3-95
Late
or
No
Pre
nata
l Car
epe
rcen
t of a
ll bi
rths
. avg
. 199
4-95
Birt
hs to
Tee
n M
othe
rspe
rcen
t of a
ll bi
rths
, 199
5
Chi
ld D
eath
spe
r 10
0,00
0 ch
ildre
n ag
es 1
-14,
avg
. 199
3-95
Mee
ting
CA
PT
Goa
lpe
rcen
t of a
ll te
nth
grad
e st
uden
ts, 1
996-
97
Wel
l Bel
ow C
AP
T S
tand
ard
perc
ent o
f all
tent
h gr
ade
stud
ents
, 199
6-97
Hig
h S
choo
l Dro
pout
spe
rcen
t of a
ll st
uden
ts g
rade
s 9-
12, 1
995-
96
Juve
nile
Vio
lent
Crim
e A
rres
tspe
r 10
0,00
0 ch
ildre
n ag
es 1
0-17
, avg
. 199
4-95
Chi
ld A
buse
/Neg
lect
perc
ent o
f all
child
ren.
SF
Y 1
995-
96
gion
'Sta
teR
ate
Wor
se T
han
Sta
te R
ate
Rat
e; B
ette
r T
han
Sta
te R
ate
1,50
05.
1
9763
.7
138.
4
159
10.1
493.
2
415
.7
224
16.2
366
26.5
164
3.0
4738
3.3
809
2.7
100%
75%
50%
25%
25%
50%
75%
100%
4%
125
14.5
71.0
10%
7.4
11.9
15%
8.6
24.8
12.3
37.9 4.6
506
4
4.3
141
37%
E32
%
126

Nor
thea
st
Ash
ford
Bro
okly
n
Can
terb
ury
Put
nam
Tot
al N
umbe
r of
Chi
ldre
n26
,363
Cha
plin
Sco
tland
Per
cent
of T
otal
Pop
ulat
ion
25.7
Eas
tford
Ste
rling
Per
Cap
ita In
com
e$1
4,52
0
Ham
pton
Tho
mps
onC
hild
Pov
erty
11.4
%
Kill
ingl
yW
indh
amLi
ving
With
Tw
o P
aren
ts73
.4%
Pla
infie
ldW
oods
tock
Pom
fret
Chi
ldre
n's
Rac
ial/E
thni
c B
ackg
roun
d
Whi
te93
.7%
Bla
ck1.
3%
Oth
er R
aces
5.0%
His
pani
c (m
ay b
e of
any
rac
e)6.
8%
Wel
fare
Ben
efits
perc
ent o
t all
child
ren
rece
ivin
g be
nefit
s, a
vg. 1
995-
96
Low
Birt
hwei
ght
per
1,00
0 bi
rths
, 199
5
Infa
nt M
orta
lity
per
1,00
0 liv
e bi
rths
, avg
. 199
3-95
Late
or
No
Pre
nata
l Car
epe
rcen
t of a
ll bi
rths
, avg
. 199
4-95
Birt
hs to
Tee
n M
othe
rspe
rcen
t of a
ll bi
rths
, 199
5
Chi
ld D
eath
spe
r 10
0,00
0 ch
ildre
n ag
es 1
-14,
avg
. 199
3-95
Mee
ting
CA
PT
Goa
lpe
rcen
t of a
ll te
nth
grad
e st
uden
ts, 1
996-
97
Wel
l Bel
ow C
AP
T S
tand
ard
perc
ent o
f all
tent
h gr
ade
stud
ents
, 199
6-97
Hig
h S
choo
l Dro
pout
spe
rcen
t of a
ll st
uden
ts g
rade
s 9-
12, 1
995-
96
Juve
nile
Vio
lent
Crim
e A
rres
tspe
r 10
0,00
0 ch
ildre
n ag
es 1
0-17
, avg
. 199
4-95
-C
hild
Abu
se/N
egle
ctpe
rcen
t of a
ll ch
ildre
n, S
FY
199
5-96
ion
Rat
e
3,49
413
.0
101
70.2
118.
1
137
9.9
175
12.2
628
.1
103
7.8
546
41.4
244
4.6
4237
2.0
1,88
47.
0
Sta
te,R
ate
Bet
ter
Tha
n S
tate
Rat
e25
%50
%75
%10
0%
10%
mil
24.8
63%
127
123

Sou
thea
stT
otal
Num
ber
of C
hild
ren
32,9
40B
ozra
hLy
me
Per
cent
of T
otal
Pop
ulat
ion
25.1
Col
ches
ter
Mon
tvill
e
Per
Cap
ita In
com
e$1
6,63
9F
rank
linN
orth
Sto
ning
ton
Chi
ld P
over
ty9.
4%G
risw
old
Nor
wic
h
Livi
ng W
ith T
wo
Par
ents
77.6
%Le
bano
nO
ld L
yme
Ledy
ard
Pre
ston
Chi
ldre
n's
Rac
ial/E
thni
c B
ackg
roun
dLi
sbon
Sal
em
Whi
te93
.6%
Bla
ck3.
4%
Oth
er R
aces
3.1%
His
pani
c (m
ay b
e of
any
rac
e)2.
8%
Indi
cato
r
Wel
fare
Ben
efits
perc
ent o
f all
child
ren
rece
ivin
g be
nefit
s, a
vg. 1
995-
96
Low
Birt
hwei
ght
per
1.00
0 bi
rths
, 199
5
Infa
nt M
orta
lity
per
1.00
0 liv
e bi
rths
. avg
. 199
3-95
Late
or
No
Pre
nata
l Car
epe
rcen
t of a
ll bi
rths
. avg
. 199
4-95
Birt
hs to
Tee
n M
othe
rspe
rcen
t of a
ll bi
rths
. 199
5
Chi
ld D
eath
spe
r 10
0,00
0 ch
ildre
n ag
es 1
-14.
avg
. 199
3-95
Mee
ting
CA
PT
Goa
lpe
rcen
t of a
ll te
nth
grad
e st
uden
ts. 1
996-
97
Wel
l Bel
ow C
AP
T S
tand
ard
perc
ent o
f all
tent
h gr
ade
stud
ents
. 199
6-97
---
Hig
h S
choo
l Dro
pout
spe
rcen
t of a
ll st
uden
ts g
rade
s 9-
12. 1
995-
96
Juve
nile
Vio
lent
Crim
e A
rres
tspe
r 10
0,00
0 ch
ildre
n ag
es 1
0-17
. avg
. 199
4-95
Chi
ld A
buse
/Neg
lect
perc
ent o
f all
child
ren.
SF
Y 1
995-
96
gion Rat
e
100%
75%
50%
2,65
78.
1
120
67.6
126.
8
247
13.7
153
8.6
519
.4
136
9.3
484
33.0
224
3.6
8461
3.9
1,19
73.
7
25%
Spr
ague
Vol
unto
wn
24%
g
21%
n
129
11.9
8.61
i0%
24.8
12.3
r'
37.9
I3o

Sou
thea
st S
hore
Eas
t Lym
eS
toni
ngto
nT
otal
Num
ber
of C
hild
ren
27,0
66
Gro
ton
Wat
erfo
rdP
erce
nt o
f Tot
al P
opul
atio
n21
.8
New
Lon
don
Per
Cap
ita In
com
e$1
6,76
8
Chi
ld P
over
ty9.
2%
Livi
ng W
ith T
wo
Par
ents
75.2
%
Chi
ldre
n's
Rac
ial/E
thni
c B
ackg
roun
d
Whi
te83
.5%
Bla
ck9.
5%
Oth
er R
aces
6.9%
His
pani
c (m
ay b
e of
any
rac
e)7.
8%
Wel
fare
Ben
efits
perc
ent o
f all
child
ren
rece
ivin
g be
nefit
s, a
vg. 1
995-
96
Low
Birt
hwei
ght
per
1,00
0 bi
rths
. 199
5
Infa
nt M
orta
lity
per
1,00
0 liv
e bi
rths
, avg
. 199
3-95
Late
or
No
Pre
nata
l Car
epe
rcen
t of a
ll bi
rths
, avg
. 199
4-95
Birt
hs to
Tee
n M
othe
rspe
rcen
t of a
ll bi
rths
, 199
5
Chi
ld D
eath
spe
r 10
0,00
0 ch
ildre
n ag
es 1
-14,
avg
. 199
3-95
Mee
ting
CA
PT
Goa
lpe
rcen
t of a
ll te
nth
grad
e st
uden
ts, 1
996-
97
Wel
l Bel
ow C
AP
T S
tand
ard
perc
ent o
f all
tent
h gr
ade
stud
ents
, 199
6-97
Hig
h S
choo
l Dro
pout
spe
rcen
t of a
ll st
uden
ts g
rade
s 9-
12, 1
995-
96
Juve
nile
Vio
lent
Crim
e A
rres
tspe
r 10
0,00
0 ch
ildre
n ag
es 1
0-17
, avg
. 199
4-95
Chi
ld A
buse
/Neg
lect
perc
ent o
f all
child
ren.
SF
Y 1
995-
96
ion
Rat
eW
orse
Tha
n S
tate
Rat
eB
ette
r T
han
Sta
te R
ate
3,02
711
.5
9052
.1
126.
9
300
17.1
175
10.1
522
.2
124
11.8
395
37.7
166
3.7
4141
4.1
1,15
54.
4
100%
75%
50%
25%
25%
50%
75%
100%
14.5
71.0 7.4
11.9
17%
8.6
24.8
4% E
.12.
3
37.9 4.6
506.
4
2%4.
3
33'
7%
1o%
1%
132


Terms
Children:Throughout this book, we have used the term "children" to apply to persons younger than the age of 18. Where the available data
uses a different age grouping, it is so noted.
Race/ethnicity:We have reported race and ethnicity using the categories established for the 1990 U.S. Census and used by state agencies provid-ing the data. People of Hispanic origin may be of any race.
Fiscal year data:Most data presented here are for calendar years. Where data collected by state or federal authorities was available only by fiscalyears, it is noted as SFY (state fiscal year, July 1 to June 30) or FFY (federal fiscal year, October 1 toSeptember 30).
Methodology
Number:For each indicator, we include the number of "events" for a given time period, for example, the number of high school studentswho dropped out during the 1995-96 school year.
Rate:For 14 of the 15 child well-being indicators, we include rates as well as numbers. A rate is a measure of the likelihood of an eventand is calculated by dividing the number of events by the number of persons that are "eligible" for that event. For example, thehigh school dropout rate is the number of students who dropped out in a given year divided by the number of students enrolled. Apercentage is a rate per 100. Other rates included here are per 1,000 or 100,000. Rates can be used to compare between regionsfor a specific indicator. Rates were not calculated if the number of "events" was less than 5. The regions with rates worse than thestatewide rate are highlighted on each table. Meaningful rates could not be calculated for the teen deaths measure at the locallevel because of a lack of reliable data on the number of teenagers to use as a denominator. In addition, estimates could not bemade because of the narrow age range.
134

Rounding:For the purpose of improving readability, percentages are rounded to the nearest whole number in the text, except in rare caseswhere smaller differences were deemed crucial. Some of the statistics cited in the text were only available rounded to the nearestwhole number. Those who are interested in a particular statistic at a more detailed level should call CAHS for more information.Please note that because of this rounding, percentages may not always add up to exactly one hundred percent.
In the charts, all rates are calculated to the nearest tenth of a percent for greater accuracy. The percent change in rates over timeis rounded to the nearest whole number.
Sources:Sources for all data are listed on each page in the order in which they appear in the text.
Notes:Technical information, formulas for calculating the data in the charts, and any limitations of the data are found in notes at thebottom of a page.
Selection of indicators:Many different indicators could have been used to measure the well-being of children. The compilation of these indicators for ourfirst book was a function of 1) results of a survey of members of the Children's Future Panel (a group of more than forty individualswho are advising this project), 2) relation to national KIDS COUNT indicators, 3) how directly the indicator measured children'swell-being, and 4) availability of data.
Regions:For the purposes of this report, we have divided Connecticut into 27 regions (towns or groups of towns) based on the public usemicrodata areas established by the Census Bureau. The use of regions allowed us to calculate rates where the population wouldhave been too small at the town level. Each region has a population of more than 100,000, and no town is split between tworegions. The five largest cities, Bridgeport, Hartford, New Haven, Stamford, and Waterbury, are regions unto themselves. The rawdata for the tables was collected originally for each town, and then towns were grouped into regions. Regional school districtssometimei enrolled students from more than one of the regions for the high school dropout data used in this report; a list of theregions to which these school districts were assigned can be found on page 37. Indexes to towns and regions and a map arelocated on pages 34-36.
135

Comparing regions to statewide rate:On the regional tables, the rate for each indicator is shown as a percent better or worse than the statewide rate. Because this
percentage varies with each measure, one should look at the child well-being indicator tables to see how a region compared to
others on that measure. For example. a region could have a high school dropout rate that is twice the statewide rate.
Comparing regions to one another:This report makes no attempt to combine indicators into an overall score for any region. Given the diversity of the indicators and
their measurement, and the wide diversity of demographics across regions. we felt it best to view the indicators individually and
form a more holistic view of how well children in each region were doing.
1 6

Corporate Members
The Advest Group, Inc.Aetna Inc.Allied Signal Inc.American Skandia Life Assurance
CorporationAnalysis &Technology, Inc.Baldwin Technology
Company, Inc.Barnes Group, Inc.Blue Cross & Blue Shield of
ConnecticutBristol-Myers Squibb CompanyChampion International
CorporationConnectiCare, Inc.Connecticut Natural Gas
CorporationCoventry Hotel Associates, Inc.Crane Fund for Widows
and ChildrenCUC International, Inc.The Dexter Corporation
Foundation, Inc.The Dun & Bradstreet
CorporationDuracell International Inc.Eagle Federal Savings BankEchlin Inc.Evans, Shores & LeonardThe Flatley CompanyFleet Financial GroupGeneral Electric Company
General Signal Networks-DataSwitch
GTE CorporationHallmark Cards, Inc.Hartford Marriott FarmingtonHartford Steam Boiler Inspection
and Insurance CompanyHeublein, Inc.Holley Dodge of Middletown, Inc.Industrial Risk InsurersKaiser PermanenteR.C. Knox and Company, Inc.Konica Business Machines
U.S.A., Inc.Liberty BankLiptonLydall, Inc.Macy's East, Inc.The MassMutual Foundation for
Hartford, Inc.Mohegan SunMutual of AmericaNortheast UtilitiesOmega Engineering, Inc.Orion Capital CompaniesOxford Health Plans, Inc.JCPenney Manchester Catalog
Fulfillment CenterPhoenix Home Life Mutual
Insurance CompanyPitney Bowes, Inc.Reflexite Corporation
13 7
Security-Connecticut CorporationShoreline Financial Advisors, LLCFrederick R. Shores and
AssociatesThe Wendell M. Smith
FoundationStone & Webster Engineering
CorporationThe Stop & Shop Supermarket
CompanySunshine RealtyTimex CorporationTosco CorporationTrans-Lux CorporationThe United Illuminating
CompanyUnited Technologies CorporationWeeden & Co., L.P.Xerox Corporation
Council of Sponsors
Kaye E. BarkerWilliam J. Cibes, Jr.June GoodmanElizabeth G. HeddenThe Perrin Family FoundationCharles A. Pillsbury
and Jean G. SandersonJohn G. PolkLois SontagMrs. James P. WarburgMr. and Mrs. F. Champion WardNorman T. Woodberry

CAHSConnecticut Association for Human Services
110 Bartholomew Avenue. Suite 4030Hartford, Connecticut 06106-2201
(860) 951-2212

(9/92)
U.S. DEPARTMENT OF EDUCATIONOffice of Educational Research and improvement (CERI)
Educational Resources Information Center (ERIC)
NOTICE
REPRODUCTION BASIS
ERIC
This document is covered by a signed "Reproduction Release(Blanket)" form (on file within the ERIC syst-ern), encompassing all-or classes of documents from its source organization and, therefore,does not require a "Specific Document" Release form.
This document is Federally-funded, or carries its own permission toreproduce, or.is otherwise in the public domain and, therefore, maybe reproduced by ERIC without a signed Reproduction Releaseform (either "Specific Document" or "Blanket").
PS