19971126 dtic · figure 1, newton's experiment with sunlight and a prism. ... the chopper,...
TRANSCRIPT
Defense Technical Information Center
Compilation Part Notice4OrAENT Oý
This paper is a part of the following report:
* Title. Technology Showcase: Integrated Monitoring,_Diagnostics and JailurePrevention.
Proceedings of a Joint Conference, Mobile, Alabama, April 22-26, 1996.
* To order the complete compilation report, use: AD-A325 558
The component part is provided here to allow users access to individually authored sectionsof proceedings, annals, symposia, etc. However, the component should be considered withinthe context of the overall compilation report and not as a stand-alone technical report.
Distribution Statement A:This document has been approved for publicrelease and sale, its distribution is unlimited.
19971126 055 DTic

CURRENT TECHNOLOGY IN OIL ANALYSIS SPECTROMETERSAND WHAT WE MAY EXPECT IN THE FUTURE
M. Lukas and R. J. YurkoSpectro Incorporated
160 Ayer RoadLittleton, MA 01460 U.S.A.
Abstract: Oil analysis spectrometers have been in use for the analysis of wear metals,contaminants and additives in lubricating oils for almost 50 years. They have becomethe mainstay and primary analytical tool of most machine condition monitoringprograms based on oil analysis. Spectrometers have evolved from large instrumentsthat take up the better part of a laboratory, to smaller table top instruments. Analysistimes have decreased from hours to seconds, and the ins ruments no lor -,er have to beoperated by experts to obtain excellent analytical results
This paper traces the history of the atomic spectroscopy technique through currentinstrumentation and capabilities. It will close with recent advances in technologiesthat have created remarkable opportunities to develop a new generation of oilanalysis spectrometers
Key Words: Atomic absorption; Atomic emission; Inductively coupled plasma;Machine condition monitoring; Oil analysis; Rotating disc electrode; Spectrometers
HISTORY OF SPECTROSCOPY: Principles of spectroscopy go back close to fourhundred years. However, modem spectroscopy has its origin in the early nineteenthcentury.
As with many of today's technological advances, spectxscopy can also trace some cits early days to Newton. While carrying out tests in 1666 with a glass prism, Newtonnoticed that sunlight is divided into spectral colors (rainbow colors), Figure 1. Thisbasic fact of science is still the operational basis of all modem spectrometers.
!
Red
GreenBlue
Figure 1, Newton's Experiment with Sunlight and a Prism

The nineteenth century started with further experimentation that eventually resultedin simple spectrographic instruments. In 1802 Wollaston found dark lines in thespectrum of the sun when he used an entrance slit as an aperture [1]. Fifteen yearslater, Fraunhofer produced the first diffraction grating and constructed a simplespectroscope to study the dark lines indicated by Wollaston. He found 700 of theselines in the spectrum of the sun and similar lines in the stars. In 1826 Talbot andHerschel introduced sodium, potassium, lithium and strontium salts into a spiritflame and observed the colors emitted by means of a spectroscope. The emission lineslay where Fraunhofer found the dark lines in the spectra of the sun and stars. Talbotrecommended that this method be used to determine the presence of specificsubstances instead of an expensive chemical analysis.
In 1860 Bunsen and Kirchhoff extended the observations made by Talbot and Herschel.They recognized that spectral lines were connected with the atoms and not with theirchemical compounds. The various atoms emit spectral lines that are unique to theelements excited in the flame. Emissions of these unique spectral lines can thus beused as evidence for the presence of these elements in the sample. This in essence, wasthe foundation stone for spectrochemical analysis. Kirchhoff also postulated onemission and absorption by stating that matter absorbs radiation at the samewavelength that it emits radiation. It was thus possible to explain the Fraunhoferlines in the spectrum of the sun as due to absorption by atoms in the cooler outerzones of the radiating source.
In 1869 Angstrom produced the first reflection grating by scratching a mirror with adiamond to create parallel lines. Sample introduction was the area of study for Gouyand less than ten years later, he introduced *the first pneumatic nebulizer to introduceliquids into flames.
At this tinf. spectroscopy was a qualitative analytical technique. Spectra wereinitially observed visually using a spectroscope, but soon thereafter, they werephotographed. Around the turn of the century, in the early 1900's, the spectroscopebecame a spectrograph when photographic plates were fitted to the image plane of theoptics. It was also determined that few spectral lines lie in the visual part of thespectrum, and the majority are located in the ultra-violet region. Gas filled opticalsystems were thus developed to observe spectra below 190 nanometers whichotherwise would be absorbed by air (oxygen).
In the 1930's emphasis shifted to alternative excitation sources because flametemperatures are too low to vaporize and excite most lines. Direct current (DC) arcs,alternating current arcs (AC), interrupted arcs and high voltage sparks weredeveloped because they vaporize all elements and excite several spectral lines foreach.
Modern spectroscopy was born in 1936 when Thanheiser and Heyes reported the firstphotoelectric detection of a spectrum using photocells. A few years later, the
development of photomultiplier tubes let to the introduction of today's modern"direct-reading spectrometers". Rotating disc electrode (RDE) systems replaced manyflames as the preferred means to introduce the sample into an arc or spark forexcitation. The main building blocks of spectrochemical analysis instruments becamethe excitation source, optical system (spectrometer), and readout system.
Since that time advances have been made in grating production, excitation sources andcomputerization. Gratings were expensive to produce and each was individuallymanufactured. When it was learned to copy gratings using a photographic replicationprocess, they became less expensive to produce and prisms were eliminated frommost spectrometers.
From 1965 to 1970 Greenfield and Fassel developed the inductively coupled plasma(ICP) source which exhibits much improved capabilities to excite spectral lines, andwithout most spectral interferences. This led to a renaissance for spectrochemicalanalysis and the ICP is still the most important excitat;on source for environmentalanaiysis and research applications.
Starting with the late 1960's, computers started to be used to convert spectrometricmeasurements into actual concentrations. Analysis times were shortened, but mostimportantly, the human element was eliminated from much of the analysis process.
In 1983 fiber optics were introduced to transmit light from the excitation source to thespectrometer optics. This eliminated the need for complex optics and made it possibleto manufacture stable and modular instruments. Until this time, spectrometersystems were restricted to laboratory use due to their need for environmental controlsand complex operating requirements. The fiber optic which simplified construction,and computerization which simplified operation made it possible to develop mobileinstruments. The entire industry changed, and it was possible for the first time tobring the instrument to the site where the analysis was required, rather than having totake the sample to a laboratory.
The Joint Oil A -alysis Program is a direct benc ciciary from these developments.Today oil analysis spectrometers are mobile, easier to use and more reliable.
TODAY'S SPECTROMETERS FOR OIL ANALYSIS: Spectrometers used for debrisand lubricant analysis fall into two categories, atomic absorption and atomicemission. Atomic absorption spectrometers consist of flame instruments (FL/AAS)and atomic emission spectrometers can be either rotating disc electrode (RDE/AES) orinductively coupled plasma (ICP/AES). Each technique will be described briefly inthis section.
Atomic Absorption Spectroscopy (AAS): In the flame atomic absorption spectroscopy(FL/AAS) technique, Figure 2, a small amount of diluted oil sample is fed into acontrolled flame normally fueled by an acetylene-oxygen or nitrous oxide mixture.The flame vaporizes the sample and stimulates the atoms into an elevated energy

state so they can readily absorb light. A special hollow cathode lamp emits a highintensity light beam corresponding to the exact energy required to cause the elementof interest to be raised to an excited energy state. Since the lamp emits light at thespecific wavelength of the element to be analyzed, a separate lamp is required foreach element. The monochromator is tuned to the desired wavelength and because ofthe chopper, receives a continuous reference signal from the hollow cathode lamp andan alternating absorbed signal from the flame. The absorbed light can be related tothe concentration of the element present in the oil [2], and a microprocessor orcomputer then separates the signals and converts them into concentrations.
Hollow Cathode Lamp Flame •"-I~ cnrl", t Photomultiplie
%" Tube'
Haff-silvred
Mirro Reeernoeut
i Oil sample •: !-,:
A
Figure 2, Schematic diagram of an atomic absorption spectrometer (AAS)
The FL/AAS technique has been in use for over 35 years in thousands of instrumentsfor elemental analysis but is applied most often for aqueous solutions, rather than oilsamples. It is a single element at a time technique that is good for quantitative, notqualitative, analysis. Improvements in the past 10 years have been in alternate meansto atomize the sample [3].
The FL/AAS technique is relatively simple to operate, offers good analyticalperformance and is the least costly instrument to acquire. It is, however, relativelyslow, involves sample preparation for most oils, and requires a different light sourcefor each element analyzed. The sample introduction system and flame temperature
limit the wear particle size detection capability to about 5 gm [4]. Table I summarizesadvantages and disadvantages of the AAS technique.
Table 1, Advantages and Disadvantages of the AAS Technique
Advantages Disadvantages"• simple to operate a slow, one element at a time"F analytical performance d sample preparation"" virtually free of spectral interfer tie fornt for particles > 5 ilm"" low purchase price o requires gases & light sources
fo ac leet nlye. h smleitodcio yse adflm tmertr

Analytical instruments using the AAS technique are considered ideal starter systemsand are used in applications where few samples have to be analyzed at any one time.
Atomic Emission Spectroscopy (AES): Most atomic emission spectrometers employedin used oil analysis are either of the rotating disk electrode type (RDE) or of theinductively coupled plasma (ICP) type. In the RDE/AES technique, Figure 3, arotating disc electrode brings a continuous sample into a gap between the disc and astationary rod electrode. A high voltage arc is then struck between the disc and rodelectrodes causing the individual atoms in the sample to give off light or radiantenergy.
Rod & Disc Grating
Electrode•
4 i'•• -,Exit
Slits~A Photomultiplier
Oil Sample & Holder eposa ecr -e pls Tubes
Fiber,
Entrance•i
Figure 3, Schematic diagram of an RDE atc mic emission spectrometer
The ICP/AES excitation technique employs an electrode-free plasma created by a flow
of inert gas (argon). The gas passes continuously through the plasma torch which islocated inside a two or three turn R.F. coil connected to a radio frequency alternatingcurrent generator, Figure 4. The argon gas acts as the secondary winding of atransformer, becoming highly ionized and extremely hot. The ionized argon isreferred to as a plasma and reaches temperatures of 8,000 to 10,0000C. The oil sampleis aspirated through the center of the torch and into the plasma where the atomspresent are totally dissociated and excited sufficiently to give off radiant energy.
In RDE/AES and ICP/AES systems, a lens or fiber optic is then used to gather andfocus the radiant energy from the excitation source onto a concave diffraction gratingwhich disperses the light into the various spectral lines associated with the elementspresent. Photomultiplier tubes are positioned behind exit slits to detect and convertradiant energy into electrical currents which give a measure of the concentration of
5i

each metal present in the sample. This result is displayed on a video screen, sent to aprinter or stored on a hard disc. While the ICP technique was developed for wateranalysis, improvements have continued for various applications including oilanalysis. A^) Grating
Llt PhotomuffiplierFn optic e I ss Tubes
to eav ge Reolsandou even graesw ichcnb nlzdwihu iuin htechniqu is very robut has feOoigptic an(d requie itl antnne.I a
beenut e onl vibe choice foara ofil deplaoyable miso spectrometersfrcmeiaan
For ubr Tabigole ,Avnae and Disadvantagesso the RDE Techniquecotnetobprfrdfr
its~~ simplct tof operatio n elaity It mloastreaiix y efetomrefienlanalyz noe sampler preartiuatesion use onsm lys oanilg based smlhdstlaes fel
to~~ dev eroels anot requien cooling water orn g easese itotdluin htehiu i eyrbut a fwmvn pit ndrqie little maintenance.Iha
mltayapiain.Tbe2smaisthe advantages and disadvantages of the IPtcnqeaesmaie nTbe3
The ~ Tal mai Acvnae n iadvantages of the ICP techniqueisispromneacucypeiinad
detetio limitlae exoelltent.Matrix effects r iia ic ape utbdiluted sapl prioetpnayss andthdioun beoe they primar based smaterils h C
" litl maneac
also lends itself to analysis of almost any material that can be dissolvable so that afine spray is created prior to analysis. Automation of the sample introduction processis widely practiced in some cases; unattended operation is thereby possible.

Table 3, Advantages and Disadvantages of the ICP Technique
Advantages Disadvantages"* performance e requires sample preparation"* limited matrix effect * requires laboratory environment"* flexibility (other materials) * inefficient for particles >5gm"* automation * requires gas (argon)
The primary limitation of the ICP technique is the need to dilute an oil sample with asolvent prior to analysis. This time-consuming step can lead to accuracy errors.Operation of the ICP also requires a relatively well-trained person with experience inbasic laboratory procedures. Used oil samples are not ideally suited for the sampleintroduction system, and a certain amount of care and cleaning is routinely required.It is not the kind of instrument one would place on the factory floor. The particle sizeaialysis efficiency is worse than the RDE technique and limits its ability to detectcertain types of severe wear conditions
TOMORROW'S SPECTROMETERS FOR OIL ANALYSIS: Atomic emissionspectrometers have become the primary technique for used oil wear metal andcontaminant analysis. Our discussion regarding future improvements will thus belimited to this technique. The most logical approach is to review each of the mainassemblies of a spectrometer system and discuss possible changes we might see in thefuture.
Excitation Source: Both the RDE and ICP technique provides acceptable analyticalperformance for used oil analysis. Wear metals and contaminants are usually in theoil samples in parts per million (ppm) concentrations; lower detection limits are notnecessary. Accuracy is also acceptable for. used oils but could be improved for theRDE technique when applied to quality control of additives. Most improvements willthus be in the cost, size and serviceability of future excitation sources.
All excitation sources are based on simple electronic circuitry using discreetcomponents. Development trends tend to be towards solid state excitation circuitswhich result in cost, size and serviceability improvements. One of the side benefitswill be the elimination of transformers that are bulky and extremely heavy.
Sample introduction is still one of the weak links of the RDE and ICP spectrometers.Pre-digestion and complex sample preparation procedure to improve particle sizeanalysis capabilities have not been acceptable. Particle size limitations will beimproved with simple ancillary systems such as the rotrode filter spectroscopy RFSmethod. Automation for sample introduction will also be a primary area ofimprovement. Automatic samplers and dilutors already exist for ICP spectrometersand work relatively well with many types of oils. The RDE technique has been a littlemore difficult to automate. However, several methods are in development and willbe commercially available in the near future.
7i

One of the biggest limitations to excitation source improvement is the requirementfor instruments to meet and correlate to the existing JOAP data base. The JOAP database has become a standard in the military, is extremely well documented andaccepted and used by numerous worldwide military organizations. It is, however,based on instrument performance and referencing methods that are over thirty yearsold. Improvements that have been made to excitation sources often cannot beimplemented if the instrument is to be used, and approved to analyze oil samples asan integral part of the JOAP.
Optical Systems: The optical systems of spectrometers have always been the primaryfactors in determining the size of an instrument. Improvements in gratings havemade it possible to reduce size without sacrificing performance or dispersion. Theearly instruments with 3 meter (9 feet) focal, curves were replaced with 2 meter, then 1meter and today as small as 0.3 meter optics. Reduced requirements in focal curve sizehave made it possible to build much smaller instruments with better stability. Theintroduction of fiber optics has also led to further improvements in stability,complexity and size of optical systems.
The optical system is still the most expensive, the largest and the most delicatecomponent of an instrument. However, rapidly developing solid-state detectortechnology in the form of charged coupled devices or CCD detectors may change allthat. This technology provides devices, by a variety of processes, consisting of manysmall light sensitive semiconductors (pixels) which may be arranged in a single row(linear array) or as a rectangle or square (area array). CCD technology is widelyapplied in such commonplace and reliable devices as video cameras, copy and faxmachines. Consequently, a robust industry exists to supply and improve such devicesand they are available at favorable prices.
A linea array may be positioned at the focal surface of a spectrometer optic such thatan entire emission spectrum may be measured pixel by pixel. Linear arrays are nowcommercially available having as many as 8000 pixels with pixel spacing ofapproximately 10 micrometers. Bearing in.mind that in the present construction of apolychromator optic, exit slits placed in front of photomultiplier tubes are often 10micrometers wide, never narrower and often wider, a CCD linear array can achievethe same selectivity as an exit slit, and does so for every location along the spectrum.This opens the possibility of simultaneous measurement everywhere along theemission spectrum which, in turn, means unlimited choice of elements within thespectral range of the optic. Further to freely choosing any element, two additionalbenefits now exist. Namely, simultaneous background correction is possible at anyspectral position and an element may be measured at several emission wavelengthsinstead of one. These features are available in conventional polychromator optics, butonly at substantial additional expense and without flexibility after construction,perhaps even compromising some wavelengths because of inevitable mechanicalconstraints.
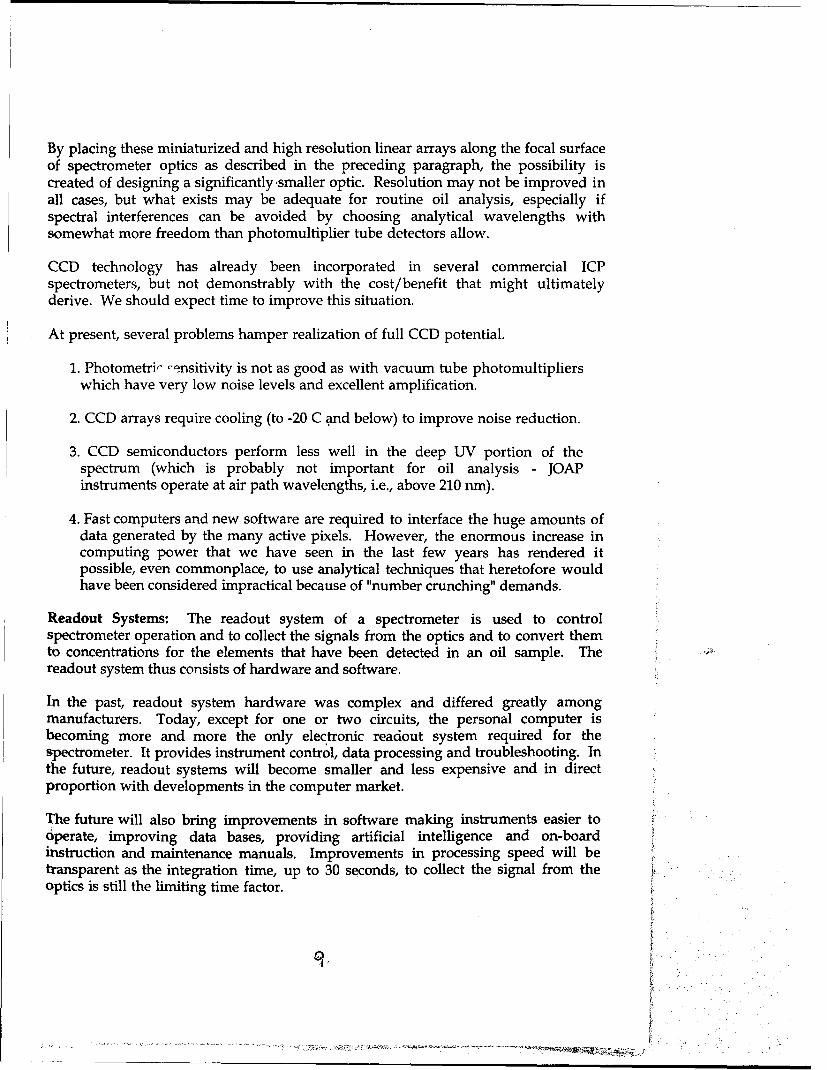
By placing these miniaturized and high resolution linear arrays along the focal surfaceof spectrometer optics as described in the preceding paragraph, the possibility iscreated of designing a significantly smaller optic. Resolution may not be improved inall cases, but what exists may be adequate for routine oil analysis, especially ifspectral interferences can be avoided by choosing analytical wavelengths withsomewhat more freedom than photomultiplier tube detectors allow.
CCD technology has already been incorporated in several commercial ICPspectrometers, but not demonstrably with the cost/benefit that might ultimatelyderive. We should expect time to improve this situation.
At present, several problems hamper realization of full CCD potential.
1. Photometri- -ensitivity is not as good as with vacuum tube photomultiplierswhich have very low noise levels and excellent amplification.
2. CCD arrays require cooling (to -20 C and below) to improve noise reduction.
3. CCD semiconductors perform less well in the deep UV portion of thespectrum (which is probably not important for oil analysis - JOAPinstruments operate at air path wavelengths, i.e., above 210 nm).
4. Fast computers and new software are required to interface the huge amounts ofdata generated by the many active pixels. However, the enormous increase incomputing power that we have seen in the last few years has rendered itpossible, even commonplace, to use analytical techniques that heretofore wouldhave been considered impractical because of "number crunching" demands.
Readout Systems: The readout system of a spectrometer is used to controlspectrometer operation and to collect the signals from the optics and to convert themto concentrations for the elements that have been detected in an oil sample. Thereadout system thus consists of hardware and software.
In the past, readout system hardware was complex and differed greatly amongmanufacturers. Today, except for one or two circuits, the personal computer isbecoming more and more the only electronic readout system required for thespectrometer. It provides instrument control, data processing and troubleshooting. Inthe future, readout systems will become smaller and less expensive and in directproportion with developments in the computer market.
The future will also bring improvements in software making instruments easier todperate, improving data bases, providing artificial intelligence and on-boardinstruction and maintenance manuals. Improvements in processing speed will betransparent as the integration time, up to 30 seconds, to collect the signal from theoptics is still the limiting time factor.
91

As computerization was used more and more in spectrometers during the late 1980's,software was envisioned to be the panacea and solution to everything. Flato's quote[15] still applies today and most likely will apply in the future.
"Those of us who were there (speaking of the late 1980's) can well remember the mistaken beliefthat software was easier to develop than hardware, and would take less time. Thismisunderstanding led to endless 36-hour workdays, many missed shipping schedules, and justas many financial problems."
CONCLUSION: There will be changes in tomorrow's oil analysis spectrometer, butthey may not be apparent to the operator of the instrument. Changes will be in theinternal components of the instruments, there may be additional capabilities andapplications, but performance will probably improve Pl'-e. Since performance for oilanalysis with today's spectrometers is more than acceptable, the main benefit derived
"" ~by the user from instruments in the future will be:
* smaller size and weight* more capabilities* easier operation* additional applications• lower cost
Changes to solid state excitation sources and CCD technology in optical systems willreduce the size and weight of instruments by at least a factor of two. More capabilitieswill be possible with solid state detector based electronics and instruments will nolonger be limited to only those elements installed when they were purchased. Everyspectral line will be available to the user and can be selected with software that is easyto use and operate. The availability of more elements and fewer compromises in theconstruction of the optics will open additional applications for oil analysisspectromete~rs. F el and coolant analysis is already possible but pi armance will beimproved. Lower cost of instruments will also make them available to other marketsand potential user that could not afford these instruments before.
Spectrometers for oil analysis have evolved from instruments that had to be used inenvironmentally controlled laboratories and by expert and well trained scientificpersonnel. Today they have become easier to operate, smaller in size, mobile, andmore robust for use in non laboratory environments. The net effect has been ananalytical capability that provides information immediately and at the site where it isactually needed. The primary advantage of tomorrow's spectrometer will be in itsexpanded capabilities and lower cost. They will open up additional markets, but mostimportant, the lower cost will make the technology available to users who until thenwere economically unable to benefit from machine condition monitoring based on oilanalysis.
REFERENCES:
[1] Slickers, K., 1993, Automatic Atomic-Emission Spectroscopy, p. 26-32, BrtihlscheUniversititsdruckerei, Giessen, Germany.
[2] Sieber, J.R, Salmon, S.G., 1994, Elemental Analysis of Lubricating Oils and Greases,Lubrication, Vol. 80, No. 1, 1994.
[3] Lukas, M., 1993, Comparison of Spectrometric Techniques for the Analysis of Liquid GasTurbine Fuels, Transactions of the ASME, Vol. 115, July 1993, p 620-627
[41 Rhine, W.E., Saba, C.S., Kaufmann, R.E., 1986, Metal Particle Detection Capabilitiesof Rotating Disc Emission Spectrometers , Lubrication Engineering, Vol. 42, No. 12, p755.
[51 Flato, J.B., Spectroscopy, 10(',), 62-64, (1995)