1999-01-0840 the influence of boost pressure on … sae index/reitz sae...1 1999-01-0840 the...
TRANSCRIPT

400 Commonwealth Drive, Warrendale, PA 15096-0001 U.S.A. Tel: (724) 776-4841 Fax: (724) 776-5760
SAE TECHNICALPAPER SERIES 1999-01-0840
The Influence of Boost Pressure on Emissionsand Fuel Consumption of a Heavy-Duty
Single-Cylinder D.I. Diesel Engine
K. V. Tanin, D. D. Wickman, D. T. Montgomery, S. Das and R. D. ReitzUniversity of Wisconsin-Madison
Reprinted From: In-Cylinder Diesel Particulate and NOx Control 1999(SP-1427)
International Congress and ExpositionDetroit, Michigan
March 1-4, 1999

The appearance of this ISSN code at the bottom of this page indicates SAE’s consent that copies of thepaper may be made for personal or internal use of specific clients. This consent is given on the condition,however, that the copier pay a $7.00 per article copy fee through the Copyright Clearance Center, Inc.Operations Center, 222 Rosewood Drive, Danvers, MA 01923 for copying beyond that permitted by Sec-tions 107 or 108 of the U.S. Copyright Law. This consent does not extend to other kinds of copying such ascopying for general distribution, for advertising or promotional purposes, for creating new collective works,or for resale.
SAE routinely stocks printed papers for a period of three years following date of publication. Direct yourorders to SAE Customer Sales and Satisfaction Department.
Quantity reprint rates can be obtained from the Customer Sales and Satisfaction Department.
To request permission to reprint a technical paper or permission to use copyrighted SAE publications inother works, contact the SAE Publications Group.
No part of this publication may be reproduced in any form, in an electronic retrieval system or otherwise, without the prior writtenpermission of the publisher.
ISSN 0148-7191Copyright 1999 Society of Automotive Engineers, Inc.
Positions and opinions advanced in this paper are those of the author(s) and not necessarily those of SAE. The author is solelyresponsible for the content of the paper. A process is available by which discussions will be printed with the paper if it is published inSAE Transactions. For permission to publish this paper in full or in part, contact the SAE Publications Group.
Persons wishing to submit papers to be considered for presentation or publication through SAE should send the manuscript or a 300word abstract of a proposed manuscript to: Secretary, Engineering Meetings Board, SAE.
Printed in USA
All SAE papers, standards, and selectedbooks are abstracted and indexed in theGlobal Mobility Database

1
1999-01-0840
The Influence of Boost Pressure on Emissionsand Fuel Consumption of a Heavy-Duty
Single-Cylinder D.I. Diesel Engine
K. V. Tanin, D. D. Wickman, D. T. Montgomery, S. Das and R. D. ReitzUniversity of Wisconsin-Madison
Copyright © 1999 Society of Automotive Engineers, Inc.
ABSTRACT
An electronically controlled Caterpillar single-cylinder oiltest engine (SCOTE) was used to study diesel combus-tion. The SCOTE retains the port, combustion chamber,and injection geometry of the production six cylinder, 373kW (500 hp) 3406E heavy-duty truck engine. The enginewas equipped with an electronic unit injector and an elec-tronically controlled common rail injector that is capableof multiple injections.
An emissions investigation was carried out using a six-mode cycle simulation of the EPA Federal Transient TestProcedure. The results show that the SCOTE meets cur-rent EPA mandated emissions levels, despite the higherinternal friction imposed by the single-cylinder configura-tion. NOx versus particulate trade-off curves were gener-ated over a range of injection timings for each mode andresults of heat release calculations were examined, giv-ing insight into combustion phenomena in current “stateof the art” heavy-duty diesel engines.
Next, a study of the effects of varying boost pressure lev-els was conducted. For fixed brake specific NOx levels,with low-pressure (90 MPa) single injections, particulatewas found to reduce monotonically as the boost pressurewas increased. Interestingly, with low pressure doubleinjections and with high pressure (>90 MPa) single injec-tions, particulate was found to decrease at first and thento increase as the boost pressure was increased beyondan optimum level. A minimum value for particulate withrespect to boost level was found for all cases, includingthe low-pressure single injections, when a correction forthe six-cylinder turbocharger efficiency was applied.Computer modeling confirms that this is due to a reduc-tion in the spray penetration and mixing that occurs asthe engine gas density is increased. BSFC was generallyreduced with increasing boost pressure. These resultssuggest that variable geometry turbochargers or otherenhanced boosting methods will aid in the reduction ofemissions and fuel consumption from heavy-duty truckengines.
INTRODUCTION
The capability of direct-injection (DI) diesel engines toproduce efficient power is well known. However, dieselengines exhibit a propensity for high nitrogen oxide (NOx)and particulate matter (particulate) emissions, and moststrategies to reduce either NOx or particulate emissionscause an increase in the other emission.
Since 1990, progress in engine technology has allowed asignificant reduction in all forms of emissions from dieselengines. However, demands for further emissions reduc-tion, quieter operation, and improved performance stillprovide serious challenges.
Advanced fuel injection technology can help reduce NOxand particulate emissions. More precise control of therate, pressure, and timing of fuel injection, while using ahigh-pressure injection system, not only permits simulta-neous reductions in NOx and particulate formation duringcombustion, but can also reduce engine noise. The elec-tronic unit injectors (EUIs) found on most commerciallyavailable heavy-duty engines are capable of precise high-pressure injection [1].
Another technology used to gain more control over com-bustion processes in diesel engines is the use of a vari-able boost pressure system. A variable boost systemallows flexible control, and thus optimization, of boostpressure for different load and speed conditions. In addi-tion to the original power and efficiency goals of variableboost systems, these systems have proven to improveemissions and transient response as well [2]. Thus, vari-able boost systems are expected to be an important com-ponent for future low emissions heavy-duty dieselengines [1].
When a fixed geometry, un-wastegated turbocharger isused to provide boost for an engine, a compromise mustbe made. Midrange torque and efficiency must be sacri-ficed in order to not over-boost at high loads and speeds.Wastegates allow some exhaust gas to bypass the turbo-charger turbine at high loads and speeds, thus reducing

2
boost pressure and avoiding an over-boost situation. Thedrawback to wastegates is that bypassed gas’ availabilityis wasted, leading to reduced overall efficiency at highloads and speeds [2]. In an attempt to provide increasedboost at lower loads and speeds while not overboostingor operating at reduced efficiency at high loads andspeeds, variable boosting systems such as VGTs andvariable speed superchargers have been developed.
There are three types of VGTs; those with variable areaturbines, those with variable geometry nozzles, andthose with axially movable vanes [2,3]. One type of VGTthat appears especially promising is the axially movablevane turbocharger. They have a high degree of flexibilityand fewer moving parts than other designs.
Another variable boost system that promises to provideeven more flexibility than VGTs is sequential hydro-supercharging (SHS). SHS systems use turbochargercompressor impellers driven by hydraulic turbines. Anengine driven hydraulic pump would provide hydraulicpower for the hydraulic turbines. The hydraulically drivencompressors are used to increase the pressure of airsupplied to the engine’s normal turbocharger compres-sor. This type of system would allow very flexible controlof boost levels and retain the availability recovery of theturbocharger [4].
Clearly, with the present variety of available variableboost systems, effects of boost pressure should be stud-ied in more detail. Thus, a significant portion of thepresent research is dedicated to studying effects of boostpressure.
EXPERIMENTAL SETUP
The test engine is a fully instrumented Caterpillar single-cylinder oil test engine (SCOTE). The SCOTE is a single-cylinder version of the Caterpillar 3400 series heavy-dutydiesel engine. It retains the injector, combustion cham-ber, and much of the port geometry of Caterpillar's 500hp 3406E heavy-duty over-the-road truck engine. Theengine laboratory setup used in the present experimentsis shown schematically on Fig. 1 and the details of theengine are given in Table 1.
The engine is capable of producing 62 kW at a ratedspeed of 1800 rev/min. Simulated supercharging and/orturbocharging with intercooling is accomplished bymetering temperature controlled, compressed air into aintake surge tank and controlling back pressure in theexhaust surge tank. Engine fluid temperatures are moni-tored using type K thermocouples.
Two fuel injection systems were used in the presentexperiments: A conventional electronic unit injector (EUI)system and a common rail system. The EUI system is thestandard fuel injection system from Caterpillar for usewith SCOTE and 500 hp 3406E heavy-duty dieselengines. With the EUI, start of injection (SOI) and dura-tion can be varied independently. During the present
experiments, however, duration was determined byrequired fuel flow rate for a given running condition. Table2 gives the specifications of the EUI system. The EUIsystem has a rising injection rate profile with SOI (needlevalve opening) at 36.5 MPa and the end at 29.0 MPa(needle valve closing).
Specifications of the common rail fuel injection systemare given in Table 3. The common rail system givessquare injection rate profiles and is capable of single,double, triple, and quadruple injection schemes withinjection pressures from 20 to 100 MPa, however, onlysingle and double injection with a maximum of 90 MPawere used to ensure reliability. Timing and duration canbe varied independently for each injection pulse.
A PC based data acquisition and analysis system wasused to take a 50 cycle average of cylinder pressure (andinjection pressure for the EUI) at 1/2 crank angle degreeincrements. The cylinder pressure data, along with otheroperating conditions were then analyzed using the FirstLaw of Thermodynamics to calculate the apparent heatrelease rate (AHRR).
Figure 1. Engine Laboratory Setup
Table 1. Engine Specifications
Engine Type Caterpillar SCOTE (single-cylinder oil test engine)- single-cylinder- direct injection- 4 valve
Bore x Stroke 137.2 mm x 165.1 mm
Compression Ratio 15.6 : 1
Displacement 2.44 liters
Combustion Cham-ber
Quiescent
Piston Articulated Steel/Aluminum Mexican Hat Sharp Edge Crater
EmissionsAnalyzers
EGR
EGR Cooler
Baffle Mixing Orifice
T.C.
T.C.
T.C.
T.C. Thermocouple
Gate Valve
Metering Orifice
T.C.
PrimaryDilution Air
T.C.
Heater
Exhaust
Exhaust
CaterpillarSingle Cylinder
Engine
SecondaryDilution Air
VacuumPump
BellowsMeter
Filters
Exhaust
Intake
Compressed Air

3
The fuel used during the present testing was obtainedfrom a commercial fuel vendor, so it represents a validsample of what is currently available to the truckingindustry. A sample of the fuel was analyzed and theresults are given in Table 4.
Emissions data recorded during experiments includetotal hydrocarbons (THC), CO, CO2, NOx, and particu-late . SOF was measured from the particulate usingSoxhlet extraction. Emissions data was obtained usingthe instrumentation summarized in Table 5. Emission lev-els were calculated according to US EPA CFR 40 specifi-cations [6].
For measurements of particulate matter, a full dilutiontunnel designed according to EPA 40CFR [6] recommen-dations is used. The purpose of the dilution tunnel is tosimulate particulate growth due to hydrocarbon adsorp-tion that is seen in the atmosphere as exhaust is expelledinto air. The dilution tunnel is a mixing device that isdesigned to ensure that the exhaust is thoroughly mixedwith dilution air. The dilution air is compressed air fromthe laboratory supply that is blown into the dilution tunnelthrough diffusers, which enhance mixing. A portion ofdiluted sample is drawn from the tunnel for analysis. Thesample portion can be further diluted in the secondarydilution tunnel before being drawn, in series, through twoPallflex T60A20 filters. The filters are weighed before andafter particulate deposition so that a total particulatemeasurement can be made.
COMPUTATIONAL SETUP
THE MODEL – The basic features of the KIVA-II CFDcode used in this study are well documented [7,8] andwill not be repeated here for brevity. However, the originalKIVA code has been extensively modified at the Univer-sity of Wisconsin-Madison's Engine Research Centerand a number of new and improved sub-models havebeen incorporated to improve its ability to predict dieselengine combustion with improved accuracy. These mod-els include a modified RNG (Re-Normalization Group) k-e turbulence model [9], a Kelvin-Helmholtz Raleigh- Tay-lor (KHRT) droplet breakup model [10], a wall-impinge-ment model [11], and a dynamically varying drop-dragcoefficient model to account for drop distortions from thespherical shape [12]. The ignition model is based on theShell auto ignition model [13-15]. The earlier specifica-tion of a minimum cell temperature of 1000 K or productconcentration of 0.1 was found to work well with no or lowconcentration of exhaust gas recirculation (EGR). Withhigh EGR cases, however, the model was unable to pre-dict the ignition delay correctly. Furthermore, if a high celltemperature is used as a switch from cool flame to maincombustion, a detrimental effect was observed forretarded injection cases. This problem was rectified usinga modified version, which incorporates the concentrationof intermediate species, "q" as one of the criteria forswitching from cool flame ignition to main combustionbased on the suggestion of Schäpertöns and Lee [16].
The combustion model is based on the characteristic-time model originally developed for spark ignition engines[17]. Finally, the emission models used are the ExtendedZeldovich mechanism to predict NO formation [18] andthe Hiroyasu model [19] for the soot formation. The sootoxidation models used in the present study are primarily
Table 2. EUI System Specifications
Injector Type Electronically ControlledUnit Injector (EUI)
Injection Pressure Up to 190 MPa
Number of Nozzle Holes
6
Nozzle Hole Diameter 0.214 mm
Spray Angle (included) 130°
Table 3. Common Rail System Specifications
Injector Type Electronically ControlledCommon Rail Injector(see reference [5])
Injection Pressure 90 MPa
Number of Nozzle Holes
6
Nozzle Hole Diameter 260 µm
Spray Angle (included) 125°
Table 4. Fuel Analysis Results
Carbon 87.10%
Hydrogen 12.68%
C/H Ratio 6.869
Heat of CombustionGrossNet
45.19 MJ/kg42.49 MJ/kg
Sulfur 0.048%
Cetane Rating 44.3
API Gravity @ 60° F 32.7
Viscosity @ 40° C 2.43 cSt
Flash Point, PMCC 67.2° C
Table 5. Emissions Instrumentation
NOx Chemiluminescent Analyzer / ThermoEnvironmental Instruments Inc., Model 10S
Particulate Full Dilution Tunnel (EPA 40CFR Design)
THC Flame Ionization Detector / Gow-Mac Model 23-500
CO Infrared Gas Analyzer / CaliforniaAnalytical Instruments Model 3300A
CO2 Infrared Gas Analyzer / Horiba,Model VIA-510

4
based on the kinetically controlled Nagle and Strickland-Constable (NSC) oxidation model [20]. However, theArrhenius rate equation's pre-exponential factor was opti-mized to match experimental soot results.
INITIAL AND BOUNDARY CONDITIONS – The predic-tion of diesel engine combustion using a CFD codestrongly depends on the accurate specification of initialand boundary conditions in the combustion chamber. Forcomputational efficiency, simulation starts from intakevalve closing (IVC). A methodology developed at ERC forestimating species density and temperature at IVC asinputs for the combustion predictions was used in thepresent study [21]. In this prediction routine, it isassumed that complete combustion occurs at each cycle.The experimental data used are fuel flow rate, intake airflow rate, engine speed, volume at IVC, intake tempera-ture, exhaust temperature, and the EGR percentagecomputed from the zero-dimensional residual gas frac-tion code. The initial gas temperature at IVC, Tivc, isdetermined by the following formula:
Where ma,f, and ma are the mass of fresh air charge, andthe total mass of intake charge respectively. Tr is the tem-perature of the residual gas (assumed to be the sametemperature as the measured exhaust temperature), and
Tint is the intake surge tank temperature. Since this sim-plified code does not take into account heat transfereffects, some freedom was reserved to adjust the initialtemperature and initial species densities within a reason-able range (< 5%) so that the computed initial pressure atIVC matched the experimental pressure.
At the solid wall surfaces, constant wall temperature withlogarithmic law-of-the-wall velocity boundary conditionswere used. Turbulence model parameters are the sameas those reported by Han and Reitz [9].
In the computational study, the symmetry of the six noz-zle holes symmetrically placed around the axis of the cyl-inder was exploited to minimize the computational timeby considering only one-sixth of the engine combustionchamber in the computations. A perspective view of thecomputational grid with an arbitrary spray plume is shownon Fig. 2.
Figure 2. Computational Mesh
Figure 3. Loads and Speeds for the Six-Mode FTP Simulation
Tivc =mr* Tr + m
a, f+ma* EGR
100
* Tint
ma, f
+ma* EGR100
+mr
0
10
20
30
40
50
60
70
80
90
100
600 800 1000 1200 1400 1600 1800
Engine Speed (rev/min)
Load
- %
Mode 1
Mode 2
Mode 3
Mode 4
Mode 5
Mode 6

5
TEST CONDITIONS
ENGINE TEST CONDITIONS – Testing was done at sixoperating conditions that constitute a six-mode FTP sim-ulation. The running conditions are shown on a load ver-sus speed map on Fig. 3. The controlled parameters forthe running conditions are presented in Table 6.
The test conditions held constant for all testing at a givenmode were engine speed, intake temperature, intakepressure, and fuel flow rate.The running conditions,except for the fuel flow rate at mode 1, were taken fromthe operating map of a six cylinder production version ofthe Caterpillar 3400 series engine (373 kW (500 hp)3406E). The fuel flow rate at mode 1 was established byvarying injection duration, and thus the fuel flow rate, togive a power output near but slightly above zero. Theassumption made was that the additional frictional meaneffective pressure imparted due to the use of a single-cyl-inder test engine would be equivalent to the accessoryload on an “as installed” six cylinder engine.
A constant pressure drop across the engine was selectedas the exhaust pressure determinant during the boostpressure experiments because it was thought that thiswould yield a nearly constant residual, so that intakeboost pressure effects would not be confounded with“internal EGR” effects from the increased residual. Thisassumption was verified using a “1-D” unsteady flowmodel [22]. The model was run for four engine cycles toensure that a steady-state condition had been achieved.When operating at mode 5, the residual gas fraction inthe fourth cycle’s intake charge changes from 4.0% to4.7% of the total intake charge when going from the basecondition (+0% boost) to the +55% boost condition. If, forthe +55% boost condition, the additional work requiredfor an enthalpy balance (modeling a real turbocharger)were coming from piston compression work, the exhaustpressure and temperature would have increased to369kPa and 673K respectively, (compared to 282kPa and627K for the constant delta P used in the experiment).Under this elevated backpressure condition, the 1-Dmodel predicts that the residual gas fraction would climbto 6.3%.
The explanation for the six-cylinder correction seen in theresults of the boost pressure experiments is as follows.With the assumption of a constant pressure drop
between intake pressure and exhaust pressure that wasused to set the exhaust pressure in the boost study, thereis an enthalpy imbalance. The available energy in theexhaust at the exhaust pressures and temperatures usedin the experiments was not great enough to accomplishthe compression of the intake charge to the level used inthe experiments if reasonable turbocharger efficiencieswere assumed. Thus, a turbocharger model was devel-oped to estimate the additional power required to com-press the intake charge to the levels used in theexperiments. The corrected six-cylinder data presentedwas attained by using a corrected engine power that isthe difference between the measured power of theengine and the additional required power estimated usingthe turbocharger model. In the turbocharger model, thechanges in enthalpy for an isentropic compression of theintake gases and an isentropic expansion of the exhaustgases are calculated. When these differences in enthalp-ies are calculated for the known six cylinder operatingcondition, an overall turbocharger (and manifolding) effi-ciency can be calculated as the ratio of the differences ofcompression and expansion enthalpies. The efficiencycan then be used to calculate the additional power(above that which is available from the exhaust) whichwould be required to compress the intake charge. In theresults presented on Figs. 18, 19, 21, 22, 27, 28, 30, 31,33, 34, 36, and 37, both the actual experimental data andthe “enthalpy balance corrected” data are presented (thecorrected data is labeled “with 6-cyl. correction”). Table 7shows the efficiencies used at each mode for the correc-tions (efficiencies were calculated from baseline runs onthe single-cylinder engine using intake and exhaust pres-sures from six-cylinder engine data).
Table 6. Test Conditions (nominal)
Running Condition Mode 1 Mode 2 Mode 3 Mode 4 Mode 5 Mode 6
Speed (rev/min) 700 821 993 1672 1737 1789
% Load 0 25 75 95 57 20
Fuel Rate (kg/hr) 0.32 1.50 6.28 11.50 6.97 3.80
Intake Temp (C) 29 28 28 40 32 27
Intake Press (kPa), {psia} 100 {14.5} 103 {14.9} 161 {23.4} 267 {38.8} 184 {26.7} 121 {17.5}
Exhaust Press (kPa), {psia} 100 {14.5} 106 {15.4} 136 {19.8} 247 {35.9} 181 {26.2} 135 {19.6}
Table 7. Efficiencies Used for Six-Cylinder Corrections
Running Condition Overall Turbocharger/Manifolding Efficiency
Common Rail, Mode 4 47.25%
Common Rail, Mode 5 47.83%
EUI, Mode 3 52.71%
EUI, Mode 4 49.58%
EUI, Mode 5 45.55%

6
COMPUTATIONAL SIMULATION – In the computationalwork, results are given on a fuel specific basis rather thanon a brake specific basis, so the enthalpy imbalancedoes not affect the computational results. Two differentload conditions (Modes 4 and 5) with varying boost pres-sures were studied in the present work. The intake boostpressures were varied, while keeping SOI at the valueused in the corresponding engine experiment.
NOMENCLATURE
Start of injection (SOI) timing data will be given in crank-shaft degrees after top dead center (ATDC), thus -6ATDC means 6 degrees before top dead center. Emis-sions data are given in either on an emission rate basis(g/hr), a brake power specific (brake specific) basis (g/kW-hr or g/bhp-hr), or on a fuel specific basis (g/kg-fuel).“Soot” should be taken to mean the insoluble portion ofparticulate emissions.
RESULTS OF BASELINE ENGINE EXPERIMENTS
One objective of the present study was to explore theemissions and performance characteristics of a currentstate-of-the-art heavy-duty diesel engine using the stan-dard production EUI injection system. As mentioned pre-viously, a multi-mode FTP simulation was used. Theresults for each mode will be discussed and then theresults of the cycle estimate will be reviewed.
MODE 1 – Mode 1 is a simulation of idle. The peak injec-tion pressure at mode 1 is 40 MPa. Idle is an importantrunning condition for heavy-duty engines because thistype of engine often sees extended idling periods while inoperation.
Figure 4 shows the NOx versus particulate trade-offcurve for mode 1. This trade-off was produced by varyingthe SOI from -9.5 degrees ATDC to -0.5 degrees ATDC.The units used on Fig. 4 are g/hr rather than the brakespecific g/bhp-hr units, as will be used in the discussionof the other modes. Emission rate units are used at mode1 because the power is quite low and emissions levelsgiven with brake specific units are hard to interpretbecause they are so large, owing to the fact that they area quotient with a very small denominator (power).
On Fig. 4, notice that when operating at the mostadvanced timing (-9.5 ATDC), there is sharp increase inparticulate mass. This is evidence of over-penetration ofthe fuel spray. At earlier injection timings, the in-cylindertemperature and air density are relatively low. Therefor,much of the injected fuel collects on the walls and the pis-ton and doesn’t burn completely. As a result, the particu-late exhibits a high percentage of soluble fraction (~90%)at the idling conditions represented by mode 1.
Figure 4. NOx versus Particulate Trade-off Curve for Mode 1
Figure 5. Cylinder Pressure, Rate-of-injection, and Apparent Heat Release Rate for Mode 1, -6.5 ATDC SOI
Figure 5 is a plot showing cylinder pressure, rate-of-injec-tion, and apparent heat release rate (AHRR) for mode 1when using an SOI of -6.5 ATDC. The -6.5 ATDC is theSOI that results in the lowest combined estimate of emis-sions and fuel consumption when used in the calculationof the six-mode-cycle estimate.
On Fig. 5, notice that all of the fuel is injected during theignition delay. Injecting fuel during the ignition delaycauses a large premixed burn fraction, which is oftenassociated with high NOx emissions. At mode 1, where avery small amount of fuel is injected, much fuel is pre-mixed before start of ignition. The heat release curve onFig. 5 shows no appreciable diffusion burn which con-firms that fuel burns at a high kinetically controlled rate(premixed burn), rather than at a slower diffusion con-trolled rate (diffusion burn).
11 12 13 14 15 16 17 18 19 200.2
0.3
0.4
0.5
0.6
0.7
0.8
-9.5 ATDC
-6.5 ATDC-3.5 ATDC
-0.5 ATDC
Par
ticul
ate
(g/h
r)
NOx (g/hr)
-40 -30 -20 -10 0 10 20 30 40 500
10
20
30
40
50
60
Pre
ssu
re (
bar)
and
Rat
e of
Inje
ctio
n (m
g/C
A)
Crank Shaft Angle (degrees ATDC)
-0.1
0.0
0.1
0.2
0.3
0.4
0.5
AH
RR
(n
orm
aliz
ed)

7
Also, the study by Montgomery et al. [23] showed thatinjection pressure has a significant influence on total par-ticulate emissions at engine idling. During those injectionpressure variation experiments it was found that 30 MPainjection produced the lowest particulate. In the presentstudy, the peak injection pressure for the mode 1 is 40MPa. Which appears to be appropriate, except at moreadvanced timings.
MODE 2 – Mode 2 is a low speed (821 rev/min), low load(25%) operating condition. Peak injection pressure formode 2 was 75 MPa.
Figure 6 shows the NOx versus particulate trade-off formode 2. This trade-off was produced by varying the SOIfrom -6.0 degrees ATDC to 2.0 degrees ATDC. On Fig. 6,at the most retarded timing there is a sharp drop in par-ticulate. The unexpected sharp drop occurs becauseunder these conditions, injection occurs when the pistonis past TDC. Consequently, much heat transfer from thecompressed air has already occurred, and the pressureand temperature are dropping rapidly due to expansion.The lower in-cylinder temperature causes a longer igni-tion delay, and consequently a large premix burn. Thelarge premixed burn, in turn, causes high temperatureslate in the cycle. The late cycle high temperatureimproves soot oxidation but also increases NOx levels.Even though retarded timings give interesting emissionsresults, BSFC is high, making this type of operation unac-ceptable.
Figure 7 shows pressure, apparent heat release rate, andinstantaneous rate-of-injection for the –0.5 ATDC SOIpoint seen on Fig. 6. Similar to the -6.5 ATDC at mode 1,the –0.5 ATDC SOI point seen on Fig. 6 is the mode 2emissions level that results in the lowest emissions whenused in the calculation of the six-mode-cycle estimate.Figure 7 shows that at mode 2, similar to mode 1, almostall of the fuel is injected during the injection delay. Thus,high NOx emissions are expected at this mode due to thelarge premixed burn fraction.
Figure 6. NOx versus Particulate for Mode 2
Figure 7. Cylinder Pressure, Rate-of-injection, and Apparent Heat Release Rate for Mode 2, –0.5 ATDC SOI
Figure 8. NOx versus Particulate Trade-off Curve for Mode 3
Figure 9. Cylinder Pressure, Rate-of-injection, and Apparent Heat Release Rate for Mode 3, -4.5 ATDC SOI
5.5 6.0 6.5 7.0 7.5 8.0 8.5 9.00.03
0.04
0.05
0.06
0.07
0.08
Par
ticul
ate
(g/
kW-h
r)
NOx (g/kW-hr)
2.0 ATDC
-0.5 ATDC
-3.5 ATDC
-6.0 ATDC
Par
ticul
ate
(g/b
hp-h
r)
NOx (g/bhp-hr)
7.38 8.05 8.72 9.39 10.06 10.73 11.40 12.07
0.040
0.054
0.067
0.080
0.094
0.107
-30 -20 -10 0 10 20 30 40 500
10
20
30
40
50
60
AH
RR
(n
orm
aliz
ed
)
Pre
ssu
re (
ba
r) a
nd R
ate
of
Inje
ctio
n (
mg
/CA
)
Crank Shaft Angle (degrees ATDC)
-0.05
0.00
0.05
0.10
0.15
0.20
0.25
0.30
4.00 4.25 4.50 4.75 5.00 5.25 5.50 5.75 6.000.10
0.12
0.14
0.16
0.18
0.20
0.22
Par
ticul
ate
(g/k
W-h
r)
NOx (g/kW-hr)
4.5 ATDC
1.5 ATDC
-1.5 ATDC
-4.5 ATDC -7.0 ATDC
Par
ticul
ate
(g/b
hp-h
r)
NOx (g/bhp-hr)
5.36 5.70 6.04 6.37 6.71 7.04 7.38 7.71 8.05
0.13
0.16
0.19
0.21
0.24
0.27
0.30
-30 -20 -10 0 10 20 30 40 500
10
20
30
40
50
60
70
80
90
100
AH
RR
(no
rma
lize
d)
Pre
ssu
re (
bar)
and
Ra
te o
f Inj
ectio
n (m
g/C
A)
Crank Shaft Angle (degrees ATDC)
0.00
0.01
0.02
0.03
0.04
0.05
8
MODE 3 – Mode 3 is an operating condition at 75% loadwith an engine speed of 993 rev/min. Peak injection pres-sure at mode 3 was 95 MPa. Mode 3 is a simulation ofengine operation near the torque peak.
Figure 8 shows the NOx versus particulate trade-offcurve for mode 3. Again, notice that the trade-off is nor-mal except for the “hook” at late timing that was also seenfor mode 2 and discussed in that section.
Figure 9 shows pressure, apparent heat release rate, andinstantaneous rate-of-injection for the –4.5 ATDC SOIpoint seen on Fig. 8 (the point used in the six-mode cycleevaluation). This is the first mode where fuel is sprayedfor a period of time longer than the ignition delay. In fact,the injection at this high load mode lasts well into the dif-fusion burn. Thus, the heat release displays the threenormal characteristics of diesel combustion; ignitiondelay, premixed burn, and diffusion burn.
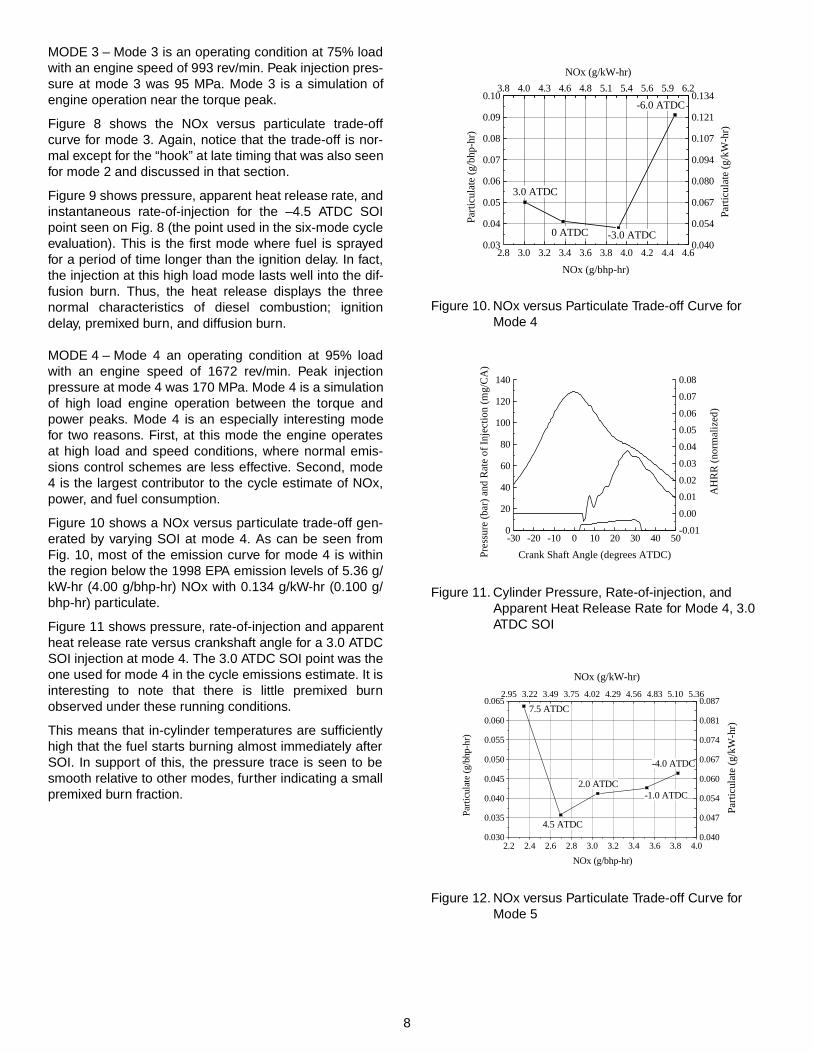
MODE 4 – Mode 4 an operating condition at 95% loadwith an engine speed of 1672 rev/min. Peak injectionpressure at mode 4 was 170 MPa. Mode 4 is a simulationof high load engine operation between the torque andpower peaks. Mode 4 is an especially interesting modefor two reasons. First, at this mode the engine operatesat high load and speed conditions, where normal emis-sions control schemes are less effective. Second, mode4 is the largest contributor to the cycle estimate of NOx,power, and fuel consumption.
Figure 10 shows a NOx versus particulate trade-off gen-erated by varying SOI at mode 4. As can be seen fromFig. 10, most of the emission curve for mode 4 is withinthe region below the 1998 EPA emission levels of 5.36 g/kW-hr (4.00 g/bhp-hr) NOx with 0.134 g/kW-hr (0.100 g/bhp-hr) particulate.
Figure 11 shows pressure, rate-of-injection and apparentheat release rate versus crankshaft angle for a 3.0 ATDCSOI injection at mode 4. The 3.0 ATDC SOI point was theone used for mode 4 in the cycle emissions estimate. It isinteresting to note that there is little premixed burnobserved under these running conditions.
This means that in-cylinder temperatures are sufficientlyhigh that the fuel starts burning almost immediately afterSOI. In support of this, the pressure trace is seen to besmooth relative to other modes, further indicating a smallpremixed burn fraction.
Figure 10. NOx versus Particulate Trade-off Curve for Mode 4
Figure 11. Cylinder Pressure, Rate-of-injection, and Apparent Heat Release Rate for Mode 4, 3.0 ATDC SOI
Figure 12. NOx versus Particulate Trade-off Curve for Mode 5
2.8 3.0 3.2 3.4 3.6 3.8 4.0 4.2 4.4 4.60.03
0.04
0.05
0.06
0.07
0.08
0.09
0.10
3.0 ATDC
0 ATDC -3.0 ATDC
-6.0 ATDC
Pa
rtic
ula
te (
g/k
W-h
r)
NOx (g/kW-hr)
Pa
rtic
ula
te (
g/b
hp-h
r)
NOx (g/bhp-hr)
3.8 4.0 4.3 4.6 4.8 5.1 5.4 5.6 5.9 6.2
0.040
0.054
0.067
0.080
0.094
0.107
0.121
0.134
-30 -20 -10 0 10 20 30 40 500
20
40
60
80
100
120
140
AH
RR
(no
rmal
ized
)
Pre
ssur
e (
bar)
and
Rat
e o
f Inj
ectio
n (
mg/
CA
)
Crank Shaft Angle (degrees ATDC)
-0.01
0.00
0.01
0.02
0.03
0.04
0.05
0.06
0.07
0.08
2.2 2.4 2.6 2.8 3.0 3.2 3.4 3.6 3.8 4.00.030
0.035
0.040
0.045
0.050
0.055
0.060
0.065
Pa
rtic
ula
te (
g/k
W-h
r)
NOx (g/kW-hr)
7.5 ATDC
4.5 ATDC
2.0 ATDC-1.0 ATDC
-4.0 ATDC
Par
ticul
ate
(g/b
hp-h
r)
NOx (g/bhp-hr)
2.95 3.22 3.49 3.75 4.02 4.29 4.56 4.83 5.10 5.36
0.040
0.047
0.054
0.060
0.067
0.074
0.081
0.087

9
MODE 5 – Mode 5 is a running condition at 57% loadand an engine speed of 1737 rev/min. The peak injectionpressure for this mode was found to be 145 MPa.
Figure 12 shows the NOx versus particulate trade-offcurve for mode 5. Notice that the emissions levels atmode 5 comply easily with the 1998 emission standards.Figure 13 shows pressure, rate-of-injection and apparentheat release rate versus crankshaft angle for a 4.5 ATDCSOI injection at mode 5. The 4.5 ATDC SOI point was theone chosen to represent mode 5 in the cycle emissionsestimate. Similar to mode 3, the heat release for mode 5shown on Fig. 13 indicates distinct periods of ignitiondelay, premixed burn, and diffusion burn.
MODE 6 – Mode 6 is a light load mode (20%) at highengine speed (1789 rev/min). The peak injection pres-sure for mode 6 was 93 MPa.
As discussed earlier, the magnitude of the unburned HC(soluble fraction) for the light-load modes depends largelyupon the amount of fuel injected during the ignition delay.It also depends on the mixing rate with the air during thisperiod, which is influenced by the swirl flow in the cylin-der.
Figure 13. Cylinder Pressure, Rate-of-injection, and Apparent Heat Release Rate for Mode 5, 4.5 ATDC SOI
Figure 14. NOx versus Particulate Trade-Off Curve for Mode 6
Figure 15. Cylinder Pressure, Rate-of-Injection, and Apparent Heat Release Rate for Mode 6, -3.5 ATDC SOI
Similar to modes 2 and 3, at the most retarded injectiontiming (2 ATDC on the NOx versus particulate trade-offshown on Fig. 14) there is a decrease in particulate dueto the longer ignition delay and the subsequent large pre-mixed charge which causes high in-cylinder tempera-tures. This results in lower particulate and higher NOxthan one might expect.
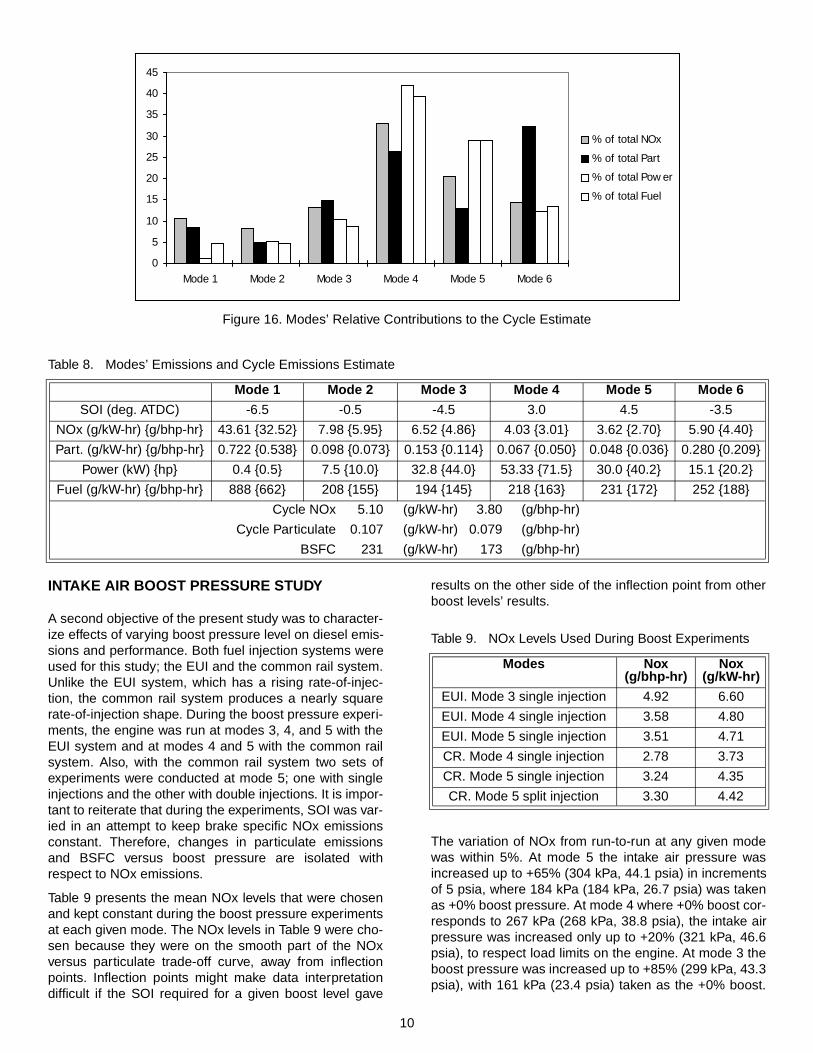
SIX MODE CYCLE EMISSIONS ESTIMATE – In order tojudge the effect of each mode on the overall cycle emis-sions, the emission rates and power from each mode ismultiplied by a weighting factor that reflects the amount oftime that the FTP test spends near the respective mode’sload and speed condition. For instance, the emissions atmode 1 (idle) are quite low, however mode 1 is weightedheavily in the FTP and is correspondingly weightedheavily in the six-mode simulation. In calculating thecycle estimate, each mode is represented by a point(SOI) with the most advantageous emission levels forthat mode. For example, at mode 4, a -3.5 ATDC SOIyielded the lowest cycle estimate of emissions of all injec-tion timings used at this mode.
Table 8 summarizes the results of the six-mode analysis.As can be seen, the engine complies with 1998 emissionlevels and is thus a useful research tool for combustionand emissions research. The cycle NOx was 5.10 g/kW-hr (3.80 g/bhp-hr), particulate was 0.107 g/kW-hr (0.079g/bhp-hr), and the BSFC was 321 g/kW-hr (173 g/bhp-hr). Note that these values are not corrected for the sin-gle-cylinder engine’s frictional losses, which are higherthan the six-cylinder version.
The bars on Fig. 16 represent each mode’s weightedcontribution to the six-mode cycle’s estimate of emis-sions, fuel consumption, and power. Clearly, the modeswhere the emissions contributions are high and thepower contribution is low are modes that have high brakespecific emissions.
-30 -20 -10 0 10 20 30 40 500
10
20
30
40
50
60
70
80
90
100
Pre
ssu
re (
bar)
an
d R
ate
of I
nje
ctio
n (
mg
/CA
)
Crank Shaft Angle (degrees ATDC)
0.00
0.01
0.02
0.03
0.04
0.05
0.06
0.07
0.08
0.09
AH
RR
(no
rmal
ize
d)
3.5 4.0 4.5 5.0 5.5 6.0 6.50.12
0.14
0.16
0.18
0.20
0.22
0.24
0.26
Par
ticul
ate
(g/k
W-h
r)
NOx (g/kW-hr)
2.0 ATDC
-0.5 ATDC
-3.5 ATDC
-6.5 ATDC
-9.0 ATDCPar
ticul
ate
(g/b
hp-h
r)
NOx (g/bhp-hr)
4.69 5.36 6.03 6.71 7.38 8.05 8.72
0.161
0.188
0.215
0.241
0.268
0.295
0.322
0.349
-30 -20 -10 0 10 20 30 40 500
10
20
30
40
50
60
70
Pre
ssur
e (
bar
) an
d R
ate
of I
nje
ctio
n (m
g/C
A)
Crank Shaft Angle (degrees)
-0.02
0.00
0.02
0.04
0.06
0.08
0.10
0.12
0.14
AH
RR
(no
rmal
ize
d)
10
Figure 16. Modes’ Relative Contributions to the Cycle Estimate
INTAKE AIR BOOST PRESSURE STUDY
A second objective of the present study was to character-ize effects of varying boost pressure level on diesel emis-sions and performance. Both fuel injection systems wereused for this study; the EUI and the common rail system.Unlike the EUI system, which has a rising rate-of-injec-tion, the common rail system produces a nearly squarerate-of-injection shape. During the boost pressure experi-ments, the engine was run at modes 3, 4, and 5 with theEUI system and at modes 4 and 5 with the common railsystem. Also, with the common rail system two sets ofexperiments were conducted at mode 5; one with singleinjections and the other with double injections. It is impor-tant to reiterate that during the experiments, SOI was var-ied in an attempt to keep brake specific NOx emissionsconstant. Therefore, changes in particulate emissionsand BSFC versus boost pressure are isolated withrespect to NOx emissions.
Table 9 presents the mean NOx levels that were chosenand kept constant during the boost pressure experimentsat each given mode. The NOx levels in Table 9 were cho-sen because they were on the smooth part of the NOxversus particulate trade-off curve, away from inflectionpoints. Inflection points might make data interpretationdifficult if the SOI required for a given boost level gave
results on the other side of the inflection point from otherboost levels’ results.
The variation of NOx from run-to-run at any given modewas within 5%. At mode 5 the intake air pressure wasincreased up to +65% (304 kPa, 44.1 psia) in incrementsof 5 psia, where 184 kPa (184 kPa, 26.7 psia) was takenas +0% boost pressure. At mode 4 where +0% boost cor-responds to 267 kPa (268 kPa, 38.8 psia), the intake airpressure was increased only up to +20% (321 kPa, 46.6psia), to respect load limits on the engine. At mode 3 theboost pressure was increased up to +85% (299 kPa, 43.3psia), with 161 kPa (23.4 psia) taken as the +0% boost.
Table 8. Modes’ Emissions and Cycle Emissions Estimate
Mode 1 Mode 2 Mode 3 Mode 4 Mode 5 Mode 6
SOI (deg. ATDC) -6.5 -0.5 -4.5 3.0 4.5 -3.5
NOx (g/kW-hr) {g/bhp-hr} 43.61 {32.52} 7.98 {5.95} 6.52 {4.86} 4.03 {3.01} 3.62 {2.70} 5.90 {4.40}
Part. (g/kW-hr) {g/bhp-hr} 0.722 {0.538} 0.098 {0.073} 0.153 {0.114} 0.067 {0.050} 0.048 {0.036} 0.280 {0.209}
Power (kW) {hp} 0.4 {0.5} 7.5 {10.0} 32.8 {44.0} 53.33 {71.5} 30.0 {40.2} 15.1 {20.2}
Fuel (g/kW-hr) {g/bhp-hr} 888 {662} 208 {155} 194 {145} 218 {163} 231 {172} 252 {188}
Cycle NOx 5.10 (g/kW-hr) 3.80 (g/bhp-hr)
Cycle Particulate 0.107 (g/kW-hr) 0.079 (g/bhp-hr)
BSFC 231 (g/kW-hr) 173 (g/bhp-hr)
�������������������
��������������������������������
������������������������������������������������������������������������������
���������������������������������������������������������������������������������
����������������������������
����������������
������������
���������������������������
������������������������������������������������������������������������������������
���������������������������������������������
�����������������������������������
0
5
10
15
20
25
30
35
40
45
Mode 1 Mode 2 Mode 3 Mode 4 Mode 5 Mode 6
% of total NOx
% of total Part�������������� % of total Pow er�������������� % of total Fuel
Table 9. NOx Levels Used During Boost Experiments
Modes Nox(g/bhp-hr)
Nox(g/kW-hr)
EUI. Mode 3 single injection 4.92 6.60
EUI. Mode 4 single injection 3.58 4.80
EUI. Mode 5 single injection 3.51 4.71
CR. Mode 4 single injection 2.78 3.73
CR. Mode 5 single injection 3.24 4.35
CR. Mode 5 split injection 3.30 4.42

11
In order to correct the engine power for the increasedintake pressure, the exhaust pressure was alsoincreased so that difference between the intake andexhaust pressures was kept constant during all experi-ments, as described earlier.
The results and discussion of the boost pressure experi-ments with the EUI system will be presented first followedby a discussion the common rail system performance.
Figure 17a. EUI, Mode 3, Equivalence Ratio and Injection Timing versus Boost
Figure 17b. EUI, Mode 3, Air/Fuel Mass Ratio and Injection Timing versus Boost
BOOST PRESSURE EFFECTS WITH EUI – Mode 3 –At mode 3 experiments were conducted with intake airpressures from 161.3kPa (23.4 psia) for baseline (+0%boost), to 298.5kPa (43.3 psia) for +85% boost. Mode 3results are shown on Figs. 17 to 19. Figure 17 shows theequivalence ratio (Fig. 17a) or air/fuel ratio (Fig. 17b) and
the SOI needed to keep brake specific NOx constant dur-ing the experiments. Notice on Fig 17a that equivalenceratio decreases inversely and air/fuel ratio increases lin-early with increasing boost pressure, just as one wouldexpect for an increase in air flow with a constant fuel flowrate. The SOI points on Fig. 17 first proceed toward moreretarded timings, then toward more advanced timingswith increasing intake air pressure. This indicates thatsmall increases in intake air pressure cause higher in-cyl-inder temperatures, requiring more retarded injection tim-ings to hold a constant NOx level. However, as the intakeair pressure is increased further, in-cylinder temperaturesare decreased, allowing more advanced injection timings.
Figure 18 shows the results of BSFC versus the intake airpressure for mode 3. The data on Fig. 18 includes boththe constant delta P data from the experiments and datathat has been corrected for the increased power requiredto compress the intake charge of a six-cylinder engineoperating at elevated boost levels. Both sets of data showthat the fuel consumption at mode 3 decreases drasti-cally with increasing boost pressure until the boost pres-sure reaches +55% (250.1 kPa, 36.3 psi) at which point,increases in boost pressure were less beneficial.
Figure 18. EUI, Mode 3, BSFC versus Boost for constant NOx of 4.92 g/bhp-hr (6.60 g/kW-hr)
Figure 19 shows the effect of intake boost pressure onparticulate emissions. Although the particulate emissionswere still decreasing with increasing intake pressure, atremendous reduction, more than 70%, was observed asthe boost pressure was increased up to +45%,(233.9kPa, 33.9psia). Also, notice that at mode 3 the six-cylinder correction had little effect on the brake specificparticulate emissions.
20.0 25.0 30.0 35.0 40.0 45.0
0.40
0.50
0.60
0.70
0.80
Equiv.Rto.
65%
10%
85%
55%
45%35%
20%
0%
Equ
iva
lenc
e R
atio
Intake Air Pressure (psia)
137.9 172.4 206.8 241.3 275.8 310.3
Intake Air Pressure (kPa)
2.0
0.0
-2.0
-4.0
-6.0
-8.0 SOI
SO
I (de
gree
s A
TD
C)
20.0 25.0 30.0 35.0 40.0 45.040
35
30
25
20
15
A/F Ratio
65%
10%
85%
55%
45%35%
20%
0%
Air/
Fue
l Mas
s R
atio
Intake Air Pressure (psia)
137.9 172.4 206.8 241.3 275.8 310.3
Intake Air Pressure (kPa)
2.0
0.0
-2.0
-4.0
-6.0
-8.0 SOI
SO
I (de
gree
s A
TD
C)
20.0 25.0 30.0 35.0 40.0 45.0120
125
130
135
140
145
150 single cylinder data with 6-cyl. correction
BS
FC
(g/
bhp
-hr)
Intake Air Pressure (psia)
137.9 172.4 206.8 241.3 275.8 310.3
Intake Air Pressure (kPa)
160.9
167.6
174.3
181.0
187.7
194.4
201.2
85%65%
55%
45%35%
20%
10%0%
BS
FC
(g/
kW-h
r)

12
Figure 19. EUI, Mode 3, Particulate versus Boost for constant NOx of 4.92 g/bhp-hr (6.60 g/kW-hr)
Figure 20a. EUI, Mode 4, Equivalence Ratio and Injection Timing versus Boost
Figure 20b. EUI, Mode 4, Air/Fuel Mass Ratio and Injection Timing versus Boost
Mode 4 – As previously mentioned, Mode 4 is a high load(61kW) operating condition. At the baseline +0% boostpressure level, the engine’s power output just reachedthe maximum absorption capability of the dynamometer,so experiments at this mode were limited to decreases inboost pressure. The intake air pressure was decreasedfrom 267.5kPa (38.8psia) at +0%, to 213.7kPa (31.0psia)at –20%. The SOI timings required to maintain constantbrake specific NOx are shown on Fig. 20. Also shown onFig. 20 is the equivalence ratio (Fig. 20a) and air/fuelratio (Fig. 20b). Notice on Fig. 20 that unlike mode 3, atmode 4, injection timing must be steadily advanced withincreasing boost pressure in order to maintain a constantbrake specific NOx level.
Figure 21. EUI. Mode 4. BSFC versus Boost for constant NOx of 3.58 g/bhp-hr (4.80 g/kW-hr)
Figure 22. EUI, Mode 4, Particulate versus Boost for constant NOx of 3.58 g/bhp-hr (4.80 g/kW-hr)
Figure 22 shows the relationship between the particulateand the boost pressure. The particulate emission risesrapidly (see Fig. 22) as the boost is decreased, providinga minimum of 0.052 g/kW-hr (0.039 g/bhp-hr) in particu-late at –5% (254.4 kPa, 36.9 psia) boost pressure. Sinceexperiments were not conducted at higher boost pres-
20.0 25.0 30.0 35.0 40.0 45.00.01
0.02
0.03
0.04
0.05
0.06
0.07
0.08
0.09
0.10
0.11 single cylinder data with 6-cyl. correction
85%65%45%
35%
20%
10%
0%
Par
ticul
ate
(g/k
W-h
r)
Par
ticul
ate
(g/b
hp-h
r)
Intake Air Pressure (psia)
137.9 172.4 206.8 241.3 275.8 310.3
Intake Air Pressure (kPa)
0.013
0.027
0.040
0.054
0.067
0.080
0.094
0.107
0.121
0.134
0.148
30.0 32.0 34.0 36.0 38.0 40.00.48
0.50
0.52
0.54
0.56
0.58
0.60
0.62
Equiv.Rto.
-20%
-15%
-10%
-5%
0%
Intake Air Pressure (kPa)
Equ
ival
ence
Rat
io
Intake Air Pressure (psia)
206.8 220.6 234.4 248.2 262.0 275.8
-2.0
-2.5
-3.0
-3.5
-4.0
-4.5
-5.0
-5.5
-6.0
-6.5
SOI
SO
I (de
gree
s A
TD
C)
30.0 32.0 34.0 36.0 38.0 40.030
29
28
27
26
25
24
23
A/F Ratio
-20%
-15%
-10%
-5%
0%
Intake Air Pressure (kPa)
Air/
Fue
l Ma
ss R
atio
Intake Air Pressure (psia)
206.8 220.6 234.4 248.2 262.0 275.8
-2.0
-2.5
-3.0
-3.5
-4.0
-4.5
-5.0
-5.5
-6.0
-6.5
SOI
SO
I (de
gree
s A
TD
C)
30.0 32.0 34.0 36.0 38.0 40.0140
142
144
146
148
150
152
154
156 single cylinder data with 6-cyl. correction
BS
FC
(g/
bhp-
hr)
Intake Air Pressure (psia)
206.8 220.6 234.4 248.2 262.0 275.8
0%-5%
-10%
-15%
-20%
Intake Air Pressure (kPa)
187.7
190.4
193.1
195.8
198.5
201.1
203.8
206.5
209.2
BS
FC
(g/
kW-h
r)
30.0 32.0 34.0 36.0 38.0 40.00.04
0.04
0.05
0.05
0.06
0.06 single cylinder data with 6-cyl. correction
-20%
-15%
-10%
-5%
0%
Par
ticul
ate
(g/
kW-h
r)
Intake Air Pressure (kPa)
Par
ticul
ate
(g/b
hp-h
r)
Intake Air Pressure (psia)
206.8 220.6 234.4 248.2 262.0 275.8
0.047
0.054
0.060
0.067
0.074
0.081
0.087

13
sures, it is difficult to judge whether this was an absoluteminimum or not. However, the computational work, whichwas also conducted at this mode, gives an opportunity forfurther investigation as discussed below.
From the experimental results, it appears that the turbo-charger selected for this specific engine has operatingconditions, which match well with the engine at high loadconditions. The intake air pressure at +0% boost pro-vided by the turbocharger is close to the optimum pres-sure at mode 4.
Mode 5 – As discussed earlier, mode 5 represents a highspeed, intermediate load mode with a peak injectionpressure of 145 MPa. Figures 23, 24, and 25 present cyl-inder pressure, rate-of-injection, and apparent heatrelease at mode 5 at the boost pressures of +0% (184kPa, 26.7 psia), +35% (249 kPa, 36.1 psia), and +65%(304 kPa, 44.1 psia) respectively. In order to keep NOxconstant, the injection timing had to be advanced some-what as the boost pressure was increased (see Fig. 26).The requirement of earlier SOI is an interesting resultbecause one might easily expect the opposite. However,it can be explained by the diluting effect of the intake mix-ture with extra air, which provides leaner air/fuel ratiosand results in decreased in-cylinder temperatures andlower NOx levels. Also, as can be seen from the graphs,the premix burn decreases along with the ignition delayas the boost pressure increases. This also explains theinfluence of the boost on NOx formation since high NOxlevels are generally thought to accompany large pre-mixed burns. This behavior of NOx, premix burn, and theignition delay versus the boost pressure was true for allcases, so graphs of the pressure, rate-of-injection andapparent heat release for the other modes will not beplotted.
Figures 26 through 28 present equivalence ratio, air/fuelratio, BSFC, and particulate versus the boost pressure,respectively, at mode 5 with the EUI fuel injection system.As can been seen from Fig. 28, particulate decreases atfirst and then increases as the boost pressure isincreased up to +35%, 249 kPa (36.1 psia). This appearsto be due to a reduction in the spray penetration and mix-ing that ultimately outweighs the benefits of leaner mix-tures as the engine gas density is increased. The 35%increase in the intake air boost pressure results in almost40% reduction in the particulate which corresponds to0.058 g/kW-hr (0.043 g/bhp-hr). BSFC was reducedmonotonically with increasing boost pressure for allcases. At 35% increased boost, the minimum for particu-late, the BSFC was found be reduced by 7% for the cor-rected six-cylinder configuration.
Figure 23. Cylinder Pressure, Rate-of-Injection, and Apparent Heat Release Rate for Mode 5, +0% Boost, 0.5 ATDC SOI
Figure 24. Cylinder Pressure, Rate-of-Injection, and Apparent Heat Release Rate for Mode 5, +35% Boost, -1.5 ATDC SOI
Figure 25. Cylinder Pressure, Rate-of-Injection, and Apparent Heat Release Rate for Mode 5, +65% Boost, -4.0 ATDC SOI
-30 -20 -10 0 10 20 30 40 500
20
40
60
80
100
AH
RR
(n
orm
aliz
ed
)
Pre
ssu
re (
bar
) a
nd
Ra
te o
f in
ject
ion
(m
g/C
A)
Crank Shaft Angle (degrees ATDC)
-0.01
0.00
0.01
0.02
0.03
0.04
0.05
0.06
0.07
0.08
-30 -20 -10 0 10 20 30 40 500
20
40
60
80
100
120
AH
RR
(n
orm
aliz
ed
)
Pre
ssu
re (
ba
r) a
nd R
ate
of i
nje
ctio
n (
mg
/CA
)
Crank Shaft Angle (degrees ATDC)
-0.01
0.00
0.01
0.02
0.03
0.04
0.05
0.06
0.07
0.08
-30 -20 -10 0 10 20 30 40 500
20
40
60
80
100
120
140
160
AH
RR
(n
orm
aliz
ed
)
Pre
ssu
re (
ba
r) a
nd
Ra
te o
f inj
ect
ion
(mg
/CA
)
Crank Shaft Angle (degrees ATDC)
-0.01
0.00
0.01
0.02
0.03
0.04
0.05
0.06
0.07
0.08

14
Figure 26a. EUI, Mode 5, Equivalence Ratio and Injection Timing versus Boost
Figure 26b. EUI, Mode 5, Air/Fuel Mass Ratio and Injection Timing versus Boost
Figure 27. EUI, Mode 5, BSFC versus Boost for constant NOx of 3.51 g/bhp-hr (4.71 g/kW-hr)
Figure 28. EUI, Mode 5, Particulate versus Boost for constant NOx of 3.51 g/bhp-hr (4.71 g/kW-hr)
BOOST PRESSURE EFFECTS WITH COMMONRAIL – Mode 4 with, single injection – At this mode theexperiments were done for intake air pressures from267.5kPa (38.8psia) at +0%, up to 321.0kPa (46.6psia) at+20%. Further increase in boost pressure was not con-sidered pertinent since most existing turbochargers havea maximum pressure ratio of about 3:1.
The results of the experiments conducted at mode 4 withthe common rail system, using single injections areshown on Figs. 29 to 31. Comparing the results withthose of the EUI system at mode 4, it can be seen thattrends of the curves are very similar, however the differ-ence in the particulate is a factor of 3. The injection pres-sure for the EUI system was higher (170 MPa at mode 4)than for the common rail (90 Mpa), so the difference inthe results confirms that there is an optimum injectionand intake air pressure combination.
Figure 29a. Common Rail, Mode 4, Single Injection, Equivalence Ratio and Injection Timing versus Boost
25.0 27.5 30.0 32.5 35.0 37.5 40.0 42.5 45.00.25
0.28
0.30
0.33
0.35
0.38
0.40
0.43
0.45
Equiv.Rto.
Intake Air Pressure (kPa)
65%
50%
40%
30%
20%
10%
0%
Equ
ival
ence
Rat
io
Intake Air Pressure (psia)
172 190 207 224 241 259 276 293 310
1.0
0.0
-1.0
-2.0
-3.0
-4.0
-5.0
SOI
SO
I (de
gree
s A
TD
C)
25.0 27.5 30.0 32.5 35.0 37.5 40.0 42.5 45.055
50
45
40
35
30
A/F Ratio
Intake Air Pressure (kPa)
65%
50%
40%
30%
20%
10%
0%
Air/
Fue
l Ma
ss R
atio
Intake Air Pressure (psia)
172 190 207 224 241 259 276 293 310
1.0
0.0
-1.0
-2.0
-3.0
-4.0
-5.0
SOI
SO
I (de
gree
s A
TD
C)
25.0 27.5 30.0 32.5 35.0 37.5 40.0 42.5 45.0145
148
150
153
155
158
160
163
165
168
single cylinder data with 6-cyl. correction
BS
FC
(g/
bhp-
hr)
Intake Air Pressure (psia)
172 190 207 224 241 259 276 293 310
65%
50%40%30%
20%10%
0%
Intake Air Pressure (kPa)
194.5
197.8
201.2
204.5
207.9
211.2
214.6
217.9
221.3
224.6
BS
FC
(g/
kW-h
r)
25.0 27.5 30.0 32.5 35.0 37.5 40.0 42.5 45.00.04
0.05
0.05
0.06
0.06
0.07
0.07 single cylinder data with 6-cyl. correction
65%
45%
35%
20%10%
0%
Par
ticul
ate
(g/
kW-h
r)
Intake Air Pressure (kPa)
Par
ticul
ate
(g/b
hp-h
r)
Intake Air Pressure (psia)
172 190 207 224 241 259 276 293 310
0.054
0.060
0.067
0.074
0.081
0.087
0.094
38.0 40.0 42.0 44.0 46.0 48.00.40
0.42
0.44
0.46
0.48
0.50
0.52
Equiv.Rto.
Equ
iva
lenc
e R
atio
Intake Air Pressure (psia)
262.0 275.8 289.6 303.4 317.2 330.9
20%
15%
10%
5%
0%
Intake Air Pressure (kPa)
1.0
0.5
0.0
-0.5
-1.0
-1.5
-2.0
SOI
SO
I (de
gree
s A
TD
C)

15
Figure 29b. Common Rail, Mode 4, Single Injection, Air/Fuel Mass Ratio and Injection Timing versus Boost
Figure 30. Common Rail, Mode 4. Single Injection, BSFC vs. Boost, NOx at 2.78 g/bhp-hr (3.73 g/kW-hr)
Figure 31. Common Rail Mode 4, Single Injection Particulate versus Boost for constant NOx of 2.78 g/bhp-hr (3.73 g/kW-hr)
Figure 32a. Common Rail, Mode 5, Single Injection, Equivalence Ratio and Injection Timing versus Boost
Figure 32b. Common Rail, Mode 5, Single Injection, Air/Fuel Mass Ratio and Injection Timing versus Boost
Figure 33. Common Rail, Mode 5, Single Injection, BSFC versus Boost for constant NOx of 3.24 g/bhp-hr (4.35 g/kW-hr)
38.0 40.0 42.0 44.0 46.0 48.036
34
32
30
28
A/F Ratio
Air/
Fue
l Ma
ss R
atio
Intake Air Pressure (psia)
262.0 275.8 289.6 303.4 317.2 330.9
20%
15%
10%
5%
0%
Intake Air Pressure (kPa)
1.0
0.5
0.0
-0.5
-1.0
-1.5
-2.0
SOI
SO
I (de
gree
s A
TD
C)
38.0 40.0 42.0 44.0 46.0 48.0146
148
150
152
154
156 single cylinder data with 6-cyl. correction
BS
FC
(g
/bhp
-hr)
Intake Air Pressure (psia)
262.0 275.8 289.6 303.4 317.2 330.9
Intake Air Pressure (kPa)
195.8
198.5
201.2
203.8
206.5
209.2
20%15%
10%5%
0%
BS
FC
(g
/kW
-hr)
38.0 40.0 42.0 44.0 46.0 48.00.08
0.10
0.12
0.14
0.16
0.18
0.20
0.22 single cylinder data with 6-cyl. correction
Pa
rtic
ulat
e (g
/bh
p-hr
)
Intake Air Pressure (psia)
262.0 275.8 289.6 303.4 317.2 330.9
Intake Air Pressure (kPa)
0.107
0.134
0.161
0.188
0.215
0.241
0.268
0.295
20%15%
10%
5%
0%
Pa
rtic
ulat
e (g
/kW
-hr)
20.0 25.0 30.0 35.0 40.0 45.0
0.25
0.30
0.35
0.40
0.45
0.50
Equiv.Rto.
65%
40%
20%
10%
0%
-10%
Eq
uiva
lenc
e R
atio
Intake Air Pressure (psia)
137.9 172.4 206.8 241.3 275.8 310.3
Intake Air Pressure (kPa)
-2.0
-3.0
-4.0
-5.0
-6.0
-7.0 SOI
SO
I (de
gre
es A
TD
C)
20.0 25.0 30.0 35.0 40.0 45.060
55
50
45
40
35
30
A/F Ratio
65%
40%
20%
10%
0%
-10%
Air/
Fue
l Ma
ss R
atio
Intake Air Pressure (psia)
137.9 172.4 206.8 241.3 275.8 310.3
Intake Air Pressure (kPa)
-2.0
-3.0
-4.0
-5.0
-6.0
-7.0 SOI
SO
I (de
gree
s A
TD
C)
20.0 25.0 30.0 35.0 40.0 45.0146
148
150
152
154
156
158
160
162
164
166 single cylinder data with 6-cyl. correction
65%
40%
20%
10%
0%
-10%
BS
FC
(g
/bhp
-hr)
Intake Air Pressure (psia)
137.9 172.4 206.8 241.3 275.8 310.3
Intake Air Pressure (kPa)
195.8
198.5
201.1
203.8
206.5
209.2
211.9
214.6
217.2
219.9
222.6
BS
FC
(g
/kW
-hr)

16
Mode 5, single injection – Figures 32 and 33 show theeffect of boost air pressure on equivalence ratio, air fuelratio and BSFC, respectively. Figure 34 shows the partic-ulate effects. It can be seen that the tendency of thecurve is almost the same as that of mode 4 with singleinjection (see Fig. 31), but the values decrease less rap-idly with the boost pressure.
Figure 34. Common Rail, Mode 5, Single Injection, Particulate versus Boost for constant NOx of 3.24 g/bhp-hr (4.35 g/kW-hr)
Figure 35a. Common Rail, Mode 5, Split Injection, Equivalence Ratio and Injection Timing versus Boost
Figure 35b. Common Rail, Mode 5, Split Injection, Air/Fuel Mass Ratio and Injection Timing versus Boost
Mode 5, split injection – At mode 5, experiments wereconducted with split injections using the same amount offuel as for the single injection but 50% of the fuel wasinjected in the first pulse and 50% after a 10 degreecrankshaft angle dwell. Figures 35, 36, and 37 showresults for the common rail system at mode 5 with splitinjection. As can be seen on Fig. 37, the particulateexhibits a strong minimum at an optimal boost pressureof about +45%. In this case, comparable particulateemissions are reached with the low pressure injectionsystem as those obtained with the higher injection pres-sure EUI system (e.g. compare to Fig 28 at +0% boost).Confirming the benefit of split injection seen previously(e.g. [23]).
Figure 36. Common Rail, Mode 5, Split Injection, BSFC versus Boost for constant NOx of 3.30 g/bhp-hr (4.42 g/kW-hr)
20.0 25.0 30.0 35.0 40.0 45.0
0.15
0.20
0.25
0.30
0.35
0.40
0.45 single cylinder data with 6-cyl. correction
Par
ticul
ate
(g
/bhp
-hr)
Intake Air Pressure (psia)
137.9 172.4 206.8 241.3 275.8 310.3
20%
65%40%
10%
0%
-10%
Intake Air Pressure (kPa)
0.201
0.268
0.335
0.402
0.469
0.536
0.603
Par
ticul
ate
(g
/kW
-hr)
25.0 30.0 35.0 40.0 45.0 50.00.20
0.25
0.30
0.35
0.40
0.45
Equiv.Rto.
Equ
iva
lenc
e R
atio
Intake Air Pressure (psia)
172.4 206.8 241.3 275.8 310.3 344.7
75%65%
45%
30%20%
10%
0%
Intake Air Pressure (kPa)
-2.0
-3.0
-4.0
-5.0
-6.0
-7.0
-8.0
SOI
SO
I (de
gree
s A
TD
C)
25.0 30.0 35.0 40.0 45.0 50.070
65
60
55
50
45
40
35
A/F Ratio
Air/
Fue
l Ma
ss R
atio
Intake Air Pressure (psia)
172.4 206.8 241.3 275.8 310.3 344.7
75%65%
45%
30%20%
10%
0%
Intake Air Pressure (kPa)
-2.0
-3.0
-4.0
-5.0
-6.0
-7.0
-8.0
SOI
SO
I (de
gree
s A
TD
C)
25.0 30.0 35.0 40.0 45.0 50.0145
150
155
160
165
170
175
180 single cylinder data with 6-cyl. correction
BS
FC
(g/
bhp-
hr)
Intake Air Pressure (psia)
172.4 206.8 241.3 275.8 310.3 344.7
Intake Air Pressure (kPa)
194.4
201.2
207.9
214.6
221.3
228.0
234.7
241.4
75%65%45%
30%20%
10%
0%
BS
FC
(g/
kW-h
r)

17
Figure 37. Common Rail, Mode 5, Split Injection, Particulate versus Boost for constant NOx of 3.30 g/bhp-hr (4.42 g/kW-hr)
COMBUSTION AND EMISSION MODELLING
As described in the experimental study, results wereobtained using six modes of operation. In this study, onlythe Mode 5 and Mode 4 cases were simulated with vary-ing boost pressures. In the experimental study there wasa limitation in the power output that could be safelyabsorbed by the existing engine dynamometer. There-fore, Mode 4 test runs could not be carried out beyond acertain boost pressure. Accordingly, the effect ofincreased boost pressure was further investigated in thesimulation study. The airflow rate and SOI timing for con-stant NOx emissions corresponding to a given boostpressure level was determined using trends observed inthe experiment and used as input in the simulation study.
SIMULATION OF MODE 4 – Mode 4 represents approxi-mately 95 percent full load operating condition. A maxi-mum boost pressure of 268 kPa could be used for thebaseline experiment. Further experimental studies werecarried out at reduced boost pressures of -5% to -20%. Inthe simulation four boost pressures were considered forMode 4: the baseline (268 kPa), -10% boost (241 kPa), -15% boost (228 kPa) and -20% boost (214 kPa). Theparameters used for the simulation are given in Table 10.
Combustion and Emission Characteristics – Figures 38and 39 show the comparison of cylinder pressure andrate-of-heat release, respectively, for the baseline and -15% boost conditions. In this case the cylinder pressurecurves were found to match very well with the experimen-tally measured data. In the rate-of-heat-release curvesshown on Fig. 39, the ignition delay is also well simu-lated.
(a) Baseline
(b) -15% Boost Pressure
Figure 38. Comparison of Simulated and Measured Cylinder Pressure
25.0 30.0 35.0 40.0 45.0 50.00.06
0.07
0.08
0.09
0.10
0.11
0.12 single cylinder data with 6-cyl. correction
Par
ticul
ate
(g/b
hp-h
r)
Intake Air Pressure (psia)
172.4 206.8 241.3 275.8 310.3 344.7
Intake Air Pressure (kPa)
0.080
0.094
0.107
0.121
0.134
0.148
0.161
75%
65%
45%30%
20%
10%
0%
Par
ticul
ate
(g/k
W-h
r)
Table 10. Simulation Parameters used in Mode 4
Parameters
Boost Pressure
Baseline -15% +20% +40%
Intake Temp, K 313 313 313 313
Intake Pressure,kPa
268 228 321 375
Exhaust Pres-sure, kPa
248 208 301 355
Air Flow Rate,kg/min
5.67 4.84 6.81 7.94
Fuel Flow Rate, kg/min
0.192 0.192 0.192 0.192
������������������������������������������������������������������������������������������������
����������
��������������������������
��������������������������������������
����������������������������������������������������
��������������������������������������������������������
���������������������������������������������������������
������������������������������������������
�������������������������������������
����������������������������������������
���������������������������������������������������������
������������������������������������������������������������������������������������������
0
2
4
6
8
10
12
14
-100 -50 0 50 100
������������������������������������������������������������������������������������������������������������������������
Exp�����������������������������KIVA
Cyl
inde
r P
ress
ure,
MP
a
Crank Angle, degree ATDC
������������������������
����������������������������������������������������������������������
����������
������������������������������������������
���������������������������������������
������������������������������������������������
���������������������������������������������������������
������������������������������������������������
���������������������������
��������������������������������������������������������������
��������������������������������������������
����������������������������������������������
�����������������������������������������������������������������������
0
2
4
6
8
10
12
-100 -50 0 50 100
���������������������������������������������������������������������������������
Exp��������������������������������KIVA
Cyl
inde
r P
ress
ure,
MP
a
Crank Angle, degree ATDC

18
(a) Baseline
(b) -15% Boost Pressure
Figure 39. Comparison of Predicted and Measured Heat Release
Soot emission as a function of boost pressure is shownon Fig. 40. The measured data for particulate emissionsincludes both soot and soluble organic fraction (SOF) inthe exhaust. In the simulation study only in-cylinder soot(the insoluble fraction of particulate) is predicted. There-fore, in the comparisons, the measured SOF was sub-tracted from the particulate emission data. Theincreasing trend of soot with lowering of boost pressureobserved in the experiment is well maintained in the sim-ulation study. However, the predicted soot levels arehigher than those measured. The overall equivalenceratio is the main factor controlling soot emissions. In thisoperating condition, no minimum value of soot wasobserved, however, the slope of the curve was found toreduce with further increase in the boost pressure. Thissuggests that there is a cut-off boost pressure conditionbeyond which the advantage of increasing boost pres-sure on soot reduction no longer exists.
Extrapolation Studies – For mode 4, the highest boostpressure cases were +20% and +40%. The intake pres-sure, air mass flow rate initial conditions were estimatedby extrapolating the measured data in the experiments.Table 10 shows the extrapolated data used in the simula-tions for the +20% and +40% boost pressure cases. Alsoshown are the baseline and -15% boost pressure dataobtained from the experiment.
The predicted cylinder pressure and rate-of-heat-releasecurves are compared with the baseline condition on Fig.41. The accumulated heat release data obtained from thesimulations show that at a boost pressure of +20%, thereis an increase in heat release by 2% at EVO but the accu-mulated heat release drops as the boost pressure isincreased to 40%. This could again be due to the fact thatat very high boost pressure some regions in the combus-tion chamber might have very low equivalence ratios andthe low temperature inhibits combustion in those regions.
Figure 40. Effect of Boost Pressure on Particulate Emission for Mode 4
The emission results obtained with +20% and +40%boost pressure (Fig. 40) indicate that significant addi-tional soot reduction could be obtained using a boostpressure in the range of +20 to +30%. Further increase inboost pressure may not be economical. With a modifica-tion in the turbocharger design, it may be possible to opti-mize an existing engine for lower soot emission whilekeeping the NOx emissions within acceptable limits.From the simulation study it is also evident that byincreasing boost pressure the thermal loading of theengine remains unaffected as the fueling rate remainsthe same in this case.
SIMULATION OF MODE 5 – Four different boost pres-sure conditions were considered: baseline, 20, 40 and 60percent increase in boost pressure. The details of theseconditions are listed in Table 11.
����������������������������������������������������������������������������������������������
���������������������������������������������������������������������������������
����������������������������������������������������������������
��������������������������������������������������
��������������������������������������
��������������������������������
�������������������������
������������������������������������������������
������������������������������������
�������������������������������������������������������������������
���������������������������������������������������
������������������������������������������������������������������
����������������������������������������������������������������������������������������������������������������������������������
���������
����������������
�������������������������������
��������������������������
����������������������������������������
��������������������
�������������������������������������
���������������������������������
����������������������������������������
��������������������������������������������
����������������������������������������������
����������������������������������
�������������������������������
����������������������������������������������������������������������������������������������������
�������������������������������������
��������������������������������������������������������������������������
-0.01
0.00
0.01
0.02
0.03
0.04
-20 -10 0 10 20 30 40 50 60
�������������������������������������������������������������������������������������������������������������� Exp��������������KIVA
Nor
mal
ized
Hea
t Rel
ease
Rat
e
Crank Angle, degree ATDC
��������������������������������������������������������������������������������������������������������
��������������������������������������������������������������������������������������������
�������������������������������������������������������������������
������������������������������������������������������������
��������������������������������������������������������
��������������������������
���������������������������
��������������������������������������������
��������������������������������������
���������������������������������������������������
���������������������������������������������������������
����������������������������������������������������������������������������������������������������������������������������������������������������������������������������������������
������������
������������������������������������������������
���������������������������
����������������������
�����������������������������������������������������
�������������������������������������
�����������������������������������������������
�����������������������
�������������������������������������
��������������������������������������������������������������������������������������������������������������
���������������������������������������������������������������������������������������������������
-0.01
0.00
0.01
0.02
0.03
0.04
-20 -10 0 10 20 30 40 50 60
����������������������������������������������������������������������������������������������������������������
�����������������������������Exp��������������KIVA
Nor
mal
ized
Hea
t Rel
ease
Rat
e
Crank Angle, degree ATDC
�����������������������������������������������
�������������������
�������������������������������
���������������������������������������������������������
�������������������������������������
������������������������������������������������
������������������������������������������������������������
���������������������������������������������������������������������������������������������������
���
���� �����
����
��������
�����
0.0
0.2
0.4
0.6
0.8
1.0
1.2
30 35 40 45 50 55
������������������������������������������������������������������������������������������������������������
������������Exp������������������������������������KIVA
206.8 241.3 275.8 310.3 344.7379.2
Soo
t, g/
kg-f
uel
Intake Air Pressure, psia
Intake Air Pressure, kPa

19
(a) Average Cylinder Pressure
(b) Normalized Heat Release
Figure 41. Effect of Boost Pressure on Cylinder Pressure and Heat Release for Mode 4
(a) Baseline
(b) +40% Boost Pressure
Figure 42. Comparison of Simulated and Measured Cylinder Pressure for Mode 5
Combustion and Emissions Characteristics – A compari-son of the experimental and simulated average cylinderpressure is shown on Fig. 42 for the baseline and +40%boost pressure operating conditions. Figures 42a and42b show reasonable agreement between the predictedand measured pressures, although the cylinder pressureis overestimated. The ability to predict correct ignitiondelay is one of the main features of the modified ignitionmodel used in this study. The rates-of-heat-release forthe above two cases are shown on Figs. 43a and 43brespectively. It is evident from Fig. 43 that the ignitiondelay is well predicted using the modified ignition modeland the experimental and simulation results match withreasonable accuracy. The diffusion burn is also wellreproduced in the simulation study.
Table 11. Simulation Parameters used for Mode 5
Parameters
Boost Pressure
Baseline +20% +40% +60%
Intake Temp, K 305 305 305 305
Intake Pressure, kPa
184 221 258 294
Exhaust Pressure, kPa
181 217 254 291
Air Flow Rate,kg/min
4.16 4.98 5.82 6.61
Fuel Flow Rate,kg/min
0.125 0.125 0.127 0.125
EquivalenceRatio
0.440 0.37 0.32 0.28
������������������������������
�����������������������������������������������������������
������������������������
��������������������������
�����������������������������������
������������������������������������������
���������������������������������������������
���������������������������������������������������������������������
�����������������������������������������
�����������������������������������������������������������
���������������������������������������������������������������������������
���������������������������������������������������������������������������������
�������������������������������������������������������������������������������������������������������������������������������������������������������������������������������������������������������������������������������������������������������
��������������������������������������������������������������������������������������������������
���������������������������������������������������������������
�������������������������������������������������������
�����������������������������������������������������������������
���������������������������������������������������������������������
�������������������������������������������������������������������������������������������������������
����������������������������������������������������������������
��������������������������������������������������������������������������
������������������������������������������������������������������
������������������������������������������������������������������������������������������������������������
�������������������������������������������������������������������������������������������������������������������
������������������������������������������������������������������������������������������������������������������������������������������������������������������������
������ ���� ���
�����
������
�����
������
����
��
��������
����� ���
0
5
10
15
20
-100 -50 0 50 100
������������������������������������������������������������������������������������������������������������������������������������������������������������
Baseline����������������������������20% Boost������������40% Boost
Cyl
inde
r P
ress
ure,
MP
a
Crank Angle, degree ATDC
�����������������������������������������������������������������������������������������������������������������������������������������������������������������������������������������������������
����������������������������������
��������������������������������
�����������������������������������������������������������������
����������������������������
����������������������������������������������������������������������
������������������������������������������������������������������������������������������������������������������������������
�������������������������������������������������
������������������������������������������������������
��������������������������������������
������������������������������������
�����������������������������������������������
���������������������������������������������������
�������������������������������������������������������������������������������������������������
��������������������
��������������������������
�������������������������������������������
����������������������������������������
����������������������������
���������������������������������
���������������������������������������������������
�����������������������������������������
����������������������������������������������������
�����������������������������������������������������������������
������������������������������������������������������������
������������������������������������������������������������������������������������������������������
�������������������������������������
���������������������������������������������������������������������������������������������������������������
������������
������������������������
�����������������������������������
����������������������������������������
�����������������������
��������������������������
�������������������������������
����������������������������
������������������������������������������
�������������������������������������
����������������������������������������
���������������������������������
������������������������������������������
��������������������������������������������������������������������������������������������������������������
��������������
�������������������������������������������������������������������������������������������������������
-0.01
0.00
0.01
0.02
0.03
0.04
-20 -10 0 10 20 30 40 50 60
����������������������������������������������������������������������������������������������������������������������������������������������������������������������������������������������
���������������������������������Baseline�������������20% Boost�������������40% Boost
No
rma
lize
d H
ea
t R
ele
ase
Ra
te
Crank Angle, degree ATDC
�����������������������������������������������������������������������������������������
���������������������������������������
���������������������������������
���������������������������������������������
������������������������������������������������������
��������������������������������������������������������
�����������������������������������������������������������������
��������������������������������������
����������������������������������������������
����������������������������������������������������������������
��������������������������������
0
2
4
6
8
10
-100 -50 0 50 100
��������������������������������������������������������������������������������������������������������
Exp���������������������������KIVA
Cyl
ind
er
Pre
ssu
re,
MP
a
Crank Angle, degree ATDC
��������������������������������������������������������������������������������������������������
������������������������������
���������������������������������������
�������������������������������������������
������������������������������������������������������������
��������������������
�������������������������
���������������������������������������������������������
�����������������������������������������
�������������������������������
�����������������������������������������������
��������������������������������������������������������������������������������
0
2
4
6
8
10
12
14
-100 -50 0 50 100
������������������������������������������������������������������������������
Exp�����������������������KIVA
Cyl
inde
r P
ress
ure,
MP
a
Crank Angle, degree ATDC

20
(a) Baseline
(b) +40% Boost Pressure
Figure 43. Comparison of Predicted and Measured Heat Release for Mode 5
The effect of boost pressure on soot emissions is com-pared on Fig. 44. The decreasing trend of soot withincrease in the boost pressure is also seen in the simula-tion study and could be the result of the lean-burn condi-tion in the combustion chamber. However, the minimumsoot value observed experimentally at about +30% boostpressure was not seen in the simulation. Instead, the pre-dicted soot was found to be nearly constant at high boostpressure. The deviation from the experiment could bedue to an inaccurate specification of the timing of SOI.This is supported by the increased NOx concentrationobserved in the simulation results at +60% boost pres-sure (Table 12). Nevertheless, the simulation study pro-vides the same conclusion that increased boost pressureis effective in reducing soot up to certain percent only,beyond which there is no significant further soot reduc-tion.
At high boost pressure the combination of lean mixturetogether with the overall low temperature in the combus-tion chamber could result in an increase in the soot emis-sions. Other possibility could be the location of soot
formation in the combustion chamber which is a functionof in-cylinder flow pattern. With a high boost pressure,the spray penetration is reduced and the mixing phenom-enon in the cylinder is modified. Therefore, the soot for-mation region in this case could be entirely different thanfor low boost pressure cases. In the next section, themechanism of soot reduction with boost pressure isexplained using the computational results.
Mechanism of Soot Reduction with Increased BoostPressure – With increased boost pressure, the overallequivalence ratio in the combustion chamber decreases.This requires the use of more advanced SOI timings forthe same level of NOx emissions. This is mainly due tothe shortened ignition delay period and the lean burnconditions associated with increased boost pressures. Inthe case of Mode 5, an injection timing of -5°ATDC with+60% boost pressure increase gave the same level ofNOx as 0° ATDC in baseline condition.
Figure 44. Effect of Boost Pressure on Particulate Emission
Due to the increased density in the combustion chamber,comparatively low spray penetration was observed withincreased boost pressure. Midway through the injectionduration period, a liquid spray penetration length of 1.32cm was observed for +60% boost compared to 1.74 cmfor the baseline condition, as shown on Fig. 45. Thevapor penetration is also reduced and the low spray pen-
�������������������������������������������������������������������������������������������������������������������������������������������������������������������������������
������������
���������������
���������������
��������������������������������������������������
��
����
������
���������������������������
������
���������������������
����
���������������������������������������������������
���������������������������������
����������������������������������
��������������������������������������������������������������������������������������
��������������������������
��������������������������������
����������������������������������
�����������������������������
���������������������������������
��������������������������������������������������������������������������������������������������������������������������������������������������������������������������������������������������������������������������������������������������������������������������������������
�����������������������������������������������������������������������������������������������������������������������������������������������������������������������������������������������������������������������������������������������������������������������������������������
���������������������������������������������������
�����������������������������������������������
��������������������������������������������������������������������������
������������������������������������������������������������������
�������������������������������������������������������
����������������������������������������������������������������������������������
����������������������������������������������������������������������������������������������������������������
������������������������������������������������������
-0.01
0.00
0.01
0.02
0.03
0.04
0.05
0.06
-20 -10 0 10 20 30 40 50 60
��������������������������������������������������������������������������������������������������������
������������Exp������������������������KIVA
No
rma
lize
d H
ea
t R
ele
ase
Ra
te
Crank Angle, degree ATDC
��������������������������������������������
������������������������������������������������
��������������������������������������������������
��������������������������������������������������
����������������������������������������������������
��������������������������������������
��
����
�������������������������������������
�������������
�������������������
���������������������������������������
������������������
�������������������������������������������������������������������
�����������������������������
�������������������������������
�������������������������
�����������������������������������������������������������������
������������������������������������������������������������������������������������������������������������������������
���������������
�������������������������
������������
����������������������������
������������������
����������������������
������������������������
��������������������������
��������������������������������
���������������������������������������������������������������������������������������������������������������������������
������������������������������������������������
�����������������������������������
����������������������������������������������
��������������������������������������������������������������������������
����������������������������������������������
����������������������������������������������
�����������������������������������
��������������������������������
����������������������������������������������������������������������������������������������������������
�������������������������
����������
-0.01
0.00
0.01
0.02
0.03
0.04
0.05
0.06
-20 -10 0 10 20 30 40 50 60
������������������������������������������������������������������������������������������
������������
Exp���������������������������KIVA
Nor
mal
ized
Hea
t Rel
ease
Rat
e
Crank Angle, degree ATDC
Table 12. Fuel specific emission results for Mode 5 – experimental and computationally predicted
Boost Pressure
Experiment(g/kg-fuel)
Simulation(g/kg-fuel)
NOx Soot NOx Soot
Baseline 21.49 0.310 20.41 0.194
+20% 22.82 0.177 20.85 0.103
+40% 23.24 0.210 23.99 0.062
+60% 24.04 0.247 25.74 0.057
��������������������������������������������������������������������������������������������������������������������������������������������
����������������������������������������������������������
����������������������������������������������������
�����������������������������������������������
������������������������������������������������������������������
�������������������������������������������������������������
������������������������������
�����������������������������������������������������������������������
����
����������������� ���
0.00
0.05
0.10
0.15
0.20
0.25
0.30
0.35
25 30 35 40 45
����������������������������������������������������������������������������������������������������������������
�������������Exp��������������������������������������KIVA
180 200 220 240 260 280 300
So
ot,
g/k
g-f
ue
l
Intake Air Pressure, psia
Intake Air Pressure, kPa

21
etration inhibits air entrainment and mixing. Therefore,this tends to increases soot formation in the case of highboost pressure. However, net soot is the result of a com-petition between the soot formation and oxidation pro-cesses in the cylinder. The abundance of oxygenavailable in the case of high boost pressures alsoenhances the soot oxidation process and finally results inreduction of net soot in the cylinder.
Comparison of the locations of soot formation regions inthe combustion chamber was found not to show any con-siderable difference between the +40% and +60% boostpressure cases. Therefore, the location of soot formationis not a controlling parameter for increased soot in thecase of +60% boost pressure.
Figure 46 shows the average cylinder temperature andinstantaneous fuel mass in the bowl for different boostpressure cases. The hatched area represents the crankangle range corresponding to the peak soot formationzone. From this figure it is observed that the peak sootformation corresponds to a constant amount of fuel in thebowl. In other words, the peak soot formation takes placewhen a certain constant amount of fuel is burned. Thedecreasing slope in the soot-boost pressure curve at veryhigh boost pressures can be attributed to the combinedeffect of low temperatures and low equivalence ratios thatinhibits soot oxidation.
(a) Baseline at 11.5° ATDC (l= 0.314e-1 h=0.283)
(b) +60% boost at 6.5° ATDC (l= 0.371e-1 h=0.334)
Figure 45. Liquid and vapor spray penetration midway through the injection period
(a) Average Cylinder Temperature
(b) Fuel mass in the piston bowl region
Figure 46. Effect of boost pressure on average cylinder temperature and instantaneous fuel mass in the bowl.
SUMMARY AND CONCLUSIONS
A study of boost pressure effects was conducted using asingle-cylinder version of a current heavy-duty dieselengine (Caterpillar 3406). A six-mode steady-state simu-lation of the federal transient test procedure (FTP) wasused for the baseline evaluation. The fuel system used inthe baseline study was an electronically controlled unitinjector (EUI) capable of injection pressure up to 190MPa. For the boost pressure study, the EUI and a com-mon rail system capable of multiple injections were used.
BASELINE EMISSIONS AND PERFORMANCESTUDY – The results lead to the following conclusions:
NOx Emissions – The low cycle NOx emissions using theEUI can be attributed to the rising shape of the rate-of-injection. Especially at mode 4, the shaped injectionintroduced so little fuel during the ignition delay that thepremixed burn was essentially eliminated, thus reducingNOx emissions significantly.
������������������������������������������������������������������������������������������������������������������������������������������������������������������������������
�������������������������������������������������������
��������������������������������������������
����������������������������������������������������������
�������������������������������������������������������������������������������������������������������������������������������������
��������������������������������������������������������
�����������������������������������������������������
������������������������������������������������������
��������������������������������������������������������������
������������������������������������������������������������
��������������������������������������������������������������������������������������
����������������������������������������������������������������������������������������������������������������������
��������������������������������������������������������������������������������������������������������������������������������������������������������������
����������������������������
���������������
����������������������������������
���������������������������������
����������������������������������������������������������
������������������������������������������������
��������������������������������������������
������������������������������������������
������������������������������������������
���������������������������������������������������������������
���������������������������������������������
�����������������������������������������������������������������������������������������������������������������������������������������������������������������������������������
�����������������������������
�������������������������������������������������������������
���������������������������������
������������������������������������������������������
���������������������������������������������������������
������������������������������������������������������
����������������������������������������������
���������������������������������������������������������������������������������������
����������������������������������������������������������
������������������������������������������������������������������
������������������������������������������������������������������������
������������������������������������������������������������������������������������������������������������������������������������������������������������������������������������������������������������������������������
��������������������������������������������������������������������������������������������������������������������������������������
��������������������������������������������������������������������������������������������������������������������
�����������������������������������������������
����������������������������������
�����������������������������������������������
���������������������������������������������������������
��������������������������������������������
���������������������������������������������
����������������������������������������
�����������������������������������������������������������
������������������������������������������������
��������������
���
��������
����������
������������� ��
�� ������
�����
���
��
�����
�������
������������ ����
����
����
��
��������
������
�����������
�������
800
900
1000
1100
1200
1300
1400
1500
0 20 40 60 80 100 120
��������������������������������������������������������������������������������������������������������������������������������������������������������������������������������������������������������
������������������Baseline
�������������������������������������� 20% Boost ��������������������������
������������ 40% Boost�����
���������������������������������
����������������������������60% Boost
Ave
rag
e C
ylin
de
r T
em
pe
ratu
re,
K
Crank Angle, degree ATDC
���������������������������������������������������������������������������������������������������������������������������������������������������
��������������������������������������������������������������������
��������
������������������
������������
������������������
������������������������
�����������������������������������������������
���������������������������������������������
�����������������������������������������������������������������������������������������������������������������������������������������������������������
������������������������������������������
������������������������������������������������������������
��������������������������������
�������������������������������������������������������
���������������������������������������������������������������������������������������������������������������������������������������������������������������������
��������
������������
������������
������������������������������������������������������������
���������������������������������
������������������������
��������������������������������������������������������������������������������������������������������������������������������������������������������������
����������������������
��������������������������������������������������������
����������������������������������������������������������������������
����������������������������������������������������������������������������������
����������������������������������������������������������������������������������������������������������������������������������������������������������������������� �����
������
����
�����������
����
����� ��� �������� �����
������
�������
��������� ���� ������ �����
�����������
���������� ���
���
���� ����� ��� ����
-0.005
0.000
0.005
0.010
0.015
0.020
0.025
0.030
-10 0 10 20 30 40
������������������������������������������������������������������������������������������������������������������������������������������������������������������������������������������������������������������������������������
������������������Baseline��������������������������������������20% Boost������������������40% Boost���������������������������������60% Boost
Fue
l Mas
s in
the
Bow
l, g
Crank Angle, degree ATDC

22
Particulate Emissions – The EUI injection also providesbenefits in particulate emissions over other systems pre-viously investigated [23]. It is assumed that this is due tothe EUI’s rising injection rate. At low loads, when gasdensities in the cylinder are low, the injection pressure islow and over-penetration is eliminated. However, at highloads, when gas densities are higher, the injection islonger and high injection pressures are attained, thusproviding greater penetration and enhanced air utiliza-tion, leading to low particulate emissions.
BOOST PRESSURE STUDY – Optimal boost pressureat each mode was found to lead to significant improve-ments in BSFC and particulate emissions. Particulateemissions decreased significantly with increased intakeboost pressure due to the increased available air for sootoxidation at elevated intake pressures (while holdingbrake specific NOx constant). However, the study alsoshowed that there exist engine operating conditions athigh boost (low equivalence ratio) beyond which the ben-efit of boost pressure on particulate emissions is notfound. This is because at very high boost pressures, theliquid spray and vapor penetration lengths are reduced.This explanation was confirmed by using computer mod-eling. Similar trends were found when the present single-cylinder test results were corrected for turbocharger effi-ciencies of the six-cylinder engine configuration.
When the observed particulate and BSFC reductionsseen at modes 3, 4, and 5 were incorporated into the six-mode cycle, particulates are reduced from 0.107 g/kW-hr(0.079 g/bhp-hr) to 0.089 g/kW-hr (0.066 g/bhp-hr) andBSFC is reduced from 231 g/kW-hr (173 g/bhp-hr) to 212g/kW-hr (158 g/bhp-hr). Clearly, these results indicatethat enhanced boosting strategies will be important inmeeting future heavy-duty diesel engine emissions andfuel consumption goals.
ACKNOWLEDGMENTS
Funding from Caterpillar, TACOM/BKM and DOE/Sandiasupported this work. The Army Research Office providedadditional facilities and support. The authors also thankMatt Thiel and Paul Pachenski for their diligent assis-tance during the data collection and all the other individu-als at the UW-Engine Research Center and Caterpillarwho were involved in making this work possible.
REFERENCES
1. Browning, L.H., “Technologies and Costs for On-RoadHeavy-Duty Engines Meeting 2004 Emissions Standards”,SAE Paper 973256, 1997.
2. Capobianco, M. and Gambarotta, A., “Variable Geometryand Wastegated Automotive Turbochargers: Measure-ments and Comparison of Turbine Performance”, Transac-tions of the ASME, Journal of Engineering for Gas Turbinesand Power, Vol. 114, July 1992.
3. Shao, J., Ogura, M., Liu, Y., Yoshino, M., “Performance of aNew Axially Movable Vane Turbocharger”, SAE Paper961747, 1996.
4. Kapich, D.D., “Sequential Hydro-Supercharging System forTurbodiesels” SAE Paper 961744, 1996.
5. Miyaki, M., Fujisawa, H., Masuda, A., and Yamoamoto,Y.,“Development of New Electronically Controlled FuelInjection System ECD-U2 For Diesel Engines”, SAE Paper910252, 1991.
6. “Emissions Regulations for New Otto-Cycle and DieselHeavy-Duty Engines; Gaseous and Particulate ExhaustTest Procedures”, CFR 40 Subpart N, US EPA, June 1997.
7. Amsden, A.A., Butler, T.D., O’Rourke, P.J., and Ramshaw.J.D., “KIVA: A comprehensive Model for 2D and 3D EngineSimulations,” SAE Paper 850554, 1984.
8. Amsden, A.A., O’Rourke, P.J. and Butler, T.D., “KIVA-II: AComputer Program for Chemically Reactive Flows withSprays,” Los Alamos National Laboratory Report No. LA -11560-MS, 1989.
9. Han, Z., and Reitz, R.D., “Turbulence Modeling of InternalCombustion Engines Using RNG k- Models,” CombustionScience and Technology, 106, pp. 4-6, 267, 1995.
10. Reitz, R.D., “Modeling Atomization Processes in High-Pressure Vaporizing Sprays,” Atomization and Spray Tech-nology, 3, 309, 1987.
11. Gonzalez, M.A., Lian, Z.W., and Reitz, R.D., “Modeling Die-sel Engine Spray Vaporization and Combustion,” SAEPaper 920579, 1992.
12. Liu, A.B., Mather, D., and Reitz, R.D., “Modeling the Effectsof Drop Drag and Breakup on Fuel Sprays,” SAE Paper930072, 1993.
13. Halstead, M., Kirsh, L., and Quinn, C., “The Autoignition ofHydrocarbon Fuels at High Temperatures and Pressures -Fitting of a Mathematical Model,” Comb. Flame, 30, pp. 45-60, 1977.
14. Theobald, M.A., and Cheng, W.K., “A Numerical Study ofDiesel Ignition,” ASME Paper 87-FE-2, 1987.
15. Kong, S.C., and Reitz, R.D., “Multidimensional Modeling ofDiesel Ignition and Combustion using a Multistep KineticsModel,” Paper 93-ICE-22, ASME Trans., Journal of Engi-neering for Gas Turbines, and Power, 115, No. 4, pp. 781-789, 1993.
16. Schapertons, H. and Lee, W., Multidimensional Modellingof Knocking combustion in SI Engines, SAE Paper 850502,1985.
17. Abraham, J., Bracco, F.V., and Reitz, R.D., “Comparisons ofComputed and Measured Premixed Charge Engine Com-bustion,” Comb. Flame, 60, pp. 309-322, 1985.
18. Bowman, C.T., “Kinetics of Pollutant Formation andDestruction in Combustion,” Prog. Energy Comb. Sci., 1,pp. 33-45, 1975.
19. Hiroyasu, H., and Kadota, T., “Models for Combustion andFormation of Nitric Oxide and Soot in DI Diesel Engines,”SAE Paper 760129, 1976.
20. Nagle, J., and Strickland-Constable, R.F., “Oxidation ofCarbon between 1000-2000 C,” Proc. of the Fifth CarbonConf., 1, pp. 154, 1962.
21. Senecal, P.K., Xin, J. and Reitz, R.D., “Predictions of Resid-ual Gas Fraction in IC Engines," SAE Paper 962052, 1996.
22. Zhu, Y. and Reitz, R.D., “A 1-D gas dynamics code for sub-sonic and supersonic flows applied to predict EGR levels ina heavy-duty diesel engine”, To appear in InternationalJournal of Vehicle Design, 1999.
23. Montgomery, D.T. and Reitz, R.D., “Six-Mode Cycle Evalu-ation of the Effect of EGR and Multiple Injections on Partic-ulate and NOx Emissions from a D.I. Diesel Engine”, SAEPaper 960316, 1996.