1999 annual report york international · pdf fileyork continues to build a stronger position...
TRANSCRIPT
York International Corporation
1999 Annual Report
500.01-HM1.8Y(400)
1York International Corporation 1999 Annual Report
Corporate and Financial Highlights1
■
York at a Glance 2 - 3
■
Letter to the Shareholders4 - 7
■
An Overview of Operations8 - 12
■
Management’s Report on Financial Statements13
■
Independent Auditors’ Report13
■
Five Year Summary of Selected Financial Data14
■
Management’s Discussion and Analysis15 - 21
■
Financial Statements22 - 25
■
Notes to Consolidated Financial Statements26 - 42
■
Summary of Quarterly Results & Trading and Dividend Information43
■
Investor and Stockholder Information44
■
Corporate Data44
■
Directors and Officersinside back cover
Financial Highlights:
(in thousands, except per share data) 1999 1998 1997
Net sales $3,866,615 $3,289,201 $3,193,657
Income from operations 163,945* 228,704 114,002
Net income 75,882* 136,493 47,393
Diluted earnings per share of common stock $ 1.91 $ 3.36 $ 1.10
Cash dividends per share $ 0.60 $ 0.48 $ 0.48
Diluted weighted average common shares outstanding 39,832 40,622 43,040
(*)In 1999, the Company recorded charges to operations for costs relating to the acquisition, integration and restructuring of Sabroe and other Company cost reductioninitiatives.
Corporate Highlights:
Achieved record sales of $3.9 billion.
Completed the acquisition of Sabroe A/S, a leading industrial refrigeration company.
Realized substantial benefits from our supply chain management program.
Introduced key new products.
Strengthened the distribution networks.
Continued the implementation of rationalization efforts.
Realized improvements in manufacturing operations.
Corporate and Financial HighlightsYork knows its strengths. Now the task is to take full advantage of them. That’s the mission of a management team being
led by a new CEO and several other new executives. Those strengths: a global company with solid products, leading market
positions and worldwide aftermarket service capability. Key initiatives: decentralized businesses, lean and streamlined
operations, a continuing stream of innovative products, and the best employees in the industry.

32York International Corporation 1999 Annual ReportYork International Corporation 1999 Annual Report
York International Corporation At A Glance
Corporate Profile:
York International is the largest independent supplier of heating, ventilation, air conditioning and refrigeration (HVAC&R)
products in the United States and a leading competitor globally. York designs, manufactures, sells and services HVAC systems
for residential and commercial markets, gas compression and refrigeration equipment for industrial processing, and
compressors for air conditioning and refrigeration applications.
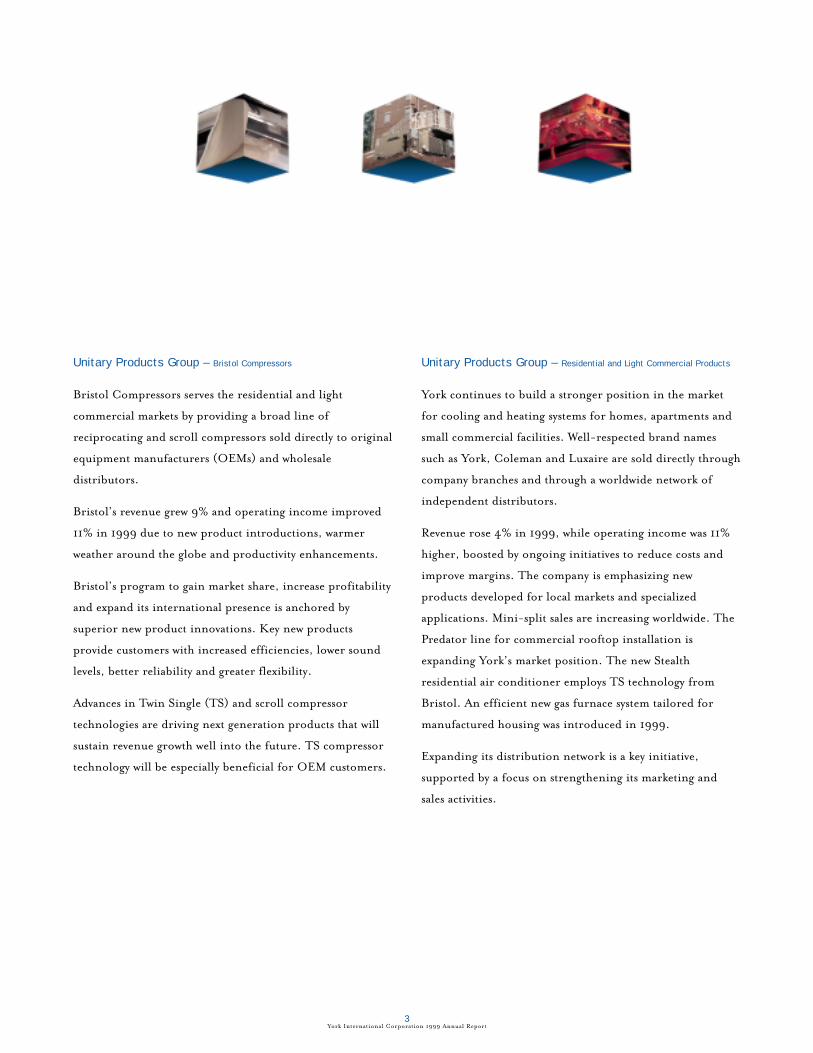
Unitary Products Group – Bristol Compressors
Bristol Compressors serves the residential and light
commercial markets by providing a broad line of
reciprocating and scroll compressors sold directly to original
equipment manufacturers (OEMs) and wholesale
distributors.
Bristol’s revenue grew 9% and operating income improved
11% in 1999 due to new product introductions, warmer
weather around the globe and productivity enhancements.
Bristol’s program to gain market share, increase profitability
and expand its international presence is anchored by
superior new product innovations. Key new products
provide customers with increased efficiencies, lower sound
levels, better reliability and greater flexibility.
Advances in Twin Single (TS) and scroll compressor
technologies are driving next generation products that will
sustain revenue growth well into the future. TS compressor
technology will be especially beneficial for OEM customers.
Unitary Products Group – Residential and Light Commercial Products
York continues to build a stronger position in the market
for cooling and heating systems for homes, apartments and
small commercial facilities. Well-respected brand names
such as York, Coleman and Luxaire are sold directly through
company branches and through a worldwide network of
independent distributors.
Revenue rose 4% in 1999, while operating income was 11%
higher, boosted by ongoing initiatives to reduce costs and
improve margins. The company is emphasizing new
products developed for local markets and specialized
applications. Mini-split sales are increasing worldwide. The
Predator line for commercial rooftop installation is
expanding York’s market position. The new Stealth
residential air conditioner employs TS technology from
Bristol. An efficient new gas furnace system tailored for
manufactured housing was introduced in 1999.
Expanding its distribution network is a key initiative,
supported by a focus on strengthening its marketing and
sales activities.
Engineered Systems Products Group
Integrated systems provide comfort cooling, heating, air and
noise filtration for millions of people in office buildings,
manufacturing plants, schools, hospitals, shopping malls
and other types of commercial facilities around the world.
Products include chillers, packaged HVAC systems, air
handling and noise filtration equipment, as well as HVAC
and refrigeration systems for marine vessels. York also
operates the largest HVAC maintenance, repair and retrofit
aftermarket service in the world.
1999 results were mixed across worldwide markets. Revenue
grew 4% and operating income declined 8%. Good
performance in the chiller and service business was offset by
a decline in the performance of the air handling business
and Latin America. Aftermarket results continued to be
strong.
New products are gaining increased market acceptance. New
product introductions and operational improvements are
key to improving financial performance in the future.
Refrigeration Products Group
York custom designs refrigeration systems for processing
and storing a wide range of food products and for vital
industrial applications throughout the world. York’s systems
serve businesses in the electronic, pharmaceutical,
petrochemical, textile, food and beverage and numerous
other industries. Refrigeration systems are found at
numerous sports venues worldwide, including the
International Olympic Games.
Products include screw and reciprocating compressors,
condensers, evaporators, heat transfer equipment, pressure
vessels, packaged refrigeration systems, hygienic air handling
and distribution systems and gas compression and carbon
dioxide systems.
Through the acquisition of Sabroe A/S, York became the
world leader in industrial refrigeration systems, nearly
doubling its sales in 1999, while raising operating income by
over 60%. Synergies from the acquisition will result in
improved revenue and profits. Actions include integrating
the best products of the combined companies, capturing
manufacturing efficiencies, gaining economies of scale and
capitalizing on a larger and stronger distribution network.
32York International Corporation 1999 Annual ReportYork International Corporation 1999 Annual Report
York International Corporation At A Glance
Corporate Profile:
York International is the largest independent supplier of heating, ventilation, air conditioning and refrigeration (HVAC&R)
products in the United States and a leading competitor globally. York designs, manufactures, sells and services HVAC systems
for residential and commercial markets, gas compression and refrigeration equipment for industrial processing, and
compressors for air conditioning and refrigeration applications.
Unitary Products Group – Bristol Compressors
Bristol Compressors serves the residential and light
commercial markets by providing a broad line of
reciprocating and scroll compressors sold directly to original
equipment manufacturers (OEMs) and wholesale
distributors.
Bristol’s revenue grew 9% and operating income improved
11% in 1999 due to new product introductions, warmer
weather around the globe and productivity enhancements.
Bristol’s program to gain market share, increase profitability
and expand its international presence is anchored by
superior new product innovations. Key new products
provide customers with increased efficiencies, lower sound
levels, better reliability and greater flexibility.
Advances in Twin Single (TS) and scroll compressor
technologies are driving next generation products that will
sustain revenue growth well into the future. TS compressor
technology will be especially beneficial for OEM customers.
Unitary Products Group – Residential and Light Commercial Products
York continues to build a stronger position in the market
for cooling and heating systems for homes, apartments and
small commercial facilities. Well-respected brand names
such as York, Coleman and Luxaire are sold directly through
company branches and through a worldwide network of
independent distributors.
Revenue rose 4% in 1999, while operating income was 11%
higher, boosted by ongoing initiatives to reduce costs and
improve margins. The company is emphasizing new
products developed for local markets and specialized
applications. Mini-split sales are increasing worldwide. The
Predator line for commercial rooftop installation is
expanding York’s market position. The new Stealth
residential air conditioner employs TS technology from
Bristol. An efficient new gas furnace system tailored for
manufactured housing was introduced in 1999.
Expanding its distribution network is a key initiative,
supported by a focus on strengthening its marketing and
sales activities.
Engineered Systems Products Group
Integrated systems provide comfort cooling, heating, air and
noise filtration for millions of people in office buildings,
manufacturing plants, schools, hospitals, shopping malls
and other types of commercial facilities around the world.
Products include chillers, packaged HVAC systems, air
handling and noise filtration equipment, as well as HVAC
and refrigeration systems for marine vessels. York also
operates the largest HVAC maintenance, repair and retrofit
aftermarket service in the world.
1999 results were mixed across worldwide markets. Revenue
grew 4% and operating income declined 8%. Good
performance in the chiller and service business was offset by
a decline in the performance of the air handling business
and Latin America. Aftermarket results continued to be
strong.
New products are gaining increased market acceptance. New
product introductions and operational improvements are
key to improving financial performance in the future.
Refrigeration Products Group
York custom designs refrigeration systems for processing
and storing a wide range of food products and for vital
industrial applications throughout the world. York’s systems
serve businesses in the electronic, pharmaceutical,
petrochemical, textile, food and beverage and numerous
other industries. Refrigeration systems are found at
numerous sports venues worldwide, including the
International Olympic Games.
Products include screw and reciprocating compressors,
condensers, evaporators, heat transfer equipment, pressure
vessels, packaged refrigeration systems, hygienic air handling
and distribution systems and gas compression and carbon
dioxide systems.
Through the acquisition of Sabroe A/S, York became the
world leader in industrial refrigeration systems, nearly
doubling its sales in 1999, while raising operating income by
over 60%. Synergies from the acquisition will result in
improved revenue and profits. Actions include integrating
the best products of the combined companies, capturing
manufacturing efficiencies, gaining economies of scale and
capitalizing on a larger and stronger distribution network.

“We will unburden, streamline,
energize and challenge this workforce
like few other companies will ever do...
A motivated and energized workforce
is truly an unbeatable asset.”
54York International Corporation 1999 Annual ReportYork International Corporation 1999 Annual Report
By any definition, York is truly a global leader in the heating, ventilation, air
conditioning and refrigeration industry. In market position, we are first or among the
top providers in each major industry segment. We operate three $1 billion-plus
businesses with total revenues that will exceed $4 billion in 2000.
Essentially an engineering company, York has products that are highly competitive in the
marketplace. They are well received by homeowners, developers of office complexes,
energy and chemical companies, pharmaceutical producers, food processors, government
agencies, retail stores, schools and legions of other customers. Building off this customer
base, we run the largest HVAC&R aftermarket service organization in the world. With
nearly half our revenues coming from outside the U.S., we are very well positioned in the
global marketplace.
We expect to grow significantly in the years ahead. Our products and services are
becoming increasingly essential to the economy and society. Heating, air conditioning
and refrigeration are no longer luxury items in most parts of the world. The markets we serve will continue to provide growth
opportunities well into the future, through a combination of new and replacement installations and service requirements. Add
to that our belief that we can achieve meaningful market share growth and it is easy to see why the future of York International
is bright indeed!
Guiding Principles
We are guided by certain principles and strategies that will enable us to achieve our financial targets. These include
streamlining operations, decentralizing businesses, continuing the stream of innovative products and employing the best talent
in the industry.
Emphasis on Cost
Our company will pay very close attention to the cost side of our business. No operating expense will be considered
insignificant or left unscrutinized. Our organization will be properly staffed in all areas, but kept lean and fast on its feet.
Unnecessary activities are being identified and eliminated. We will simplify, standardize and rationalize all our product lines
To Our Stockholders
Michael R. YoungPresident and Chief Executive Officer

76York International Corporation 1999 Annual ReportYork International Corporation 1999 Annual Report
When we compare ourselves to our major competition, we realize that many of them are high-performance, multi-talented
organizations, just as we are. So what makes us think that we can perform better than they can? I think that one of our most
important advantages lies in the way we deal with our single greatest asset, our workforce. We are fully committed to the well-
being and the satisfaction of our employees. Increasing our employee communication efforts and many other employee-
focused initiatives will be commonplace throughout our company. Honesty, fairness, courtesy, dignity, respect, consideration
and appreciation are not just words to us. They are concepts that we practice and emphasize every day. We will unburden,
streamline, energize and challenge this workforce like few other companies will ever do. This will give us an advantage that will
separate us from our competition. A motivated and energized workforce is truly an unbeatable asset.
Our Performance
We are not satisfied with our 1999 results. With Sabroe, revenue increased from $3.3 billion to $3.9 billion. Earnings
declined mainly as a result of Sabroe integration costs, restructuring costs and higher expenses in our air handling and Latin
American operations. Actions to address these issues have begun and are on track. While York remains a solidly profitable
company with excellent cash flow, we certainly can and will do better. We have set realistic goals for the Year 2000 with every
expectation of meeting them.
York is a company with a tremendous future. We have all of the ingredients required to excel: great products, excellent
manufacturing facilities, strong brand names, a global presence and a talented workforce. Capitalizing on these strengths, we
will continue to advance our leadership position.
Robert N. Pokelwaldt retired near the end of 1999 as Chairman and Chief Executive Officer. His contributions over many
years were numerous and his leadership was instrumental in helping York become a major worldwide player in the heating,
ventilation, air conditioning and refrigeration industry. We wish him well in his retirement.
and services. Manufacturing costs will continue to decrease as we achieve ever greater efficiencies and continue to add “just-in-
time” manufacturing capabilities everywhere it makes sense. Our highly successful supply chain management initiatives will
continue in the future, with operating units playing an ever-increasing role.
Our operating and geographic units will become more autonomous and we are streamlining our corporate functions. This
change to a more decentralized organization will reduce administrative and overhead expenses because our business units
already are very self-sufficient.
Our continuous improvement efforts are centered around driving responsibility to the business units. We will become more
focused on fundamental concepts that will be clearly understood by the entire organization. For example, employees are being
encouraged to continuously seek better ways of doing their job. They are challenged to evaluate new ideas and take risks. They
need to recognize that as they push the edge of the envelope, failure will sometimes occur in the pursuit of better methods.
Emphasis on Product
One of our greatest strengths is our very broad and truly outstanding product line. But as good as this product line is, we
often find that other companies also have a very competitive product offering. Therefore, more than ever before, we will focus
on developing truly innovative and technologically superior products. There is nothing that is more important to the success
of our long-term strategy. If we do not have the products that our customers want, we will be unable to seize the market
opportunities that their needs present.
We have many technologically advanced new products that have been recently introduced or are now coming to market. The
new Predator commercial rooftop line leads the industry in efficiency and features, while the Stealth series residential air
conditioner offers better humidity control and quieter operation. Bristol’s Twin Single compressor technology expands our
market opportunities with OEM’s, offering advantages in efficiency, sound, humidity control and reliability. Next Generation
scroll compressors are smaller, quieter and more reliable. A new chiller line addresses the industry’s move toward air-cooled
systems and the Millennium centrifugal chiller has increased our large tonnage chiller market share. A new line of underfloor
air distribution units offers customers more flexibility and improved indoor air quality.
The Sabroe acquisition enables us to combine the best of York, Sabroe and Frick brands to create a very competitive line of
refrigeration systems. Recently introduced refrigeration products offer important reliability improvements and energy savings.
Included in this line are mid- and high-range screw compressor packages with lower cost variable speed drives.
Focusing on York’s Employees
We will surround ourselves with only the very best people. Our single most important job is to identify the very best talent, put
them in place and clear a path for them to perform. Our operating divisions and geographic units are now headed by
seasoned, proven, energetic and dedicated professionals, all of whom have a great deal of experience in our industry. I have
complete confidence in their abilities.
Mike YoungPresident and Chief Executive OfficerMarch 15, 2000

98York International Corporation 1999 Annual ReportYork International Corporation 1999 Annual Report
Engineered Systems Group
The results for large engineered HVAC and air handling systems were mixed in 1999. Overall, revenue for the Engineered
Systems Group (ESG) was up nearly 4% and operating income fell 8%. Good performance in the chiller and service business
was offset by a decline in the performance of the air handling business and Latin America.
Aftermarket service operations provide maintenance, repair, parts replacement, retrofits and replacement systems for customers.
Aftermarket revenue and earnings continue to grow and are major positive contributors to ESG results, fueled by a large and
growing installed equipment base.
Service 2000 is a new initiative aimed at strengthening ESG’s capabilities by expanding its global team of professional
technicians and providing increased support. Upgrading equipment, automating administrative processes and improving
communications enables ESG to deliver higher levels of service.
Difficulties in consolidating airside plants during 1999 resulted in higher costs and product delivery delays, adversely
impacting revenue and earnings. Initiatives now in place include improved manufacturing processes and personnel upgrades.
New products utilizing York’s rich technology and engineering experience are key to capturing market share. The Millennium
centrifugal chiller line featuring the Optiview Control Center continues to be well received by customers. ESG’s new air-
cooled packaged chiller products are becoming a popular choice for the growing medium size application market. A new line
of underfloor air distribution units was also introduced recently. It offers the customer major benefits, including flexibility in
placement and rearrangement, better personal comfort control, and improved indoor air quality.
Manufacturing efficiency is a top priority, evidenced by the implementation of continuous improvement, just-in-time
capabilities, supply chain management and similar programs.
ESG has excellent opportunities to deliver integrated systems to customers that satisfy total environmental needs and meet
indoor air quality and noise control standards. ESG continues to win contracts for new installations of global stature. Notable
examples in 1999 were systems installed at the new Pudong airport in Shanghai and the Kingdom Trade Center, soon to be the
tallest building in the Middle East.
“…employees are being encouraged to
continuously seek better ways of doing their job.
They are challenged to evaluate new ideas
and take risks.”
Review of Operations

1110York International Corporation 1999 Annual ReportYork International Corporation 1999 Annual Report
Unitary Products Group – Bristol Compressors
Bristol’s focus on new products and productivity enhancements, coupled with warmer weather, led to market share, revenue
and operating income gains in 1999. Revenues grew 9% and operating income grew 11%. Both the Bristol Compressor
operations and the Scroll Technologies joint venture recorded gains.
Bristol’s focus remains on introducing revolutionary new products, implementing cost improvement initiatives, expanding its
international presence and relying on the ingenuity and expertise of its employees to drive continuous improvement.
Innovative new products provide a competitive advantage in the unitary compressor market. New product innovations are the
cornerstone of an initiative to gain market share, increase profitability and expand Bristol’s international presence.
Twin-Single (TS) compressor technology expands Bristol’s market opportunities. It offers significant design advantages in the
areas of higher operating efficiencies, reduced noise, increased reliability, improved humidity control and, in the case of some
heat pump systems, significantly higher heat output. It also offers the ability to design systems with much broader building
application potential. In addition, TS technology will be adapted for residential refrigerator compressors, an 80-million-unit
global market.
Next Generation scroll compressor products position the company to capture sizable market share as users recognize the array
of important new design features – significantly quieter operation, smaller physical size for greater installation flexibility, one-
third fewer parts, fewer welds, and changes to improve reliability. This new scroll compressor advances the scroll offering
beyond anything else available in the industry and provides significant advantages in global markets.
Continuous improvements such as streamlining work flow, implementing just-in-time parts and materials systems and gaining
the cost benefits of supply chain management have generated substantial gains in operating efficiencies. Productivity increased
by more than 6% at Bristol’s facilities. Reduced material costs and manufacturing improvements also produced substantial
benefits in 1999.
Scroll Technologies made substantial financial progress by increasing production, successfully launching new products and
focusing on the cost structure. It continues to make significant progress in product development, supply chain management
and operating efficiencies.
Unitary Products Group – Residential and Light Commercial Products
Attractive product enhancements and warmer weather across the globe helped boost unitary equipment revenue in 1999 and
gains in operating efficiencies led to substantially higher profitability. Revenue grew 4% and operating income increased 11%,
reflecting gains in product lines for both residential and light commercial applications.
Three major initiatives are driving improved performance: rolling out superior new products tailored to local markets,
implementing cost improvement initiatives in both manufacturing and administrative operations and expanding the
distribution network.
New products are giving York a competitive advantage in the unitary market. The Predator commercial rooftop line leads the
industry in efficiency and value-added features. The Stealth series residential air conditioner, utilizing Bristol’s TS
compressor technology, is an industry first, offering improved efficiency, quieter operation and better humidity control. An
entirely new gas furnace designed specifically for the manufactured housing market positions the Coleman brand furnace as
state-of-the-art. The company’s mini-split product line has been expanded to better serve the 25-million-unit global market.
New product innovations will continue to be a focus and will lead to enhanced margins, improved product mix, and most of
all, a delighted customer.
Operating efficiencies are improving. Productivity rose by nearly 6% in 1999. Key initiatives for further improvement include
streamlining work flow, implementing just-in-time parts and materials systems into various processes, and gaining additional
cost benefits from supply chain management.
Programs are underway to expand the distribution network and create a more effective marketing capability. New distributors
and sales offices have been added worldwide, especially in North America. Marketing efforts are aimed at important and
growing market segments, including contracting specialists, manufactured housing customers and the aftermarket.
In addition to best-in-class products, distributors enjoy added benefits, flexibility and a support network to augment their
efforts. The York Liberties Plan puts the buying power and resources of York International behind independent dealers who
make a commitment to sell and install York HVAC equipment. Programs like payroll administration, medical and dental
benefits, fleet leasing, consumer financing, and much more are available to dealers under this program. This strong marketing
and sales program makes York an attractive choice.
12York International Corporation 1999 Annual Report
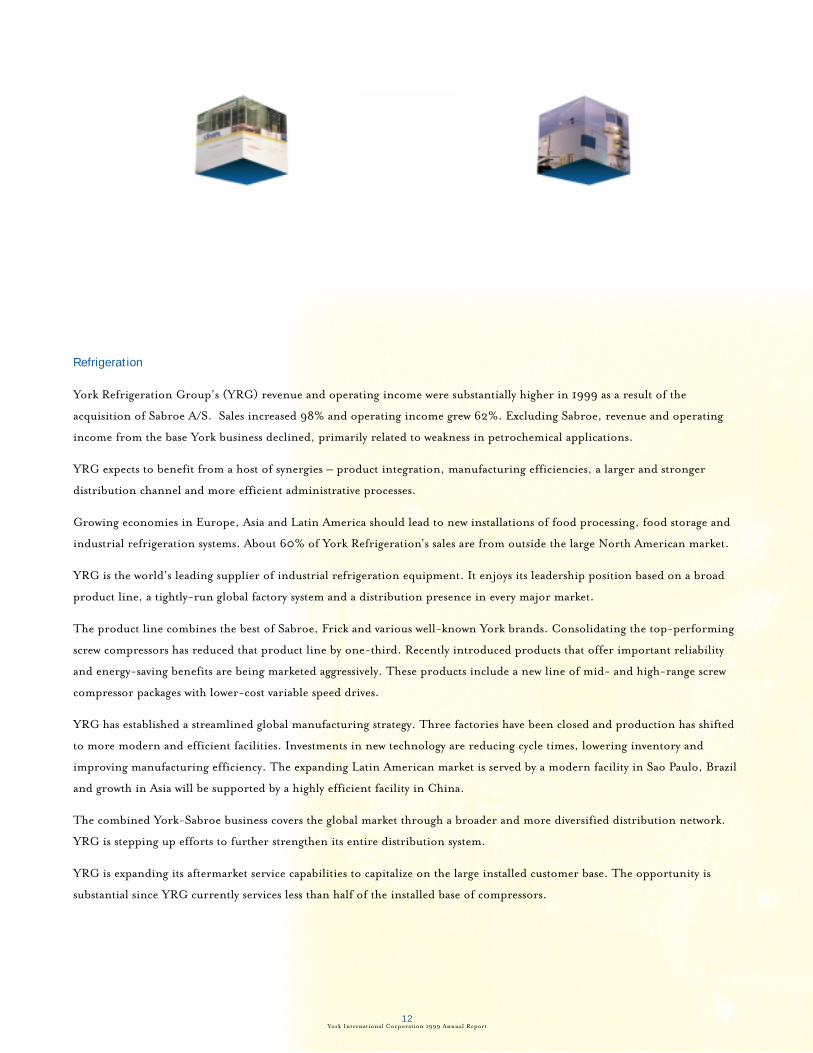
Refrigeration
York Refrigeration Group’s (YRG) revenue and operating income were substantially higher in 1999 as a result of the
acquisition of Sabroe A/S. Sales increased 98% and operating income grew 62%. Excluding Sabroe, revenue and operating
income from the base York business declined, primarily related to weakness in petrochemical applications.
YRG expects to benefit from a host of synergies – product integration, manufacturing efficiencies, a larger and stronger
distribution channel and more efficient administrative processes.
Growing economies in Europe, Asia and Latin America should lead to new installations of food processing, food storage and
industrial refrigeration systems. About 60% of York Refrigeration’s sales are from outside the large North American market.
YRG is the world’s leading supplier of industrial refrigeration equipment. It enjoys its leadership position based on a broad
product line, a tightly-run global factory system and a distribution presence in every major market.
The product line combines the best of Sabroe, Frick and various well-known York brands. Consolidating the top-performing
screw compressors has reduced that product line by one-third. Recently introduced products that offer important reliability
and energy-saving benefits are being marketed aggressively. These products include a new line of mid- and high-range screw
compressor packages with lower-cost variable speed drives.
YRG has established a streamlined global manufacturing strategy. Three factories have been closed and production has shifted
to more modern and efficient facilities. Investments in new technology are reducing cycle times, lowering inventory and
improving manufacturing efficiency. The expanding Latin American market is served by a modern facility in Sao Paulo, Brazil
and growth in Asia will be supported by a highly efficient facility in China.
The combined York-Sabroe business covers the global market through a broader and more diversified distribution network.
YRG is stepping up efforts to further strengthen its entire distribution system.
YRG is expanding its aftermarket service capabilities to capitalize on the large installed customer base. The opportunity is
substantial since YRG currently services less than half of the installed base of compressors.

Independent Auditors’ Report
The Board of Directors and Stockholders, York International Corporation:
We have audited the accompanying consolidated balance sheets of York International Corporation and subsidiaries as of
December 31, 1999 and 1998, and the related consolidated statements of operations, comprehensive income, cash flows and
stockholders’ equity for each of the years in the three-year period ended December 31, 1999. These consolidated financial
statements are the responsibility of the Company’s management. Our responsibility is to express an opinion on these
consolidated financial statements based on our audits.
We conducted our audits in accordance with generally accepted auditing standards. Those standards require that we plan and
perform the audit to obtain reasonable assurance about whether the financial statements are free of material misstatement.
An audit includes examining, on a test basis, evidence supporting the amounts and disclosures in the financial statements. An
audit also includes assessing the accounting principles used and significant estimates made by management, as well as evaluating
the overall financial statement presentation. We believe that our audits provide a reasonable basis for our opinion.
In our opinion, the consolidated financial statements referred to above present fairly, in all material respects, the financial
position of York International Corporation and subsidiaries as of December 31, 1999 and 1998, and the results of their
operations and their cash flows for each of the years in the three-year period ended December 31, 1999, in conformity with
generally accepted accounting principles.
Harrisburg, Pennsylvania
February 17, 2000
Management’s Report on Financial Statements
To the Stockholders of York International Corporation:
The management of York International Corporation is responsible for the preparation of the accompanying financial
statements. In management’s opinion, the financial statements have been prepared in conformity with generally accepted
accounting principles. The Company believes that the accounting systems and related controls that it maintains are sufficient to
provide reasonable assurance that financial records are reliable for preparing financial statements and maintaining account-
ability for assets. These systems and controls are tested and evaluated regularly by the Company’s internal auditors as well as by
the independent auditors in connection with their annual audit.
The directors of York International Corporation have established an Audit Committee currently comprised of four outside
directors. The Audit Committee meets with management, the internal auditors and the independent auditors and monitors
generally the accounting affairs of the Company. The Audit Committee also recommends to the stockholders the selection of
the independent auditors.
Michael R. Young C. David Myers Charles F. Cargile
President and Vice President and Vice President, Finance and
Chief Executive Officer Chief Financial Officer Corporate Development
February 17, 2000
13York International Corporation 1999 Annual Report
Management’s Report on Financial Statements and Independent Auditors’ Report
14York International Corporation 1999 Annual Report
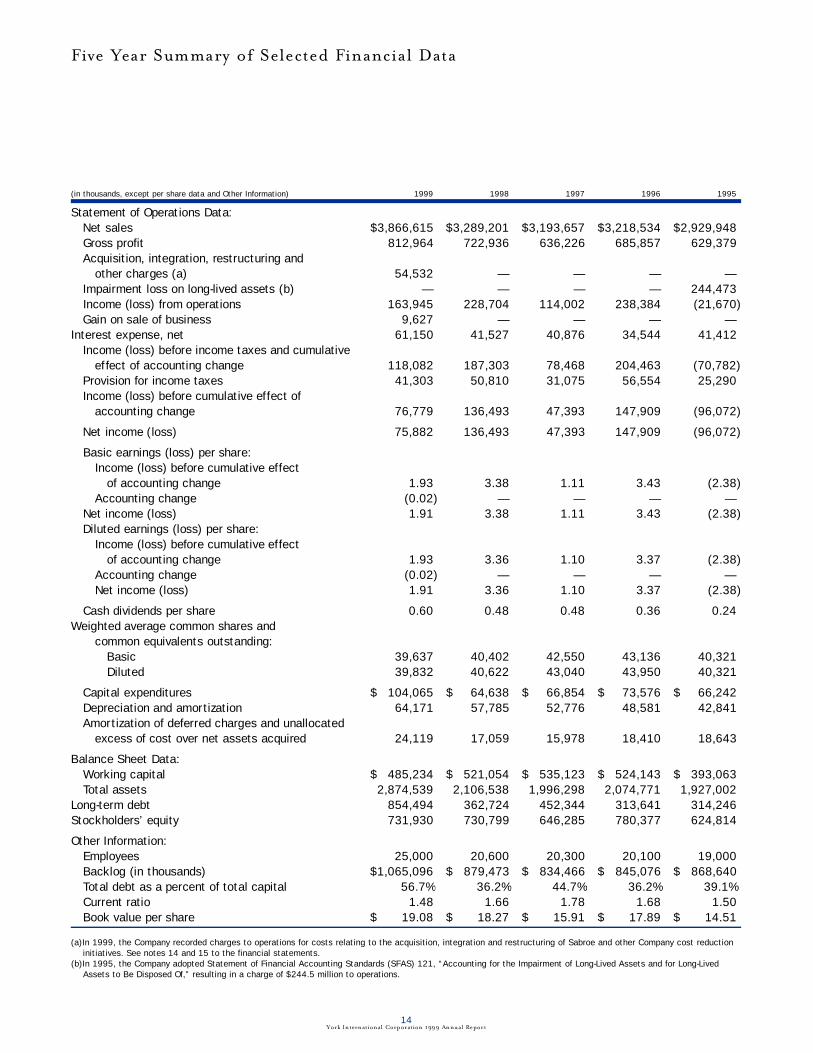
Five Year Summary of Selected Financial Data
(in thousands, except per share data and Other Information) 19991 19981 19971 19961 19951
Statement of Operations Data:Net sales $ 3 , 8 6 6 , 6 1 5) $ 3 , 2 8 9 , 2 0 1) $ 3 , 1 9 3 , 6 5 7) $ 3 , 2 1 8 , 5 3 4) $ 2 , 9 2 9 , 9 4 8)G ross pro f i t 8 1 2 , 9 6 4) 7 2 2 , 9 3 6) 6 3 6 , 2 2 6) 6 8 5 , 8 5 7) 6 2 9 , 3 7 9)Acquisition, integration, re s t ructuring and
other charges (a) 5 4 , 5 3 2) —) —) —) —)I m p a i rment loss on long-lived assets (b) —) —) —) —) 2 4 4 , 4 7 3)Income (loss) from operations 1 6 3 , 9 4 5) 2 2 8 , 7 0 4) 1 1 4 , 0 0 2) 2 3 8 , 3 8 4) ( 2 1 , 6 7 0 )Gain on sale of business 9 , 6 2 7) —) —) —) —)
I n t e rest expense, net 6 1 , 1 5 0) 4 1 , 5 2 7) 4 0 , 8 7 6) 3 4 , 5 4 4) 4 1 , 4 1 2)Income (loss) before income taxes and cumulative
e ffect of accounting change 1 1 8 , 0 8 2) 1 8 7 , 3 0 3) 7 8 , 4 6 8) 2 0 4 , 4 6 3) ( 7 0 , 7 8 2 )P rovision for income taxes 4 1 , 3 0 3) 5 0 , 8 1 0) 3 1 , 0 7 5) 5 6 , 5 5 4) 2 5 , 2 9 0)Income (loss) before cumulative effect of
accounting change 7 6 , 7 7 9) 1 3 6 , 4 9 3) 4 7 , 3 9 3) 1 4 7 , 9 0 9) ( 9 6 , 0 7 2 )
Net income (loss) 7 5 , 8 8 2) 1 3 6 , 4 9 3) 4 7 , 3 9 3) 1 4 7 , 9 0 9) ( 9 6 , 0 7 2 )
Basic earnings (loss) per share :Income (loss) before cumulative effect
of accounting change 1 . 9 3) 3 . 3 8) 1 . 1 1) 3 . 4 3) ( 2 . 3 8 )Accounting change ( 0 . 0 2 ) —) —) —) —)
Net income (loss) 1 . 9 1) 3 . 3 8) 1 . 1 1) 3 . 4 3) ( 2 . 3 8 )Diluted earnings (loss) per share :
Income (loss) before cumulative effect of accounting change 1 . 9 3) 3 . 3 6) 1 . 1 0) 3 . 3 7) ( 2 . 3 8 )
Accounting change ( 0 . 0 2 ) —) —) —) —)Net income (loss) 1 . 9 1) 3 . 3 6) 1 . 1 0) 3 . 3 7) ( 2 . 3 8 )
Cash dividends per share 0 . 6 0) 0 . 4 8) 0 . 4 8) 0 . 3 6) 0 . 2 4)Weighted average common shares and
common equivalents outstanding:B a s i c 3 9 , 6 3 7) 4 0 , 4 0 2) 4 2 , 5 5 0) 4 3 , 1 3 6) 4 0 , 3 2 1)D i l u t e d 3 9 , 8 3 2) 4 0 , 6 2 2) 4 3 , 0 4 0) 4 3 , 9 5 0) 4 0 , 3 2 1)
Capital expenditure s $, 01 0 4 , 0 6 5) $0 , 06 4 , 6 3 8) $0 , 06 6 , 8 5 4) $0 , 07 3 , 5 7 6) $0 , 06 6 , 2 4 2)D e p reciation and amort i z a t i o n 6 4 , 1 7 1) 5 7 , 7 8 5) 5 2 , 7 7 6) 4 8 , 5 8 1) 4 2 , 8 4 1)A m o rtization of deferred charges and unallocated
excess of cost over net assets acquire d 2 4 , 1 1 9) 1 7 , 0 5 9) 1 5 , 9 7 8) 1 8 , 4 1 0) 1 8 , 6 4 3)
Balance Sheet Data:Working capital $0 ,4 8 5 , 2 3 4) $0 ,5 2 1 , 0 5 4) $0 ,5 3 5 , 1 2 3) $0 ,5 2 4 , 1 4 3) $0 ,3 9 3 , 0 6 3)Total assets 2 , 8 7 4 , 5 3 9) 2 , 1 0 6 , 5 3 8) 1 , 9 9 6 , 2 9 8) 2 , 0 7 4 , 7 7 1) 1 , 9 2 7 , 0 0 2)
L o n g - t e rm debt 8 5 4 , 4 9 4) 3 6 2 , 7 2 4) 4 5 2 , 3 4 4) 3 1 3 , 6 4 1) 3 1 4 , 2 4 6)Stockholders’ equity 7 3 1 , 9 3 0) 7 3 0 , 7 9 9) 6 4 6 , 2 8 5) 7 8 0 , 3 7 7) 6 2 4 , 8 1 4)
Other Inform a t i o n :E m p l o y e e s 2 5 , 0 0 0) 2 0 , 6 0 0) 2 0 , 3 0 0) 2 0 , 1 0 0) 1 9 , 0 0 0)Backlog (in thousands) $ 1 , 0 6 5 , 0 9 6) $0 ,8 7 9 , 4 7 3) $0 ,8 3 4 , 4 6 6) $0 ,8 4 5 , 0 7 6) $0 ,8 6 8 , 6 4 0)Total debt as a percent of total capital 5 6 . 7 %) 3 6 . 2 %) 4 4 . 7 %) 3 6 . 2 %) 3 9 . 1 %)C u rrent ratio 1 . 4 8) 1 . 6 6) 1 . 7 8) 1 . 6 8) 1 . 5 0)Book value per share $0 0 , 01 9 . 0 8) $0 , 0 01 8 . 2 7) $0 , 0 01 5 . 9 1) $0 , 0 01 7 . 8 9) $0 , 0 01 4 . 5 1)
(a)In 1999, the Company recorded charges to operations for costs relating to the acquisition, integration and restructuring of Sabroe and other Company cost reductioninitiatives. See notes 14 and 15 to the financial statements.
(b)In 1995, the Company adopted Statement of Financial Accounting Standards (SFAS) 121, “Accounting for the Impairment of Long-Lived Assets and for Long-LivedAssets to Be Disposed Of,” resulting in a charge of $244.5 million to operations.

15York International Corporation 1999 Annual Report
RESULTS OF OPERATIONSThe following table sets forth sales by product group and geographic marke t :
Net Sales(in thousands) 19991 19981 19971
Unitary Products Group:Bristol Compressors $0,579,686) $0,529,809) $0,504,024)Residential and light commercial products 1,098,514) 1,055,627) 964,648)Intragroup compressor sales (108,721) (103,676) (76,294)
1,569,479) 1,481,760) 1,392,378)Engineered Systems Group 1,460,736) 1,408,091) 1,396,436)York Refrigeration Group 883,609) 447,499) 447,093)Eliminations (47,209) (48,149) (42,250)
Net Sales $3,866,615) $3,289,201) $3,193,657)
U.S. 52%) 58%) 58%)International 48%) 42%) 42%)
Total 100%) 100%) 100%)
In June 1997, the Financial Accounting Standards Board (FASB) issued SFAS No. 131, “Disclosure about Segments of an Enterprise and
Related Information.” This statement re q u i res the Company to report certain financial and other information about its business
segments, products and services, the geographic areas in which it operates and its major customers. The objective of this statement is to
help users of financial statements better understand the enterprise’s performance, better assess its prospects for future net cash flows and
m a ke more informed judgments about the enterprise as a whole. See note 17 to the consolidated financial statements for this disclosure .
Results of Operations 1999 as Compared with 1998Sales for the year ended December 31, 1999 increased 17.6% to $3,866.6 million from $3,289.2 million for 1998. (See table above
which shows sales by business segment and geographic market, and note 17 to the consolidated financial statements for additional
information.) Sales levels increased for all business groups. Order backlog at December 31, 1999 was $1,065.1 million compared to
$879.5 million as of December 31, 1998.
Unitary Products Group (UPG) sales increased 5.9% to $1,569.5 million due to improved volume in both the compressor and the
equipment businesses. Sales increases in North America, including a preseason sales incentive program, Europe and the Middle East
offset lower equipment volume in Latin America.
E n g i n e e red Systems Group (ESG) sales increased 3.7% to $1,460.7 million, primarily due to increased volume in domestic aftermarke t
service and chiller equipment sales. The increases were offset somewhat by lower airside equipment volume and the impact of the sale of
Viron, the Company’s performance contracting business.
York Refrigeration Group (YRG) sales increased 97.5% to $883.6 million. The increase was due to the acquisition of Sabroe, which
added approximately $445 million of sales to the York Refrigeration total. Excluding the impact of Sabroe, Refrigeration sales were down
in Europe and Asia primarily due to lower capital investments by petrochemical companies.
From a geographic perspective, domestic sales increased 5.5% to $2,002.4 million and international sales increased 34.1% to $1,864.2 million.
In 1999, the Company re c o rded charges in cost of goods sold of $22.4 million, primarily to write-down inventory to the lower of cost
or market. Integration of the Refrigeration business, principally discontinuation of certain Gram product lines, resulted in $6.9 million
of the inventory write-down. Deteriorating economic conditions in Latin America and Eastern Europe resulted in inventory write-downs
of $3.2 million and $4.2 million, respectively. ESG operations, primarily in the U.S. and Australia, resulted in inventory write-downs of
$1.5 million. The discontinuance of a UPG product line resulted in additional inventory write-downs of $4.6 million and warra n t y
charges of $2.0 million.
In 1999, gross profit increased 12.5% to $813.0 million (21.0% of sales) from $722.9 million (22.0% of sales) in 1998. The gross profit
dollar improvement was due to the inclusion of Sabroe for seven months, the higher margin ESG service business and improved factory
performance and cost reductions in UPG. Excluding the charges identified in the preceding para g raph, gross profit as a percentage of sales
d e c reased from 22.0% in 1998 to 21.6% in 1999. The decrease resulted primarily from ESG airside factory inefficiencies and overa l l
weakness in the airside business and in Latin America. During 1999, the Company re c o rded $6.0 million of credits to cost of goods sold
for expected recovery from business interruption insurance relating to the Grantley accident. Similar credits totaled $25.5 million in 1998.
Management’s Discussion and Analysis of Financial Condition and Results of Opera t i o n s
16York Internat ional Corporation 1999 Annual Report
Selling, General and Administrative expense (SG&A) increased 20.3% to $594.5 million (15.4% of sales) in 1999 from $494.2 million
(15.0% of sales) in 1998. The increase in amount is due to the acquisition of Sabroe, and selective investments, primarily in the first half
of the year, in engineering, product development and information technology.
In 1999, the Company re c o rded charges to operations of $54.5 million, of which $35.0 million related to the integration of Sabroe into
the York Refrigeration business and $19.5 million related to restructuring and downsizing other Company operations not impacted by
the Sabroe acquisition.
The York Refrigeration Group charges consist of non-cash write-downs of $8.2 million and other accruals of $8.7 million principally
for the closure of the Gram manufacturing facility in Denmark, the closure of duplicate sales and service offices in Europe and Asia and
w o r k f o rce reductions. Additionally, the Company re c o rded cash expenses of $12.7 million relating to the cost and loss on a curre n c y
option to fix the price of the acquisition and $5.4 million for integration expenses consisting of employee relocation, office integra t i o n
activities, product training and sign and logo changes.
The other Company charges of $19.5 million consist of non-cash write-downs of $3.6 million and other accruals of $15.9 million. The
charges relate to workforce reductions, asset write-downs, principally in Latin America and Eastern Europe due to the current economic
conditions in those regions, closing costs for the ESG Airside factory in Salisbury, North Carolina, contractual obligations and other
re c e i v a b l e s .
Income from operations in 1999 decreased to $163.9 million (4.2% of sales) from $228.7 million (7.0% of sales) in 1998. The
discussion below of each business units’ income from operations excludes all charges as discussed above.
Unitary Products Group income from operations increased 11.2% to $156.2 million (10.0% of sales) due to better performance in the
equipment and compressor businesses. Improved plant performance on higher volume, cost reduction efforts and strong mini-split
product exports from Thailand offset weakness in Latin American performance.
E n g i n e e red Systems Group income from operations decreased 8.4% to $114.7 million (7.9% of sales) due to poor performance in the
airside business and weakness in Latin America. These weaknesses were partially offset by strong year-over-year performance in
a f t e r m a r ket service operations, success in certain new product introductions and continued strength in Asia.
York Refrigeration Group income from operations increased 62.4% to $44.5 million (5.0% of sales) due to including seven months of
Sabroe earnings. Excluding Sabroe, re f r i g e ration earnings were significantly lower on a year-over-year basis due to factory inefficiencies
and overall reduced capital spending by petrochemical companies.
In 1999, the Company re c o rded a gain on the sale of Viron, the Company’s performance contracting business, of $9.6 million.
In 1999, net interest expense increased 47.3% to $61.2 million due to the impact of higher average borrowings. Excluding the Sabroe
acquisition financing, lower average debt levels and favorable average interest rates for foreign and variable debt would have contributed to
lower interest expense.
Equity in earnings of affiliates was $5.7 million in 1999 as compared to $0.1 million in 1998. The improvement was primarily the re s u l t
of improved performance in the UPG Scroll Technologies Compressor opera t i o n .
Provision for income taxes of $41.3 million for 1999 relates to both U.S. and non-U.S. operations. The effective rate was 35% for 1999
c o m p a red to 27.1% (33% excluding export incentives, foreign tax credit planning and other non-U.S. activities including closures and
consolidations) for 1998. The increase in the effective tax rate is primarily attributable to integration and restructuring charges in certain
jurisdictions for which no tax benefit was re c o rd e d .
Net income, as a result of the above factors, was $75.9 million in 1999 as compared to $136.5 million in 1998.
Results of Operations 1998 as Compared with 1997Sales for the year ended December 31, 1998 increased 3.0% to $3,289.2 million from $3,193.7 million for 1997. (See table on page 15
which shows sales by business segment and geographic market, and note 17 to the consolidated financial statements for additional
information.) Sales levels increased for all business groups. Order backlog at December 31, 1998 was $879.5 million compared to $834.5
million as of December 31, 1997.
Unitary Products Group sales increased 6.4% to $1,481.8 million, primarily due to improved volume in the unitary equipment marke t s
in North America and Latin America and continued growth and expansion in Latin American marke t s .
E n g i n e e red Systems Group sales increased 0.8% to $1,408.1 million, primarily due to increased volume in the domestic service and
equipment business and continued growth and expansion in Latin America. These increases were offset by a decline in the Asian marke t
and lost sales as a result of the accident at the Grantley factory in York, PA. (See additional disclosure in note 16 to the consolidated
financial statements.)

York Refrigeration Group sales were basically flat at $447.5 million, primarily due to the sale of the German Commercial Refrigera t i o n
business in the second quarter of 1997. Excluding the sale of this business, re f r i g e ration product sales improved approximately 6%
primarily due to stronger sales levels in the second half of 1998 in Europe and North America.
From a geographic perspective, domestic sales increased 3.2% to $1,898.6 million and international sales increased 2.6% to $1,390.6 million.
Gross profit in 1998 increased 13.6% to $722.9 million (22.0% of sales) from $636.2 million (19.9% of sales) in 1997. Excluding the
n o n - recurring items in 1997, gross profit as a percent of sales increased 120 basis points. This improvement is due to the performance of
the Unitary Products Group, improved performance in manufacturing operations, product mix, and other cost reduction measure s .
During 1998, the Company re c o rded credits to cost of goods sold of $25.5 million reflecting expected insurance recovery for certain
i n c remental expenses and losses included in cost of goods sold as a result of the Grantley accident.
Selling, General and Administrative expense (SG&A) decreased 5.4% to $494.2 million (15.0% of sales) in 1998 from $522.2 million
(16.4% of sales) in 1997. Excluding the non-recurring items in 1997, SG&A as a percent of sales was flat.
Income from operations in 1998 increased to $228.7 million (7.0% of sales) from $114.0 million (3.6% of sales) in 1997. Excluding the
n o n - recurring items in 1997, operating income as a percent of sales increased 120 basis points.
Unitary Products Group income from operations increased 36.8% to $140.5 million (9.5% of sales), primarily due to increased volume
in the unitary equipment markets in North America and Latin America, improved plant performance, effective implementation of cost
reduction programs and continued growth and expansion in Latin American markets.
E n g i n e e red Systems Group income from operations increased 5.8% to $125.2 million (8.9% of sales), primarily due to increased volume
and performance in the domestic service and equipment business and continued growth and expansion in Latin America. These incre a s e s
w e re offset by the decline in the Asian market and profits on lost sales as a result of the accident at the Grantley factory.
York Refrigeration Group income from operations increased 20.6% to $27.4 million (6.1% of sales), primarily due to stronger
performance domestically and in Europe in both sales and factory performance. SG&A expenditures were reduced by effective control of
spending in all regions and the sale of the German Commercial Refrigeration business.
In 1998, net interest expense increased 1.6% to $41.5 million due to the impact of higher average borrowing rates offset by the benefit of
reduced working capital levels.
Equity in earnings of affiliates was $0.1 million in 1998 as compared to $5.3 million in 1997. The 1997 earnings include a net gain of $4.5
million relating to the gain on the sale of an Egyptian air conditioning company reduced by a portion of the non-recurring charge in 1997.
Provision for income taxes of $50.8 million for 1998 relates to both U.S. and non-U.S. operations. The effective rate is 27.1% and reflects a
n o n - recurring benefit re c o rded in the third quarter relating to export incentives, foreign tax credit planning and other activities outside the
U.S., including closures and consolidations. Excluding the non-recurring benefit, the Company’s effective tax rate would have been 33%.
Net income, as a result of the above factors, was $136.5 million in 1998 as compared to $47.4 million in 1997.
LIQUIDITY AND CAPITAL RESOURCESWorking capital re q u i rements are generally met through a combination of internally generated funds, bank lines of credit, commerc i a l
paper issuances, financing of trade receivables and credit terms from suppliers which approximate receivable terms to the Company’s
customers. The Company believes that these sources, including its $400 million 364-day Revolver and its $500 million Amended Cre d i t
A g reement described below, will be sufficient to meet working capital needs during 2000. Additional sources of working capital include
customer deposits and progress payments.
Working capital was $485.2 million and $521.1 million as of December 31, 1999 and 1998, respectively. Accounts receivable increased in
1999 due to the addition of Sabroe and the UPG sales incentive program including extended terms. These increases were slightly offset by
d e c reases in ESG and the additional $75 million of receivables sales. Inventory levels were higher at December 31, 1999, than at
December 31, 1998, due to the acquisition of Sabroe somewhat offset by lower inventory levels in Unitary Products. The current ratio was
1.48 at December 31, 1999, as compared to 1.66 for December 31, 1998.
Long-term indebtedness was $854.5 million at December 31, 1999, primarily consisting of borrowings of $396.8 million in commerc i a l
paper, $300.0 million of senior notes, $41.8 in bank lines and $57.2 million in Danish term loans.
At December 31, 1999, the Company had available a $400 million 364-day Revolving Credit Agreement (the Revolver) and a $500
million Amended Credit Agreement (the Credit Agreement) expiring on July 31, 2002. The Revolver and the Credit Agre e m e n t
amendment were effective on June 3, 1999 and provide for borrowings under the facility at LIBOR plus 0.45%. If borrowings gre a t e r
than 33% of either facility are utilized, the rate increases to LIBOR plus 0.55%. The Company pays a fee of 0.10% for each facility and
the Credit Agreement allows for borrowings at specified bid rates. At December 31, 1999, the LIBOR rate was 6.03%. The Revolver and
the Credit Agreement, as amended, contain financial and operating covenants requiring the Company to maintain certain financial ra t i o s
17York International Corporation 1999 Annual Report

18York International Corporat ion 1999 Annual Report
and standard provisions limiting leverage, investments and liens. The Company was in compliance with these financial and opera t i n g
covenants at December 31, 1999. No amounts were outstanding under either of these agre e m e n t s .
The Company’s bank lines provide for total borrowings of $175 million which are expected to be reborrowed in the ordinary course of business.
At December 31, 1999 and 1998, the Company had $41.8 million and $41.0 million, respectively, outstanding under these bank lines.
C o m m e rcial paper borrowings are expected to be reborrowed in the ordinary course of business. Commercial paper borrowings were also
the primary source of funds used to finance the acquisition of Sabroe A/S. The interest rate on the commercial paper was 6.08% as of
December 31, 1999.
At December 31, 1999 and 1998, the Company had $300 million of Senior Notes outstanding. On June 1, 1998, the Company issued
$200 million of 6.70% fixed rate Senior Notes having a maturity of ten years from the date of issue. The remaining $100 million 10-year
Senior Notes bear interest at a 6.75% fixed rate and are due March 2003.
The Company maintains foreign currency term loans at December 31, 1999, of $71.5 million payable in semi-annual payments of
$7.15 million. These term loans are due July 2004 and bear interest at an average rate of 4.12%.
Concerning bank loans and other, the Company’s non-U.S. subsidiaries maintain bank credit facilities in various currencies that
provided for available borrowings of $385.1 million and $269.6 million at December 31, 1999 and 1998, respectively, of which
$295.1 million and $202.9 million, respectively, were unused. In some instances, borrowings against these credit facilities have been
guaranteed by the Company to assure availability of funds at favorable rates. The Company also maintains other debt of $57.2 million
and $7.6 million at December 31, 1999 and 1998, respectively.
The Company established a receivables sales agreement in 1992. Under an Amended and Restated Receivables Sales Agreement entere d
into on December 22, 1999, the maximum amount of the purchasers’ investment increased from $150 million to $175 million and is
subject to decrease based on the level of eligible accounts receivable and restrictions on concentrations of receivables. The balance of the
sold accounts receivable was $175 million and $100 million at December 31, 1999 and 1998, respectively. The sold accounts receivable are
reflected as a reduction of receivables in the accompanying consolidated balance sheets. The discount rate on the receivables sold was
approximately 6.22% and 5.30% at December 31, 1999 and 1998, re s p e c t i v e l y .
In December 1999, the Company sold certain machinery and equipment resulting in net proceeds of $82.4 million and entered into a
five year lease for the use of the equipment. At the end of the lease term, the Company may purchase the equipment, return the
equipment to the lessor, or extend the lease for up to five additional years. If the Company chooses to return the equipment at the end of
the initial lease term, the Company is obligated to pay the lessor a maximum of $33.8 million.
Because the Company’s obligations under the Amended and Restated Credit Agreement and Receivables Sales Agreement bear interest at
floating rates, the Company’s interest costs are sensitive to changes in prevailing interest ra t e s .
Based on historical cash flows, the Company believes that it will be able to satisfy its principal and interest payment obligations and its working
capital and capital expenditure re q u i rements from operating cash flows together with the availability under the revolving credit facility.
In the ordinary course of business, the Company enters into various types of transactions that involve contracts and financial instruments
with off-balance-sheet risk. The Company enters into these financial instruments to manage financial market risk, including fore i g n
exchange, commodity price and interest rate risk. The Company enters into these financial instruments utilizing over-the-counter as
opposed to exchange traded instruments. The Company mitigates the risk that counterparties to these over-the-counter agreements will
fail to perform by only entering into agreements with major international financial institutions. Financial instruments are more fully
discussed in note 2 to the consolidated financial statements and under the caption Market Risk on page 19.
Capital expenditures were $104.1 million in 1999 as compared to $64.6 million in 1998. The increase was the result of seven months of
Sabroe capital spending, the Grantley rebuild, planned projects to improve factory performance and information technology capital
projects. Capital expenditures currently anticipated for expanded capacity, cost reductions and the introduction of new products during
2000 are expected to be in excess of depreciation and amortization. These expenditures will be funded from a combination of opera t i n g
cash flows, availability under the revolving credit facility, commercial paper borrowings and advance payments received from the insura n c e
company for accident claims submitted.
Cash dividends of $0.60 and $0.48 per share were paid on common stock in 1999 and 1998, respectively. The declaration and payment
of future dividends will be at the sole discretion of the Board of Directors and will depend upon such factors as the Company’s
profitability, financial condition, cash re q u i rements, future prospects and other factors deemed relevant by the Board of Dire c t o r s .
Employee stock plans include the amended 1992 Employee Stock Purchase Plan which authorizes the allocation of 2,000,000 shares of
stock for the Plan and the Amended and Restated 1992 Omnibus Stock Plan which authorizes the issuance of up to 7,880,000 shares of
the Company’s common stock as stock options or restricted share awards. At December 31, 1999, approximately 756,000 options
remained available for grant under the Plan.

In February 1999, the Board of Directors authorized the Company to purchase an additional 2.5 million shares of its Common Stock,
i n c reasing the authorization to 8.5 million shares, over the four subsequent years which can be used to fund the Company’s Employee
Stock Purchase Plan and the Amended and Restated 1992 Omnibus Stock Plan. The stock purchases are made from time to time on the
open market. Under the program, 2.0 million shares were re p u rchased on the open market during 1999 and 1.1 million shares were
re p u rchased in 1998. In addition, during the first quarter of 2000, the Company re p u rchased approximately 300,000 share s .
Company management believes that these employee stock plans provide valuable incentives to a broad range of York employees by giving
them a direct equity interest in the Company. Company management further believes that funding the re q u i red shares through share
re p u rchases will mitigate the dilutive impact such employee plans would otherwise have.
ACQUISITION OF SABROE AND THE INTEGRATION PLANOn June 10, 1999, the Company acquired all of the outstanding capital stock of Sabroe A/S (Sabroe), a Danish company, for $407.1
million in cash and assumed debt of $216.0 million. Sabroe is a world leader in supplying re f r i g e ration systems and products. The
Company financed the acquisition through issuance of commercial paper, supported by its credit facilities.
The Company is in the process of executing the plan for integrating Sabroe into the York Refrigeration Group. The plan includes the
closing of Sabroe’s Retech and York’s Gram manufacturing plants in Denmark and Sabroe’s Norrkoping manufacturing plant in Sweden.
The plan also includes the closure of select duplicate sales and service offices in Europe and Asia, salary and wage employee ra t i o n a l-
izations, product rationalizations, and other actions related to reorganizing the York Refrigeration Group. The plan is expected to be
substantially completed within one year from the acquisition date.
INFLATIONManagement believes inflation has not had a significant impact on the Company’s results of operations for the periods presented. The
Company was able to substantially offset the effect of inflation through cost reduction programs in 1999. Management does not anticipate
inflation having a significant impact on the future results of opera t i o n s .
CYCLICALITYE x p o s u re to cyclicality in the new construction market is partially mitigated by the Company’s emphasis on the service, repair and
replacement market. As the installed base of heating, air conditioning and re f r i g e ration equipment has grown and aged, the Company
derives a significant portion of its revenue from the service, repair and replacement market. In 1999, 1998 and 1997, respectively, on a
worldwide basis, service, repair and replacement revenue accounted for an estimated 42%, 44% and 41% of the Company’s total sales,
while new construction sales accounted for the remaining 58%, 56% and 59%.
SEASONALITYSales of the Company’s Unitary products equipment historically have been seasonal. Demand for residential air conditioning equipment
in the new construction and replacement market varies according to the season, with increased demand generally in the summer months.
Demand in the residential replacement market generally peaks in early summer for air conditioners and in the fall for furnaces. Demand
for hermetic compressors in the original equipment market generally increases from January through July as manufacturers incre a s e
production to meet anticipated seasonal demand. The Company provides incentives for distributors to purchase products in advance of
seasonal sales. These incentives, together with advance production schedules, somewhat reduce the impact of seasonal fluctuations on the
Company’s sales of residential equipment. Requirements for service and repair parts for Engineered Systems products and the
R e f r i g e ration Contracting business also increase during summer months. The overall effect of seasonality is slightly dampened by the
Company’s Engineered Systems and Refrigeration equipment, for which demand is less seasonal.
MARKET RISKThe Company is subject to market risk associated with changes in interest rates, foreign currency exchange rates and certain commodity
prices. To manage the risk of fluctuations in interest rates, the Company’s borrowings are a mix of fixed and floating rate obligations.
This includes $100 million of Senior Notes that bear interest at a 6.75% fixed rate and are due March 2003 as well as $200 million of
Senior Notes with a fixed interest rate of 6.70% which are due June 2008. Short-term borrowings are typically bank loans and
c o m m e rcial paper that is reborrowed in the ordinary course of business. The Company’s short-term borrowings maturity dates support
seasonal working capital needs. The Company’s non-U.S. subsidiaries maintain bank credit facilities for borrowings in their functional
c u r rency on a floating rate basis.
The Company has manufacturing facilities in 14 foreign countries and its products are sold in over 100 countries throughout the world.
As a result, the Company is exposed to foreign currency risk that future cash flows from transactions in foreign currencies will be
negatively impacted by exchange rate changes. To reduce this risk, the Company hedges its foreign currency transaction exposure with
f o r w a rd contracts and purchased options, in accordance with the Company’s Treasury Policy and Pr o c e d u res Manual on hedging (the
19York Internat ional Corporation 1999 Annual Report
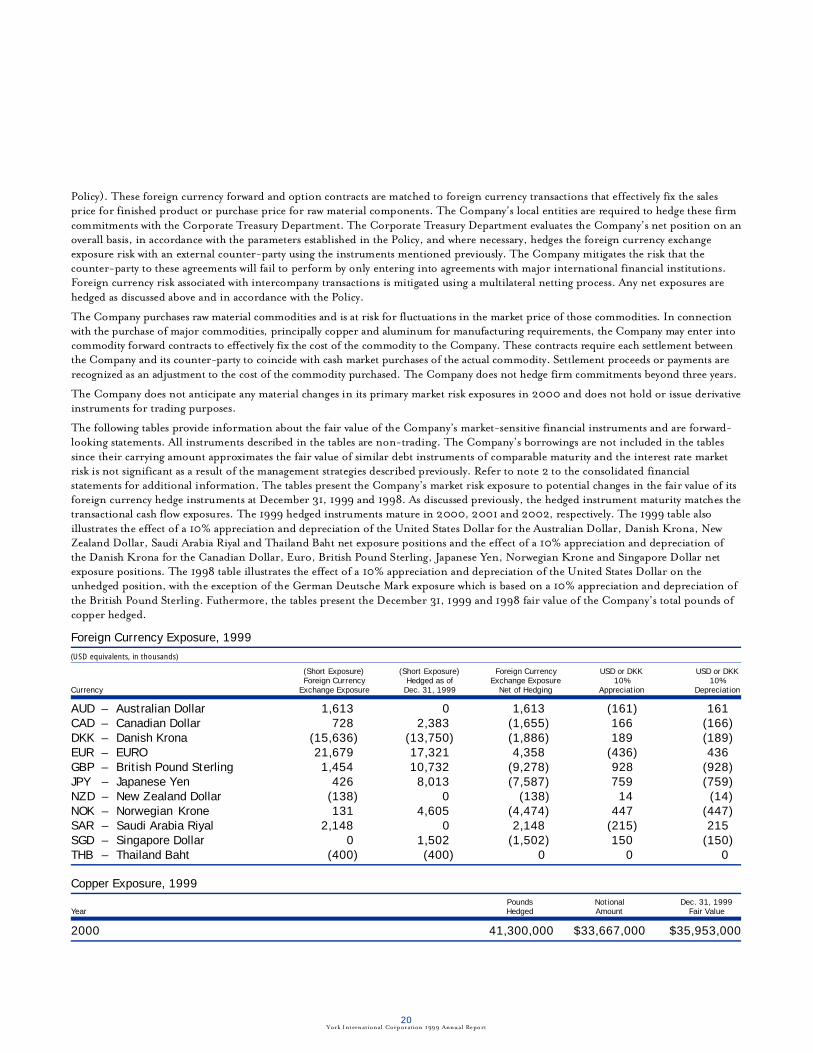
Policy). These foreign currency forward and option contracts are matched to foreign currency transactions that effectively fix the sales
price for finished product or purchase price for raw material components. The Company’s local entities are re q u i red to hedge these firm
commitments with the Corporate Treasury Department. The Corporate Treasury Department evaluates the Company’s net position on an
o v e rall basis, in accordance with the parameters established in the Policy, and where necessary, hedges the foreign currency exchange
e x p o s u re risk with an external counter-party using the instruments mentioned previously. The Company mitigates the risk that the
counter-party to these agreements will fail to perform by only entering into agreements with major international financial institutions.
Fo reign currency risk associated with intercompany transactions is mitigated using a multilateral netting process. Any net exposures are
hedged as discussed above and in accordance with the Po l i c y .
The Company purchases raw material commodities and is at risk for fluctuations in the market price of those commodities. In connection
with the purchase of major commodities, principally copper and aluminum for manufacturing re q u i rements, the Company may enter into
commodity forward contracts to effectively fix the cost of the commodity to the Company. These contracts re q u i re each settlement between
the Company and its counter-party to coincide with cash market purchases of the actual commodity. Settlement proceeds or payments are
recognized as an adjustment to the cost of the commodity purchased. The Company does not hedge firm commitments beyond three years.
The Company does not anticipate any material changes in its primary market risk exposures in 2000 and does not hold or issue derivative
instruments for trading purposes.
The following tables provide information about the fair value of the Company’s market-sensitive financial instruments and are forward -
looking statements. All instruments described in the tables are non-trading. The Company’s borrowings are not included in the tables
since their carrying amount approximates the fair value of similar debt instruments of comparable maturity and the interest rate marke t
risk is not significant as a result of the management strategies described previously. Refer to note 2 to the consolidated financial
statements for additional information. The tables present the Company’s market risk exposure to potential changes in the fair value of its
f o reign currency hedge instruments at December 31, 1999 and 1998. As discussed previously, the hedged instrument maturity matches the
t ransactional cash flow exposures. The 1999 hedged instruments mature in 2000, 2001 and 2002, respectively. The 1999 table also
i l l u s t rates the effect of a 10% appreciation and depreciation of the United States Dollar for the Australian Dollar, Danish Krona, New
Zealand Dollar, Saudi Arabia Riyal and Thailand Baht net exposure positions and the effect of a 10% appreciation and depreciation of
the Danish Krona for the Canadian Dollar, Euro, British Pound Sterling, Japanese Yen, Norwegian Krone and Singapore Dollar net
e x p o s u re positions. The 1998 table illustrates the effect of a 10% appreciation and depreciation of the United States Dollar on the
unhedged position, with the exception of the German Deutsche Mark exposure which is based on a 10% appreciation and depreciation of
the British Pound Sterling. Fu t h e r m o re, the tables present the December 31, 1999 and 1998 fair value of the Company’s total pounds of
copper hedged.
Foreign Currency Exposure, 1999
(USD equivalents, in thousands)
(Short Exposure) (Short Exposure) Foreign Currency USD or DKK USD or DKKForeign Currency Hedged as of Exchange Exposure 10% 10%
Currency Exchange Exposure Dec. 31, 1999 Net of Hedging Appreciation Depreciation
AUD – Australian Dollar 1,613) 0) 1,613) (161) 161)CAD – Canadian Dollar 728) 2,383) (1,655) 166) (166)DKK – Danish Krona (15,636) (13,750) (1,886) 189) (189)EUR – EURO 21,679) 17,321) 4,358) (436) 436)GBP – British Pound Sterling 1,454) 10,732) (9,278) 928) (928)JPY – Japanese Yen 426) 8,013) (7,587) 759) (759)NZD – New Zealand Dollar (138) 0) (138) 14) (14)NOK – Norwegian Krone 131) 4,605) (4,474) 447) (447)SAR – Saudi Arabia Riyal 2,148) 0) 2,148) (215) 215)SGD – Singapore Dollar 0) 1,502) (1,502) 150) (150)THB – Thailand Baht (400) (400) 0) 0) 0)
Copper Exposure, 1999Pounds Notional Dec. 31, 1999
Year Hedged Amount Fair Value
2000 41,300,000 $33,667,000 $35,953,000
20York International Corporation 1999 Annual Report

21York International Corporat ion 1999 Annual Report
Foreign Currency Exposure, 1998
(USD equivalents, in thousands)
(Short Exposure) (Short Exposure) Foreign Currency USD or GBP USD or GBPForeign Currency Hedged as of Exchange Exposure 10% 10%
Currency Exchange Exposure Dec. 31, 1998 Net of Hedging Appreciation Depreciation
AUD – Australian Dollar 9,200) 9,200) 0) 0) 0)CLP – Chilean Peso 5,100) 2,500) 2,600) (260) 260)DEM – German Deutsche Mark 11,863) 11,542) 321) (32) 32)DKK – Danish Krona (789) 0) (789) 79) (79)GBP – British Pound Sterling 1,606) 1,383) 223) (22) 22)JPY – Japanese Yen 5,227) 5,253) (26) 3) (3)NZD – New Zealand Dollar 608) 608) 0) 0) 0)SGD – Singapore Dollar 5,900) 5,900) 0) 0) 0)THB – Thailand Baht 1,557) 1,557) 0) 0) 0)ZAR – South African Rands 2,167) 2,167) 0) 0) 0)
Copper Exposure, 1998Pounds Notional Dec. 31, 1998
Year Hedged Amount Fair Value
1999 50,000,000 $42,692,000 $34,346,0002000 20,000,000 17,150,000 14,660,000
EURO CONVERSIONThe Euro is not expected to have a material effect on the Company’s operating results or competitive position. The Company’s financial
systems are Euro compliant and opportunities will continue to be investigated for European-wide system infra s t r u c t u res.
GRANTLEY ACCIDENTOn February 2, 1998, the Company incurred damage to its Grantley manufacturing facility in York, PA, when tanks used for testing
r u p t u red. The accident caused substantial damage to facilities used in steel cutting and rolling operations and heat exchanger production. The
Company took a number of measures to limit the disruptions and costs resulting from the accident, including moving production to other
Company facilities, outsourcing or subcontracting production of certain components, and establishing temporary production elsewhere at the
G rantley location. The Company’s rebuilding operations were substantially completed during the second quarter of 1999, fully restoring its
production capacity. For additional information relating to the Grantley facility incident, see note 16 to the consolidated financial statements.
NEW ACCOUNTING STANDARDSIn June 1998, the Financial Accounting Standards Board (FASB) issued Statement of Financial Accounting Standards (SFAS) No. 133,
“Accounting for Derivative Instruments and Hedging Activities” (the Standard). The Standard establishes comprehensive accounting and
reporting standards for derivative instruments and hedging activities that re q u i re a company to re c o rd the derivative instrument at fair
value in the balance sheet. Fu r t h e r m o re, the derivative instrument must meet specific criteria or the change in its fair value is to be
recognized in earnings in the period of change. To achieve hedge accounting treatment the derivative instrument needs to be part of a
well-documented hedging strategy that describes the exposure to be hedged, the objective of the hedge and a measurable definition of its
effectiveness in hedging the exposure. In June 1999, the FASB issued SFAS No. 137, “Accounting for Derivative Instruments and
Hedging Activities – Deferral of the Effective Date of SFAS No. 133.” SFAS No. 137 delays the Standard effective date to the beginning of
the first quarter of the fiscal year beginning after June 15, 2000. Although the Company has not completed its analysis, adoption of this
statement is not expected to have a material effect on the Company’s financial statements.
FORWARD-LOOKING INFORMATION – RISK FACTORSTo the extent the Company has made “forward-looking statements,” certain risk factors could cause actual results to differ materially from
those anticipated in such forward-looking statements including, but not limited to, competition, government regulation, environmental
c o n s i d e rations and the successful integration of Sabroe into the YRG. Unseasonably cool spring or summer weather could adversely affect
the Company’s UPG residential air conditioning business. The ESG air conditioning business could be affected by a slowdown in the
large chiller market and by the acceptance of new product introductions. The resolution of the Grantley insurance claim for an amount
g reater than or less than amounts re c o rded could affect the Company’s results. Overall performance of the Company in 1999 was affected
by less robust economic conditions in Latin America and Eastern Europe. Fu t u re anticipated performance could be affected by any
serious economic downturns in other worldwide markets or a slower than expected recovery in Latin America and Eastern Europe.

22York International Corporation 1999 Annual Report
Consolidated Balance Sheets
December 31(in thousands) 19991 19981
ASSETSCurrent assets:
Cash and cash equivalents $0,039,514) $0,022,746)Receivables 720,022) 632,768)Inventories 599,046) 536,854)Prepayments and other current assets 131,787) 118,165)
Total current assets 1,490,369) 1,310,533)Deferred income taxes 13,207) 30,805)Investments in affiliates 25,425) 20,092)Property, plant and equipment, net 499,710) 374,731)Unallocated excess of cost over net assets acquired 768,809) 337,353)Deferred charges and other assets 77,019) 33,024)
Total assets $2,874,539) $2,106,538)
LIABILITIES AND STOCKHOLDERS’ EQUITYCurrent liabilities:
Notes payable and current portion of long-term debt $0,102,864) $0,052,583)Accounts payable and accrued expenses 860,264) 670,797)Income taxes 42,007) 66,099)
Total current liabilities 1,005,135) 789,479)Long-term warranties 39,607) 36,488)Long-term debt 854,494) 362,724)Postretirement benefit liabilities 154,066) 140,152)Other long-term liabilities 89,307) 46,896)
Total liabilities $2,142,609) $1,375,739)
Stockholders’ equity:Common stock $.005 par value; 200,000 shares authorized;
Issued 45,062 shares in 1999 and 44,616 shares in 1998 225) 223)Additional paid in capital 715,322) 700,959)Retained earnings 342,529) 290,465)Accumulated other comprehensive losses (71,146) (58,209)Treasury stock, at cost; 6,700 shares in 1999 and
4,621 shares in 1998 (253,274) (199,037)Unearned compensation (1,726) (3,602)
Total stockholders’ equity 731,930) 730,799)Total liabilities and stockholders’ equity $2,874,539) $2,106,538)
The accompanying notes are an integral part of these statements.
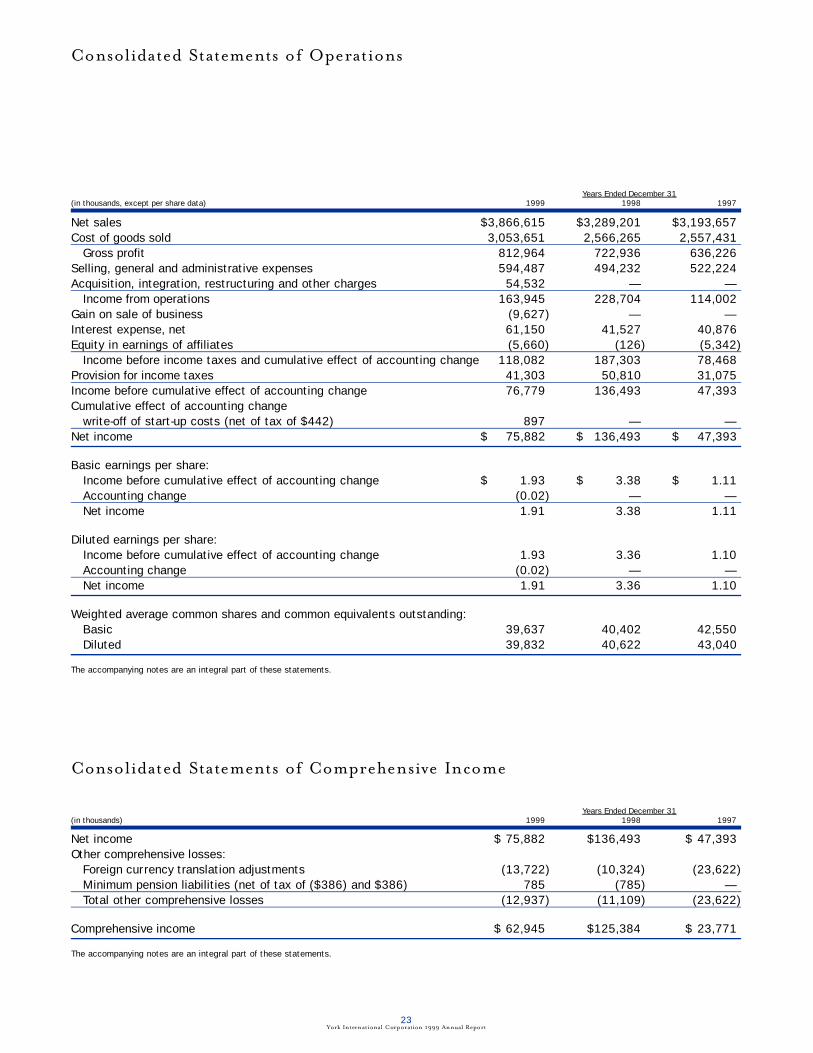
23York International Corporation 1999 Annual Report
Years Ended December 31(in thousands, except per share data) 19991 19981 19971
Net sales $3,866,615) $3,289,201) $3,193,657)Cost of goods sold 3,053,651) 2,566,265) 2,557,431)
Gross profit 812,964) 722,936) 636,226)Selling, general and administrative expenses 594,487) 494,232) 522,224)Acquisition, integration, restructuring and other charges 54,532) —) —)
Income from operations 163,945) 228,704) 114,002)Gain on sale of business (9,627) —) —)Interest expense, net 61,150) 41,527) 40,876)Equity in earnings of affiliates (5,660) (126) (5,342)
Income before income taxes and cumulative effect of accounting change 118,082) 187,303) 78,468)Provision for income taxes 41,303) 50,810) 31,075)Income before cumulative effect of accounting change 76,779) 136,493) 47,393)Cumulative effect of accounting change
write-off of start-up costs (net of tax of $442) 897) —) —)Net income $0,075,882) $,0136,493) $,0047,393)
Basic earnings per share:Income before cumulative effect of accounting change $00,001.93) $,00003.38) $,00001.11)Accounting change (0.02) —) —)Net income 1.91) 3.38) 1.11)
Diluted earnings per share:Income before cumulative effect of accounting change 1.93) 3.36) 1.10)Accounting change (0.02) —) —)Net income 1.91) 3.36) 1.10)
Weighted average common shares and common equivalents outstanding:Basic 39,637) 40,402) 42,550)Diluted 39,832) 40,622) 43,040)
The accompanying notes are an integral part of these statements.
Consolidated Statements of Opera t i o n s
Years Ended December 31(in thousands) 19991 19981 19971
Net income $)75,882) $136,493) $)47,393)Other comprehensive losses:
Foreign currency translation adjustments (13,722) (10,324) (23,622)Minimum pension liabilities (net of tax of ($386) and $386) 785) (785) —)Total other comprehensive losses (12,937) (11,109) (23,622)
Comprehensive income $)62,945) $125,384) $)23,771)
The accompanying notes are an integral part of these statements.
Consolidated Statements of Comprehensive Income

24York International Corporation 1999 Annual Report
Consolidated Statements of Cash Flows
Years Ended December 31(in thousands) 19991 19981 19971
Cash flows from operating activities:Net income $(075,882) $)136,493) $047,393)Adjustments to reconcile net income to net
cash provided by operating activities:Depreciation and amortization of property, plant and equipment 64,171) 57,785) 52,776)Amortization of deferred charges and unallocated
excess of cost over net assets acquired 24,119) 17,059) 15,978)Provision for doubtful accounts receivable 10,899) 8,206) 6,139)Effect of non-cash charges 58,807) —) —)Gain on sale of business (9,627) —) —)Cumulative effect of accounting change 897) —) —)Other 2,340) 5,634) (1,638)Change in assets and liabilities net of effects from
purchase of other companies and sale of business:Receivables (43,215) (88,430) 2,074)Inventories 10,896) 4,536) 48,562)Prepayments and other current assets (4,042) (6,025) (3,145)Deferred income taxes (12,755) (9,417) (1,686)Other assets (10,513) (16,995) 2,245)Accounts payable and accrued expenses (80,787) 64,050) (2,422)Income taxes (26,831) 47,889) (13,429)Long-term warranties 3,362) 197) 2,030)Postretirement benefit liabilities 7,797) 6,073) 4,883)Other long-term liabilities 1,344) 6,113) (6,046)
Net cash provided by operating activities 72,744) 233,168) 153,714)Cash flows from investing activities:
Purchases of and investments in other companies (net of cash acquired) (407,766) (7,794) (8,978)
Proceeds from sale of business, net 35,512) —) —)Capital expenditures (104,065) (64,638) (66,854)Other 1,155) 1,781) 5,718)
Net cash used by investing activities (475,164) (70,651) (70,114)Cash flows from financing activities:
Net payments on short-term debt (37,488) (16,855) (59,023)Long-term debt payments (33,327) (119,748) (114,223)Net (payments) proceeds of commercial paper borrowings 396,847) (168,182) 83,146)Proceeds from sale lease-back 82,397) —) —)Proceeds from sale of accounts receivable 75,000) —) —)Proceeds from issuance of senior bank notes —) 198,310) —)Net proceeds from issuance of bank loans —) —) 169,780)Common stock issued 13,636) 19,546) 14,909)Treasury stock purchases (54,237) (45,824) (157,224)Dividends paid (23,818) (19,403) (20,349)
Net cash provided (used) by financing activities 419,010) (152,156) (82,984)Effect of exchange rate changes on cash 178) 157) 142)Net increase in cash and cash equivalents 16,768) 10,518) 758)Cash and cash equivalents at beginning of year 22,746) 12,228) 11,470)Cash and cash equivalents at end of year $(039,514) $(022,746) $012,228)
Supplemental disclosure of cash paid for:Interest $(059,484) $(040,207) $041,519)Income taxes 62,306) 28,153) 55,587)
Non-cash investing activities, acquisition of business:Fair value of tangible and intangible assets acquired 877,276) 7,377) 20,447)Cash paid (407,766) (7,794) (17,481)Liabilities assumed $(469,510) $000,(417) $002,966)
The accompanying notes are an integral part of these statements.

25York International Corporation 1999 Annual Report
Additional Accumulated OtherCommon Stock Issued Paid In Retained Comprehensive Treasury Stock Unearned
(in thousands, except share data) Shares Amount Capital Earnings Losses Shares Amount Compensation
Balance, December 31, 1996 43,719,853 $219 $667,775) $146,331) $(23,478) 97,628) $00(3,875) $(6,595)
Net income — — —) 47,393) —) —) —) —)
Issuance of common stock under
executive stock agreements 15,000 — 898) —) —) (25,000) 1,126) (1,984)
Issuance of common stock under
employee stock purchase plan 165,369 1 5,557) —) —) (744) 34) —)
Other, primarily exercise of stock options 157,067 — 2,758) —) —) (149,926) 6,495) —)
Tax effect of options exercised — — 2,187) —) —) —) —) —)
Amortization of unearned compensation — — —) —) —) —) —) 2,614)
Issuance of treasury stock, at cost — — 5) —) —) (469) 19) —)
Purchase of treasury stock, at cost — — —) —) —) 3,507,321) (157,224) —)
Cash dividends on common stock
($.48 per share) — — —) (20,349) —) —) —) —)
Currency translation adjustment — — —) —) (23,622) —) —) —)
Balance, December 31, 1997 44,057,289 $220 $679,180) $173,375) $(47,100) 3,428,810) $(153,425) $(5,965)
Net income — — —) 136,493) —) —) —) —)
Issuance of common stock under
executive stock agreements, net 32,000 — 1,169) —) —) 1,600) 212) (1,137)
Issuance of common stock under
employee stock purchase plan 225,861 1 7,585) —) —) —) —) —)
Other, primarily exercise of stock options 300,625 2 11,715) —) —) —) —) —)
Tax effect of options exercised — — 1,310) —) —) —) —) —)
Amortization of unearned compensation — — —) —) —) —) —) 3,500)
Purchase of treasury stock, at cost — — —) —) —) 1,190,640) (45,824) —)
Cash dividends on common stock
($.48 per share) — — —) (19,403) —) —) —) —)
Minimum pension liability — — —) —) (785) —) —) —)
Currency translation adjustment — — —) —) (10,324) —) —) —)
Balance, December 31, 1998 44,615,775 $223 $700,959) $290,465) $(58,209) 4,621,050) $(199,037) $(3,602)
Net income — — —) 75,882) —) —) —) —)
Issuance of common stock under
executive stock agreements, net 23,500 — 953) —) —) 1,000) —) (919)
Issuance of common stock under
employee stock purchase plan 205,980 1 4,803) —) —) —) —) —)
Other, primarily exercise of stock options 216,662 1 7,878) —) —) —) —) —)
Tax effect of options exercised — — 729) —) —) —) —) —)
Amortization of unearned compensation — — —) —) —) —) —) 2,795)
Purchase of treasury stock, at cost — — —) —) —) 2,077,838) (54,237) —)
Cash dividends on common stock
($.60 per share) — — —) (23,818) —) —) —) —)
Minimum pension liability — — —) —) 785) —) —) —)
Currency translation adjustment — — —) —) (13,722) —) —) —)
Balance, December 31, 1999 45,061,917 $225 $715,322) $342,529) $(71,146) 6,699,888) $(253,274) $(1,726)
The accompanying notes are an integral part of these statements.
Consolidated Statements of Stockholders’ Equity

26York International Corporation 1999 Annual Report
NOTE 1—SUMMARY OF SIGNIFICANT ACCOUNTING POLICIES
Nature of OperationsYork International Corporation (The Company) is a full-line, global designer and manufacturer of heating, ventilating, air
conditioning and refrigeration (HVAC&R) equipment with three major product groups: Unitary, Engineered Systems, and
Refrigeration. The Company markets its products and services throughout the world, and its customers range from residential
contractors to design builders, contractors and building owners.
Use of Estimates in the Financial StatementsPreparation of the financial statements, in conformity with generally accepted accounting principles, requires management to make
estimates and assumptions that affect the reported amounts of assets and liabilities and disclosures of contingent assets and liabilities
at the date of the financial statements, and the reported amounts of revenues and expenses during the reporting period. Actual results
could differ from those estimates.
Principles of ConsolidationThe consolidated financial statements include the accounts of the Company and its wholly-owned and majority-owned subsidiaries.
All significant intercompany transactions have been eliminated.
Cash and Cash EquivalentsThe Company considers all highly liquid investments purchased with a maturity of three months or less to be cash equivalents.
InventoriesInventories are valued at the lower of cost or market using the last-in, first-out (LIFO) or first-in, first-out (FIFO) method.
Property, Plant and Equipment and DepreciationProperty, plant and equipment are stated at cost less accumulated depreciation. Expenditures for maintenance, repairs and renewals of
relatively minor items are generally charged to earnings as incurred. Improvements and renewals of significant items are capitalized.
Depreciation is computed generally on a straight-line basis over the estimated useful lives of related assets. For income tax purposes,
accelerated methods of depreciation are generally used.
Unallocated Excess of Cost Over Net Assets AcquiredUnallocated excess of cost over net assets acquired is amortized on a straight-line basis over periods of up to 40 years. Accumulated
amortization related to such excess at December 31, 1999 and 1998, is $110.4 million and $90.3 million, respectively. The Company
assesses the recoverability or impairment, if any, of the elements of this intangible asset by determining whether the amortization of
the balance over its remaining life can be recovered through undiscounted future operating cash flows of the acquired operations or
the long-lived assets to which the unallocated excess is attributed.
Postretirement Benefit Plans and Postemployment BenefitsA majority of domestic employees participate in noncontributory pension plans, and substantially all non-U.S. employees participate
in contributory or noncontributory pension plans.
The Company has certain postemployment benefits provided to former or inactive employees who are not retirees. These benefits
include salary continuance, severance and disability health care. The benefits are accrued over the employee’s service period or as an
expense at the date of the event triggering the benefit.
The Company adopted SFAS No.132, “Employers’ Disclosures about Pensions and Other Postretirement Benefits” in 1998, which
revised employers’ disclosures about pension and other postretirement benefit plans. All prior disclosures were restated to conform to
the provisions of SFAS 132.
Revenue RecognitionSales and related cost of goods sold are recognized as title transfers, generally based upon shipment of products or performance of
services.
Income TaxesIncome taxes are accounted for under the asset and liability method. Deferred tax assets and liabilities are recognized for the future
tax consequences attributable to differences between the financial statement carrying amounts of existing assets and liabilities and
their respective tax bases and operating loss and tax credit carryforwards. Deferred tax assets and liabilities are measured using enacted
tax rates expected to apply to taxable income in the years in which those temporary differences are expected to be recovered or settled.
Notes to Consolidated Financial Statements
The effect on deferred tax assets and liabilities of a change in tax rates is recognized in income in the period that includes the
enactment date. Earnings of foreign operations are reinvested in the business and no provision for domestic income tax or foreign
withholding tax is made on such earnings until distributed.
Earnings per ShareEarnings per share (EPS) are computed in accordance with Statement of Financial Accounting Standards (SFAS) No.128, “Earnings
per Share.” Basic EPS are based upon the weighted average common shares outstanding during the period. Diluted EPS are based
upon the weighted average outstanding common shares and common share equivalents.
Foreign Currency TranslationThe functional currency for the majority of the Company’s foreign operations is the applicable local currency. Adjustments resulting
from translating foreign functional currency financial statements into U.S. dollars are included in currency translation adjustments
in stockholders’ equity. Gains or losses resulting from foreign currency transactions are included in the results of operations.
Accounting for Stock-Based CompensationThe Company applies Accounting Principles Board (APB) Opinion No. 25, “Accounting for Stock Issued to Employees,” and related
interpretations in accounting for its stock-based compensation plans. Accordingly, no compensation expense has been recognized
with respect to such plans other than for restricted stock and performance-based awards. Information related to stock-based
compensation awards is presented in note 18 to the consolidated financial statements along with the disclosures required under
SFAS 123, “Accounting for Stock-Based Compensation.”
Start-Up ActivitiesIn 1999, the Company adopted AICPA Statement of Position (SOP) 98-5, “Reporting on the Cost of Start-Up Activities,” which
re q u i res that costs of start-up activities, including organization costs, be expensed as incurred. In January 1999, the Company re c o rded a
charge of $0.9 million, net of $0.4 million in related income taxes, to write-off start-up activities in accordance with the SOP.
NOTE 2—FINANCIAL INSTRUMENTS
Financial Instruments with Off-Balance-Sheet RiskIn the ordinary course of business, the Company enters into various types of transactions that involve contracts and financial
instruments with off-balance-sheet risk. The Company enters into these financial instruments to manage financial market risk,
including foreign exchange, commodity price and interest rate risk. The Company enters into these financial instruments utilizing
over-the-counter as opposed to exchange traded instruments. The Company mitigates the risk that counter-parties to these over-the-
counter agreements will fail to perform by only entering into agreements with major international financial institutions.
Foreign Currency InstrumentsSince the Company purchases raw materials and sells finished products in various currencies, the Company is exposed to foreign
currency risk. The Company manages its foreign currency transaction risk by hedging the net currency exposures. However, the
Company does not hedge certain foreign exchange transaction exposures that are immaterial or are considered to be in currencies
highly correlated to the manufacturing entity’s currency.
The Company primarily uses foreign currency forward contracts and purchased options. These foreign currency forward and option
contracts are matched to firm commitments of foreign currency transactions and effectively fix the sales or purchase price. These
contracts are settled in cash upon expiration, with settlement proceeds or payments included in the measurement of the item hedged.
The option contracts are purchased in cash and amortized over the contract term. The Company does not hedge anticipated or firm
commitments beyond three years.
Commodity ContractsSince the Company purchases raw material commodities, it is at risk for fluctuations in the market price of those commodities. In
connection with the purchase of major commodities, principally copper and aluminum for anticipated manufacturing requirements,
the Company may enter into commodity forward contracts to effectively fix the cost of the commodity. These contracts require cash
settlement between the Company and its counter-party to coincide with cash market purchases of the actual commodity. Settlement
proceeds or payments are recognized as an adjustment to the cost of the commodity purchased. The Company does not hedge firm
commitments beyond three years.
27York International Corporation 1999 Annual Report

The notional amount and estimated fair values of the Company’s hedging contracts are as follows:
1999 1998(in thousands) Notional Fair Notional Fair
Foreign currency forward contracts $073,890 $072,301 $055,245 $054,629Commodity forward contracts 33,667 35,953 59,842 49,006
Other Financial InstrumentsThe carrying amounts and estimated fair values of the Company’s other financial instruments are as follows:
1999 1998(in thousands) Carrying Fair Carrying Fair
Cash and cash equivalents $039,514 $039,514 $022,746 $022,746Short-term borrowings 102,864 102,864 52,583 52,583Long-term debt:
Commercial paper 396,847 396,847 — —Bank lines 41,812 41,812 41,003 41,003Senior notes at 6.75% 100,000 95,950 100,000 102,622Senior notes at 6.70% 200,000 176,825 200,000 205,632Term loans 57,196 57,196 — —Other 58,639 58,639 21,721 21,721
The fair values of each of the Company’s long-term debt instruments are based on the amount of future cash flows associated with
each instrument discounted using the Company’s current borrowing rate for similar debt instruments of comparable maturity.
NOTE 3—RECEIVABLESReceivables consist of:
(in thousands) 1999 1998
Customers, trade $657,076 $554,601Affiliate receivables, trade 19,113 12,538Other receivables 75,175 85,540
751,364 652,679Less allowance for doubtful accounts receivable 31,342 19,911
Net receivables $720,022 $632,768
The Company established a receivables sales agreement in 1992. Under an Amended and Restated Receivables Sales Agreement entere d
into on December 22, 1999, the maximum amount of the purchasers’ investment increased from $150 million to $175 million and is
subject to decrease based on the level of eligible accounts receivable and restrictions on concentrations of receivables. The balance of
the sold accounts receivable was $175 million and $100 million at December 31, 1999 and 1998, respectively. The sold accounts
receivable are reflected as a reduction of receivables in the accompanying consolidated balance sheets. The discount rate on the
receivables sold was approximately 6.22% and 5.30% at December 31, 1999 and 1998, respectively.
NOTE 4—INVENTORIESInventories consist of:
(in thousands) 1999 1998
Raw material $199,171 $177,960Work in progress 112,669 92,712Finished goods 287,206 266,182
Total inventories $599,046 $536,854
Inventories valued under the LIFO method comprised approximately 30%, 36% and 41% of the December 31, 1999, 1998 and 1997
totals, respectively. If valued under the FIFO method, inventories would have been greater by $11.7 million at December 31, 1999,
$13.1 million at December 31, 1998 and $13.8 million at December 31, 1997.
28York International Corporation 1999 Annual Report

NOTE 5—PREPAYMENTS AND OTHER CURRENT ASSETSPrepayments and other current assets consist of:
(in thousands) 1999 1998
Deferred income tax assets $069,395 $074,394Prepaid insurance 20,870 19,499Prepaid materials and supplies 11,777 6,939Deferred employee benefits 11,542 —Other 18,203 17,333
Total prepayments and other current assets $131,787 $118,165
NOTE 6—INVESTMENTS IN AFFILIATESThe Company owns 50% or less of affiliate operations located in Malaysia, Cyprus, Saudi Arabia, Spain, Russia, Denmark, Japan, Kore a ,
Morocco and the United States. These investments are accounted for using the equity method of accounting and total $25.4 million in
1999 and $20.1 million in 1998. Dividends received from affiliates were $1.0 million in 1999, $0.5 million in 1998 and $1.2 million in
1997. Equity in earnings of affiliates for 1997 includes a one-time gain of approximately $6.0 million resulting from the sale of the
Company’s minority interest in an Egyptian air conditioning company.
NOTE 7—PROPERTY, PLANT AND EQUIPMENTProperty, plant and equipment consist of:
(in thousands) 1999 1998
Land $079,380 $010,751Buildings 139,770 123,865Machinery and equipment 549,672 550,396Construction in progress 48,997 31,682Capital leases 12,734 14,337
830,553 731,031Less accumulated depreciation 330,843 356,300
Net property, plant and equipment $499,710 $374,731
Amortization of capital lease assets has been included in depreciation expense. Accumulated capital lease amortization was $4.4 million
and $4.3 million at December 31, 1999 and 1998, re s p e c t i v e l y .
NOTE 8—ACCOUNTS PAYABLE AND ACCRUED EXPENSESAccounts payable and accrued expenses consist of:
(in thousands) 1999 1998
Accounts payable, trade and other $534,860 $429,646Employee compensation, benefits and related accruals 168,644 105,300Warranties and claims 58,413 46,948Accrued insurance 31,854 28,140Other accrued expenses 66,493 60,763
Total accounts payable and accrued expenses $860,264 $670,797
29York International Corporation 1999 Annual Report

NOTE 9—NOTES PAYABLE AND LONG-TERM DEBTNotes payable and long-term debt consist of:
(in thousands) 1999 1998
Notes payable and current portion of long-term debt:Term loans (foreign currency) current portion $014,299 $ 000,0—Bank loans 81,145 51,011Other 7,420 1,572
Total notes payable and current portion of long-term debt $102,864 $052,583
Long-term debt:Bank lines at an average rate of 5.28% in 1999 and 5.61% in 1998 $041,812 $041,003Commercial paper, 6.08% interest 396,847 —Senior notes, 6.75% interest, due March 2003 100,000 100,000Senior notes, 6.70% interest, due June 2008 200,000 200,000Term loans (foreign currency) at an average rate of 4.12%, due July 2004 57,196 —Other, primarily foreign bank loans, at an average rate of 5.91% in 1999
and 5.86% in 1998 58,639 21,721Total long-term debt $854,494 $362,724
In June 1999, the Company established a $400 million 364-day Revolving Credit Agreement (the Revolver) and amended the
$500 million Amended Credit Agreement (the Credit Agreement) expiring on July 31, 2002. The Revolver and the Credit Agre e m e n t
amendment provide for borrowings under the facilities at LIBOR plus 0.45%. If borrowings greater than 33% of either facility are
utilized, the rate increases to LIBOR plus 0.55%. The Company pays a fee of 0.10% for each facility, and the Credit Agreement
allows for borrowings at specified bid rates. At December 31, 1999 and 1998, the LIBOR rate was 6.03% and 5.06%, respectively.
The Revolver and the Credit Agreement, as amended, contain financial and operating covenants requiring the Company to maintain
certain financial ratios and standard provisions limiting leverage, investments and liens. The Company was in compliance with these
financial and operating covenants at December 31, 1999 and 1998. No amounts were outstanding under either of these agreements.
The Company’s bank lines provide for total borrowings of $175 million which are expected to be reborrowed in the ordinary course
of business. At December 31, 1999 and 1998, the Company had $41.8 million and $41.0 million, respectively, outstanding under
these bank lines.
Commercial paper borrowings are expected to be reborrowed in the ordinary course of business on a long-term basis. Commercial
paper borrowings were also the primary source of funds used to finance the acquisition of Sabroe A/S. The interest rate on the
commercial paper was 6.08% as of December 31, 1999.
Concerning bank loans and other, the Company’s non-U.S. subsidiaries maintain bank credit facilities in various currencies that
provided for available borrowings of $385.1 million and $269.6 million at December 31, 1999 and 1998, respectively, of which
$295.1 million and $202.9 million, respectively, were unused. In some instances, borrowings against these credit facilities have been
guaranteed by the Company to assure availability of funds at favorable rates. The Company also maintains other debt of $57.2 million
and $7.6 million at December 31, 1999 and 1998, respectively.
Annual principal payments on long-term debt are as follows for the fiscal years indicated:
(in thousands)
2000 $021,7192001 19,6582002 458,6352003 119,1842004 17,732Thereafter 239,285
Interest expense is net of interest income of $5.1 million in 1999, $3.4 million in 1998 and $1.8 million in 1997.
30York International Corporation 1999 Annual Report
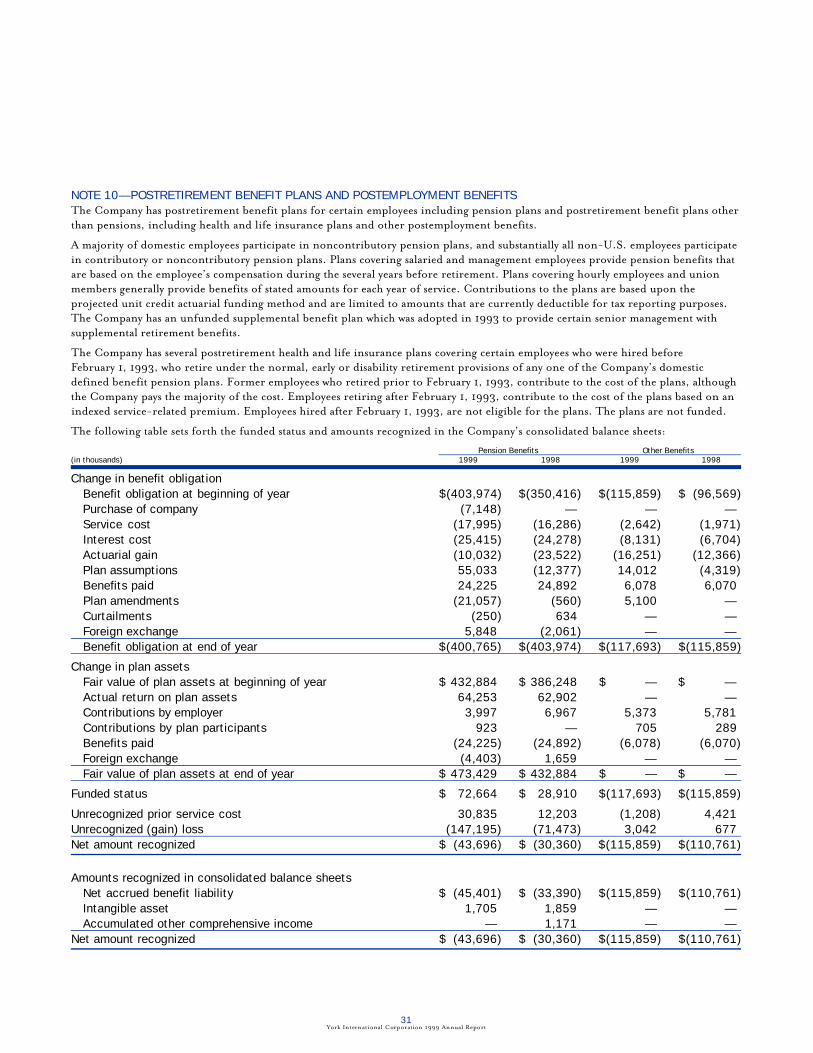
NOTE 10—POSTRETIREMENT BENEFIT PLANS AND POSTEMPLOYMENT BENEFITSThe Company has postretirement benefit plans for certain employees including pension plans and postretirement benefit plans other
than pensions, including health and life insurance plans and other postemployment benefits.
A majority of domestic employees participate in noncontributory pension plans, and substantially all non-U.S. employees participate
in contributory or noncontributory pension plans. Plans covering salaried and management employees provide pension benefits that
are based on the employee’s compensation during the several years before retirement. Plans covering hourly employees and union
members generally provide benefits of stated amounts for each year of service. Contributions to the plans are based upon the
projected unit credit actuarial funding method and are limited to amounts that are currently deductible for tax reporting purposes.
The Company has an unfunded supplemental benefit plan which was adopted in 1993 to provide certain senior management with
supplemental retirement benefits.
The Company has several postretirement health and life insurance plans covering certain employees who were hired before
February 1, 1993, who retire under the normal, early or disability retirement provisions of any one of the Company’s domestic
defined benefit pension plans. Former employees who retired prior to February 1, 1993, contribute to the cost of the plans, although
the Company pays the majority of the cost. Employees retiring after February 1, 1993, contribute to the cost of the plans based on an
indexed service-related premium. Employees hired after February 1, 1993, are not eligible for the plans. The plans are not funded.
The following table sets forth the funded status and amounts recognized in the Company’s consolidated balance sheets:
Pension Benefits Other Benefits(in thousands) 1999 1998 1999 1998
Change in benefit obligationBenefit obligation at beginning of year $(403,974) $(350,416) $(115,859) $0(96,569)Purchase of company (7,148) —) —) —)Service cost (17,995) (16,286) (2,642) (1,971)Interest cost (25,415) (24,278) (8,131) (6,704)Actuarial gain (10,032) (23,522) (16,251) (12,366)Plan assumptions 55,033) (12,377) 14,012) (4,319)Benefits paid 24,225) 24,892) 6,078) 6,070)Plan amendments (21,057) (560) 5,100) —)Curtailments (250) 634) —) —)Foreign exchange 5,848) (2,061) —) —)Benefit obligation at end of year $(400,765) $(403,974) $(117,693) $(115,859)
Change in plan assetsFair value of plan assets at beginning of year $)432,884) $)386,248) $ 0—) $000,00—)Actual return on plan assets 64,253) 62,902) —) —)Contributions by employer 3,997) 6,967) 5,373) 5,781)Contributions by plan participants 923) —) 705) 289)Benefits paid (24,225) (24,892) (6,078) (6,070)Foreign exchange (4,403) 1,659) —) —)Fair value of plan assets at end of year $)473,429) $)432,884) $ 0—) $000,00—)
Funded status $)372,664) $)028,910) $(117,693) $(115,859)
Unrecognized prior service cost 30,835) 12,203) (1,208) 4,421)Unrecognized (gain) loss (147,195) (71,473) 3,042) 677)Net amount recognized $0(43,696) $0(30,360) $(115,859) $(110,761)
Amounts recognized in consolidated balance sheetsNet accrued benefit liability $0(45,401) $0(33,390) $(115,859) $(110,761)Intangible asset 1,705) 1,859) —) —)Accumulated other comprehensive income —) 1,171) —) —)
Net amount recognized $0(43,696) $0(30,360) $(115,859) $(110,761)
31York International Corporation 1999 Annual Report
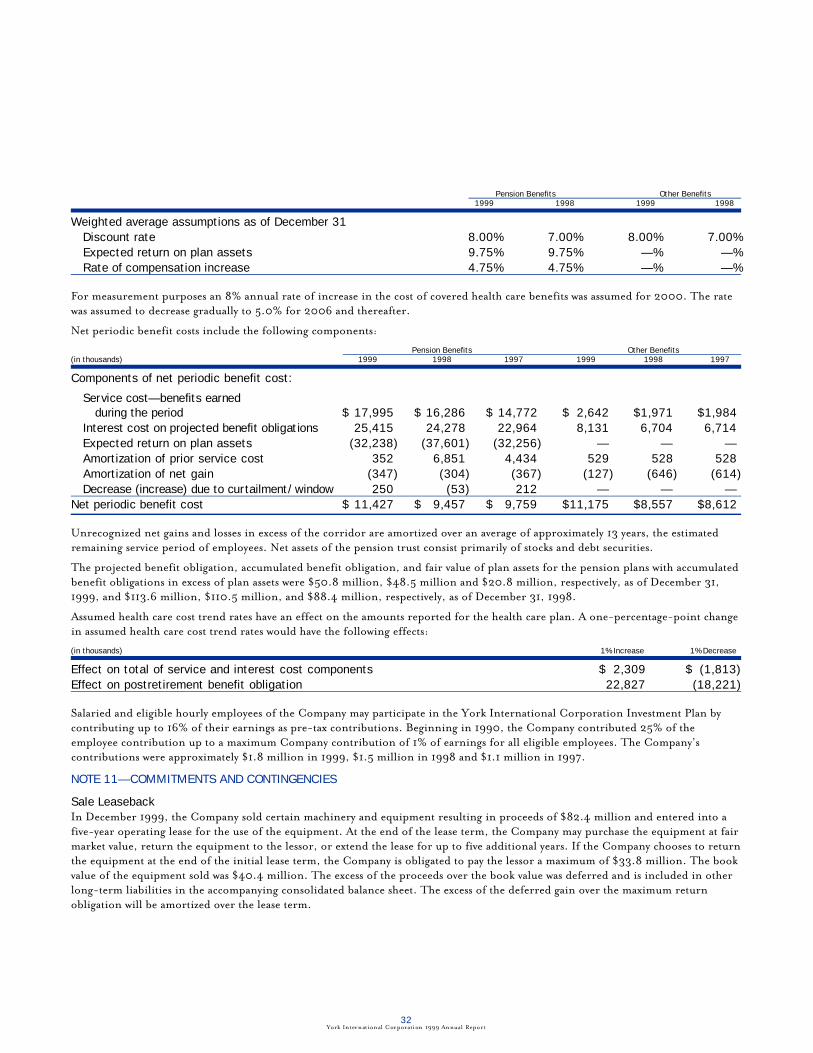
Pension Benefits Other Benefits1999 1998 1999 1998
Weighted average assumptions as of December 31Discount rate 8.00% 7.00% 8.00% 7.00%Expected return on plan assets 9.75% 9.75% —% —%Rate of compensation increase 4.75% 4.75% —% —%
For measurement purposes an 8% annual rate of increase in the cost of covered health care benefits was assumed for 2000. The rate
was assumed to decrease gradually to 5.0% for 2006 and thereafter.
Net periodic benefit costs include the following components:
Pension Benefits Other Benefits(in thousands) 1999 1998 1997 1999 1998 1997
Components of net periodic benefit cost:
S e rvice cost—benefits earned during the period $)17,995) $)16,286) $(14,772) $02,642) $1,971) $1,984)
I n t e rest cost on projected benefit obligations 25,415) 24,278) 22,964) 8,131) 6,704) 6,714)Expected return on plan assets (32,238) (37,601) (32,256) —) —) —)Amortization of prior service cost 352) 6,851) 4,434) 529) 528) 528)Amortization of net gain (347) (304) (367) (127) (646) (614)D e c rease (increase) due to curt a i l m e nt/ w i n d o w 250) (53) 212) —) —) —)
Net periodic benefit cost $)11,427) $)09,457) $(09,759) $11,175) $8,557) $8,612)
Unrecognized net gains and losses in excess of the corridor are amortized over an average of approximately 13 years, the estimated
remaining service period of employees. Net assets of the pension trust consist primarily of stocks and debt securities.
The projected benefit obligation, accumulated benefit obligation, and fair value of plan assets for the pension plans with accumulated
benefit obligations in excess of plan assets were $50.8 million, $48.5 million and $20.8 million, respectively, as of December 31,
1999, and $113.6 million, $110.5 million, and $88.4 million, respectively, as of December 31, 1998.
Assumed health care cost trend rates have an effect on the amounts reported for the health care plan. A one-percentage-point change
in assumed health care cost trend rates would have the following effects:
(in thousands) 1% Increase 1% Decrease
Effect on total of service and interest cost components $02,309 $0(1,813)Effect on postretirement benefit obligation 22,827 (18,221)
Salaried and eligible hourly employees of the Company may participate in the York International Corporation Investment Plan by
contributing up to 16% of their earnings as pre-tax contributions. Beginning in 1990, the Company contributed 25% of the
employee contribution up to a maximum Company contribution of 1% of earnings for all eligible employees. The Company’s
contributions were approximately $1.8 million in 1999, $1.5 million in 1998 and $1.1 million in 1997.
NOTE 11—COMMITMENTS AND CONTINGENCIES
Sale LeasebackIn December 1999, the Company sold certain machinery and equipment resulting in proceeds of $82.4 million and entered into a
five-year operating lease for the use of the equipment. At the end of the lease term, the Company may purchase the equipment at fair
market value, return the equipment to the lessor, or extend the lease for up to five additional years. If the Company chooses to return
the equipment at the end of the initial lease term, the Company is obligated to pay the lessor a maximum of $33.8 million. The book
value of the equipment sold was $40.4 million. The excess of the proceeds over the book value was deferred and is included in other
long-term liabilities in the accompanying consolidated balance sheet. The excess of the deferred gain over the maximum return
obligation will be amortized over the lease term.
32York Internat ional Corporation 1999 Annual Report
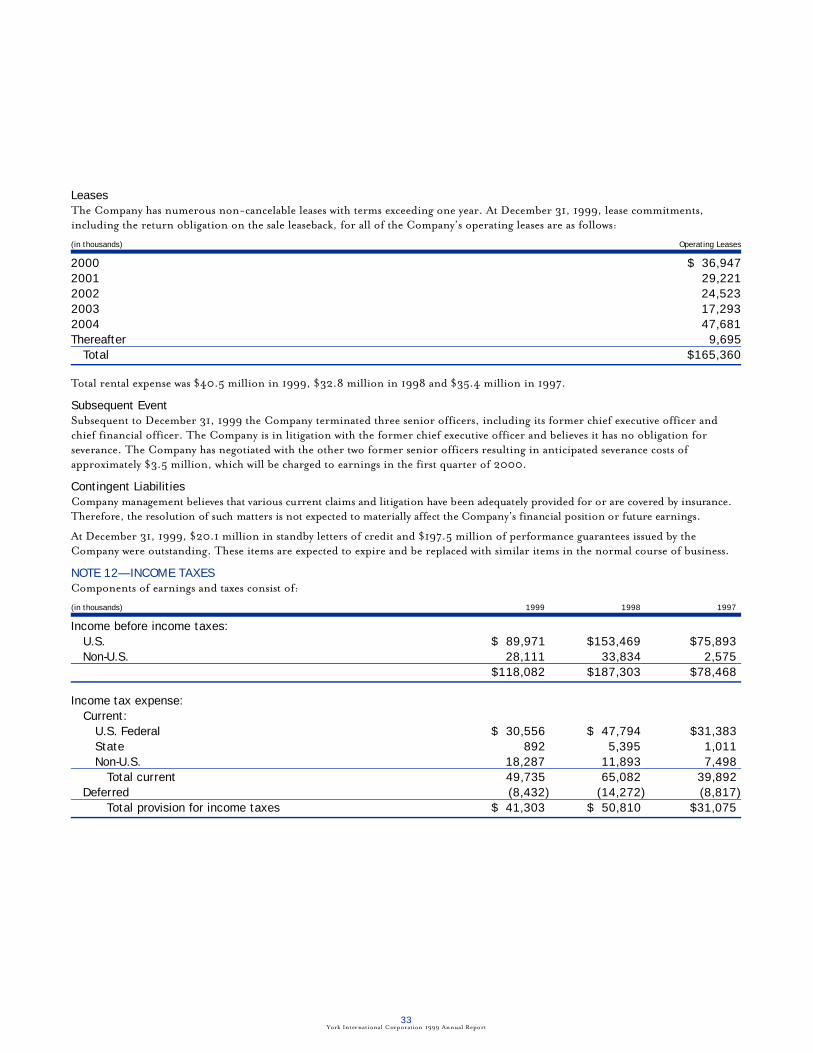
LeasesThe Company has numerous non-cancelable leases with terms exceeding one year. At December 31, 1999, lease commitments,
including the return obligation on the sale leaseback, for all of the Company’s operating leases are as follows:
(in thousands) Operating Leases
2000 $036,9472001 29,2212002 24,5232003 17,2932004 47,681Thereafter 9,695
Total $165,360
Total rental expense was $40.5 million in 1999, $32.8 million in 1998 and $35.4 million in 1997.
Subsequent EventSubsequent to December 31, 1999 the Company terminated three senior officers, including its former chief executive officer and
chief financial officer. The Company is in litigation with the former chief executive officer and believes it has no obligation for
severance. The Company has negotiated with the other two former senior officers resulting in anticipated severance costs of
approximately $3.5 million, which will be charged to earnings in the first quarter of 2000.
Contingent LiabilitiesCompany management believes that various current claims and litigation have been adequately provided for or are covered by insura n c e .
T h e re f o re, the resolution of such matters is not expected to materially affect the Company’s financial position or future earnings.
At December 31, 1999, $20.1 million in standby letters of credit and $197.5 million of performance guarantees issued by the
Company were outstanding. These items are expected to expire and be replaced with similar items in the normal course of business.
NOTE 12—INCOME TAXESComponents of earnings and taxes consist of:
(in thousands) 19991 19981 19971
Income before income taxes:U.S. $089,971) $153,469) $75,893)Non-U.S. 28,111) 33,834) 2,575)
$118,082) $187,303) $78,468)
Income tax expense:Current:
U.S. Federal $030,556) $047,794) $31,383)State 892) 5,395) 1,011)Non-U.S. 18,287) 11,893) 7,498)
Total current 49,735) 65,082) 39,892)Deferred (8,432) (14,272) (8,817)
Total provision for income taxes $041,303) $050,810) $31,075)
33York International Corporation 1999 Annual Report

Income tax expense differed from the amounts computed by applying the U.S. Federal income tax rate of 35% to income before
income taxes as a result of the following:
(in thousands) 19991 19981 19971
Tax expense at statutory rate $41,329) $)65,556) $)27,464)Increase (decrease) resulting from:
Equity in earnings of affiliates/minority interest (693) (498) (540)Taxes on foreign earnings 880) (16,389) 7,466)State income taxes—current 580) 3,507) 657)Purchase accounting adjustments 6,811) 3,511) 3,570)State income taxes—deferred (239) 621) (1,421)Export incentives (5,496) (4,122) (4,776)Other (1,869) (1,376) (1,345)
Total provision for income taxes $41,303) $)50,810) $)31,075)
The tax effects of temporary differences that give rise to significant portions of the deferred tax assets and deferred tax liabilities at
December 31, 1999 and 1998 are presented below:
(in thousands) 1999 1998
Deferred tax assets:Accounts receivable, principally due to allowance for doubtful accounts $005,013 $003,625Inventories, including uniform capitalization 19,981 18,359Compensated absences and benefits, principally
due to accrual for financial reporting purposes 13,222 12,294Contingencies, due to accrual for financial reporting purposes 8,285 7,860Warranty reserves, due to accrual for financial reporting purposes 24,480 23,928Postretirement benefits 57,089 54,970Other 35,128 28,556
Total gross deferred tax assets 163,198 149,592Deferred tax liabilities:
Plant, equipment and intangible assets due to purchase accountingadjustments and differences in depreciation and amortization 59,449 26,337
Inventory, due to purchase accounting adjustments 15,765 15,765Other 5,382 2,291
Total gross deferred tax liabilities 80,596 44,393Net deferred tax assets $082,602 $105,199
Based on the Company’s historical and current pre-tax earnings, management believes it is likely the Company will realize the net
deferred tax assets.
During 1998, the Internal Revenue Service (IRS) completed its examination of the Company’s Federal income tax returns for 1993
and 1994. The Company reached a settlement agreement with the IRS for those years; this settlement did not have a material effect on
the Company’s financial statements.
Various state and foreign tax returns are under examination by the applicable authorities. The Company does not anticipate any
material effect to the Company’s financial statements resulting from these examinations.
34York International Corporation 1999 Annual Report

Domestic income taxes or foreign withholding taxes have not been provided on $156 million and $124 million of undistributed
earnings of foreign subsidiaries and affiliates at December 31, 1999 and 1998, respectively. These earnings are considered to be
permanently invested in the businesses and, under the tax laws, are not subject to such taxes until distributed as dividends. If the
earnings were not considered permanently invested, approximately $9.3 million and $7.3 million of deferred income taxes,
consisting of foreign withholding taxes, would have been provided at December 31, 1999 and 1998, respectively. Such taxes, if
ultimately paid, may be recoverable as foreign tax credits in the U.S.
NOTE 13—RESEARCH AND DEVELOPMENTTotal re s e a rch and development costs charged to expense amounted to $41.0 million in 1999, $31.2 million in 1998 and $30.6 million
in 1997.
NOTE 14—ACQUISITIONS AND DIVESTITURESOn June 10, 1999, the Company acquired all of the outstanding capital stock of Sabroe A/S (Sabroe), a Danish company, for
$407.1 million in cash and assumed debt of $216.0 million. Sabroe is a world leader in supplying refrigeration systems and products.
In connection with the acquisition and restructuring, the following were considered in the allocation of the purchase price:
acquisition expenses of $7.3 million; deferred taxes of $30.4 million; non-cash write-downs of $4.4 million and other accruals of
$11.8 million.
The Company is in the process of executing the plan for integrating Sabroe into the York Refrigeration Group. The Sabroe portion
of the plan includes closing the Retech and Norrkoping manufacturing plants in Denmark and Sweden, respectively, closing certain
duplicate sales and service offices in Europe and Asia, product rationalizations and other costs related to the York Refrigeration
Group restructuring. The plan also includes Sabroe workforce reductions of approximately 500 salary and wage employees, of which
230 remain at December 31, 1999. The plan is expected to be substantially complete within one year from the acquisition date. The
table below details the restructuring activities discussed above.
Non-cash Established Utilized Remaining(in thousands) Write-downs Accruals in 1999 Accruals
Fixed assets write-downs $02,542 $0000— $00000— $0000—Inventory write-downs 1,849 — — —Severance costs — 9,299 3,402 5,897Contractual obligations — 1,911 336 1,575Other — 632 276 356
$04,391 $11,842 $004,014 $07,828
The acquisition has been accounted for under the purchase method of accounting and the Sabroe assets, liabilities and results of
operations, since acquisition, have been included in the consolidated financial statements. The preliminary allocation of the purchase
price and other costs as discussed above resulted in the following components of intangible assets, based on independent appraisals
and other information, and related straight-line amortization periods:
Intangible Amortization(in thousands) Assets Period
Unallocated excess of cost over net assets acquired $441,289 30 yearsTrademark and tradenames 35,480 30 yearsProprietary technology and patents 2,050 15 yearsTotal intangibles $478,819
35York International Corporation 1999 Annual Report
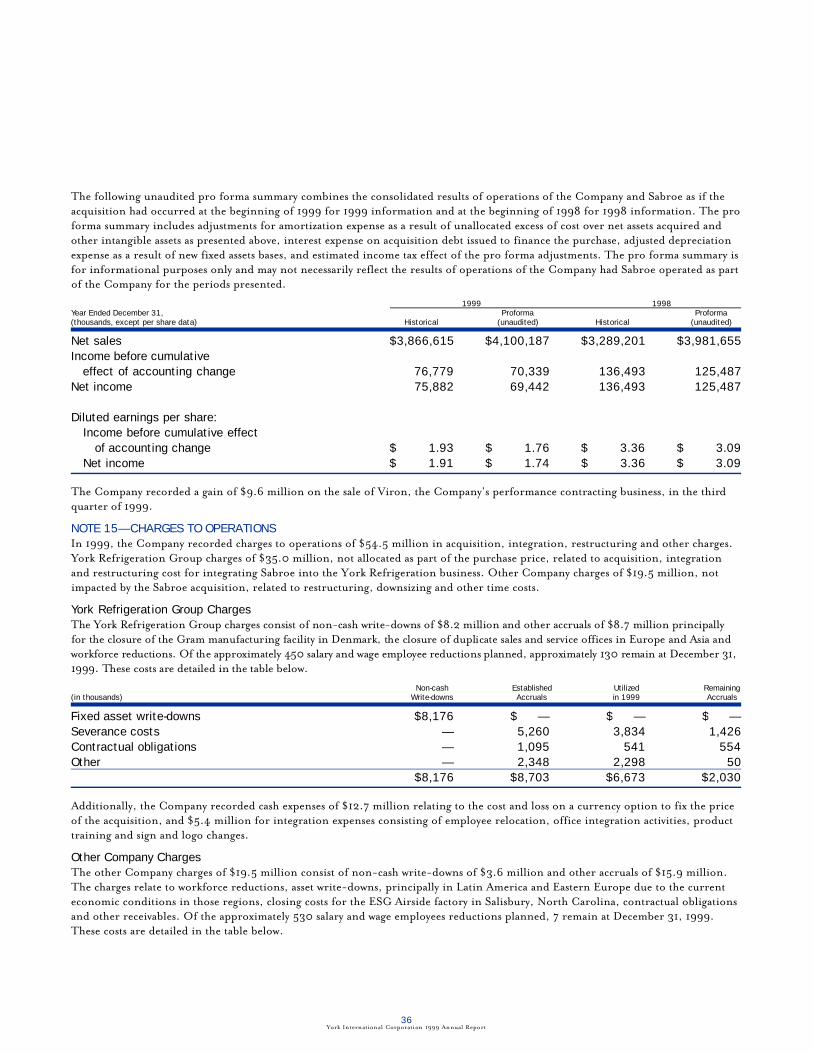
The following unaudited pro forma summary combines the consolidated results of operations of the Company and Sabroe as if the
acquisition had occurred at the beginning of 1999 for 1999 information and at the beginning of 1998 for 1998 information. The pro
forma summary includes adjustments for amortization expense as a result of unallocated excess of cost over net assets acquired and
other intangible assets as presented above, interest expense on acquisition debt issued to finance the purchase, adjusted depreciation
expense as a result of new fixed assets bases, and estimated income tax effect of the pro forma adjustments. The pro forma summary is
for informational purposes only and may not necessarily reflect the results of operations of the Company had Sabroe operated as part
of the Company for the periods presented.
1999 1998Year Ended December 31, Proforma Proforma(thousands, except per share data) Historical (unaudited) Historical (unaudited)
Net sales $3,866,615 $4,100,187 $3,289,201 $3,981,655Income before cumulative
effect of accounting change 76,779 70,339 136,493 125,487Net income 75,882 69,442 136,493 125,487
Diluted earnings per share:Income before cumulative effect
of accounting change $0,0001.93 $0,0001.76 $0,0003.36 $0,0003.09Net income $0,0001.91 $0,0001.74 $0,0003.36 $0,0003.09
The Company recorded a gain of $9.6 million on the sale of Viron, the Company’s performance contracting business, in the third
quarter of 1999.
NOTE 15—CHARGES TO OPERATIONSIn 1999, the Company recorded charges to operations of $54.5 million in acquisition, integration, restructuring and other charges.
York Refrigeration Group charges of $35.0 million, not allocated as part of the purchase price, related to acquisition, integration
and restructuring cost for integrating Sabroe into the York Refrigeration business. Other Company charges of $19.5 million, not
impacted by the Sabroe acquisition, related to restructuring, downsizing and other time costs.
York Refrigeration Group ChargesThe York Refrigeration Group charges consist of non-cash write-downs of $8.2 million and other accruals of $8.7 million principally
for the closure of the Gram manufacturing facility in Denmark, the closure of duplicate sales and service offices in Europe and Asia and
w o r k f o rce reductions. Of the approximately 450 salary and wage employee reductions planned, approximately 130 remain at December 31,
1999. These costs are detailed in the table below.
Non-cash E s t a b l i s h e d U t i l i z e d R e m a i n i n g(in thousands) Wr i t e - d o w n s A c c ru a l s in 1999 A c c ru a l s
Fixed asset write-downs $8,176 $000— $000— $000—Severance costs — 5,260 3,834 1,426Contractual obligations — 1,095 541 554Other — 2,348 2,298 50
$8,176 $8,703 $6,673 $2,030
Additionally, the Company recorded cash expenses of $12.7 million relating to the cost and loss on a currency option to fix the price
of the acquisition, and $5.4 million for integration expenses consisting of employee relocation, office integration activities, product
training and sign and logo changes.
Other Company ChargesThe other Company charges of $19.5 million consist of non-cash write-downs of $3.6 million and other accruals of $15.9 million.
The charges relate to workforce reductions, asset write-downs, principally in Latin America and Eastern Europe due to the current
economic conditions in those regions, closing costs for the ESG Airside factory in Salisbury, North Carolina, contractual obligations
and other receivables. Of the approximately 530 salary and wage employees reductions planned, 7 remain at December 31, 1999.
These costs are detailed in the table below.
36York International Corporation 1999 Annual Report
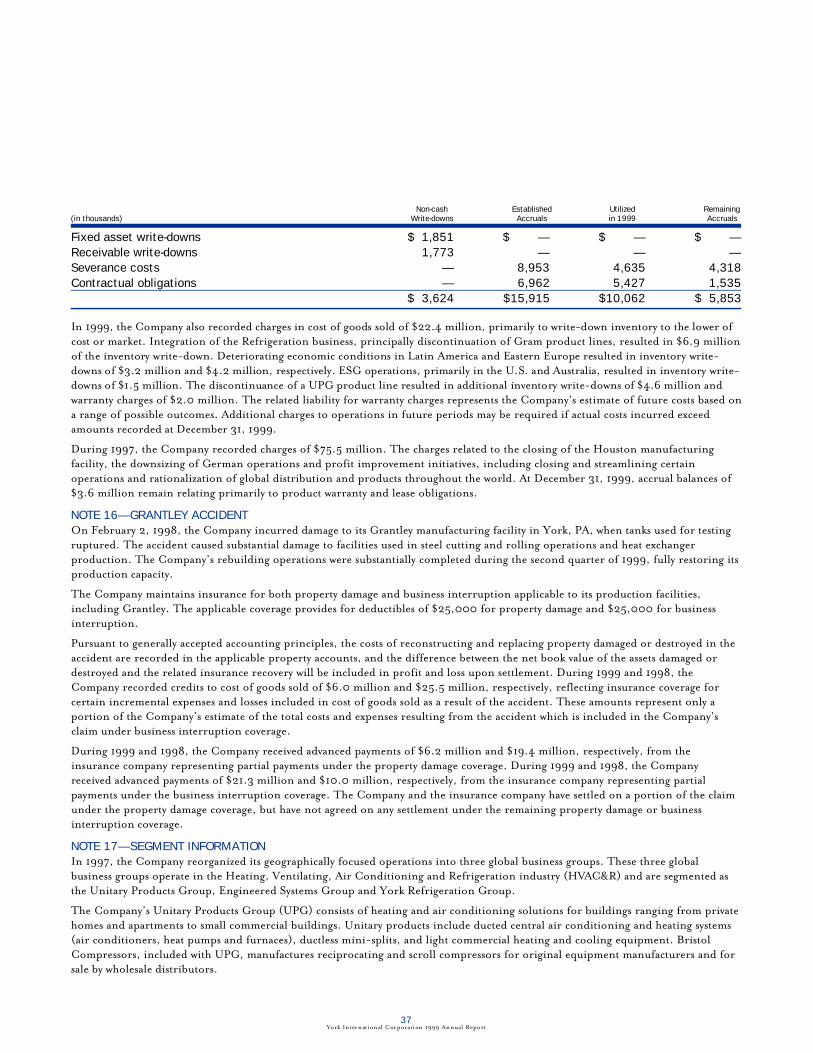
N o n - c a s h E s t a b l i s h e d U t i l i z e d R e m a i n i n g(in thousands) Wr i t e - d o w n s A c c ru a l s in 1999 A c c ru a l s
Fixed asset write-downs $01,851 $ ,000— $ ,000— $ ,000—Receivable write-downs 1,773 — — —Severance costs — 8,953 4,635 4,318Contractual obligations — 6,962 5,427 1,535
$03,624 $15,915 $10,062 $05,853
In 1999, the Company also re c o rded charges in cost of goods sold of $22.4 million, primarily to write-down inventory to the lower of
cost or market. Integration of the Refrigeration business, principally discontinuation of Gram product lines, resulted in $6.9 million
of the inventory write-down. Deteriorating economic conditions in Latin America and Eastern Europe resulted in inventory write-
downs of $3.2 million and $4.2 million, respectively. ESG operations, primarily in the U.S. and Australia, resulted in inventory write-
downs of $1.5 million. The discontinuance of a UPG product line resulted in additional inventory write-downs of $4.6 million and
warranty charges of $2.0 million. The related liability for warranty charges represents the Company’s estimate of future costs based on
a range of possible outcomes. Additional charges to operations in future periods may be required if actual costs incurred exceed
amounts recorded at December 31, 1999.
During 1997, the Company recorded charges of $75.5 million. The charges related to the closing of the Houston manufacturing
facility, the downsizing of German operations and profit improvement initiatives, including closing and streamlining certain
operations and rationalization of global distribution and products throughout the world. At December 31, 1999, accrual balances of
$3.6 million remain relating primarily to product warranty and lease obligations.
NOTE 16—GRANTLEY ACCIDENTOn February 2, 1998, the Company incurred damage to its Grantley manufacturing facility in York, PA, when tanks used for testing
ruptured. The accident caused substantial damage to facilities used in steel cutting and rolling operations and heat exchanger
production. The Company’s rebuilding operations were substantially completed during the second quarter of 1999, fully restoring its
production capacity.
The Company maintains insurance for both property damage and business interruption applicable to its production facilities,
including Grantley. The applicable coverage provides for deductibles of $25,000 for property damage and $25,000 for business
interruption.
Pursuant to generally accepted accounting principles, the costs of reconstructing and replacing property damaged or destroyed in the
accident are recorded in the applicable property accounts, and the difference between the net book value of the assets damaged or
destroyed and the related insurance recovery will be included in profit and loss upon settlement. During 1999 and 1998, the
Company recorded credits to cost of goods sold of $6.0 million and $25.5 million, respectively, reflecting insurance coverage for
certain incremental expenses and losses included in cost of goods sold as a result of the accident. These amounts represent only a
portion of the Company’s estimate of the total costs and expenses resulting from the accident which is included in the Company’s
claim under business interruption coverage.
During 1999 and 1998, the Company received advanced payments of $6.2 million and $19.4 million, respectively, from the
insurance company representing partial payments under the property damage coverage. During 1999 and 1998, the Company
received advanced payments of $21.3 million and $10.0 million, respectively, from the insurance company representing partial
payments under the business interruption coverage. The Company and the insurance company have settled on a portion of the claim
under the property damage coverage, but have not agreed on any settlement under the remaining property damage or business
interruption coverage.
NOTE 17—SEGMENT INFORMATIONIn 1997, the Company reorganized its geographically focused operations into three global business groups. These three global
business groups operate in the Heating, Ventilating, Air Conditioning and Refrigeration industry (HVAC&R) and are segmented as
the Unitary Products Group, Engineered Systems Group and York Refrigeration Group.
The Company’s Unitary Products Group (UPG) consists of heating and air conditioning solutions for buildings ranging from private
homes and apartments to small commercial buildings. Unitary products include ducted central air conditioning and heating systems
(air conditioners, heat pumps and furnaces), ductless mini-splits, and light commercial heating and cooling equipment. Bristol
Compressors, included with UPG, manufactures reciprocating and scroll compressors for original equipment manufacturers and for
sale by wholesale distributors.
37York Internat ional Corporation 1999 Annual Report

The Company’s Engineered Systems Group (ESG) consists of heating and air conditioning solutions for buildings ranging from
small office buildings and fast food restaurants to large commercial and industrial complexes. Engineered Systems air conditioning
products include air-cooled and water-cooled chillers, central air handling units, variable air volume units, control equipment to
monitor and control the entire system, maintenance and service. ESG manufactures and provides custom design solutions for large
systems used in hospitals, office towers, hotels and airports. ESG also supplies specially designed chilled water systems for use on naval
and commercial marine vessels.
The Company’s York Refrigeration Group (YRG) consists of screw and reciprocating compressors, condensers, evaporators, heat
exchangers, process refrigeration systems, hygienic air distribution systems, gas compression systems, automated plant control systems,
refrigeration contracting, maintenance and service.
The following table represents the Company’s operating results by segment:
(in thousands) 19991 19981 19971
Net sales:Unitary Products Group:
Bristol Compressors $0,579,686) $0,529,809) $0,504,024)Residential and light commercial products 1,098,514) 1,055,627) 964,648)Intragroup compressor sales (108,721) (103,676) (76,294)
1,569,479) 1,481,760) 1,392,378)Engineered Systems Group 1,460,736) 1,408,091) 1,396,436)York Refrigeration Group 883,609) 447,499) 447,093)Eliminations (1) (47,209) (48,149) (42,250)
$3,866,615) $3,289,201) $3,193,657)
(1) Eliminations include the following intersegment sales:Unitary Products Group $0,013,330) $0,010,936) $0,012,609)Engineered Systems Group 12,802) 12,710) 7,236)York Refrigeration Group 21,077) 24,503) 22,405)Eliminations (1) $0,047,209) $0,048,149) $0,042,250)
Income from operations:Unitary Products Group:
Bristol Compressors $0,058,990) $0,053,152) $0,044,860)Residential and light commercial products 97,247) 87,330) 57,864)
156,237) 140,482) 102,724)Engineered Systems Group 114,689) 125,170) 118,278)York Refrigeration Group 44,527) 27,420) 22,734)Eliminations, general corporate expenses
and other non-allocated items (151,508) (64,368) (129,734)$0,163,945) $,0228,704) $0,114,002)
Equity in (earnings) losses of affiliates:Unitary Products Group:
Bristol Compressors $000(2,640) $0,000,785) $0.,0(5,732)Residential and light commercial products (867) 318) 1,792)
(3,507) 1,103) (3,940)Engineered Systems Group (1,769) (1,260) (1,402)York Refrigeration Group (384) 31) —)
$0,,0(5,660) $0,000(126) $000(5,342)
Gain on sale of business $0,,0(9,627) $))00000—) $))00000—)Interest expense, net 61,150) 41,527) 40,876)Income before income taxes and cumulative effect of accounting change $0,118,082) $0,187,303) $0,078,468)Provision for income taxes 41,303) 50,810) 31,075)Income before cumulative effect of accounting change $0,076,779) $0,136,493) $0,047,393)
38York International Corporation 1999 Annual Report

(in thousands) 19991 19981 19971
Total assets:Unitary Products Group:
Bristol Compressors $0,217,792) $0,207,624) $0,201,863)Residential and light commercial products 569,223) 511,669) 488,105)Eliminations and other non-allocated assets (14,267) (14,225) (7,370)
772,748) 705,068) 682,598)Engineered Systems Group 714,212) 713,943) 703,498)York Refrigeration Group 669,317) 272,039) 237,179)Eliminations and other non-allocated assets 718,262) 415,488) 373,023)
$2,874,539) $2,106,538) $1,996,298)
Depreciation and amortization of property, plant and equipment:Unitary Products Group:
Bristol Compressors $0,010,536) $0,010,003) $00,09,357)Residential and light commercial products 16,192) 16,539) 14,006)
26,728) 26,542) 23,363)Engineered Systems Group 18,299) 16,871) 15,679)York Refrigeration Group 15,162) 9,502) 9,351)Other non-allocated depreciation and amortization 3,982) 4,870) 4,383)
$0,064,171) $,0057,785) $0,052,776)
Capital expenditures:Unitary Products Group:
Bristol Compressors $0,015,698) $0,011,436) $0,011,558)Residential and light commercial products 19,266) 13,088) 13,963)
34,964) 24,524) 25,521)Engineered Systems Group 37,074) 28,257) 23,413)Refrigeration Products Group 17,949) 9,001) 15,095)Other non-allocated capital expenditures 14,078) 2,856) 2,825)
$,0104,065) $,0064,638) $0,066,854)
Other non-allocated costs for management reporting include goodwill amortization, certain pension costs, Olympic sponsorship costs,
i n t e g ration costs, restructuring costs, other corporate costs, interest and income taxes. Non-allocated assets primarily consist of pre p a i d
pension expenses, deferred tax assets, goodwill, LIFO inventory reserves, and other corporate assets. For management re p o r t i n g ,
intersegment sales are re c o rded on a cost-plus basis and are re c o rded at cost by the buying segment. Business unit management
performance is based on earnings before interest and taxes adjusted by a charge for capital and, to a lesser extent, earnings per share .
39York International Corporation 1999 Annual Report

The Company’s sales are 52% to the United States and 48% to non-U.S. countries in 1999 and 58% to the United States and 42% to
non-U.S. countries for 1998 and 1997. No single non-U.S. country or single customer accounts for greater than 10% of the
Company’s sales. Information related to United States and non-U.S. sales to outside customers, based on the location of the assets
generating the sales, is as follows:
(in thousands) 1999 1998 1997
Net Sales:United States $2,309,364 $2,200,137 $2,155,174Other 1,557,251 1,089,064 1,038,483
$3,866,615 $3,289,201 $3,193,657
Included in United States sales are export sales of $307.0 million in 1999, $301.5 million in 1998 and $316.3 million in 1997.
The location of the Company’s net property, plant and equipment is as follows:
1999 1998 1997
Net property, plant and equipment:United States 53% 76% 78%Denmark 23% 4% 4%Other 24% 20% 18%
100% 100% 100%
At December 31, 1999, Denmark was the only non-U.S. country with greater than 10% of the Company’s consolidated net property,
plant and equipment. No single non-U.S. country had greater than 10% of the Company’s consolidated net property, plant and
equipment at December 31, 1998 or 1997.
NOTE 18—STOCKHOLDERS’ EQUITYThe 1992 Employee Stock Purchase Plan authorizes the allocation of 1,500,000 shares of common stock for the Plan. An additional
500,000 shares were authorized in February 1999. The purchase price of the shares under the Purchase Plan is 85% of the lower of
the fair market value of shares at the beginning of the period or end of the period. No compensation expense is recorded in
connection with the Plan. In 1999, 1998 and 1997, there were 205,980 shares, 225,861 shares and 165,169 shares, respectively,
purchased by employees at a price of $23.32 per share, $33.63 per share and $33.63 per share, respectively.
During May 1997 and February 1999, amendments to the 1992 Omnibus Stock Plan were approved. The amended and restated 1992
Omnibus Stock Plan authorizes the issuance of up to 7,880,000 shares of the Company’s common stock under stock option or
restricted share awards, of which up to 3% of the total outstanding shares are available for restricted share awards. The exercise price
of stock options granted under the Plan is equal to the fair market value of the shares on the date the option is granted. The restricted
shares are granted at a price determined by the Board of Directors. In 1999, 1998 and 1997 under the 1992 Omnibus Stock Plan, key
employees were awarded 23,500, 32,000 and 40,000 shares, respectively, of restricted common stock generally vesting over four
years. Accordingly, unearned compensation of $0.9 million, $1.1 million and $2.0 million was recorded as a charge to equity in
1999, 1998 and 1997, respectively, which is being amortized over the vesting period.
40York International Corporation 1999 Annual Report
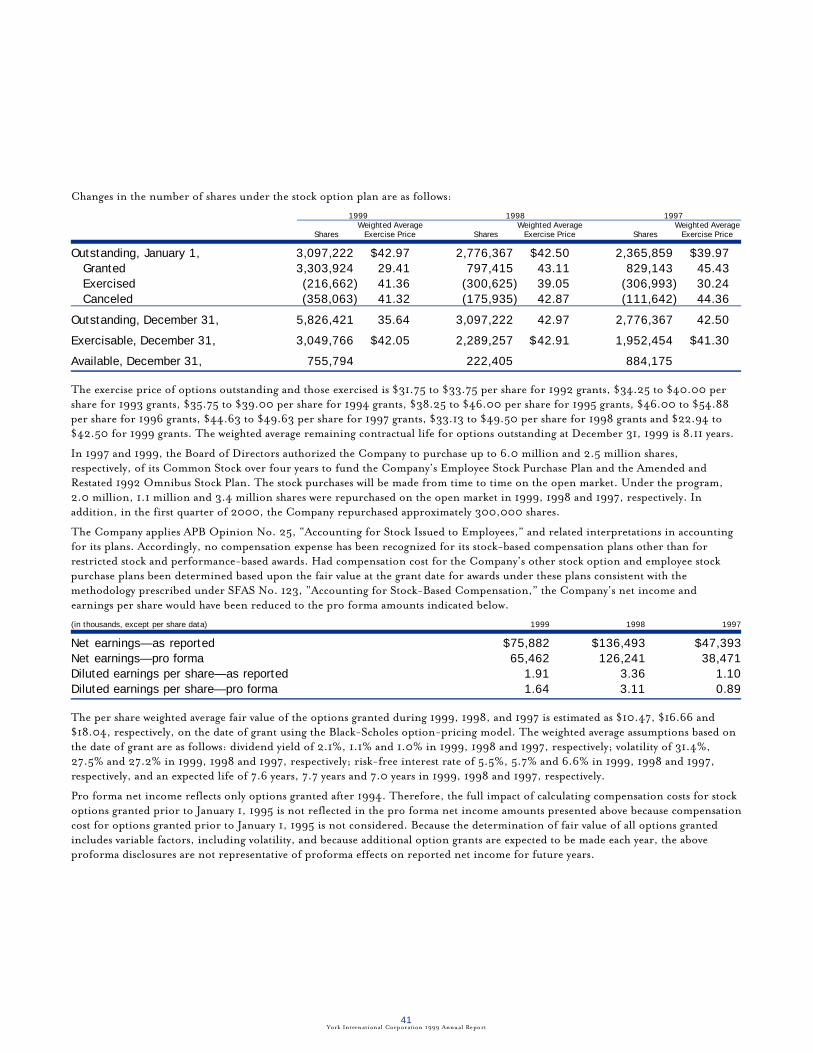
Changes in the number of shares under the stock option plan are as follows:
1999 1998 1997Weighted Average Weighted Average Weighted Average
Shares Exercise Price Shares Exercise Price Shares Exercise Price
Outstanding, January 1, 3,097,222) $42.97 2,776,367) $42.50 2,365,859) $39.97Granted 3,303,924) 29.41 797,415) 43.11 829,143) 45.43Exercised (216,662) 41.36 (300,625) 39.05 (306,993) 30.24Canceled (358,063) 41.32 (175,935) 42.87 (111,642) 44.36
Outstanding, December 31, 5,826,421) 35.64 3,097,222) 42.97 2,776,367) 42.50
Exercisable, December 31, 3,049,766) $42.05 2,289,257) $42.91 1,952,454) $41.30
Available, December 31, 755,794) 222,405) 884,175) )
The exercise price of options outstanding and those exercised is $31.75 to $33.75 per share for 1992 grants, $34.25 to $40.00 per
share for 1993 grants, $35.75 to $39.00 per share for 1994 grants, $38.25 to $46.00 per share for 1995 grants, $46.00 to $54.88
per share for 1996 grants, $44.63 to $49.63 per share for 1997 grants, $33.13 to $49.50 per share for 1998 grants and $22.94 to
$42.50 for 1999 grants. The weighted average remaining contractual life for options outstanding at December 31, 1999 is 8.11 years.
In 1997 and 1999, the Board of Directors authorized the Company to purchase up to 6.0 million and 2.5 million shares,
respectively, of its Common Stock over four years to fund the Company’s Employee Stock Purchase Plan and the Amended and
Restated 1992 Omnibus Stock Plan. The stock purchases will be made from time to time on the open market. Under the program,
2.0 million, 1.1 million and 3.4 million shares were repurchased on the open market in 1999, 1998 and 1997, respectively. In
addition, in the first quarter of 2000, the Company repurchased approximately 300,000 shares.
The Company applies APB Opinion No. 25, “Accounting for Stock Issued to Employees,” and related interpretations in accounting
for its plans. Accordingly, no compensation expense has been recognized for its stock-based compensation plans other than for
restricted stock and performance-based awards. Had compensation cost for the Company’s other stock option and employee stock
purchase plans been determined based upon the fair value at the grant date for awards under these plans consistent with the
methodology prescribed under SFAS No. 123, “Accounting for Stock-Based Compensation,” the Company’s net income and
earnings per share would have been reduced to the pro forma amounts indicated below.
(in thousands, except per share data) 1999 1998 1997
Net earnings—as reported $75,882 $136,493 $47,393Net earnings—pro forma 65,462 126,241 38,471Diluted earnings per share—as reported 1.91 3.36 1.10Diluted earnings per share—pro forma 1.64 3.11 0.89
The per share weighted average fair value of the options granted during 1999, 1998, and 1997 is estimated as $10.47, $16.66 and
$18.04, respectively, on the date of grant using the Black-Scholes option-pricing model. The weighted average assumptions based on
the date of grant are as follows: dividend yield of 2.1%, 1.1% and 1.0% in 1999, 1998 and 1997, respectively; volatility of 31.4%,
27.5% and 27.2% in 1999, 1998 and 1997, respectively; risk-free interest rate of 5.5%, 5.7% and 6.6% in 1999, 1998 and 1997,
respectively, and an expected life of 7.6 years, 7.7 years and 7.0 years in 1999, 1998 and 1997, respectively.
Pro forma net income reflects only options granted after 1994. Therefore, the full impact of calculating compensation costs for stock
options granted prior to January 1, 1995 is not reflected in the pro forma net income amounts presented above because compensation
cost for options granted prior to January 1, 1995 is not considered. Because the determination of fair value of all options granted
includes variable factors, including volatility, and because additional option grants are expected to be made each year, the above
proforma disclosures are not representative of proforma effects on reported net income for future years.
41York International Corporation 1999 Annual Report

NOTE 19—EARNINGS PER SHARE RECONCILIATION OF SHARES OUTSTANDINGNet income as set forth in the statements of operations is used in the computation of basic and diluted earnings per share
information. Reconciliations of shares used in the computations of earnings per share are as follows:
(in thousands) 1999 1998 1997
Weighted average common shares outstanding usedin the computation of basic earnings per share 39,637 40,402 42,550
Effect of dilutive securities:Non-vested restricted shares 61 132 167Stock options 134 88 323
Weighted average common shares and equivalents usedin the computation of diluted earnings per share 39,832 40,622 43,040
42York International Corporation 1999 Annual Report
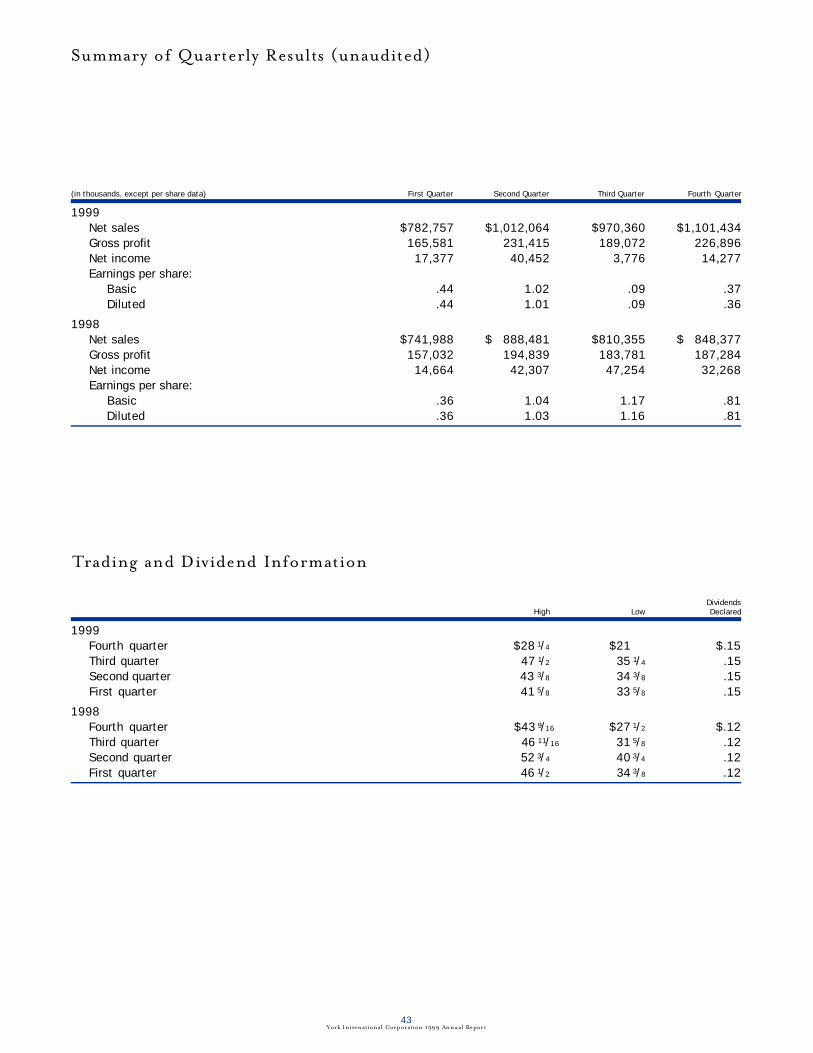
43York International Corporation 1999 Annual Report
(in thousands, except per share data) First Quarter Second Quarter Third Quarter Fourth Quarter
1999Net sales $782,757 $1,012,064 $970,360 $1,101,434Gross profit 165,581 231,415 189,072 226,896Net income 17,377 40,452 3,776 14,277Earnings per share:
Basic .44 1.02 .09 .37Diluted .44 1.01 .09 .36
1998Net sales $741,988 $1,888,481 $810,355 $0,848,377Gross profit 157,032 194,839 183,781 187,284Net income 14,664 42,307 47,254 32,268Earnings per share:
Basic .36 1.04 1.17 .81Diluted .36 1.03 1.16 .81
Summary of Quarterly Results (unaudited)
DividendsHigh Low Declared
1999Fourth quarter $28 1/4 $21 1/2 $.15Third quarter 47 1/2 35 1/4 .15Second quarter 43 3/8 34 3/8 .15First quarter 41 5/8 33 5/8 .15
1998Fourth quarter $43 9/16 $27 1/2 $.12Third quarter 46 11/16 31 5/8 .12Second quarter 52 3/4 40 3/4 .12First quarter 46 1/2 34 3/8 .12
Trading and Dividend Information
44York International Corporation 1999 Annual Report
INVESTOR AND STOCKHOLDER INFORMATION
Stockholder InquiriesQuestions concerning your account, dividend payments,
address changes, consolidation of duplicate accounts, lost
certificates and related matters should be addressed to York
International Corporation’s transfer agent:
Chase Mellon Shareholder Services, L.L.C.
P.O. Box 3315
South Hackensack, NJ 07606-1915
1-800-851-9677
http://www.chasemellon.com
Dividend PolicyThe declaration and payment of quarterly dividends is made
at the discretion of York’s Board of Directors. The dividend
is reviewed by the board quarterly. York has paid quarterly
dividends on its common shares without interruption since
going public in 1991.
Direct Deposit of DividendsStockholders who would like their dividends directly
deposited in a U.S. bank account should contact the transfer
agent at the above address for an enrollment form.
Dividend Reinvestment ProgramAn automatic dividend reinvestment plan is available to all
stockholders of re c o rd. Dividends can be automatically
reinvested in York common stock. Participants also may add cash
for the purchase of additional shares. For more information,
contact Chase Mellon Shareholder Services, L.L.C.,
at (800) 437-6726.
Investor Relations ProgramYork International has an active investor relations program
directed to both individual and institutional investors. The
Company’s investor relations mission is to maintain an
ongoing awareness of the Company’s performance among its
stockholders and the financial community. The Company
welcomes inquiries from its investors, large or small, as well
as from members of the financial community. For further
information, contact:
Investor Relations Department
York International Corporation
P.O. Box 1592-364F
York, PA 17405-1592
Telephone: (717) 771-7409
Fax: (717) 771-7381
About York’s ShareholdersAt year-end, the Company had approximately 5,000 re g i s t e re d
s h a reholders. Approximately 10% of the Company shares were
held by individual investors. The Company shares were also
held by about 150 institutions. At year-end, there were
approximately 3,500 employee shareholders participating in
the York International Employee Stock Purchase Plan, for an
estimated 19% enrollment of eligible employees.
CORPORATE DATA
Corporate OfficesStreet Address:
York International Corporation
631 South Richland Avenue
York, PA 17403
Mailing Address:
York International Corporation
P.O. Box 1592
York, PA 17405-1592
Telephone: (717) 771-7890
Fax: (717) 771-7381
Additional InformationStockholder, financial and other information about York is
available from several sources. The Company’s 10K Report,
10Q and Quarterly Reports to Stockholders are available
through the Company’s automated telephone system by
dialing (717) 771-7409.
You can also request these publications by writing:
Investor Relations
York International Corporation
P.O. Box 1592-364F
York, PA 17405-1592
Fax: (717) 771-7381
E-mail: [email protected]
York news releases, including earnings announcements,
a re available by fax 24 hours a day through Company News
On-Call at (800) 758-5804. The York extension is 992638.
You can access financial and other information, such as
quarterly press releases on earnings and product
announcements, through the Internet. To connect to York’s
website, set your browser software to: http://www.york.com
Stock Exchange ListingThe New York Stock Exchange
Stock Trading SymbolYRK
Investor and Stockholder Information and Corporate Data
B o a rd of Dire c t o r s
MICHAEL R. YOUNGPresident and Chief Executive Officer
OLE ANDERSENVice President and President of
R e f r i g e ration Products Group
JAMES F. DAMIANIVice President and President of
Unitary Products Group
WAYNE J. KENNEDYVice President and President of
Bristol Compre s s o r s
PETER C. SPELLARVice President and President of Engineere d
Systems Group
DALE L. BENNETTVice President, Human Resourc e s
CHARLES F. CARGILEVice President, Finance and Corpora t e
D e v e l o p m e n t
JANE G. DAVISVice President, Secretary and
G e n e ral Counsel
HELEN S. MARSTELLERVice President, Investor Relations
C. DAVID MYERSVice President and Chief Financial Officer
JAMES P. CORCORANTre a s u re r
DAVID R. HECKController
O f f i c e r s
GERALD C. MCDONOUGHPrivate Business Consultant
R e t i red Chairman and Chief Executive
Officer of Leaseway Holdings, Inc.
Chairman of the Board and member of the
Finance, and Nominating and Governance
C o m m i t t e e s
MALCOLM W. GAMBILLR e t i red Chairman and Chief Executive
Officer of Harsco Corpora t i o n
Member of the Audit, Compensation,
Executive, and Nominating and Governance
C o m m i t t e e s
ROBERT F. B. LOGANR e t i red Chairman and Chief Executive
Officer of Banc One Arizona Corpora t i o n
Member of the Audit, Compensation, and
Finance Committees
DONALD M. ROBERTSR e t i red Vice Chairman and Tre a s u rer of
United States Trust Company of New Yo r k
and its parent, U.S. Trust Corporation
Chairman of the Audit Committee and
member of the Executive, and Nominating
and Governance Committees
MICHAEL R. YOUNGPresident and Chief Executive Officer
JOHN R. TUCKERFormer Chief Executive Officer and
Pre s i d e n t
JAMES A. URRYVice President of Citicorp Ve n t u re
Capital, Ltd.
Member of the Audit, Compensation,
and Executive Committees
JOHN E. WELSH, IIIVice Chairman of Mobile
Telecommunications Te c h n o l o g i e s
C o r p o ra t i o n
Chairman of the Finance Committee and
member of the Executive Committee
WALTER B. WRISTONPrivate Business Consultant
R e t i red Chairman and Chief Executive
Officer of Citicorp
Chairman of the Compensation and
Executive Committees
The trademarks AIR PRO; BRISTOL; FRASER-JOHNSTON; GUARDIAN; LUXAIRE; ACUAIR; FRICK; FRIGIDCOIL; IMECO; NORTHFIELD; RECO and YORK are registered in theUnited States Patent and Trademark Office by York International Corporation or its affiliates. SABROE; NOVENCO; RETECH; GRAM REFRIGERATION; RECOLD; and RITECOIL are trademarks of York International Corporation or its affiliates.