1999 mortality technical notes
TRANSCRIPT
Deaths: Final Data for 1999 (Technical Notes and References)Donna L. Hoyert, Ph.D., Elizabeth Arias, Ph.D., Betty L. Smith, B.S. Ed.,Sherry L. Murphy, Kenneth D. Kochanek, M.A., Division of Vital Statistics
Volume 49, Number 8 September 21, 2001

90 National Vital Statistics Report, Vol. 49, No. 8, September 21, 2001
Technical notes
Nature and sources of data
Data in this report are based on information from all deathcertificates filed in the 50 States and the District of Columbia. TheU.S. Standard Certificate of Death—which is used as a model by theStates—was last revised in 1989; for additional details see the 1989revision of the U.S. standard certificates and reports (21) andTechnical Appendix of Vital Statistics of the United States, 1989,Volume II, Mortality, part A (22). Data for Puerto Rico, the VirginIslands, Guam, American Samoa, and the Northern Marianas areincluded in tables showing data by State, but are not included in U.S.totals.
Mortality statistics are based on information coded by the Statesand provided to the National Center for Health Statistics (NCHS)through the Vital Statistics Cooperative Program (VSCP) and fromcopies of the original certificates received by NCHS from the Stateregistration offices. In 1999 all the States and the District of Columbiaparticipated in this program and submitted part or all of the mortalitydata for 1999 in electronic data files to NCHS. All States providedprecoded medical (cause-of-death) data to NCHS except Arizona,Illinois, Kentucky, Missouri, New Jersey, Ohio, and West Virginia, NewYork City, and the District of Columbia. For 1999 all States submittedprecoded demographic data for all deaths.
Data for the entire United States refer to events occurring withinthe United States. Data shown for geographic areas are by place ofresidence. Beginning with 1970 mortality statistics for the United Statesexclude deaths of nonresidents of the United States. All data excludefetal deaths.
Mortality statistics for Puerto Rico, Virgin Islands, AmericanSamoa, and Northern Marianas exclude deaths of nonresidents ofPuerto Rico, Virgin Islands, American Samoa, and Northern Marianas,respectively. For Guam, however, mortality statistics exclude deathsthat occurred to a resident of any place other than Guam or the UnitedStates.
Cause-of-death classification
The mortality statistics presented in this report were compiled inaccordance with the World Health Organization (WHO) regulations,which specify that member nations classify and code causes of deathin accordance with the current revision of the International StatisticalClassification of Diseases and Related Health Problems (ICD). TheICD provides the basic guidance used in virtually all countries to codeand classify causes of death. Effective with deaths occurring in 1999,the United States began using the Tenth Revision of this classifica-tion, (ICD–10) (6); during the period 1979–98, causes were codedand classified according to the Ninth Revision (ICD–9) (8). For earlieryears causes of death were classified according to the revisions thenin use—1968–78, Eighth Revision, adapted for use in the UnitedStates; 1958–67, Seventh Revision; and 1949–57, Sixth Revision.
Changes in classification of causes of death due to these revisionsmay result in discontinuities in cause-of-death trends. Discontinuitiesbetween the Ninth and Tenth Revisions of the ICD for selected causesof death are measured using comparability ratios from a comparabilitystudy described in the section Comparability between ICD–9 andICD–10 for mortality. Comparability ratios between the Eighth and Ninth
Revisions, between the Seventh and Eighth Revisions, and betweenthe Sixth and Seventh Revisions may be found in other NCHS reports(23–25).
The ICD not only details disease classification but also providesdefinitions, tabulation lists, the format of the death certificate, and therules for coding cause of death. Cause-of-death data presented in thispublication were coded by procedures outlined in annual issues of theNCHS Instruction Manual (26–28). It includes rules for selecting theunderlying cause of death for tabulation purposes, definitions, tabu-lation lists, and regulations on the use of the Classification.
Before data for 1968, mortality medical data were based onmanual coding of an underlying cause of death for each certificate inaccordance with WHO rules. Effective with data year 1968, NCHSconverted to computerized coding of the underlying cause and manualcoding of all causes (multiple causes) on the death certificate. In thissystem, called ‘‘Automated Classification of Medical Entities’’ (ACME)(29), multiple cause codes serve as inputs to the computer softwarethat employs WHO rules to select the underlying cause. All cause-of-death data in this report are coded using ACME.
The ACME system is used to select the underlying cause of deathfor all death certificates in the United States. In addition, NCHS hasdeveloped two computer systems as inputs to ACME. Beginning with1990 data, the Mortality Medical Indexing, Classification, and Retrievalsystem (MICAR) (30,31), was introduced to automate coding multiplecauses of death. In addition, MICAR provides more detailed informationon the conditions reported on death certificates than is availablethrough the International Classification of Diseases (ICD) code struc-ture. Beginning with data year 1993, SuperMICAR, an enhancementof the MICAR system, was introduced. SuperMICAR allows for literalentry of the multiple cause-of-death text as reported by the certifier. Thisinformation is then automatically processed by the MICAR and ACMEcomputer systems. Records that cannot be automatically processed byMICAR or SuperMICAR are manually multiple-cause coded and thenfurther processed through ACME.
For 1999 approximately 39 percent of the Nation’s death recordswere multiple-cause coded using SuperMICAR, and 61 percent usingMICAR only. This represents data from 27 States that were coded bySuperMICAR and data from 23 States, the District of Columbia, andNew York City that were coded by MICAR.
In this report tabulations of cause-of-death statistics are basedsolely on the underlying cause of death. The underlying cause isdefined by WHO as ‘‘the disease or injury which initiated the train ofmorbid events leading directly to death, or the circumstances of theaccident or violence which produced the fatal injury’’ (6). It is selectedfrom the conditions entered by the physician in the cause-of-deathsection of the death certificate. When more than one cause or conditionis entered by the physician, the underlying cause is determined by thesequence of conditions on the certificate, provisions of the ICD, andassociated selection rules and modifications. Generally, more medicalinformation is reported on death certificates than is directly reflectedin the underlying cause of death. This is captured in NCHS multiplecause-of-death statistics (32–34).
Tabulation lists and cause-of-death ranking
Tabulation lists for ICD–10 were developed to maximize conti-nuity with ICD–9. This continuity is especially useful in trend analysisand in identifying causes of death that are of public health and
National Vital Statistics Report, Vol. 49, No. 8, September 21, 2001 91
medical importance. The lists are published in the NCHS InstructionManual, Part 9, ICD–10 Cause-of-Death Lists for Tabulating MortalityStatistics, Effective 1999 (35). For this report two tabulation lists areused, namely, the List of 113 Selected Causes of Death used fordeaths of all ages, and the List of 130 Selected Causes of InfantDeath used for infants. These lists are also used to rank leadingcauses of death for the two population groups. For the List of 113Selected Causes of Death, the group titles Major cardiovasculardiseases (ICD–10 codes I00–I78) and Symptoms, signs, andabnormal clinical and laboratory findings, not elsewhere classified(ICD–10 codes R00–R99), are not ranked. In addition, category titlesthat begin with the words ‘‘Other’’ and ‘‘All other’’ are not ranked todetermine the leading causes of death. When one of the titles thatrepresents a subtotal is ranked (for example, Tuberculosis (ICD–10codes A16–A19)), its component parts are not ranked (in this case,Respiratory tuberculosis (ICD–10 code A16) and Other tuberculosis(ICD–10 codes A17–A19)). For the List of 130 Selected Causes ofInfant Death, the same ranking procedures are used, except that thecategory Major cardiovascular diseases is not in the list.
Cause-of-death titles in ICD–10 differ in some cases from thosein ICD–9. A comparison of cause-of-death titles for the 15 leadingcauses of death between ICD–9 and ICD–10 is shown in table I. For7 of the 15 leading causes of death the titles between ICD–9 andICD–10 are the same.
The 10 leading causes of infant death were affected by theintroduction of ICD–10 as well. A comparison of cause-of-death titlesfor the 10 leading causes of infant death between ICD–9 and ICD–10are shown in table II. For 4 of the 10 leading causes of infant death,the titles between ICD–9 and ICD–10 are the same.
The change in the tabulation lists and coding rules for selectingthe underlying cause of death between ICD–9 and ICD–10 has impli-cations for ranking leading causes of death (9). The top five causesof death and causes of infant death did not change in rank; however,changes in rank for causes ranked sixth and lower resulted from usingICD–10 instead of ICD–9.
Race and Hispanic origin
Race and Hispanic origin are reported separately on the deathcertificate. Therefore, data shown by race include persons of His-panic or non-Hispanic origin, and data for Hispanic origin includepersons of any race. In this report, unless otherwise specified, deathsof Hispanic origin are included in the totals for each race group—white, black, American Indian, and Asian or Pacific Islander (API)—according to the decedent’s race as reported on the death certificate.Data shown for Hispanic persons include all persons of Hispanicorigin of any race.
Mortality data for the Hispanic-origin population are based ondeaths to residents of all 50 States and the District of Columbia. Datayear 1997 was the first year that mortality data for the Hispanicpopulation were available for the entire United States.
Quality of race and Hispanic origin data—Death rates for Hispanic,American Indian, and API persons should be interpreted with cautionbecause of inconsistencies in reporting Hispanic origin or race on thedeath certificate as compared with race on censuses, surveys, and birthcertificates. Studies have shown underreporting on death certificatesof American Indians, API, and Hispanic decedents; and undercounts
of these groups in the censuses (14,36).A number of studies have been conducted on the reliability of racereported on the death certificate by comparing race on the deathcertificate with that reported on another data collection instrument, suchas the census or a survey. Differences may arise because of differencesin who provides race information on the compared records. Raceinformation on the death certificate is reported by the funeral directoras provided by an informant or in the absence of an informant, on thebasis of observation. In contrast, race on the census or on the CurrentPopulation Survey (CPS) is obtained while the individual is alive andis self-reported or reported by another member of the householdfamiliar with the individual and, therefore, may be considered morevalid. A high level of agreement between the death certificate and thecensus or survey report is essential to assure unbiased death rates byrace.
Studies (36,37) show that a person self-reported as AmericanIndian or Asian on census or survey records was sometimes reportedas white on the death certificate. The net effect of misclassification isan underestimation of deaths and death rates for races other than whiteand black. In addition, undercoverage of minority groups in the censusand resultant population estimates introduces biases into death ratesby race (5,14,38). Estimates of the approximate effect of the combinedbias due to race misclassification on death certificates and under-enumeration on the 1990 census are as follows: white, –1.0 percent;black, –5.0; American Indian, +20.6; Asian or Pacific Islander, +10.7(14).
The National Longitudinal Mortality Study (NLMS) examined thereliability of Hispanic origin reported on 43,520 death certificates withthat reported on a total of 12 Current Population Surveys conductedby the U.S. Bureau of the Census for the years 1979–85 (14). In thisstudy, agreement—on a record-by-record basis— was 89.7 percent forany report of Hispanic origin. The ratio of deaths for CPS divided bydeaths for death certificate was 1.07 indicating net underreporting ofHispanic origin on death certificates by 7 percent as compared withself-reports on the surveys. Death rates for the Hispanic-origin popu-lation are also affected by undercoverage of this population group inthe census and resultant population estimates; the estimated netcorrection, taking into account both sources of bias, is 1.6 percent(14,38).
Other races and race not stated—Beginning in 1992 all recordscoded as ‘‘Other races’’ (0.02 percent of the total deaths in 1999) wereassigned to the specified race of the previous record. Records for whichrace was unknown, not stated, or not classifiable (0.10 percent) wereassigned the racial designation of the previous record.
Infant and maternal mortality rates—For 1989–99, as in previousyears, infant and maternal deaths continue to be tabulated by the raceof the decedent. However, beginning with the 1989 data year, themethod of tabulating live births by race was changed from race ofparents to race of mother as stated on the birth certificate. This changeaffects infant and maternal mortality rates because live births are thedenominators of these rates (39,40). To improve continuity and easeof interpretation, trend data by race in this report have been retabulatedby race of mother for all years beginning with the 1980 data year.
Quantitatively, the change in the basis for tabulating live births byrace results in more white births and fewer black births and births ofother races. Consequently, infant and maternal mortality rates underthe new tabulating procedure tend to be about 2 percent lower for whiteinfants and about 5 percent higher for black infants than when they arecomputed by the previous method of tabulating live births by race of

Table I. List of ICD–10 leading causes of death for 1999 and comparable ICD–9 causes of deathICD–10 ICD–9
Diseases of heart (I00–I09,I11,I13,I20–I51) . . . . . . . . . . . . . . . . . . . . . . Diseases of heart (390–398,402,404,410–429)Malignant neoplasms (C00–C97). . . . . . . . . . . . . . . . . . . . . . . . . . . . . Malignant neoplasms, including neoplasms of lymphatic and hematopoietic
tissues (140–208)Cerebrovascular diseases (I60–I69) . . . . . . . . . . . . . . . . . . . . . . . . . . . Cerebrovascular diseases (430–434,436–438)1
Chronic lower respiratory diseases (J40–J47) . . . . . . . . . . . . . . . . . . . . . Chronic obstructive pulmonary diseases and allied conditions (490–494,496)1
Accidents (unintentional injuries) (V01–X59,Y85–Y86) . . . . . . . . . . . . . . . . Accidents (E800–E869,E880–E929)1
Diabetes mellitus (E10–E14) . . . . . . . . . . . . . . . . . . . . . . . . . . . . . . . Diabetes mellitus (250)Influenza and pneumonia (J10–J18) . . . . . . . . . . . . . . . . . . . . . . . . . . . Pneumonia and influenza (480–487)Alzheimer’s disease (G30) . . . . . . . . . . . . . . . . . . . . . . . . . . . . . . . . Alzheimer’s disease (331.0)Nephritis, nephrotic syndrome and nephrosis (N00–N07,N17–N19,N25–N27) . . Nephritis, nephrotic syndrome and nephrosis (580–589)Septicemia (A40–A41) . . . . . . . . . . . . . . . . . . . . . . . . . . . . . . . . . . . Septicemia (038)Intentional self-harm (suicide) (X60–X84,Y87.0) . . . . . . . . . . . . . . . . . . . Suicide (E950–E959)Chronic liver disease and cirrhosis (K70,K73–K74) . . . . . . . . . . . . . . . . . . Chronic liver disease and cirrhosis (571)Essential (primary) hypertension and hypertensive renal disease (I10,I12) Hypertension with or without renal disease (401,403)Assault (homicide) (X85–Y09,Y87.1) . . . . . . . . . . . . . . . . . . . . . . . . . . Homicide (E960–E969)1
Aortic aneurysm and dissection (I71) . . . . . . . . . . . . . . . . . . . . . . . . . . Aortic aneurysm (441)2
1ICD–9 codes do not match those of the ICD–9 List of 72 Selected Causes of Death; see Technical notes.2Not a rankable cause in ICD–9; see Technical notes.
Table II. List of ICD–10 leading causes of infant death for 1999 and comparable ICD–9 causes of infant deathICD–10 ICD–9
Congenital malformations, deformations, and chromosomal abnormalities(Q00–Q99) . . . . . . . . . . . . . . . . . . . . . . . . . . . . . . . . . . . . . . . . . Congenital anomalies (740–759)
Disorders related to short gestation and low birthweight, not elsewhereclassified (P07) . . . . . . . . . . . . . . . . . . . . . . . . . . . . . . . . . . . . . . Disorders relating to short gestation and unspecified low birthweight (765)
Sudden infant death syndrome (R95) . . . . . . . . . . . . . . . . . . . . . . . . . Sudden infant death syndrome (798.0)Newborn affected by maternal complications of pregnancy (P01) . . . . . . . . . Newborn affected by maternal complications of pregnancy (761)Respiratory distress of newborn (P22) . . . . . . . . . . . . . . . . . . . . . . . . . Respiratory distress syndrome (769)Newborn affected by complications of placenta, cord and membranes (P02) Newborn affected by complications of placenta, cord and membranes (762)Accidents (unintentional injuries) (V01–X59) . . . . . . . . . . . . . . . . . . . . . . Accidents (E800–E869,E880–E929)1
Bacterial sepsis of newborn (P36) . . . . . . . . . . . . . . . . . . . . . . . . . . . Other infection specific to the perinatal period (771.8)2
Diseases of the circulatory system (I00–I99) . . . . . . . . . . . . . . . . . . . . . . Diseases of the circulatory system (390–434,436–459)2
Atelectasis (P28.0–P28.1) . . . . . . . . . . . . . . . . . . . . . . . . . . . . . . . . . Primary, other, and unspecified atelectasis (770.4–770.5)2
1ICD–9 codes do not match those of the ICD–9 List of 61 Selected Causes of Infant Death; see Technical notes.2Not a rankable cause in ICD–9; see Technical notes.
92 National Vital Statistics Report, Vol. 49, No. 8, September 21, 2001
parents. Rates for most other minority races also are higher whencomputed by race of mother (22,40).
Infant mortality rates for the Hispanic-origin population are basedon numbers of resident infant deaths reported to be of Hispanic originand numbers of resident live births by Hispanic origin of mother for theUnited States. In computing infant mortality rates, deaths and live birthsof unknown origin are not distributed among the specified Hispanic andnon-Hispanic groups. The percent of infant deaths of unknown originwas 1.4 and the percent of live births to mothers of unknown origin was1.2 for the United States for 1999.
Small numbers of infant deaths for specific Hispanic-origin groupsresult in infant mortality rates subject to relatively large random variation(see ‘‘Random variation’’). Infant mortality rates by Hispanic origin areless subject to reporting error when based on linked files of infantdeaths and live births (20).
Infant mortality rates calculated from the general mortality file forspecified race and/or Hispanic origin are in error because of reportingproblems that affect the classification of race and Hispanic origin onthe birth and death certificates for the same infant. Infant mortality ratesby specified race and Hispanic origin are more accurate when basedon the linked file of infant deaths and live births (20). The linked file
computes infant mortality rates using the race and/or Hispanic originof the mother from the birth certificate in both the numerator anddenominator of the rate. In addition, mother’s race and/or Hispanicorigin from the birth certificate is considered to be more accuratelyreported than infant’s race and/or Hispanic origin from the deathcertificate because, on the birth certificate, race is generally reportedby the mother at the time of delivery whereas, on the death certificate,infant’s race and/or Hispanic origin is reported by an informant, usuallythe mother but sometimes by the funeral director. Estimates of reportingerrors have been made by comparing rates based on the linked fileswith those in which the race of infant death is based on information fromthe death certificate (14,22).
Life tables
The life table provides a comprehensive measure of the effect ofmortality on life expectancy. It is composed of sets of values showingthe mortality experience of a hypothetical group of infants born at thesame time and subject throughout their lifetime to the age-specificdeath rates of a particular time period, usually a given year.Beginning with final data reported for 1997, the life table methodology

was changed from previous annual reports. Previously, U.S. lifetables were abridged and constructed by reference to a standardtable (41). In addition, the age range for these life tables was limitedto 5-year age groups ending with the age group 85 years and over.
Beginning with 1997 mortality data, a revised life table method-ology was used to construct complete life tables by single years of agethat extend to age 100 (42) using a methodology similar to that of thedecennial life tables (43). The advantages of the new over the previousmethodology are its comparability with decennial life table method-ology, greater accuracy, and greater age detail. A comparison of thetwo methods shows small differences in resulting values for life expect-ancy (42). Although the new method produces complete life tables, thatis, life tables by single years of age, life table data shown in this reportare summarized in 5-year age groupings. To calculate the probabilityof dying at each age, the revised methodology uses vital statistics deathrates for ages under 85 years and mortality data from the Medicareprogram for ages over 85 years. Medicare data were used to modelthe probability of dying at ages 85 and over because the data are shownto be significantly more reliable than vital statistics data at the oldestages (44).
Causes of death contributing to changes in lifeexpectancy
Causes of death contributing to changes in life expectancy wereestimated using a life table partitioning technique. The methodpartitions changes into component additive parts. This methodidentifies the causes of death having the greatest influence, positiveor negative, on changes in life expectancy (15,45).
Comparability between ICD–9 and ICD–10 for mortality
One of the efforts to maintain the tradition of progress in theclassification of diseases has been the practice, begun in 1900, torevise about every 10–20 years what is now the InternationalClassification of Diseases (ICD). Each of these revisions hasproduced some break in the comparability of cause-of-death statis-tics. ICD–10 has many changes from ICD–9, including considerablygreater detail, shifts of inclusion terms and titles from one category,section, or chapter to another; regroupings of diseases; new titlesand sections; and modifications in coding rules (6). As a result,serious breaks occur in comparability for a number of causes ofdeath. Measures of this discontinuity are essential to the interpreta-tion of mortality trends. Ratios of comparability between ICD–9 andICD–10 have been computed for this purpose.
The method followed by the United States for constructing com-parability ratios for mortality data is that recommended by the Inter-national Conference for the Sixth Revision of the International List ofDiseases and Causes of Death, which convened in France in 1948. TheConference recommended that deaths for a country as a whole in 1949or in 1950 be coded according to the Detailed List of Causes of Deathof the Fifth Revision, and that dual tabulations of these data bepublished in such a way as to indicate the changes resulting from theapplication of the new revision. The dual coding method to measurediscontinuities in mortality data resulting from the introduction of a newrevision was used in this study between ICD–9 and ICD–10. Thismakes the fifth time since the recommendation of the InternationalConference for the Sixth Revision that the United States used thismethod (7).
Studies of the comparability between revisions of the ICD havebeen carried out and published at least since the Fifth Revision.Comparability studies—also called bridge-coding studies—involve dualclassification of a single year of mortality data, that is, classifying theunderlying cause of death on mortality records by the new revision andthe previous revision. The key element of a comparability study is thecomparability ratio, which is derived from the dual classification. It iscalculated by dividing the number of deaths for a selected cause ofdeath classified by the new revision by the number of deaths classifiedto the most nearly comparable cause of death by the previous revision.The resulting ratio represents the net effect of the new revision onstatistics for this cause and can be used as a factor to adjust mortalitystatistics for causes of death classified by a previous revision to becomparable to those for the same cause classified by the new revision.
A comparability ratio of 1.00 indicates that the same number ofdeaths was assigned to a particular cause or combination of causeswhether the Ninth or Tenth Revision was used. A ratio showing perfectcorrespondence (1.00) between the two revisions does not necessarilyindicate that the cause was unaffected by changes in classification andcoding procedures but merely that there was no net change.
A ratio of less than 1.00 results from a decrease in assignmentsof death to a cause in ICD–10 compared with ICD–9. A ratio of morethan 1.00 results from an increase in assignments of deaths to a causein ICD–10 compared with the comparable ICD–9 cause.
One of the major objectives of the comparability study was tofurnish ratios that measure the degree of discontinuity between datatabulated by the cause lists published under ICD–10 and data tabulatedby the most nearly comparable cause lists published under ICD–9.
Ratios are presented for the cause lists presented in this report.The list of selected causes for which final data are published has beenexpanded from the 72 causes plus HIV infection and Alzheimer’sdisease published under ICD–9, to 113 causes under ICD–10. The listof selected causes of infant death was expanded from 61 plus HIVdisease to 130 causes. The lists are as follows:
ICD–10 ICD–9
1. List of 113 Selected Causesof Death
1. List of 72 Selected Causesof Death, HIV infection andAlzheimer’s disease
2. List of 130 SelectedCauses of Infant Death
2. List of 61 Selected Causesof Infant Death and HIVinfection
The data used in the ICD–10 Comparability Study are cause-of-death information from a large sample of death certificates for deathsoccurring in 1996 filed in the 50 States and the District of Columbia.Table III shows comparability ratios and their standard errors for theList of 113 Selected Causes of Death. Table IV shows the sameinformation for the List of 130 Selected Causes of Infant Death. Thecause-of-death information in the sample is based on death recordsin which the underlying cause of death is classified by ICD–9 andICD–10. The sample comprises 1,852,651 (80 percent) out of thetotal 2,314,690 resident deaths that occurred in the United Statesduring 1996. The sample is treated as if it were random. As a result,standard errors associated with comparability ratios are based onsampling and stochastic (random) variation (9). Most of the records inthe study were processed using the NCHS automated systems for
National Vital Statistics Report, Vol. 49, No. 8, September 21, 2001 93

Table III. Comparable category codes and estimated comparability ratios for 113 selected causes of death, injury by firearms, drug-induced deaths, andalcohol-induced deaths according to the Ninth and Tenth Revisions, International Classification of Diseases
Cause of death (Based on the Tenth Revision,International Classification of Diseases, 1992)
Category codes according to theTenth Revision (ICD–10)
Category codes according to theNinth Revision (ICD–9)
Number of deathsallocated according to Estimated
comparabilityratio
Standarderror
Relativestandard
error
95-percentconfidence limits
Tenth Revision Ninth Revision Lower Upper
Salmonella infections. . . . . . . . . . . . . . . . . . . . . . . . A01–A02 002–003 30 37 0.8108 0.0644 7.9 0.6846 0.9370Shigellosis and amebiasis . . . . . . . . . . . . . . . . . . . . . A03,A06 004,006 * * * * * * *Certain other intestinal infections. . . . . . . . . . . . . . . . . A04,A07–A09 007–009 * * * * * * *Tuberculosis . . . . . . . . . . . . . . . . . . . . . . . . . . . . . A16–A19 010–018 653 764 0.8547 0.0172 2.0 0.8209 0.8885
Respiratory tuberculosis. . . . . . . . . . . . . . . . . . . . . A16 010–012 518 572 0.9056 0.0201 2.2 0.8662 0.9450Other tuberculosis . . . . . . . . . . . . . . . . . . . . . . . . A17–A19 013–018 135 192 0.7031 0.0407 5.8 0.6233 0.7830
Whooping cough . . . . . . . . . . . . . . . . . . . . . . . . . . A37 033 * * * * * * *Scarlet fever and erysipelas . . . . . . . . . . . . . . . . . . . A38,A46 034.1–035 * * * * * * *Meningococcal infection . . . . . . . . . . . . . . . . . . . . . . A39 036 221 222 0.9955 0.0149 1.5 0.9663 1.0247Septicemia. . . . . . . . . . . . . . . . . . . . . . . . . . . . . . A40–A41 038 21,258 17,791 1.1949 0.0042 0.3 1.1867 1.2030Syphilis. . . . . . . . . . . . . . . . . . . . . . . . . . . . . . . . A50–A53 090–097 21 33 0.6364 0.1184 18.6 0.4043 0.8685Acute poliomyelitis . . . . . . . . . . . . . . . . . . . . . . . . . A80 045 * * * * * * *Arthropod-borne viral encephalitis . . . . . . . . . . . . . . . . A83–A84,A85.2 062–064 * * * * * * *Measles . . . . . . . . . . . . . . . . . . . . . . . . . . . . . . . B05 055 * * * * * * *Viral hepatitis . . . . . . . . . . . . . . . . . . . . . . . . . . . . B15–B19 070 1,123 1,346 0.8343 0.0120 1.4 0.8109 0.8578Human immunodeficiency virus (HIV) disease . . . . . . . . . B20–B24 *042–*044 12,765 11,150 1.1448 0.0045 0.4 1.1360 1.1536Malaria . . . . . . . . . . . . . . . . . . . . . . . . . . . . . . . . B50–B54 084 * * * * * * *Other and unspecified infectious and parasiticdiseases and their sequelae. . . . . . . . . . . . . . . . . . . A00,A05,A20–A36,A42–A44,A48–A49, 001,005,020–032,037,039–041,046–054,
A54–A79,A81–A82,A85.0–A85.1,A85.8 056–061,065–066,071–083,085–088,A86–B04,B06–B09,B25–B49,B55–B99 098–134,136–139,771.3 2,865 2,607 1.0990 0.0154 1.4 1.0688 1.1291
Malignant neoplasms. . . . . . . . . . . . . . . . . . . . . . . . C00–C97 140–208 464,688 461,544 1.0068 0.0002 0.0 1.0064 1.0072Malignant neoplasms of lip, oral cavity and pharynx . . . . C00–C14 140–149 5,927 6,172 0.9603 0.0040 0.4 0.9525 0.9681Malignant neoplasm of esophagus . . . . . . . . . . . . . . C15 150 9,596 9,630 0.9965 0.0020 0.2 0.9926 1.0003Malignant neoplasm of stomach . . . . . . . . . . . . . . . . C16 151 11,480 11,408 1.0063 0.0019 0.2 1.0025 1.0101Malignant neoplasms of colon, rectum and anus . . . . . . . . C18–C21 153–154 48,583 48,619 0.9993 0.0009 0.1 0.9975 1.0010Malignant neoplasms of liver and intrahepaticbile ducts . . . . . . . . . . . . . . . . . . . . . . . . . . . . C22 155 9,732 10,102 0.9634 0.0023 0.2 0.9588 0.9679
Malignant neoplasm of pancreas . . . . . . . . . . . . . . . C25 157 24,313 24,361 0.9980 0.0009 0.1 0.9963 0.9997Malignant neoplasm of larynx . . . . . . . . . . . . . . . . . C32 161 3,209 3,194 1.0047 0.0053 0.5 0.9943 1.0150Malignant neoplasms of trachea, bronchus and lung . . . . C33–C34 162 131,750 133,936 0.9837 0.0005 0.1 0.9827 0.9846Malignant melanoma of skin . . . . . . . . . . . . . . . . . . C43 172 5,941 6,139 0.9677 0.0032 0.3 0.9614 0.9741Malignant neoplasm of breast . . . . . . . . . . . . . . . . . C50 174–175 38,102 37,891 1.0056 0.0010 0.1 1.0036 1.0075Malignant neoplasm of cervix uteri . . . . . . . . . . . . . . C53 180 3,753 3,802 0.9871 0.0034 0.3 0.9805 0.9938Malignant neoplasms of corpus uteri and uterus,part unspecified . . . . . . . . . . . . . . . . . . . . . . . . . C54–C55 179,182 5,318 5,183 1.0260 0.0040 0.4 1.0182 1.0339
Malignant neoplasm of ovary. . . . . . . . . . . . . . . . . . C56 183.0 11,292 11,344 0.9954 0.0016 0.2 0.9923 0.9985Malignant neoplasm of prostate . . . . . . . . . . . . . . . . C61 185 30,672 30,267 1.0134 0.0015 0.1 1.0105 1.0162Malignant neoplasms of kidney and renal pelvis . . . . . . C64–C65 189.0,189.1 9,521 9,521 1.0000 0.0022 0.2 0.9957 1.0043Malignant neoplasm of bladder . . . . . . . . . . . . . . . . C67 188 9,563 9,594 0.9968 0.0026 0.3 0.9916 1.0019Malignant neoplasms of meninges, brain andother parts of central nervous system. . . . . . . . . . . . C70–C72 191–192 10,039 10,359 0.9691 0.0025 0.3 0.9642 0.9740
Malignant neoplasms of lymphoid, hematopoieticand related tissue . . . . . . . . . . . . . . . . . . . . . . . C81–C96 200–208 44,715 44,530 1.0042 0.0012 0.1 1.0019 1.0064Hodgkin’s disease . . . . . . . . . . . . . . . . . . . . . . . C81 201 1,021 1,036 0.9855 0.0089 0.9 0.9680 1.0030Non-Hodgkin’s lymphoma . . . . . . . . . . . . . . . . . . C82–C85 200,202 17,924 18,326 0.9781 0.0018 0.2 0.9745 0.9817Leukemia . . . . . . . . . . . . . . . . . . . . . . . . . . . . C91–C95 204–208 16,600 16,405 1.0119 0.0019 0.2 1.0083 1.0155
See footnotes at end of table.
94N
ationalVitalStatisticsR
eport,Vol.49,No.8,Septem
ber21,2001

Table III. Comparable category codes and estimated comparability ratios for 113 selected causes of death, injury by firearms, drug-induced deaths, andalcohol-induced deaths according to the Ninth and Tenth Revisions, International Classification of Diseases—Con.
Cause of death (Based on the Tenth Revision,International Classification of Diseases, 1992)
Category codes according to theTenth Revision (ICD–10)
Category codes according to theNinth Revision (ICD–9)
Number of deathsallocated according to Estimated
comparabilityratio
Standarderror
Relativestandard
error
95-percentconfidence limits
Tenth Revision Ninth Revision Lower Upper
Multiple myeloma and immunoproliferative neoplasms. . C88,C90 203 9,099 8,763 1.0383 0.0030 0.3 1.0324 1.0443Other and unspecified malignant neoplasms oflymphoid, hematopoietic and related tissue . . . . . . . C96 - - - * * * * * * *
All other and unspecified malignant neoplasms. . . . . . C17,C23–C24,C26–C31,C37–C41,C44–C49,C51–C52,C57–C60, 152, 156,158–160,163–171,173,181,C66,C68–C69,C73–C80,C97 183.2–184,186–187,189.2–190,193–199 51,182 45,492 1.1251 0.0021 0.2 1.1210 1.1292
In situ neoplasms, benign neoplasms andneoplasms of uncertain or unknown behavior . . . . . . . . D00–D48 210–239 9,263 5,532 1.6744 0.0164 1.0 1.6422 1.7067
Anemias . . . . . . . . . . . . . . . . . . . . . . . . . . . . . . . D50–D64 280–285 3,059 3,200 0.9559 0.0077 0.8 0.9409 0.9710Diabetes mellitus . . . . . . . . . . . . . . . . . . . . . . . . . . E10–E14 250 48,636 48,242 1.0082 0.0011 0.1 1.0060 1.0103Nutritional deficiencies . . . . . . . . . . . . . . . . . . . . . . . E40–E64 260–269 3,215 2,763 1.1636 0.0165 1.4 1.1312 1.1960
Malnutrition . . . . . . . . . . . . . . . . . . . . . . . . . . . . E40–E46 260–263 2,607 2,665 0.9782 0.0151 1.5 0.9487 1.0078Other nutritional deficiencies . . . . . . . . . . . . . . . . . . E50–E64 264–269 608 98 6.2041 0.5961 9.6 5.0358 7.3724
Meningitis . . . . . . . . . . . . . . . . . . . . . . . . . . . . . . G00,G03 320–322 592 584 1.0137 0.0136 1.3 0.9871 1.0403Parkinson’s disease . . . . . . . . . . . . . . . . . . . . . . . . G20–G21 332 10,404 10,392 1.0012 0.0028 0.3 0.9956 1.0067Alzheimer’s disease . . . . . . . . . . . . . . . . . . . . . . . . G30 331.0 29,707 19,121 1.5536 0.0071 0.5 1.5398 1.5675Major cardiovascular diseases . . . . . . . . . . . . . . . . . . I00–I78 390–434,436–448 796,919 798,435 0.9981 0.0002 0.0 0.9977 0.9985
Diseases of heart . . . . . . . . . . . . . . . . . . . . . . . . I00–I09,I11,I13,I20–I51 390–398,402,404,410–429 615,564 624,405 0.9858 0.0002 0.0 0.9854 0.9863Acute rheumatic fever and chronic rheumaticheart diseases . . . . . . . . . . . . . . . . . . . . . . . . I00–I09 390–398 2,446 2,980 0.8208 0.0089 1.1 0.8034 0.8382
Hypertensive heart disease . . . . . . . . . . . . . . . . . I11 402 17,322 21,577 0.8028 0.0028 0.3 0.7973 0.8083Hypertensive heart and renal disease . . . . . . . . . . . I13 404 2,170 2,027 1.0705 0.0160 1.5 1.0392 1.1019Ischemic heart diseases . . . . . . . . . . . . . . . . . . . I20–I25 410–414,429.2 466,459 466,935 0.9990 0.0002 0.0 0.9985 0.9994
Acute myocardial infarction . . . . . . . . . . . . . . . . I21–I22 410 178,125 180,169 0.9887 0.0003 0.0 0.9880 0.9893Other acute ischemic heart diseases . . . . . . . . . . I24 411 2,667 2,638 1.0110 0.0117 1.2 0.9880 1.0340Other forms of chronic ischemic heart disease. . . . . I20,I25 412–414,429.2 285,667 284,128 1.0054 0.0004 0.0 1.0046 1.0062
Atherosclerotic cardiovascular disease,so described. . . . . . . . . . . . . . . . . . . . . . . I25.0 429.2 64,354 61,362 1.0488 0.0016 0.2 1.0456 1.0519
All other forms of chronic ischemic heart disease. . I20,I25.1–I25.9 412–414 221,313 222,766 0.9935 0.0004 0.0 0.9927 0.9942Other heart diseases . . . . . . . . . . . . . . . . . . . . . I26–I51 415–429.1,429.3–429.9 127,167 130,886 0.9716 0.0010 0.1 0.9696 0.9736
Acute and subacute endocarditis . . . . . . . . . . . . . I33 421 552 554 0.9964 0.0137 1.4 0.9695 1.0233Diseases of pericardium and acute myocarditis . . . . I30–I31,I40 420,422–423 489 475 1.0295 0.0160 1.6 0.9981 1.0608Heart failure . . . . . . . . . . . . . . . . . . . . . . . . . I50 428 44,297 42,554 1.0410 0.0013 0.1 1.0384 1.0435All other forms of heart disease . . . . . . . . . . . . . I26–I28,I34–I38,I42–I49,151 415–417,424–427,429.0–429.1,429.3–429.9 81,829 87,303 0.9373 0.0014 0.2 0.9345 0.9401
Essential (primary) hypertension and hypertensiverenal disease . . . . . . . . . . . . . . . . . . . . . . . . . . I10,I12 401,403 11,958 10,684 1.1192 0.0050 0.4 1.1094 1.1291
Cerebrovascular diseases . . . . . . . . . . . . . . . . . . . I60–I69 430–434,436–438 137,264 129,640 1.0588 0.0008 0.1 1.0572 1.0604Atherosclerosis . . . . . . . . . . . . . . . . . . . . . . . . . . I70 440 13,894 14,417 0.9637 0.0025 0.3 0.9588 0.9686Other diseases of circulatory system . . . . . . . . . . . . . I71–I78 441–448 18,239 19,289 0.9456 0.0021 0.2 0.9414 0.9498
Aortic aneurysm and dissection . . . . . . . . . . . . . . . I71 441 12,216 12,201 1.0012 0.0010 0.1 0.9992 1.0032Other diseases of arteries, arterioles and capillaries. . . I72–I78 442–448 6,023 7,088 0.8497 0.0053 0.6 0.8394 0.8601
Other disorders of circulatory system . . . . . . . . . . . . . . I80–I99 451–459 2,984 2,899 1.0293 0.0172 1.7 0.9956 1.0631Influenza and pneumonia . . . . . . . . . . . . . . . . . . . . . J10–J18 480–487 50,526 72,371 0.6982 0.0018 0.3 0.6947 0.7016
Influenza . . . . . . . . . . . . . . . . . . . . . . . . . . . . . J10–J11 487 572 567 1.0088 0.0073 0.7 0.9945 1.0231Pneumonia . . . . . . . . . . . . . . . . . . . . . . . . . . . . J12–J18 480–486 49,954 71,804 0.6957 0.0018 0.3 0.6922 0.6992
Other acute lower respiratory infections. . . . . . . . . . . . . J20–J22 466 346 355 0.9746 0.0392 4.0 0.8978 1.0515Acute bronchitis and bronchiolitis . . . . . . . . . . . . . . . J20–J21 466 265 355 0.7465 0.0264 3.5 0.6947 0.7983
See footnotes at end of table.
NationalVitalStatistics
Report,Vol.49,N
o.8,September
21,200195

Table III. Comparable category codes and estimated comparability ratios for 113 selected causes of death, injury by firearms, drug-induced deaths, andalcohol-induced deaths according to the Ninth and Tenth Revisions, International Classification of Diseases—Con.
Cause of death (Based on the Tenth Revision,International Classification of Diseases, 1992)
Category codes according to theTenth Revision (ICD–10)
Category codes according to theNinth Revision (ICD–9)
Number of deathsallocated according to Estimated
comparabilityratio
Standarderror
Relativestandard
error
95-percentconfidence limits
Tenth Revision Ninth Revision Lower Upper
Unspecified acute lower respiratory infection . . . . . . . . J22 - - - * * * * * * *Chronic lower respiratory diseases. . . . . . . . . . . . . . . . J40–J47 490–494,496 94,326 90,022 1.0478 0.0009 0.1 1.0460 1.0496
Bronchitis, chronic and unspecified . . . . . . . . . . . . . . J40–J42 490–491 913 2,320 0.3935 0.0107 2.7 0.3726 0.4145Emphysema. . . . . . . . . . . . . . . . . . . . . . . . . . . . J43 492 14,369 14,774 0.9726 0.0031 0.3 0.9666 0.9786Asthma . . . . . . . . . . . . . . . . . . . . . . . . . . . . . . J45–J46 493 4,217 4,718 0.8938 0.0061 0.7 0.8819 0.9057Other chronic lower respiratory diseases . . . . . . . . . . . J44,J47 494,496 74,827 68,210 1.0970 0.0014 0.1 1.0943 1.0998
Pneumoconioses and chemical effects . . . . . . . . . . . . . J60–J66,J68 500–506 860 845 1.0178 0.0099 1.0 0.9983 1.0372Pneumonitis due to solids and liquids . . . . . . . . . . . . . . J69 507 10,183 9,104 1.1185 0.0048 0.4 1.1092 1.1279Other diseases of respiratory system . . . . . . . . . . . . . . J00–J06,J30–J39,J67,J70–J98 034.0,460–465,470–478,495,508–519 16,656 14,269 1.1673 0.0052 0.4 1.1572 1.1774Peptic ulcer . . . . . . . . . . . . . . . . . . . . . . . . . . . . . K25–K28 531–534 3,574 3,686 0.9696 0.0045 0.5 0.9608 0.9784Diseases of appendix . . . . . . . . . . . . . . . . . . . . . . . K35–K38 540–543 209 202 1.0347 0.0242 2.3 0.9873 1.0820Hernia . . . . . . . . . . . . . . . . . . . . . . . . . . . . . . . . K40–K46 550–553 658 633 1.0395 0.0154 1.5 1.0094 1.0696Chronic liver disease and cirrhosis . . . . . . . . . . . . . . . K70,K73–K74 571 21,688 20,920 1.0367 0.0027 0.3 1.0314 1.0420
Alcoholic liver disease. . . . . . . . . . . . . . . . . . . . . . K70 571.0–571.3 10,147 9,965 1.0183 0.0050 0.5 1.0085 1.0281Other chronic liver disease and cirrhosis . . . . . . . . . . . K73–K74 571.4–571.9 11,541 10,955 1.0535 0.0041 0.4 1.0454 1.0615
Cholelithiasis and other disorders of gallbladder . . . . . . . . K80–K82 574–575 1,725 1,803 0.9567 0.0060 0.6 0.9450 0.9685Nephritis, nephrotic syndrome and nephrosis . . . . . . . . . N00–N07,N17–N19,N25–N27 580–589 24,939 20,242 1.2320 0.0044 0.4 1.2234 1.2407
Acute and rapidly progressive nephritic andnephrotic syndrome . . . . . . . . . . . . . . . . . . . . . . N00–N01,N04 580–581 161 249 0.6466 0.0342 5.3 0.5796 0.7136
Chronic glomerulonephritis, nephritis andnephropathy not specified as acute or chronic,and renal sclerosis unspecified . . . . . . . . . . . . . . . . N02–N03,N05–N07,N26 582–583,587 468 1,213 0.3858 0.0144 3.7 0.3575 0.4141
Renal failure . . . . . . . . . . . . . . . . . . . . . . . . . . . N17–N19 584–586 24,290 18,758 1.2949 0.0050 0.4 1.2852 1.3047Other disorders of kidney . . . . . . . . . . . . . . . . . . . . N25,N27 588–589 20 22 0.9091 0.0867 9.5 0.7392 1.0790
Infections of kidney. . . . . . . . . . . . . . . . . . . . . . . . . N10–N12,N13.6,N15.1 590 731 726 1.0069 0.0144 1.4 0.9786 1.0352Hyperplasia of prostate . . . . . . . . . . . . . . . . . . . . . . N40 600 326 327 0.9969 0.0159 1.6 0.9658 1.0280Inflammatory diseases of female pelvic organs . . . . . . . . N70–N76 614–616 63 64 0.9844 0.0410 4.2 0.9040 1.0648Pregnancy, childbirth and the puerperium. . . . . . . . . . . . O00–099 630–676 * * * * * * *
Pregnancy with abortive outcome . . . . . . . . . . . . . . . O00–O07 630–639 * * * * * * *Other complications of pregnancy, childbirth andthe puerperium . . . . . . . . . . . . . . . . . . . . . . . . . O10–O99 640–676 * * * * * * *
Certain conditions originating in the perinatal period . . . . . P00–P96 760–771.2,771.4–779 10,184 9,555 1.0658 0.0033 0.3 1.0593 1.0724Congenital malformations, deformations andchromosomal abnormalities . . . . . . . . . . . . . . . . . . . Q00–Q99 740–759 5,950 7,025 0.8470 0.0055 0.6 0.8362 0.8577
Symptoms, signs and abnormal clinical andlaboratory findings, not elsewhere classified . . . . . . . . . R00–R99 780–799 16,940 17,732 0.9553 0.0034 0.4 0.9487 0.9620
All other diseases (Residual) . . . . . . . . . . . . . . . . . . . Residual Residual 109,853 122,107 0.8996 0.0015 0.2 0.8968 0.9025Accidents (unintentional injuries) . . . . . . . . . . . . . . . . . V01–X59,Y85–Y86 E800–E869,E880–E929 31,084 30,163 1.0305 0.0014 0.1 1.0278 1.0333
Transport accidents . . . . . . . . . . . . . . . . . . . . . . . V01–V99,Y85 E800–E848,E929.0,E929.1 17,547 17,586 0.9978 0.0006 0.1 0.9966 0.9990Motor vehicle accidents . . . . . . . . . . . . . . . . . . . . . V02–V04,V09.0,V09.2,V12–V14,
V19.0–V19.2,V19.4–V19.6,V20–V79,V80.3–V80.5,V81.0–V81.1,V82.0–V82.1,V83–V86,V87.0–V87.8,V88.0–V88.8,V89.0,V89.2 E810–E825 16,632 17,051 0.9754 0.0006 0.1 0.9742 0.9766
See footnotes at end of table.
96N
ationalVitalStatisticsR
eport,Vol.49,No.8,Septem
ber21,2001

Table III. Comparable category codes and estimated comparability ratios for 113 selected causes of death, injury by firearms, drug-induced deaths, andalcohol-induced deaths according to the Ninth and Tenth Revisions, International Classification of Diseases—Con.
Cause of death (Based on the Tenth Revision,International Classification of Diseases, 1992)
Category codes according to theTenth Revision (ICD–10)
Category codes according to theNinth Revision (ICD–9)
Number of deathsallocated according to Estimated
comparabilityratio
Standarderror
Relativestandard
error
95-percentconfidence limits
Tenth Revision Ninth Revision Lower Upper
Other land transport accidents . . . . . . . . . . . . . . . V01,V05–V06,V09.1,V09.3–V09.9,V10–V11,V15–V18,V19.3,V19.8–V19.9,V80.0–V80.2,V80.6–V80.9,V81.2–V81.9,V82.2–V82.9,V87.8,V88.9,V89.1,V89.3,V89.9 E800–E807,E826–E829 * * * * * * *
Water, air and space, and other and unspecifiedtransport accidents and their sequelae . . . . . . . . . . V90–V99,Y85 E830–E848,E929.0,E929.1 351 347 1.0115 0.0209 2.1 0.9706 1.0525
Nontransport accidents . . . . . . . . . . . . . . . . . . . . . W00–X59,Y86 E850–E869,E880–E928,E929.2–E929.9 13,537 12,577 1.0763 0.0035 0.3 1.0696 1.0831Falls . . . . . . . . . . . . . . . . . . . . . . . . . . . . . . . W00–W19 E880–E888 5,173 6,152 0.8409 0.0049 0.6 0.8313 0.8505Accidental discharge of firearms . . . . . . . . . . . . . . W32–W34 E922 493 466 1.0579 0.0127 1.2 1.0331 1.0828Accidental drowning and submersion. . . . . . . . . . . . W65–W74 E910 283 284 0.9965 0.0127 1.3 0.9716 1.0213Accidental exposure to smoke, fire and flames . . . . . . X00–X09 E890–E899 493 506 0.9743 0.0089 0.9 0.9568 0.9918Accidental poisoning and exposure tonoxious substance . . . . . . . . . . . . . . . . . . . . . . X40–X49 E850–E869,E924.1 * * * * * * *
Other and unspecified nontransport accidentsand their sequelae. . . . . . . . . . . . . . . . . . . . . . W20–W31,W35–W64,W75–W99, E900–E909,E911–E921,E923–E924.0,
X10–X39,X50–X59,Y86 E924.8–E928,E929.2–E929.9 6,698 4,721 1.4188 0.0123 0.9 1.3947 1.4428Intentional self-harm (suicide). . . . . . . . . . . . . . . . . . . X60–X84,Y87.0 E950–E959 18,352 18,422 0.9962 0.0005 0.0 0.9952 0.9972
Intentional self-harm (suicide) by discharge of firearms . . X72–X74 E955.0–E955.4 14,157 14,183 0.9982 0.0007 0.1 0.9968 0.9996Intentional self-harm (suicide) by other andunspecified means and their sequelae . . . . . . . . . . . X60–X71,X75–X84,Y87.0 E950–E954,E955.5–E959 4,195 4,239 0.9896 0.0023 0.2 0.9850 0.9942
Assault (homicide) . . . . . . . . . . . . . . . . . . . . . . . . . X85–Y09,Y87.1 E960–E969 12,287 12,308 0.9983 0.0006 0.1 0.9972 0.9994Assault (homicide) by discharge of firearms . . . . . . . . . X93–X95 E965.0–E965.4 8,718 8,745 0.9969 0.0008 0.1 0.9953 0.9985Assault (homicide) by other and unspecifiedmeans and their sequelae . . . . . . . . . . . . . . . . . . X85–X92,X96–Y09,Y87.1 E960–E964,E965.5–E969 3,569 3,563 1.0017 0.0024 0.2 0.9969 1.0064
Legal intervention. . . . . . . . . . . . . . . . . . . . . . . . . . Y35,Y89.0 E970–E978 * * * * * * *Events of undetermined intent . . . . . . . . . . . . . . . . . . Y10–Y34,Y87.2,Y89.9 E980–E989 * * * * * * *
Discharge of firearms, undetermined intent . . . . . . . . . Y22–Y24 E985.0–E985.4 * * * * * * *Other and unspecified events ofundetermined intent and their sequelae . . . . . . . . . . . Y10–Y21,Y25–Y34,Y87.2,Y89.9 E980–E984,E985.5–E989 * * * * * * *
Operations of war and their sequelae . . . . . . . . . . . . . . Y36,Y89.1 E990–E999 * * * * * * *Complications of medical and surgical care . . . . . . . . . . Y40–Y84,Y88 E870–E879,E930–E949 * * * * * * *
Injury by firearms1 . . . . . . . . . . . . . . . . . . . . . . . . . W32–W34,X72–X74,X93–X95, E922,E955.0–E955.4,E965.0–E965.4,Y22–Y24,Y35.0 E970,E985.0–E985.4 23,355 23,418 0.9973 0.0006 0.1 0.9961 0.9985
Drug-induced deaths1 . . . . . . . . . . . . . . . . . . . . . . . F11.0–F11.5,F11.7–F11.9,F12.0–F12.5,F12.7–F12.9,F13.0–F13.5,F13.7–F13.9,F14.0–F14.5,F14.7–F14.9,F15.0–F15.5,F15.7–F15.9,F16.0–F16.5,F16.7–F16.9,F17.0,F17.3–F17.5,F17.7–F17.9,F18.0–F18.5,F18.7–F18.9,F19.0–F19.5,F19.7–F19.9,X40–X44,X60–X64,X85, 292,304,305.2–305.9,E850–E858,Y10–Y14 E950.0–E950.5,E962.0,E980.0–E980.5 1,158 969 1.1950 0.0225 1.9 1.1509 1.2391
Alcohol-induced deaths1 . . . . . . . . . . . . . . . . . . . . . F10,G31.2,G62.1,I42.6,K29.2,K70, 291,303,305.0,357.5,425.5,535.3,R78.0,X45,X65,Y15 571.0–571.3,790.3,E860 14,783 15,269 0.9682 0.0025 0.3 0.9633 0.9731
* Figure does not meet standards of reliability or precision; see Technical notes.- - - Category not applicable.0.0 Quantity more than zero but less than 0.05.1Included in selected categories.
NationalVitalStatistics
Report,Vol.49,N
o.8,September
21,200197

Table IV. Comparable category codes and estimated comparability ratios for 130 selected causes of infant death according to the Ninth and TenthRevisions, International Classification of Diseases
Cause of death (Based on the Tenth Revision,International Classification of Diseases, 1992)
Category codes accordingto the Tenth Revision (ICD–10)
Category codes accordingto the Ninth Revision (ICD–9)
Number ofdeaths allocated
according toEstimated
comparabilityratio
Standarderror
Relativestandard
error
95-percentconfidence limits
TenthRevision
NinthRevision Lower Upper
Certain infectious and parasitic diseases . . . . . . . . . . . . A00–B99 001–033,034.1–134,136–139,771.3 284 387 0.7339 0.0339 4.6 0.6673 0.8004Certain intestinal infectious diseases . . . . . . . . . . . . . A00–A08 001–008 * * * * * * *Diarrhea and gastroenteritis of infectious origin . . . . . . . A09 009 0 144 0.0000 0.0000 0.0 0.0000 0.0000Tuberculosis . . . . . . . . . . . . . . . . . . . . . . . . . . . A16–A19 010–018 * * * * * * *Tetanus . . . . . . . . . . . . . . . . . . . . . . . . . . . . . . A33,A35 037,771.3 * * * * * * *Diptheria . . . . . . . . . . . . . . . . . . . . . . . . . . . . . A36 032 * * * * * * *Whooping cough . . . . . . . . . . . . . . . . . . . . . . . . . A37 033 * * * * * * *Meningococcal infection. . . . . . . . . . . . . . . . . . . . . A39 036 25 26 0.9615 0.0377 3.9 0.8876 1.0355Septicemia . . . . . . . . . . . . . . . . . . . . . . . . . . . . A40–A41 038 167 121 1.3802 0.0713 5.2 1.2403 1.5200Congenital syphillis . . . . . . . . . . . . . . . . . . . . . . . A50 090 * * * * * * *Gonococcal infection . . . . . . . . . . . . . . . . . . . . . . A54 098 * * * * * * *Viral diseases . . . . . . . . . . . . . . . . . . . . . . . . . . A80–B34 042–079 62 62 1.0000 0.0757 7.6 0.8517 1.1483
Acute poliomyelitis . . . . . . . . . . . . . . . . . . . . . . A80 045 * * * * * * *Varicella (chickenpox) . . . . . . . . . . . . . . . . . . . . B01 052 * * * * * * *Measles . . . . . . . . . . . . . . . . . . . . . . . . . . . . B05 055 * * * * * * *Human immunodeficiency virus (HIV) disease . . . . . . B20–B24 042–044 * * * * * * *Mumps . . . . . . . . . . . . . . . . . . . . . . . . . . . . . B26 072 * * * * * * *Other and unspecified viral diseases. . . . . . . . . . . . A81–B00,B02–B04,B06–B19,B25,
B27–B34 046–051,053–054,056–071,073–079 35 36 0.9722 0.1255 12.9 0.7262 1.2182Candidiasis . . . . . . . . . . . . . . . . . . . . . . . . . . . . B37 112 * * * * * * *Malaria . . . . . . . . . . . . . . . . . . . . . . . . . . . . . . B50–B54 084 * * * * * * *Pneumocystosis . . . . . . . . . . . . . . . . . . . . . . . . . B59 136.3 * * * * * * *All other and unspecified infectious and parasiticdiseases . . . . . . . . . . . . . . . . . . . . . . . . . . . . . A20–A32,A38,A42–A49,A51–A53, 020–031,034.1–035,039–041,080–083,
A55–A79,B35–B36,B38–B49, 085–088,091–097,099–111,114–134,B55–B58,B60–B99 136.0–136.2,136.4–139 * * * * * * *
Neoplasms. . . . . . . . . . . . . . . . . . . . . . . . . . . . . . C00–D48 140–239 73 72 1.0139 0.0420 4.1 0.9317 1.0961Malignant neoplasms . . . . . . . . . . . . . . . . . . . . . . C00–C97 140–208 48 46 1.0435 0.0544 5.2 0.9369 1.1501
Hodgkin’s disease and non-Hodgkin’s lymphomas. . . . C81–C85 200–202 * * * * * * *Leukemia. . . . . . . . . . . . . . . . . . . . . . . . . . . . C91–C95 204–208 * * * * * * *Other and unspecified malignant neoplasms . . . . . . . C00–C80,C88–C90,C96–C97 140–199,203 30 28 1.0714 0.0906 8.5 0.8939 1.2489
In situ neoplasms, benign neoplasms and neoplasms ofuncertain or unknown behavior. . . . . . . . . . . . . . . . D00–D48 210–239 25 26 0.9615 0.1131 11.8 0.7398 1.1833
Diseases of the blood and blood-forming organs andcertain disorders involving the immune mechanism . . . . . D50–D89 135, 279–289 35 50 0.7000 0.0803 11.5 0.5427 0.8573Anemias. . . . . . . . . . . . . . . . . . . . . . . . . . . . . . D50–D64 280–285 * * * * * * *Other diseases of blood and blood-forming organs . . . . D65–D76 286–289 * * * * * * *Certain disorders involving the immune mechanism . . . . D80–D89 135,279 * * * * * * *
Endocrine, nutritional and metabolic diseases . . . . . . . . . E00–E88 240–278 112 129 0.8682 0.0555 6.4 0.7595 0.9770Short stature, not elsewhere classified . . . . . . . . . . . . E34.3 259.4 * * * * * * *Malnutrition and other nutritional deficiencies . . . . . . . . E40–E64 260–269 * * * * * * *Cystic fibrosis . . . . . . . . . . . . . . . . . . . . . . . . . . E84 277.0 * * * * * * *Volume depletion, disorders of fluid, electrolyte andacid-base balance . . . . . . . . . . . . . . . . . . . . . . . E86–E87 276 40 53 0.7547 0.0852 11.3 0.5878 0.9217
See footnotes at end of table.
98N
ationalVitalStatisticsR
eport,Vol.49,No.8,Septem
ber21,2001

Table IV. Comparable category codes and estimated comparability ratios for 130 selected causes of infant death according to the Ninth and TenthRevisions, International Classification of Diseases—Con.
Cause of death (Based on the Tenth Revision,International Classification of Diseases, 1992)
Category codes accordingto the Tenth Revision (ICD–10)
Category codes accordingto the Ninth Revision (ICD–9)
Number ofdeaths allocated
according toEstimated
comparabilityratio
Standarderror
Relativestandard
error
95-percentconfidence limits
TenthRevision
NinthRevision Lower Upper
All other endocrine, nutritional and metabolicdiseases . . . . . . . . . . . . . . . . . . . . . . . . . . . . . E00–E32,E34.0–E34.2,E34.4–E34.9, 240–259.3,259.8–259.9,270–275,
E65–E83,E85,E88 277.1–278 64 55 1.1636 0.0809 6.9 1.0051 1.3221Diseases of the nervous system . . . . . . . . . . . . . . . . . G00–G98 320–359,435 305 286 1.0664 0.0263 2.5 1.0149 1.1180
Meningitis . . . . . . . . . . . . . . . . . . . . . . . . . . . . . G00,G03 320–322 70 70 1.0000 0.0404 4.0 0.9208 1.0792Infantile spinal muscular atrophy, type I(Werdnig-Hoffman) . . . . . . . . . . . . . . . . . . . . . . . G12.0 335.0 47 47 1.0000 0.0521 5.2 0.8978 1.1022
Infantile cerebral palsy . . . . . . . . . . . . . . . . . . . . . G80 343 * * * * * * *Anoxic brain damage, not elsewhere classified . . . . . . . G93.1 348.1 29 30 0.9667 0.1269 13.1 0.7179 1.2155Other diseases of nervous system . . . . . . . . . . . . . . G04,G06–G11,G12.1–G12.9,
G20–G72,G81–G92,G93.0, 323–334,335.1–342,344–348.0,G93.2–G93.9,G95–G98 348.2–359,435 145 126 1.1508 0.0532 4.6 1.0466 1.2550
Diseases of the ear and mastoid process . . . . . . . . . . . H60–H93 380–389 * * * * * * *Diseases of the circulatory system. . . . . . . . . . . . . . . . I00–I99 390–434,436–459 419 587 0.7138 0.0244 3.4 0.6659 0.7617
Pulmonary heart disease and diseases of pulmonarycirculation . . . . . . . . . . . . . . . . . . . . . . . . . . . . I26–I28 415–417 138 123 1.1220 0.0447 4.0 1.0342 1.2097
Pericarditis, endocarditis and myocarditis . . . . . . . . . . I30,I33,I40 420–422 * * * * * * *Cardiomyopathy . . . . . . . . . . . . . . . . . . . . . . . . . I42 425 82 84 0.9762 0.0166 1.7 0.9436 1.0088Cardiac arrest . . . . . . . . . . . . . . . . . . . . . . . . . . I46 427.5 25 87 0.2874 0.0508 17.7 0.1878 0.3869Cerebrovascular diseases . . . . . . . . . . . . . . . . . . . I60–I69 430–434,436–438 77 163 0.4724 0.0510 10.8 0.3725 0.5723All other diseases of circulatory system . . . . . . . . . . . I00–I25,I31,I34–I38,I44–I45, 390–414,423–424,426–427.4,
I47–I51,I70–I99 427.6–429,440–459 88 123 0.7154 0.0519 7.3 0.6137 0.8172Disease of the respiratory system . . . . . . . . . . . . . . . . J00–J98 034.0,460–519 420 516 0.8140 0.0220 2.7 0.7709 0.8570
Acute upper respiratory infections . . . . . . . . . . . . . . . J00–J06 034.0,460–465 * * * * * * *Influenza and pneumonia . . . . . . . . . . . . . . . . . . . . J10–J18 480–487 231 303 0.7624 0.0261 3.4 0.7112 0.8135
Influenza . . . . . . . . . . . . . . . . . . . . . . . . . . . . J10–J11 487 * * * * * * *Pneumonia . . . . . . . . . . . . . . . . . . . . . . . . . . . J12–J18 480–486 224 295 0.7593 0.0266 3.5 0.7072 0.8114
Acute bronchitis and acute bronchiolitis . . . . . . . . . . . J20–J21 466 33 41 0.8049 0.0758 9.4 0.6563 0.9534Bronchitis, chronic and unspecified . . . . . . . . . . . . . . J40–J42 490–491 * * * * * * *Asthma . . . . . . . . . . . . . . . . . . . . . . . . . . . . . . J45–J46 493 * * * * * * *Pneumonitis due to solids and liquids . . . . . . . . . . . . J69 507 * * * * * * *Other and unspecified diseases of respiratory system . . . J22,J30–J39,J43–J44,J47–J68,J70–J98 470–479,492,494–506,508–519 117 127 0.9213 0.0632 6.9 0.7973 1.0452
Diseases of the digestive system . . . . . . . . . . . . . . . . K00–K92 520–579 278 167 1.6647 0.1084 6.5 1.4521 1.8772Gastritis, duodenitis, and noninfective enteritis andcolitis . . . . . . . . . . . . . . . . . . . . . . . . . . . . . . . K29,K50–K55 535, 555–558 137 47 2.9149 0.3879 13.3 2.1547 3.6751
Hernia of abdominal cavity and intestinal obstructionwithout hernia . . . . . . . . . . . . . . . . . . . . . . . . . . K40–K46,K56 550–553,560 * * * * * * *
All other and unspecified diseases of digestive system . . K00–K28,K30–K38,K57–K92 520–534,536–543,562–579 84 86 0.9767 0.0708 7.3 0.8379 1.1156Diseases of the genitourinary system . . . . . . . . . . . . . . N00–N98 580–629 117 117 1.0000 0.0567 5.7 0.8889 1.1111
Renal failure and other disorders of kidney . . . . . . . . . N17–N19,N25,N27 584–589 102 98 1.0408 0.0658 6.3 0.9118 1.1699Other and unspecified diseases of genitourinarysystem . . . . . . . . . . . . . . . . . . . . . . . . . . . . . . N00–N15,N20–N23,N26,N28–N98 580–583,590–629 * * * * * * *
Certain conditions originating in the perinatal period . . . . . P00–P96 760–771.2,771.4–779 10,047 9,495 1.0581 0.0032 0.3 1.0519 1.0643
See footnotes at end of table.
NationalVitalStatistics
Report,Vol.49,N
o.8,September
21,200199

Table IV. Comparable category codes and estimated comparability ratios for 130 selected causes of infant death according to the Ninth and TenthRevisions, International Classification of Diseases—Con.
Cause of death (Based on the Tenth Revision,International Classification of Diseases, 1992)
Category codes accordingto the Tenth Revision (ICD–10)
Category codes accordingto the Ninth Revision (ICD–9)
Number ofdeaths allocated
according toEstimated
comparabilityratio
Standarderror
Relativestandard
error
95-percentconfidence limits
TenthRevision
NinthRevision Lower Upper
Newborn affected by maternal factors and bycomplications of pregnancy, labor and delivery . . . . . . P00–P04 760–763 1,305 1,256 1.0390 0.0099 1.0 1.0196 1.0585Newborn affected by maternal hypertensive disorders . P00.0 760.0 23 22 1.0455 0.0465 4.4 0.9544 1.1365Newborn affected by other maternal conditions whichmay be unrelated to present pregnancy . . . . . . . . . P00.1–P00.9 760.1–760.6,760.8–760.9 * * * * * * *
Newborn affected by maternal complications ofpregnancy . . . . . . . . . . . . . . . . . . . . . . . . . . P01 761 662 643 1.0295 0.0138 1.3 1.0024 1.0567Newborn affected by incompetent cervix . . . . . . . . P01.0 761.0 205 201 1.0199 0.0188 1.8 0.9831 1.0567Newborn affected by premature rupture ofmembranes . . . . . . . . . . . . . . . . . . . . . . . . P01.1 761.1 314 307 1.0228 0.0136 1.3 0.9962 1.0494
Newborn affected by multiple pregnancy . . . . . . . . P01.5 761.5 104 103 1.0097 0.0507 5.0 0.9103 1.1091Newborn affected by other maternal complicationsof pregnancy . . . . . . . . . . . . . . . . . . . . . . . P01.2–P01.4,P01.6–P01.9 761.2–761.4,761.6–761.9 39 32 1.2188 0.1655 13.6 0.8945 1.5430
Newborn affected by complications of placenta, cordand membranes . . . . . . . . . . . . . . . . . . . . . . . P02 762 579 553 1.0470 0.0128 1.2 1.0219 1.0721Newborn affected by complications involvingplacenta . . . . . . . . . . . . . . . . . . . . . . . . . . P02.0–P02.3 762.0–762.3 306 285 1.0737 0.0174 1.6 1.0395 1.1079
Newborn affected by complications involving cord . . P02.4–P02.6 762.4–762.6 * * * * * * *Newborn affected by chorioamnionitis. . . . . . . . . . P02.7 762.7 258 255 1.0118 0.0163 1.6 0.9799 1.0436Newborn affected by other and unspecifiedabnormalities of membranes . . . . . . . . . . . . . . P02.8–P02.9 762.8–762.9 * * * * * * *
Newborn affected by other complications of laborand delivery . . . . . . . . . . . . . . . . . . . . . . . . . P03 763.0–763.4,763.6–763.9 37 20 1.8500 0.3262 17.6 1.2107 2.4893
Newborn affected by noxious influences transmittedvia placenta or breast milk . . . . . . . . . . . . . . . . . P04 760.7, 763.5 * * * * * * *
Disorders related to length of gestation and fetalmalnutrition . . . . . . . . . . . . . . . . . . . . . . . . . . . P05–P08 764–766 3,843 3,474 1.1062 0.0064 0.6 1.0936 1.1188Slow fetal growth and fetal malnutrition . . . . . . . . . . P05 764 34 30 1.1333 0.1004 8.9 0.9366 1.3301Disorders related to short gestation and low birthweight, not elsewhere classified . . . . . . . . . . . . . . P07 765 3,809 3,444 1.1060 0.0064 0.6 1.0934 1.1186Extremely low birthweight or extreme immaturity . . . P07.0,P07.2 765.0 2,835 2,558 1.1083 0.0079 0.7 1.0927 1.1239Other low birthweight or preterm. . . . . . . . . . . . . P07.1,P07.3 765.1 974 886 1.0993 0.0135 1.2 1.0729 1.1258
Disorders related to long gestation and highbirthweight . . . . . . . . . . . . . . . . . . . . . . . . . . P08 766 * * * * * * *
Birth trauma . . . . . . . . . . . . . . . . . . . . . . . . . . . P10–P15 767 5 113 0.0442 0.0197 44.5 0.0056 0.0829Intrauterine hypoxia and birth asphyxia. . . . . . . . . . . . P20–P21 768 401 277 1.4477 0.0599 4.1 1.3303 1.5650
Intrauterine hypoxia . . . . . . . . . . . . . . . . . . . . . . P20 768.2–768.4 57 63 0.9048 0.1227 13.6 0.6643 1.1452Birth asphyxia . . . . . . . . . . . . . . . . . . . . . . . . . P21 768.5–768.9 344 214 1.6075 0.0763 4.7 1.4579 1.7571
Respiratory distress of newborn . . . . . . . . . . . . . . . . P22 769 917 894 1.0257 0.0131 1.3 1.0001 1.0513Other respiratory conditions originating in the perinatalperiod . . . . . . . . . . . . . . . . . . . . . . . . . . . . . . P23–P28 770 1,160 1,372 0.8455 0.0216 2.6 0.8032 0.8878Congenital pneumonia . . . . . . . . . . . . . . . . . . . . P23 770.0 57 15 3.8000 0.9004 23.7 2.0352 5.5648Neonatal aspiration syndromes . . . . . . . . . . . . . . . P24 770.1 78 56 1.3929 0.1115 8.0 1.1743 1.6114Interstitial emphysema and related conditionsoriginating in the perinatal period . . . . . . . . . . . . . P25 770.2 146 121 1.2066 0.0595 4.9 1.0899 1.3233
See footnotes at end of table.
100N
ationalVitalStatisticsR
eport,Vol.49,No.8,Septem
ber21,2001

Table IV. Comparable category codes and estimated comparability ratios for 130 selected causes of infant death according to the Ninth and TenthRevisions, International Classification of Diseases—Con.
Cause of death (Based on the Tenth Revision,International Classification of Diseases, 1992)
Category codes accordingto the Tenth Revision (ICD–10)
Category codes accordingto the Ninth Revision (ICD–9)
Number ofdeaths allocated
according toEstimated
comparabilityratio
Standarderror
Relativestandard
error
95-percentconfidence limits
TenthRevision
NinthRevision Lower Upper
Pulmonary hemorrhage originating in the perinatalperiod . . . . . . . . . . . . . . . . . . . . . . . . . . . . . P26 770.3 212 145 1.4621 0.0751 5.1 1.3150 1.6092
Chronic respiratory disease originating in the perinatalperiod . . . . . . . . . . . . . . . . . . . . . . . . . . . . . P27 770.7 243 214 1.1355 0.0327 2.9 1.0715 1.1995
Atelectasis . . . . . . . . . . . . . . . . . . . . . . . . . . . P28.0–P28.1 770.4–770.5 382 185 2.0649 0.1144 5.5 1.8406 2.2891All other respiratory conditions originating in theperinatal period . . . . . . . . . . . . . . . . . . . . . . . P28.2–P28.9 770.6–770.8 42 636 0.0660 0.0101 15.2 0.0463 0.0858
Infections specific to the perinatal period . . . . . . . . . . P35–P39 771.0–771.2,771.4–771.8 563 552 1.0199 0.0261 2.6 0.9688 1.0710Bacterial sepsis of newborn . . . . . . . . . . . . . . . . . P36 771.8 470 514 0.9144 0.0272 3.0 0.8611 0.9677Omphalitis of newborn with or without mild . . . . . . .hemorrhage. . . . . . . . . . . . . . . . . . . . . . . . . . P38 771.4 * * * * * * *
All other infections specific to the perinatalperiod . . . . . . . . . . . . . . . . . . . . . . . . . . . . . P35,P37,P39 771.0–771.2,771.5–771.7 93 38 2.4474 0.3705 15.1 1.7211 3.1736
Hemorrhagic and hematological disorders of newborn . . . P50–P61 772–774, 776 390 274 1.4234 0.0640 4.5 1.2979 1.5488Neonatal hemorrhage . . . . . . . . . . . . . . . . . . . . P50–P52,P54 772 319 222 1.4369 0.0698 4.9 1.3002 1.5737Hemorrhagic disease of newborn. . . . . . . . . . . . . . P53 776.0 * * * * * * *Hemolytic disease of newborn due to isoimmunizationand other perinatal jaundice . . . . . . . . . . . . . . . . P55–P59 773–774 * * * * * * *
Hematological disorders . . . . . . . . . . . . . . . . . . . P60–P61 776.1–776.9 * * * * * * *Syndrome of infant of a diabetic mother and neonataldiabetes mellitus . . . . . . . . . . . . . . . . . . . . . . . . P70.0–P70.2 775.0–775.1 * * * * * * *
Necrotizing enterocolitis of newborn . . . . . . . . . . . . . P77 777.5 249 203 1.2266 0.0456 3.7 1.1371 1.3161Hydrops fetalis not due to hemolytic disease . . . . . . . . P83.2 778.0 120 120 1.0000 0.0264 2.6 0.9483 1.0517Other perinatal conditions . . . . . . . . . . . . . . . . . . . P29,P70.3–P76,P78–P81,P83.0–P83.1 775.2–775.9,777.0–777.4,777.6–777.9,
P83.3–P96 778.1–779 1,092 954 1.1447 0.0192 1.7 1.1070 1.1823Congenital malformations, deformations andchromosomal abnormalities . . . . . . . . . . . . . . . . . . . Q00–Q99 740–759 3,400 3,751 0.9064 0.0057 0.6 0.8953 0.9176Anencephaly and similar malformations . . . . . . . . . . . Q00 740 299 299 1.0000 0.0000 0.0 1.0000 1.0000Congenital hydrocephalus . . . . . . . . . . . . . . . . . . . Q03 742.3 62 91 0.6813 0.0552 8.1 0.5732 0.7895Spina bifida . . . . . . . . . . . . . . . . . . . . . . . . . . . . Q05 741 24 32 0.7500 0.0765 10.2 0.6000 0.9000Other congenital malformations of nervous system. . . . . Q01–Q02,Q04,Q06–Q07 742.0–742.2,742.4–742.9 191 177 1.0791 0.0477 4.4 0.9856 1.1725Congenital malformations of heart. . . . . . . . . . . . . . . Q20–Q24 745–746 1,022 1,027 0.9951 0.0081 0.8 0.9793 1.0109Other congenital malformations of circulatory system . . . Q25–Q28 747 75 121 0.6198 0.0504 8.1 0.5210 0.7186Congenital malformations of respiratory system. . . . . . . Q30–Q34 748 361 571 0.6322 0.0225 3.6 0.5882 0.6762Congenital malformations of digestive system. . . . . . . . Q35–Q45 749–751 * * * * * * *Congenital malformations of genitourinary system . . . . . Q50–Q64 752–753 216 229 0.9432 0.0244 2.6 0.8955 0.9910Congenital malformations and deformations ofmusculoskeletal system, limbs and integument . . . . . . Q65–Q85 754–757 269 311 0.8650 0.0319 3.7 0.8024 0.9275
Down’s syndrome . . . . . . . . . . . . . . . . . . . . . . . . Q90 758.0 57 58 0.9828 0.0705 7.2 0.8446 1.1209Edward’s syndrome . . . . . . . . . . . . . . . . . . . . . . . Q91.0–Q91.3 758.2 277 278 0.9964 0.0080 0.8 0.9807 1.0121Patau’s syndrome . . . . . . . . . . . . . . . . . . . . . . . . Q91.4–Q91.7 758.1 170 173 0.9827 0.0099 1.0 0.9632 1.0021Other congenital malformations and deformations . . . . . Q10–Q18,Q86–Q89 743–744,759 304 312 0.9744 0.0210 2.2 0.9332 1.0155Other chromosomal abnormalities, not elsewhereclassified. . . . . . . . . . . . . . . . . . . . . . . . . . . . . Q92–Q99 758.3–758.9 57 53 1.0755 0.0783 7.3 0.9221 1.2289
See footnotes at end of table.
NationalVitalStatistics
Report,Vol.49,N
o.8,September
21,2001101

Table IV. Comparable category codes and estimated comparability ratios for 130 selected causes of infant death according to the Ninth and TenthRevisions, International Classification of Diseases—Con.
Cause of death (Based on the Tenth Revision,International Classification of Diseases, 1992)
Category codes accordingto the Tenth Revision (ICD–10)
Category codes accordingto the Ninth Revision (ICD–9)
Number ofdeaths allocated
according toEstimated
comparabilityratio
Standarderror
Relativestandard
error
95-percentconfidence limits
TenthRevision
NinthRevision Lower Upper
Symptoms, signs and abnormal clinical and laboratoryfindings, not elsewhere classified . . . . . . . . . . . . . . . . R00–R99 780–799 2,799 2,732 1.0245 0.0042 0.4 1.0163 1.0327Sudden infant death syndrome . . . . . . . . . . . . . . . . R95 798.0 2,575 2,485 1.0362 0.0040 0.4 1.0284 1.0440Other symptoms, signs and abnormal clinical andlaboratory findings, not elsewhere classified . . . . . . . . R00–R53,R55–R594,R96–R99 780–796,798.1–799 224 247 0.9069 0.0270 3.0 0.8540 0.9598
All other diseases . . . . . . . . . . . . . . . . . . . . . . . . . F01–F99,H00–H57,L00–M99 290–319,360–379,680–739 * * * * * * *External causes of mortality. . . . . . . . . . . . . . . . . . . . V01–Y84 E800–E999 441 444 0.9932 0.0098 1.0 0.9741 1.0124
Accidents (unintentional injuries). . . . . . . . . . . . . . . . V01–X59 E800–E869,E880-E929 292 285 1.0246 0.0107 1.0 1.0037 1.0454Transport accidents . . . . . . . . . . . . . . . . . . . . . . V01–V99 E800–E848,E920–E929.1 99 108 0.9167 0.0294 3.2 0.8590 0.9743
Motor vehicle accidents . . . . . . . . . . . . . . . . . . V02–V04,V09.0,V09.2,V12–V14,V19.0–V19.2,V19.4–V19.6,V20–V79,V80.3–V80.5,V81.0–V81.1,V82.0–V82.1,V83–V86,V87.0–V87.8,V88.0–V88.8,V89.0,V89.2 E810–E825 95 98 0.9694 0.0176 1.8 0.9349 1.0039
Other and unspecified transport accidents . . . . . . . V01,V05–V06,V09.1,V09.3–V09.9,V10–V11,V15–V18,V19.3,V19.8,V19.9,V80.0–V80.2,V80.6–V80.9,V81.2–V81.9,V82.2–V82.9,V87.9,V88.9,V89.1,V89.3,V89.9,V90–V99 E800–E807,E826–E848,E929.1 * * * * * * *
Falls. . . . . . . . . . . . . . . . . . . . . . . . . . . . . . . W00–W19 E880–E888 * * * * * * *Accidental discharge of firearms . . . . . . . . . . . . . . W32–W34 E922 * * * * * * *Accidental drowning and submersion . . . . . . . . . . . W65–W74 E910 * * * * * * *Accidental suffocation and strangulation in bed . . . . . W75 E913.0 * * * * * * *Other accidental suffocation and strangulation . . . . . . W76–W77,W81–W84 E913.1–E913.9 79 69 1.1449 0.0537 4.7 1.0396 1.2502Accidental inhalation and ingestion of food or otherobjects causing obstruction of respiratory tract . . . . . W78–W80 E911–E912 32 29 1.1034 0.0810 7.3 0.9447 1.2622
Accidents caused by exposure to smoke, fire andflames . . . . . . . . . . . . . . . . . . . . . . . . . . . . . X00–X09 E890–E899 * * * * * * *
Accidental poisoning and exposure to noxioussubstances . . . . . . . . . . . . . . . . . . . . . . . . . . X40–X49 E850–E869,E924.1 * * * * * * *
Other and unspecified accidents . . . . . . . . . . . . . . W20–W31,W35–W64,W85–W99, E900–E909,E914–E921,E923–E924.0,X10–X39,X50–X59 E924.8–E929 * * * * * * *
Assault (homicide) . . . . . . . . . . . . . . . . . . . . . . . . X85–Y09 E960–E968 146 154 0.9481 0.0179 1.9 0.9130 0.9831Assault (homicide) by hanging, strangulation andsuffocation . . . . . . . . . . . . . . . . . . . . . . . . . . X91 E963 * * * * * * *
Assault (homicide) by discharge of firearms . . . . . . . X93–X95 E965.0–E965.4 * * * * * * *Neglect, abandonment and other maltreatmentsyndromes . . . . . . . . . . . . . . . . . . . . . . . . . . Y06–Y07 E967,E968.4 * * * * * * *
Assault (homicide) by other and unspecified means. . . X85–X90,X92,X96–X99,Y00–Y05, E960–E962,E964,E965.5–E966,Y08–Y09 E968.0–E968.3, E968.8–E968.9 91 88 1.0341 0.0417 4.0 0.9524 1.1158
Complications of medical and surgical care . . . . . . . . . Y40–Y84 E870–E879,E930–E949 * * * * * * *Other external causes. . . . . . . . . . . . . . . . . . . . . . X60–X84,Y10–Y36 E970–E979 * * * * * * *
* Figure does not meet standards of reliability or precision; see Technical notes.0.0 Quantity more than zero but less than 0.05.
102N
ationalVitalStatisticsR
eport,Vol.49,No.8,Septem
ber21,2001

National Vital Statistics Report, Vol. 49, No. 8, September 21, 2001 103
selecting the underlying cause of death. Records that could not beprocessed were rejected for manual coding. Since the rejects are notfully representative of the complete file, the comparability ratios in thisreport are biased to an unknown extent. For most categories the biasis believed to be small. Tables III and IV show comparability ratiosonly for causes of death for which the data were deemed reliable;data not deemed reliable were replaced with an asterisk (*).
For the 15 leading causes of death in 1999 according to ICD–10,table 8 presents death rates for 1999, death rates for 1998 for the mostnearly comparable ICD–9 titles (tables I and II) multiplied by the com-parability ratio (comparability-modified rates), and death rates for 1998that are not comparability modified. Comparability-modified data for1998 uses ICD–9 codes that approximate ICD–10 categories (table III).
Selected causes of death with problems of interpretation
Changes between the comparability-modified 1998 rates and the1999 rates for selected causes should be interpreted with caution dueto concerns with the accuracy of the comparability ratio if the ratiodoes not accurately account for difference in the coding andclassification system, changes in death rates between 1998 and 1999will be under or overstated. Although comparability-modified 1998rates are presented in this report for only the 15 leading causes ofdeath (table 8), the following paragraphs attempt to explain some ofthe issues in interpreting these data for selected causes in the List of113 Selected Causes of Death and the List of 130 Selected Causesof Infant Death. For further explanation of these issues, refer to thereport, Comparability of Cause of Death Between ICD–9 and ICD–10:Preliminary Estimates (9).
Alzheimer’s disease—The comparability ratio for Alzheimer’s dis-ease (ICD–10 code G30) is 1.5536 (table III), indicating a 55 percentincrease in Alzheimer’s disease deaths when classified by ICD–10. Inabsolute terms, more than 10,000 additional deaths were classified toAlzheimer’s disease in ICD–10 than in ICD–9. Nearly all of this increase(about 95 percent) comes from deaths that were classified in ICD–9 asPresenile dementia (ICD–9 code 290.1).
The application of the comparability ratio presented for Alz-heimer’s disease to years later than 1996 may substantially underes-timate the increase in Alzheimer’s disease due to ICD–10. Increasesin the reporting of Alzheimer’s-type dementia have occurred since1996, resulting in substantial increases in Presenile dementia from1996 to 1998. The number of Alzheimer’s disease deaths increased byabout 1,000 deaths between 1996 and 1997; slowing to an increaseof about 300 between 1997 and 1998. In contrast, the increase inPresenile dementia was more substantial, about 2,000 deaths eachyear. If the comparability ratio were based on 1998 data it wouldprobably be at least 1.69 (approximating the ICD–10-classified Alz-heimer’s disease deaths by adding the Alzheimer’s disease and Pre-senile dementia deaths). Assuming proportionately similar increases inthe ICD–9 classification of Alzheimer’s disease and Presenile dementiafrom 1998 to 1999, the comparability ratio based on 1999 data couldbe as high as 1.8 or 1.9 resulting in higher rates for Alzheimer’s diseasein 1998. As a consequence, the reported increase in mortality forAlzheimer’s disease in table C is overstated considerably.
Nephritis, nephrotic syndrome and nephrosis and Renalfailure—Nephritis, nephrotic syndrome and nephrosis (ICD–10 codesN00–N07,N17–N19,N25–N27) has a comparability ratio of 1.2320
(table III). The 23 percent increase in this category is due primarily tochanges in the classification of Renal failure (ICD–10 codes N17–N19)that has a comparability ratio of 1.2949. End-stage renal disease, whichwas classified as an unspecified disorder of the kidney in ICD–9 (ICD–9code 593.9) (grouped with All other diseases), has been reclassifiedin ICD–10 as End-stage renal disease (ICD–10 code N18.0), a sub-category of Renal failure (N17–N19). This results in adding a sub-stantial number of deaths to the Renal failure and Nephritis, nephroticsyndrome and nephrosis categories.
When applied to years later than 1996, the comparability ratios forNephritis, nephrotic syndrome and nephrosis and Renal failure pre-sented in this report may underestimate the increase in these causesdue to ICD–10. From 1996 to 1999 reporting of End-stage renal diseaseincreased by about 1,900 deaths. This increase disproportionatelyaffects the numerator of the comparability ratio since End-stage renaldisease is included with Renal failure in ICD–10, but not in ICD–9. Thus,the numerator of the comparability ratio should probably be larger byroughly 1,900 deaths giving a comparability ratio about 1.4 for Renalfailure and about 1.3 for Nephritis, nephrotic syndrome and nephrosis.
Pregnancy, childbirth and the puerperium—The large increase inthe number of deaths attributable to Pregnancy, childbirth and thepuerperium (ICD–10 codes O00-O99) is due to a selection rule changein ICD–10 (26). See section entitled Maternal mortality.
Motor vehicle accidents and Other land transport accidents—Thepreliminary comparability ratio for Motor vehicle accidents shown intable III (0.9754) is different from that shown in the report, Comparabilityof Cause of Death Between ICD–9 and ICD–10: Preliminary Estimates(9). For a death to be classified as a Motor vehicle accident in ICD–10,it must be explicit that the injury involved a ‘‘motor’’ vehicle. In ICD–9,in the absence of the term ‘‘motor’’ or when a vehicle accident wasreported as occurring on a highway or road, the assumption was toclassify the accident as involving a motor vehicle. ICD–10 does notallow this assumption and classifies such accidents as involvingunspecified vehicles (categorized in ICD–10 as Other land transportaccidents). However, for U.S. data, it has been decided that, if anaccident occurred on a highway or road, classification to Motor vehicleaccident is appropriate. This change is made in this report. Taking intoaccount, this change in classification results in a revised comparabilityratio for Motor vehicle accidents. This ratio is only applicable to datain which the aforementioned classification change was implemented.It is possible that some States may have released data that does notinclude this change.
Diarrhea and gastroenteritis of infectious origin—The apparentelimination of infant deaths due to Diarrhea and gastroenteritis ofinfectious origin (ICD–10 code A09) occurred because in ICD–10, fordeveloped countries, diarrhea or gastroenteritis is presumed to benoninfectious unless specified otherwise. In ICD–9 the presumptionwas that the disease was infectious when unspecified. Records codedin ICD–9 to ICD–9 code 009.0 (Infectious colitis, enteritis, and gas-troenteritis) are reclassified in ICD–10 to noninfectious causes.
Birth trauma—For newborns, cerebral hemorrhage either unspeci-fied or due to birth injury, anoxia, or hypoxia was classified in ICD–9to a birth injury or trauma (ICD–9 code 767.0, Subdural and cerebralhemorrhage). In ICD–10, for the cerebral hemorrhage to be classifiedas birth injury (ICD–10 code P10.0, Subdural hemorrhage due to birthinjury), the certifier must specify that there was a birth injury. Cerebralhemorrhages either unspecified or due to anoxia or hypoxia are clas-sified as nontraumatic. Nearly all of the Birth trauma (ICD–10 codes

104 National Vital Statistics Report, Vol. 49, No. 8, September 21, 2001
P10–P15) cases are reclassified to nontraumatic causes; thus thenumerator of the comparability ratio is based on a very small number(table IV).
Atelectasis—In ICD–10, when hypoplasia or dysplasia of lung ismentioned on the death certificate with prematurity or short gestation,the appropriate classification is Primary atelectasis of newborn (ICD–10codes P28.0–P28.1) rather than Hypoplasia and dysplasia of lung(ICD–10 code Q33.6). Due to this coding change, the number of deathsclassified to Atelectasis increased substantially in 1999.
Sudden infant death syndrome (SIDS)—The large decrease in thenumber of deaths attributable to SIDS (ICD–10 code R95) is partiallydue to the change in the way SIDS is diagnosed in the medicalcommunity and reported on the death certificate. Many of these deathshave been classified to the category Other symptoms, signs andabnormal clinical and laboratory findings, not elsewhere classified.
Codes for firearm deaths
Causes of death attributable to firearm mortality include ICD–10codes W32–W34, Accidental discharge of firearms; X72–X74, Inten-tional self-harm (suicide) by discharge of firearms; X93–X95, Assault(homicide) by discharge of firearms; Y22–Y24, Discharge of firearms,undetermined intent; and Y35.0, Legal intervention involving firearmdischarge. Deaths from injury by firearms exclude deaths due toexplosives and other causes indirectly related to firearms.
Codes for drug-induced deaths
Causes of death attributable to drug-induced mortality includeselected codes from the ICD–10 title Mental and behavioral disordersdue to psychoactive substance use, specifically, ICD–10 codesF11.0–F11.5, F11.7–F11.9, F12.0–F12.5, F12.7–F12.9, F13.0–F13.5,F13.7–F13.9, F14.0–F14.5, F14.7–F14.9, F15.0–F15.5, F15.7–F15.9,F16.0–F16.5, F16.7–F16.9, F17.0, F17.3–F17.5, F17.7–F17.9,F18.0–F18.5, F18.7–F18.9, F19.0–F19.5, and F19.7–F19.9; Acci-dental poisoning by and exposure to drugs, medicaments andbiological substances, X40–X44; Intentional self-poisoning (suicide)by and exposure to drugs, medicaments and biological substances,X60–X64; Assault (homicide) by drugs, medicaments and biologicalsubstances, X85; and Poisoning by and exposure to drugs, medica-ments and biological substances, undetermined intent, Y10–Y14.Drug-induced causes exclude accidents, homicides, and othercauses indirectly related to drug use. Also excluded are newborndeaths associated with mother’s drug use.
Codes for alcohol-induced deaths
Causes of death attributable to alcohol-induced mortality includeICD–10 codes F10, Mental and behavioral disorders due to alcoholuse; G31.2, Degeneration of nervous system due to alcohol; G62.1,Alcoholic polyneuropathy; I42.6, Alcoholic cardiomyopathy; K29.2,Alcoholic gastritis; K70, Alcoholic liver disease; R78.0, Finding ofalcohol in blood; X45, Accidental poisoning by and exposure toalcohol; X65, Intentional self-poisoning by and exposure to alcohol;and Y15, Poisoning by and exposure to alcohol, undetermined intent.Alcohol-induced causes exclude accidents, homicides, and othercauses indirectly related to alcohol use. This category also excludesnewborn deaths associated with maternal alcohol use.
Marital status
Age-specific and age-adjusted death rates by marital status areshown in table 22. Mortality data by marital status is generally of highquality. A study of death certificate data using the 1986 NationalMortality Followback Survey showed a high level of consistency inreporting marital status (37). Age-adjusted death rates by maritalstatus were computed based on the age-specific rates and thestandard population for ages 25 years and over. While age-specificdeath rates by marital status are shown for the age group 15–24years, they are not included in the computation of the age-adjustedrate because of their high variability, particularly among the widowedpopulation. Also, the age groups 75–84 and 85 years and over arecombined due to high variability in death rates in the 85 year andover age group, particularly for the never-married population.
Educational attainment
Beginning with the 1989 data year, an item indicating decedent’seducational attainment was added to the certificates of numerousStates. Mortality data on educational attainment for 1999 are basedon deaths to residents of the 46 States and the District of Columbiawhose data were approximately 80 percent or more complete on aplace-of-occurrence basis. Data for Kentucky were excluded usingthis criterion. Data for Georgia, Rhode Island, and South Dakota wereexcluded because the item was not on their certificates.
Age-specific and age-adjusted death rates by educational attain-ment are shown in table 23. Age-adjusted death rates by educationalattainment were computed based on the age-specific rates and thestandard population for ages 25–64 years. Data for age groups 65years and over are not shown because reporting quality is poorer atolder than younger ages (46).
Rates by educational attainment are affected by differences in themeasuring education for the numerator and the denominator. Thenumerator is based on number of years of education completed asreported on the death certificate whereas the denominator is based onhighest degree completed as reported on census surveys (47).
Injury at work
Information on deaths attributed to injuries at work is derivedfrom a separate item on the death certificate that asks the medicalcertifier whether the death resulted from an injury sustained at work.The item is on the death certificate of all States. Number of deaths,age-specific death rates, and age-adjusted death rates for injury atwork are shown in tables 24 and 25. Deaths, crude death rates, andage-adjusted death rates for injury at work are shown for ages 15years and over. Age-adjusted death rates for injury at work werecomputed using age-specific death rates and the U.S. standardpopulation based on year 2000 standard for ages 15 years and over.See section on Computation of Rates.
Infant mortality
Infant mortality rates are the most commonly used index formeasuring the risk of dying during the first year of life. The ratespresented in this report are calculated by dividing the number ofinfant deaths in a calendar year by the number of live birthsregistered for the same period and are presented as rates per 1,000

National Vital Statistics Report, Vol. 49, No. 8, September 21, 2001 105
or per 100,000 live births. For final birth figures used in thedenominator for infant mortality rates, see Births: Final Data for 1999(48). In contrast to infant mortality rates based on live births, infantdeath rates are based on the estimated population under 1 year ofage. Infant death rates that appear in tabulations of age-specificdeath rates in this report are calculated by dividing the number ofinfant deaths by the estimated population of persons under 1 year ofage on July 1, 1999, and are presented as rates per 100,000population in this age group. Because of differences in the denomi-nators, infant death rates may differ from infant mortality rates.
Maternal mortality
Maternal mortality rates are computed on the basis of thenumber of live births. The maternal mortality rate indicates thelikelihood of a pregnant woman dying of maternal causes. They arecalculated by dividing the number of maternal deaths in a calendaryear by the number of live births registered for the same period andare presented as rates per 100,000 live births. The number of livebirths used in the denominator is an approximation of the populationof pregnant women who are at risk of a maternal death.
‘‘Maternal deaths’’ are defined by the World Health Organizationas ‘‘the death of a woman while pregnant or within 42 days of termi-nation of pregnancy, irrespective of the duration and the site of thepregnancy, from any cause related to or aggravated by the pregnancyor its management, but not from accidental or incidental causes’’ (6).Included in these deaths are ICD–10 codes O00–O95, O98–O99, andA34.
Changes have been made in the classification and coding ofmaternal deaths between ICD–9 and ICD–10, effective with mortalitydata for 1999. Some State death certificates include a separate ques-tion regarding pregnancy status. A positive response to the questionis interpreted as ‘‘pregnant’’ being reported in Part II of the cause-of-death section of the death certificate. If a specified length of time is notprovided by the medical certifier, it is assumed that the pregnancyterminated 42 days or less prior to death. Further, if only indirectmaternal causes of death (that is, a previously existing disease or adisease that developed during pregnancy that was not due to directobstetric causes but was aggravated by physiologic effects of preg-nancy) are reported in Part I and pregnancy is reported in either Part Ior Part II, ICD–10 classifies this as a maternal death. ICD–9 onlyclassified the death as maternal if pregnancy was reported in Part I.
Quality of reporting and processing cause of death
One index of the quality of reporting causes of death is theproportion of death certificates coded to Chapter XVIII; Symptoms,signs and abnormal clinical and laboratory findings, not elsewhereclassified (ICD–10 codes R00–R99). Although deaths occur for whichthe underlying causes are impossible to determine, this proportionindicates the care and consideration given to the cause-of-deathstatement by the medical certifier. This proportion also may be usedas a rough measure of the specificity of the medical diagnoses madeby the certifier in various areas. In 1999, 1.12 percent of all reporteddeaths in the United States were assigned to Symptoms, signs andabnormal clinical and laboratory findings, not elsewhere classified.The percent of deaths from this cause for all ages combinedgenerally has remained stable since 1990.
Rare causes of death
Selected causes of death considered to be of public healthconcern are routinely confirmed by the States according to agreedupon procedures between the State vital statistics programs and theNational Center for Health Statistics. These causes, termed Infre-quent and rare causes of death, are listed in the NCHS instructionmanuals Parts 2a, 11, and 20 (26,49,50).
As a consequence of the major effort involved in implementing anew revision of the ICD, a number of States did not provide completeconfirmation of deaths from Infrequent and rare causes for 1999. TheseStates include the following: California, Florida, Illinois, Indiana, Ken-tucky, Maine, Michigan, Missouri, New Jersey, New York City, NorthCarolina, Ohio, Pennsylvania, Rhode Island, Washington, and WestVirginia.
Population bases for computing rates
The population used for computing death rates in this report(furnished by the U.S. Bureau of the Census) represents thepopulation residing in the specified area, enumerated as of April 1 forcensus years and estimated as of July 1 for all other years. Deathrates for the United States for 1999 are based on populationestimates as of July 1, 1999, shown in table V by 10-year age groupsand available by 5-year age groups on the mortality Web site athttp://www.cdc.gov/nchs/datawh/statab/unpubd/mortabs.htm (51). Theestimates are based on the 1990 census level counts. The 1990census level counts by race were modified to be consistent with U.S.Office of Management and Budget categories and historical catego-ries for death data (52). The population estimates for Mexicans,Puerto Ricans, Cubans, and Other Hispanics, shown in table VI, andthe population estimates by marital status, shown in table VII, arebased on the Current Population Survey adjusted to resident popu-lation control totals (53) for the United States and, as such, aresubject to sampling variation (see ‘‘Random variation’’).
Population estimates by educational attainment, shown intable VIII, are also based on the Current Population Survey (53)adjusted to resident population control totals for 46 States and theDistrict of Columbia and are also subject to sampling variation (see‘‘Random variation’’).
Population estimates for each State, Puerto Rico, Virgin Islands,Guam, American Samoa, and Northern Marianas, shown in table IX,are based on demographic analysis and, therefore, are not subject tosampling variation (54–59).
Computing rates
Except for infant and maternal mortality rates, rates are on anannual basis per 1,000 or per 100,000 estimated population residingin the specified area. Infant and maternal mortality rates are per1,000 or per 100,000 live births. Comparisons made in the textamong rates, unless otherwise specified, are statistically significant atthe 0.05 level of significance. Lack of comment in the text about anytwo rates does not mean that the difference was tested and found notto be significant at this level.
Age-adjusted rates are used to compare relative mortality risksamong groups and over time. However, they should be viewed as

Table V. Estimated population by 10-year age groups, specified race and sex: United States, 1999
Age
All races White Black American Indian Asian or Pacific Islander
Total Male Female Total Male Female Total Male Female Total Male Female Total Male Female
Total . . . . . . . . . 272,690,813 133,276,559 139,414,254 224,610,797 110,336,291 114,274,506 34,862,169 16,557,186 18,304,983 2,397,426 1,186,745 1,210,681 10,820,421 5,196,337 5,624,084
Under 1 year . . . . 3,819,903 1,952,133 1,867,770 3,027,180 1,549,389 1,477,791 568,772 289,078 279,694 42,542 21,442 21,100 181,409 92,224 89,1851–4 years. . . . . . . 15,122,239 7,730,542 7,391,697 12,015,456 6,155,680 5,859,776 2,226,888 1,129,687 1,097,201 159,576 80,755 78,821 720,319 364,420 355,8995–14 years . . . . . 39,495,230 20,219,664 19,275,566 31,094,794 15,940,356 15,154,438 6,232,872 3,166,617 3,066,255 467,966 237,653 230,313 1,699,598 875,038 824,56015–24 years . . . . . 37,773,512 19,334,049 18,439,463 30,014,705 15,441,143 14,573,562 5,740,422 2,881,622 2,858,800 428,979 215,783 213,196 1,589,406 795,501 793,90525–34 years. . . . . 37,935,812 18,826,288 19,109,524 30,431,393 15,273,321 15,158,072 5,286,663 2,505,284 2,781,379 374,047 191,269 182,778 1,843,709 856,414 987,29535–44 years. . . . . 44,812,649 22,254,316 22,558,333 36,946,545 18,540,240 18,406,305 5,652,358 2,653,695 2,998,663 358,769 178,119 180,650 1,854,977 882,262 972,71545–54 years . . . . . 35,802,358 17,499,088 18,303,270 30,249,529 14,954,220 15,295,309 3,928,525 1,783,710 2,144,815 256,008 123,692 132,316 1,368,296 637,466 730,83055–64 years. . . . . 23,389,085 11,150,407 12,238,678 20,133,661 9,710,115 10,423,546 2,345,099 1,014,648 1,330,451 148,113 69,600 78,513 762,212 356,044 406,16865–74 years . . . . . 18,218,248 8,198,696 10,019,552 15,958,629 7,243,777 8,714,852 1,678,493 707,523 970,970 90,511 40,756 49,755 490,615 206,640 283,97575–84 years . . . . . 12,146,695 4,871,134 7,275,561 10,965,640 4,414,172 6,551,468 889,080 333,297 555,783 50,534 21,212 29,322 241,441 102,453 138,98885 yearsand over . . . . . . 4,175,082 1,240,242 2,934,840 3,773,265 1,113,878 2,659,387 312,997 92,025 220,972 20,381 6,464 13,917 68,439 27,875 40,564
SOURCE: Unpublished Bureau of the Census file NESTV99.
Table VI. Estimated population by 10-year age groups, according to specified Hispanic origin, race for non-Hispanic population, and sex: United States, 1999Hispanic origin, race for
non-Hispanic population, and sex TotalUnder1 year
1–4years
5–14years
15–24years
25–34years
35–44years
45–54years
55–64years
65–74years
75–84years
85 yearsand over
All origins . . . . . . . . . . . . . . 272,690,817 3,819,898 15,122,243 39,495,210 37,773,512 37,935,822 44,812,633 35,802,344 23,389,103 18,218,255 12,146,702 4,175,095Male . . . . . . . . . . . . . 133,276,546 1,952,129 7,730,544 20,219,645 19,334,054 18,826,296 22,254,296 17,499,079 11,150,419 8,198,701 4,871,139 1,240,244Female . . . . . . . . . . . . 139,414,271 1,867,769 7,391,699 19,275,565 18,439,458 19,109,526 22,558,337 18,303,265 12,238,684 10,019,554 7,275,563 2,934,851
Hispanic. . . . . . . . . . . . . . . 31,337,161 721,505 2,745,603 5,982,424 5,470,190 5,230,172 4,748,231 2,914,649 1,679,035 1,101,735 554,434 189,183Male . . . . . . . . . . . . . 15,761,486 367,917 1,401,922 3,054,760 2,839,902 2,694,460 2,423,093 1,423,924 778,134 485,849 227,993 63,532Female . . . . . . . . . . . . 15,575,675 353,588 1,343,681 2,927,664 2,630,288 2,535,712 2,325,138 1,490,725 900,901 615,886 326,441 125,651
Mexican . . . . . . . . . . . . . 20,488,782 512,263 1,982,862 4,165,118 3,787,811 3,503,948 2,925,177 1,708,153 924,033 597,836 292,282 89,299Male . . . . . . . . . . . . . 10,548,482 261,059 997,510 2,151,110 2,004,072 1,838,773 1,530,723 876,699 450,397 271,914 132,653 33,572Female . . . . . . . . . . . . 9,940,300 251,204 985,352 2,014,008 1,783,739 1,665,175 1,394,454 831,454 473,636 325,922 159,629 55,727
Puerto Rican . . . . . . . . . . . 2,945,172 60,495 231,465 544,553 505,575 451,306 439,630 317,737 193,064 127,288 62,256 11,803Male . . . . . . . . . . . . . 1,419,464 30,919 128,458 280,642 246,828 210,967 203,359 149,028 90,634 49,110 25,783 3,736Female . . . . . . . . . . . . 1,525,708 29,576 103,007 263,911 258,747 240,339 236,271 168,709 102,430 78,178 36,473 8,067
Cuban . . . . . . . . . . . . . . 1,344,410 16,287 54,265 135,355 136,076 175,451 208,400 169,844 173,622 144,959 97,666 32,485Male . . . . . . . . . . . . . 646,862 7,260 17,640 72,174 66,202 86,250 112,076 82,361 86,336 75,189 31,530 9,844Female . . . . . . . . . . . . 697,548 9,027 36,625 63,181 69,874 89,201 96,324 87,483 87,286 69,770 66,136 22,641
Other Hispanic1 . . . . . . . . . 6,558,797 132,460 477,011 1,137,398 1,040,728 1,099,467 1,175,024 718,915 388,316 231,652 102,230 55,596Male . . . . . . . . . . . . . 3,146,678 68,679 258,314 550,834 522,800 558,470 576,935 315,836 150,767 89,636 38,027 16,380Female . . . . . . . . . . . . 3,412,119 63,781 218,697 586,564 517,928 540,997 598,089 403,079 237,549 142,016 64,203 39,216
Non-Hispanic2. . . . . . . . . . . . 241,353,656 3,098,393 12,376,640 33,512,786 32,303,322 32,705,650 40,064,402 32,887,695 21,710,068 17,116,520 11,592,268 3,985,912Male . . . . . . . . . . . . . 117,515,060 1,584,212 6,328,622 17,164,885 16,494,152 16,131,836 19,831,203 16,075,155 10,372,285 7,712,852 4,643,146 1,176,712Female . . . . . . . . . . . . 123,838,596 1,514,181 6,048,018 16,347,901 15,809,170 16,573,814 20,233,199 16,812,540 11,337,783 9,403,668 6,949,122 2,809,200
White . . . . . . . . . . . . . . . 196,049,405 2,366,680 9,504,139 25,662,188 25,019,655 25,667,506 32,639,082 27,600,764 18,598,444 14,945,247 10,450,220 3,595,480Male . . . . . . . . . . . . . 95,962,070 1,212,565 4,873,529 13,167,936 12,843,492 12,814,074 16,340,919 13,659,876 8,997,644 6,795,986 4,201,617 1,054,432Female . . . . . . . . . . . . 100,087,335 1,154,115 4,630,610 12,494,252 12,176,163 12,853,432 16,298,163 13,940,888 9,600,800 8,149,261 6,248,603 2,541,048
Black . . . . . . . . . . . . . . . 33,092,411 529,001 2,074,442 5,886,951 5,446,361 4,996,800 5,366,444 3,757,034 2,249,229 1,617,792 862,710 305,647Male . . . . . . . . . . . . . 15,674,062 268,703 1,051,490 2,988,505 2,731,741 2,360,779 2,507,837 1,699,897 971,148 681,338 322,995 89,629Female . . . . . . . . . . . . 17,418,349 260,298 1,022,952 2,898,446 2,714,620 2,636,021 2,858,607 2,057,137 1,278,081 936,454 539,715 216,018
1Includes Central and South American and Other and unknown Hispanic. 2Includes races other than white and black.
SOURCE: Population estimates based on unpublished tabulations prepared by the Housing and Household Economic Statistics Division, U.S. Bureau of the Census.
106N
ationalVitalStatisticsR
eport,Vol.49,No.8,Septem
ber21,2001

Table VII. Estimated population for ages 15 years and over by marital status, 10-year age groups, race, and sex:United States, 1999
Race, sex, andmarital status
15 yearsand over
15–24years
25–34years
35–44years
45–54years
55–64years
65–74years
75 yearsand over
All races1 . . . . . . . . . . . 214,253,450 37,773,516 37,935,789 44,812,661 35,802,370 23,389,072 18,218,238 16,321,804Never married. . . . . . . . 59,325,869 33,280,736 13,443,119 7,028,745 3,023,419 1,216,086 694,728 639,036Ever married . . . . . . . 154,927,581 4,492,780 24,492,670 37,783,916 32,778,951 22,172,986 17,523,510 15,682,768
Married . . . . . . . . . 120,319,059 4,170,254 21,821,638 31,386,346 26,347,606 17,153,203 12,121,780 7,318,232Widowed . . . . . . . . . 14,703,589 14,013 92,354 404,593 874,824 1,818,109 3,848,043 7,651,653Divorced.. . . . . . . . . 19,904,933 308,513 2,578,678 5,992,977 5,556,521 3,201,674 1,553,687 712,883
All races,1 male . . . . . . . 103,374,198 19,334,060 18,826,271 22,254,312 17,499,075 11,150,399 8,198,689 6,111,392Never married. . . . . . . . 32,158,349 17,663,740 7,700,596 4,084,523 1,555,183 611,445 307,972 234,890Ever married . . . . . . . . 71,215,849 1,670,320 11,125,675 18,169,789 15,943,892 10,538,954 7,890,717 5,876,502
Married . . . . . . . . . . 59,887,583 1,558,121 10,014,050 15,284,800 13,366,454 8,881,852 6,520,127 4,262,179Widowed . . . . . . . . . 2,697,871 1,205 17,991 104,440 174,507 319,701 710,507 1,369,520Divorced.. . . . . . . . . 8,630,395 110,994 1,093,634 2,780,549 2,402,931 1,337,401 660,083 244,803
All races,1 female . . . . . . 110,879,252 18,439,456 19,109,518 22,558,349 18,303,295 12,238,673 10,019,549 10,210,412Never married. . . . . . . . 27,167,520 15,616,996 5,742,523 2,944,222 1,468,236 604,641 386,756 404,146Ever married . . . . . . . . 83,711,732 2,822,460 13,366,995 19,614,127 16,835,059 11,634,032 9,632,793 9,806,266
Married . . . . . . . . . . 60,431,476 2,612,133 11,807,588 16,101,546 12,981,152 8,271,351 5,601,653 3,056,053Widowed . . . . . . . . . 12,005,718 12,808 74,363 300,153 700,317 1,498,408 3,137,536 6,282,133Divorced.. . . . . . . . . 11,274,538 197,519 1,485,044 3,212,428 3,153,590 1,864,273 893,604 468,080
White. . . . . . . . . . . . . . 178,473,363 30,014,708 30,431,387 36,946,548 30,249,543 20,133,641 15,958,634 14,738,902Never married. . . . . . . . 44,853,837 26,047,748 9,676,554 4,926,191 2,188,638 915,291 536,697 562,718Ever married . . . . . . . 133,619,526 3,966,960 20,754,833 32,020,357 28,060,905 19,218,350 15,421,937 14,176,184
Married . . . . . . . . . . 104,652,644 3,693,245 18,538,676 26,783,108 22,788,468 15,158,095 10,910,637 6,780,415Widowed . . . . . . . . . 12,439,757 8,727 66,107 315,778 662,094 1,414,227 3,190,185 6,782,639Divorced.. . . . . . . . . 16,527,125 264,988 2,150,050 4,921,471 4,610,343 2,646,028 1,321,115 613,130
White male . . . . . . . . . . 86,690,843 15,441,144 15,273,309 18,540,233 14,954,211 9,710,105 7,243,785 5,528,056Never married. . . . . . . . 24,941,567 13,975,201 5,786,730 3,069,701 1,190,999 481,755 236,661 200,520Ever married . . . . . . . . 61,749,276 1,465,943 9,486,579 15,470,532 13,763,212 9,228,350 7,007,124 5,327,536
Married . . . . . . . . . . 52,237,112 1,366,346 8,563,878 13,068,602 11,581,204 7,856,009 5,873,623 3,927,450Widowed . . . . . . . . . 2,247,711 846 17,414 80,029 132,439 244,324 577,045 1,195,614Divorced.. . . . . . . . . 7,264,453 98,751 905,287 2,321,901 2,049,569 1,128,017 556,456 204,472
White female . . . . . . . . . 91,782,520 14,573,564 15,158,078 18,406,315 15,295,332 10,423,536 8,714,849 9,210,846Never married. . . . . . . . 19,912,270 12,072,547 3,889,824 1,856,490 997,639 433,536 300,036 362,198Ever married . . . . . . . . 71,870,250 2,501,017 11,268,254 16,549,825 14,297,693 9,990,000 8,414,813 8,848,648
Married . . . . . . . . . . 52,415,532 2,326,899 9,974,798 13,714,506 11,207,264 7,302,086 5,037,014 2,852,965Widowed . . . . . . . . . 10,192,046 7,881 48,693 235,749 529,655 1,169,903 2,613,140 5,587,025Divorced.. . . . . . . . . 9,262,672 166,237 1,244,763 2,599,570 2,560,774 1,518,011 764,659 408,658
Black . . . . . . . . . . . . . . 25,833,663 5,740,427 5,286,661 5,652,362 3,928,525 2,345,107 1,678,490 1,202,091Never married. . . . . . . . 11,191,899 5,401,212 2,830,960 1,776,005 713,843 271,582 136,849 61,448Ever married . . . . . . . . 14,641,764 339,215 2,455,701 3,876,357 3,214,682 2,073,525 1,541,641 1,140,643
Married . . . . . . . . . . 9,986,018 307,153 2,093,204 2,914,336 2,237,024 1,268,666 810,750 354,885Widowed . . . . . . . . . 1,835,077 2,256 24,685 72,818 173,022 330,517 527,831 703,948Divorced.. . . . . . . . . 2,820,669 29,806 337,812 889,203 804,636 474,342 203,060 81,810
Black male . . . . . . . . . . 11,971,816 2,881,630 2,505,282 2,653,699 1,783,711 1,014,651 707,518 425,325Never married. . . . . . . . 5,475,863 2,750,533 1,374,466 830,959 315,717 116,805 62,027 25,356Ever married . . . . . . . . 6,495,953 131,097 1,130,816 1,822,740 1,467,994 897,846 645,491 399,969
Married . . . . . . . . . . 4,962,125 122,449 975,428 1,418,674 1,128,887 659,012 441,587 216,088Widowed . . . . . . . . . 381,222 0 0 20,097 39,804 60,441 111,753 149,127Divorced.. . . . . . . . . 1,152,606 8,648 155,388 383,969 299,303 178,393 92,151 34,754
Black female . . . . . . . . . 13,861,847 2,858,797 2,781,379 2,998,663 2,144,814 1,330,456 970,972 776,766Never married. . . . . . . . 5,716,036 2,650,679 1,456,494 945,046 398,126 154,777 74,822 36,092Ever married . . . . . . . . 8,145,811 208,118 1,324,885 2,053,617 1,746,688 1,175,679 896,150 740,674
Married . . . . . . . . . . 5,023,893 184,704 1,117,776 1,495,662 1,108,137 609,654 369,163 138,797Widowed . . . . . . . . . 1,453,855 2,256 24,685 52,721 133,218 270,076 416,078 554,821Divorced.. . . . . . . . . 1,668,063 21,158 182,424 505,234 505,333 295,949 110,909 47,056
1Includes races other than white and black.
SOURCE: Population estimates based on unpublished tabulations prepared by the Housing and Household Economic Statistics Division, U.S. Bureau of the Census.
National Vital Statistics Report, Vol. 49, No. 8, September 21, 2001 107
relative indexes rather than as actual measures of mortality risk. Theywere computed by the direct method, that is, by applying age-specificdeath rates to the U.S. standard population.Beginning with the 1999 data year, a new population standard wasadopted by NCHS for use in age-adjusting death rates. Based on theyear 2000 projected population of the United States, the new
standard replaces the 1940 standard population that had been usedfor over 50 years. The new population standard affects levels ofmortality and to some extent trends and group comparisons. Ofparticular note are the effects on race comparison of mortality. Fordetailed discussion see Age Standardization of Death Rates: Imple-mentation of the Year 2000 Standard (7).

Table VIII. Estimated population for ages 25–64 years, by educational attainment and sex: Total of 46 reporting Statesand the District of Columbia, 1999
Years of school completed and sex25–64years
25–34years
35–44years
45–54years
55–64years
Both sexes . . . . . . . . . . . . . . . . . 134,833,509 36,084,064 42,608,999 33,842,243 22,298,203Under 12 years. . . . . . . . . . . . . . 17,266,667 4,433,942 4,933,222 3,819,020 4,080,48312 years. . . . . . . . . . . . . . . . . . 44,118,610 11,032,314 14,373,871 10,601,169 8,111,25613 or more years . . . . . . . . . . . . 73,448,232 20,617,808 23,301,906 19,422,054 10,106,464
Male . . . . . . . . . . . . . . . . . . . . . 66,309,181 17,920,066 21,187,418 16,562,700 10,638,997Under 12 years. . . . . . . . . . . . . . 8,790,283 2,371,126 2,629,132 1,855,186 1,934,83912 years. . . . . . . . . . . . . . . . . . 21,261,941 5,762,296 7,282,051 4,733,429 3,484,16513 or more years . . . . . . . . . . . . 36,256,957 9,786,644 11,276,235 9,974,085 5,219,993
Female . . . . . . . . . . . . . . . . . . . . 68,524,328 18,163,998 21,421,581 17,279,543 11,659,206Under 12 years. . . . . . . . . . . . . . 8,476,384 2,062,816 2,304,090 1,963,834 2,145,64412 years. . . . . . . . . . . . . . . . . . 22,856,669 5,270,018 7,091,820 5,867,740 4,627,09113 or more years . . . . . . . . . . . . 37,191,275 10,831,164 12,025,671 9,447,969 4,886,471
SOURCE: Population estimates based on unpublished tabulations prepared by the Housing and Household Economic Statistics Divsion, U.S. Bureau of the Census.
Table IX. Estimated population for the United States, each division, each State, Puerto Rico, Virgin Islands, Guam,American Samoa, and Northern Marianas, 1999
Area Total Area Total
United States . . . . . . . . . . . . . . . . . . . . . . 272,690,813 East South Central . . . . . . . . . . . . . . . . . . 16,582,841Kentucky . . . . . . . . . . . . . . . . . . . . . . . 3,960,825
New England . . . . . . . . . . . . . . . . . . . . . . 13,495,933 Tennessee . . . . . . . . . . . . . . . . . . . . . . 5,483,535Maine . . . . . . . . . . . . . . . . . . . . . . . . . 1,253,040 Alabama . . . . . . . . . . . . . . . . . . . . . . . 4,369,862New Hampshire . . . . . . . . . . . . . . . . . . . 1,201,134 Mississippi . . . . . . . . . . . . . . . . . . . . . . 2,768,619Vermont . . . . . . . . . . . . . . . . . . . . . . . . 593,740 West South Central . . . . . . . . . . . . . . . . . . 30,325,593Massachusetts . . . . . . . . . . . . . . . . . . . . 6,175,169 Arkansas. . . . . . . . . . . . . . . . . . . . . . . 2,551,373Rhode Island . . . . . . . . . . . . . . . . . . . . . 990,819 Louisiana . . . . . . . . . . . . . . . . . . . . . . 4,372,035Connecticut . . . . . . . . . . . . . . . . . . . . . . 3,282,031 Oklahoma . . . . . . . . . . . . . . . . . . . . . . 3,358,044
Middle Atlantic. . . . . . . . . . . . . . . . . . . . . . 38,334,029 Texas . . . . . . . . . . . . . . . . . . . . . . . . . 20,044,141New York . . . . . . . . . . . . . . . . . . . . . . . 18,196,601 Mountain . . . . . . . . . . . . . . . . . . . . . . . . 17,127,479New Jersey . . . . . . . . . . . . . . . . . . . . . . 8,143,412 Montana . . . . . . . . . . . . . . . . . . . . . . . 882,779Pennsylvania . . . . . . . . . . . . . . . . . . . . . 11,994,016 Idaho . . . . . . . . . . . . . . . . . . . . . . . . . 1,251,700
East North Central . . . . . . . . . . . . . . . . . . . 44,442,146 Wyoming. . . . . . . . . . . . . . . . . . . . . . . 479,602Ohio . . . . . . . . . . . . . . . . . . . . . . . . . . 11,256,654 Colorado . . . . . . . . . . . . . . . . . . . . . . . 4,056,133Indiana . . . . . . . . . . . . . . . . . . . . . . . . 5,942,901 New Mexico . . . . . . . . . . . . . . . . . . . . . 1,739,844Illinois . . . . . . . . . . . . . . . . . . . . . . . . . 12,128,370 Arizona. . . . . . . . . . . . . . . . . . . . . . . . 4,778,332Michigan . . . . . . . . . . . . . . . . . . . . . . . 9,863,775 Utah . . . . . . . . . . . . . . . . . . . . . . . . . 2,129,836Wisconsin . . . . . . . . . . . . . . . . . . . . . . . 5,250,446 Nevada. . . . . . . . . . . . . . . . . . . . . . . . 1,809,253
West North Central . . . . . . . . . . . . . . . . . . . 18,800,138 Pacific . . . . . . . . . . . . . . . . . . . . . . . . . . 44,022,633Minnesota . . . . . . . . . . . . . . . . . . . . . . . 4,775,508 Washington . . . . . . . . . . . . . . . . . . . . . 5,756,361Iowa . . . . . . . . . . . . . . . . . . . . . . . . . . 2,869,413 Oregon . . . . . . . . . . . . . . . . . . . . . . . . 3,316,154Missouri . . . . . . . . . . . . . . . . . . . . . . . . 5,468,338 California. . . . . . . . . . . . . . . . . . . . . . . 33,145,121North Dakota . . . . . . . . . . . . . . . . . . . . . 633,666 Alaska . . . . . . . . . . . . . . . . . . . . . . . . 619,500South Dakota. . . . . . . . . . . . . . . . . . . . . 733,133 Hawaii . . . . . . . . . . . . . . . . . . . . . . . . 1,185,497Nebraska . . . . . . . . . . . . . . . . . . . . . . . 1,666,028Kansas . . . . . . . . . . . . . . . . . . . . . . . . 2,654,052 Puerto Rico . . . . . . . . . . . . . . . . . . . . . . 3,889,507
South Atlantic . . . . . . . . . . . . . . . . . . . . . . 49,560,021 Virgin Islands . . . . . . . . . . . . . . . . . . . . . 119,615Delaware . . . . . . . . . . . . . . . . . . . . . . . 753,538 Guam . . . . . . . . . . . . . . . . . . . . . . . . . . 151,968Maryland . . . . . . . . . . . . . . . . . . . . . . . 5,171,634 American Samoa . . . . . . . . . . . . . . . . . . . 63,781District of Columbia . . . . . . . . . . . . . . . . . 519,000 Northern Marianas . . . . . . . . . . . . . . . . . . 69,216Virginia . . . . . . . . . . . . . . . . . . . . . . . . 6,872,912West Virginia . . . . . . . . . . . . . . . . . . . . . 1,806,928North Carolina . . . . . . . . . . . . . . . . . . . . 7,650,789South Carolina . . . . . . . . . . . . . . . . . . . . 3,885,736Georgia . . . . . . . . . . . . . . . . . . . . . . . . 7,788,240Florida . . . . . . . . . . . . . . . . . . . . . . . . . 15,111,244
SOURCE: Unpublished Bureau of the Census file STRES991.txt.
108 National Vital Statistics Report, Vol. 49, No. 8, September 21, 2001
All age-adjusted rates shown in this report are based on the year2000 standard population. The year 2000 standard population andcorresponding weights used for computing age-adjusted rates andrelative standard errors (RSEs), excluding those by marital status,education, injury at work, and the U.S. territories, are shown in table X.
Age-adjusted rates by marital status were computed by applyingthe age-specific death rates to the U.S. standard population for ages25 years and over. Although age-specific death rates by maritalstatus are shown for the age group 15–24 years, they are notincluded in the calculation of age-adjusted rate because of their high
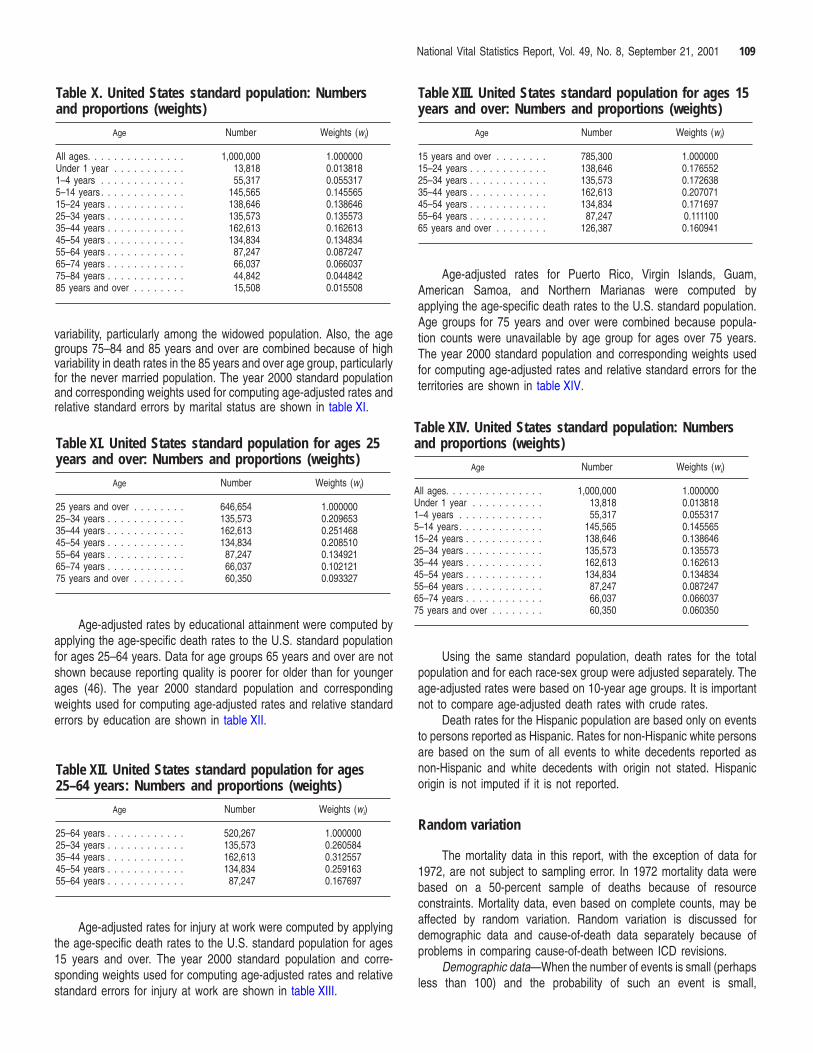
Table X. United States standard population: Numbersand proportions (weights)
Age Number Weights (wi)
All ages. . . . . . . . . . . . . . . 1,000,000 1.000000Under 1 year . . . . . . . . . . . 13,818 0.0138181–4 years . . . . . . . . . . . . . 55,317 0.0553175–14 years . . . . . . . . . . . . . 145,565 0.14556515–24 years . . . . . . . . . . . . 138,646 0.13864625–34 years . . . . . . . . . . . . 135,573 0.13557335–44 years . . . . . . . . . . . . 162,613 0.16261345–54 years . . . . . . . . . . . . 134,834 0.13483455–64 years . . . . . . . . . . . . 87,247 0.08724765–74 years . . . . . . . . . . . . 66,037 0.06603775–84 years . . . . . . . . . . . . 44,842 0.04484285 years and over . . . . . . . . 15,508 0.015508
Table XIII. United States standard population for ages 15years and over: Numbers and proportions (weights)
Age Number Weights (wi)
15 years and over . . . . . . . . 785,300 1.00000015–24 years . . . . . . . . . . . . 138,646 0.17655225–34 years . . . . . . . . . . . . 135,573 0.17263835–44 years . . . . . . . . . . . . 162,613 0.20707145–54 years . . . . . . . . . . . . 134,834 0.17169755–64 years . . . . . . . . . . . . 87,247 0.11110065 years and over . . . . . . . . 126,387 0.160941
National Vital Statistics Report, Vol. 49, No. 8, September 21, 2001 109
variability, particularly among the widowed population. Also, the agegroups 75–84 and 85 years and over are combined because of highvariability in death rates in the 85 years and over age group, particularlyfor the never married population. The year 2000 standard populationand corresponding weights used for computing age-adjusted rates andrelative standard errors by marital status are shown in table XI.
Table XI. United States standard population for ages 25years and over: Numbers and proportions (weights)
Age Number Weights (wi)
25 years and over . . . . . . . . 646,654 1.00000025–34 years . . . . . . . . . . . . 135,573 0.20965335–44 years . . . . . . . . . . . . 162,613 0.25146845–54 years . . . . . . . . . . . . 134,834 0.20851055–64 years . . . . . . . . . . . . 87,247 0.13492165–74 years . . . . . . . . . . . . 66,037 0.10212175 years and over . . . . . . . . 60,350 0.093327
Table XIV. United States standard population: Numbersand proportions (weights)
Age Number Weights (wi)
All ages. . . . . . . . . . . . . . . 1,000,000 1.000000Under 1 year . . . . . . . . . . . 13,818 0.0138181–4 years . . . . . . . . . . . . . 55,317 0.0553175–14 years . . . . . . . . . . . . . 145,565 0.14556515–24 years . . . . . . . . . . . . 138,646 0.13864625–34 years . . . . . . . . . . . . 135,573 0.13557335–44 years . . . . . . . . . . . . 162,613 0.16261345–54 years . . . . . . . . . . . . 134,834 0.13483455–64 years . . . . . . . . . . . . 87,247 0.08724765–74 years . . . . . . . . . . . . 66,037 0.06603775 years and over . . . . . . . . 60,350 0.060350
Age-adjusted rates by educational attainment were computed byapplying the age-specific death rates to the U.S. standard populationfor ages 25–64 years. Data for age groups 65 years and over are notshown because reporting quality is poorer for older than for youngerages (46). The year 2000 standard population and correspondingweights used for computing age-adjusted rates and relative standarderrors by education are shown in table XII.
Table XII. United States standard population for ages25–64 years: Numbers and proportions (weights)
Age Number Weights (wi)
25–64 years . . . . . . . . . . . . 520,267 1.00000025–34 years . . . . . . . . . . . . 135,573 0.26058435–44 years . . . . . . . . . . . . 162,613 0.31255745–54 years . . . . . . . . . . . . 134,834 0.25916355–64 years . . . . . . . . . . . . 87,247 0.167697
Age-adjusted rates for injury at work were computed by applyingthe age-specific death rates to the U.S. standard population for ages15 years and over. The year 2000 standard population and corre-sponding weights used for computing age-adjusted rates and relativestandard errors for injury at work are shown in table XIII.
Age-adjusted rates for Puerto Rico, Virgin Islands, Guam,American Samoa, and Northern Marianas were computed byapplying the age-specific death rates to the U.S. standard population.Age groups for 75 years and over were combined because popula-tion counts were unavailable by age group for ages over 75 years.The year 2000 standard population and corresponding weights usedfor computing age-adjusted rates and relative standard errors for theterritories are shown in table XIV.
Using the same standard population, death rates for the totalpopulation and for each race-sex group were adjusted separately. Theage-adjusted rates were based on 10-year age groups. It is importantnot to compare age-adjusted death rates with crude rates.
Death rates for the Hispanic population are based only on eventsto persons reported as Hispanic. Rates for non-Hispanic white personsare based on the sum of all events to white decedents reported asnon-Hispanic and white decedents with origin not stated. Hispanicorigin is not imputed if it is not reported.
Random variation
The mortality data in this report, with the exception of data for1972, are not subject to sampling error. In 1972 mortality data werebased on a 50-percent sample of deaths because of resourceconstraints. Mortality data, even based on complete counts, may beaffected by random variation. Random variation is discussed fordemographic data and cause-of-death data separately because ofproblems in comparing cause-of-death between ICD revisions.
Demographic data—When the number of events is small (perhapsless than 100) and the probability of such an event is small,

110 National Vital Statistics Report, Vol. 49, No. 8, September 21, 2001
considerable caution must be observed in interpreting the data. Suchinfrequent events may be assumed to follow a Poisson probabilitydistribution. For this distribution, the relative standard error (RSE) is ameasure of the variability. For computing RSEs in percent, this formulamay be used for all tables except for the death rates shown in tables 4,22, and 23 (see subsection below):
1. RSE(D) = RSE(R ) = 100Œ1D
whereD = number of deathsR = rate
Beginning with 1989 data, an asterisk is shown in place of a ratebased on fewer than 20 deaths, which is the equivalent of an RSE(R)of 23 percent or more. A RSE(R) of 23 percent is consideredstatistically unreliable. For age-adjusted death rates, this criterion wasbased on the sum of the age-specific deaths. This same procedure isused in this report except for the death rates shown in tables 4, 22,and 23 (see subsection below).
For tables showing the number of deaths (D) (where D is 100 ormore) the chances are 95 in 100 that
2. D – (1.96 v D vRSE(D)
100 ) and D + (1.96 v D vRSE(D)
100 )cover the ‘‘true’’ number of deaths. This is referred to as a 95-percentconfidence interval. For computing 95-percent confidence intervalswhen D is less than 100 deaths, see the NCHS Web site athttp://www.cdc.gov/nchs and refer to ‘‘Technical Appendix from VitalStatistics of United States: Mortality, 1999.’’
For tables showing a crude death rate (R) or an age-specific deathrate (based on 100 or more deaths) for the i th age group (Ri), exceptthe rates in tables 4, 22, and 23, the chances are 95 in 100 that theactual rate falls within the confidence interval as computed using thefollowing formula:
3. R – (1.96 v R vRSE(R)
100 ) and R + (1.96 v R vRSE(R)
100 )For computing 95-percent confidence intervals for R when D is
less than 100 deaths, see the Web site mentioned above.For testing the difference between two rates (R1 and R2, each
based on 100 or more deaths), the following z-test may be used todefine a significance test statistic:
4. z =R1 – R2
�R 21 (RSE(R1)
100 )2
+ R 22 (RSE(R2)
100 )2
If ?z ? ≥ 1.96, then the difference is statistically significant at the0.05 level and if z < 1.96, the difference is not significant. Forcomputing statistical tests when R1 and/or R2 are based on less than100 deaths, see the Web site mentioned above.
For tables showing an age-adjusted death rate (R ′), except therates in tables 4, 22, and 23, the RSEs in formulas 3 and 4 above wouldbe substituted by this formula:
5. RSE(R ′) = 100
η {w 2i R 2
i ( 1Di
) }R ′
where
Ri = age-specific rate for the i th age groupwi = i th age-specific U.S. standard population such that
∑(wi) = 1.000000 (see table X and age-adjusted death rateunder ‘‘Definition of terms’’ )
Di = number of deaths for the i th age group
For tables showing an infant mortality rate (based on live birthsin the denominator), IMR, the RSEs in formulas 3 and 4 would besubstituted by the following formula:
6. RSE(IMR) = 100Œ1D +
1B
where
B = number of live births
For tables showing a maternal mortality rate (based on livebirths in the denominator), the RSEs in formulas 3 and 4 would besubstituted with formula 6.
Tables 4, 22, and 23—Rates for Mexicans, Puerto Ricans,Cubans, and Other Hispanics in table 4, rates by marital status intable 22, and rates by educational attainment in table 23 are based onpopulation estimates derived from the U.S. Bureau of the Census’Current Population Survey and adjusted to resident population controltotals. As a result, the rates are subject to the variability of thedenominator as well as the numerator. For tables 4, 22, and 23 thefollowing RSE formulas were used to determine an RSE of 23 percentor more for the purpose of showing the rate or an asterisk.
For crude, R, and age-specific death rates, Ri,
7. RSE(R) = 100Π(1D) + 0.67 (a +bP)
and for age-adjusted death rates, R ′,
8. RSE(R ′) = 100��{w 2
i R 2i [ ( 1
Di) + 0.67 (a+
bPi) ] }
R ′where
D = number of deathsP = population estimate used for computing the rate (see
table VI for population estimates used for computing ratesin table 4; see table VII for population estimates used forcomputing rates in table 22; and see table VIII for popu-lation estimates used for computing rates in table 23)
Di = number of deaths for the i th age groupPi = population estimate used for computing the i th age-
specific death rate (see table VI for population estimatesused for computing rates in table 4; see table VII forpopulation estimates used for computing rates in table 22;and see table VIII for population estimates used for com-puting rates in table 23)

National Vital Statistics Report, Vol. 49, No. 8, September 21, 2001 111
wi = age-specific U.S. standard population such that∑(wi) = 1.000000 (see table X for weights (wi) used forcomputing age-adjusted rates in table 4; see table XI forweights used for computing age-adjusted rates in table 22;and see table XII for weights used for computing age-adjusted rates in table 23)
w 2i = the square of the age-specific U.S. standard population
In table 4, for all origins, total Hispanic, total non-Hispanic,non-Hispanic white, and non-Hispanic black populations,
a = 0.000000 and b = 0and for Mexican, Puerto Rican, Cuban, and Other Hispanicpopulations,
a = –0.000238 and b = 7,486
In table 22, for all marital status groups combined for all races, white,and black populations,
a = 0.000000 and b = 0,
for each marital status group for all races and the white population,
a = –0.000019 and b = 5,211,
and for each marital status group for the black population,
a = –0.000213 and b = 7,486
In table 23, for all education groups combined,
a = 0.000000 and b = 0
and for each education group,
a = –0.000011 and b = 2,369
The a and b parameters are averages of the 1998 and 1999CPS standard error parameters (60,61).
To compute 95-percent confidence intervals and z-tests for thedeath rates (based on 100 or more deaths) shown in tables 4, 22, and23, the RSE formulas 7 and 8 may be substituted, as appropriate, forthe RSEs used in formulas 3 and 4.
Cause-of-death data—The calculation of measures of variabilityby cause of death take into account the variability of the comparabilityratio modified 1998 data for comparison with the 1999 data. Foradditional information on the statistical tests below, please refer to AGuide to State Implementation of ICD–10 for Mortality, Part II: ApplyingComparability Ratios (62) at the following Web site: http://www.cdc.gov/nchs/datawh/statab/unpubd/comp.htm.
Two issues arise in the analysis of mortality data across theboundary of two ICD revisions (ICD–9 and ICD–10):
1. data presentation and analysis2. statistical tests to ascertain whether the change in mortality
between the last year of the old revision (1998) and the first yearof the new revision (1999) is a statistically significant change
Table 8 presents death rates for the 15 leading causes of deathin 1999 according to ICD–10, compared with death rates for 1998 forthe most nearly comparable ICD–9 titles (tables I and II) multiplied bythe ICD–10:ICD–9 comparability ratios (comparability-modified deathrates). Also shown are the 1998 rates that are not comparability-modified for the same 15 leading causes.
The second issue is determining whether the change in deathrates between 1998 and 1999 was statistically significant, taking intoaccount comparability. This is accomplished in a manner similar tostatistical analysis of mortality trends within the same revision (8), but
incorporating into the comparisons and the statistical tests explicitregard for comparability. This section focuses on presenting methodsfor analyzing differences in mortality between revisions. The key dif-ference is that the latter analysis must take explicitly into accountcomparability ratios that measure the quantitative impact of the newrevisions on causes of death.
Formulas shown below address the general problem of evaluatingdifferences between two population-based death rates estimated forsuccessive years, between revisions of the ICD. Rates used throughoutthe section are specific for cause of death. Rates computed using datafrom an initial year (R1) are assumed to be based on ICD–9, while thosefor the following year (R2) are assumed to be based on ICD–10. Acomparability ratio (C) measures the level of agreement betweenclassification systems. The cause-specific comparability ratio will beapplied to R1 to adjust for the change in the way these deaths wereclassified for the later revision compared with the earlier revision. Inaddition to 1998 mortality data, this factor (C) should also be applicableto at least 1994, 1995, 1996, and 1997. The comparability ratio needsto be considered in statistical tests that compare the changes in ratesfrom one year to a subsequent one between revisions.
In applying the formulas, distinctions should be made for casesinvolving large (100 or more) and small (1–99) numbers of deaths. Allformulas in this section are for cases involving large numbers of deaths(100 or more). Formulas for constructing 95 percent confidence inter-vals for small numbers of deaths are shown in the publication men-tioned above (62).
The general formula for obtaining (estimated) RSE’s for a point-estimate, θ (like a comparability ratio), is the following:
9. RSE(θ∫) = 100S(θ∫)θ∫
where
S(θ) = standard error of Theta
The estimated RSE for an age-specific death rate or a crudedeath rate is given by the formula below:
10. RSE(R) = RSE(D) = 100Œ1D
where
R = the cause-specific death rate produced by dividing thenumber of deaths attributed to a given cause at a giventime by the population-at-risk for that same time period
D = the estimated number of deaths due to a given cause on agiven time
The following procedures for constructing approximate 95 per-cent confidence intervals are ordered depending on whether thedeath rate was computed based on the recently introduced ICD–10revision or on the previous (ICD–9) revision, respectively. The ratebased on the ICD–9 revision is adjusted by the application of acause-specific comparability ratio.
For an age-specific or crude death rate based on the ICD–10revision, the 95 percent confidence interval may be captured as follows:
11. Lower limit: R2 – (1.96 c R2 c
RSE(R2)
100 )12. Upper limit: R2 + (1.96 c R2 c
RSE(R2)
100 )

112 National Vital Statistics Report, Vol. 49, No. 8, September 21, 2001
For an age-specific or crude death rate based on the ICD–9revision, the 95 percent confidence interval may be captured asfollows:
13. Lower limit: C c R1 – (1.96 c C c R1 c
RSE(C c R1)
100 )14. Upper limit: C c R1 + (1.96 c C c R1 c
RSE(C c R1)
100 )where
R2 = death rate (per 100,000) computed for data year underICD–10
C = ICD–10:ICD–9 comparability ratio specific for the cause-of-death of interest
R1 = death rate (per 100,000) computed for data year underICD–9
Let us suppose that the respective ICD–9 and ICD–10 deathrates for a cause of death were 11.7 (R1) and 6.2 (R2) per 100,000population. The ICD–10:ICD–9 comparability ratio (C) obtained forthis cause was 1.0600. Its standard error, S(C), is 0.0096.
Assume that the numbers of deaths for this cause were 31,130for ICD–9 and 16,516 for ICD–10. By inserting the number of deaths(D) into formula 10, we obtain the RSEs for both yearly rates: 0.5668for the ICD–9 rate and 0.7781 for the ICD–10 rate [RSE(R1) andRSE(R2), respectively].
By inserting the comparability ratio and its standard error intoFormula 9, we obtain RSE(C) = (0.0096 / 1.0600) c 100 = 0.9057.
Since we wish to modify the ICD–9 rate (R1) to compensate forthe difference in classification systems, we must multiply this rate timesthe comparability ratio C c R1 = 12.40. To obtain the standard error ofthis modified ICD–9 rate, S(C c R1), we must refer to Formula 17. Thisformula requires knowing the RSEs for the ICD–9 rate and for thecomparability ratio. By substituting these values into the formula, wehave that RSE(C c R1) = 1.0684.
Lower 95-percent confidence interval limit for C c R1 = 12.40 –(1.96 c 0.1325) = 12.14.
Upper 95-percent confidence interval limit for C c R1 =12.40 + (1.96 c 0.1325) = 12.66.
Lower 95-percent confidence interval limit for R2 = 6.2 – (1.96c 0.0482) = 6.10.
Upper 95-percent confidence interval limit for R2 = 6.2 + (1.96c 0.0482) = 6.29.
For testing the difference between two rates (R1 and R2, eachbased on 100 or more deaths), the following z-test that considers theuse of a comparability ratio applied to ICD–9 death rates, may beused to define a significance test statistic:
15. z =C c R1 – R2
ŒC 2c R1
2 {(RSE(R1)100 )2
+ (RSE(C)100 )2
c [1+(RSE(R1)100 )2 ]} + R 2
2 (RSE(R2)100 )2
where
C = ICD–10:ICD–9 comparability ratio for the specificcause category
R1,R2 = cause-specific death rates based on ICD–9 andICD–10 years, respectively
RSE(R1) = relative standard error of the ICD–9 cause-specificdeath rate
RSE(R2) = relative standard error of the ICD–10 cause-specificdeath rate
RSE(C) = relative standard error of the ICD–10:ICD–9 com-parability ratio specific for the cause of death
If ?z ? ≥ 1.96, then the difference is statistically significant at the0.05 level and if z < 1.96, the difference is not significant. Forcomputing statistical tests when R1 and/or R2 are based on less than100 deaths, see A Guide to State Implementation of ICD–10 forMortality, Part II: Applying Comparability Ratios (62).
For tables showing an age-adjusted death rate, (R ′), the RSE informula 5 above would be substituted by this formula:
16. RSE(R ′2) = 100
η [wi2c Ri 2
2 ( 1Di 2
)]R ′2
where
R ′2 = age-adjusted death rate for a specific cause ofinterest, based on ICD–10
i = each age groupRi 2 = age-specific death rate for the ith age group (ICD–10
file)wi = i th age-specific U.S. Standard Population weight such
that ∑wi = 1.000000Di 2 = number of deaths for the i th age group (ICD–10 file)
attributed to the cause of interest
Ci ’s are treated as constants in this report (Ci = C). Assumingthat we have both an age-specific rate and comparability ratio, wemay proceed to compute the RSE for Ci Ri1 for each age group. Thisis the first of two steps necessary for obtaining the RSE of anage-adjusted rate based on ICD–9 data that has been modifiedthrough a comparability ratio, R′′1. For an age-specific comparabilityratio and death rate based on the ICD–9 revision, the RSE can becalculated as follows:
17. RSE(Ci c Ri1) = 100Œ(RSE(Ri1)100 )2
+ (RSE(Ci)100 )2 [1+(RSE(Ri1)
100 )2]where
Ci = age-specific comparability ratio for the cause ofinterest
Ri1 = age-specific death rate for the ith age group (ICD–9file)
Let R ′′1 = ∑wiCiRi1. The RSE for R ′′1 would incorporate all 11values (corresponding to each age group) computed through the
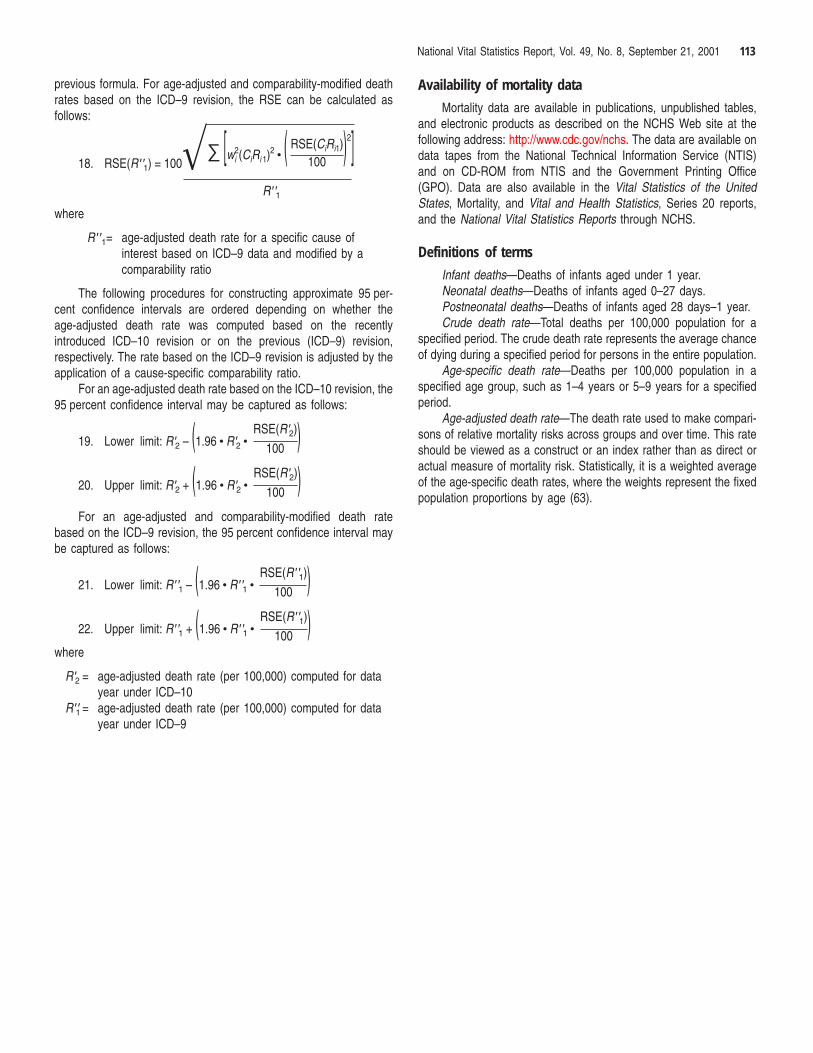
National Vital Statistics Report, Vol. 49, No. 8, September 21, 2001 113
previous formula. For age-adjusted and comparability-modified deathrates based on the ICD–9 revision, the RSE can be calculated asfollows:
18. RSE(R ′′1) = 100Œ∑ [wi
2(CiRi 1)2c ( RSE(CiRi1)
100)2]
R ′′1where
R ′′1= age-adjusted death rate for a specific cause ofinterest based on ICD–9 data and modified by acomparability ratio
The following procedures for constructing approximate 95 per-cent confidence intervals are ordered depending on whether theage-adjusted death rate was computed based on the recentlyintroduced ICD–10 revision or on the previous (ICD–9) revision,respectively. The rate based on the ICD–9 revision is adjusted by theapplication of a cause-specific comparability ratio.
For an age-adjusted death rate based on the ICD–10 revision, the95 percent confidence interval may be captured as follows:
19. Lower limit: R ′2 – (1.96 c R ′2 cRSE(R ′2)
100 )20. Upper limit: R ′2 + (1.96 c R ′2 c
RSE(R ′2)
100 )For an age-adjusted and comparability-modified death rate
based on the ICD–9 revision, the 95 percent confidence interval maybe captured as follows:
21. Lower limit: R ′′1 – (1.96 c R ′′1 cRSE(R ′′1)
100 )22. Upper limit: R ′′1 + (1.96 c R ′′1 c
RSE(R ′′1)
100 )where
R ′2 = age-adjusted death rate (per 100,000) computed for datayear under ICD–10
R ′′1 = age-adjusted death rate (per 100,000) computed for datayear under ICD–9
Availability of mortality data
Mortality data are available in publications, unpublished tables,and electronic products as described on the NCHS Web site at thefollowing address: http://www.cdc.gov/nchs. The data are available ondata tapes from the National Technical Information Service (NTIS)and on CD-ROM from NTIS and the Government Printing Office(GPO). Data are also available in the Vital Statistics of the UnitedStates, Mortality, and Vital and Health Statistics, Series 20 reports,and the National Vital Statistics Reports through NCHS.
Definitions of terms
Infant deaths—Deaths of infants aged under 1 year.Neonatal deaths—Deaths of infants aged 0–27 days.Postneonatal deaths—Deaths of infants aged 28 days–1 year.Crude death rate—Total deaths per 100,000 population for a
specified period. The crude death rate represents the average chanceof dying during a specified period for persons in the entire population.
Age-specific death rate—Deaths per 100,000 population in aspecified age group, such as 1–4 years or 5–9 years for a specifiedperiod.
Age-adjusted death rate—The death rate used to make compari-sons of relative mortality risks across groups and over time. This rateshould be viewed as a construct or an index rather than as direct oractual measure of mortality risk. Statistically, it is a weighted averageof the age-specific death rates, where the weights represent the fixedpopulation proportions by age (63).
References
1. Hoyert DL, Singh GK, Rosenberg HM. Sources of data on socioeco-nomic differential mortality in the United States. Journal of OfficialStatistics. 11(3): 233–60. 1995.
2. Kochanek KD, Smith BL, Anderson RN. Deaths: Preliminary data for1999. National vital statistics reports; vol 49 no 3. Hyattsville, Maryland:National Center for Health Statistics. 2001.
3. Anderson RN. Deaths: Leading causes for 1999. National vital statis-tics reports; vol 49 no. 11. Hyattsville, Maryland: National Center forHealth Statistics. 2001 (forthcoming).
4. de Turk PB. Deaths: Geographic variations in cause specific mortality,United States, 1997–99. National vital statistics reports; vol 49.Hyattsville, Maryland: National Center for Health Statistics. 2001(forthcoming).
5. National Center for Health Statistics. Technical appendix. Vital statisticsof the United States: Mortality, 1995. Available on the NCHS Web siteat: www.cdc.gov/nchs and to be included on the CD-ROM entitled,‘‘Vital Statistics of the United States, Mortality, 1995.’’
6. World Health Organization. International Statistical Classification ofDiseases and Related Health Problems, Tenth Revision. Geneva:World Health Organization. 1992.
7. Anderson RN, Rosenberg HM. Age standardization of death rates:Implementation of the year 2000 standard. National vital statisticsreports; vol 47 no 3. Hyattsville, Maryland: National Center for HealthStatistics. 1998.
8. World Health Organization. Manual of the International StatisticalClassification of Diseases, Injuries, and Causes of Death, based on therecommendations of the Ninth Revision Conference, 1975. Geneva:World Health Organization. 1977.
9. Anderson RN, Miniño AM, Hoyert DL, Rosenberg HM. Comparability ofcause of death between ICD–9 and ICD–10: Preliminary estimates.National vital statistics reports; vol 49 no 2. Hyattsville, Maryland:National Center for Health Statistics. 2001.
10. Murphy SL. Deaths: Final data for 1998. National vital statistics reports;vol 48 no 11. Hyattsville, Maryland: National Center for HealthStatistics. 2000.
11. Centers for Disease Control and Prevention. Update: Influenzaactivity—United States, 1998–99 season. Morbidity and mortalityweekly report; vol 48 no 9. Washington DC: Public Health Service.1999.
12. Centers for Disease Control and Prevention. Influenza activity—UnitedStates, 1999–2000 season. Morbidity and mortality weekly report; vol48 no 45. Washington, DC: Public Health Service. 2000.
13. Centers for Disease Control and Prevention. Update: Influenzaactivity—United States, 1999–2000 season. Morbidity and mortalityweekly report; vol 49 no 3. Washington, DC: Public Health Service.2000.
14. Rosenberg HM, Maurer JD, Sorlie PD, Johnson NJ, et al. Quality ofdeath rates by race and Hispanic origin: A summary of currentresearch, 1999. National Center for Health Statistics. Vital Health Stat2(128). 1999.
15. Kochanek KD, Maurer JD, Rosenberg HM. Causes of death contrib-uting to changes in life expectancy: United States, 1984–1989.National Center for Health Statistics. Vital Health Stat 20(23). 1994.
16. Maurer JD, Rosenberg HM, Keemer JB. Deaths of Hispanic origin, 15reporting States, 1979–81. National Center for Health Statistics. VitalHealth Stat 20(18). 1990.
17. Hoyert DL, Rosenberg HM, MacDorman MF. Effect of changes in deathcertificate format on cause-specific mortality trends, United States,1979–1992. Office for National Statistics. Studies on Medical andPopulation Subjects 64. 2000.
18. Hoyert DL, Kochanek KD, Murphy SL. Deaths: Final Data for 1997.National vital statistics reports; vol 47 no 19. Hyattsville, Maryland:National Center for Health Statistics. 1999.
19. Pamuk E, Makuc D, Heck K, Reuben C, Lochner K. Socioeconomicstatus and health chartbook. Health, United States, 1998. Hyattsville,Maryland: National Center for Health Statistics. 1998.
20. Mathews TJ, Curtin SC, MacDorman MF. Infant mortality statistics fromthe 1998 period linked birth/infant death data set. National vitalstatistics reports; vol 48 no 12. Hyattsville, Maryland: National Centerfor Health Statistics. 2000.
21. Tolson GC, Barnes JM, Gay GA, Kowaleski JL. The 1989 revision ofthe U.S. standard certificates and reports. National Center for HealthStatistics. Vital Health Stat 4(28). 1991.
22. National Center for Health Statistics. Technical appendix. Vital statisticsof the United States, 1989, vol II, mortality, part A. Washington: PublicHealth Service. 1993.
23. Klebba AJ, Scott JH. Estimates of selected comparability ratios basedon dual coding of 1976 death certificates by the Eighth and NinthRevisions of the International Classification of Diseases. Monthly vitalstatistics report; vol 28 no 11, supp. Hyattsville, Maryland: PublicHealth Service. 1980.
National Vital Statistics Report, Vol. 49, No. 8, September 21, 2001

24. Klebba AJ, Dolman AB. Comparability of mortality statistics for theSeventh and Eighth Revisions of the International Classification ofDiseases, United States. National Center for Health Statistics. VitalHealth Stat 2(66). 1975.
25. National Center for Health Statistics. Comparability of mortality statis-tics for the Sixth and Seventh Revisions, United States, 1958. VitalStatistics-Special reports; vol 51 no 4. Washington, DC: Public HealthService. 1965.
26. National Center for Health Statistics. Vital statistics, instructions forclassifying the underlying cause of death. NCHS instruction manual;part 2a. Hyattsville, Maryland: Public Health Service. Published annu-ally.
27. National Center for Health Statistics. Vital statistics, instructions forclassifying multiple causes of death. NCHS instruction manual; part 2b.Hyattsville, Maryland: Public Health Service. Published annually.
28. National Center for Health Statistics. Vital statistics, nonindexed terms,standard abbreviations, and State geographic codes used in mortalitydata classification. NCHS instruction manual; part 2e. Hyattsville,Maryland: Public Health Service. Published annually until 1999.
29. National Center for Health Statistics. Vital statistics, ICD–9 ACMEdecision tables for classifying underlying causes of death. NCHSinstruction manual; part 2c. Hyattsville, Maryland: Public Health Ser-vice. Published annually.
30. National Center for Health Statistics. Vital statistics, data entry instruc-tions for the mortality medical indexing, classification, and retrievalsystem (MICAR). NCHS instruction manual; part 2g. Hyattsville,Maryland: Public Health Service. Published annually.
31. National Center for Health Statistics. Vital statistics, dictionary of validterms for the mortality medical indexing, classification, and retrievalsystem (MICAR). NCHS instruction manual; part 2h. Hyattsville,Maryland: Public Health Service. Published annually.
32. Chamblee RF, Evans MC. TRANSAX, the NCHS system for producingmultiple cause-of-death statistics, 1968–78. National Center for HealthStatistics. Vital Health Stat 1(20). 1986.
33. Israel RA, Rosenberg HM, Curtin LR. Analytical potential for multiplecause-of-death data. Am J Epidemiol 124(2): 161–79. 1986.
34. National Center for Health Statistics. Public use data file documenta-tion: Multiple cause of death for ICD–9, 1998 data. Hyattsville,Maryland: Public Health Service. 2000.
35. National Center for Health Statistics. ICD–10 cause-of-death lists fortabulating mortality statistics, effective 1999. NCHS instruction manual:part 9. Hyattsville, Maryland: Public Health Service. 1999.
36. Sorlie PD, Rogot E, Johnson NJ. Validity of demographic characteris-tics on the death certificate. Epidemiology 3(2):181–4. 1992.
37. Poe GS, Powell-Griner E, McLaughlin JK, et al. Comparability of thedeath certificate and the 1986 national mortality followback survey.National Center for Health Statistics. Vital Health Stat 2(118). 1993.
38. Hogan H. The 1990 post-enumeration survey: Operations and results.J Am Stat Assoc 48(423):1047–60. 1993.
39. National Center for Health Statistics. Technical appendix. Vital statisticsof the United States, 1989, vol I, natality. Washington: Public HealthService. 1992.
40. Hoyert DL. Effect on mortality rates of the 1989 changes in tabulatingrace. National Center for Health Statistics. Vital Health Stat 20(25).1994.
41. Sirken MG. Comparison of two methods of constructing abridged lifetables by reference to a ‘‘standard’’ table. National Center for HealthStatistics. Vital Health Stat 2(4). 1966.
42. Anderson RN. Method for constructing complete annual U.S. lifetables. National Center for Health Statistics. Vital Health Stat 2(129).1999.
43. National Center for Health Statistics. U.S. decennial life tables for1989–91, vol 1 no 2, methodology of the national and State life tables.Hyattsville, Maryland. 1998.
44. Kestenbaum B. A description of the extreme aged population based onimproved Medicare enrollment data. Demography 29:565–80. 1992.
45. Arriaga EE. Changing trends in mortality decline during the lastdecades. In: Ruzicka L, Wunsch G, Kane P, eds. Differential mortality:Methodological issues and biosocial factors. Oxford: Clarendon Press.1989.
46. Sorlie PD, Johnson NJ. Validity of education information on the deathcertificate. Epidemiology 7(4): 437–9. 1996.
47. Kominski R, Adams A. Educational attainment in the United States,March 1993 and 1992. U.S. Bureau of the Census. Current Populationreports: series p20–476. Washington: U.S. Government Printing Office.1994.
48. Ventura SJ, Martin JA, Curtin SC, et al. Births: Final data for 1999.National vital statistics reports; vol 49 no 1. Hyattsville, Maryland:National Center for Health Statistics. 2001.
49. National Center for Health Statistics. Vital statistics, computer edits formortality data, effective 1999. NCHS instruction manual; part 11.Hyattsville, Maryland: Public Health Service. 1998.
50. National Center for Health Statistics. Vital statistics, ICD–10 cause-of-death querying, 1999. NCHS instruction manual; part 20. Hyattsville,Maryland: Public Health Service. 1999.
51. U.S. Bureau of the Census. Unpublished census file NESTV99.Consistent with populations published in: U.S. population estimates, byage, sex, race, and Hispanic origin: 1990–1999. Washington, DC.2000.
52. National Center for Health Statistics. Technical appendix. Vital statisticsof the United States, 1990, vol II, mortality, part A. Washington: PublicHealth Service. 1994.
53. U.S. Bureau of the Census. Population estimates for 1999 based onunpublished tabulations prepared by the Housing and HouseholdEconomic Statistics Division.
54. U.S. Bureau of the Census. Population estimates for the U.S. andStates by single year of age and sex: July 1, 1999. Internet releasedate: March 9, 2000. http://www.census.gov/population/estimates/state/stats/st-99–10.txt.
55. U.S. Bureau of the Census. Unpublished Census file PUERTO99.56. U.S. Bureau of the Census. Unpublished Census file USVI99.WK1.57. U.S. Bureau of the Census. Unpublished Census file GUAM99.WK1.58. U.S. Bureau of the Census. Unpublished Census file ASAMOA99.WK1.59. U.S. Bureau of the Census. Unpublished Census file CNMI99.WK1.60. U.S. Bureau of the Census. Money income in the United States: 1998.
Current population reports, consumer income. Series P60–206. Wash-ington: U.S. Government Printing Office. 1999.
61. U.S. Bureau of the Census. Money income in the United States: 1999.Current population reports, consumer income. Series P60–209. Wash-ington: U.S. Government Printing Office. 2000.
62. Minino AM. A guide to State implementation of ICD–10 for mortality,part II: Applying comparability ratios. Hyattsville, Maryland: NationalCenter for Health Statistics. 2000.
63. Feinleib M, Zarate AO, eds. Reconsidering age adjustment procedures:Workshop proceedings. National Center for Health Statistics. VitalHealth Stat 4(29). 1992.
National Vital Statistics Report, Vol. 49, No. 8, September 21, 2001