1q 2016 emea isg outsourcing index®
TRANSCRIPT

© 2016
Information Services
Group, Inc.
All Rights Reserved
isg-one.com
*Contracts with ACV ≥ €4M from the ISG Contracts Knowledgebase®
1
Hosted by:
John King
Bank of America Merrill Lynch
18 April 2016
The ISG Outsourcing Index®
First Quarter 2016
EMEA Market Data and Insights
© 2016
Information Services
Group, Inc.
All Rights Reserved
isg-one.com
*Contracts with ACV ≥ €4M from the ISG Contracts Knowledgebase®
2
Covering the state of the outsourcing industry for EMEA commercial contracts.*
Welcome to the 54th Quarterly ISG Outsourcing Index® Review
Bernd SchaeferPartner
John KeppelPartner & President
*Contracts with ACV ≥ €5M from the ISG Contracts Knowledgebase®

© 2016
Information Services
Group, Inc.
All Rights Reserved
isg-one.com
*Contracts with ACV ≥ €4M from the ISG Contracts Knowledgebase®
3
At a GlanceGLOBAL MARKET ACV UP 20% Y/Y
WITH SMALLER AWARDS DRIVING MARKET GROWTH
NUMBER OF RESTRUCTURING AWARDS SETS QUARTERLY RECORD,
WHILE RESTRUCTURING ACV SURGES ALMOST 50% Y/Y
AMERICAS UP 30% ON BEST QUARTERLY PERFORMANCE IN FOUR YEARS
EMEA UP 19% Y/Y WITH STRONG SHOWING IN THE RESTRUCTURING MARKET
ASIA PACIFIC ACV AND NUMBER OF AWARDS DOWN Y/Y;
EXTENDED WEAKNESS ACROSS MANY GEOGRAPHIC MARKETS
Scorecard 1Q16 1Q Y/Y 1Q Q/Q 1Q16 1Q Y/Y 1Q Q/Q
ACV (€B)* Change Change Counts Change Change
Global Market Totals € 4.9 20% -12% 404 32% 13%
Mega-relationships € 0.9 -3% -49% 5 -29% -38%
By Type New Scope € 2.6 4% 0% 231 11% 3%
Restructurings € 2.2 48% -23% 173 78% 31%
By Scope ITO € 3.4 24% -21% 301 51% 20%
BPO € 1.5 12% 17% 103 -4% -2%
By Region Americas € 2.2 30% 6% 217 49% 47%
EMEA € 2.2 19% -26% 160 28% -6%
Asia Pacific € 0.4 -13% -4% 27 -23% -29%

© 2016
Information Services
Group, Inc.
All Rights Reserved
isg-one.com
*Contracts with ACV ≥ €4M from the ISG Contracts Knowledgebase®
4
Global Market ACV is up 20% Y/Y, and smaller awards drive market growth;
ACV approaches €5B level, while number of awards exceeds the 400 mark.
Broader Market Quarterly ACV (€B)*
Broader Market Quarterly Contract Counts
Global Market Contract Award Trends
€ 4.9 € 5.5
€ 4.4 € 4.9
€ 4.1
€ 5.3 € 4.6
€ 5.4 € 5.2
€ 4.0
€ 5.1
€ 3.2
€ 4.9 € 4.6 € 4.8 € 5.2 € 5.9 € 6.1
€ 5.5
€ 3.8
€ 19.7 € 19.4 € 17.5
€ 19.6 € 21.2
1Q164Q3Q2Q1Q154Q3Q2Q1Q144Q3Q2Q1Q134Q3Q2Q1Q124Q3Q2Q11
Quarterly ACV TTM ACV Totals
404 356 336
446
306
387
295
376 358 325
378
233
323 313 263
313 370
332 313 275
15421364129412121290
1Q164Q3Q2Q1Q154Q3Q2Q1Q144Q3Q2Q1Q134Q3Q2Q1Q124Q3Q2Q11
Quarterly Counts TTM Count Totals
© 2016
Information Services
Group, Inc.
All Rights Reserved
isg-one.com
*Contracts with ACV ≥ €4M from the ISG Contracts Knowledgebase®
5
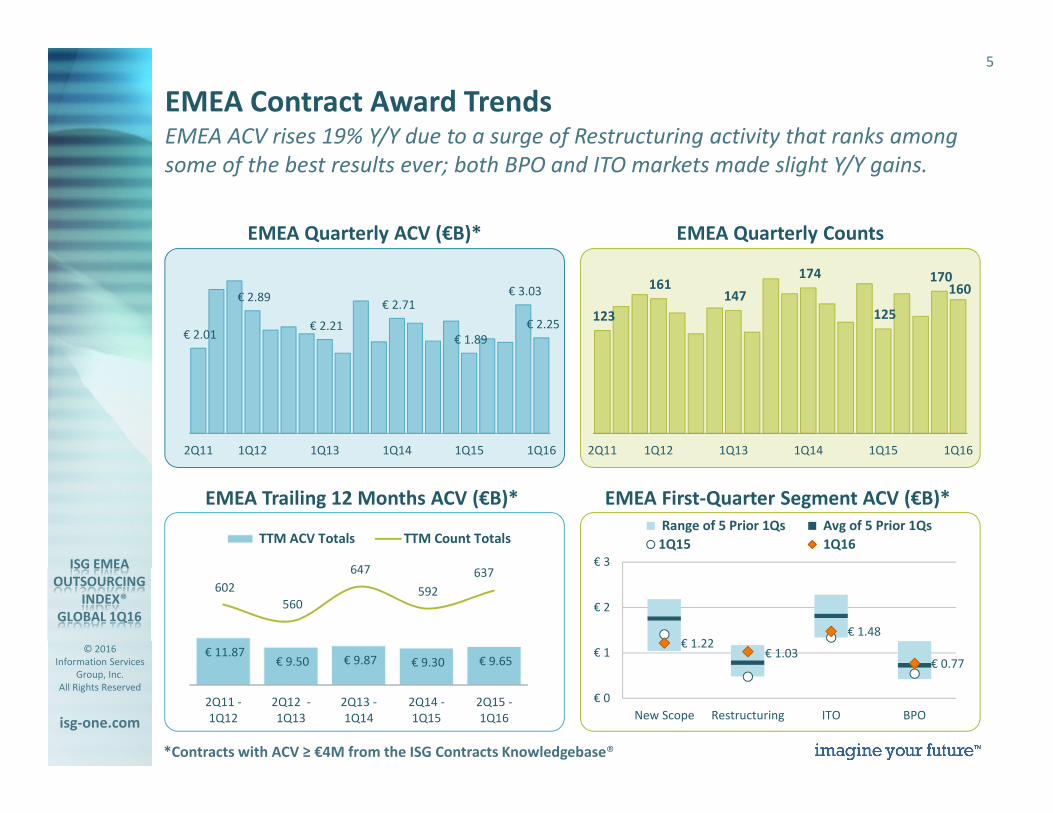
EMEA ACV rises 19% Y/Y due to a surge of Restructuring activity that ranks among
some of the best results ever; both BPO and ITO markets made slight Y/Y gains.
EMEA Quarterly Counts
EMEA Contract Award Trends
EMEA Quarterly ACV (€B)*
EMEA First-Quarter Segment ACV (€B)* EMEA Trailing 12 Months ACV (€B)*
€ 1.22 € 1.03
€ 1.48
€ 0.77
€ 0
€ 1
€ 2
€ 3
New Scope Restructuring ITO BPO
Range of 5 Prior 1Qs Avg of 5 Prior 1Qs
1Q15 1Q16
€ 2.25
€ 3.03
€ 1.89
€ 2.71
€ 2.21
€ 2.89
€ 2.01
1Q161Q151Q141Q131Q122Q11
160 170
125
174
147 161
123
1Q161Q151Q141Q131Q122Q11
€ 9.65 € 9.30 € 9.87 € 9.50 € 11.87
637
592
647
560
602
2Q15 -
1Q16
2Q14 -
1Q15
2Q13 -
1Q14
2Q12 -
1Q13
2Q11 -
1Q12
TTM ACV Totals TTM Count Totals

© 2016
Information Services
Group, Inc.
All Rights Reserved
isg-one.com
*Contracts with ACV ≥ €4M from the ISG Contracts Knowledgebase®
6
U.K. and France inch up Y/Y, while Nordics and Southern Europe make larger gains.
DACH market ACV down Y/Y though number of DACH awards increases over 30% Y/Y.
EMEA Sub-Regions First-Quarter ACV (€B)*
EMEA Industry First-Quarter ACV (€B)*
EMEA Contract Award Trends Detail
€ 0.89
€ 0.28
€ 0.55
€ 0.09 € 0.12 € 0.10 € 0.22
€ 0.01 € 0.0
€ 0.2
€ 0.4
€ 0.6
€ 0.8
€ 1.0
€ 1.2
€ 1.4
U.K. & Ireland DACH Nordics Benelux France Africa &
Middle East
Southern
Europe
E. Europe &
Russia
Range of 5 Prior 1Qs Avg of 5 Prior 1Qs 1Q15 1Q16
€ 0.67
€ 0.50
€ 0.26 € 0.25 € 0.23
€ 0.05 € 0.10 € 0.12 € 0.08 € 0.0
€ 0.2
€ 0.4
€ 0.6
€ 0.8
€ 1.0
€ 1.2
Financial
Services
Manufacturing Telecom &
Media
Travel,
Transport &
Leisure
Energy Business
Services
Consumer
Packaged
Goods
Retail Healthcare &
Pharma
Range of 5 Prior 1Qs Avg of 5 Prior 1Qs 1Q15 1Q16
© 2016
Information Services
Group, Inc.
All Rights Reserved
isg-one.com
*Contracts with ACV ≥ €4M from the ISG Contracts Knowledgebase®
7
Firstsource Solutions*
FleetCor*
GFI Informatique*
ISON Group
Luxoft
Mindtree
NGA HR*
Transcom
VirtusaPolaris
WNS
Co. Revenues < $2 B
Capita
Ceva Logistics
CGI
G4S*
HCL
Infosys
Jones Lang LaSalle*
MITIE
Serco
Wipro
Co. Revenues $2 -10 B
Accenture
Atos
BT
Capgemini
Cognizant
HPE
IBM
ISS Global*
TCS
T-Systems
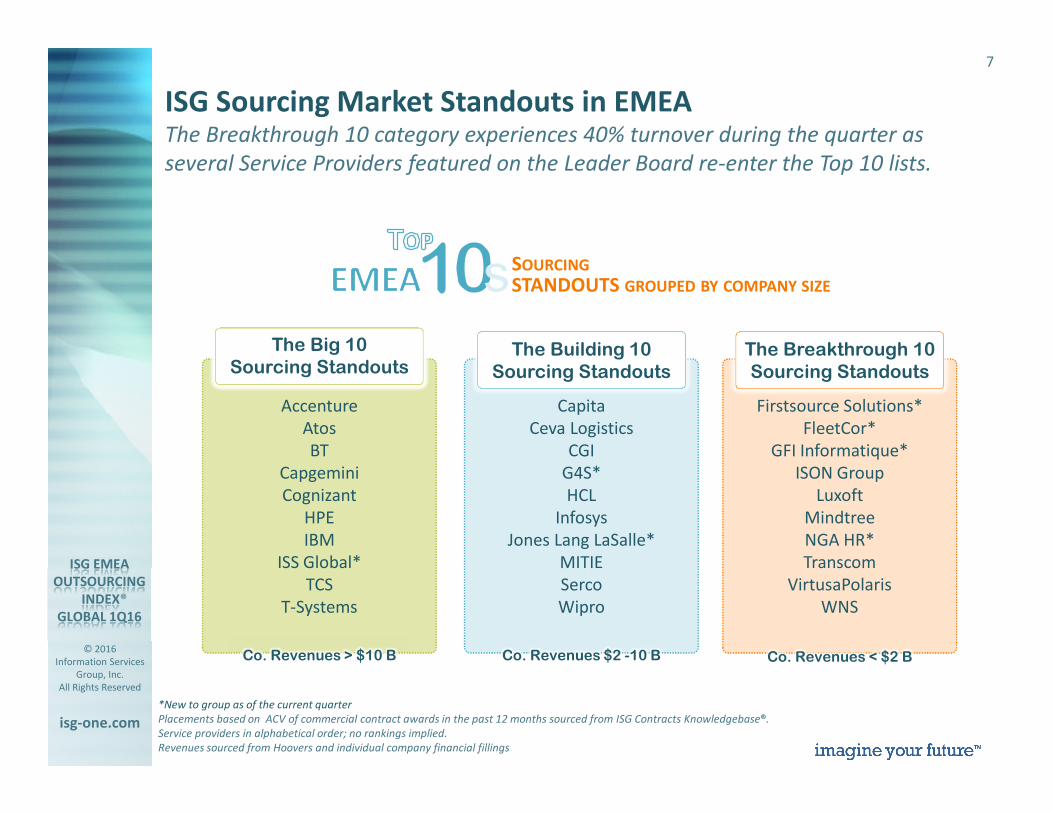
ISG Sourcing Market Standouts in EMEAThe Breakthrough 10 category experiences 40% turnover during the quarter as
several Service Providers featured on the Leader Board re-enter the Top 10 lists.
*New to group as of the current quarter
Placements based on ACV of commercial contract awards in the past 12 months sourced from ISG Contracts Knowledgebase®.
Service providers in alphabetical order; no rankings implied.
Revenues sourced from Hoovers and individual company financial fillings
Co. Revenues > $10 B
SOURCING
STANDOUTS GROUPED BY COMPANY SIZE
The Building 10Sourcing Standouts
The Breakthrough 10Sourcing Standouts
The Big 10Sourcing Standouts
© 2016
Information Services
Group, Inc.
All Rights Reserved
isg-one.com
*Contracts with ACV ≥ €4M from the ISG Contracts Knowledgebase®
8
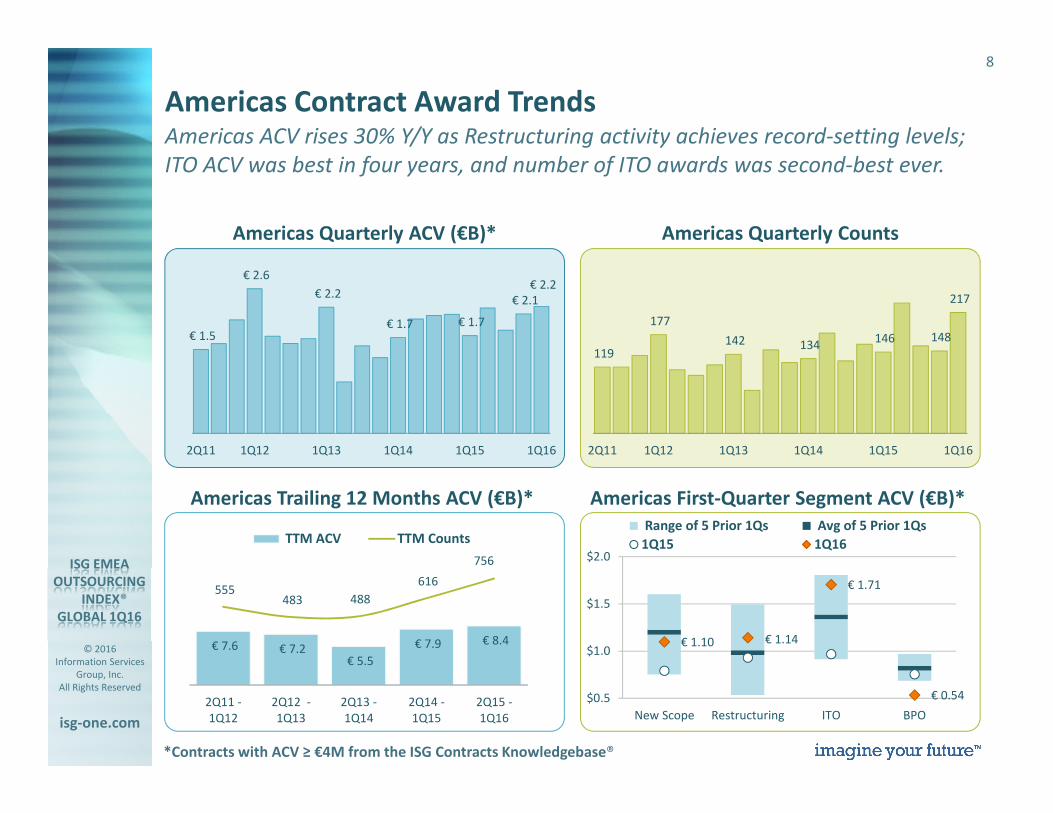
Americas Quarterly Counts
Americas Contract Award Trends
Americas Quarterly ACV (€B)*
Americas First-Quarter Segment ACV (€B)* Americas Trailing 12 Months ACV (€B)*
Americas ACV rises 30% Y/Y as Restructuring activity achieves record-setting levels;
ITO ACV was best in four years, and number of ITO awards was second-best ever.
217
148 146 134 142
177
119
1Q161Q151Q141Q131Q122Q11
€ 2.2
€ 2.1
€ 1.7 € 1.7
€ 2.2
€ 2.6
€ 1.5
1Q161Q151Q141Q131Q122Q11
€ 8.4 € 7.9
€ 5.5 € 7.2 € 7.6
756
616
488 483 555
2Q15 -
1Q16
2Q14 -
1Q15
2Q13 -
1Q14
2Q12 -
1Q13
2Q11 -
1Q12
TTM ACV TTM Counts
€ 1.10 € 1.14
€ 1.71
€ 0.54 $0.5
$1.0
$1.5
$2.0
New Scope Restructuring ITO BPO
Range of 5 Prior 1Qs Avg of 5 Prior 1Qs
1Q15 1Q16
© 2016
Information Services
Group, Inc.
All Rights Reserved
isg-one.com
*Contracts with ACV ≥ €4M from the ISG Contracts Knowledgebase®
9
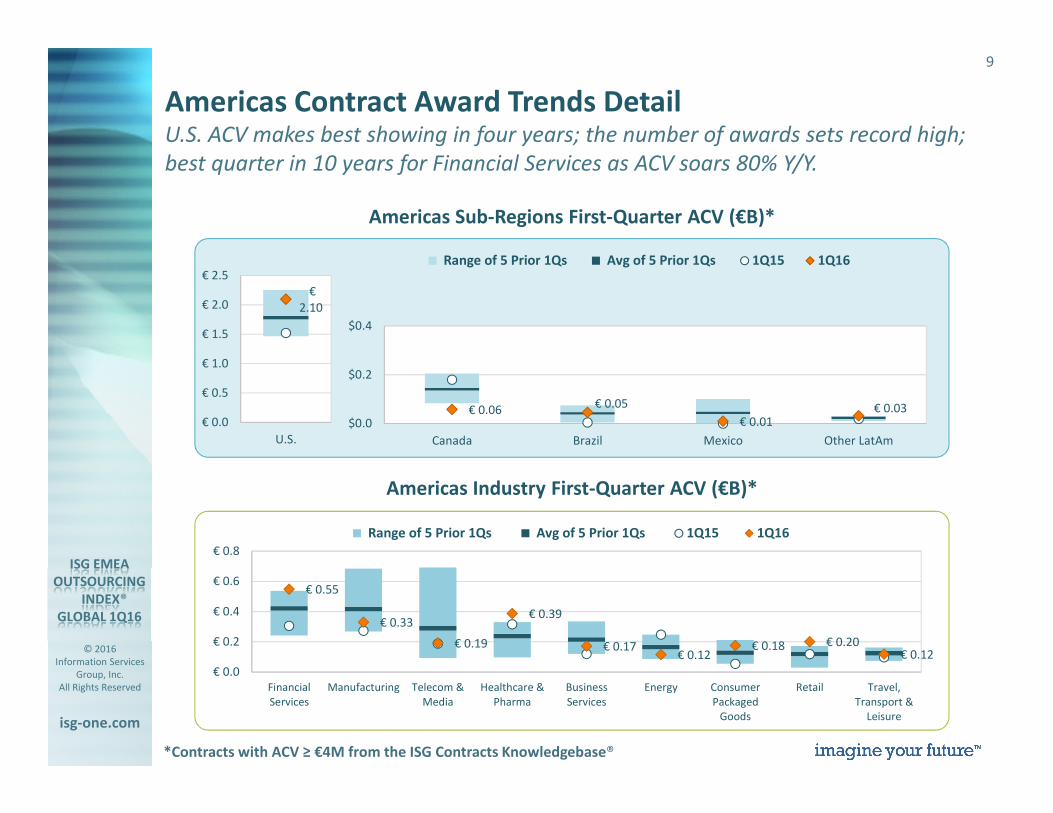
U.S. ACV makes best showing in four years; the number of awards sets record high;
best quarter in 10 years for Financial Services as ACV soars 80% Y/Y.
Americas Sub-Regions First-Quarter ACV (€B)*
Americas Industry First-Quarter ACV (€B)*
Americas Contract Award Trends Detail
€ 0.55
€ 0.33
€ 0.19
€ 0.39
€ 0.17 € 0.12
€ 0.18 € 0.20 € 0.12
€ 0.0
€ 0.2
€ 0.4
€ 0.6
€ 0.8
Financial
Services
Manufacturing Telecom &
Media
Healthcare &
Pharma
Business
Services
Energy Consumer
Packaged
Goods
Retail Travel,
Transport &
Leisure
Range of 5 Prior 1Qs Avg of 5 Prior 1Qs 1Q15 1Q16
€ 0.06 € 0.05
€ 0.01 € 0.03
$0.0
$0.2
$0.4
Canada Brazil Mexico Other LatAm
Range of 5 Prior 1Qs Avg of 5 Prior 1Qs 1Q15 1Q16
€
2.10
€ 0.0
€ 0.5
€ 1.0
€ 1.5
€ 2.0
€ 2.5
U.S.

© 2016
Information Services
Group, Inc.
All Rights Reserved
isg-one.com
*Contracts with ACV ≥ €4M from the ISG Contracts Knowledgebase®
10
Asia Pacific ACV slips 13% from a modest Q1 compare with number of contracts also
falling; both New Scope and Restructuring ACV lag Y/Y.
Asia Pacific Quarterly Counts
Asia Pacific Contract Award Trends
Asia Pacific Quarterly ACV (€B)*
Asia Pacific First-Quarter Segment ACV (€B)*Asia Pacific Trailing 12 Months ACV (€B)*
€ 1.69 € 2.20 € 2.15
€ 2.85
€ 1.67
149 156 159 169
133
2Q15 -
1Q16
2Q14 -
1Q15
2Q13 -
1Q14
2Q12 -
1Q13
2Q11 -
1Q12
TTM ACV TTM Counts
€ 0.33
€ 0.06
€ 0.19 € 0.19
€ 0.0
€ 0.2
€ 0.4
€ 0.6
€ 0.8
New Scope Restructuring ITO BPO
Range of 5 Prior 1Qs Avg of 5 Prior 1Qs
1Q15 1Q16
€ 0.38 € 0.44
€ 0.84
€ 0.45 € 0.42 € 0.30
1Q161Q151Q141Q131Q122Q11
27
38 35
50
34 32 33
1Q161Q151Q141Q131Q122Q11

© 2016
Information Services
Group, Inc.
All Rights Reserved
isg-one.com
*Contracts with ACV ≥ €4M from the ISG Contracts Knowledgebase®
11
One large mega award helps support ANZ and Manufacturing short-term growth;
remaining geographic and vertical markets in Asia Pacific struggle to gain traction.
Asia Pacific Sub-Regions First-Quarter ACV (€B)*
Asia Pacific Industry First-Quarter ACV (€B)*
Asia Pacific Contract Award Trends Detail
€ 0.22
€ 0.02
€ 0.07
€ -
€ 0.06
€ -€ 0.00
€ 0.05
€ 0.10
€ 0.15
€ 0.20
€ 0.25
€ 0.30
ANZ India and South
Asia
Japan Greater China Southeast Asia South Korea
Range of 5 Prior 1Qs Avg of 5 Prior 1Qs 1Q15 1Q16
€ 0.05 € 0.04 € 0.01
€ 0.21
€ 0.04 € -
€ 0.03 € 0.01 € -€ 0.0
€ 0.1
€ 0.2
€ 0.3
Financial
Services
Telecom &
Media
Travel,
Transport &
Leisure
Manufacturing Energy Consumer
Packaged
Goods
Business
Services
Retail Healthcare &
Pharma
Range of 5 Prior 1Qs Avg of 5 Prior 1Qs 1Q15 1Q16

© 2016
Information Services
Group, Inc.
All Rights Reserved
isg-one.com
*Contracts with ACV ≥ €4M from the ISG Contracts Knowledgebase®
12
Special Topic First Quarter 2016
PUBLIC SECTOR OUTSOURCING
John Keppel
Partner & President
© 2016
Information Services
Group, Inc.
All Rights Reserved
isg-one.com
*Contracts with ACV ≥ €4M from the ISG Contracts Knowledgebase®
13
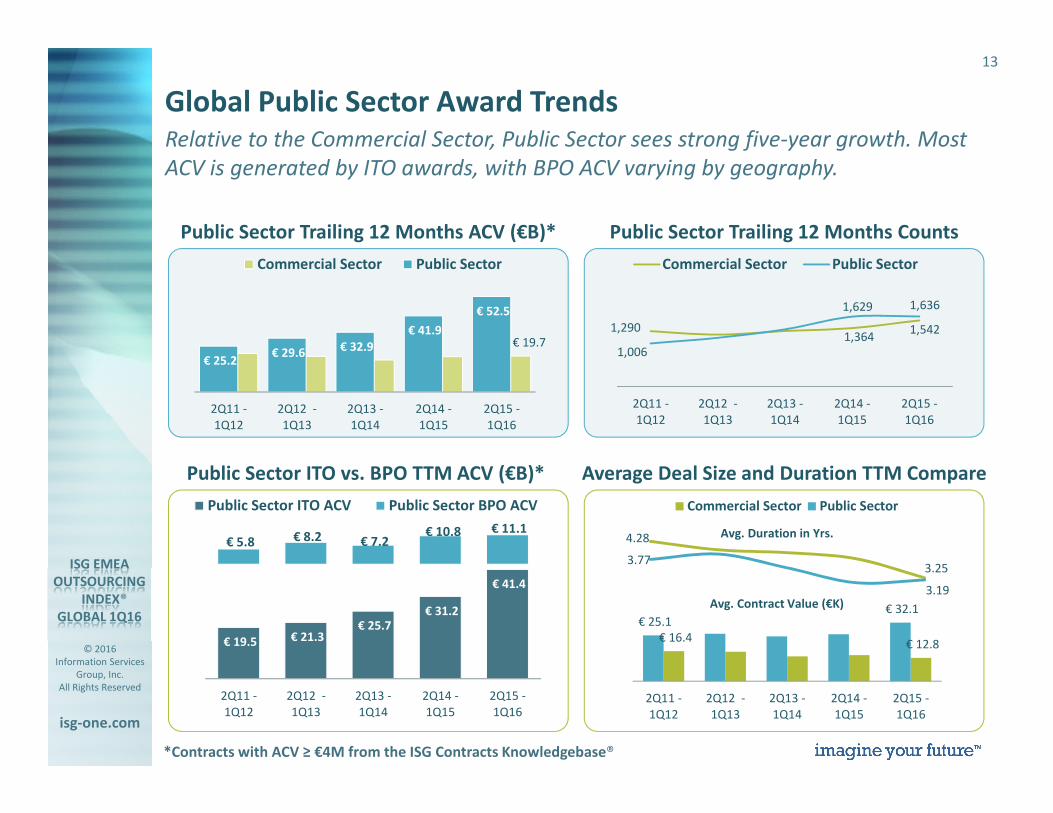
Relative to the Commercial Sector, Public Sector sees strong five-year growth. Most
ACV is generated by ITO awards, with BPO ACV varying by geography.
Public Sector Trailing 12 Months Counts
Global Public Sector Award Trends
1,542 1,364
1,290
1,636 1,629
1,006
2Q15 -
1Q16
2Q14 -
1Q15
2Q13 -
1Q14
2Q12 -
1Q13
2Q11 -
1Q12
Commercial Sector Public Sector
Public Sector Trailing 12 Months ACV (€B)*
Public Sector ITO vs. BPO TTM ACV (€B)*
3.25
4.28
3.19
3.77
Average Deal Size and Duration TTM Compare
Avg. Duration in Yrs.
Avg. Contract Value (€K)
€ 19.7
€ 52.5
€ 41.9
€ 32.9 € 29.6
€ 25.2
2Q15 -
1Q16
2Q14 -
1Q15
2Q13 -
1Q14
2Q12 -
1Q13
2Q11 -
1Q12
Commercial Sector Public Sector
€ 41.4
€ 31.2 € 25.7
€ 21.3 € 19.5
€ 11.1 € 10.8 € 7.2 € 8.2 € 5.8
2Q15 -
1Q16
2Q14 -
1Q15
2Q13 -
1Q14
2Q12 -
1Q13
2Q11 -
1Q12
Public Sector ITO ACV Public Sector BPO ACV
€ 12.8 € 16.4
€ 32.1 € 25.1
2Q15 -
1Q16
2Q14 -
1Q15
2Q13 -
1Q14
2Q12 -
1Q13
2Q11 -
1Q12
Commercial Sector Public Sector

© 2016
Information Services
Group, Inc.
All Rights Reserved
isg-one.com
*Contracts with ACV ≥ €4M from the ISG Contracts Knowledgebase®
14
Global Public Sector Award TrendsNorth America, led by federal government IT spending, accounts for a large share of
sourcing. Average deal values increase, whereas durations shorten.
Share of Public Sector ACV for Trailing 12 Months
Top Public Sector Providers
in Recent 12 Months
58%
17%5% 3%
17%
U.S. &
Canada
U.K. Continental
Europe
ANZ Other
*New to List for 2016
Service providers in alphabetical order; no rankings implied.
Placements based on counts of public sector contract awards sourced from ISG Contracts Knowledgebase ®.
U.S. & Canada ANZ
U.K. Continental Europe
Booz Allen Hamilton*
CACI*
HPE*
Lockheed Martin
Northrop Grumman
Raytheon
Science Applications
BT
Capgemini*
Capita
Carillion
CGI
Fujitsu*
G4S*
HPE
Accenture
Atea
Atos
BT*
Capgemini
HPE
Indra Sistemas
Accenture
Boeing
Harris Corp.
HPE*
IBM
Raytheon*
SingTel Optus*
Telstra*Public Sector Regional ITO vs. BPO % TTM
79%
31%
88%76%
21%
69%
12%24%
U.S. & Canada U.K. Continental
Europe
ANZ
ITO ACV BPO ACV

© 2016
Information Services
Group, Inc.
All Rights Reserved
isg-one.com
*Contracts with ACV ≥ €4M from the ISG Contracts Knowledgebase®
15
€ 31.4
€ 24.0
€ 15.4
€ 5.8 € 3.0
€ 4.7
€ 0.9 € 0.9 € 1.2
€ 0.3 € 0.7 € 0.6
€ 13.0
€ 6.1€ 4.1
2Q15 - 1Q162Q14 - 1Q152Q13 - 1Q14
Local
Government
Public
Healthcare
Other Federal
Government
Department of
Defense
U.S. Public Sector Contract Award DetailsDepartment of Defense (DoD) ITO dominates the U.S. Public Sector sourcing;
Health and Human Services (HHS) and Homeland Security (DHS) remain active.
% of DOD
Consortium
Contracts up
17 percentage pts
in Recent 12 Months
Local GovernmentCapgemini
Dell
Harris
HPE
Verizon
Public HealthcareAtos
Booz Allen Hamilton
HPE
ICF International
Kelly Services
Other Federal
GovernmentAccenture
CSC
HPE
Raytheon
Science Applications
DoD Single ProviderGeneral Dynamics
Lockheed Martin
Northrop Grumman
Science Applications
Raytheon
DoD Consortium
Participation**
BAE Systems
Booz Allen
General Dynamics
Leidos
Lockheed Martin
U.S. Activity Details by Sub-Sector
U.S. Public Sector Activity for Last 3 TTMs Top U.S. Public Sector Providers for the
Most Recent 12 Months*
*Service providers in alphabetical order; no rankings implied. Placements based on counts of contract awards in the ISG Contracts Knowledgebase ®.
**Providers who had the highest participation rates in consortiums who were awarded DOD contracts.
€ 38.4 € 28.6
€ 21.8
1,041 1,059
723
2Q15 - 1Q162Q14 - 1Q152Q13 - 1Q14
ACV €B Counts
© 2016
Information Services
Group, Inc.
All Rights Reserved
isg-one.com
*Contracts with ACV ≥ €4M from the ISG Contracts Knowledgebase®
16
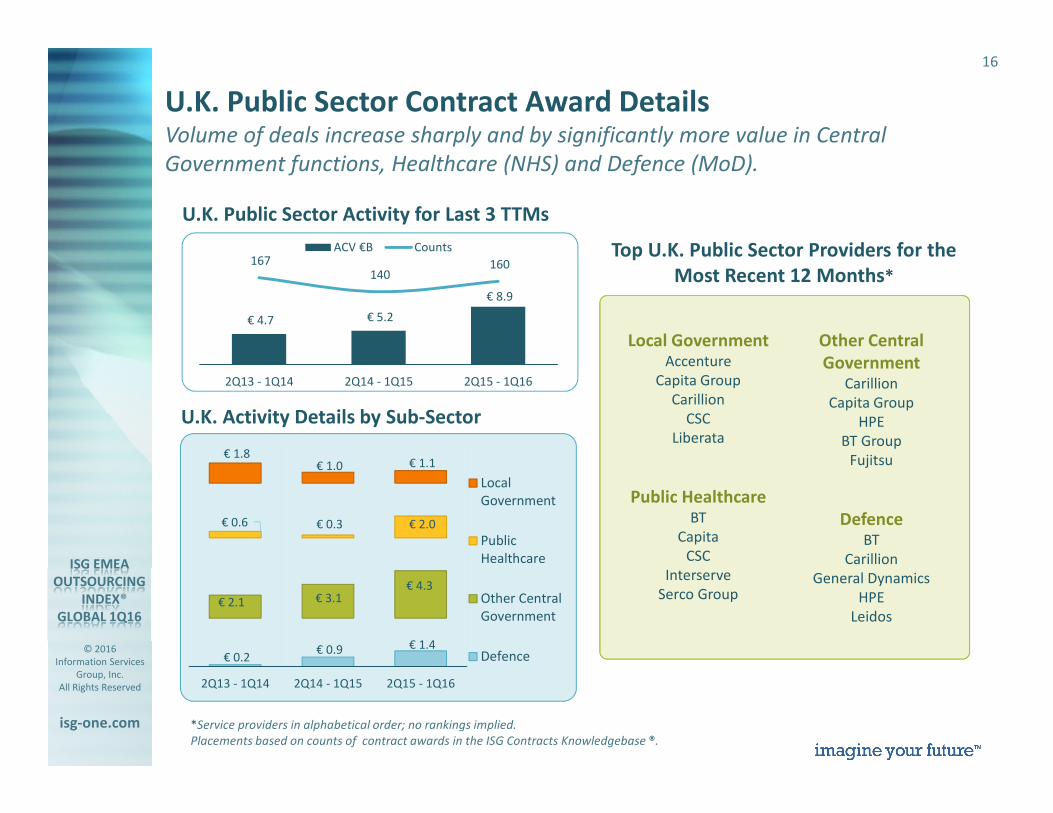
U.K. Public Sector Contract Award DetailsVolume of deals increase sharply and by significantly more value in Central
Government functions, Healthcare (NHS) and Defence (MoD).
Local GovernmentAccenture
Capita Group
Carillion
CSC
Liberata
Public HealthcareBT
Capita
CSC
Interserve
Serco Group
Other Central
GovernmentCarillion
Capita Group
HPE
BT Group
Fujitsu
DefenceBT
Carillion
General Dynamics
HPE
Leidos
U.K. Activity Details by Sub-Sector
U.K. Public Sector Activity for Last 3 TTMs
Top U.K. Public Sector Providers for the
Most Recent 12 Months*
*Service providers in alphabetical order; no rankings implied.
Placements based on counts of contract awards in the ISG Contracts Knowledgebase ®.
€ 1.4 € 0.9 € 0.2
€ 4.3 € 3.1 € 2.1
€ 2.0 € 0.3 € 0.6
€ 1.1 € 1.0 € 1.8
2Q15 - 1Q162Q14 - 1Q152Q13 - 1Q14
Local
Government
Public
Healthcare
Other Central
Government
Defence
€ 8.9
€ 5.2 € 4.7
160 140
167
2Q15 - 1Q162Q14 - 1Q152Q13 - 1Q14
ACV €B Counts
© 2016
Information Services
Group, Inc.
All Rights Reserved
isg-one.com
*Contracts with ACV ≥ €4M from the ISG Contracts Knowledgebase®
17
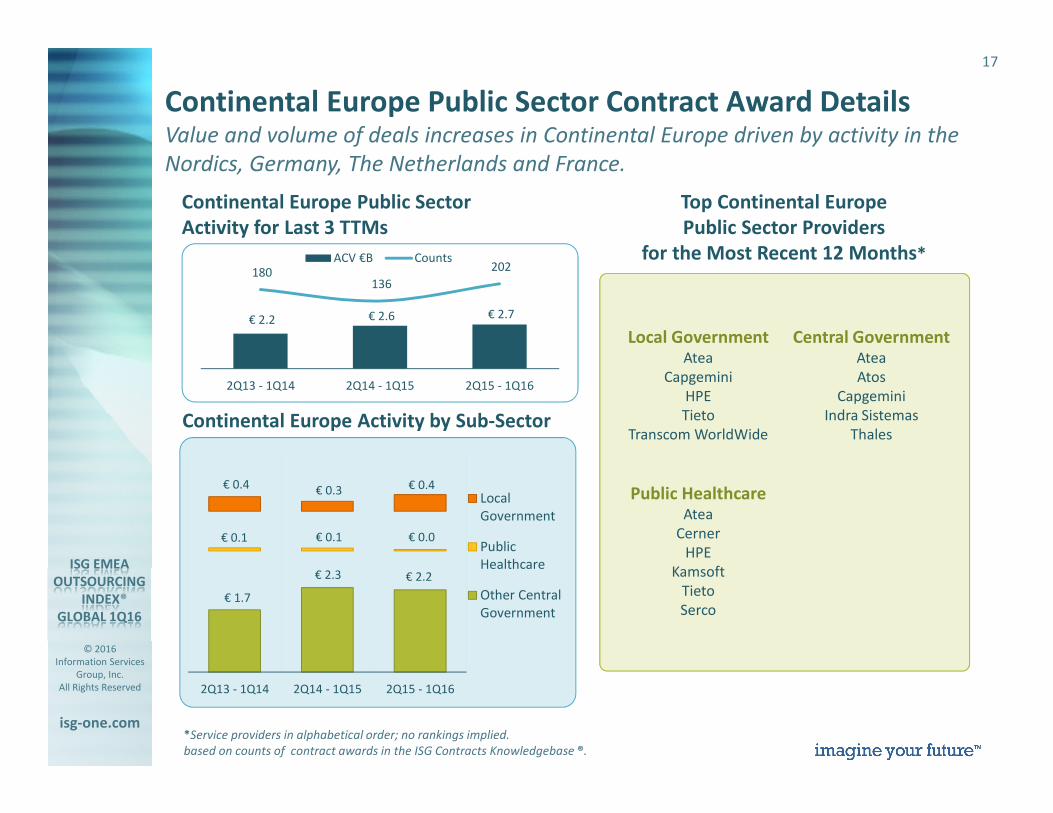
Continental Europe Public Sector Contract Award DetailsValue and volume of deals increases in Continental Europe driven by activity in the
Nordics, Germany, The Netherlands and France.
Local GovernmentAtea
Capgemini
HPE
Tieto
Transcom WorldWide
Public HealthcareAtea
Cerner
HPE
Kamsoft
Tieto
Serco
Central GovernmentAtea
Atos
Capgemini
Indra Sistemas
ThalesContinental Europe Activity by Sub-Sector
Continental Europe Public Sector
Activity for Last 3 TTMs
Top Continental Europe
Public Sector Providers
for the Most Recent 12 Months*
*Service providers in alphabetical order; no rankings implied.
based on counts of contract awards in the ISG Contracts Knowledgebase ®.
€ 2.2 € 2.3
€ 1.7
€ 0.0 € 0.1 € 0.1
€ 0.4 € 0.3 € 0.4
2Q15 - 1Q162Q14 - 1Q152Q13 - 1Q14
Local
Government
Public
Healthcare
Other Central
Government
€ 2.7 € 2.6 € 2.2
202
136 180
2Q15 - 1Q162Q14 - 1Q152Q13 - 1Q14
ACV €B Counts
© 2016
Information Services
Group, Inc.
All Rights Reserved
isg-one.com
*Contracts with ACV ≥ €4M from the ISG Contracts Knowledgebase®
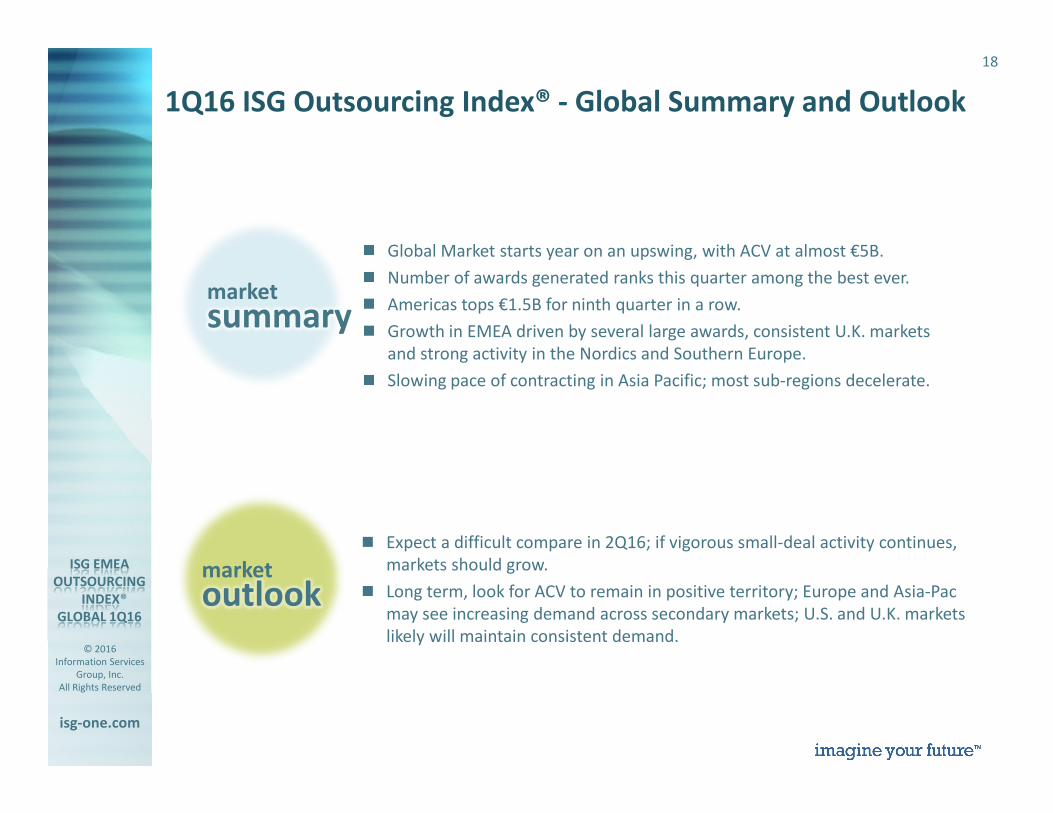
18
� Global Market starts year on an upswing, with ACV at almost €5B.
� Number of awards generated ranks this quarter among the best ever.
� Americas tops €1.5B for ninth quarter in a row.
� Growth in EMEA driven by several large awards, consistent U.K. markets
and strong activity in the Nordics and Southern Europe.
� Slowing pace of contracting in Asia Pacific; most sub-regions decelerate.
� Expect a difficult compare in 2Q16; if vigorous small-deal activity continues,
markets should grow.
� Long term, look for ACV to remain in positive territory; Europe and Asia-Pac
may see increasing demand across secondary markets; U.S. and U.K. markets
likely will maintain consistent demand.
1Q16 ISG Outsourcing Index® - Global Summary and Outlook
summarymarket
outlookmarket
© 2016
Information Services
Group, Inc.
All Rights Reserved
isg-one.com
*Contracts with ACV ≥ €4M from the ISG Contracts Knowledgebase®
19
Please contact us with your questions and comments.
Learn More
Paul ReynoldsPartner & Chief Research Officer,
ISG Momentum
+1 508 625 2194
www.isg-one.comJohn Keppel
Partner and President
+44 (0)7879 432 212
Denise Colgan
EMEA and AP Media Contact
+44 1737 371523
Bill McNeeCEO Saugatuck Technologies,
an ISG Business
+1 203 820 8987
Laura Mountain
Cohn & Wolfe for ISG
+44 (0) 20 7331 5372

© 2016
Information Services
Group, Inc.
All Rights Reserved
isg-one.com
*Contracts with ACV ≥ €4M from the ISG Contracts Knowledgebase®
20
First Quarter 2016
APPENDIX: SCORE CARD FOR TCV

© 2016
Information Services
Group, Inc.
All Rights Reserved
isg-one.com
*Contracts with ACV ≥ €4M from the ISG Contracts Knowledgebase®
21
The ISG Outsourcing Index has moved to ACV as the primary measure of the
Broader Market. We will continue to provide a high-level TCV view of the market via
a Scorecard analysis.
First Quarter 2016 TCV Scorecard
*Contracts with TCV ≥ €25M from the ISG Contracts Knowledgebase®
Scorecard 1Q16 1Q Y/Y 1Q Q/Q
TCV (€B)* Change Change
Global Market € 15.5 -12% -24%
New Scope € 10.9 -15% -4%
Restructurings € 4.6 -3% -49%
Mega-deals € 2.9 -26% -37%
ITO € 9.4 -28% -39%
BPO € 6.1 33% 22%
Americas € 5.6 -2% -25%
EMEA € 7.6 -21% -35%
Asia Pacific € 2.2 5% 107%

© 2016
Information Services
Group, Inc.
All Rights Reserved
isg-one.com
*Contracts with ACV ≥ €4M from the ISG Contracts Knowledgebase®
22
www.isg-one.com
Information Services Group is a leading technology insights, market intelligence and advisory services company, serving more than 500 clients around the
world to help them achieve operational excellence. ISG supports private and public sector organizations to transform and optimize their operational
environments through research, benchmarking, consulting and managed services, with a focus on information technology, business process transformation,
program management services and enterprise resource planning. Clients look to ISG for unique insights and innovative solutions for leveraging technology,
the deepest data source in the industry, and more than five decades of experience of global leadership in information and advisory services. Based in
Stamford, Conn., the company has more than 1,000 employees and operates in 21 countries.
imagine your future™
RESEARCH | CONSULTING | MANAGED SERVICES
let’s connect...