1.risk-benefit considerations for ap 2.empirical results ... · waples, r. s., and j. drake. 2004....
TRANSCRIPT

OutlineOutline
1. Risk-benefit considerations for AP2. Empirical results from salmon
supplementation3. Meta-analysis of Columbia River
Chinook supplementation4. Reproductive success studies in
upper Columbia River5. Review key questions

Key questions regardingKey questions regarding endangered species conservation
1. Pros and cons of AP?os a d co s o2. When can AP be used effectively?3 Wh h ld AP b d?3. When should AP not be used?4. What species are best suited to AP?at spec es a e best su ted to5. What are alternatives to AP?

Why is it important to conserve y pwild populations?
Long-term sustainability unproven• Catastrophic failure p• Political and funding uncertainties• Erosion of ecological/genetic/lifeErosion of ecological/genetic/life
history diversity• Loss of fitness and productivityp y
Hatcheries don’t promote functioning natural ecosystemsfunctioning natural ecosystems
The following slides are based on:
Waples, R. S., and J. Drake. 2004. Risk-b fit id ti f i t kbenefit considerations for marine stock enhancement: a Pacific salmon perspective. pp. 260-306 in K. M. Leber et al., eds.pp. 260 306 in K. M. Leber et al., eds. Stock Enhancement and Sea Ranching: Developments, Pitfalls and Opportunities. S d Editi Bl k ll O f dSecond Edition, Blackwell, Oxford.
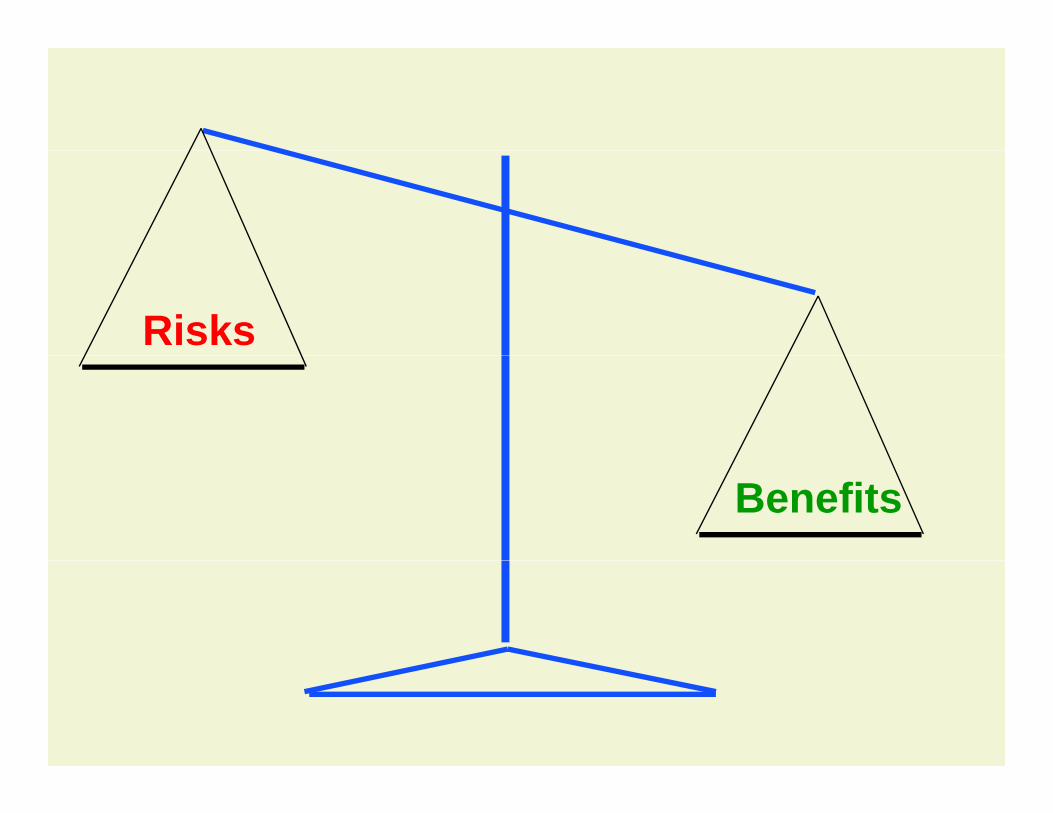
Risks
Benefits

Types of benefits to be considered
Conservation General
• Natural l ti
• Natural l ti populations
• Harvest populations
• Mitigation• Treaty obligationsTreaty obligations• Public education

Wh t bj ti ?What are program objectives?
Harvest increase?L l iti ti ?Legal mitigation?Conservation?Co se at oAll of the above?

Potential benefits of propagationPotential benefits of propagation for natural populations
1. Reduce short-term extinction risk*risk
2. Reseed vacant habitat*3 S d3. Speed recovery
* Empirical evidence exists
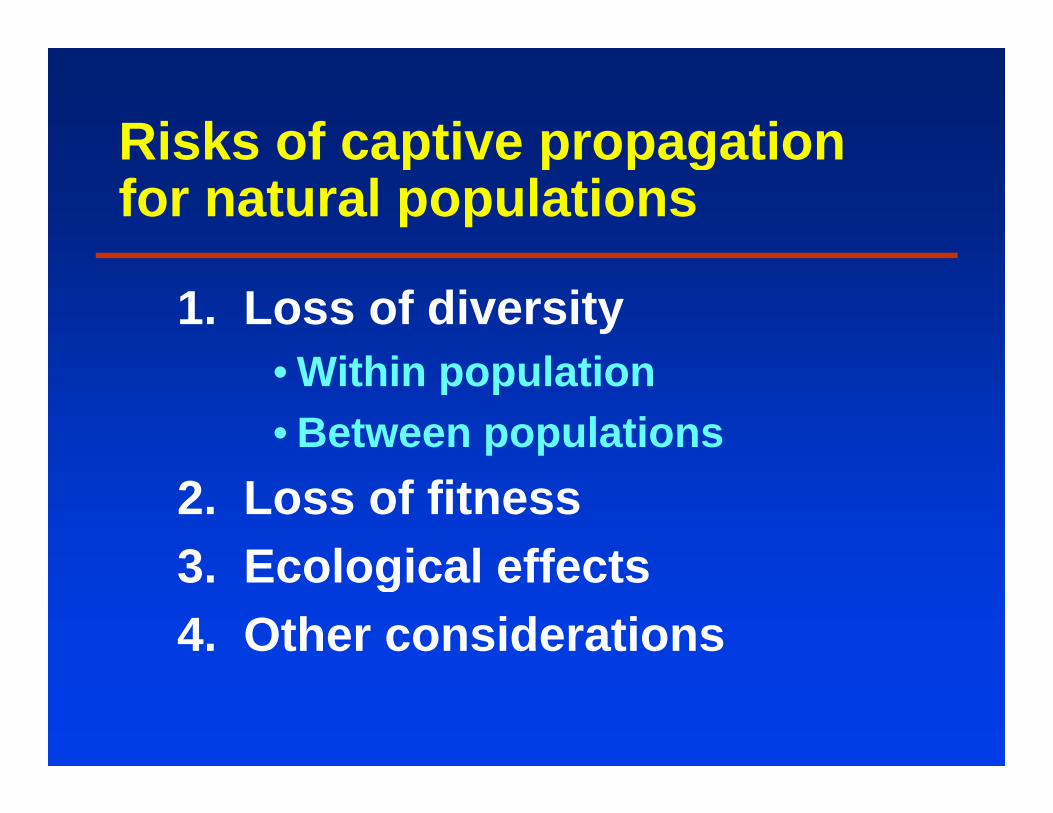
Risks of captive propagationRisks of captive propagation for natural populations
1. Loss of diversity• Within population• Between populations
2. Loss of fitness3 Ecological effects3. Ecological effects4. Other considerations

Diversity within populationsW Diversity within populationsW
HH
W
Ryman-Laikreeffect HH

Broodstockll ticollection
W iSpawning WeirSpawningareas

FitnessHatchery vs. wild environments
Similarities DifferencesWater Food
SubstrateDensityTemperatureFlow regimeCompetitorsPredators

ssfit
nes
tive
fR
ela
Araki et al. 2007

Ecological effects
2
(log)
r2 = 0.06 r2 = 0.73
Average Ocean Productivity Poor Ocean Productivity
0
1
hino
ok (
-1
0
al w
ild c
h
-2
Sur
viva
10 20 30 40 5010 20 30 40 50-3
Number of hatchery spring chinook released (millions)y p g ( )
Levin et al. 2001

Skagit River chinookCatch per tow
12
8
10
12
per T
ow
H
ALL SITES - MARKED VS. NOT MARKED
4
6
8
nook
Cat
ch
W
H
2
4
Meo
n C
hin
0
5/01
6/01
7/01
8/01
9/01
10/0
1M th
C. Rice et al, unpubl. dataMonth

Mi llMiscellaneous concerns
1. Risk tradeoffs2. Marking3. Statistical power3. Statistical power4. Unexpected developments5. Termination of program

Tradeoffs in minimizing risks ofTradeoffs in minimizing risks of supplementation
• Broodstock collection• Release strategies• Program scale• Program scale• Population mixing• Marking

Sampling for broodstock: Sa p g o b oodstocbalancing opposing risks
1. Take small fraction of populationInbreedingFounder effect
2. Take all or most of populationCatastrophic failureFish culture effectsFish culture effects

Broodstock integrity: oodstoc teg tybalancing opposing risks
1. Sample from entire spawning run% f• Maximize % of diversity sampled, but
• Risk capturing non-target fish
2. Sample only part of run• Reduce risk of contamination, but• Reduce diversity of populationy p p

Sacramento River chinook salmonSpawn timing
Jan Mar May Jul Sep Nov
Spawn timing
ll lll ll l l l l l ly
FallFall
Late fallate a
Spring
Winter

Sacramento River chinook salmonRun timing
Jan Mar May Jul Sep Nov
Run timing
ll lll ll l l l l l ly
FallFall
Late fallate a
Spring
Winter

Key questions: MonitoringKey questions: Monitoring
1. What level of marking is necessary for program evaluation? Forprogram evaluation? For identifiability?
2 Are the costs (time money mortality)2. Are the costs (time, money, mortality) of necessary marking acceptable?
3 What is the power of monitoring3. What is the power of monitoring program to detect undesirable effects?

Mi llMiscellaneous concerns
1. Risk tradeoffs2. Marking3. Statistical power3. Statistical power4. Unexpected developments5. Termination of program
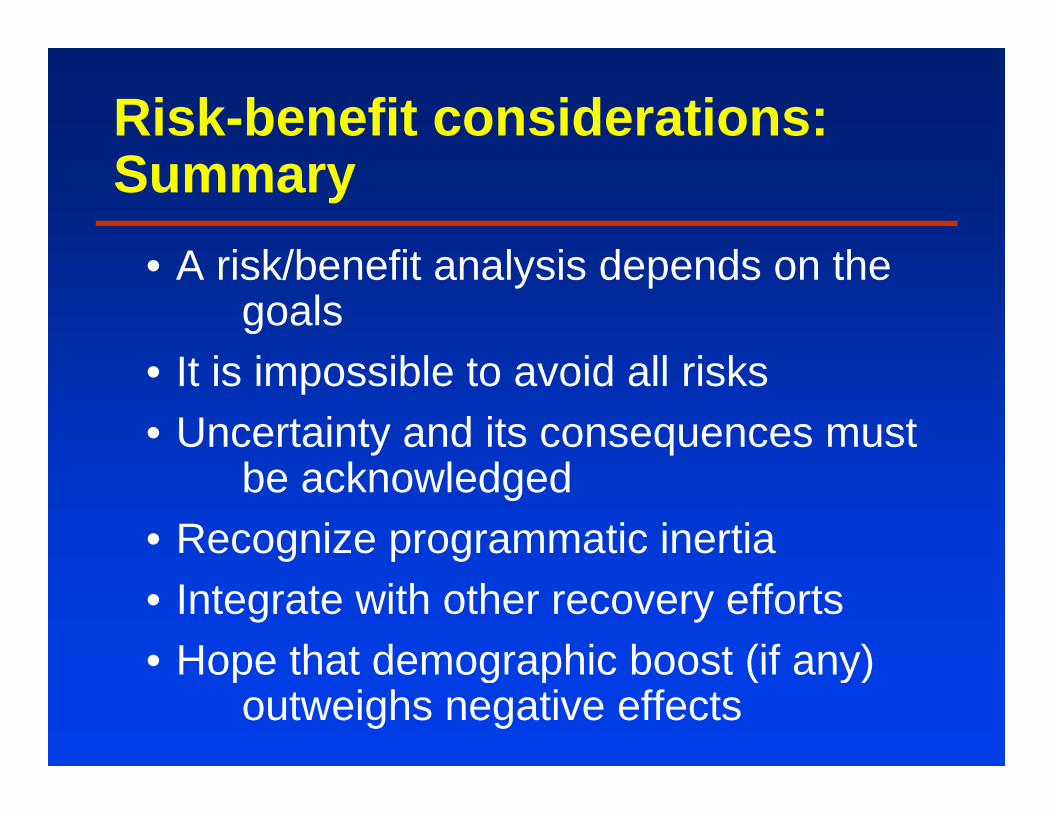
Risk-benefit considerations: Summary
A i k/b fit l i d d th• A risk/benefit analysis depends on the goals
• It is impossible to avoid all risks• Uncertainty and its consequences must
be acknowledged• Recognize programmatic inertiag p g• Integrate with other recovery efforts• Hope that demographic boost (if any)• Hope that demographic boost (if any)
outweighs negative effects

AP programs can try to minimize (but cannot avoid):
I b di• Inbreeding• Ryman-Laikre effect• Effects of broodstock selection• Genetic driftGenetic drift• Domestication

The following slides are based on:
Waples, R. S., M. J. Ford, and D. Schmitt. 2007. E i i l lt f l l t ti iEmpirical results of salmon supplementation in the Northeast Pacific: A preliminary assessment. pp. 383-403 in T. M. Bert, ed.assessment. pp. 383 403 in T. M. Bert, ed. Ecological and Genetic Implications of Aquaculture Activities. Springer, Dordrecht, th N th l dthe Netherlands.

Review of salmon supplementationppMiller et al. 1990
“Twenty-five of the 26 supplementation projects were considered successful by the principal investigator …”
“We found no evaluated projects that had rebuilt wild/natural runs to self-sustaining levels.”

D fi iti f l t tiDefinition of supplementation
Intentional integration of hatchery and wild production with the goaland wild production, with the goal of improving the status of the natural populationnatural population.

Hierarchical goals
Effective broodstock collectionRepresentativenessIntegrity
High survival in cultureHigh survival in culturePrespawningEgg-smoltEgg-smolt Adult-adult
Population increasePopulation increaseNatural spawning successSustainable natural population

Programs evaluated
OR/O /Species CR PS WA BC Tot
Chinook 11 4 - 1 16Chum 2 1 3Chum - 2 - 1 3Sockeye 1 - - - 1Pink - - - 1 1Steelhead 1 - - - 1Steelhead 1 1

Program lengthProgram length
Duration Number
8-12 yr 7y
13-20 yr 11
21-30 yr 4

Supplementation review Waples et al 2007
Was it met?Objective Y N ?
Waples et al. 2007
Objective Y N ?Broodstock collection (representative)
A 11 3 8Age 11 3 8Run timing 10 2 10Integrity 17 5 -
H t h i lHatchery survivalPrespawning (90%) 12 6 4Egg-smolt (70%) 19 2 1Ad lt d lt (2 ) 12 4 6Adult-adult (2x) 12 4 6
Population increase (20%) 8 11 3Natural spawning (comparable) 1 2 19p g ( p )Sustainable - 2 20

Population status
Before After
Healthy 1 -
Depressed 8 -
At risk 10At risk 10 -
Critical 3 2
Still being - 20supplementedsupplemented

Population responsePopulation response
Supplemented ControlSupplemented Control
I d 6 1Increased 6 1Stable 3 2Declined 10 3No data - 13
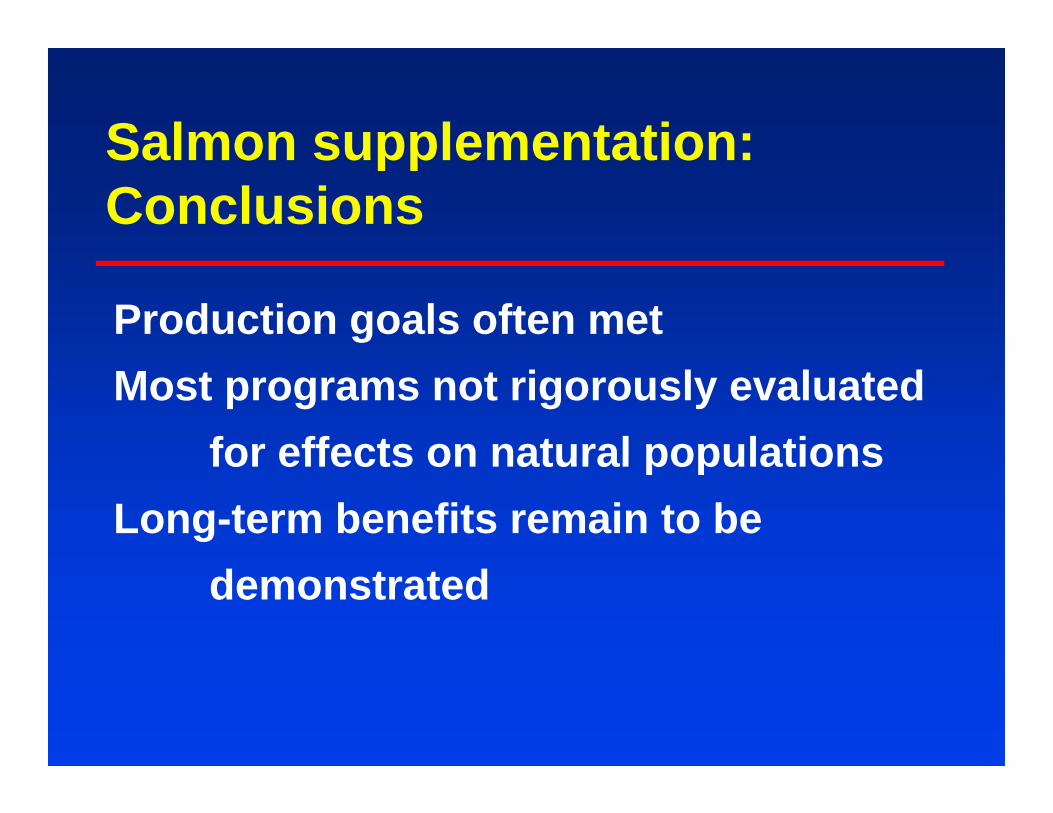
Salmon supplementation:Salmon supplementation:Conclusions
Production goals often metMost programs not rigorously evaluated
for effects on natural populationsfor effects on natural populationsLong-term benefits remain to be
demonstrated

The following slides are based on:
Mike Ford, NWFSC, unpublished dataA meta-analysis of supplementation of
Columbia River basin spring-summer p gChinook salmon

Total spawners (in river)
2000
2500
ners
8910
rol
Supplemented
1500
al spa
wn
567
pp./cont
SupplementedControl
Supp./control
500
1000
al natura
2345
d = sup Trend
Supp./control
0
500
1975 1980 1985 1990 1995 2000 2005
tota
012
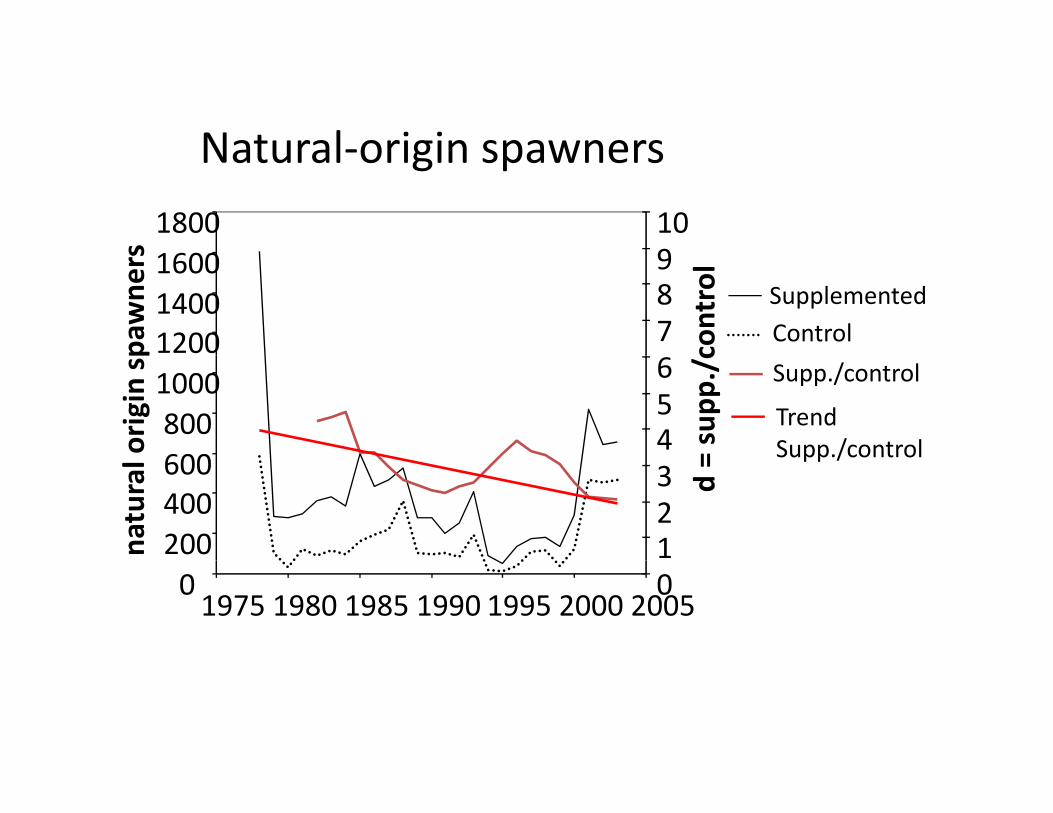
Natural‐origin spawnerss
Natural‐origin spawners
16001800
910
pawne
rs
120014001600
789
control
SupplementedControl
origin sp
6008001000
456
= supp
./c
Supp./control
Trend Supp./control
natural
200400600
123 d
= pp /
01975 1980 1985 1990 1995 2000 2005
0

Natural origin recruits/total spawnersNatural‐origin recruits/total spawners14 5
10
12
3
4
ontrol Supplemented
Control
R/S
6
8
2
3
supp
./c
Supp./control
Trend Supp /control
2
41 d
= Supp./control
01975 1980 1985 1990 1995 2000 2005
0

Local compared to non‐local broodstock
Non‐local: Upper ColumbiaNon local: Upper Columbia
Local: Snake River
Total spawners Natural origin spawners Natural R / SSupplemented Control Supp./control Trend
1980 1985 1990 1995 2000 2005 1975 1980 1985 1990 1995 2000 2005 1975 1980 1985 1990 1995 2000 20051975
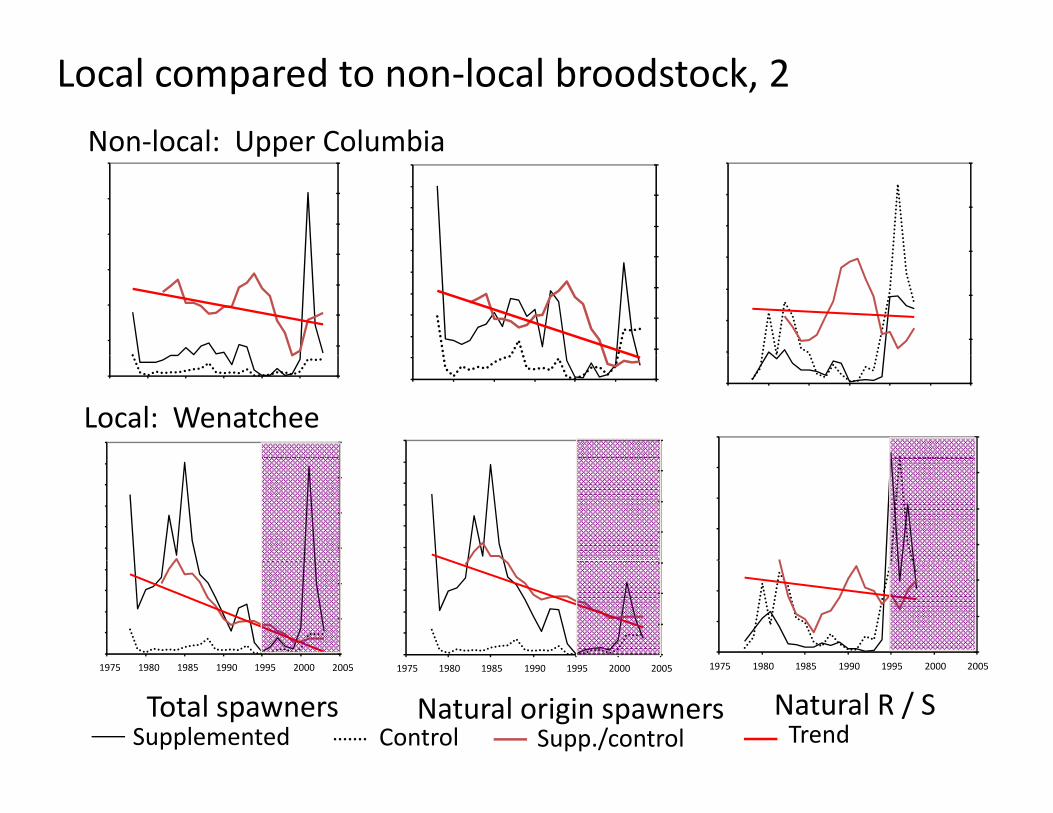
Local compared to non‐local broodstock, 2
Non‐local: Upper ColumbiaNon local: Upper Columbia
Local: Wenatchee
1975 1980 1985 1990 1995 2000 2005
Total spawners Natural origin spawners Natural R / SSupplemented Control Supp./control Trend
1975 1980 1985 1990 1995 2000 2005 1975 1980 1985 1990 1995 2000 2005 1975 1980 1985 1990 1995 2000 2005

Col. R. supplementation -- summary
• Supplemented population are not increasing l ti t l t d l tirelative to unsupplemented populations
• Supplemented populations have lower productivityproductivity
• Populations supplemented with non-local broodstock had poor response to improvedbroodstock had poor response to improved ocean conditions
• Supplementation appears to have helped pp pp pbuffer years of extremely low abundance
• Juvenile production data and long-term reproductive success data would help

The following slides are based on:
A. Murdoch et al. 2007. Monitoring the reproductive success of naturally spawning hatchery and natural spring Chinook salmon i th W t h Ri BPA P j t Nin the Wenatchee River. BPA Project No. 2003-039-00. Bonneville Power Administration Portland OregonAdministration, Portland, Oregon.

Wenatchee spring Chinook salmonp g
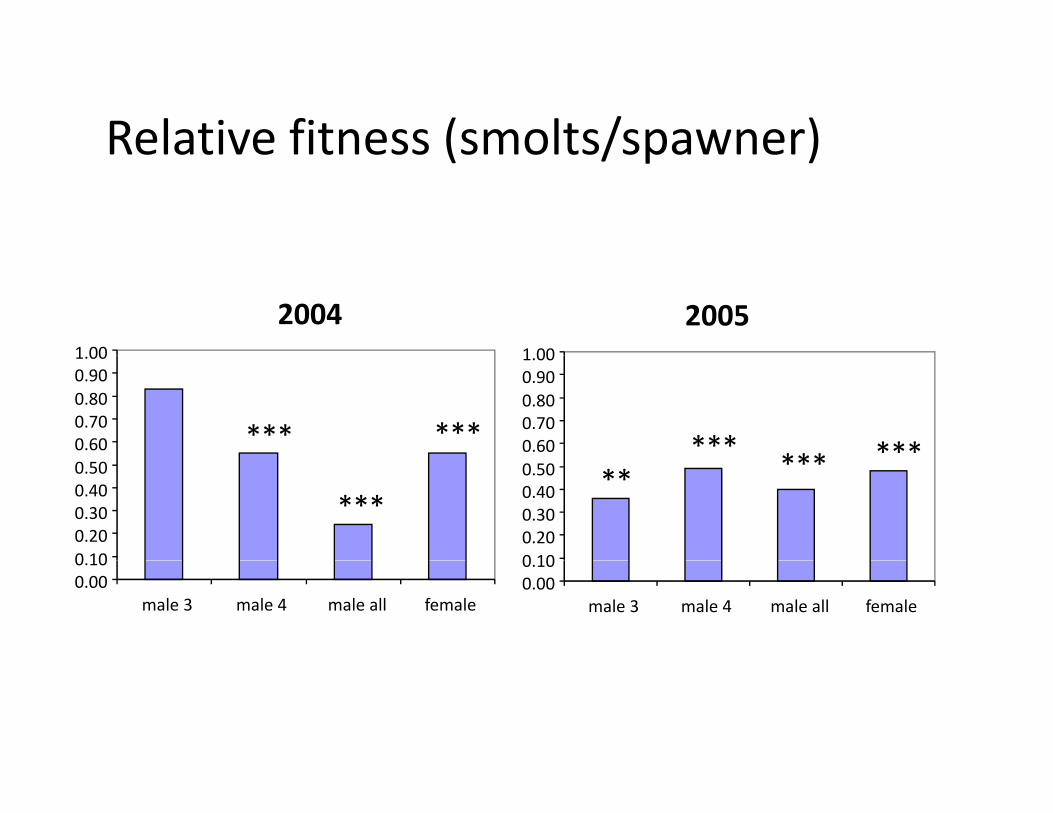
Relative fitness (smolts/spawner)Relative fitness (smolts/spawner)
2004 20051 00 1 00
0.600.700.800.901.00
0.600.700.800.901.00
*** ********* ***
0 100.200.300.400.50
0 100.200.300.400.50
********
0.000.10
male 3 male 4 male all female0.000.10
male 3 male 4 male all female

Traits – spawning locationTraits spawning location
60
40
50
30
40
RKM
10
20
H WORIGIN
0
ORIGIN
NasonChiwawa

Multiple effects, malesMultiple effects, males
2004 2005 Effect estimate p-value estimate p-value Constant 1 084 2 891Constant 1.084 2.891Hatchery origin -0.314 0.418 -1.245 0.033Age 3 0.9 0.095 1.634 0.012Origin X age 3 0 073 0 849 1 092 0 059Origin X age 3 0.073 0.849 -1.092 0.059Run timing 0.231 0.187 -0.002 0.991Weight 1.479 <0.001 0.667 0.009Location 0 519 0 005 0 48 0 007Location 0.519 0.005 0.48 0.007

Multiple effects, femalesMultiple effects, females
2004 2005 Effect estimate p-value estimate p-valuep pConstant 1.165 1.608Hatchery origin -0.165 0.166 -0.023 0.893Run timing 0 084 0 519 0 128 0 336Run timing 0.084 0.519 0.128 0.336Weight 0.092 0.402 0.242 0.045Location 0.651 <0.001 0.983 <0.001
Summary
• Large reduction in relative reproductive f W t h h t h isuccess of Wenatchee hatchery spring
Chinook in spite of using local broodstockbroodstock
• Size and spawning location appear to be important factors contributing to results

Pros and cons of AP?Pros and cons of AP?
ProCan help maintain gene poolsCan help reseed vacant habitat
Pro
pCan help meet some societal goals
ConLong-term benefits not demonstratedE t d ti i fit
Con
Expect reductions in fitnessExpect reductions in diversityE i i d li iExpect unanticipated complications

When might AP be used effectively?• When target population faces high, short-
term extinction riskterm extinction risk• When there are serious concerns for
inbreeding depressioninbreeding depression• When suitable and accessible habitat is
unseededunseeded • When comprehensive risk-benefit analysis
indicates net benefits are likely toindicates net benefits are likely to outweigh adverse effects
In conj nction ith comprehensi e• In conjunction with comprehensive recovery efforts

1000 Upper Salmon RiverChi k l
800
900ds
Chinook salmon
500
600
700
of re
d
300
400
500
mbe
r
100
200Nu
0
1960 1965 1970 1975 1980 1985 1990
Year

When should AP not be used?
• When there are not ‘enough’ fish but• When there are not enough fish but current risks to target population are not highg
• When natural colonization can reseed vacant habitatvacant habitat
• When logistic challenges prevent risk-averse implementationaverse implementation
• When comprehensive risk-benefit analysis indicates net benefits are not likely toindicates net benefits are not likely to outweigh adverse effects

What species are best suited to AP?
• Freshwater speciesp• Anadromous species with brief freshwater
life historyy• Species with weak population genetic
structure and few local adaptatationsstructure and few local adaptatations • Species that can tolerate crowded rearing
conditionsconditions

What alternatives to AP exist?
• Abundant good quality habitatg q y• Functioning natural ecosystems• Fix the causes for decline• Fix the causes for decline