1st qtr 2nd qtr 3rd qtr 4th qtrstorage.googleapis.com/request-attachments...(gni) likewise posted a...
TRANSCRIPT

1st Qtr
2nd Qtr
3rd Qtr
4th Qtr
OCTOBER 2018

FOREWORD
The Current Labor Statistics is a quarterly publication of the Philippine Statistics Authority (PSA) that provides data
users with timely, accurate and reliable data on the latest labor and employment statistics and other macroeconomic
statistics which are accompanied by data highlights.
This October 2018 CLS issue presents preliminary statistics of the July 2018 Labor Force Survey (LFS).
Also included in this issue are updates on the indices of employment; minimum wage rates; labor turnover rates;
indices of compensation; consumer price index; inflation rate; purchasing power of the peso; net inward foreign
investments; gross national income (GNI), gross domestic product (GDP) and gross regional domestic product (GRDP); GDP
real growth rates, inflation rates and unemployment rates in selected Asian countries; and comparative wages in Asian
countries.
The PSA would like to thank the agencies where the data were secured, specifically, the Bangko Sentral ng Pilipinas and the National Wages and Productivity Commission. Equally deserving of our gratitude are the various offices of the PSA
for their continuing support to this publication.
FOR THE NATIONAL STATISTICIAN
JOSIE B. PEREZ Assistant Secretary
(Deputy National Statistician) Officer-in-Charge
PHILIPPINE STATISTICS AUTHORITY October 12, 2018

DATA HIGHLIGHTS
Starting April 2016, the Labor Force Survey (LFS) has adopted the 2013 Master Sample Design which has a sample
size of approximately 44,000 households. It likewise used the population projections based on the 2010 Census of
Population and Housing. Other changes made were the use of the 2012 Philippine Standard Occupational
Classification (PSOC) from the previously utilized 2002 Update of the PSOC.
Preliminary results of the July 2018 Labor Force Survey of the Philippine Statistics Authority (PSA) showed that the
total household population of 15 years old and over in the country was estimated at 71.560 million wherein about
42.982 million persons were in the labor force. This placed the labor force participation rate (LFPR) at 60.1 percent, a
decrease of 0.5 percentage point from the 60.6 percent registered in July 2017 despite the increment of 438,000
(1.0%) in the labor force for the period. This is due to the household population 15 years old and over growing at a
faster pace than the labor force (2.0% vs. 1.0%, respectively).
The total number of employed persons in the country was estimated at 40.659 million, an increase of 488,000 (1.2%)
from the 40.171 million posted in the same period last year. The increase in employment is attributed to the
increments posted in industry and services sectors of 172,000 (2.2%) and 1.052 million (4.7%) respectively, which
negates the decrement suffered by the agriculture sector (-737,000 or -7.3%).
All of the industries in the services sector, except for accommodation and food service activities, posted increases in
employment. The wholesale and retail trade; repair of motor vehicles and motorcycles accounted for the biggest slice
(239,000 or 3.2%) of the 488,000 increase in employment for the period. This was followed by administrative and
support service activities which recorded an increment of 192,000 (13.7%).
In the same manner, employment in all sub-sectors under industry grew except for water supply, sewerage, waste
management and remediation activities which went down by 5,000. Manufacturing accounted for the biggest increase of 142,000.
Among the regions, substantial increases in number of employed persons were recorded in Region IV-A (214,000 or 3.7%) and the National Capital Region (116,000 or 2.3%). Meanwhile, Region VII posted the biggest decline in employment of 4.1 percent (-129,000) followed by Region VI of 2.4 percent (-76,000).

Moreover, workers in full time employment or those working 40 hours or more per week registered a gain of
6.1 percent (1.658 million) during the period while part-time workers decreased by 1.174 million (-9.3%). Further, the number of wage and salary workers went up substantially by 1.012 million (4.0%) while self-employed workers and unpaid family workers posted declines of 4.3 percent (-480,000) and 9.8 percent (-205,000), respectively.
Meanwhile, declines in employment were noted among males (-4,000); those aged 15-24 years old (-190,000) and
those with elementary (-4,000), junior high school (-462,000) and post secondary (-101,000) levels of education.
By major occupation group, ample increases in employment were observed in service and sales workers (302,000 or
5.2%), managers (291,000 or 4.7%) and technicians and associate professionals (204,000 or 13.1%) negating the considerable drop in number of employed skilled agricultural, forestry and fishery workers of 609,000 (-11.2%).
About 7.005 million workers were underemployed or those employed persons who expressed desire to have additional
hours of work in their present job or to have additional job or to have a new job with longer working hours in
July 2018. This translates to an underemployment rate of 17.2 percent, higher by 0.9 percentage point than the
16.3 percent rate registered the previous year.
Invisibly underemployed or those working 40 hours or more and still wanting additional hours of work during the
reference week accounted for 3.703 million, an increase of 601,000 (19.4%) from the 3.101 million invisibly underemployed in July 2017. Meanwhile visibly underemployed or those working less than 40 hours numbered
3.302 million for the period, which was 138,000 less than the 3.440 million registered a year ago.
Regions with the highest underemployment rates during the period were Region V (28.0%), Region VIII (27.2%),
Region IX and CARAGA (both with 25.8%) and Region X (23.5%). On the other hand, the National Capital Region posted the lowest and the only single digit underemployment rate at 8.0 percent in July 2018.
The number of unemployed persons was placed at 2.323 million, a decline of 50,000 from the 2.373 million recorded
in July 2017. Unemployment rate stood at 5.4 percent in July 2018, lower by 0.2 percentage point than the rate
posted in the same period last year at 5.6 percent. Among regions, Region I (6.5%), Region III (6.3%), Regions IV-A
and V (both with 6.3%) and National Capital Region (6.1%) registered the highest unemployment rates.
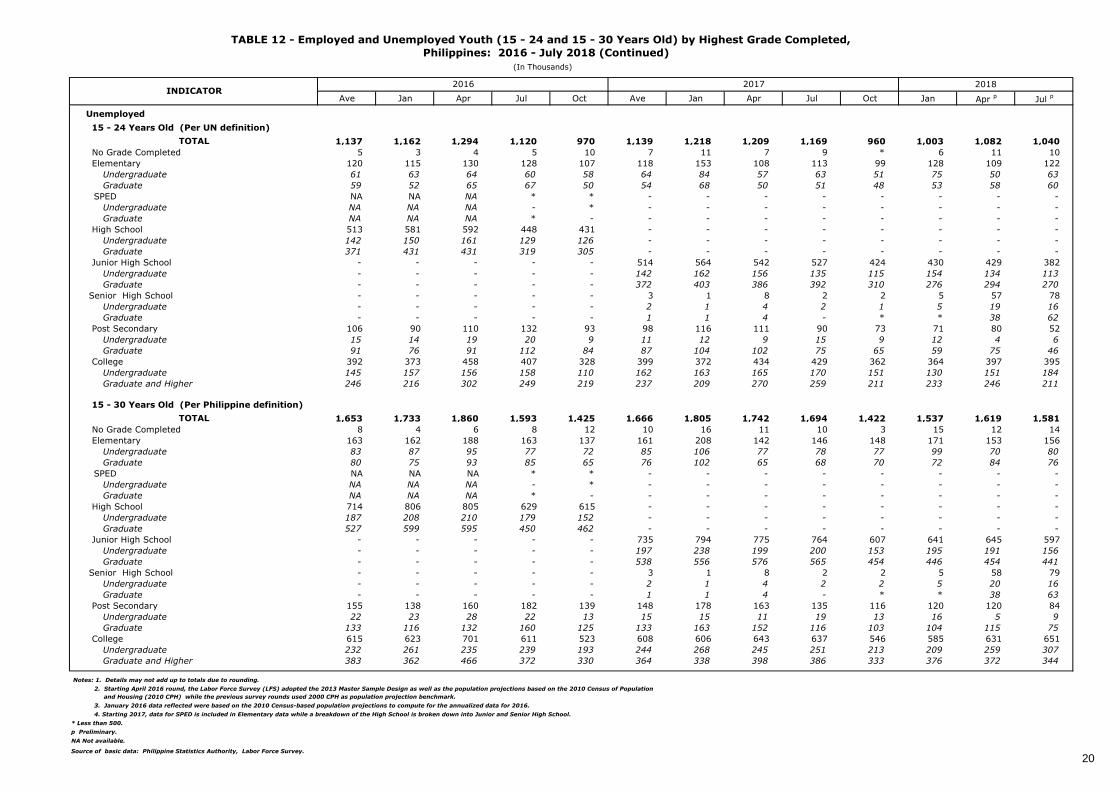
Among the unemployed persons for the period, 61.1 percent (1.420 million) were males while the age group 15 to 24
years old accounted for 1.040 million or 44.8 percent of the total unemployed. Except for the young workers, all age
groups posted higher number of unemployed person, with the age group 35 to 44 years incurring an increase of

27,000 (11.1%). By highest grade completed, bulk of the unemployed were in junior high school (928,000 or
40.0%) and those that have reached college level of education (853,000 or 36.7%).
Starting 2018, the Labor Turnover Survey (LTS) which is conducted quarterly by the PSA covers agricultural and non-
agricultural establishments employing 20 and over workers nationwide. Labor turnover rate was posted at
1.58 percent. The accession rate of 9.30 percent implied that 93 workers for every 1,000 employed were hired for
business expansion or replacement of separated workers while the separation rate of 7.72 percent means that 77
workers were either laid-off or quit their jobs during the period.
All major sectors posted positive labor turnover rates for the period with the industry sector posting the highest rate at
3.47 percent as all its subsectors recorded positive labor turnover rates. This was followed by the agriculture, forestry
and fishing at 2.01 percent and the services sector at 0.95 percent.
The index of employment in non-agricultural industries was posted at 187.2 in first quarter of 2018, 2.7 index points
higher than 184.5 from the same quarter last year.
The index of compensation per employee in non-agricultural industries at constant 1978 prices was reported at 116.8 in first quarter of 2018, 0.9 index points higher than the 115.9 posted during the same period last year. Among industries, private services recorded the highest index of compensation at 335.3 index points while manufacturing
registered the lowest index at 51.7.
The growth of the country’s Gross Domestic Product (GDP) during the second quarter of 2018 slowed down as it registered an increase of 6.0 percent from 6.6 percent during the same period last year. The Gross National Income (GNI) likewise posted a lower growth of 5.8 percent from 6.6 percent registered during the 2nd quarter of 2017.
The net inward foreign investments recorded by the Bangko Sentral ng Pilipinas (BSP) for the 2nd quarter of 2018
totaled to US$3.150 billion, an increase of US$63 million from the same period last year. The increment was the result of the growth in the net foreign direct investment of US$1.026 billion for the 2nd quarter of 2018.
The labor productivity at constant 2000 prices in 2017 reached P214,849, a growth of 8.4 percent from 2016. The highest growth rate was recorded in the agriculture, hunting, forestry and fishing at 12.1 percent.
Among regions, nine regions had labor productivity growth rates higher than the national growth rate of 8.4 in 2017.
Based on the 2017 List of Establishments, the country has a total of 924,721 establishments nationwide in 2017.
Across regions, one in every five establishments is found in the National Capital Region accounting for 21.0 percent or
194,134 of total establishments. This was followed by Region IV-A and Region III with 15.0 percent (138,465) and
11.2 percent (103,634) shares, respectively.
Among sectors, majority of these establishments are engaged in the non-industrial sector at 85.6 percent, followed by
the industrial sector at 13.4 percent, with the agriculture, forestry and fishing sector reporting the least share at 1.0
percent. Among major industry groups, wholesale and retail trade; repair of motor vehicles and motorcycles posted
the highest share at 45.9 percent (424,061).
Classified by employment size, majority or nine out of every ten establishments (89.6%) have employment size of 1-9
workers. The shares of the rest of the employment sizes ranged from 6.0 percent (10-19 workers) to 0.4 percent
(101-199 workers & 200 workers and more).
Meanwhile, the total employment generated by these establishments was recorded at 7,832,089 workers in 2017. By
region, the establishments’ employment in the National Capital Region has the largest share at 37.7 percent
(2,949,627). This was followed by Region IV-A at 15.3 percent (1,198,563) and Region III at 8.9 percent (700,104).
Classified by sector, the employment in the non-industrial sector accounted for around three-fourths (72.9%) or
5,712,327 of the total. This was followed by the industrial sector with 24.6 percent (1,928,593) and agriculture,
forestry and fishing at 2.4 percent (191,169).
Data released by the National Wages and Productivity Commission (NWPC) on the Comparative Wages in Selected
Asian Countries as of 31 August 2018 indicates that among Asian countries, Japan has the highest monthly minimum
pay ranging from US$1,587.93 to US$2,064.10. South Korea and Taiwan came next with a monthly minimum wage of
US$1,627.51 and US$1,094.70, respectively.
In the case of the Philippines, a minimum wage earner receives a monthly pay ranging from US$169.99 to US$287.24
depending on which area or region the worker is employed. Indonesia (US$90.71 to US$227.55) and Vietnam
(US$143.20 to US$161.74), on the other hand, provides a monthly minimum wage lower than the Philippines.

FOREWORD i
DATA HIGHLIGHTS ii
PART I. MACROECONOMIC LABOR AND EMPLOYMENT STATISTICS
Table
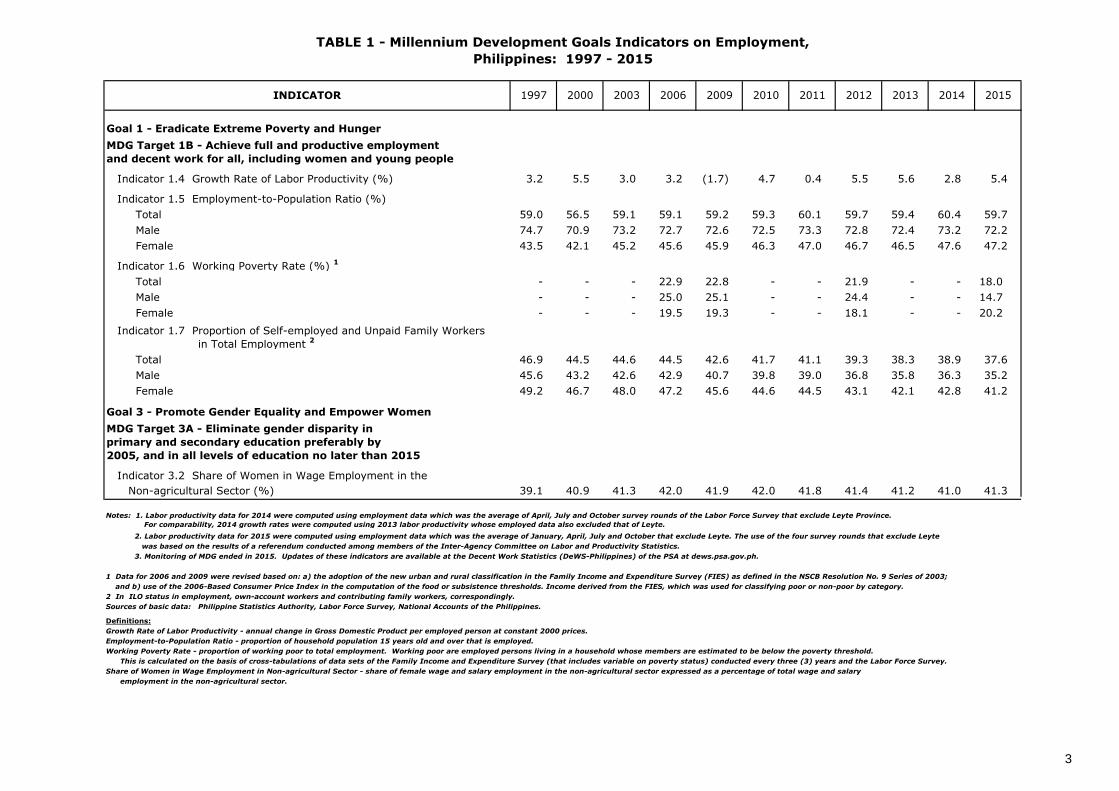
1 Millennium Development Goals Indicators on Employment, Philippines: 1997 - 2015 3
2 Household Population 15 Years Old and Over and Employment Status, Philippines: 2016 - July 2018 4
3 Household Population 15 Years Old and Over and Employment Status by Sex, Philippines: 2016 - July 2018 5
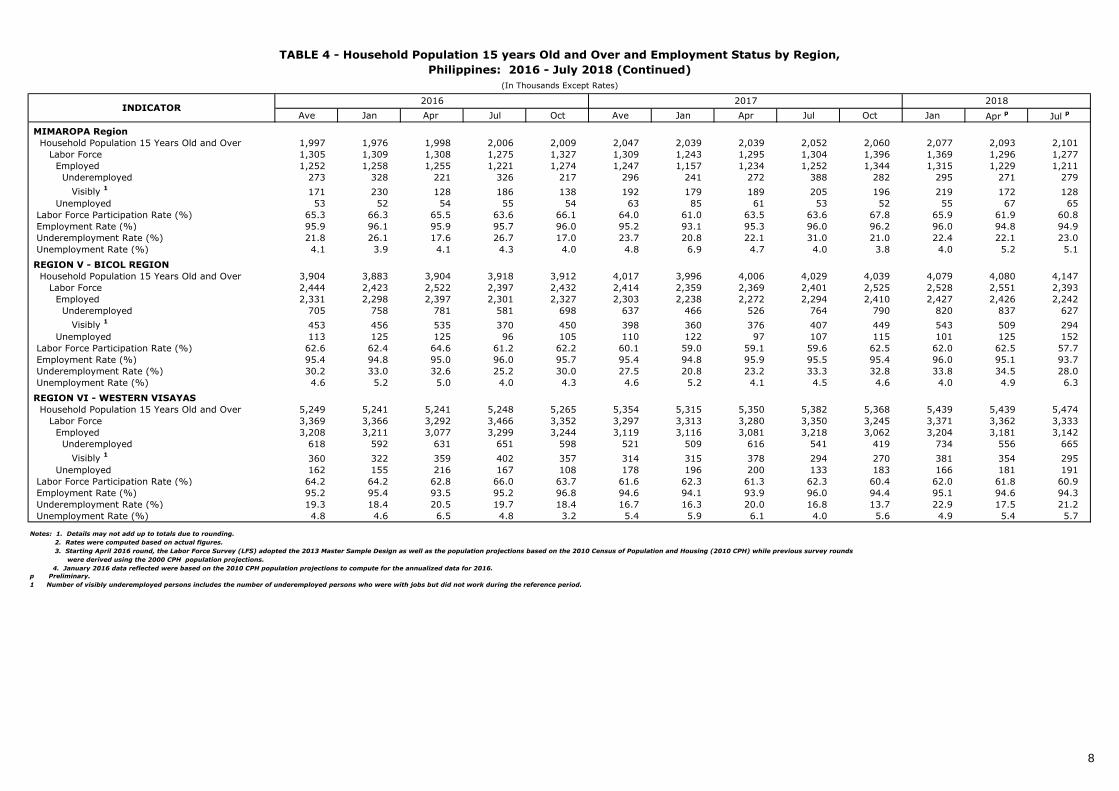
4 Household Population 15 Years Old and Over and Employment Status by Region, Philippines: 2016 - July 2018 6
5 Employed Persons by Major Industry Group, Philippines: 2016 - July 2018 12
6 Employed Persons by Major Occupation Group, Philippines: 2016 - July 2018 13
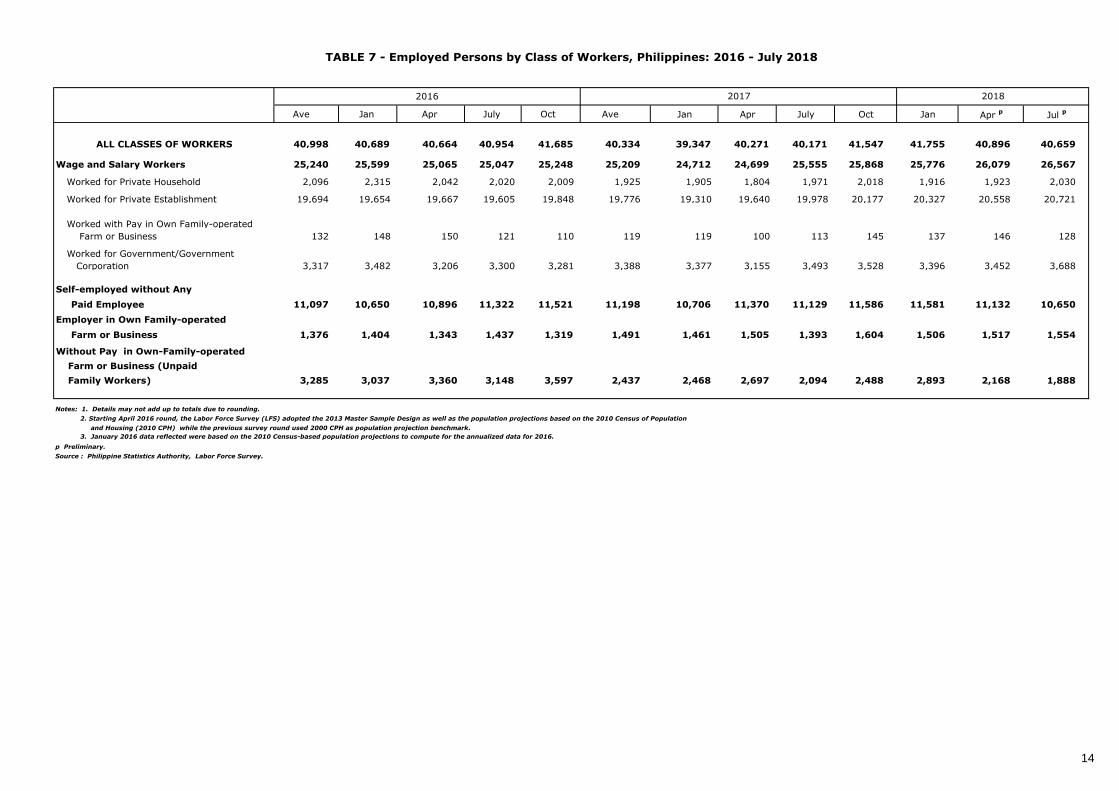
7 Employed Persons by Class of Workes, Philippines: 2016 - July 2018 14
8 Employed Persons by Number of Hours Worked Per Week, Philippines: 2016 - July 2018 15
9 Employed Persons by Sex, Age Group and Highest Grade Completed, Philippines: 2016 - July 2018 16
10 Unemployed Persons by Sex, Age Group and Highest Grade Completed, Philippines: 2016 - July 2018 17
11 Youth (15 - 24 and 15 - 30 Years Old) Household Population and Employment Status by Sex,
Philippines: 2016 - July 2018 18
12 Employed and Unemployed Youth (15 - 24 and 15 - 30 Years Old) by Highest Grade Completed,
Philippines: 2016 - July 2018 19
13 Working Children (5 - 17 Years Old) by Age Group and Sex, Philippines: 2016 - July 2018 21
14 Indices of Employment in Non-Agricultural Industries by Major Industry Group,
Philippines: 2015 - First Quarter 2018 22
15 Labor Turnover Rates in Enterprises by Quarter, National Capital Region: First Quarter 2015 - Fourth Quarter 2017 23
15a Labor Turnover Rates in Enterprises by Major Industry Group, National Capital Region: First Quarter 2015 - Fourth Quarter 2017 24
16 Labor Turnover Rates in Agricultural and Non-Agricultural Establishments by Major Industry Group, Philippines: First Quarter 2018 (Final) 25
17 Average Daily Basic Pay of Wage and Salary Workers by Region, Philippines: 2016 - January 2018 26
18 Average Daily Basic Pay of Wage and Salary Workers by Major Industry Group, Philippines: 2016 - January 2018 27
19 Average Daily Basic Pay of Wage and Salary Workers by Major Occupation Group, Philippines: 2016 - January 2018 28
20 Average Daily Basic Pay of Wage and Salary Workers, Philippines: 2016 - January 2018 29
21 Minimum Wage Rates by Sector and Region, Philippines: As of October 3, 2018 30
22 Agricultural Wage Rates of Farm Workers, Philippines: 2014 - 2016 37
23 Indices of Compensation Per Employee in Non-Agricultural Industries by Major Industry Group,
Philippines: 2015 - First Quarter 2018 38
24 Exchange Rate, Consumer Price Index and Inflation Rate, Philippines: 2016 - June 2018 39
25 Purchasing Power of Peso, Philippines: 2016 - June 2018 40
26 Gross National Income and Gross Domestic Product by Quarter, Philippines: 2016 - Second Quarter 2018 41
27 Net Inward Foreign Investments by Type (BOP Concept), Philippines: 2016 - Second Quarter 2018 42
TABLE OF CONTENTS

28 Labor Productivity and Growth Rates by Sector, Philippines: 2013 - 2017 43
29 Labor Productivity and Growth Rates by Region, Philippines: 2015 - 2017 44
30 Gross Regional Domestic Product, Philippines: 2015 - 2017 45
PART II. RELATED LABOR AND EMPLOYMENT STATISTICS
31 Number of Establishments by Region and Employment Size, Philippines: 2017 46
32 Establishments' Employment by Region and Employment Size, Philippines: 2017 47
33 Number of Establishments by Major Industry Group/Sector and Employment Size, Philippines: 2017 48
34 Establishments' Employment by Major Industry Group/Sector and Employment Size, Philippines: 2017 49
35 Number of Families, Total and Average Annual Family Income and Expenditure by Region, Philippines: 2015 50
36 Annual Per Capita Poverty Threshold, Magnitude of Poor and Poverty Incidence by Region,
Philippines: 2009, 2012 and 2015 51
37 Poverty Incidence of Basic Sectors, Philippines: 2006, 2009, 2012 and 2015 52
38 Total Population and Annual Population Growth Rates by Region, Philippines: 2000, 2010 and 2015 53
39 Gross Domestic Product (GDP) Real Growth Rates in Selected Asian Countries:
First Quarter 2015 - Third Quarter 2018 54
40 Inflation Rates in Selected Asian Countries: April 2017 - September 2018 55
41 Unemployment Rates in Selected Asian Countries: April 2017 - August 2018 56
42 Gross Domestic Product Per Capita, Purchasing Power Parity in Selected Asian Countries: 2008 - 2017 57
43 Comparative Wages in Asian Countries: As of August 31, 2018 58

PART I
MacroeconomicLabor and Employment
Statistics
Goal 1 - Eradicate Extreme Poverty and Hunger
MDG Target 1B - Achieve full and productive employment
and decent work for all, including women and young people
Indicator 1.4 Growth Rate of Labor Productivity (%) 3.2 5.5 3.0 3.2 (1.7) 4.7 0.4 5.5 5.6 2.8 5.4
Indicator 1.5 Employment-to-Population Ratio (%)
Total 59.0 56.5 59.1 59.1 59.2 59.3 60.1 59.7 59.4 60.4 59.7
Male 74.7 70.9 73.2 72.7 72.6 72.5 73.3 72.8 72.4 73.2 72.2
Female 43.5 42.1 45.2 45.6 45.9 46.3 47.0 46.7 46.5 47.6 47.2
Indicator 1.6 Working Poverty Rate (%) 1
Total - - - 22.9 22.8 - - 21.9 - - 18.0
Male - - - 25.0 25.1 - - 24.4 - - 14.7
Female - - - 19.5 19.3 - - 18.1 - - 20.2
Indicator 1.7 Proportion of Self-employed and Unpaid Family Workers
in Total Employment 2
Total 46.9 44.5 44.6 44.5 42.6 41.7 41.1 39.3 38.3 38.9 37.6
Male 45.6 43.2 42.6 42.9 40.7 39.8 39.0 36.8 35.8 36.3 35.2
Female 49.2 46.7 48.0 47.2 45.6 44.6 44.5 43.1 42.1 42.8 41.2
Goal 3 - Promote Gender Equality and Empower Women
MDG Target 3A - Eliminate gender disparity in
primary and secondary education preferably by
2005, and in all levels of education no later than 2015
Indicator 3.2 Share of Women in Wage Employment in the
Non-agricultural Sector (%) 39.1 40.9 41.3 42.0 41.9 42.0 41.8 41.4 41.2 41.0 41.3
Notes: 1. Labor productivity data for 2014 were computed using employment data which was the average of April, July and October survey rounds of the Labor Force Survey that exclude Leyte Province.
For comparability, 2014 growth rates were computed using 2013 labor productivity whose employed data also excluded that of Leyte.
2. Labor productivity data for 2015 were computed using employment data which was the average of January, April, July and October that exclude Leyte. The use of the four survey rounds that exclude Leyte
was based on the results of a referendum conducted among members of the Inter-Agency Committee on Labor and Productivity Statistics.
3. Monitoring of MDG ended in 2015. Updates of these indicators are available at the Decent Work Statistics (DeWS-Philippines) of the PSA at dews.psa.gov.ph.
1 Data for 2006 and 2009 were revised based on: a) the adoption of the new urban and rural classification in the Family Income and Expenditure Survey (FIES) as defined in the NSCB Resolution No. 9 Series of 2003;
and b) use of the 2006-Based Consumer Price Index in the computation of the food or subsistence thresholds. Income derived from the FIES, which was used for classifying poor or non-poor by category.
2 In ILO status in employment, own-account workers and contributing family workers, correspondingly.
Sources of basic data: Philippine Statistics Authority, Labor Force Survey, National Accounts of the Philippines.
Definitions:
Growth Rate of Labor Productivity - annual change in Gross Domestic Product per employed person at constant 2000 prices.
Employment-to-Population Ratio - proportion of household population 15 years old and over that is employed.
Working Poverty Rate - proportion of working poor to total employment. Working poor are employed persons living in a household whose members are estimated to be below the poverty threshold.
This is calculated on the basis of cross-tabulations of data sets of the Family Income and Expenditure Survey (that includes variable on poverty status) conducted every three (3) years and the Labor Force Survey.
Share of Women in Wage Employment in Non-agricultural Sector - share of female wage and salary employment in the non-agricultural sector expressed as a percentage of total wage and salary
employment in the non-agricultural sector.
TABLE 1 - Millennium Development Goals Indicators on Employment,
Philippines: 1997 - 2015
INDICATOR 2014201120101997 2013 20152000 2003 20122006 2009
3

2018
Ave Jan Apr Jul Oct Ave Jan Apr Jul Oct Jan Apr p
Jul p
Household Population
15 Years Old and Over 68,311 67,889 68,167 68,443 68,743 69,891 69,414 69,605 70,164 70,380 70,897 71,014 71,560
Labor Force 43,361 43,144 43,289 43,286 43,724 42,775 42,109 42,714 42,544 43,732 44,075 43,256 42,982
Employed 40,998 40,689 40,664 40,954 41,685 40,334 39,347 40,271 40,171 41,547 41,755 40,896 40,659
At Work 40,600 40,421 39,896 40,729 41,352 39,964 38,944 39,712 39,946 41,255 41,243 40,465 40,431
Worked Less Than 40 Hours (Part-Time) 13,361 13,040 13,350 13,087 13,967 13,650 13,441 15,215 12,640 13,304 14,690 12,671 11,466
Worked 40 Hours and Over (Full-Time) 27,239 27,381 26,546 27,642 27,386 26,314 25,503 24,497 27,306 27,951 26,552 27,794 28,964
With a Job But Not at Work 398 268 768 225 332 370 404 559 225 292 512 430 228
Underemployed 7,513 7,975 7,431 7,134 7,510 6,506 6,398 6,468 6,541 6,616 7,498 6,934 7,005
Visibly 1
4,149 4,189 4,288 3,965 4,153 3,739 3,839 4,027 3,440 3,652 4,416 3,740 3,302
Invisibly 3,364 3,786 3,143 3,169 3,357 2,766 2,559 2,442 3,101 2,963 3,082 3,194 3,703
Unemployed 2,363 2,455 2,625 2,332 2,040 2,441 2,761 2,443 2,373 2,185 2,320 2,360 2,323
Labor Force Participation Rate (%) 63.5 63.6 63.5 63.2 63.6 61.2 60.7 61.4 60.6 62.1 62.2 60.9 60.1
Employment Rate (%) 94.6 94.3 93.9 94.6 95.3 94.3 93.4 94.3 94.4 95.0 94.7 94.5 94.6
Underemployment Rate (%) 18.3 19.6 18.3 17.4 18.0 16.1 16.3 16.1 16.3 15.9 18.0 17.0 17.2
Visible Underemployment Rate (%) 10.1 10.3 10.5 9.7 10.0 9.3 9.8 10.0 8.6 8.8 10.6 9.1 8.1
Unemployment Rate (%) 5.4 5.7 6.1 5.4 4.7 5.7 6.6 5.7 5.6 5.0 5.3 5.5 5.4
Employment Generation NA NA NA NA NA (664) (1,342) (393) (783) (138) 2,408 625 488
Employment Growth (%) NA NA NA NA NA (1.62) (3.30) (0.97) (1.91) (0.33) 6.12 1.55 1.21
Notes: 1. Details may not add up to totals due to rounding.
2. Rates were computed based on actual figures.
3. Starting April 2016 round, the Labor Force Survey (LFS) adopted the 2013 Master Sample Design as well as the population projections based on the 2010 Census of Population and Housing (2010 CPH) while previous survey rounds
were derived using the 2000 CPH population projections.
4. January 2016 data reflected were based on the 2010 CPH population projections to compute for the annualized data for 2016.
p Preliminary.
NA Not available.
1 Number of visibly underemployed persons includes the number of underemployed persons who were with jobs but did not work during the reference period.
Source of basic data: Philippine Statistics Authority, Labor Force Survey.
Definitions:
Labor Force - population 15 years old and over who are either employed or unemployed.
Employed - persons 15 years old and over who, during the reference week, were reported at work for at least an hour.
Unemployed - persons 15 years old and over without work or had no job/business, looking or seeking work, and available for work during the reference week.
Underemployed - employed persons who want additional hours of work in their present job, or to have additional job, or to have a new job with longer working hours.
Visibly Underemployed - underemployed persons who worked for less than 40 hours during the reference week.
Invisibly Underemployed - underemployed persons who worked for 40 hours or more during the reference week.
Employment Generation - year-on-year incremental change in employment.
2016INDICATOR
2017
TABLE 2 - Household Population 15 Years Old and Over and Employment Status,
Philippines: 2016 - July 2018(In Thousands Except Rates)
4

Ave Jan Apr Jul Oct Ave Jan Apr Jul Oct Jan Apr p
Jul p
Household Population 15 Years Old and Over 34,184 34,022 34,035 34,205 34,474 35,004 34,751 34,804 35,136 35,324 35,520 35,590 35,875
Labor Force Labor Force 26,521 26,111 26,616 26,515 26,843 26,667 26,437 26,645 26,613 26,975 27,280 26,789 26,509
Employed Employed 25,035 24,542 24,955 25,104 25,538 25,067 24,514 25,088 25,093 25,573 25,760 25,308 25,089
At Work At Work 24,795 24,375 24,510 24,965 25,330 24,836 24,229 24,773 24,954 25,386 25,440 25,081 24,963
Worked Less Than 40 Hours (Part-Time) Worked Less Than 40 Hours (Part-Time) 7,961 7,641 8,020 7,886 8,296 8,486 8,593 9,465 7,861 8,024 9,047 7,599 6,700
Worked 40 Hours and Over (Full-Time) Worked 40 Hours and Over (Full-Time) 16,834 16,733 16,490 17,079 17,035 16,350 15,636 15,309 17,093 17,361 16,393 17,482 18,263
With a Job But Not at Work 240 167 445 139 207 231 284 315 139 187 320 227 127
Underemployed Underemployed 5,176 5,381 5,151 4,933 5,237 4,466 4,492 4,465 4,472 4,433 5,215 4,616 4,782
Visibly 1
Visibly 1
2,753 2,697 2,865 2,649 2,800 2,488 2,648 2,723 2,262 2,319 2,947 2,410 2,034
Invisibly Invisibly 2,423 2,684 2,286 2,285 2,437 1,977 1,844 1,742 2,210 2,113 2,268 2,205 2,747
Unemployed Unemployed 1,486 1,569 1,661 1,410 1,305 1,601 1,923 1,557 1,520 1,402 1,520 1,481 1,420
Labor Force Participation Rate (%) Labor Force Participation Rate (%) 77.6 76.7 78.2 77.5 77.9 76.2 76.1 76.6 75.7 76.4 76.8 75.3 73.9
Employment Rate (%) Employment Rate (%) 94.4 94.0 93.8 94.7 95.1 94.0 92.7 94.2 94.3 94.8 94.4 94.5 94.6
Underemployment Rate (%) Underemployment Rate (%) 20.7 21.9 20.6 19.7 20.5 17.8 18.3 17.8 17.8 17.3 20.2 18.2 19.1
Visible Underemployment Rate (%) Visible Underemployment Rate (%) 11.0 11.0 11.5 10.6 11.0 9.9 10.8 10.9 9.0 9.1 11.4 9.5 8.1
Unemployment Rate (%) Unemployment Rate (%) 5.6 6.0 6.2 5.3 4.9 6.0 7.3 5.8 5.7 5.2 5.6 5.5 5.4
Household Population 15 Years Old and Over 34,127 33,867 34,131 34,238 34,269 34,887 34,662 34,801 35,028 35,056 35,377 35,424 35,685
Labor Force Labor Force 16,840 17,033 16,674 16,771 16,882 16,107 15,672 16,069 15,932 16,757 16,795 16,468 16,473
Employed Employed 15,963 16,147 15,709 15,849 16,147 15,267 14,834 15,183 15,078 15,973 15,995 15,588 15,569
At Work At Work 15,805 16,046 15,386 15,764 16,022 15,129 14,715 14,939 14,992 15,869 15,803 15,384 15,468
Less Than 40 Hours (Part-Time) Worked Less Than 40 Hours (Part-Time) 5,400 5,399 5,330 5,201 5,671 5,164 4,848 5,750 4,779 5,280 5,644 5,072 4,767
40 Hours and Over (Full-Time) Worked 40 Hours and Over (Full-Time) 10,404 10,648 10,056 10,563 10,351 9,964 9,866 9,189 10,213 10,589 10,159 10,312 10,701
With a Job But Not at Work 159 101 323 85 125 138 119 244 86 104 192 204 101
Underemployed Underemployed 2,337 2,594 2,279 2,201 2,273 2,040 1,906 2,003 2,069 2,183 2,283 2,318 2,223
Visibly 1
Visibly 1
1,396 1,492 1,423 1,317 1,353 1,251 1,191 1,303 1,177 1,333 1,469 1,330 1,268
Invisibly Invisibly 941 1,102 857 884 920 789 715 700 891 850 814 988 955
Unemployed Unemployed 877 886 965 922 735 840 838 886 854 783 800 880 904
Labor Force Participation Rate (%) Labor Force Participation Rate (%) 49.3 50.3 48.9 49.0 49.3 46.2 45.2 46.2 45.5 47.8 47.5 46.5 46.2
Employment Rate (%) Employment Rate (%) 94.8 94.8 94.2 94.5 95.6 94.8 94.7 94.5 94.6 95.3 95.2 94.7 94.5
Underemployment Rate (%) Underemployment Rate (%) 14.6 16.1 14.5 13.9 14.1 13.4 12.8 13.2 13.7 13.7 14.3 14.9 14.3
Visible Underemployment Rate (%) Visible Underemployment Rate (%) 8.7 9.2 9.1 8.3 8.4 8.2 8.0 8.6 7.8 8.3 9.2 8.5 8.1
Unemployment Rate (%) Unemployment Rate (%) 5.2 5.2 5.8 5.5 4.4 5.2 5.3 5.5 5.4 4.7 4.8 5.3 5.5
Notes: 1. Details may not add up to totals due to rounding.
2. Rates were computed based on actual figures.
3. Starting April 2016 round, the Labor Force Survey (LFS) adopted the 2013 Master Sample Design as well as the population projections based on the 2010 Census of Population and Housing (2010 CPH) while previous survey rounds
were derived using the 2000 CPH population projections.
4. January 2016 data reflected were based on the 2010 CPH population projections to compute for the annualized data for 2016.
1 Number of visibly underemployed persons includes the number of underemployed persons who were with jobs but did not work during the reference period.
p Preliminary.
Source of basic data: Philippine Statistics Authority, Labor Force Survey.
TABLE 3 - Household Population 15 Years Old and Over and Employment Status by Sex,
Philippines: 2016 - July 2018
(In Thousands Except Rates)
20182016
FEMALE
MALE
INDICATOR2017
5

Ave Jan Apr Jul Oct Ave Jan Apr Jul Oct Jan Apr p
Jul p
NATIONAL CAPITAL REGION
Household Population 15 Years Old and Over 8,919 8,887 8,907 8,921 8,961 9,087 9,021 9,053 9,119 9,155 9,142 9,134 9,226
Labor Force 5,613 5,608 5,594 5,602 5,647 5,552 5,531 5,480 5,520 5,676 5,542 5,463 5,538
Employed 5,239 5,221 5,188 5,239 5,306 5,141 5,062 5,088 5,083 5,329 5,108 5,112 5,199
Underemployed 458 510 449 475 397 479 602 479 377 459 368 462 414
Visibly 1
171 186 172 154 172 198 216 205 176 197 147 165 142
Unemployed 374 388 406 362 341 411 469 392 436 347 434 351 339
Labor Force Participation Rate (%) 62.9 63.1 62.8 62.8 63.0 61.1 61.3 60.5 60.5 62.0 60.6 59.8 60.0
Employment Rate (%) 93.3 93.1 92.7 93.5 94.0 92.6 91.5 92.8 92.1 93.9 92.2 93.6 93.9
Underemployment Rate (%) 8.7 9.8 8.6 9.1 7.5 9.3 11.9 9.4 7.4 8.6 7.2 9.0 8.0
Unemployment Rate (%) 6.7 6.9 7.3 6.5 6.0 7.4 8.5 7.2 7.9 6.1 7.8 6.4 6.1
CORDILLERA ADMINISTRATIVE REGION
Household Population 15 Years Old and Over 1,211 1,191 1,211 1,218 1,221 1,241 1,237 1,239 1,244 1,243 1,264 1,262 1,272
Labor Force 800 803 798 797 803 778 743 768 802 799 786 759 801
Employed 765 769 766 758 767 745 698 737 775 769 757 734 761
Underemployed 177 195 176 191 145 110 121 116 113 90 112 104 137
Visibly 1
81 87 93 80 66 52 60 51 52 43 54 43 62
Unemployed 35 33 32 39 36 33 45 32 27 29 29 25 40
Labor Force Participation Rate (%) 66.1 67.4 65.9 65.5 65.8 62.7 60.1 62.0 64.5 64.2 62.2 60.2 63.0
Employment Rate (%) 95.6 95.8 96.0 95.1 95.5 95.7 93.9 95.9 96.6 96.3 96.4 96.7 95.0
Underemployment Rate (%) 23.1 25.3 22.9 25.1 19.0 14.8 17.3 15.7 14.6 11.7 14.8 14.2 18.0
Unemployment Rate (%) 4.4 4.2 4.0 4.9 4.5 4.3 6.1 4.1 3.4 3.7 3.6 3.3 5.0
REGION I - ILOCOS REGION
Household Population 15 Years Old and Over 3,417 3,383 3,431 3,428 3,427 3,470 3,453 3,443 3,513 3,470 3,502 3,549 3,511
Labor Force 2,119 2,104 2,118 2,152 2,101 2,045 2,097 1,949 2,063 2,071 2,217 2,211 2,106
Employed 1,988 1,966 1,960 2,037 1,987 1,864 1,916 1,745 1,893 1,902 2,068 2,050 1,969
Underemployed 346 343 365 341 337 370 391 326 382 380 577 394 370
Visibly 1
220 194 235 211 240 215 270 223 202 167 321 221 201
Unemployed 131 138 158 116 114 181 182 203 170 169 148 161 136
Labor Force Participation Rate (%) 62.0 62.2 61.7 62.8 61.3 58.9 60.7 56.6 58.7 59.7 63.3 62.3 60.0
Employment Rate (%) 93.8 93.5 92.5 94.6 94.6 91.1 91.3 89.6 91.8 91.8 93.3 92.7 93.5
Underemployment Rate (%) 17.4 17.4 18.6 16.7 17.0 19.8 20.4 18.7 20.2 20.0 27.9 19.2 18.8
Unemployment Rate (%) 6.2 6.5 7.5 5.4 5.4 8.9 8.7 10.4 8.2 8.2 6.7 7.3 6.5
Notes: 1. Details may not add up to totals due to rounding.
2. Rates were computed based on actual figures.
3. Starting April 2016 round, the Labor Force Survey (LFS) adopted the 2013 Master Sample Design as well as the population projections based on the 2010 Census of Population and Housing (2010 CPH) while previous survey rounds were derived
using the 2000 CPH population projections.
4. January 2016 data reflected were based on the 2010 CPH population projections to compute for the annualized data for 2016.
p Preliminary.
1 Number of visibly underemployed persons includes the number of underemployed persons who were with jobs but did not work during the reference period.
TABLE 4 - Household Population 15 Years Old and Over and Employment Status by Region,
Philippines: 2016 - July 2018
(In Thousands Except Rates)
INDICATOR2016 2017 2018
6

Ave Jan Apr Jul Oct Ave Jan Apr Jul Oct Jan Apr p
Jul p
REGION II - CAGAYAN VALLEY
Household Population 15 Years Old and Over 2,327 2,315 2,305 2,336 2,352 2,366 2,362 2,364 2,378 2,361 2,389 2,402 2,405
Labor Force 1,529 1,545 1,468 1,541 1,562 1,499 1,505 1,479 1,468 1,545 1,560 1,556 1,502
Employed 1,482 1,502 1,424 1,487 1,515 1,452 1,430 1,432 1,434 1,513 1,495 1,520 1,462
Underemployed 190 246 150 138 224 197 229 230 115 214 370 317 231
Visibly 1
124 130 116 94 154 143 176 155 69 172 271 205 141
Unemployed 47 44 44 54 47 47 75 47 34 32 66 36 40
Labor Force Participation Rate (%) 65.7 66.8 63.7 66.0 66.4 63.4 63.7 62.6 61.7 65.4 65.3 64.8 62.4
Employment Rate (%) 96.9 97.2 97.0 96.5 97.0 96.8 95.0 96.8 97.7 97.9 95.8 97.7 97.3
Underemployment Rate (%) 12.8 16.4 10.5 9.3 14.8 13.6 16.0 16.0 8.0 14.2 24.8 20.8 15.8
Unemployment Rate (%) 3.1 2.8 3.0 3.5 3.0 3.2 5.0 3.2 2.3 2.1 4.2 2.3 2.7
REGION III - CENTRAL LUZON
Household Population 15 Years Old and Over 7,555 7,512 7,515 7,546 7,647 7,752 7,648 7,719 7,794 7,846 7,853 7,810 7,904
Labor Force 4,693 4,724 4,636 4,674 4,738 4,548 4,428 4,433 4,719 4,614 4,769 4,704 4,778
Employed 4,383 4,377 4,310 4,378 4,468 4,247 4,130 4,135 4,385 4,338 4,511 4,451 4,476
Underemployed 706 655 675 619 873 485 653 401 451 435 517 612 532
Visibly 1
328 294 335 306 377 238 294 210 221 228 252 244 243
Unemployed 310 347 326 296 270 302 298 298 335 276 257 253 302
Labor Force Participation Rate (%) 62.1 62.9 61.7 61.9 62.0 58.7 57.9 57.4 60.5 58.8 60.7 60.2 60.5
Employment Rate (%) 93.4 92.7 93.0 93.7 94.3 93.4 93.3 93.3 92.9 94.0 94.6 94.6 93.7 Underemployment Rate (%) 16.1 15.0 15.7 14.1 19.5 11.5 15.8 9.7 10.3 10.0 11.5 13.8 11.9
Unemployment Rate (%) 6.6 7.3 7.0 6.3 5.7 6.6 6.7 6.7 7.1 6.0 5.4 5.4 6.3
REGION IV-A - CALABARZON
Household Population 15 Years Old and Over 9,539 9,479 9,537 9,520 9,618 9,787 9,733 9,721 9,840 9,855 9,973 10,062 10,153
Labor Force 6,125 6,162 6,168 5,982 6,190 6,235 6,150 6,188 6,143 6,457 6,276 6,249 6,329
Employed 5,687 5,711 5,703 5,521 5,814 5,800 5,645 5,747 5,716 6,092 5,852 5,838 5,930
Underemployed 887 1,161 893 594 902 810 836 663 824 917 764 743 859
Visibly 1
430 523 437 325 434 412 432 420 362 435 418 363 348
Unemployed 438 452 465 460 375 435 505 441 427 365 423 412 399
Labor Force Participation Rate (%) 64.2 65.0 64.7 62.8 64.4 63.7 63.2 63.7 62.4 65.5 62.9 62.1 62.3
Employment Rate (%) 92.8 92.7 92.5 92.3 93.9 93.0 91.8 92.9 93.0 94.3 93.3 93.4 93.7
Underemployment Rate (%) 15.6 20.3 15.7 10.8 15.5 14.0 14.8 11.5 14.4 15.1 13.1 12.7 14.5
Unemployment Rate (%) 7.2 7.3 7.5 7.7 6.1 7.0 8.2 7.1 7.0 5.7 6.7 6.6 6.3
Notes: 1. Details may not add up to totals due to rounding.
2. Rates were computed based on actual figures.
3. Starting April 2016 round, the Labor Force Survey (LFS) adopted the 2013 Master Sample Design as well as the population projections based on the 2010 Census of Population and Housing (2010 CPH) while previous survey
rounds were derived using the 2000 CPH population projections.
4. January 2016 data reflected were based on the 2010 CPH population projections to compute for the annualized data for 2016.
p Preliminary.
1 Number of visibly underemployed persons includes the number of underemployed persons who were with jobs but did not work during the reference period.
TABLE 4 - Household Population 15 Years Old and Over and Employment Status by Region,
Philippines: 2016 - July 2018 (Continued)
(In Thousands Except Rates)
INDICATOR2016 2017 2018
7
Ave Jan Apr Jul Oct Ave Jan Apr Jul Oct Jan Apr p
Jul p
MIMAROPA Region
Household Population 15 Years Old and Over 1,997 1,976 1,998 2,006 2,009 2,047 2,039 2,039 2,052 2,060 2,077 2,093 2,101
Labor Force 1,305 1,309 1,308 1,275 1,327 1,309 1,243 1,295 1,304 1,396 1,369 1,296 1,277
Employed 1,252 1,258 1,255 1,221 1,274 1,247 1,157 1,234 1,252 1,344 1,315 1,229 1,211
Underemployed 273 328 221 326 217 296 241 272 388 282 295 271 279
Visibly 1
171 230 128 186 138 192 179 189 205 196 219 172 128
Unemployed 53 52 54 55 54 63 85 61 53 52 55 67 65
Labor Force Participation Rate (%) 65.3 66.3 65.5 63.6 66.1 64.0 61.0 63.5 63.6 67.8 65.9 61.9 60.8
Employment Rate (%) 95.9 96.1 95.9 95.7 96.0 95.2 93.1 95.3 96.0 96.2 96.0 94.8 94.9
Underemployment Rate (%) 21.8 26.1 17.6 26.7 17.0 23.7 20.8 22.1 31.0 21.0 22.4 22.1 23.0
Unemployment Rate (%) 4.1 3.9 4.1 4.3 4.0 4.8 6.9 4.7 4.0 3.8 4.0 5.2 5.1
REGION V - BICOL REGION
Household Population 15 Years Old and Over 3,904 3,883 3,904 3,918 3,912 4,017 3,996 4,006 4,029 4,039 4,079 4,080 4,147
Labor Force 2,444 2,423 2,522 2,397 2,432 2,414 2,359 2,369 2,401 2,525 2,528 2,551 2,393
Employed 2,331 2,298 2,397 2,301 2,327 2,303 2,238 2,272 2,294 2,410 2,427 2,426 2,242
Underemployed 705 758 781 581 698 637 466 526 764 790 820 837 627
Visibly 1
453 456 535 370 450 398 360 376 407 449 543 509 294
Unemployed 113 125 125 96 105 110 122 97 107 115 101 125 152
Labor Force Participation Rate (%) 62.6 62.4 64.6 61.2 62.2 60.1 59.0 59.1 59.6 62.5 62.0 62.5 57.7
Employment Rate (%) 95.4 94.8 95.0 96.0 95.7 95.4 94.8 95.9 95.5 95.4 96.0 95.1 93.7
Underemployment Rate (%) 30.2 33.0 32.6 25.2 30.0 27.5 20.8 23.2 33.3 32.8 33.8 34.5 28.0
Unemployment Rate (%) 4.6 5.2 5.0 4.0 4.3 4.6 5.2 4.1 4.5 4.6 4.0 4.9 6.3
REGION VI - WESTERN VISAYAS
Household Population 15 Years Old and Over 5,249 5,241 5,241 5,248 5,265 5,354 5,315 5,350 5,382 5,368 5,439 5,439 5,474
Labor Force 3,369 3,366 3,292 3,466 3,352 3,297 3,313 3,280 3,350 3,245 3,371 3,362 3,333
Employed 3,208 3,211 3,077 3,299 3,244 3,119 3,116 3,081 3,218 3,062 3,204 3,181 3,142
Underemployed 618 592 631 651 598 521 509 616 541 419 734 556 665
Visibly 1
360 322 359 402 357 314 315 378 294 270 381 354 295
Unemployed 162 155 216 167 108 178 196 200 133 183 166 181 191
Labor Force Participation Rate (%) 64.2 64.2 62.8 66.0 63.7 61.6 62.3 61.3 62.3 60.4 62.0 61.8 60.9
Employment Rate (%) 95.2 95.4 93.5 95.2 96.8 94.6 94.1 93.9 96.0 94.4 95.1 94.6 94.3
Underemployment Rate (%) 19.3 18.4 20.5 19.7 18.4 16.7 16.3 20.0 16.8 13.7 22.9 17.5 21.2
Unemployment Rate (%) 4.8 4.6 6.5 4.8 3.2 5.4 5.9 6.1 4.0 5.6 4.9 5.4 5.7
Notes: 1. Details may not add up to totals due to rounding.
2. Rates were computed based on actual figures.
3. Starting April 2016 round, the Labor Force Survey (LFS) adopted the 2013 Master Sample Design as well as the population projections based on the 2010 Census of Population and Housing (2010 CPH) while previous survey rounds
were derived using the 2000 CPH population projections.
4. January 2016 data reflected were based on the 2010 CPH population projections to compute for the annualized data for 2016.
p Preliminary.
1 Number of visibly underemployed persons includes the number of underemployed persons who were with jobs but did not work during the reference period.
INDICATOR2016 2017 2018
TABLE 4 - Household Population 15 years Old and Over and Employment Status by Region,
Philippines: 2016 - July 2018 (Continued)
(In Thousands Except Rates)
8

Ave Jan Apr Jul Oct Ave Jan Apr Jul Oct Jan Apr p
Jul p
REGION VII - CENTRAL VISAYAS
Household Population 15 Years Old and Over 5,083 5,053 5,060 5,114 5,106 5,193 5,173 5,176 5,212 5,210 5,280 5,264 5,309
Labor Force 3,401 3,307 3,442 3,340 3,512 3,378 3,423 3,481 3,290 3,316 3,334 3,251 3,171
Employed 3,234 3,127 3,287 3,183 3,338 3,224 3,270 3,307 3,141 3,179 3,141 3,066 3,012
Underemployed 477 551 449 437 469 566 461 614 564 624 766 490 444
Visibly 1
260 283 266 224 265 269 272 320 224 258 381 218 219
Unemployed 167 181 155 157 175 154 153 175 150 137 193 185 159
Labor Force Participation Rate (%) 66.9 65.4 68.0 65.3 68.8 65.1 66.2 67.3 63.1 63.6 63.1 61.8 59.7
Employment Rate (%) 95.1 94.5 95.5 95.3 95.0 95.5 95.5 95.0 95.5 95.9 94.2 94.3 95.0
Underemployment Rate (%) 14.7 17.6 13.7 13.7 14.1 17.6 14.1 18.6 17.9 19.6 24.4 16.0 14.7
Unemployment Rate (%) 4.9 5.5 4.5 4.7 5.0 4.5 4.5 5.0 4.5 4.1 5.8 5.7 5.0
REGION VIII - EASTERN VISAYAS
Household Population 15 Years Old and Over 3,006 2,980 3,002 3,023 3,020 3,084 3,069 3,081 3,084 3,102 3,137 3,152 3,158
Labor Force 1,874 1,819 1,907 1,943 1,827 1,860 1,724 1,978 1,871 1,869 1,932 1,992 1,951
Employed 1,790 1,737 1,794 1,858 1,771 1,778 1,614 1,903 1,795 1,799 1,862 1,901 1,859
Underemployed 535 472 532 582 552 403 374 457 394 386 361 453 506
Visibly 1
331 304 351 358 312 272 251 334 267 238 264 267 260
Unemployed 84 82 112 85 55 82 110 75 75 69 71 91 92
Labor Force Participation Rate (%) 62.3 61.1 63.5 64.3 60.5 60.3 56.2 64.2 60.7 60.2 61.6 63.2 61.8
Employment Rate (%) 95.5 95.5 94.1 95.6 97.0 95.5 93.6 96.2 96.0 96.3 96.3 95.4 95.3
Underemployment Rate (%) 29.9 27.2 29.7 31.3 31.2 22.6 23.2 24.0 21.9 21.4 19.4 23.8 27.2
Unemployment Rate (%) 4.5 4.5 5.9 4.4 3.0 4.5 6.4 3.8 4.0 3.7 3.7 4.6 4.7
REGION IX - ZAMBOANGA PENINSULA
Household Population 15 Years Old and Over 2,503 2,484 2,504 2,521 2,504 2,559 2,541 2,548 2,567 2,582 2,609 2,615 2,616
Labor Force 1,600 1,589 1,588 1,578 1,645 1,496 1,430 1,551 1,481 1,523 1,548 1,429 1,425
Employed 1,540 1,529 1,521 1,505 1,603 1,437 1,364 1,512 1,414 1,458 1,496 1,369 1,352
Underemployed 346 346 276 312 449 249 210 357 295 135 241 208 349
Visibly 1
199 197 185 203 209 174 156 253 200 89 180 130 168
Unemployed 60 59 67 72 42 59 66 39 67 65 52 61 72
Labor Force Participation Rate (%) 63.9 64.0 63.4 62.6 65.7 58.5 56.3 60.9 57.7 59.0 59.3 54.7 54.5
Employment Rate (%) 96.2 96.3 95.8 95.4 97.5 96.0 95.4 97.5 95.5 95.7 96.6 95.8 94.9
Underemployment Rate (%) 22.5 22.6 18.2 20.8 28.0 17.3 15.4 23.6 20.8 9.2 16.1 15.2 25.8
Unemployment Rate (%) 3.8 3.7 4.2 4.6 2.5 4.0 4.6 2.5 4.5 4.3 3.4 4.2 5.1
Notes: 1. Details may not add up to totals due to rounding.
2. Rates were computed based on actual figures.
3. Starting April 2016 round, the Labor Force Survey (LFS) adopted the 2013 Master Sample Design as well as the population projections based on the 2010 Census of Population and Housing (2010 CPH) while previous survey rounds
were derived using the 2000 CPH population projections.
4. January 2016 data reflected were based on the 2010 CPH population projections to compute for the annualized data for 2016.
p Preliminary.
1 Number of visibly underemployed persons includes the number of underemployed persons who were with jobs but did not work during the reference period.
INDICATOR2016 2017 2018
TABLE 4 - Household Population 15 Years Old and Over and Employment Status by Region,
Philippines: 2016 - July 2018 (Continued)(In Thousands Except Rates)
9

Ave Jan Apr Jul Oct Ave Jan Apr Jul Oct Jan Apr p
Jul p
REGION X - NORTHERN MINDANAO
Household Population 15 Years Old and Over 3,172 3,160 3,154 3,179 3,196 3,254 3,224 3,239 3,267 3,286 3,301 3,305 3,321
Labor Force 2,115 2,046 2,141 2,124 2,150 2,076 2,031 2,097 1,966 2,208 2,377 2,180 2,059
Employed 2,004 1,939 2,019 1,998 2,061 1,966 1,920 1,985 1,855 2,103 2,305 2,068 1,953
Underemployed 559 485 561 639 550 365 363 380 288 429 485 425 459
Visibly 1
326 265 350 350 338 249 250 265 174 307 356 270 243
Unemployed 111 107 121 127 89 110 111 112 111 105 72 111 106
Labor Force Participation Rate (%) 66.7 64.7 67.9 66.8 67.3 63.8 63.0 64.7 60.2 67.2 72.0 66.0 62.0
Employment Rate (%) 94.8 94.8 94.3 94.0 95.8 94.7 94.5 94.6 94.3 95.3 97.0 94.9 94.8
Underemployment Rate (%) 27.9 25.0 27.8 32.0 26.7 18.5 18.9 19.2 15.5 20.4 21.0 20.5 23.5
Unemployment Rate (%) 5.2 5.2 5.7 6.0 4.2 5.3 5.5 5.4 5.7 4.7 3.0 5.1 5.2
REGION XI - DAVAO REGION
Household Population 15 Years Old and Over 3,355 3,331 3,342 3,362 3,387 3,438 3,411 3,434 3,440 3,468 3,479 3,488 3,517
Labor Force 2,111 2,145 2,071 2,132 2,097 2,157 2,106 2,197 2,062 2,265 2,163 2,079 2,075
Employed 2,016 2,040 1,961 2,041 2,024 2,052 1,980 2,090 1,964 2,175 2,061 1,968 2,006
Underemployed 339 409 326 325 296 365 290 362 346 461 367 372 341
Visibly 1
157 204 145 156 123 176 161 204 151 188 186 184 158
Unemployed 95 105 110 91 73 105 125 107 98 90 101 111 69
Labor Force Participation Rate (%) 62.9 64.4 62.0 63.4 61.9 62.7 61.7 64.0 59.9 65.3 62.2 59.6 59.0
Employment Rate (%) 95.5 95.1 94.7 95.7 96.5 95.1 94.1 95.1 95.3 96.0 95.3 94.6 96.7
Underemployment Rate (%) 16.8 20.0 16.6 15.9 14.6 17.7 14.6 17.3 17.6 21.2 17.8 18.9 17.0
Unemployment Rate (%) 4.5 4.9 5.3 4.3 3.5 4.9 5.9 4.9 4.7 4.0 4.7 5.4 3.3
REGION XII - SOCCSKSARGEN
Household Population 15 Years Old and Over 3,008 2,984 2,997 3,021 3,031 3,086 3,067 3,078 3,080 3,119 3,131 3,133 3,150
Labor Force 1,933 1,919 1,919 1,932 1,963 1,919 1,926 1,872 1,887 1,992 1,954 1,894 1,943
Employed 1,854 1,846 1,803 1,865 1,900 1,843 1,844 1,792 1,813 1,924 1,880 1,801 1,878
Underemployed 440 441 403 536 381 331 393 304 345 281 337 283 350
Visibly 1
266 262 266 327 208 214 250 187 221 196 181 153 186
Unemployed 79 73 116 67 62 76 83 80 74 67 74 93 65
Labor Force Participation Rate (%) 64.3 64.3 64.0 64.0 64.8 62.2 62.8 60.8 61.3 63.8 62.4 60.4 61.7
Employment Rate (%) 95.9 96.2 94.0 96.6 96.8 96.0 95.7 95.7 96.1 96.6 96.2 95.1 96.7
Underemployment Rate (%) 23.7 23.9 22.4 28.7 20.0 18.0 21.3 16.9 19.0 14.6 17.9 15.7 18.6
Unemployment Rate (%) 4.1 3.8 6.0 3.4 3.2 4.0 4.3 4.3 3.9 3.4 3.8 4.9 3.3
Notes: 1. Details may not add up to totals due to rounding.
2. Rates were computed based on actual figures.
3. Starting April 2016 round, the Labor Force Survey (LFS) adopted the 2013 Master Sample Design as well as the population projections based on the 2010 Census of Population and Housing (2010 CPH) while previous survey rounds were derived using
the 2000 CPH population projections.
4. January 2016 data reflected were based on the 2010 CPH population projections to compute for the annualized data for 2016.
p Preliminary.
1 Number of visibly underemployed persons includes the number of underemployed persons who were with jobs but did not work during the reference period.
INDICATOR2016 2017 2018
TABLE 4 - Household Population 15 Years Old and Over and Employment Status by Region,
Philippines: 2016 - April 2018 (Continued)
(In Thousands Except Rates)
10

Ave Jan Apr Jul Oct Ave Jan Apr Jul Oct Jan Apr p
Jul p
CARAGA
Household Population 15 Years Old and Over 1,798 1,786 1,796 1,806 1,803 1,844 1,830 1,843 1,851 1,853 1,875 1,872 1,896
Labor Force 1,143 1,133 1,174 1,129 1,137 1,145 1,082 1,201 1,141 1,155 1,257 1,237 1,185
Employed 1,086 1,062 1,107 1,079 1,097 1,087 991 1,145 1,099 1,113 1,207 1,185 1,138
Underemployed 304 326 347 290 254 251 187 267 298 252 298 348 293
Visibly 1
183 178 211 158 184 171 138 188 174 184 205 209 154
Unemployed 57 71 67 49 40 58 92 56 42 42 50 52 47
Labor Force Participation Rate (%) 63.6 63.5 65.3 62.5 63.1 62.1 59.2 65.2 61.7 62.3 67.1 66.1 62.5
Employment Rate (%) 95.0 93.7 94.3 95.6 96.5 94.9 91.5 95.3 96.3 96.3 96.0 95.8 96.0
Underemployment Rate (%) 28.0 30.7 31.4 26.9 23.1 23.0 18.9 23.3 27.1 22.7 24.7 29.4 25.8
Unemployment Rate (%) 5.0 6.3 5.7 4.4 3.5 5.1 8.5 4.7 3.7 3.7 4.0 4.2 4.0
AUTONOMOUS REGION IN MUSLIM
MINDANAO
Household Population 15 Years Old and Over 2,266 2,244 2,262 2,274 2,284 2,311 2,296 2,272 2,312 2,364 2,369 2,354 2,401
Labor Force 1,187 1,140 1,145 1,220 1,242 1,066 1,018 1,095 1,075 1,077 1,092 1,042 1,116
Employed 1,140 1,096 1,093 1,182 1,190 1,029 974 1,066 1,040 1,036 1,064 998 1,068
Underemployed 154 157 195 97 169 72 71 100 57 62 86 58 149
Visibly 1
91 75 102 61 125 51 57 69 41 36 58 33 59
Unemployed 47 44 52 38 53 37 44 28 35 40 29 43 48
Labor Force Participation Rate (%) 52.4 50.8 50.6 53.7 54.4 46.1 44.3 48.2 46.5 45.6 46.1 44.3 46.5
Employment Rate (%) 96.1 96.1 95.5 96.9 95.8 96.5 95.7 97.4 96.8 96.2 97.4 95.8 95.7
Underemployment Rate (%) 13.5 14.3 17.8 8.2 14.2 7.0 7.3 9.4 5.5 5.9 8.1 5.8 13.9
Unemployment Rate (%) 3.9 3.9 4.5 3.1 4.2 3.5 4.3 2.6 3.2 3.8 2.6 4.2 4.3
Notes: 1. Details may not add up to totals due to rounding.
2. Rates were computed based on actual figures.
3. Starting April 2016 round, the Labor Force Survey (LFS) adopted the 2013 Master Sample Design as well as the population projections based on the 2010 Census of Population and Housing (2010 CPH) while previous survey
rounds were derived using the 2000 CPH population projections.
4. January 2016 data reflected were based on the 2010 CPH population projections to compute for the annualized data for 2016.
1 Number of visibly underemployed persons includes the number of underemployed persons who were with jobs but did not work during the reference period.
Source of basic data: Philippine Statistics Authority, Labor Force Survey.
TABLE 4 - Household Population 15 Years Old and Over and Employment Status by Region,
Philippines: 2016 - July 2018 (Continued)
(In Thousands Except Rates)
2018INDICATOR
2016 2017
11

Ave Jan Apr Jul Oct Ave Jan Apr Jul Oct Jan Apr p
Jul p
ALL INDUSTRIES 40,998 40,689 40,664 40,954 41,685 40,334 39,347 40,271 40,171 41,547 41,755 40,896 40,659
11,064 10,909 10,389 11,156 11,801 10,261 10,028 10,514 10,129 10,373 10,870 9,791 9,392
Agriculture, Hunting and Forestry 9,801 9,618 9,087 9,895 10,605 9,066 8,871 9,271 8,909 9,214 9,842 8,688 8,119
Fishing and Aquaculture 1,263 1,291 1,303 1,261 1,196 1,194 1,157 1,242 1,219 1,159 1,027 1,103 1,273
7,159 6,836 7,391 7,280 7,130 7,370 6,836 7,433 7,714 7,498 7,552 8,038 7,886
Mining and Quarrying 219 214 215 227 219 203 179 223 204 208 215 215 205
Manufacturing 3,404 3,388 3,476 3,374 3,378 3,481 3,280 3,533 3,497 3,615 3,549 3,644 3,639
Electricity, Gas, Steam and Air Conditioning Supply 91 87 97 104 77 80 87 75 71 86 102 101 73
Water Supply; Sewerage, Waste Management and
Remediation Activities 68 59 75 71 65 69 74 57 80 64 46 65 75
Construction 3,378 3,088 3,528 3,503 3,391 3,537 3,215 3,544 3,863 3,525 3,640 4,012 3,894
22,775 22,944 22,884 22,518 22,754 22,703 22,483 22,325 22,329 23,676 23,334 23,067 23,381
Wholesale and Retail Trade; Repair of Motor Vehicles
and Motorcycles 8,039 7,672 8,337 8,100 8,048 7,900 7,909 7,882 7,564 8,244 8,273 7,909 7,803
Transportation and Storage 3,038 3,045 2,960 3,094 3,052 3,127 3,070 3,095 3,078 3,267 3,314 3,176 3,222
Accommodation and Food Service Activities 1,777 1,819 1,766 1,723 1,802 1,740 1,679 1,708 1,730 1,842 1,717 1,642 1,693
Information and Communication 366 390 382 362 333 397 367 423 408 388 366 433 417
Financial and Insurance Activities 514 490 524 517 524 506 499 504 496 526 492 562 579
Real Estate Activities 193 234 204 171 163 186 169 170 197 208 211 185 221
Professional, Scientific and Technical Activities 213 226 231 199 194 247 246 249 232 262 228 300 280
Administrative and Support Service Activities 1,371 1,261 1,371 1,337 1,515 1,475 1,458 1,487 1,402 1,553 1,587 1,589 1,594
Public Administration and Defense;
Compulsory Social Security 2,196 2,306 2,171 2,119 2,187 2,408 2,367 2,245 2,543 2,478 2,414 2,511 2,625
Education 1,304 1,385 1,216 1,318 1,297 1,204 1,222 1,131 1,195 1,270 1,187 1,103 1,235
Human Health and Social Work Activities 502 516 497 483 510 484 502 482 468 486 484 543 527
Arts, Entertainment and Recreation 361 431 371 301 342 325 314 345 292 351 360 395 352
Other Service Activities (includes Activities of
Households as Employers; Undifferentiated
Goods and Services-producing Activities of
Households for Own Use) 2,898 3,165 2,848 2,791 2,787 2,701 2,680 2,602 2,723 2,799 2,697 2,716 2,831
Activities of Extraterritorial Organizations and Bodies 3 4 5 3 1 2 1 2 1 3 4 4 2
Notes: 1. Details may not add up to totals due to rounding.
2. Industry classification is based on the 2009 Philippine Statandard Industrial Classification (PSIC).
3. Starting April 2016 round, the Labor Force Survey (LFS) adopted the 2013 Master Sample Design as well as the population projections based on the 2010 Census of Population and Housing (2010 CPH) while previous survey rounds were derived
using the 2000 CPH population projections.
4. January 2016 data reflected were based on the 2010 CPH population projections to compute for the annualized data for 2016.
p Preliminary.
Source: Philippine Statistics Authority, Labor Force Survey.
TABLE 5 - Employed Persons by Major Industry Group, Philippines: 2016 - July 2018(In Thousands)
20182016 2017
Services
MAJOR INDUSTRY GROUP
Agriculture
Industry
12

Ave Jan Apr Jul Oct Ave Jan Apr Jul Oct Jan Apr p
Jul p
ALL OCCUPATIONS 40,998 40,689 40,664 40,954 41,685 40,334 39,347 40,271 40,171 41,547 41,755 40,896 40,659
Managers 6,992 6,974 6,986 7,068 6,940 6,490 6,607 6,575 6,138 6,640 6,785 6,542 6,429
Professionals 1,973 1,698 2,053 2,078 2,072 2,149 2,145 2,089 2,105 2,257 2,203 2,197 2,263
Technicians and Associate Professionals 1,296 866 1,508 1,375 1,429 1,533 1,436 1,450 1,563 1,685 1,535 1,679 1,767
Clerical Support Workers 1,798 569 2,166 2,125 2,331 2,283 2,155 2,256 2,282 2,440 2,347 2,405 2,332
Service and Sales Workers 5,930 4,811 6,382 6,213 6,315 6,069 6,076 6,039 5,813 6,348 6,156 6,056 6,115
Skilled Agricultural, Forestry and Fishery Workers 5,108 4,697 4,884 5,324 5,524 5,426 5,253 5,436 5,427 5,588 5,477 5,095 4,818
Craft and Related Trades Workers 2,879 1,780 3,345 3,261 3,132 3,198 3,191 3,003 3,376 3,219 2,966 3,411 3,347
Plant and Machine Operators and Assemblers 2,239 1,732 2,452 2,376 2,397 2,552 2,397 2,551 2,635 2,626 2,656 2,555 2,639
Elementary Occupations 11,267 11,780 10,794 11,032 11,463 10,538 9,982 10,784 10,756 10,630 11,536 10,877 10,833
Armed Forces Occupations and Special Occupations 100 121 95 100 82 95 105 88 74 113 94 80 116
Others 1,415 5,662 - - - - - - - - - - -
Notes: 1. Details may not add up to totals due to rounding.
2. Starting April 2016, the LFS used the occupational classification based on the 2012 Philippine Standards Occupational Classification wherein some occupations were transferred to other major classificaton groups.
3. Starting April 2016 round, the Labor Force Survey (LFS) adopted the population projections based on the 2010 Census of Population and Housing (2010 CPH) while previous survey
rounds were derived using 2000 CPH population projection.
4. January 2016 data reflected were based on the 2010 CPH population projections. Also, occupations were re-classified to conform to 2012 PSOC to compute for the annualized data for 2016.
p Preliminary.
Source: Philippine Statistics Authority, Labor Force Survey.
MAJOR OCCUPATION GROUP2016 2017 2018
TABLE 6 - Employed Persons by Major Occupation Group, Philippines: 2016 - July 2018
(In Thousands)
13
Ave Jan Apr July Oct Ave Jan Apr July Oct Jan Apr p
Jul p
ALL CLASSES OF WORKERS 40,998 40,689 40,664 40,954 41,685 40,334 39,347 40,271 40,171 41,547 41,755 40,896 40,659
Wage and Salary Workers 25,240 25,599 25,065 25,047 25,248 25,209 24,712 24,699 25,555 25,868 25,776 26,079 26,567
Worked for Private Household 2,096 2,315 2,042 2,020 2,009 1,925 1,905 1,804 1,971 2,018 1,916 1,923 2,030
Worked for Private Establishment 19,694 19,654 19,667 19,605 19,848 19,776 19,310 19,640 19,978 20,177 20,327 20,558 20,721
Worked with Pay in Own Family-operated
Farm or Business 132 148 150 121 110 119 119 100 113 145 137 146 128
Worked for Government/Government
Corporation 3,317 3,482 3,206 3,300 3,281 3,388 3,377 3,155 3,493 3,528 3,396 3,452 3,688
Self-employed without Any
Paid Employee 11,097 10,650 10,896 11,322 11,521 11,198 10,706 11,370 11,129 11,586 11,581 11,132 10,650
Employer in Own Family-operated
Farm or Business 1,376 1,404 1,343 1,437 1,319 1,491 1,461 1,505 1,393 1,604 1,506 1,517 1,554
Without Pay in Own-Family-operated
Farm or Business (Unpaid
Family Workers) 3,285 3,037 3,360 3,148 3,597 2,437 2,468 2,697 2,094 2,488 2,893 2,168 1,888
Notes: 1. Details may not add up to totals due to rounding.
2. Starting April 2016 round, the Labor Force Survey (LFS) adopted the 2013 Master Sample Design as well as the population projections based on the 2010 Census of Population
and Housing (2010 CPH) while the previous survey round used 2000 CPH as population projection benchmark.
3. January 2016 data reflected were based on the 2010 Census-based population projections to compute for the annualized data for 2016.
p Preliminary.
Source : Philippine Statistics Authority, Labor Force Survey.
2018
TABLE 7 - Employed Persons by Class of Workers, Philippines: 2016 - July 2018
2016
2017
14

Ave Jan Apr July Oct Ave Jan Apr Jul Oct Jan Apr p
Jul p
40,998 40,689 40,664 40,954 41,685 40,334 39,347 40,271 40,171 41,547 41,755 40,896 40,659
At Work 40,600 40,421 39,896 40,729 41,352 39,964 38,944 39,712 39,946 41,255 41,243 40,465 40,431
Worked Less Than 40 Hours 13,361 13,040 13,350 13,087 13,967 13,650 13,441 15,215 12,640 13,304 14,690 12,671 11,466
Less Than 20 Hours 5,298 5,168 5,499 4,848 5,675 5,577 5,811 5,817 4,971 5,711 6,443 5,297 4,755
20 - 29 Hours 4,080 3,937 4,118 4,069 4,195 4,138 3,962 4,841 3,880 3,868 4,225 3,771 3,489
30 - 39 Hours 3,984 3,935 3,734 4,170 4,096 3,935 3,669 4,557 3,789 3,725 4,023 3,604 3,222
Worked 40 Hours and Over 27,239 27,381 26,546 27,642 27,386 26,314 25,503 24,497 27,306 27,951 26,552 27,794 28,964
40 - 48 Hours 17,916 17,930 17,284 18,136 18,312 17,708 16,946 16,376 18,589 18,919 17,907 18,942 19,849
49 and Over 9,323 9,451 9,263 9,506 9,073 8,607 8,557 8,122 8,717 9,032 8,645 8,852 9,116
With a Job, Not at Work 398 268 768 225 332 370 404 559 225 292 512 430 228
Mean Hours Worked 42.2 42.5 42.2 42.6 41.7 41.4 41.3 40.3 42.2 41.7 40.6 42.0 43.0
Notes: 1. Details may not add up to totals due to rounding.
4. Starting April 2016 round, the Labor Force Survey (LFS) adopted the 2013 Master Sample Design as well as the population projections based on the 2010 Census of Population 2. Starting April 2016 round, the Labor Force Survey (LFS) adopted the 2013 Master Sample Design as well as the population projections based on the 2010 Census of Population
5. Annualized data for 2016 refer to the average of four survey rounds using January 2016 data based on the 2010 Census-based Population Projection. and Housing (2010 CPH) while the previous survey round used 2000 CPH as population projection benchmark.
3. January 2016 data reflected were based on the 2010 Census-based population projections to compute for the annualized data for 2016.
p Preliminary.
Source of basic data: Philippine Statistics Authority, Labor Force Survey.
2017
TOTAL EMPLOYED PERSONS
2018
TABLE 8 - Employed Persons by Number of Hours Worked Per Week, Philippines: 2016 - July 2018
NUMBER OF HOURS WORKED2016
15

Ave Jan Apr July Oct Ave Jan Apr Jul Oct Jan Apr p
Jul p
40,998 40,689 40,664 40,954 41,685 40,334 39,347 40,271 40,171 41,547 41,755 40,896 40,659
Male 25,035 24,542 24,955 25,104 25,538 25,067 24,514 25,088 25,093 25,573 25,760 25,308 25,089
Female 15,963 16,147 15,709 15,849 16,147 15,267 14,834 15,183 15,078 15,973 15,995 15,588 15,569 -
ALL AGE GROUPS 40,998 40,689 40,664 40,954 41,685 40,334 39,347 40,271 40,171 41,547 41,755 40,896 40,659
15 - 24 Years 7,265 6,897 7,506 7,187 7,472 6,780 6,590 6,899 6,504 7,125 7,014 6,766 6,314
25 - 34 Years 10,592 10,453 10,499 10,636 10,781 10,783 10,466 10,671 10,827 11,170 11,117 10,993 10,917
35 - 44 Years 9,346 9,415 9,159 9,327 9,484 9,223 9,096 9,158 9,253 9,386 9,560 9,322 9,416
45 - 54 Years 7,561 7,581 7,448 7,600 7,616 7,485 7,310 7,484 7,513 7,635 7,697 7,602 7,662
55 - 64 Years 4,398 4,456 4,249 4,433 4,453 4,376 4,246 4,373 4,397 4,489 4,543 4,415 4,509
65 Years & Over 1,834 1,887 1,802 1,771 1,878 1,686 1,639 1,685 1,677 1,742 1,823 1,798 1,840
Age Not Reported 1 - 1 - 1 * - * 1 * 1 - 1 -
TOTAL 40,998 40,689 40,664 40,954 41,685 40,334 39,347 40,271 40,171 41,547 41,755 40,896 40,659
No Grade Completed 574 608 523 593 574 599 651 583 595 565 650 573 626 -
Elementary 11,148 11,322 10,818 11,324 11,126 10,717 10,598 10,860 10,670 10,739 11,101 10,495 10,666
Undergraduate 5,793 5,749 5,462 5,987 5,972 5,763 5,655 5,891 5,736 5,773 5,934 5,065 5,275
Graduate 5,355 5,572 5,355 5,337 5,154 4,954 4,943 4,970 4,934 4,966 5,167 5,429 5,390 -
SPED 2 NA NA 5 1 - - - - - - - -
Undergraduate 1 NA NA 1 1 - - - - - - - -
Graduate 1 NA NA 4 - - - - - - - - - - -
High School 17,030 16,504 17,005 17,011 17,605 - - - - - - - -
Undergraduate 5,240 5,099 5,120 5,228 5,514 - - - - - - - -
Graduate 11,790 11,404 11,885 11,783 12,091 - - - - - - - -
Junior High School - - - - - 16,588 15,926 16,640 16,771 17,013 17,310 16,700 16,309
Undergraduate - - - - - 5,164 4,892 5,173 5,207 5,383 5,283 5,069 5,184
Graduate - - - - - 11,424 11,033 11,467 11,564 11,630 12,027 11,631 11,125
Senior High School - - - - - 105 4 148 103 164 146 439 408 Undergraduate - - - - - 100 2 142 97 157 136 240 160 Graduate - - - - - 5 2 6 5 7 10 199 248
Post Secondary 2,014 1,888 1,652 2,334 2,178 1,907 2,018 1,939 1,711 1,962 1,875 1,671 1,610
Undergraduate 255 301 219 267 232 226 251 195 195 261 195 163 273
Graduate 1,759 1,587 1,433 2,067 1,946 1,682 1,767 1,743 1,516 1,701 1,680 1,508 1,337
College 10,231 10,367 10,667 9,686 10,201 10,419 10,150 10,101 10,322 11,103 10,673 11,017 11,040
Undergraduate 3,877 3,661 3,962 3,793 4,101 4,171 3,991 4,063 4,216 4,413 4,262 5,073 5,367
Graduate and Higher 6,354 6,706 6,706 5,893 6,100 6,248 6,159 6,038 6,105 6,690 6,411 5,944 5,673
Notes: 1. Details may not add up to totals due to rounding.
2. Starting April 2016 round, the Labor Force Survey (LFS) adopted the 2013 Master Sample Design as well as the population projections based on the 2010 Census of Population
and Housing (2010 CPH) while the previous survey round used 2000 CPH as population projection benchmark.
3. January 2016 data reflected were based on the 2010 Census-based population projections.
4. Starting 2017, data for SPED is included in Elementary data while a breakdown of the High School is broken down into Junior and Senior High School.
* Less than 500.
p Preliminary.
NA Not available.
Source of basic data: Philippine Statistics Authority, Labor Force Survey.
2017
TABLE 9 - Employed Persons by Sex, Age Group and Highest Grade Completed,
Philippines: 2016 - July 2018 (Revised)
(In Thousands)
INDICATOR2018
BOTH SEXES
2016
16

Ave Jan Apr July Oct Ave Jan Apr Jul Oct Jan Apr p
Jul p
BOTH SEXES 2,363 2,455 2,625 2,332 2,040 2,441 2,761 2,443 2,373 2,185 2,320 2,360 2,323
Male 1,486 1,569 1,661 1,410 1,305 1,601 1,923 1,557 1,520 1,402 1,520 1,481 1,420
Female 877 886 965 922 735 840 838 886 854 783 800 880 904
ALL AGE GROUPS 2,363 2,455 2,625 2,332 2,040 2,441 2,761 2,443 2,373 2,185 2,320 2,360 2,323
15 - 24 Years 1,137 1,162 1,294 1,120 970 1,139 1,218 1,209 1,169 960 1,003 1,082 1,040
25 - 34 Years 692 751 743 660 613 718 818 716 705 632 722 713 716
35 - 44 Years 255 245 273 284 217 263 298 238 248 267 293 263 275
45 - 54 Years 172 184 198 163 143 191 245 163 149 207 186 178 175
55 - 64 Years 85 93 92 79 78 112 159 99 88 103 101 109 99
65 Years & Over 23 20 25 26 19 18 24 17 14 17 14 15 18
Age Not Reported - - - - - - - - - - - - -
TOTAL 2,363 2,455 2,625 2,332 2,040 2,441 2,761 2,443 2,373 2,185 2,320 2,360 2,323
No Grade Completed 16 13 13 19 18 16 23 19 15 6 25 19 24
Elementary 305 310 355 293 262 326 438 294 264 310 332 317 316
Undergraduate 151 158 182 149 118 168 215 147 134 175 180 149 146
Graduate 153 152 173 144 144 159 222 147 131 136 152 167 170
SPED * - - - * - - - - - - - -
SPED Undergraduate * - - - * - - - - - - - -
SPED Graduate - - - - - - - - - - - - -
High School 1,011 1,114 1,114 931 884 - - - - - - - -
Undergraduate 273 306 295 273 215 - - - - - - - -
Graduate 738 807 819 658 669 - - - - - - - -
Junior High School - - - - - 1,067 1,200 1,083 1,065 920 963 965 928
Undergraduate - - - - - 283 334 263 280 255 281 284 229
Graduate - - - - - 784 867 819 785 665 682 681 699
Senior High School - - - - - 3 1 8 2 2 5 63 79 Undergraduate - - - - - 2 1 4 2 2 5 20 16 Graduate - - - - - 1 1 4 - * - 42 63
Post Secondary 200 184 197 242 179 203 238 202 179 193 170 153 124
Undergraduate 28 30 35 28 19 24 25 18 24 31 23 8 11
Graduate 172 153 162 214 160 179 214 184 155 162 147 145 113
College 831 835 946 847 697 825 860 837 848 755 825 844 853
Undergraduate 328 358 340 332 280 346 403 333 342 306 317 382 416
Graduate 504 477 607 515 417 479 457 503 506 449 508 462 437
Notes: 1. Details may not add up to totals due to rounding.
2. Starting April 2016 round, the Labor Force Survey (LFS) adopted the 2013 Master Sample Design as well as the population projections based on the 2010 Census of Population
and Housing (2010 CPH) while the previous survey round used 2000 CPH as population projection benchmark.
3. January 2016 data reflected were based on the 2010 Census-based population projections.
4. Starting 2017, data for SPED is included in Elementary data while a breakdown of the High School is broken down into Junior and Senior High School.
* Less than 500.
p Preliminary.
NA Not available.
Source of basic data: Philippine Statistics Authority, Labor Force Survey.
TABLE 10 - Unemployed Persons by Sex, Age Group and Highest Grade Completed,
Philippines: 2016 - July 2018 (Revised)(In Thousands)
20182017INDICATOR
2016
17

Ave Jan Apr July Oct Ave Jan Apr July Oct Jan Apr p
Jul p
15 - 24 Years Old (Per UN definition)
Household Population 19,669 19,540 19,615 19,734 19,789 19,734 19,660 19,746 19,841 19,688 19,788 19,866 19,978
Male 10,089 10,032 10,048 10,114 10,161 10,143 10,097 10,142 10,199 10,134 10,191 10,226 10,278
Female 9,580 9,508 9,567 9,620 9,627 9,591 9,563 9,605 9,642 9,554 9,597 9,641 9,700
Employed 7,265 6,897 7,506 7,187 7,472 6,780 6,590 6,899 6,504 7,125 7,014 6,766 6,314
Male 4,627 4,384 4,756 4,606 4,762 4,376 4,260 4,459 4,233 4,551 4,502 4,301 4,028
Female 2,638 2,513 2,750 2,581 2,710 2,404 2,330 2,439 2,271 2,574 2,512 2,466 2,286
Unemployed 1,137 1,162 1,294 1,120 970 1,139 1,218 1,209 1,169 960 1,003 1,082 1,040
Male 674 707 779 613 596 695 776 710 704 588 630 633 590
Female 463 455 516 507 373 445 442 499 465 373 373 449 450
Unemployment Rate (%) 13.5 14.4 14.7 13.5 11.5 14.4 15.6 14.9 15.2 11.9 12.5 13.8 14.1
Male 12.7 13.9 14.1 11.7 11.1 13.7 15.4 13.7 14.3 11.4 12.3 12.8 12.8
Female 14.9 15.3 15.8 16.4 12.1 15.6 15.9 17.0 17.0 12.6 12.9 15.4 16.5
15 - 30 Years Old (Per Philippine definition)
Household Population 29,306 29,167 29,295 29,285 29,477 29,809 29,532 29,789 30,023 29,891 29,861 30,066 30,300
Male 15,022 15,022 14,930 15,009 15,125 15,274 15,142 15,222 15,353 15,378 15,358 15,412 15,618
Female 14,285 14,145 14,366 14,276 14,353 14,535 14,390 14,567 14,670 14,513 14,503 14,655 14,682
Employed 13,876 13,487 14,006 13,749 14,262 13,632 13,196 13,661 13,378 14,292 13,927 13,629 13,151
Male 8,862 8,553 8,933 8,853 9,108 8,783 8,512 8,826 8,661 9,133 8,981 8,679 8,486
Female 5,015 4,934 5,073 4,897 5,154 4,849 4,684 4,835 4,717 5,160 4,945 4,950 4,666
Unemployed 1,653 1,733 1,860 1,593 1,425 1,666 1,805 1,742 1,694 1,422 1,537 1,619 1,581
Male 1,004 1,077 1,140 909 888 1,042 1,203 1,051 1,047 865 966 976 930
Female 649 656 720 684 537 624 602 691 647 557 571 643 651
Unemployment Rate (%) 10.6 11.4 11.7 10.4 9.1 10.9 12.0 11.3 11.2 9.0 9.9 10.6 10.7
Male 10.2 11.2 11.3 9.3 8.9 10.6 12.4 10.6 10.8 8.7 9.7 10.1 9.9
Female 11.5 11.7 12.4 12.3 9.4 11.4 11.4 12.5 12.1 9.7 10.3 11.5 12.2
Notes: 1. Details may not add up to totals due to rounding.
2. Starting April 2016 round, the Labor Force Survey (LFS) adopted the 2013 Master Sample Design as well as the population projections based on the 2010 Census of Population
and Housing (2010 CPH) while the previous survey round used 2000 CPH as population projection benchmark.
3. January 2016 data reflected were based on the 2010 Census-based population projections to compute for the annualized data for 2016.
p Preliminary.
Source of basic data: Philippine Statistics Authority, Labor Force Survey, Public Use Files.
TABLE 11 - Youth (15-24 and 15-30 Years Old) Household Population and Employment Status by Sex,
Philippines: 2016 - July 2018
20182017INDICATOR
2016
18

Ave Jan Apr Jul Oct Ave Jan Apr Jul Oct Jan Apr p
Jul p
Employed
15 - 24 Years Old (Per UN definition)
7,265 6,897 7,506 7,187 7,472 6,780 6,590 6,899 6,504 7,125 7,014 6,766 6,314
No Grade Completed 59 56 53 62 63 57 53 52 69 52 51 42 50
Elementary 1,487 1,410 1,470 1,563 1,506 1,375 1,378 1,392 1,363 1,368 1,345 1,208 1,168
Undergraduate 844 790 854 868 864 796 823 820 760 779 741 588 596
Graduate 643 620 616 695 642 580 554 572 603 589 604 620 571 SPED NA NA NA 1 - - - - - - - - -
Undergraduate NA NA NA - - - - - - - - - -
Graduate NA NA NA 1 - - - - - - - - -
High School 3,650 3,440 3,807 3,578 3,776 - - - - - - - -
Undergraduate 1,355 1,206 1,341 1,351 1,524 - - - - - - - -
Graduate 2,295 2,234 2,467 2,227 2,252 - - - - - - - -
Junior High School - - - - - 3,220 3,167 3,330 3,050 3,334 3,365 3,176 2,727
Undergraduate - - - - - 1,199 1,176 1,231 1,086 1,301 1,319 1,240 1,050
Graduate - - - - - 2,022 1,991 2,098 1,964 2,033 2,046 1,935 1,678
Senior High School - - - - - 104 3 146 103 164 146 400 370
Undergraduate - - - - - 99 1 140 97 157 136 230 149
Graduate - - - - - 5 2 6 5 7 10 170 221
Post Secondary 347 337 285 377 386 321 341 314 281 348 310 230 284
Undergraduate 44 58 32 43 46 42 42 34 39 54 22 16 39
Graduate 302 280 254 334 341 279 299 280 242 294 288 213 245
College 1,723 1,653 1,890 1,606 1,741 1,703 1,648 1,665 1,638 1,859 1,797 1,711 1,715
Undergraduate 783 696 905 717 816 788 733 840 734 844 822 843 869
Graduate and Higher 940 957 986 889 925 914 914 824 903 1,015 975 868 846
15 - 30 Years Old (Per Philippine definition)
13,876 13,487 14,006 13,749 14,262 13,632 13,196 13,661 13,378 14,292 13,927 13,629 13,151
No Grade Completed 110 107 102 122 110 120 122 122 129 105 116 106 117
Elementary 2,638 2,522 2,618 2,728 2,685 2,552 2,519 2,601 2,531 2,557 2,591 2,369 2,386
Undergraduate 1,461 1,376 1,425 1,516 1,526 1,449 1,423 1,493 1,423 1,458 1,437 1,148 1,226
Graduate 1,177 1,146 1,193 1,212 1,159 1,103 1,096 1,108 1,108 1,099 1,153 1,220 1,160 SPED NA - NA 3 1 - - - - - - - -
Undergraduate NA - NA - 1 - - - - - - - -
Graduate NA - NA 3 - - - - - - - - -
High School 6,527 6,173 6,698 6,452 6,785 - - - - - - - -
Undergraduate 2,166 1,983 2,167 2,137 2,379 - - - - - - - -
Graduate 4,360 4,190 4,531 4,315 4,406 - - - - - - - -
Junior High School - - - - - 6,214 6,008 6,272 6,091 6,486 6,389 6,139 5,593
Undergraduate - - - - - 2,028 1,939 2,035 1,957 2,180 2,168 2,038 1,872
Graduate - - - - - 4,187 4,070 4,237 4,135 4,306 4,221 4,101 3,721
Senior High School - - - - - 105 4 148 103 164 146 412 386
Undergraduate - - - - - 100 2 142 97 157 136 233 154
Graduate - - - - - 5 2 6 5 7 10 179 232
Post Secondary 774 731 612 902 851 745 766 758 646 809 714 574 630
Undergraduate 96 110 72 101 100 88 87 80 81 102 67 41 92
Graduate 678 621 540 802 751 657 679 679 564 707 648 533 538
College 3,825 3,953 3,977 3,542 3,830 3,897 3,777 3,759 3,879 4,171 3,970 4,030 4,040
Undergraduate 1,495 1,383 1,604 1,427 1,565 1,580 1,479 1,590 1,560 1,691 1,599 1,882 1,943
Graduate and Higher 2,331 2,570 2,373 2,114 2,265 2,317 2,298 2,170 2,319 2,480 2,371 2,148 2,097
Notes: 1. Details may not add up to totals due to rounding.
2. Starting April 2016 round, the Labor Force Survey (LFS) adopted the 2013 Master Sample Design as well as the population projections based on the 2010 Census of Population
and Housing (2010 CPH) while the previous survey rounds used 2000 CPH as population projection benchmark.
3. January 2016 data reflected were based on the 2010 Census-based population projections to compute for the annualized data for 2016.
4. Starting 2017, data for SPED is included in Elementary data while a breakdown of the High School is broken down into Junior and Senior High School.
p Preliminary.
NA Not available.
Source of basic data: Philippine Statistics Authority, Labor Force Survey.
TOTAL
INDICATOR2016
TOTAL
2017
TABLE 12 - Employed and Unemployed Youth (15-24 and 15-30 Years Old) by Highest Grade Completed,
Philippines: 2016 - July 2018
(In Thousands)
2018
19
Ave Jan Apr Jul Oct Ave Jan Apr Jul Oct Jan Apr p
Jul p
Unemployed
15 - 24 Years Old (Per UN definition)
1,137 1,162 1,294 1,120 970 1,139 1,218 1,209 1,169 960 1,003 1,082 1,040
No Grade Completed 5 3 4 5 10 7 11 7 9 * 6 11 10
Elementary 120 115 130 128 107 118 153 108 113 99 128 109 122
Undergraduate 61 63 64 60 58 64 84 57 63 51 75 50 63
Graduate 59 52 65 67 50 54 68 50 51 48 53 58 60
SPED NA NA NA * * - - - - - - - -
Undergraduate NA NA NA - * - - - - - - - -
Graduate NA NA NA * - - - - - - - - -
High School 513 581 592 448 431 - - - - - - - -
Undergraduate 142 150 161 129 126 - - - - - - - -
Graduate 371 431 431 319 305 - - - - - - - -
Junior High School - - - - - 514 564 542 527 424 430 429 382
Undergraduate - - - - - 142 162 156 135 115 154 134 113
Graduate - - - - - 372 403 386 392 310 276 294 270
Senior High School - - - - - 3 1 8 2 2 5 57 78
Undergraduate - - - - - 2 1 4 2 1 5 19 16
Graduate - - - - - 1 1 4 - * * 38 62
Post Secondary 106 90 110 132 93 98 116 111 90 73 71 80 52
Undergraduate 15 14 19 20 9 11 12 9 15 9 12 4 6
Graduate 91 76 91 112 84 87 104 102 75 65 59 75 46
College 392 373 458 407 328 399 372 434 429 362 364 397 395
Undergraduate 145 157 156 158 110 162 163 165 170 151 130 151 184
Graduate and Higher 246 216 302 249 219 237 209 270 259 211 233 246 211
15 - 30 Years Old (Per Philippine definition)
1,653 1,733 1,860 1,593 1,425 1,666 1,805 1,742 1,694 1,422 1,537 1,619 1,581
No Grade Completed 8 4 6 8 12 10 16 11 10 3 15 12 14
Elementary 163 162 188 163 137 161 208 142 146 148 171 153 156
Undergraduate 83 87 95 77 72 85 106 77 78 77 99 70 80
Graduate 80 75 93 85 65 76 102 65 68 70 72 84 76
SPED NA NA NA * * - - - - - - - -
Undergraduate NA NA NA - * - - - - - - - -
Graduate NA NA NA * - - - - - - - - -
High School 714 806 805 629 615 - - - - - - - -
Undergraduate 187 208 210 179 152 - - - - - - - -
Graduate 527 599 595 450 462 - - - - - - - -
Junior High School - - - - - 735 794 775 764 607 641 645 597
Undergraduate - - - - - 197 238 199 200 153 195 191 156
Graduate - - - - - 538 556 576 565 454 446 454 441
Senior High School - - - - - 3 1 8 2 2 5 58 79
Undergraduate - - - - - 2 1 4 2 2 5 20 16
Graduate - - - - - 1 1 4 - * * 38 63
Post Secondary 155 138 160 182 139 148 178 163 135 116 120 120 84
Undergraduate 22 23 28 22 13 15 15 11 19 13 16 5 9
Graduate 133 116 132 160 125 133 163 152 116 103 104 115 75
College 615 623 701 611 523 608 606 643 637 546 585 631 651
Undergraduate 232 261 235 239 193 244 268 245 251 213 209 259 307
Graduate and Higher 383 362 466 372 330 364 338 398 386 333 376 372 344
Notes: 1. Details may not add up to totals due to rounding.
2. Starting April 2016 round, the Labor Force Survey (LFS) adopted the 2013 Master Sample Design as well as the population projections based on the 2010 Census of Population
and Housing (2010 CPH) while the previous survey rounds used 2000 CPH as population projection benchmark.
3. January 2016 data reflected were based on the 2010 Census-based population projections to compute for the annualized data for 2016.
4. Starting 2017, data for SPED is included in Elementary data while a breakdown of the High School is broken down into Junior and Senior High School.
* Less than 500.
p Preliminary.
NA Not available.
Source of basic data: Philippine Statistics Authority, Labor Force Survey.
TOTAL
TOTAL
INDICATOR2018
TABLE 12 - Employed and Unemployed Youth (15 - 24 and 15 - 30 Years Old) by Highest Grade Completed,
Philippines: 2016 - July 2018 (Continued)
(In Thousands)
2016 2017
20

Ave Jan Apr Jul Oct Ave Jan Apr Jul Oct Jan Apr p
Jul p
Household Population
Total 29,103 29,867 28,502 28,886 29,155 29,398 29,095 29,361 29,648 29,487 29,804 30,245 30,209
5 - 9 Years Old 11,181 11,025 11,203 11,218 11,279 11,448 11,375 11,471 11,451 11,497 11,505 11,635 11,636
10 - 14 Years Old 11,294 12,003 10,798 11,062 11,311 11,289 11,119 11,251 11,403 11,381 11,490 11,773 11,740
15 - 17 Years Old 6,628 6,839 6,501 6,606 6,565 6,661 6,602 6,639 6,794 6,609 6,810 6,837 6,834
Boys 14,933 15,302 14,611 14,806 15,014 15,153 15,008 15,079 15,274 15,252 15,337 15,488 15,556
5 - 9 Years Old 5,739 5,631 5,792 5,733 5,800 5,883 5,833 5,872 5,905 5,921 5,906 5,962 5,979
10 - 14 Years Old 5,764 6,153 5,460 5,630 5,812 5,808 5,735 5,765 5,849 5,885 5,930 6,021 6,011
15 - 17 Years Old 3,431 3,518 3,359 3,443 3,403 3,462 3,440 3,442 3,520 3,446 3,501 3,505 3,566
Girls 14,169 14,565 13,891 14,080 14,141 14,244 14,087 14,282 14,374 14,235 14,467 14,757 14,653
5 - 9 Years Old 5,443 5,394 5,411 5,486 5,480 5,566 5,541 5,599 5,546 5,576 5,599 5,673 5,657
10 - 14 Years Old 5,530 5,850 5,338 5,431 5,500 5,480 5,384 5,486 5,554 5,497 5,560 5,752 5,729
15 - 17 Years Old 3,197 3,321 3,142 3,163 3,161 3,199 3,162 3,197 3,273 3,162 3,308 3,332 3,267
Working Children
Total 1,509 1,386 1,737 1,402 1,509 1,344 1,179 1,536 1,087 1,573 1,719 1,713 1,046
5 - 9 Years Old 84 54 88 97 95 57 35 47 54 93 128 102 51
10 - 14 Years Old 394 331 455 352 439 393 325 479 315 452 570 566 276
15 - 17 Years Old 1,031 1,002 1,194 953 975 894 820 1,009 719 1,028 1,021 1,044 718
Boys 978 922 1,085 920 986 907 801 1,034 748 1,046 1,115 1,126 718
5 - 9 Years Old 48 32 49 55 56 30 18 30 28 44 64 59 27
10 - 14 Years Old 234 197 266 215 259 241 205 292 189 278 348 348 163
15 - 17 Years Old 696 692 770 649 672 636 577 713 531 725 703 718 529
Girls 531 465 652 483 522 436 378 501 339 527 604 587 328
5 - 9 Years Old 35 21 39 42 38 27 16 17 26 49 64 43 24
10 - 14 Years Old 160 134 189 137 180 152 119 187 126 174 222 218 114
15 - 17 Years Old 336 310 424 304 304 258 242 297 188 304 318 326 189
Notes: 1. Details may not add up to totals due to rounding.
2. Starting April 2016 round, the Labor Force Survey (LFS) adopted the 2013 Master Sample Design as well as the population projections based on the 2010 Census of Population
and Housing (2010 CPH) while the previous survey round used 2000 CPH as population projection benchmark.
3 . January 2016 data reflected were based on the 2010 Census-based population projections to compute for the annualized data for 2016.
p Preliminary.
Source of basic data: Philippine Statistics Authority, Labor Force Survey.
TABLE 13 - Working Children (5 - 17 Years Old) by Age Group and Sex, Philippines: 2016 -July 2018
(In Thousands)
20172016INDICATOR
2018
21

2018
Ave 1st Qtr 2nd Qtr 3rd Qtr 4th Qtr Ave 1st Qtr 2nd Qtr 3rd Qtr 4th Qtr 1st Qtr
TOTAL, NON-AGRICULTURAL INDUSTRIES 1
188.5 190.4 182.0 221.9 181.7 176.0 194.8 184.5 231.2 184.4 178.9 187.2
Mining and Quarrying 16.4 15.7 18.3 13.7 19.9 10.7 15.4 17.2 13.9 19.9 10.7 16.4
Manufacturing 232.5 233.7 217.4 296.6 217.7 203.2 239.7 219.5 311.7 220.0 207.6 222.0
Electricity and Water 155.4 157.0 187.3 145.3 142.2 153.1 158.3 189.6 144.2 143.6 155.6 194.7
Wholesale and Retail Trade 140.3 142.8 141.2 140.8 141.8 147.3 144.6 142.4 143.0 145.4 147.7 146.3
Transportation and Communications 95.9 100.1 97.4 98.6 101.8 102.6 104.3 102.8 104.2 104.8 105.4 104.9
Finance 220.4 224.6 224.2 226.7 221.2 226.3 228.7 230.4 233.9 223.0 227.5 231.4
Real Estate 89.2 93.5 95.4 95.0 87.0 96.7 97.7 104.7 97.0 89.8 99.4 106.3
Private Services 172.5 174.4 172.9 173.5 173.5 177.7 176.8 175.4 175.7 177.1 179.0 178.6
Note: Averages are obtained by adding the four (4) quarterly indices and dividing it by four.
1 Excludes index of employment in construction due to unavailability of data.
Source of basic data: Philippine Statistics Authority, Quarterly Economic Indices of the Philippines.
Definition:
Employment index - is a statistical measure designed to show changes in employment with respect to time (in this case, 1978) and industry group.
The indices are derived as the ratio of the estimated values to the base year levels, as follows:
Employment for Period t
Index on Employment = -------------------------------- X 100
Employment in 1978
TABLE 14 - Indices of Employment in Non-Agricultural Industries by Major Industry Group,
Philippines: 2015 - First Quarter 2018
(1978 = 100)
MAJOR INDUSTRY GROUP 20152016 2017
22
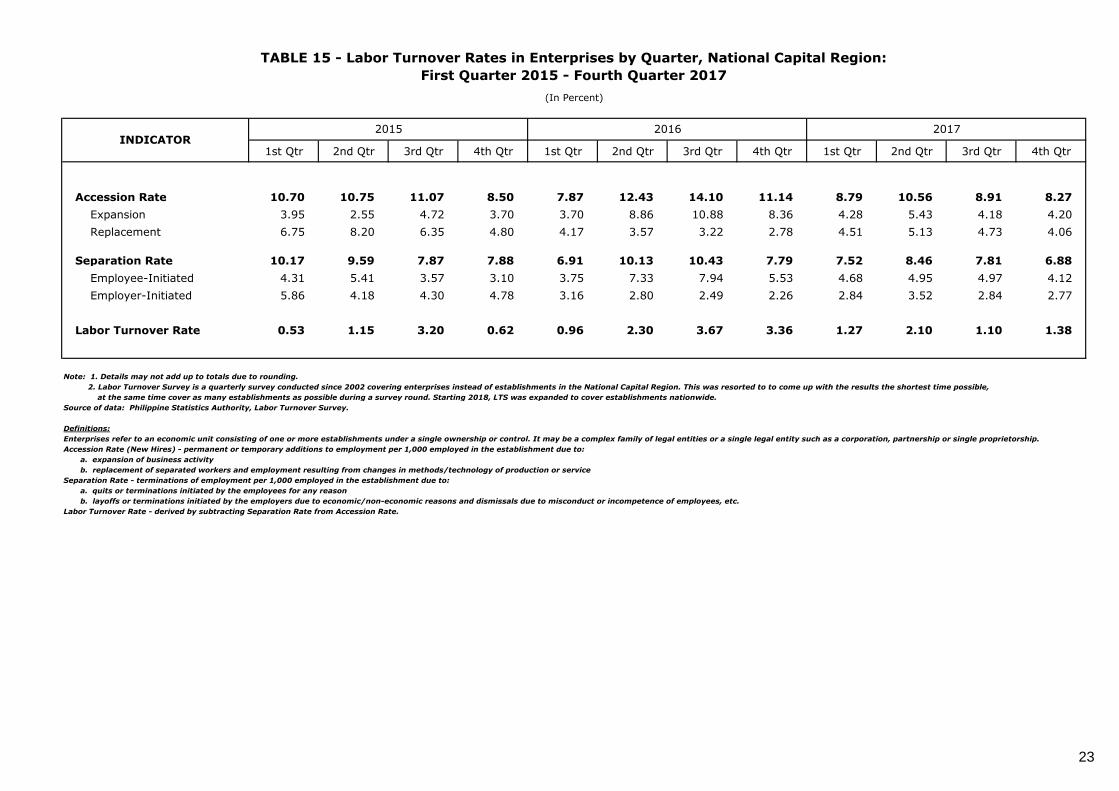
1st Qtr 2nd Qtr 3rd Qtr 4th Qtr 1st Qtr 2nd Qtr 3rd Qtr 4th Qtr 1st Qtr 2nd Qtr 3rd Qtr 4th Qtr
Accession Rate 10.70 10.75 11.07 8.50 7.87 12.43 14.10 11.14 8.79 10.56 8.91 8.27
Expansion 3.95 2.55 4.72 3.70 3.70 8.86 10.88 8.36 4.28 5.43 4.18 4.20
Replacement 6.75 8.20 6.35 4.80 4.17 3.57 3.22 2.78 4.51 5.13 4.73 4.06
Separation Rate 10.17 9.59 7.87 7.88 6.91 10.13 10.43 7.79 7.52 8.46 7.81 6.88
Employee-Initiated 4.31 5.41 3.57 3.10 3.75 7.33 7.94 5.53 4.68 4.95 4.97 4.12
Employer-Initiated 5.86 4.18 4.30 4.78 3.16 2.80 2.49 2.26 2.84 3.52 2.84 2.77
Labor Turnover Rate 0.53 1.15 3.20 0.62 0.96 2.30 3.67 3.36 1.27 2.10 1.10 1.38
Note: 1. Details may not add up to totals due to rounding.
2. Labor Turnover Survey is a quarterly survey conducted since 2002 covering enterprises instead of establishments in the National Capital Region. This was resorted to to come up with the results the shortest time possible,
at the same time cover as many establishments as possible during a survey round. Starting 2018, LTS was expanded to cover establishments nationwide.
Source of data: Philippine Statistics Authority, Labor Turnover Survey.
Definitions:
Accession Rate (New Hires) - permanent or temporary additions to employment per 1,000 employed in the establishment due to:
a. expansion of business activity
b. replacement of separated workers and employment resulting from changes in methods/technology of production or service
Separation Rate - terminations of employment per 1,000 employed in the establishment due to:
a. quits or terminations initiated by the employees for any reason
b. layoffs or terminations initiated by the employers due to economic/non-economic reasons and dismissals due to misconduct or incompetence of employees, etc.
Labor Turnover Rate - derived by subtracting Separation Rate from Accession Rate.
2016INDICATOR
TABLE 15 - Labor Turnover Rates in Enterprises by Quarter, National Capital Region:
First Quarter 2015 - Fourth Quarter 2017
(In Percent)
2015 2017
Enterprises refer to an economic unit consisting of one or more establishments under a single ownership or control. It may be a complex family of legal entities or a single legal entity such as a corporation, partnership or single proprietorship.
23

1st Qtr 2nd Qtr 3rd Qtr 4th Qtr 1st Qtr 2nd Qtr 3rd Qtr 4th Qtr 1st Qtr 2nd Qtr 3rd Qtr 4th Qtr
ALL INDUSTRIES 0.53 1.15 3.20 0.62 0.96 2.30 3.67 3.36 1.27 2.10 1.10 1.38
Agriculture, Fishery and Forestry 3.63 1.02 0.14 (6.21) 1.18 4.59 (0.83) 0.66 2.50 1.92 (0.70) (4.61)
Industry (1.11) (1.59) 1.54 (0.92) 2.54 (2.11) 0.98 1.70 2.84 3.10 1.38 0.43
Mining and Quarrying 3.50 9.16 2.63 (14.10) 5.77 3.40 3.24 (9.90) 14.88 9.89 2.34 10.16
Manufacturing (1.66) (0.77) 0.81 0.55 1.47 1.93 2.02 1.30 3.89 3.90 2.22 (0.47)
Electricity, Gas, Steam and Air Conditioning Supply (0.23) (0.62) (0.38) 0.08 (0.73) (1.17) (1.80) (0.11) 0.03 0.21 0.66 (0.35)
Water Supply; Sewerage, Waste Management and Remediation Activities 1.53 2.66 2.21 1.06 5.44 1.52 0.05 (0.86) 2.15 (1.00) 1.99 1.46
Construction (0.82) (4.50) 3.45 (3.89) 3.75 (8.36) (0.64) 3.18 1.00 2.04 0.17 1.21
Services 0.92 1.52 3.54 0.93 0.64 2.88 4.03 3.58 0.94 1.86 1.05 1.65
Wholesale and Retail Trade; Repair of Motor Vehicles and Motorcycles (0.72) 1.72 1.38 0.58 (0.05) 3.06 1.12 11.49 1.13 3.95 0.46 1.76
Transportation and Storage (0.16) 1.28 2.83 2.81 0.54 2.87 20.79 (1.65) 1.08 1.93 2.53 1.20
Accommodation and Food Service Activities (0.46) 2.03 2.72 (0.22) 1.85 2.50 6.02 3.37 0.84 5.32 (0.31) 3.47
Information and Communication 1.15 0.12 1.71 (4.53) 3.31 4.45 0.59 (1.23) 2.78 (3.26) 2.73 1.39
Financial and Insurance Activities (0.10) 2.67 0.72 1.00 (2.89) 5.10 2.71 0.69 2.43 2.73 3.08 3.72
Real Estate Activities (1.40) 0.64 1.49 1.88 (1.59) (0.38) 1.80 3.73 0.51 3.25 2.25 (0.59)
Professional, Scientific and Technical Activities 2.96 1.24 1.06 5.42 1.44 0.12 0.87 0.80 0.81 0.53 0.83 1.18
Administrative and Support Service Activities 5.27 0.97 8.49 2.10 2.18 2.41 5.10 2.71 (0.11) (0.57) 0.32 1.26
Education (0.40) 3.65 1.70 0.80 (0.06) 6.08 (0.44) 2.24 0.70 2.43 1.57 0.12
Human Health and Social Work Activities (2.39) 2.95 1.48 0.68 1.08 2.18 1.38 4.26 1.47 1.01 1.73 0.41
Arts, Entertainment and Recreation (0.85) 2.19 (0.01) 1.12 (0.29) 0.78 1.51 0.87 0.46 0.77 0.72 0.60
Other Service Activities (0.43) 1.47 3.19 1.21 2.09 4.36 4.87 2.61 (0.89) 4.67 (0.44) 0.06
Note: 1. Details may not add up to totals due to rounding.
2. Labor Turnover Survey is a quarterly survey conducted since 2002 covering enterprises instead of establishments in the National Capital Region. This was resorted to to come up with the results the shortest time possible,
at the same time cover as many establishments as possible during a survey round. Starting 2018, LTS was expanded to cover establishments nationwide.
Source of data: Philippine Statistics Authority, Labor Turnover Survey.
Definition:
Enterprises refer to an economic unit consisting of one or more establishments under a single ownership or control. It may be a complex family of legal entities or a single legal entity such as a corporation, partnership or single proprietorship.
Labor Turnover Rate - derived by subtracting Separation Rate from Accession Rate.
Table 15a - Labor Turnover Rates in Enterprises by Major Industry Group, National Capital Region:
First Quarter 2015 - Fourth Quarter 2017
(In Percent)
MAJOR INDUSTRY GROUP2015 2016 2017
24

Accession SeparationPercent
DifferenceExpansion Replacement
Employee-
Initiated
Employer-
Initiated
ALL INDUSTRIES 9.30 7.72 1.58 3.79 5.50 4.82 2.90
Agriculture, Fishery and Forestry 6.86 4.85 2.01 2.83 4.03 3.55 1.30
Industry 12.06 8.59 3.47 5.16 6.90 4.71 3.88
Mining and Quarrying 12.36 8.06 4.29 8.62 3.73 2.41 5.65
Manufacturing 13.20 8.98 4.22 4.64 8.55 4.98 4.00
Electricity, Gas, Steam and Air Conditioning Supply 3.09 1.78 1.31 1.97 1.12 0.96 0.82
Water Supply; Sewerage, Waste Management and Remediation Activities 2.93 1.67 1.26 2.20 0.73 1.04 0.63
Construction 11.51 10.09 1.43 8.23 3.28 5.44 4.64
Services 8.54 7.59 0.95 3.41 5.14 4.92 2.67
Wholesale and Retail Trade; Repair of Motor Vehicles and Motorcycles 9.86 8.43 1.43 2.75 7.11 6.21 2.22
Transportation and Storage 4.01 2.46 1.54 2.43 1.58 1.85 0.62
Accommodation and Food Service Activities 7.78 6.84 0.94 2.69 5.09 5.00 1.84
Information and Communication 6.45 5.57 0.88 2.86 3.59 4.23 1.34
Financial and Insurance Activities 6.12 4.13 2.00 2.43 3.69 3.37 0.76
Real Estate Activities 3.83 5.59 (1.76) 1.90 1.93 3.00 2.59
Professional, Scientific and Technical Activities 10.85 5.93 4.92 2.25 8.59 4.79 1.13
Administrative and Support Service Activities 11.33 10.78 0.55 5.21 6.13 5.96 4.83
Education 2.10 3.17 (1.06) 0.88 1.23 2.25 0.91
Human Health and Social Work Activities 6.72 5.13 1.59 2.43 4.28 4.76 0.37
Arts, Entertainment and Recreation 5.47 3.49 1.98 4.00 1.47 2.24 1.25
Other Service Activities 4.85 5.65 (0.80) 1.22 3.63 5.37 0.28
Note: 1. Details may not add up to totals due to rounding.
2. Starting 2018, the Labor Turnover Survey, conducted quarterly, covers establishments employing 20 and over workers all over the country, hence is not comparable with previous survey results.
Source of data: Philippine Statistics Authority, Labor Turnover Survey.
Definition:
Establishment - an economic unit which engages, under a single ownership or control, i.e., under a single legal entity, in one or predominantly one kind of economic activity at a single fixed physical location.
Labor Turnover Rate - derived by subtracting Separation Rate from Accession Rate.
Table 16 - Labor Turnover Rates in Agricultural and Non-Agricultural Establishments
by Major Industry, Philippines: 1st Quarter 2018 (Final)
MAJOR INDUSTRY GROUP
Total Accession Separation
25

2018
Ave Jan Apr Jul Oct Aver Jan Apr Jul Oct Jan
PHILIPPINES 400.95 387.56 403.59 401.53 411.49 415.17 414.64 408.80 412.92 423.89 427.76
National Capital Region 561.74 547.79 577.01 557.64 564.35 567.29 577.77 548.72 542.16 598.86 575.18
Cordillera Administrative Region 432.00 422.64 430.61 432.08 443.36 432.46 433.09 442.61 425.44 429.96 492.54
Region I - Ilocos Region 341.24 320.70 370.27 333.22 343.58 362.18 343.33 363.53 369.23 370.56 397.22
Region II - Cagayan Valley 316.57 295.08 336.89 309.87 328.66 343.24 355.56 337.08 367.47 315.38 351.86
Region III - Central Luzon 404.46 387.51 400.21 412.24 418.03 412.97 415.80 429.28 396.01 413.29 439.77
Region IV - A - CALABARZON 445.19 430.29 446.52 454.66 448.94 462.99 460.14 464.11 460.07 467.36 475.79
326.27 315.40 319.69 316.70 355.52 349.76 366.93 335.89 333.61 364.21 380.78
Region V - Bicol Region 324.50 316.81 321.99 322.52 337.23 353.51 325.62 343.14 400.84 339.53 354.25
Region VI - Western Visayas 314.76 291.13 323.80 317.45 329.33 330.06 317.10 316.35 344.13 343.38 341.05
Region VII - Central Visayas 351.20 342.17 336.48 350.33 376.85 367.32 358.10 349.94 385.05 374.70 381.74
Region VIII - Eastern Visayas 318.94 319.48 306.05 321.76 328.15 363.83 347.37 347.52 376.79 385.06 372.44
Region IX - Zamboanga Peninsula 332.57 327.75 337.35 318.57 346.85 336.47 351.21 330.38 349.08 316.67 326.58
Region X - Northern Mindanao 321.66 316.75 308.51 319.51 343.47 338.70 346.44 327.53 334.32 346.03 352.63
Region XI - Davao Region 348.04 355.50 331.61 366.82 337.58 354.35 352.05 341.59 359.30 363.44 374.20
Region XII - SOCCSKSARGEN 317.74 307.72 324.17 323.91 316.36 335.69 326.71 342.26 330.84 342.37 344.09
Caraga 352.25 356.30 360.15 355.10 337.29 355.53 365.16 340.35 349.18 367.62 364.55
Autonomous Region in Muslim
Mindanao 370.01 400.00 385.15 337.59 368.20 381.88 405.39 388.58 344.21 391.62 344.87
Notes: 1. Excludes those paid on commission basis, honorarium and boundary as in the case of jeepney/bus/tricycle drivers.
2. Starting April 2016 round, the Labor Force Survey (LFS) adopted the 2013 Master Sample Design as well as the population projections based on the 2010 Census of Population and Housing (2010 CPH) while previous survey rounds were derived
using the 2000 CPH population projections.
3. January 2016 data reflected were based on the 2010 CPH population projections to compute for the annualized data for 2016.
r Revised.
Source of basic data: Philippine Statistics Authority, Labor Force Survey, Public Use Files.
Definition:
Basic Pay - pay for normal time prior to deduction of social security contributions, withholding taxes, etc. It excludes allowances, bonuses, commissions, overtime pay, benefits in kind, etc.
TABLE 17 - Average Daily Basic Pay of Wage and Salary Workers by Region, Philippines: 2016 - January 2018
(In Pesos)
REGION2016 2017
MIMAROPA Region
26
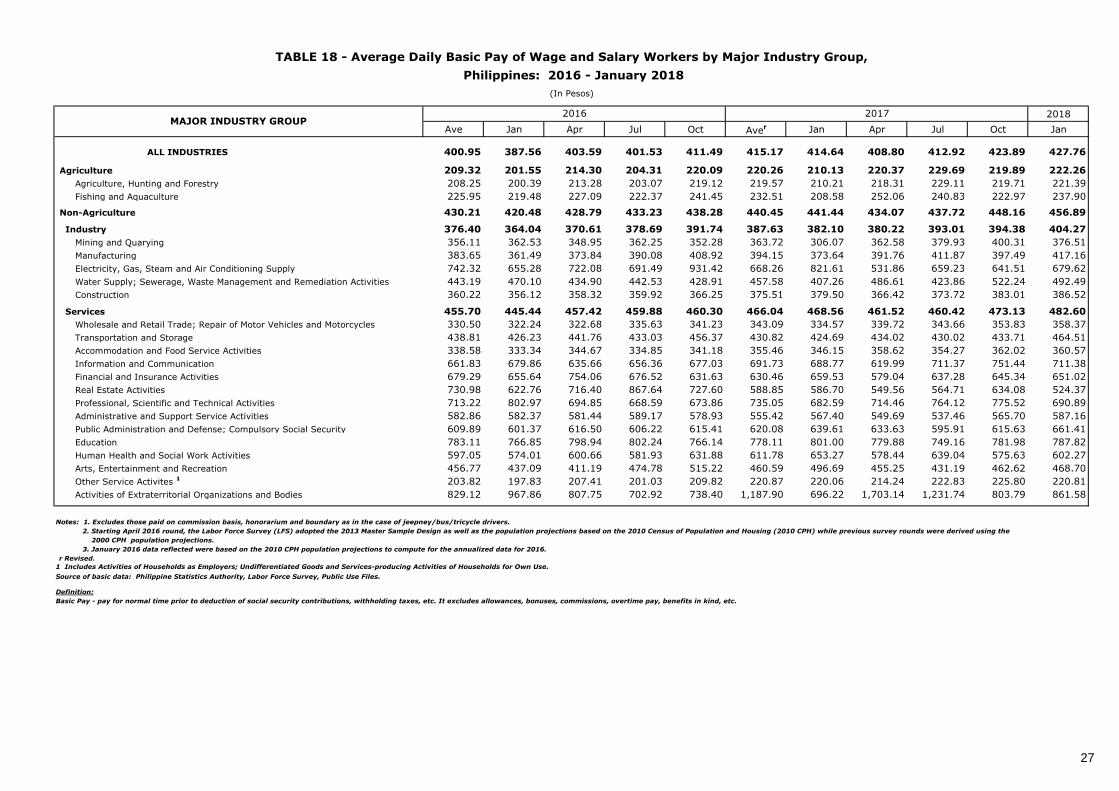
2018
Ave Jan Apr Jul Oct Aver Jan Apr Jul Oct Jan
ALL INDUSTRIES 400.95 387.56 403.59 401.53 411.49 415.17 414.64 408.80 412.92 423.89 427.76
209.32 201.55 214.30 204.31 220.09 220.26 210.13 220.37 229.69 219.89 222.26
Agriculture, Hunting and Forestry 208.25 200.39 213.28 203.07 219.12 219.57 210.21 218.31 229.11 219.71 221.39
Fishing and Aquaculture 225.95 219.48 227.09 222.37 241.45 232.51 208.58 252.06 240.83 222.97 237.90
430.21 420.48 428.79 433.23 438.28 440.45 441.44 434.07 437.72 448.16 456.89
Industry 376.40 364.04 370.61 378.69 391.74 387.63 382.10 380.22 393.01 394.38 404.27
Mining and Quarying 356.11 362.53 348.95 362.25 352.28 363.72 306.07 362.58 379.93 400.31 376.51
Manufacturing 383.65 361.49 373.84 390.08 408.92 394.15 373.64 391.76 411.87 397.49 417.16
Electricity, Gas, Steam and Air Conditioning Supply 742.32 655.28 722.08 691.49 931.42 668.26 821.61 531.86 659.23 641.51 679.62
Water Supply; Sewerage, Waste Management and Remediation Activities 443.19 470.10 434.90 442.53 428.91 457.58 407.26 486.61 423.86 522.24 492.49
Construction 360.22 356.12 358.32 359.92 366.25 375.51 379.50 366.42 373.72 383.01 386.52
Services 455.70 445.44 457.42 459.88 460.30 466.04 468.56 461.52 460.42 473.13 482.60
Wholesale and Retail Trade; Repair of Motor Vehicles and Motorcycles 330.50 322.24 322.68 335.63 341.23 343.09 334.57 339.72 343.66 353.83 358.37
Transportation and Storage 438.81 426.23 441.76 433.03 456.37 430.82 424.69 434.02 430.02 433.71 464.51
Accommodation and Food Service Activities 338.58 333.34 344.67 334.85 341.18 355.46 346.15 358.62 354.27 362.02 360.57
Information and Communication 661.83 679.86 635.66 656.36 677.03 691.73 688.77 619.99 711.37 751.44 711.38
Financial and Insurance Activities 679.29 655.64 754.06 676.52 631.63 630.46 659.53 579.04 637.28 645.34 651.02
Real Estate Activities 730.98 622.76 716.40 867.64 727.60 588.85 586.70 549.56 564.71 634.08 524.37
Professional, Scientific and Technical Activities 713.22 802.97 694.85 668.59 673.86 735.05 682.59 714.46 764.12 775.52 690.89
Administrative and Support Service Activities 582.86 582.37 581.44 589.17 578.93 555.42 567.40 549.69 537.46 565.70 587.16
Public Administration and Defense; Compulsory Social Security 609.89 601.37 616.50 606.22 615.41 620.08 639.61 633.63 595.91 615.63 661.41
Education 783.11 766.85 798.94 802.24 766.14 778.11 801.00 779.88 749.16 781.98 787.82
Human Health and Social Work Activities 597.05 574.01 600.66 581.93 631.88 611.78 653.27 578.44 639.04 575.63 602.27
Arts, Entertainment and Recreation 456.77 437.09 411.19 474.78 515.22 460.59 496.69 455.25 431.19 462.62 468.70
Other Service Activites 1 203.82 197.83 207.41 201.03 209.82 220.87 220.06 214.24 222.83 225.80 220.81
Activities of Extraterritorial Organizations and Bodies 829.12 967.86 807.75 702.92 738.40 1,187.90 696.22 1,703.14 1,231.74 803.79 861.58
Notes: 1. Excludes those paid on commission basis, honorarium and boundary as in the case of jeepney/bus/tricycle drivers.
2. Starting April 2016 round, the Labor Force Survey (LFS) adopted the 2013 Master Sample Design as well as the population projections based on the 2010 Census of Population and Housing (2010 CPH) while previous survey rounds were derived using the
2000 CPH population projections.
3. January 2016 data reflected were based on the 2010 CPH population projections to compute for the annualized data for 2016.
r Revised.
1 Includes Activities of Households as Employers; Undifferentiated Goods and Services-producing Activities of Households for Own Use.
Source of basic data: Philippine Statistics Authority, Labor Force Survey, Public Use Files.
Definition:
Basic Pay - pay for normal time prior to deduction of social security contributions, withholding taxes, etc. It excludes allowances, bonuses, commissions, overtime pay, benefits in kind, etc.
TABLE 18 - Average Daily Basic Pay of Wage and Salary Workers by Major Industry Group,
Philippines: 2016 - January 2018
(In Pesos)
2016 2017
Non-Agriculture
MAJOR INDUSTRY GROUP
Agriculture
27
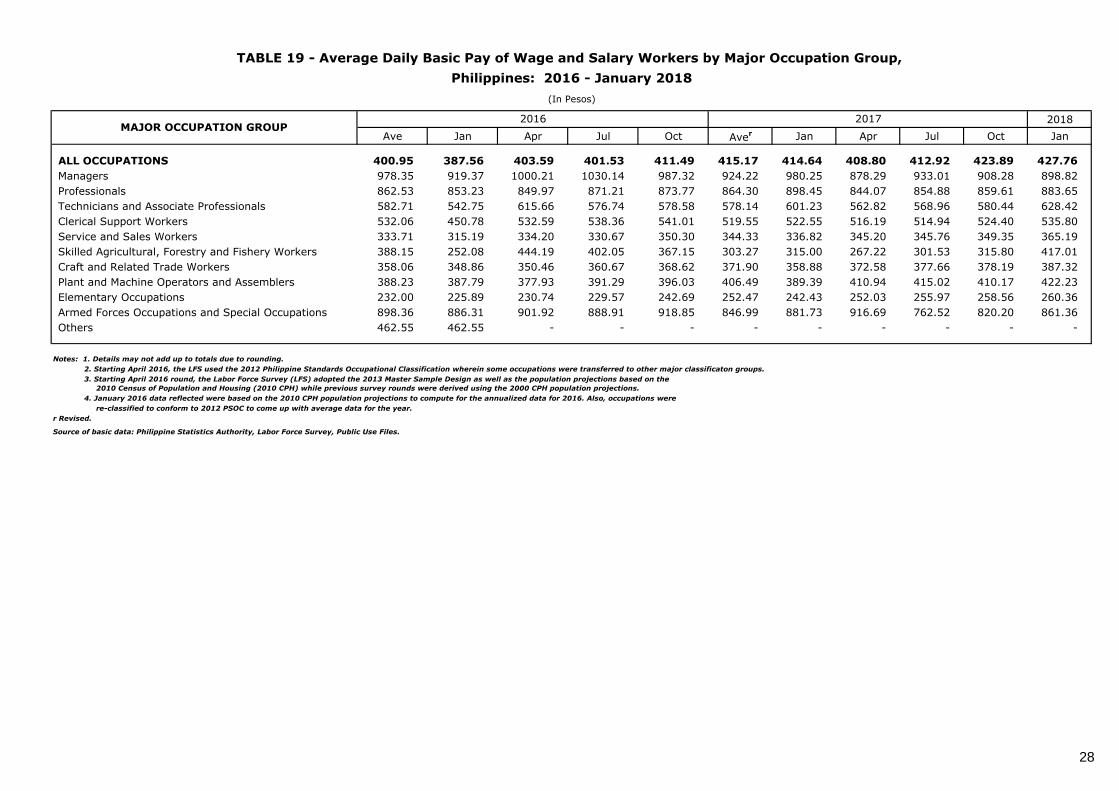
2018
Ave Jan Apr Jul Oct Aver Jan Apr Jul Oct Jan
ALL OCCUPATIONS 400.95 387.56 403.59 401.53 411.49 415.17 414.64 408.80 412.92 423.89 427.76
Managers 978.35 919.37 1000.21 1030.14 987.32 924.22 980.25 878.29 933.01 908.28 898.82
Professionals 862.53 853.23 849.97 871.21 873.77 864.30 898.45 844.07 854.88 859.61 883.65
Technicians and Associate Professionals 582.71 542.75 615.66 576.74 578.58 578.14 601.23 562.82 568.96 580.44 628.42
Clerical Support Workers 532.06 450.78 532.59 538.36 541.01 519.55 522.55 516.19 514.94 524.40 535.80
Service and Sales Workers 333.71 315.19 334.20 330.67 350.30 344.33 336.82 345.20 345.76 349.35 365.19
Skilled Agricultural, Forestry and Fishery Workers 388.15 252.08 444.19 402.05 367.15 303.27 315.00 267.22 301.53 315.80 417.01
Craft and Related Trade Workers 358.06 348.86 350.46 360.67 368.62 371.90 358.88 372.58 377.66 378.19 387.32
Plant and Machine Operators and Assemblers 388.23 387.79 377.93 391.29 396.03 406.49 389.39 410.94 415.02 410.17 422.23
Elementary Occupations 232.00 225.89 230.74 229.57 242.69 252.47 242.43 252.03 255.97 258.56 260.36
Armed Forces Occupations and Special Occupations 898.36 886.31 901.92 888.91 918.85 846.99 881.73 916.69 762.52 820.20 861.36
Others 462.55 462.55 - - - - - - - - -
Notes: 1. Details may not add up to totals due to rounding.
2. Starting April 2016, the LFS used the 2012 Philippine Standards Occupational Classification wherein some occupations were transferred to other major classificaton groups.
3. Starting April 2016 round, the Labor Force Survey (LFS) adopted the 2013 Master Sample Design as well as the population projections based on the
2010 Census of Population and Housing (2010 CPH) while previous survey rounds were derived using the 2000 CPH population projections.
4. January 2016 data reflected were based on the 2010 CPH population projections to compute for the annualized data for 2016. Also, occupations were
re-classified to conform to 2012 PSOC to come up with average data for the year.
r Revised.
Source of basic data: Philippine Statistics Authority, Labor Force Survey, Public Use Files.
Philippines: 2016 - January 2018
TABLE 19 - Average Daily Basic Pay of Wage and Salary Workers by Major Occupation Group,
(In Pesos)
MAJOR OCCUPATION GROUP2016 2017
28

2018
Ave Jan Apr Jul Oct Aver Jan Apr Jul Oct Jan
ALL WAGE AND SALARY WORKERS 400.95 387.56 403.59 401.53 411.49 415.17 414.64 408.80 412.92 423.89 427.76
Worked for:
Private Household 183.02 180.80 181.83 178.26 191.59 200.84 199.47 193.07 201.72 208.21 204.46
Private Establishment 380.11 366.20 383.72 379.37 391.33 393.23 389.87 385.55 393.34 403.65 404.03
With Pay in Own Family-Operated
Farm or Business 266.75 258.93 306.82 222.52 280.59 278.23 286.57 323.18 254.61 260.33 325.01
Government/Government Corporation 709.05 699.84 711.79 717.34 707.55 697.50 715.93 712.14 675.21 689.83 731.68
Notes: 1. Excludes those paid on commission basis, honorarium and boundary as in the case of jeepney/bus/tricycle drivers.
2. Starting April 2016 round, the Labor Force Survey (LFS) adopted the 2013 Master Sample Design as well as the population projections based on the 2010 Census of Population and Housing (2010 CPH) while previous survey rounds were derived
using the 2000 CPH population projections.
3. January 2016 data reflected were based on the 2010 CPH population projections to compute for the annualized data for 2016.
r Revised.
Source of basic data: Philippine Statistics Authority, Labor Force Survey, Public Use Files.
Definition:
Basic Pay - pay for normal time prior to deduction of social security contributions, withholding taxes, etc. It excludes allowances, bonuses, commissions, overtime pay, benefits in kind, etc.
TABLE 20 - Average Daily Basic Pay of Wage and Salary Workers, Philippines: 2016 - January 2018
(In Pesos)
CATEGORY2016 2017
29
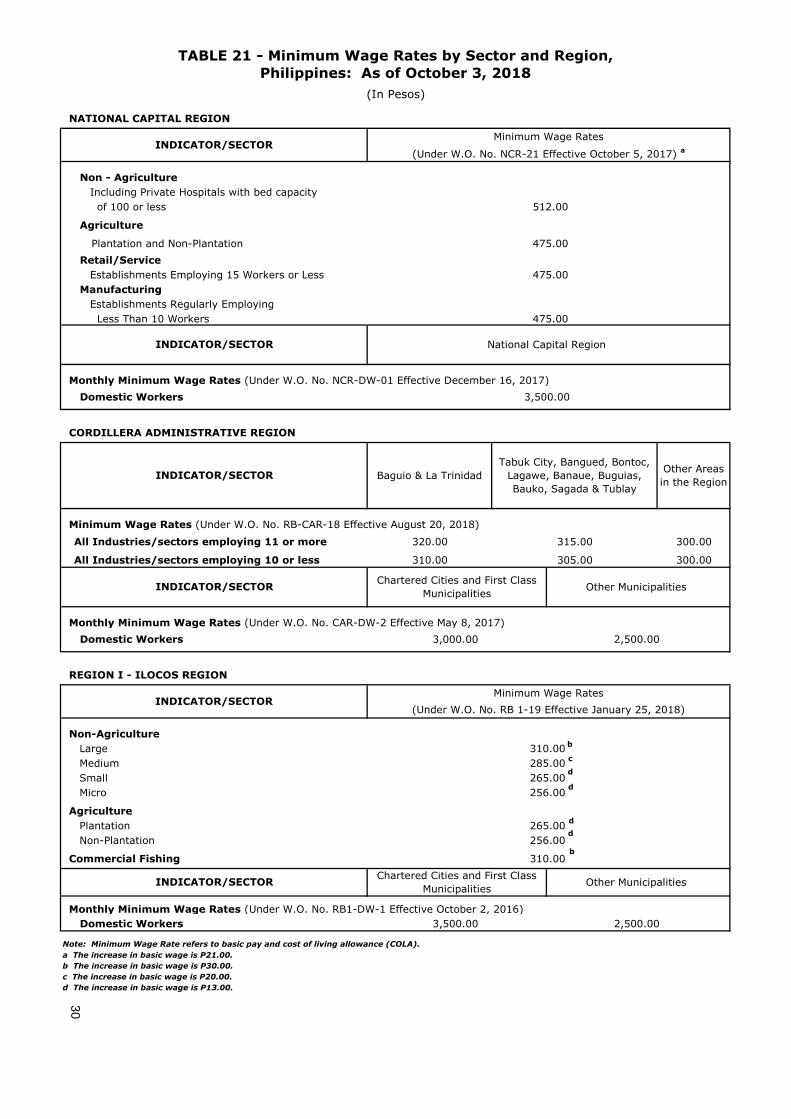
NATIONAL CAPITAL REGION
Non - Agriculture
Including Private Hospitals with bed capacity
of 100 or less
Agriculture
Plantation and Non-Plantation
Retail/Service
Establishments Employing 15 Workers or Less
Manufacturing
Establishments Regularly Employing
Less Than 10 Workers
Monthly Minimum Wage Rates (Under W.O. No. NCR-DW-01 Effective December 16, 2017)
Domestic Workers
CORDILLERA ADMINISTRATIVE REGION
Minimum Wage Rates (Under W.O. No. RB-CAR-18 Effective August 20, 2018)
Monthly Minimum Wage Rates (Under W.O. No. CAR-DW-2 Effective May 8, 2017)
Domestic Workers
REGION I - ILOCOS REGION
Non-Agriculture
Large
Medium
Small
Micro
Agriculture
Plantation
ManufacturingNon-Plantation
Commercial Fishing
Monthly Minimum Wage Rates (Under W.O. No. RB1-DW-1 Effective October 2, 2016)
Domestic Workers
Note: Minimum Wage Rate refers to basic pay and cost of living allowance (COLA).
a The increase in basic wage is P21.00.
b The increase in basic wage is P30.00.
c The increase in basic wage is P20.00.
d The increase in basic wage is P13.00.
475.00
2,500.00
Baguio & La Trinidad
Tabuk City, Bangued, Bontoc,
Lagawe, Banaue, Buguias,
Bauko, Sagada & Tublay
315.00
National Capital Region
3,500.00
475.00
320.00
310.00 305.00
INDICATOR/SECTOR
256.00
256.00
Minimum Wage Rates
(Under W.O. No. RB 1-19 Effective January 25, 2018)
Other Areas
in the Region
265.00
TABLE 21 - Minimum Wage Rates by Sector and Region,
Philippines: As of October 3, 2018
(In Pesos)
Minimum Wage Rates
475.00
512.00
(Under W.O. No. NCR-21 Effective October 5, 2017) a
INDICATOR/SECTOR
3,500.00 2,500.00
300.00
300.00
All Industries/sectors employing 11 or more
All Industries/sectors employing 10 or less
3,000.00
310.00
INDICATOR/SECTOR
INDICATOR/SECTOR
INDICATOR/SECTORChartered Cities and First Class
MunicipalitiesOther Municipalities
Other Municipalities
265.00
INDICATOR/SECTORChartered Cities and First Class
Municipalities
310.00
285.00
b
c
d
d
d
d
b
30

REGION II - CAGAYAN VALLEY
Minimum Wage Rates (Under W.O. No. RTWPB-02-18 Effective September 25, 2017) a
Non - Agriculture
Agriculture
Retail/Service
Establishments Employing
More Than 10 Workers
Establishments Employing
Less Than 10 Workers
REGION III - CENTRAL LUZON
Minimum Wage Rates (Under W.O. No. RBIII-20 Effective August 1, 2018) b
Non - Agriculture -
-
of Less Than P 30M
Agriculture
Plantation
Non - Plantation
Retail/Service
Note: Minimum Wage Rate refers to basic pay and cost of living allowance (COLA).
a The increase in basic wage is P40.00.
b The increase in basic wage is P20.00 for non-agriculture, agriculture and retail/service and P34.00 for retail/service with 11-15 workers.
Establishments With Less Than 10 Workers 375.00 -
274.00
340.00
INDICATOR/SECTORChartered Cities and First Class
MunicipalitiesOther Municipalities
Monthly Minimum Wage Rates (Under W.O. No. RBIII-DW-01 Effective October 7, 2017)
Domestic Workers 4,000.00 3,000.00
Monthly Minimum Wage Rates (Under W.O. No. RB II-DW-01 Effective May 29, 2017)
Establishments With 11-15 Workers
Establishments With 10 or More Workers
Establishments With Total Assets
Establishments With Total Assets of P 30M or More
389.00 -
300.00
Aurora
300.00300.00
389.00
-
2,500.00
-
Bulacan, Bataan, Nueva Ecija,
Pampanga, Tarlac and Zambales
340.00
300.00
320.00
340.00 340.00
INDICATOR/SECTORChartered Cities and First Class
MunicipalitiesOther Municipalities
340.00 340.00340.00
320.00 320.00
340.00
320.00
TABLE 21 – Minimum Wage Rates by Sector and Region,
Philippines: As of October 3, 2018 (Continued)
(In Pesos)
INDICATOR/SECTOR Isabela Nueva VizcayaQuirino and
BatanesCagayan
339.00
324.00
312.00354.00
2,500.00Domestic Workers
400.00
393.00
370.00
INDICATOR/SECTOR
31
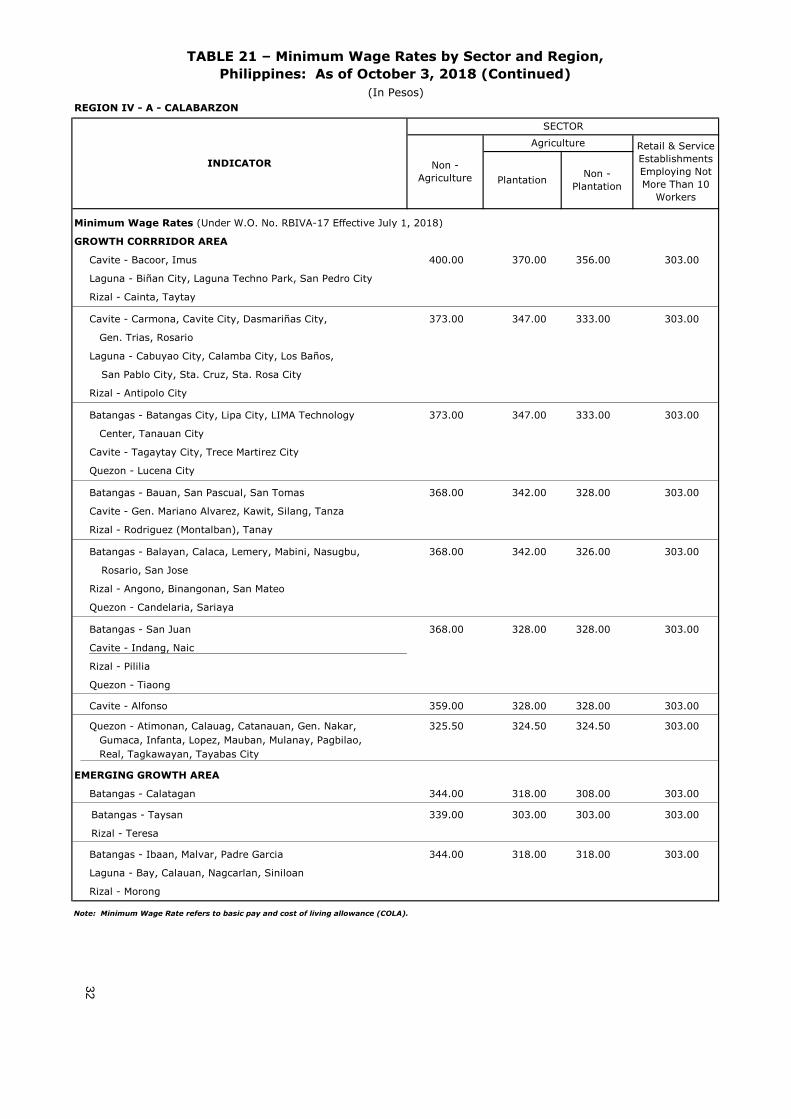
REGION IV - A - CALABARZON
Minimum Wage Rates (Under W.O. No. RBIVA-17 Effective July 1, 2018)
GROWTH CORRRIDOR AREA
Cavite - Bacoor, Imus
Laguna - Biñan City, Laguna Techno Park, San Pedro City
Rizal - Cainta, Taytay
Cavite - Carmona, Cavite City, Dasmariñas City,
Gen. Trias, Rosario
Laguna - Cabuyao City, Calamba City, Los Baños,
San Pablo City, Sta. Cruz, Sta. Rosa City
Rizal - Antipolo City
Batangas - Batangas City, Lipa City, LIMA Technology
Center, Tanauan City
Cavite - Tagaytay City, Trece Martirez City
Quezon - Lucena City
Batangas - Bauan, San Pascual, San Tomas
Cavite - Gen. Mariano Alvarez, Kawit, Silang, Tanza
Rizal - Rodriguez (Montalban), Tanay
Batangas - Balayan, Calaca, Lemery, Mabini, Nasugbu,
Rosario, San Jose
Rizal - Angono, Binangonan, San Mateo
Quezon - Candelaria, Sariaya
Batangas - San Juan
Cavite - Indang, Naic
Rizal - Pililia
Quezon - Tiaong
Cavite - Alfonso
Quezon - Atimonan, Calauag, Catanauan, Gen. Nakar,
Gumaca, Infanta, Lopez, Mauban, Mulanay, Pagbilao,
Real, Tagkawayan, Tayabas City
EMERGING GROWTH AREA
Batangas - Calatagan
Batangas - Taysan
Rizal - Teresa
Batangas - Ibaan, Malvar, Padre Garcia
Laguna - Bay, Calauan, Nagcarlan, Siniloan
Rizal - Morong
Note: Minimum Wage Rate refers to basic pay and cost of living allowance (COLA).
318.00 318.00 303.00
339.00
344.00
303.00
344.00
368.00 342.00 328.00 303.00
368.00 328.00 328.00
368.00 342.00 326.00
303.00 303.00
303.00
303.00325.50
318.00 308.00 303.00
333.00
333.00
328.00 328.00
324.50
303.00
303.00
303.00
303.00347.00
347.00
303.00370.00 356.00400.00
PlantationNon -
Plantation
TABLE 21 – Minimum Wage Rates by Sector and Region,
Philippines: As of October 3, 2018 (Continued)
(In Pesos)
INDICATOR Non -
Agriculture
Agriculture
SECTOR
Retail & Service
Establishments
Employing Not
More Than 10
Workers
324.50
373.00
373.00
359.0032

REGION IV - A - CALABARZON
EMERGING GROWTH AREA (continued)
Batangas - Laurel, Lian, Lobo, Taal, Talisay, Tuy
Cavite - Maragondon
Rizal - Cardona
Laguna - Alaminos, Cavinti, Kalayaan, Lumban,
Pagsanjan, Pila
Cavite - Noveleta
Quezon - Lucban, San Francisco (Aurora)
Quezon - Polilio, Guinayangan, San Narciso
RESOURCED-BASED AREA
Cavite - Ternate
Laguna - Paete, Pakil 283
Batangas - Agoncillo, Alitagtag, Balete, Cuenca, Mataas na Kahoy, San Luis, San Nicolas, Sta. Teresita, Tingloy
Cavite - Amadeo, Magallanes, Mendez, Gen. Emilio
Aguinaldo
Laguna - Famy, Liliw, Luisiana, Mabitac, Magdalena,
Majayjay, Pangil, Rizal, Sta. Maria, Victoria
Rizal - Baras, Jala-Jala
Quezon - Agdangan, Alabat, Buenavista, Burdeos, Dolores, Gen. Luna, Jomalig, Macalelon, Padre Burgos, Panukulan,
Patnanungan, Plaridel, Perez, Pitogo, Quezon, Sampaloc, San Andres, San Antonio, Unisan
Monthly Minimum Wage Rates (Under W.O. No. RBIVA-DW-01 Effective April 1, 2016)
Chartered cities and first class municipalitiesDomestic Workers
MIMAROPA Region
Minimum Wage Rates (Under W.O. No. RB-MIMAROPA-08 Effective September 24, 2017)a
All Sectors
Establishments Employing More Than 10 Workers
Establishments Employing Not More Than 10 Workers
Minimum Wage Rates (Under W.O. No. RB-MIMAROPA-DW-01 Effective July 7, 2017)
Chartered cities and first class municipalitiesDomestic Workers
REGION V - BICOL REGION
Non - Agriculture
Establishments Employing More Than 10 Workers
Establishments Employing Not More Than 10 Workers
Monthly Minimum Wage Rates (Under W.O. No. RB V-DW-01 Effective June 2, 2017)
Chartered cities and first class municipalitiesDomestic Workers
Note: Minimum Wage Rate refers to basic pay and cost of living allowance (COLA).
a Third tranche of wage increase effective August 1, 2018. The increase of P12.00 for establishments employing not more than 10 workers.
327.50 327.50 327.50 303.00
303.00
TABLE 21 – Minimum Wage Rates by Sector and Region,
INDICATOR/SECTORChartered Cities and First
Class MunicipalitiesOther Municipalities
303.00 303.00 303.00
303.00
Philippines: As of October 3, 2018 (Continued)
Retail & Service
Establishments
Employing Not
More Than 10
Workers
Non -
Plantation
303.00
SECTOR
303.00
327.50
333.00
303.00333.00 303.00
Plantation
Non -
Agriculture
(In Pesos)
INDICATOR
295.00
Calapan City,
Puerto Galera,
El Nido and
Coron
300.00
271.00
305.00
(Under W.O. No. RBV-18 Effective September 21, 2018)
The Rest of the
Region
First Class
Municipalities
of MIMAROPA
2,500.00 2,500.00
Minimum Wage Rates
Agriculture
303.00
300.00300.00
303.00
Other Municipalities
317.50
303.00 303.00
Chartered Cities and First
Class Municipalities
317.00
327.00
303.00
271.00 271.00271.00
327.00
333.00
Highly
Urbanized City
(Puerto
Princesa)
327.00
303.00
INDICATOR/SECTOR
303.00
317.50
327.00
303.00
INDICATOR/SECTORChartered Cities and First
Class MunicipalitiesOther Municipalities
3,000.00 2,500.00
2,500.00
300.00
1,800.00
INDICATOR/SECTOR
INDICATOR
32
33

REGION VI - WESTERN VISAYAS
Non - Agriculture/Industrial/Commercial
Employing More Than 10 Workers
Employing 10 or Less Workers
Agriculture
Plantation
Non-Plantation
AgricultureMonthly Minimum Wage Rates (Under W.O. No. RBVI-DW-02 Effective December 16, 2017)
Domestic Workers
Minimum Wage Rates (Under W.O. No. RBVII-20 Effective August 3, 2018) a
Non - Agricultureb
Agriculture
Non-sugar
Sugar
Monthly Minimum Wage Rates (Under W.O. No. ROVII-D.W.-01 Effective April 13, 2017)
Domestic Workers
Non - Agriculture
Agriculture (Non-sugar)
Retail/Service
Employing 10 Workers and Below
Employing 11 up to 30 Workers
Cottage/Handicraft
Sugar Industry
Mills
Farm c
Monthly Minimum Wage Rates (Under W.O. No. RBVIII-01 Effective March 23, 2016)
Domestic Workers
Note: Nominal Wage Rate refers to basic pay and cost of living allowance (COLA).
a The increase in basic pay is P13.00.
b Under the new wage structure, sugar mill workers are classified under Class B, Non-Agriculture.
c Effective May 01, 2015, the sub-classifications of Non-Plantation and Plantation for Sugar Industry was merged into one (1) called as Farm.
INDICATOR/SECTORChartered Cities and First Class
MunicipalitiesOther Municipalities
2,500.00 2,000.00
INDICATOR/SECTOR
3,500.00 3,500.00
333.00-338.00
REGION VII - CENTRAL VISAYAS
INDICATOR/SECTOR
Cities of Carcar, Cebu,
Danao, Lapulapu,
Mandaue, Naga,Talisay,
and Municipalities of
Compostela, Consolacion,
Cordova, Liloan,
Minglanilla, San Fernando
or Expanded Metro Cebu
295.00
295.00
TABLE 21 – Minimum Wage Rates by Sector and Region,
Philippines: As of October 3, 2018 (Continued)
(In Pesos)
Minimum Wage RatesINDICATOR/SECTOR
Class D
(Under W.O. No. RBVI-23 Effective July 12, 2018)
Municipalities in
Siquijor Province
and
Municipalities in
Bantayan and
Camotes Islands
Class B Class C
318.00-323.00
365.00
295.00
Tagbilaran City
and all
Municipalities in
Bohol Province
and Negros
Oriental
Province
Chartered Cities and First Class
MunicipalitiesOther Municipalities
Class A
313.00
313.00
Cities of Toledo,
Bogo and the rest
of Municipalities in
Cebu Province
except Bantayan
and
Camotes Islands
REGION VIII - EASTERN VISAYAS
368.00
376.00-386.00 343.00-348.00
328.00
328.00
313.00
275.00
305.00
275.00
275.00
275.00
305.00
305.00
Minimum Wage RatesINDICATOR/SECTOR
(Under W.O. No. RBVIII-19 Effective June 25, 2018)
368.00 313.00
INDICATOR/SECTORChartered Cities and First Class
MunicipalitiesOther Municipalities
3,000.00 2,500.00
34

Non - Agriculture
(Includes Private Hospitals, Educational Institutions,
Security Agencies, Janitorial and Retail/Service
Establishments Employing More Than 30 Workers)
Agriculture (Includes Rubber-Based Plantation Enterprise)
Plantation Agricultural Enterprise
Non-Plantation Agricultural Enterprise
Retail/Service
Establishments Employing Not More Than 30 Workers
Cottage/Handicraft
Minimum Wage Rates (Under W.O. No. RX-19 Effective July 16, 2017)
Non - Agriculture
Agriculture
Note: Minimum Wage Rate refers to basic pay and cost of living allowance (COLA).
Wage Category I - Covers the cities of Cagayan de Oro and Iligan, and the Municipalities of Tagaloan, Villanueva and Jasaan.
Wage Category II - Covers the cities of Malaybalay, Valencia, Gingoog, El Salvador and Ozamiz, and the Municipalities of Maramag, Quezon and Manolo Fortich.
Wage Category III - Covers the cities of Oroquieta and Tangub, and the Municipalities of Lugait, Opo and Mambajao.
All establishments employing ten (10) worker or less.
Wage Category IV - Covers all other areas not covered under the above categories.
INDICATOR/SECTORChartered Cities and First Class
MunicipalitiesOther Municipalities
Monthly Minimum Wage Rates (Under W.O. No. RBX-DW-01 Effective December 6, 2017)
Domestic Workers 3,000.00 2,000.00
INDICATOR/SECTORChartered Cities and First Class
MunicipalitiesOther Municipalities
Monthly Minimum Wage Rates (Under W.O. No. RIX-DW-01 Effective October 1, 2016)
Domestic Workers 2,500.00 2,000.00
TABLE 21 – Minimum Wage Rates by Sector and Region,
(In Pesos)
Philippines: As of October 3, 2018 (Continued)
REGION IX - ZAMBOANGA PENINSULA
303.00
303.00
INDICATOR/SECTOR(Under W.O. No. RIX-19 Effective July 30, 2018)
303.00
REGION X - NORTHERN MINDANAO
316.00
Minimum Wage Rates
INDICATOR/SECTORWage
Category I
Wage
Category II
Wage
Category IIIWage Category IV
303.00
326.00
338.00
304.00
316.00
311.00
323.00
319.00
331.00
35

Non - Agriculture
Agriculture
Retail/Service
Establishments Employing More Than
10 Workers
Establishments Employing Not More Than
10 Workers
Non - Agriculture
Agriculture
Retail/Service Establishment
CARAGA
Non - Agriculture
Agriculture
Plantation
Non - Plantation
Retail/Service
Establishments Employing 10 Workers or Less
Establishments Employing More Than 10 Workers
AUTONOMOUS REGION IN MUSLIM MINDANAO
Non - Agriculture
Manufacturing/Commercial/Academe
Agriculture
Plantation/Non-Plantation
Note: Minimum Wage Rate refers to basic pay and cost of living allowance (COLA).
a Integration of P5.00 COLA into the basic pay.
b Second tranche of wage increase effective May 01, 2018.
The increase in basic wage is P10.00.
INDICATOR/SECTORChartered Cities and First Class
MunicipalitiesOther Municipalities
Monthly Minimum Wage Rates (Under W.O. No. RBXI-DW-01 Effective December 16, 2017)
Domestic Workers 3,000.00 2,000.00
INDICATOR/SECTORChartered Cities and First Class
MunicipalitiesOther Municipalities
Monthly Minimum Wage Rates (Under W.O. No. RXIII-DW-01 Effective December 10, 2017)
Domestic Workers 2,500.00 2,000.00
Source of data: National Wages and Productivity Commission.
INDICATOR/SECTORChartered Cities and First Class
MunicipalitiesOther Municipalities
Monthly Minimum Wage Rates (Under W.O. No. RXIII-DW-01 Effective October 12, 2016)
Domestic Workers 3,000.00 2,500.00
305.00
290.00
305.00
305.00
Minimum Wage Rates
280.00
270.00
311.00
Minimum Wage Rates
290.00
REGION XII - SOCCSKSARGEN
370.00
355.00
370.00
365.00
TABLE 21 – Minimum Wage Rates by Sector and Region,
Philippines: As of October 3, 2018 (Continued)(In Pesos)
REGION XI - DAVAO REGION
Minimum Wage Rates
305.00
305.00
INDICATOR/SECTOR(Under W.O. No. RBARMM-16 Effective June 15, 2018)
INIDICATOR/SECTOR(Under W.O. No. RBXI-19 Effective August 16, 2018)
INIDICATOR/SECTOR(Under W.O. No. RBXII-19 Effective May 11, 2018)
a
INDICATOR/SECTOR(Under W.O. No. RXIII-15 Effective December 8, 2017)
b
Minimum Wage Rates
36
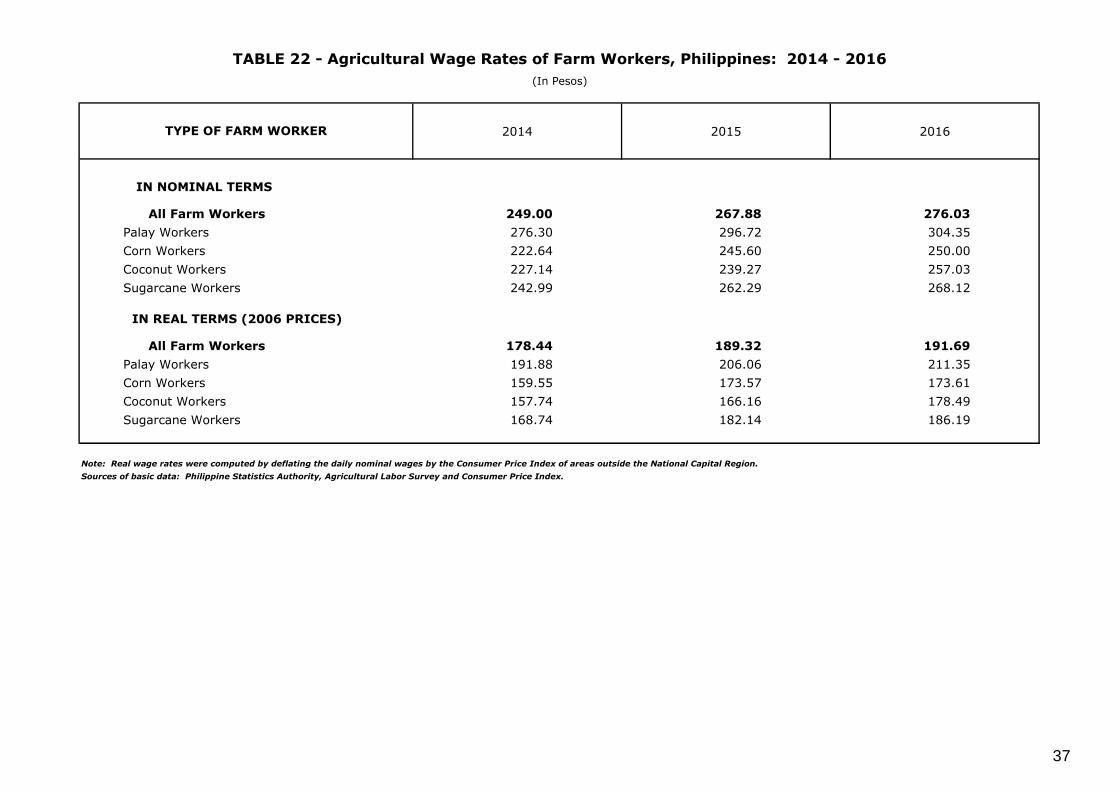
2014 2015 2016
IN NOMINAL TERMS
All Farm Workers 249.00 267.88 276.03
Palay Workers 276.30 296.72 304.35
Corn Workers 222.64 245.60 250.00
Coconut Workers 227.14 239.27 257.03
Sugarcane Workers 242.99 262.29 268.12
IN REAL TERMS (2006 PRICES)
All Farm Workers 178.44 189.32 191.69
Palay Workers 191.88 206.06 211.35
Corn Workers 159.55 173.57 173.61
Coconut Workers 157.74 166.16 178.49
Sugarcane Workers 168.74 182.14 186.19
Note: Real wage rates were computed by deflating the daily nominal wages by the Consumer Price Index of areas outside the National Capital Region.
Sources of basic data: Philippine Statistics Authority, Agricultural Labor Survey and Consumer Price Index.
TYPE OF FARM WORKER
TABLE 22 - Agricultural Wage Rates of Farm Workers, Philippines: 2014 - 2016
(In Pesos)
37

2015 2018
Ave Ave 1st Qtr 2nd Qtr 3rd Qtr 4th Qtr Ave 1st Qtr 3rd Qtr 4th Qtr 1st Qtr
AT CURRENT PRICES
Total, Non-Agricultural Industries 2,643.2 2,760.5 2576.2r
2,592.9 2,884.6 2,988.1 2,886.2 2,699.7 2,682.4 3,052.5 3,110.2 2,824.2
Mining and Quarrying 4,514.0 4,522.7 2,575.8 4,152.3 6,493.5 4,869.1 4,761.7 2,706.4 4,391.5 6,911.2 5,037.5 2,666.5
Manufacturing 1,373.7 1,428.7 1,072.6 1,531.4 1,571.9 1,538.9 1,551.4 1,208.1 1,616.2 1,731.2 1,650.1 1,251.7
Electricity and Water 4,338.5 4,541.5 3,790.6 4,560.8 5,543.7 4,270.8 4,469.8 3,519.0 4,844.3 5,387.4 4,128.5 3,503.3
Construction 2,799.1 2,857.5 2,779.8 3,123.5 2,788.9 2,737.6 2,991.7 2,883.1 3,431.7 2,852.3 2,799.6 3,031.7
Wholesale and Retail Trade 2,273.9 2,331.7 2,315.1 2,337.1 2,305.8 2,368.7 2,415.5 2,385.1 2,466.8 2,345.6 2,464.4 2,456.2
Transportation and Communications 5,962.1 5,551.3 6,009.0 5,528.1 5,081.7 5,586.2 5,701.4 5,867.3 5,706.9 5,369.1 5,862.3 6,236.7
Finance 2,295.7 2,320.1 2,396.9 2,483.1 2,147.2 2,253.3 2,329.3 2,370.1 2,432.8 2,176.4 2,337.9 2,384.3
Real Estate 1,535.6 1,628.0 1,614.5 1,633.6 1,643.8 1,620.1 1,739.0 1,701.9 1,747.9 1,830.8 1,675.3 1,772.0
Private Services 7,015.1 7,629.8 7443.3r
7,572.4 7,595.3 7,908.1 7,886.7 7,738.2 7,791.7 7,873.2 8,143.6 8,109.6
AT CONSTANT 1978 PRICES
Total, Non-Agricultural Industries 1
118.4 121.4 114.1 114.5 126.1 131.0 123.1 115.9 114.9 129.4 132.0 116.8
Mining and Quarrying 202.1 198.8 114.1 183.4 284.0 213.5 202.8 116.2 188.2 293.1 213.7 110.2
Manufacturing 61.6 62.8 47.5 67.6 68.7 67.5 66.1 51.9 69.2 73.4 70.0 51.7
Electricity and Water 194.3 199.8 167.9 201.5 242.4 187.3 190.6 151.1 207.6 228.5 175.2 144.8
Wholesale and Retail Trade 101.9 102.6 102.5 103.2 100.8 103.9 103.1 102.4 105.7 99.5 104.6 101.5
Transportation and Communications 267.1 244.4 266.1 244.2 222.2 244.9 243.2 251.9 244.5 227.7 248.7 257.8
Finance 102.9 102.2 106.2 109.7 93.9 98.8 99.4 101.8 104.2 92.3 99.2 98.6
Real Estate 68.8 71.7 71.5 72.2 71.9 71.0 74.2 73.1 74.9 77.6 71.1 73.3
Private Services 314.3 335.8 329.7 334.5 332.1 346.7 336.4 332.3 333.8 333.9 345.5 335.3
Note: Averages are obtained by adding the four (4) quarterly indices of compensations and dividing the total.
r Revised.
1 Excludes index of compensation in construction.
Source of basic data: Philippine Statistics Authority, Quarterly Economic Indices of the Philippines.
Definition:
Compensation - refers to remuneration in cash and in kind paid to employees at regular intervals for time work or work done. It is reported gross before any deductions are made by the
employer in respect of taxes, contributions of employees to social security and pension schemes, life insurance premiums, union dues and other obligations of employees.
It consists of total salaries and wages, commissions and other benefits, and employer's contribution to social security and pension schemes and similar benefits.
MAJOR INDUSTRY GROUP2016
TABLE 23 - Indices of Compensation Per Employee in Non - Agricultural Industries
by Major Industry Group, Philippines: 2015 - First Quarter 2018
2nd Qtr
2017
38
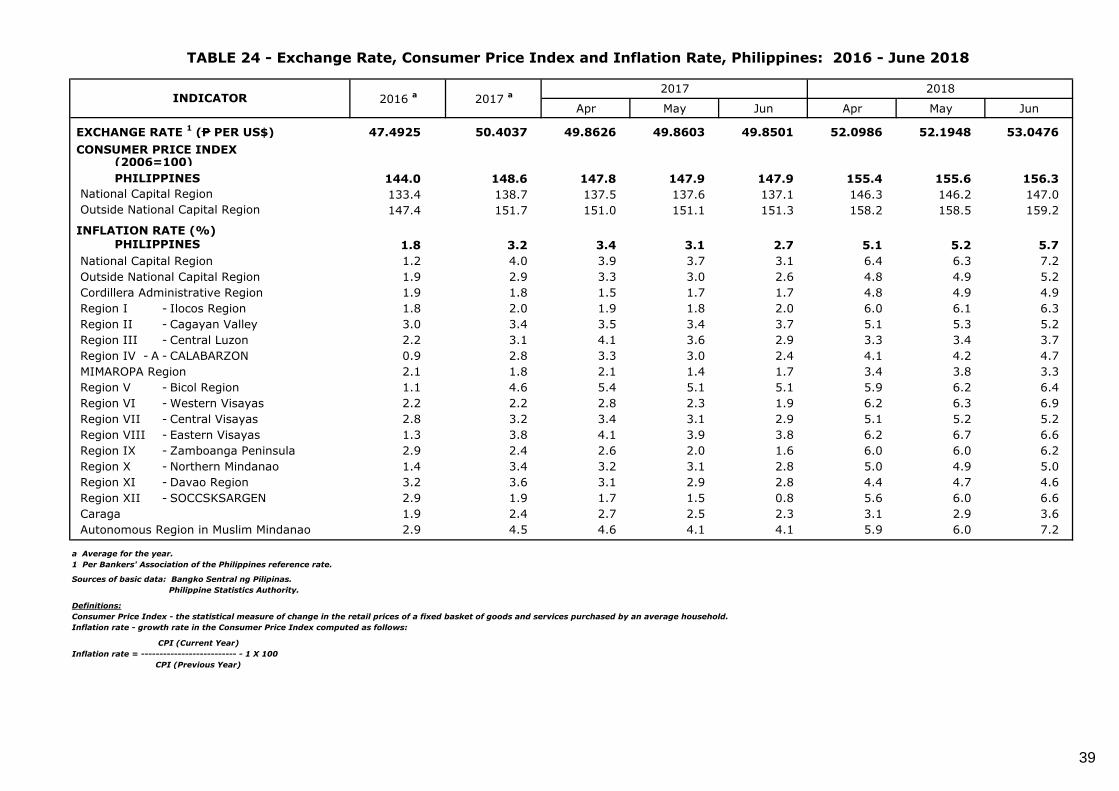
Apr May Jun Apr May Jun
EXCHANGE RATE 1 (P PER US$) 47.4925 50.4037 49.8626 49.8603 49.8501 52.0986 52.1948 53.0476
CONSUMER PRICE INDEX (2006=100)
144.0 148.6 147.8 147.9 147.9 155.4 155.6 156.3
National Capital Region 133.4 138.7 137.5 137.6 137.1 146.3 146.2 147.0
Outside National Capital Region 147.4 151.7 151.0 151.1 151.3 158.2 158.5 159.2
INFLATION RATE (%)
1.8 3.2 3.4 3.1 2.7 5.1 5.2 5.7
National Capital Region 1.2 4.0 3.9 3.7 3.1 6.4 6.3 7.2
Outside National Capital Region 1.9 2.9 3.3 3.0 2.6 4.8 4.9 5.2
Cordillera Administrative Region 1.9 1.8 1.5 1.7 1.7 4.8 4.9 4.9
Region I - Ilocos Region 1.8 2.0 1.9 1.8 2.0 6.0 6.1 6.3
Region II - Cagayan Valley 3.0 3.4 3.5 3.4 3.7 5.1 5.3 5.2
Region III - Central Luzon 2.2 3.1 4.1 3.6 2.9 3.3 3.4 3.7
Region IV - A - CALABARZON 0.9 2.8 3.3 3.0 2.4 4.1 4.2 4.7
MIMAROPA Region 2.1 1.8 2.1 1.4 1.7 3.4 3.8 3.3
Region V - Bicol Region 1.1 4.6 5.4 5.1 5.1 5.9 6.2 6.4
Region VI - Western Visayas 2.2 2.2 2.8 2.3 1.9 6.2 6.3 6.9
Region VII - Central Visayas 2.8 3.2 3.4 3.1 2.9 5.1 5.2 5.2
Region VIII - Eastern Visayas 1.3 3.8 4.1 3.9 3.8 6.2 6.7 6.6
Region IX - Zamboanga Peninsula 2.9 2.4 2.6 2.0 1.6 6.0 6.0 6.2
Region X - Northern Mindanao 1.4 3.4 3.2 3.1 2.8 5.0 4.9 5.0
Region XI - Davao Region 3.2 3.6 3.1 2.9 2.8 4.4 4.7 4.6
Region XII - SOCCSKSARGEN 2.9 1.9 1.7 1.5 0.8 5.6 6.0 6.6
Caraga 1.9 2.4 2.7 2.5 2.3 3.1 2.9 3.6
Autonomous Region in Muslim Mindanao 2.9 4.5 4.6 4.1 4.1 5.9 6.0 7.2
a Average for the year.
1 Per Bankers' Association of the Philippines reference rate.
Sources of basic data: Bangko Sentral ng Pilipinas.
Philippine Statistics Authority.
Definitions:
Consumer Price Index - the statistical measure of change in the retail prices of a fixed basket of goods and services purchased by an average household.
Inflation rate - growth rate in the Consumer Price Index computed as follows:
CPI (Current Year)
Inflation rate = -------------------------- - 1 X 100
CPI (Previous Year)
TABLE 24 - Exchange Rate, Consumer Price Index and Inflation Rate, Philippines: 2016 - June 2018
2018
PHILIPPINES
PHILIPPINES
INDICATOR2017
2016 a
2017 a
39

Apr May Jun Apr May Jun
PHILIPPINES 0.69 0.67 0.68 0.68 0.68 0.64 0.64 0.64
National Capital Region 0.75 0.72 0.73 0.73 0.73 0.68 0.68 0.68
Outside National Capital Region 0.68 0.66 0.66 0.66 0.66 0.63 0.63 0.63
Cordillera Administrative Region 0.70 0.69 0.70 0.70 0.69 0.67 0.67 0.66
Region I - Ilocos Region 0.73 0.72 0.72 0.72 0.72 0.68 0.68 0.68
Region II - Cagayan Valley 0.67 0.65 0.66 0.66 0.65 0.63 0.62 0.62
Region III - Central Luzon 0.69 0.67 0.67 0.67 0.67 0.65 0.65 0.65
Region IV - A - CALABARZON 0.71 0.69 0.69 0.69 0.69 0.66 0.66 0.66
MIMAROPA Region 0.68 0.66 0.67 0.67 0.67 0.64 0.64 0.64
Region V - Bicol Region 0.68 0.65 0.65 0.65 0.65 0.61 0.61 0.61
Region VI - Western Visayas 0.67 0.65 0.66 0.66 0.65 0.62 0.62 0.61
Region VII - Central Visayas 0.67 0.65 0.66 0.66 0.65 0.63 0.62 0.62
Region VIII - Eastern Visayas 0.65 0.63 0.63 0.63 0.63 0.59 0.59 0.59
Region IX - Zamboanga Peninsula 0.63 0.62 0.62 0.62 0.62 0.58 0.59 0.58
Region X - Northern Mindanao 0.65 0.62 0.63 0.63 0.63 0.60 0.60 0.60
Region XI - Davao Region 0.65 0.63 0.63 0.63 0.63 0.61 0.60 0.60
Region XII - SOCCSKSARGEN 0.65 0.63 0.64 0.64 0.63 0.60 0.60 0.60
Caraga 0.62 0.60 0.60 0.60 0.60 0.58 0.58 0.58
Autonomous Region in Muslim
Mindanao 0.62 0.59 0.60 0.60 0.60 0.57 0.56 0.56
a Average for the year.
Source of basic data: Philippine Statistics Authority, Consumer Price Index.
Definitions:
Purchasing Power of Peso - the equivalent value at base year (2006) prices of goods and services that a peso could buy at current prices.
1
Purchasing Power of Peso =-------------------- X 100
CPI
TABLE 25 - Purchasing Power of Peso, Philippines: 2016 - June 2018
(2006 = 1.00)
2016 a
PURCHASING POWER OF PESO
INDICATOR2017 2018
2017 a
40

Total 1st Qtr 2nd Qtr 3rd Qtr 4th Qtr Total 1st Qtr 2nd Qtr 3rd Qtr 4th Qtr 1st Qtr r 2nd Qtr
AT CURRENT PRICES
Gross National Income (PB) 17,430.3 3,997.4 4,336.1 4,209.1 4,887.7 19,006.7 4,356.5 4,741.0 4,623.2 5,285.9 4,764.7 5,182.4
Growth Rate (%) 8.2 7.6 8.2 8.6 8.2 9.0 9.0 9.3 9.8 8.1 9.4 9.3
Per Capita GNI (In P) 168,828 38,956 42,085 40,686 47,055 181,152 41,854 45,367 44,063 50,178 45,049 48,807
Gross Domestic Product (PB) 14,479.9 3,267.9 3,613.1 3,483.8 4,115.1 15,806.4 3,570.7 3,946.1 3,818.5 4,471.0 3,914.6 4,323.5
Growth Rate (%) 8.7 7.6 8.8 9.3 9.0 9.2 9.3 9.2 9.6 8.6 9.6 9.6
Per Capita GDP (In P) 140,251 31,847 35,068 33,676 39,617 150,650 34,305 37,761 36,394 42,442 37,012 40,718
AT CONSTANT 2000 PRICES
Gross National Income (PB) 9,755.1 2,304.4 2,477.6 2,349.5 2,623.6 10,394.8 2,448.9 2,641.9 2,521.4 2,782.6 2,603.1 2,794.7
Growth Rate (%) 6.7 7.2 6.9 6.7 6.0 6.6 6.3 6.6 7.3 6.1 6.3 5.8
Per Capita GNI (In P) 94,487 22,457 24,047 22,711 25,258 99,073 23,527 25,281 24,031 26,414 24,612 26,320
Gross Domestic Product (PB) 8,122.7 1,886.6 2,081.2 1,953.6 2,201.3 8,665.7 2,008.4 2,219.5 2,093.3 2,344.5 2,140.4 2,352.5
Growth Rate (%) 6.9 6.7 7.0 7.1 6.7 6.7 6.5 6.6 7.2 6.5 6.6 6.0
Per Capita GDP (In P) 78,676 18,386 20,199 18,884 21,193 82,592 19,295 21,238 19,951 22,256 20,237 22,156
Note: Details may not add up to totals due to rounding.
r Revised.
Source of data: Philippine Statistics Authority, National Accounts of the Philippines.
INDICATOR2017 2018
TABLE 26 - Gross National Income and Gross Domestic Product by Quarter,
Philippines: 2016 - Second Quarter 2018
2016
41

Total 4th Qtr 1st Qtr 1st Qtr 2nd Qtr
TOTAL 8,016 465 3,313 2,121 2,117 9,262r
-1,105r
3,087r
2,545r
4,735r
1,945 3,150
Net Foreign Direct Investment 1
8,280 1,423 2,946 1,685 2,226 10,058r
1,539r
2,502r
2,431r
3,586r
2,227 3,528
Net Foreign Portfolio Investment 2
-264 -958 367 436 -109 -796 -2,644 585 114 1,149 -282 -378
Notes: 1. Details may not add up to totals due to rounding.
2. Balance of Payments Statistics are based on the IMF's Balance of Payments and International Investment Position Manual, 6th Edition.
p Preliminary.
r Revised.
1 Balance of Payments (BOP) Net FDI flows refer to non-residents' placements less non-residents' withdrawals + reinvested earnings + net inter-company loans.
2 Net foreign portfolio investment refers to non-residents' placements less non-residents' withdrawals.
Source of data: Bangko Sentral ng Pilipinas.
Definitions:
Direct Investments - transactions between domestic enterprises and foreign investors or foreign enterprises and domestic investors aimed at creating or expanding
investor's permanent interest in said enterprises.
Portfolio Invetments - cover transactions in equity in which the investor holds less than 10 percent of the total equity of an enterprise.
2nd Qtr 3rd Qtr Total 2nd Qtr TYPE OF INVESTMENT
2016
TABLE 27 - Net Inward Foreign Investments by Type (BOP Concept), Philippines: 2016 - Second Quarter 2018
(In US$ Million)
2018 p2017
4th Qtr 3rd Qtr 1st Qtr
42
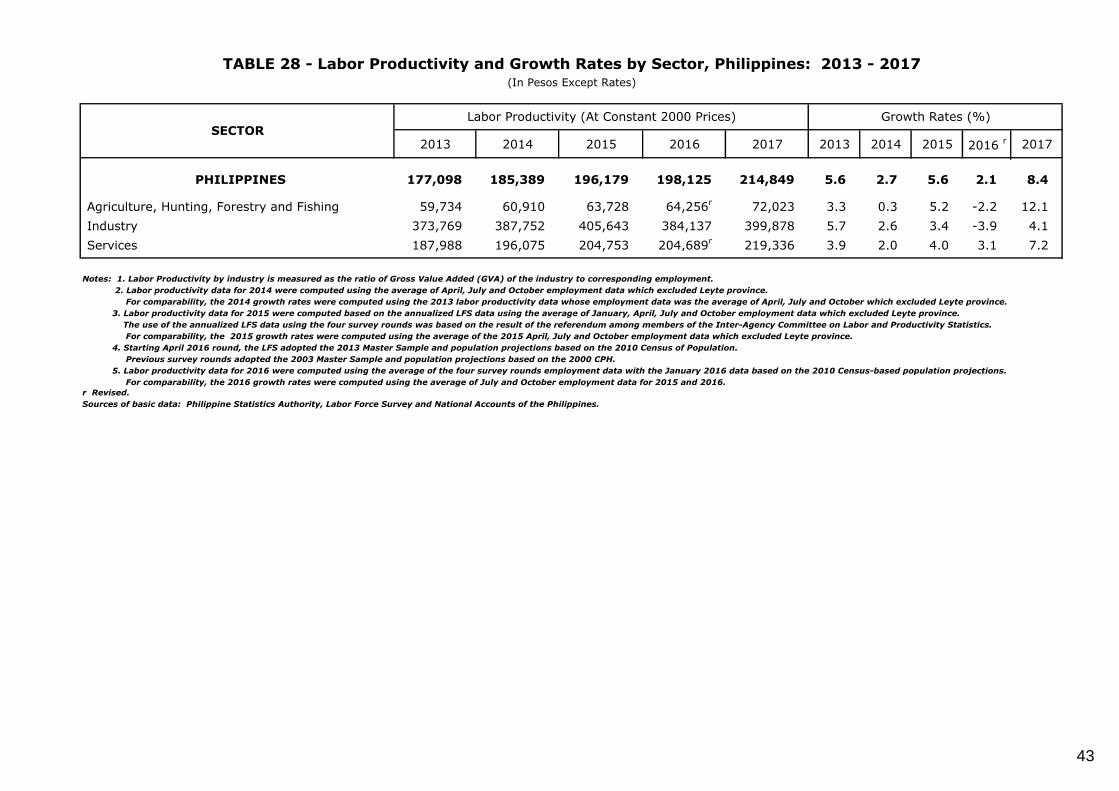
2013 2014 2015 2016 2017 2013 2014 2015 2016 r 2017
PHILIPPINES 177,098 185,389 196,179 198,125 214,849 5.6 2.7 5.6 2.1 8.4
Agriculture, Hunting, Forestry and Fishing 59,734 60,910 63,728 64,256r
72,023 3.3 0.3 5.2 -2.2 12.1
Industry 373,769 387,752 405,643 384,137 399,878 5.7 2.6 3.4 -3.9 4.1
Services 187,988 196,075 204,753 204,689r
219,336 3.9 2.0 4.0 3.1 7.2
Notes: 1. Labor Productivity by industry is measured as the ratio of Gross Value Added (GVA) of the industry to corresponding employment.
2. Labor productivity data for 2014 were computed using the average of April, July and October employment data which excluded Leyte province.
For comparability, the 2014 growth rates were computed using the 2013 labor productivity data whose employment data was the average of April, July and October which excluded Leyte province.
3. Labor productivity data for 2015 were computed based on the annualized LFS data using the average of January, April, July and October employment data which excluded Leyte province.
The use of the annualized LFS data using the four survey rounds was based on the result of the referendum among members of the Inter-Agency Committee on Labor and Productivity Statistics.
For comparability, the 2015 growth rates were computed using the average of the 2015 April, July and October employment data which excluded Leyte province.
4. Starting April 2016 round, the LFS adopted the 2013 Master Sample and population projections based on the 2010 Census of Population.
Previous survey rounds adopted the 2003 Master Sample and population projections based on the 2000 CPH.
5. Labor productivity data for 2016 were computed using the average of the four survey rounds employment data with the January 2016 data based on the 2010 Census-based population projections.
For comparability, the 2016 growth rates were computed using the average of July and October employment data for 2015 and 2016.
r Revised.
Sources of basic data: Philippine Statistics Authority, Labor Force Survey and National Accounts of the Philippines.
SECTORLabor Productivity (At Constant 2000 Prices) Growth Rates (%)
TABLE 28 - Labor Productivity and Growth Rates by Sector, Philippines: 2013 - 2017(In Pesos Except Rates)
43
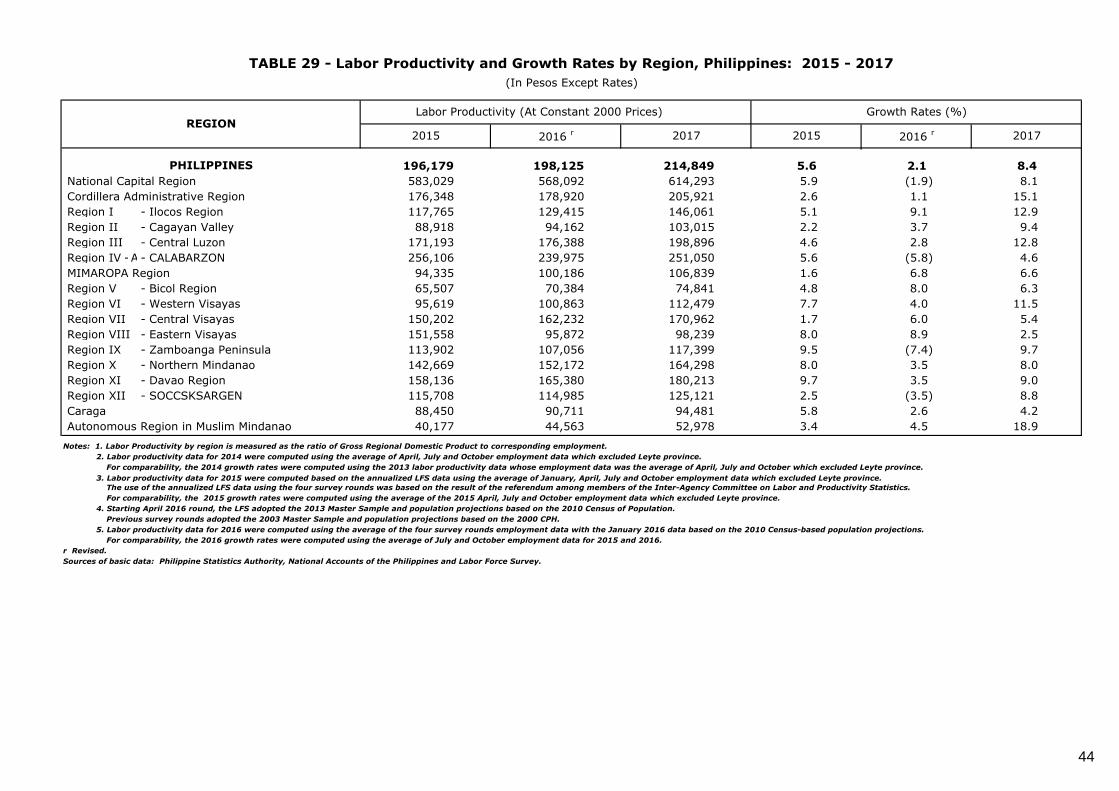
196,179 198,125 214,849 5.6 2.1 8.4
National Capital Region 583,029 568,092 614,293 5.9 (1.9) 8.1
Cordillera Administrative Region 176,348 178,920 205,921 2.6 1.1 15.1
Region I - Ilocos Region 117,765 129,415 146,061 5.1 9.1 12.9
Region II - Cagayan Valley 88,918 94,162 103,015 2.2 3.7 9.4
Region III - Central Luzon 171,193 176,388 198,896 4.6 2.8 12.8
Region IV -A - CALABARZON 256,106 239,975 251,050 5.6 (5.8) 4.6
MIMAROPA Region 94,335 100,186 106,839 1.6 6.8 6.6
Region V - Bicol Region 65,507 70,384 74,841 4.8 8.0 6.3
Region VI - Western Visayas 95,619 100,863 112,479 7.7 4.0 11.5
Region VII - Central Visayas 150,202 162,232 170,962 1.7 6.0 5.4
Region VIII - Eastern Visayas 151,558 95,872 98,239 8.0 8.9 2.5
Region IX - Zamboanga Peninsula 113,902 107,056 117,399 9.5 (7.4) 9.7
Region X - Northern Mindanao 142,669 152,172 164,298 8.0 3.5 8.0
Region XI - Davao Region 158,136 165,380 180,213 9.7 3.5 9.0
Region XII - SOCCSKSARGEN 115,708 114,985 125,121 2.5 (3.5) 8.8
Caraga 88,450 90,711 94,481 5.8 2.6 4.2
Autonomous Region in Muslim Mindanao 40,177 44,563 52,978 3.4 4.5 18.9
Notes: 1. Labor Productivity by region is measured as the ratio of Gross Regional Domestic Product to corresponding employment.
2. Labor productivity data for 2014 were computed using the average of April, July and October employment data which excluded Leyte province.
For comparability, the 2014 growth rates were computed using the 2013 labor productivity data whose employment data was the average of April, July and October which excluded Leyte province.
3. Labor productivity data for 2015 were computed based on the annualized LFS data using the average of January, April, July and October employment data which excluded Leyte province.
The use of the annualized LFS data using the four survey rounds was based on the result of the referendum among members of the Inter-Agency Committee on Labor and Productivity Statistics.
For comparability, the 2015 growth rates were computed using the average of the 2015 April, July and October employment data which excluded Leyte province.
4. Starting April 2016 round, the LFS adopted the 2013 Master Sample and population projections based on the 2010 Census of Population.
Previous survey rounds adopted the 2003 Master Sample and population projections based on the 2000 CPH.
5. Labor productivity data for 2016 were computed using the average of the four survey rounds employment data with the January 2016 data based on the 2010 Census-based population projections.
For comparability, the 2016 growth rates were computed using the average of July and October employment data for 2015 and 2016.
r Revised.
Sources of basic data: Philippine Statistics Authority, National Accounts of the Philippines and Labor Force Survey.
TABLE 29 - Labor Productivity and Growth Rates by Region, Philippines: 2015 - 2017
(In Pesos Except Rates)
REGION2017
Labor Productivity (At Constant 2000 Prices)
2016 r2015 2016
r 2015
PHILIPPINES
2017
Growth Rates (%)
44

2015 2016 2017 2015-2016 2016-2017
13,322.0 14,479.9 15,806.4 8.7 9.2
National Capital Region 5,043.6 5,526.3 6,016.2 9.6 8.9
Cordillera Administrative Region 234.6 242.9 272.3 3.5 12.1
Region I - Ilocos Region 409.1 450.4 487.6 10.1 8.3
Region II - Cagayan Valley 236.8 251.4 280.6 6.2 11.6
Region III - Central Luzon 1,187.3 1,304.1 1,459.6 9.8 11.9
Region IV - A - CALABARZON 2,059.5 2,142.9 2,316.4 4.0 8.1
204.8 210.5 236.5 2.8 12.3
Region V - Bicol Region 282.8 306.5 331.7 8.4 8.2
Region VI - Western Visayas 549.8 596.2 658.0 8.4 10.4
Region VII - Central Visayas 867.2 964.9 1,032.6 11.3 7.0
Region VIII - Eastern Visayas 271.9 311.7 321.0 14.6 3.0
Region IX - Zamboanga Peninsula 277.2 295.1 312.5 6.5 5.9
Region X - Northern Mindanao 517.6 576.8 626.5 11.4 8.6
Region XI - Davao Region 565.2 641.2 728.8 13.5 13.7
Region XII - SOCCSKSARGEN 356.0 386.4 426.2 8.6 10.3
Caraga 159.0 167.3 180.9 5.2 8.1
Autonomous Region in Muslim Mindanao 99.6 105.2 119.1 5.7 13.1
7,600.2 8,122.7 8,665.7 6.9 6.7
National Capital Region 2,770.6 2,976.2 3,158.1 7.4 6.1
Cordillera Administrative Region 133.8 136.9 153.4 2.3 12.1
Region I - Ilocos Region 237.2 257.3 272.3 8.5 5.8
Region II - Cagayan Valley 134.4 139.5 149.6 3.8 7.2
Region III - Central Luzon 706.3 773.1 844.7 9.5 9.3
Region IV - A - CALABARZON 1,302.3 1,364.7 1,456.1 4.8 6.7
122.3 125.4 133.2 2.6 6.2
Region V - Bicol Region 155.4 164.1 172.4 5.5 5.1
Region VI - Western Visayas 305.5 323.5 350.8 5.9 8.4
Region VII - Central Visayas 482.9 524.6 551.2 8.6 5.1
Region VIII - Eastern Visayas 153.2 171.6 174.7 12.0 1.8
Region IX - Zamboanga Peninsula 157.6 164.9 168.7 4.6 2.3
Region X - Northern Mindanao 283.8 305.0 323.0 7.5 5.9
Region XI - Davao Region 304.4 333.4 369.8 9.5 10.9
Region XII - SOCCSKSARGEN 203.2 213.2 230.6 4.9 8.2
Caraga 96.6 98.5 102.7 2.0 4.3
Autonomous Region in Muslim Mindanao 50.6 50.8 54.5 0.4 7.3
Notes: 1. Details may not add up to totals due to rounding.
2. Growth rates based on actual figures.Source of data: Philippine Statistics Authority, Gross Regional Domestic Product 2015 - 2017.
TABLE 30 - Gross Regional Domestic Product, Philippines: 2015 - 2017
(Estimates as of April 2018)
PHILIPPINES
AT CONSTANT 2000 PRICES
Growth Rates (%)
MIMAROPA Region
MIMAROPA Region
PHILIPPINES
REGION
AT CURRENT PRICES
Levels (In Billion Pesos)
45

PART II
Related Labor andEmployment Statistics

Total 1 - 4 5 - 9 10 - 19 20 - 49 50 - 99 100 - 199 200 & Over
924,721 691,174 137,262 55,547 24,450 8,415 3,829 4,044
National Capital Region 194,134 125,563 34,230 17,747 9,783 3,426 1,567 1,818
Cordillera Administrative Region 19,203 15,507 2,373 891 272 77 41 42
Region I - Ilocos Region 48,719 39,516 6,038 2,124 703 212 84 42
Region II - Cagayan Valley 29,215 23,461 3,894 1,308 384 95 42 31
Region III - Central Luzon 103,634 80,125 14,454 5,512 2,186 749 303 305
Region IV - A - CALABARZON 138,465 106,080 19,728 7,063 3,183 1,189 565 657
MIMAROPA Region 27,226 22,621 3,131 1,023 314 91 22 24
Region V - Bicol Region 36,354 28,166 5,472 1,766 596 195 110 49
Region VI - Western Visayas 56,107 41,798 8,724 3,403 1,401 408 192 181
Region VII - Central Visayas 62,139 44,390 9,813 4,436 2,038 720 347 395
Region VIII - Eastern Visayas 27,830 21,698 4,209 1,327 398 116 48 34
Region IX - Zamboanga Peninsula 31,040 25,458 3,670 1,274 384 140 62 52
Region X - Northern Mindanao 35,328 26,507 5,376 2,125 814 284 120 102
Region XI - Davao Region 49,548 36,806 7,992 2,939 1,054 394 195 168
Region XII - SOCCSKSARGEN 36,109 30,015 3,983 1,288 499 175 71 78
Caraga 17,092 13,356 2,454 855 249 86 46 46
Autonomous Region in Muslim Mindanao 12,578 10,107 1,721 466 192 58 14 20
Source of data: Philippine Statistics Authority, 2017 List of Establishments.
TABLE 31 - Number of Establishments by Region and Employment Size, Philippines: 2017
REGION
Employment Size
PHILIPPINES
46

Total 1 - 4 5 - 9 10 - 19 20 - 49 50 - 99 100 - 199
7,832,089 1,504,923 864,825 721,186 726,309 576,975 528,033 2,909,838
National Capital Region 2,949,627 289,689 218,197 231,908 290,563 234,251 216,257 1,468,762
Cordillera Administrative Region 107,204 31,744 14,918 11,481 8,068 5,331 5,649 30,013
Region I - Ilocos Region 214,852 85,070 37,552 27,527 21,098 14,787 11,523 17,295
Region II - Cagayan Valley 125,987 50,502 24,267 16,843 11,358 6,431 5,814 10,772
Region III - Central Luzon 700,104 170,486 90,650 71,682 64,239 51,483 41,607 209,957
Region IV- A - CALABARZON 1,198,563 238,400 123,746 91,540 95,673 82,423 78,199 488,582
MIMAROPA Region 102,240 43,642 19,749 13,216 9,182 6,070 3,002 7,379
Region V - Bicol Region 182,527 61,797 34,150 22,526 17,503 13,312 15,107 18,132
Region VI - Western Visayas 374,962 92,897 55,414 44,411 41,378 28,028 25,778 87,056
Region VII - Central Visayas 648,791 95,541 62,217 57,100 60,296 49,034 47,778 276,825
Region VIII - Eastern Visayas 133,480 50,360 26,272 17,155 11,569 7,945 6,475 13,704
Region IX - Zamboanga Peninsula 148,789 52,961 22,804 16,442 11,583 9,882 8,479 26,638
Region X - Northern Mindanao 242,012 56,676 33,794 27,693 24,304 19,225 16,478 63,842
Region XI - Davao Region 347,867 78,469 50,078 38,088 31,604 26,734 27,708 95,186
Region XII - SOCCSKSARGEN 199,615 56,399 24,866 16,659 14,858 12,065 9,894 64,874
Caraga 97,546 27,885 15,437 10,994 7,383 6,045 6,386 23,416
Autonomous Region in Muslim Mindanao 57,923 22,405 10,714 5,921 5,650 3,929 1,899 7,405
Source of data: Philippine Statistics Authority, 2017 List of Establishments.
TABLE 32 - Establishments' Employment by Region and Employment Size, Philippines: 2017
REGION
Employment Size
200 & Over
PHILIPPINES
47

1-4 5-9 10-19 20-49 50-99 100-199
PHILIPPINES 924,721 691,174 137,262 55,547 24,450 8,415 3,829 4,044
Agriculture, Forestry, and Fishing 9,209 4,399 2,384 1,068 786 288 129 155
Industrial Sector 124,052 85,388 21,086 7,976 4,759 2,211 1,254 1,378
Mining and Quarrying 930 377 276 89 104 33 19 32
Manufacturing 117,035 83,568 19,577 6,754 3,604 1,678 890 964
Electricity, Gas, Steam, and Air Conditioning Supply 1,234 232 196 270 254 96 98 88
Water Supply; Sewerage, Waste Management 1,466 375 364 315 231 105 49 27
and Remediation Activities
Construction 3,387 836 673 548 566 299 198 267
Non-Industrial Sector 791,460 601,387 113,792 46,503 18,905 5,916 2,446 2,511
Wholesale and Retail Trade; Repair of Motor
Vehicles and Motorcycles 424,061 338,994 56,444 19,079 6,557 1,785 778 424
Transportation and Storage 8,496 3,794 1,950 1,197 801 413 179 162
Accommodation and Food Service Activities 121,821 87,312 20,270 8,395 4,314 1,191 258 81
Information and Communication 35,730 32,539 1,479 680 566 222 107 137
Financial and Insurance Activities 41,143 23,497 10,964 4,855 1,295 280 121 131
Real Estate Activities 9,748 6,109 1,868 1,022 487 155 58 49
Professional, Scientific and Technical Activities 16,885 12,448 2,428 1,081 520 230 89 89
Administrative and Support Service Activities 16,194 9,976 2,509 1,225 735 439 346 964
Education 17,504 5,170 3,810 4,691 2,431 834 319 249
Human Health and Social Work Activities 27,422 22,862 2,361 1,046 553 263 153 184
Arts, Entertainment, and Recreation 14,956 11,396 2,271 937 236 57 27 32
Other Service Activities 57,500 47,290 7,438 2,295 410 47 11 9
Source of data: Philippine Statistics Authority, 2017 List of Establishments.
200 & Over
TABLE 33 - Number of Establishments by Major Industry Group/Sector and Employment Size, Philippines: 2017
MAJOR INDUSTRY GROUP/SECTOR Employment Size
Total
48

1-4 5-9 10-19 20-49 50-99 100-199
PHILIPPINES 7,832,089 1,504,923 864,825 721,186 726,309 576,975 528,033 2,909,838
Agriculture, Forestry, and Fishing 191,169 11,354 15,508 14,331 24,297 19,931 17,651 88,097
Industrial Sector 1,928,593 202,387 131,723 103,971 144,887 152,731 174,614 1,018,280
Mining and Quarrying 42,709 1,024 1,745 1,226 3,235 2,214 2,778 30,487
Manufacturing 1,468,158 197,619 121,887 87,346 109,190 115,987 123,142 712,987
Electricity, Gas, Steam, and Air Conditioning Supply 64,447 598 1,325 3,701 7,840 6,484 14,376 30,123
Water Supply; Sewerage, Waste Management 38,611 965 2,439 4,168 7,069 7,197 6,792 9,981
and Remediation Activities
Construction 314,668 2,181 4,327 7,530 17,553 20,849 27,526 234,702
Non-Industrial Sector 5,712,327 1,291,182 717,594 602,884 557,125 404,313 335,768 1,803,461
Wholesale and Retail Trade; Repair of Motor
Vehicles and Motorcycles 1,903,168 728,604 352,370 243,839 190,077 121,469 106,340 160,469
Transportation and Storage 211,052 9,334 12,814 16,018 24,699 28,077 24,398 95,712
Accommodation and Food Service Activities 709,395 203,154 126,955 110,111 127,041 81,314 32,622 28,198
Information and Communication 220,124 58,537 9,244 9,208 16,981 15,393 14,989 95,772
Financial and Insurance Activities 391,471 57,908 71,456 61,999 36,198 18,943 16,653 128,314
Real Estate Activities 93,798 12,170 12,100 13,218 14,127 10,366 7,907 23,910
Professional, Scientific and Technical Activities 169,207 26,899 15,348 14,227 15,728 15,847 12,418 68,740
Administrative and Support Service Activities 1,132,921 21,304 16,108 15,992 22,539 30,452 48,383 978,143
Education 383,180 13,070 25,501 63,439 74,586 57,131 44,573 104,880
Human Health and Social Work Activities 213,228 41,553 14,871 13,825 17,178 18,330 22,210 85,261
Arts, Entertainment, and Recreation 93,869 22,875 14,249 12,056 6,717 3,877 3,896 30,199
Other Service Activities 190,914 95,774 46,578 28,952 11,254 3,114 1,379 3,863
Source of data: Philippine Statistics Authority, 2017 List of Establishments.
MAJOR INDUSTRY GROUP/SECTOREmployment Size
TABLE 34 - Establishments' Employment by Major Industry Group/Sector and Employment Size, Philippines: 2017
200 & Over Total
49

PHILIPPINES 22,730 6,068,162 267 4,882,860 215
National Capital Region 3,019 1,282,823 425 1,053,215 349
Cordillera Administrative Region 402 113,531 282 84,004 209
Region I - Ilocos Region 1,170 278,515 238 212,525 182
Region II - Cagayan Valley 816 193,589 237 132,063 162
Region III - Central Luzon 2,507 750,054 299 600,095 239
Region IV - A - CALABARZON 3,251 1,013,942 312 875,400 269
MIMAROPA Region 697 154,612 222 111,907 161
Region V - Bicol Region 1,262 236,476 187 202,469 160
Region VI - Western Visayas 1,699 384,039 226 299,808 176
Region VII - Central Visayas 1,672 399,734 239 323,434 193
Region VIII - Eastern Visayas 976 191,720 197 151,994 156
Region IX - Zamboanga Peninsula 824 156,872 190 118,758 144
Region X - Northern Mindanao 1,029 227,998 221 166,005 161
Region XI - Davao Region 1,156 285,560 247 219,680 190
Region XII - SOCCSKSARGEN 1,055 198,438 188 170,863 162
Caraga 579 114,745 198 92,243 159
Autonomous Region in Muslim
Mindanao 616 85,514 139 68,397 111
Notes: 1. Details may not add up to totals due to rounding.
2. The number of families was estimated using the household population projections based on the household population counts from the 2010 Census of Population and Housing (CPH).
Source of data: Philippine Statistics Authority, Family Income and Expenditures Survey.
Average
(In thousands)
TABLE 35 - Number of Families, and Total and Average Annual Family Income and Expenditure by Region,
Philippines: 2015
(At Current Prices)
REGION
Expenditure
Total
(In millions)
Number of Families
(In thousands)
Income
Average
(In thousands)
Total
(In millions)
50

16,871 20.5 26.3 18,935 19.7 25.2 21,753 3,747 21,927 16.5 21.6
National Capital Region 19,227 2.4 3.6 20,344 2.6 3.9 25,007 80 495 2.7 3.9
Cordillera Administrative Region 17,243 19.2 25.1 19,483 17.5 22.8 21,770 60 352 14.9 19.7
Region I - Ilocos Region 17,595 16.8 22.0 18,373 14.0 18.5 20,488 112 671 9.6 13.1
Region II - Cagayan Valley 17,330 20.2 25.5 19,125 17.0 22.1 21,860 95 554 11.7 15.8
Region III - Central Luzon 18,188 10.7 13.7 20,071 10.1 12.9 23,200 224 1,242 8.9 11.2
Region IV - A - CALABARZON 17,033 8.8 11.9 19,137 8.3 10.9 22,121 216 1,288 6.7 9.1
MIMAROPA Region 15,613 27.2 34.5 17,292 23.6 31.0 20,224 121 754 17.4 24.4
Region V - Bicol Region 16,888 35.3 44.2 18,257 32.3 41.1 21,476 347 2,172 27.5 36.0
Region VI - Western Visayas 15,971 23.6 30.8 18,029 22.8 29.1 21,070 282 1,728 16.6 22.4
Region VII - Central Visayas 16,662 26.0 31.0 18,767 25.7 30.2 21,914 394 2,057 23.6 27.6
Region VIII - Eastern Visayas 16,278 34.5 42.6 18,076 37.4 45.2 21,304 300 1,757 30.7 38.7
Region IX - Zamboanga Peninsula 16,260 39.5 45.8 18,054 33.7 40.1 20,925 214 1,275 26.0 33.9
Region X - Northern Mindanao 16,878 33.3 40.1 19,335 32.8 39.5 22,345 312 1,720 30.3 36.6
Region XI - Davao Region 17,120 25.5 31.4 19,967 25.0 30.7 22,754 192 1,092 16.6 22.0
Region XII - SOCCSKSARGEN 16,405 30.8 38.3 18,737 37.1 44.7 21,025 321 1,717 30.5 37.3
Caraga 18,309 46.0 54.4 19,629 31.9 40.3 22,570 178 1,062 30.8 39.1
Autonomous Region in Muslim
Mindanao 16,683 39.9 47.4 20,517 48.7 55.8 21,563 297 1,991 48.2 53.7
Notes: 1. Details may not add up to totals due to rounding.
2. Estimates were generated based on the refinements in the official poverty estimation methodology approved by the PSA Executive Board on February 1, 2011.
1 The annual per capita income/expenditure required or the amount to be spent for the cost of the basic food and non-food requirements (valued in peso).
2 The proportion of families/population with per capita income less than the per capita poverty threshold to the total number of families/population.
3 The number of families/population whose annual per capita income falls below the annual per capita poverty threshold.
Source of data: Philippine Statistics Authority.
Poverty Incidence 2 (%)
Families Population Families PopulationFamilies
Annual
Per Capita
Poverty
Threshold 1
(P)
Magnitude of Poor 3
(000)
Population
PHILIPPINES
Poverty Incidence 2
(%)
Families Population
Poverty Incidence 2
(%)REGION
2009
Annual
Per Capita
Poverty
Threshold 1
(P)
TABLE 36 - Annual Per Capita Poverty Threshold, Magnitude of Poor and Poverty Incidence by Region,
Philippines: 2009, 2012 and 2015
2012
Annual
Per Capita
Poverty
Threshold 1
(P)
2015
51

Women 25.9 25.7 25.6 22.5
Youth 21.1 21.6 22.3 19.4
Children 35.2 35.3 35.2 31.4
Senior Citizens 16.9 16.1 16.2 13.2
Individuals Residing in Urban Areas 12.6 12.6 13.0 11.5
Migrant and Formal Sector Workers 16.0 16.8 16.6 13.4
Farmers 38.5 38.0 38.3 34.3
Fishermen 41.2 41.3 39.2 34.0
Self-employed and Unpaid Family Workers 30.6 29.9 29.0 25.0
Employed Population (Working Poor) 22.9 22.8 21.9 18.0
Unemployed Population 16.5 16.8 18.7 16.4
Source of data: Philippine Statistics Authority.
Definitions:
Women - individuals whose declared sex is female.
Youth - individuals 15 to 30 years old.
Children - individuals below 18 years old.
Senior Citizens - individuals 60 years old and above.
Individuals Residing in Urban Areas - individuals residing in an urban area whose income falls below the official poverty threshold.
Migrant and Formal Sector Workers - individuals who are overseas contract workers (OCWs) or workers other than OCWs or employed persons working for private establishments and government organizations and corporations.
Farmers - employed individuals 15 years old and over whose primary occupation is farming and plant growing or animal production.
Fishermen - employed individuals 15 years old and over whose primary occupation is fishing.
Self-employed and Unpaid Family Workers - employed individuals 15 years old and over who are either self-employed or worked without pay on family-owned business.
Employed Population - individuals who are 15 years and over, who during the reference period are reported either at work or with a job but not at work.
Unemployed Population - individuals who are 15 years and over, who during the reference period are reported without work and currently available for work and seeking work.
BASIC SECTOR 2006 2009 2012 2015
TABLE 37 - Poverty Incidence of Basic Sectors, Philippines: 2006, 2009, 2012 and 2015
52
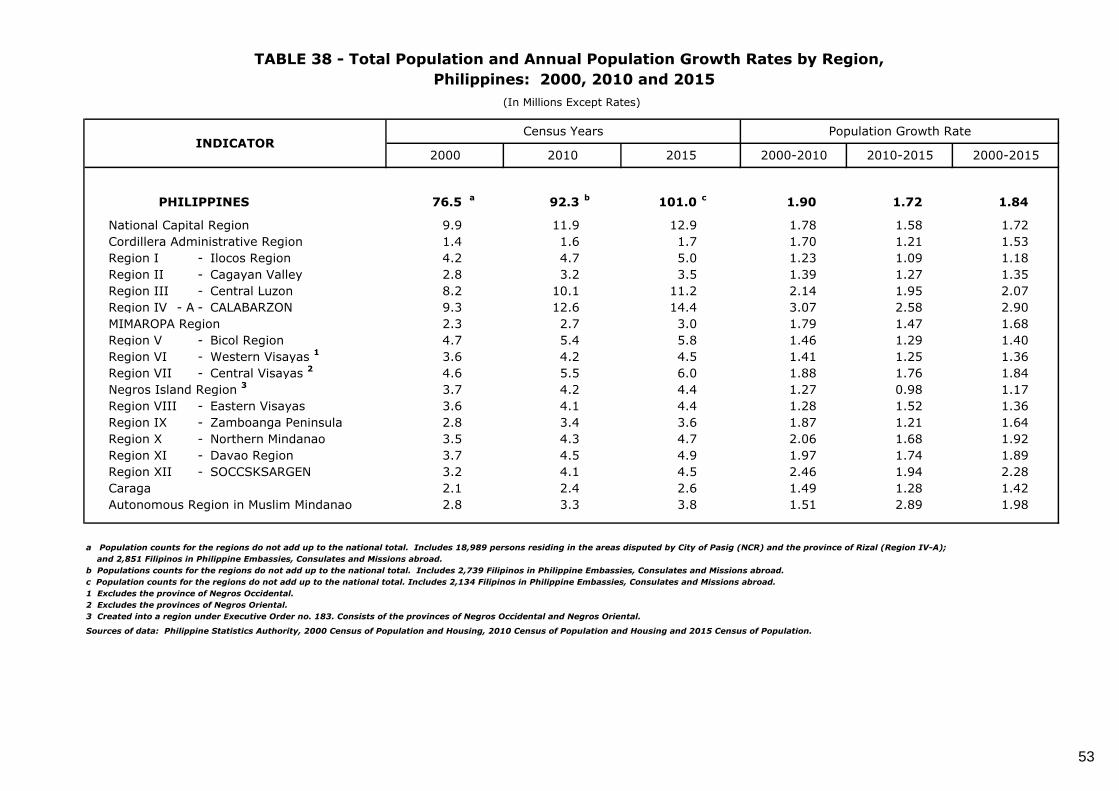
PHILIPPINES 76.5 a
92.3b
101.0c
1.90 1.72 1.84
National Capital Region 9.9 11.9 12.9 1.78 1.58 1.72
Cordillera Administrative Region 1.4 1.6 1.7 1.70 1.21 1.53
Region I - Ilocos Region 4.2 4.7 5.0 1.23 1.09 1.18
Region II - Cagayan Valley 2.8 3.2 3.5 1.39 1.27 1.35
Region III - Central Luzon 8.2 10.1 11.2 2.14 1.95 2.07
Region IV - A - CALABARZON 9.3 12.6 14.4 3.07 2.58 2.90
MIMAROPA Region 2.3 2.7 3.0 1.79 1.47 1.68
Region V - Bicol Region 4.7 5.4 5.8 1.46 1.29 1.40
Region VI - Western Visayas 1
3.6 4.2 4.5 1.41 1.25 1.36
Region VII - Central Visayas 2
4.6 5.5 6.0 1.88 1.76 1.84
Negros Island Region 3
3.7 4.2 4.4 1.27 0.98 1.17
Region VIII - Eastern Visayas 3.6 4.1 4.4 1.28 1.52 1.36
Region IX - Zamboanga Peninsula 2.8 3.4 3.6 1.87 1.21 1.64
Region X - Northern Mindanao 3.5 4.3 4.7 2.06 1.68 1.92
Region XI - Davao Region 3.7 4.5 4.9 1.97 1.74 1.89
Region XII - SOCCSKSARGEN 3.2 4.1 4.5 2.46 1.94 2.28
Caraga 2.1 2.4 2.6 1.49 1.28 1.42
Autonomous Region in Muslim Mindanao 2.8 3.3 3.8 1.51 2.89 1.98
a Population counts for the regions do not add up to the national total. Includes 18,989 persons residing in the areas disputed by City of Pasig (NCR) and the province of Rizal (Region IV-A);
and 2,851 Filipinos in Philippine Embassies, Consulates and Missions abroad.
b Populations counts for the regions do not add up to the national total. Includes 2,739 Filipinos in Philippine Embassies, Consulates and Missions abroad.
c Population counts for the regions do not add up to the national total. Includes 2,134 Filipinos in Philippine Embassies, Consulates and Missions abroad.
1 Excludes the province of Negros Occidental.
2 Excludes the provinces of Negros Oriental.
3 Created into a region under Executive Order no. 183. Consists of the provinces of Negros Occidental and Negros Oriental.
Sources of data: Philippine Statistics Authority, 2000 Census of Population and Housing, 2010 Census of Population and Housing and 2015 Census of Population.
INDICATOR2010-2015 2000-20152000 2000-20102015
Philippines: 2000, 2010 and 2015
TABLE 38 - Total Population and Annual Population Growth Rates by Region,
(In Millions Except Rates)
Population Growth RateCensus Years
2010
53
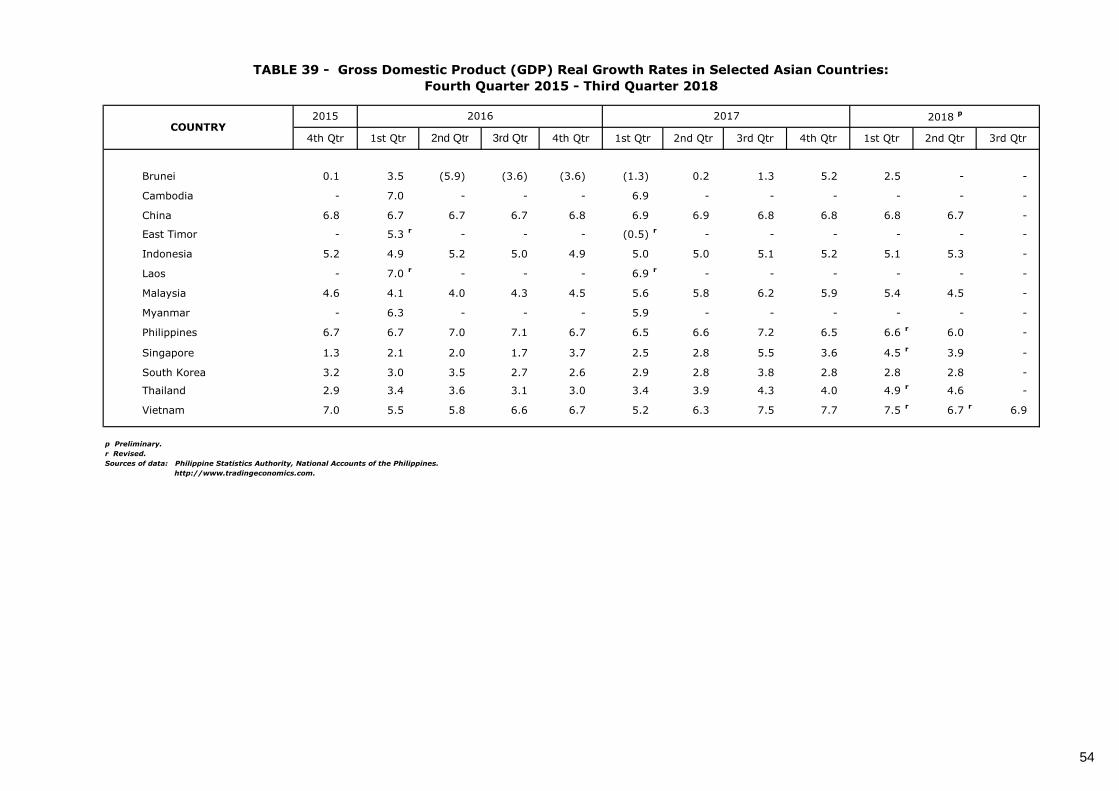
Brunei 0.1 3.5 (5.9) (3.6) (3.6) (1.3) 0.2 1.3 5.2 2.5 - -
Cambodia - 7.0 - - - 6.9 - - - - - -
China 6.8 6.7 6.7 6.7 6.8 6.9 6.9 6.8 6.8 6.8 6.7 -
East Timor - 5.3r
- - - (0.5)r
- - - - - -
Indonesia 5.2 4.9 5.2 5.0 4.9 5.0 5.0 5.1 5.2 5.1 5.3 -
Laos - 7.0r
- - - 6.9r
- - - - - -
Malaysia 4.6 4.1 4.0 4.3 4.5 5.6 5.8 6.2 5.9 5.4 4.5 -
Myanmar - 6.3 - - - 5.9 - - - - - -
Philippines 6.7 6.7 7.0 7.1 6.7 6.5 6.6 7.2 6.5 6.6r
6.0 -
Singapore 1.3 2.1 2.0 1.7 3.7 2.5 2.8 5.5 3.6 4.5r
3.9 -
South Korea 3.2 3.0 3.5 2.7 2.6 2.9 2.8 3.8 2.8 2.8 2.8 -
Thailand 2.9 3.4 3.6 3.1 3.0 3.4 3.9 4.3 4.0 4.9r
4.6 -
Vietnam 7.0 5.5 5.8 6.6 6.7 5.2 6.3 7.5 7.7 7.5r
6.7r
6.9
p Preliminary.
r Revised.
Sources of data: Philippine Statistics Authority, National Accounts of the Philippines.
http://www.tradingeconomics.com.
2nd Qtr 3rd QtrCOUNTRY
4th Qtr
2016
3rd Qtr2nd Qtr
2015
3rd Qtr
2018 p
4th Qtr1st Qtr
2017
Fourth Quarter 2015 - Third Quarter 2018
TABLE 39 - Gross Domestic Product (GDP) Real Growth Rates in Selected Asian Countries:
1st Qtr 2nd Qtr4th Qtr 1st Qtr
54

Brunei (0.6) (0.3) (0.3) 0.3 (0.1) 0.3 0.3 (0.3) ** 0.2 ** 0.4 0.4 (0.1) 0.2 - - -
Cambodia 3.2 2.7 2.3 2.3 2.6 2.7 2.1 2.3 2.2 2.0 2.3 2.3 2.4 2.9 3.0 - - -
China 1.2 1.5 1.5 1.4 1.8 1.6 1.9 1.7 1.8 1.5 2.9 2.1 1.8 1.8 1.9 2.1 2.3 -
East Timor 0.5 0.9 0.8 1.0 0.7 0.4 0.8 0.8 0.8 1.6 2.0 2.0 2.7 2.5 2.5 2.5 2.7 -
Indonesia 4.2 4.3 4.4 3.9 3.8 3.7 3.6 3.3 3.6 3.3 3.2 3.4 3.4 3.2 3.1 3.2 3.2 2.9
Laos 1.5 1.1 0.4 ** 0.2 0.3 0.5 0.2 0.2 1.0 1.8 1.9 1.9 2.0 - - - -
Malaysia 4.4 3.9 3.6 3.2 3.7 4.3 3.7 3.4 3.5 2.7 1.4 1.3 1.4 1.8 0.8 0.9 0.2 -
Myanmar 4.7 3.9 2.9 2.3 2.4 3.4 4.0 4.5 4.5 5.2 5.1 5.4 5.9 5.9 6.4 7.6 8.2 -
Philippines1
3.2 2.9 2.5 2.4 2.7 3.1 3.1 3.0 2.9 3.4 3.8 4.3 4.5 4.6 5.2 5.7 6.4 -
Singapore 0.4 1.4 0.5 0.6 0.4 0.4 0.4 0.6 0.4 - 0.5 0.2 0.1 0.4 0.6 0.6 0.7 -
South Korea 1.9 2.0 1.9 2.2 2.6 2.1 1.8 1.3 1.5 1.0 1.4 1.3 1.6 1.5 1.5 1.5 1.4 -
Thailand 0.4 ** (0.1) 0.2 0.3 0.9 0.9 1.0 0.8 0.7 0.4 0.8 1.1 1.5 1.4 1.5 1.6 1.3
Vietnam 4.3 3.2 2.5 2.5 3.4 3.4 3.0 2.6 2.6 2.7 3.2 2.7 2.8 3.9 4.7 4.5 4.0 4.0
Note: Data for other Asian countries cannot be found in the website used. If other websites shall be used, methodology may differ resulting to incomparability of data.
p Preliminary.
1 Rebased to 2012 base year from the current 2006 base year.
** Less than -0.05%.
Sources of data: Philippine Statistics Authority,
http://www.tradingeconomics.com.
July AugFebCOUNTRY
Apr DecMay AugJun JanJul Oct Sep
2018 p
TABLE 40 - Inflation Rates in Selected Asian Countries: April 2017 - September 2018
2017
Sep Mar Apr May JuneNov
55

Apr May Jun Jul Aug Sep Oct Nov Dec Jan Feb Mar Apr May Jun Jul Aug
Indonesia Semi-annual - - - 5.5 - - - - - 5.1 - - - - - - -
Malaysia Monthly 3.4 3.4 3.4 3.5 3.4 3.4 3.4 3.3 3.3 3.4 3.3 3.3 3.3 3.3 3.4 3.4 -
Philippines Quarterly 5.7 - - 5.6 - - 5.0 - - 5.3 - - 5.5 - - 5.4 -
Singapore Quarterly 2.2 - - 2.1 - - 2.1 - - 2.0 - - 2.1 - - - -
South Korea Monthly 4.0 3.6 3.8 3.6 3.8 3.7 3.6 3.7 3.7 3.6 3.6 4.0 3.8 4.0 3.7 3.8 4.2
Thailand Monthly 1.2 1.3 1.1 1.2 1.1 1.2 1.3 1.1 1.0 1.3 1.3 1.2 1.1 1.0 1.1 1.0 1.0
China Quarterly 4.0 - - 4.0 - - 3.9 - - 3.9 - - 3.8 - - - -
Note: Data for other Asian countries cannot be found in the website used. If other websites shall be used, methodology may differ resulting to incomparability of data.
p Preliminary.
Sources of data: Philippine Statistics Authority, Labor Force Survey.
http://www.tradingeconomics.com.
TABLE 41 - Unemployment Rates in Selected Asian Countries: April 2017 - August 2018
COUNTRY Periodicity2017 2018
P
r
56

Country
Brunei Darussalam 81,906 79,513 80,553 82,435 81,994 79,070 76,089 74,600 71,789 71,809
Cambodia 2,452 2,418 2,523 2,659 2,807 2,964r
3,124 3,291 3,465r
3,645
Indonesia 7,793 8,045 8,434 8,838 9,251 9,643 10,003 10,368 10,766 11,189
Lao PDR 3,732r
3,947r
4,219r
4,495r
4,794r
5,116r
5,437r
5,755r
6,073r
6,397
Malaysia 20,989 20,092 21,107 21,819 22,591 23,224 24,195 25,002 25,669 26,808
Myanmar 3,112 3,418 3,721 3,898 4,149 4,458 4,770 5,057r
5,305r
5,592
Philippines 5,309 5,285 5,597 5,707 5,989 6,307 6,586 6,875 7,233 7,599
Singapore 66,046 63,697 72,116 75,113 76,286 78,897 80,904 81,741 82,622 85,535
Thailand 12,757 12,605 13,487 13,535 14,448 14,772 14,857 15,252 15,706 16,278
Vietnam 4,010 4,185 4,408 4,633 4,821 5,024 5,265 5,555 5,838 6,172
r Revised.
Source of data: World Bank, World Development Indicators.
http://www.tradingeconomics.com
purchasing power over GDP as the U.S. dollar has in the United States. GDP at purchaser's prices is the sum of gross value added by all resident producers in the economy plus any product taxes
201020092008 20152014 2016
fixed base year prices.
minus any subsidies not included in the value of the products. It is calculated without making deductions for depreciation of fabricated assets or for depletion and degradation of
US. PPP as a rate of conversion ensures that money exchanged for a dollar buys the same volume of goods and services in every country. By equalizing prices, PPP rates deliver a measure of
relative GDP which is based on what constitutes "real" income, the volume of goods and services embodied in GDP. The method of using PPP is analogous to measuring GDP in different years at
201320122011
Definitions:
GDP per capita based on purchasing power parity (PPP) - PPP GDP is gross domestic product converted to international dollars using purchasing power parity rates. An international dollar has the
Table 42 - Gross Domestic Product Per Capita, Purchasing Power Parity
in Selected Asian Countries: 2008 - 2017
(At Constant 2011 International $)
2017
Data are in constant 2011 international dollars.
Purchasing Power Parity (PPP) rate - defined as the number of units of a country’s currency that is required to buy the same amount of goods and services in the country as one US$ would buy in the
57

57
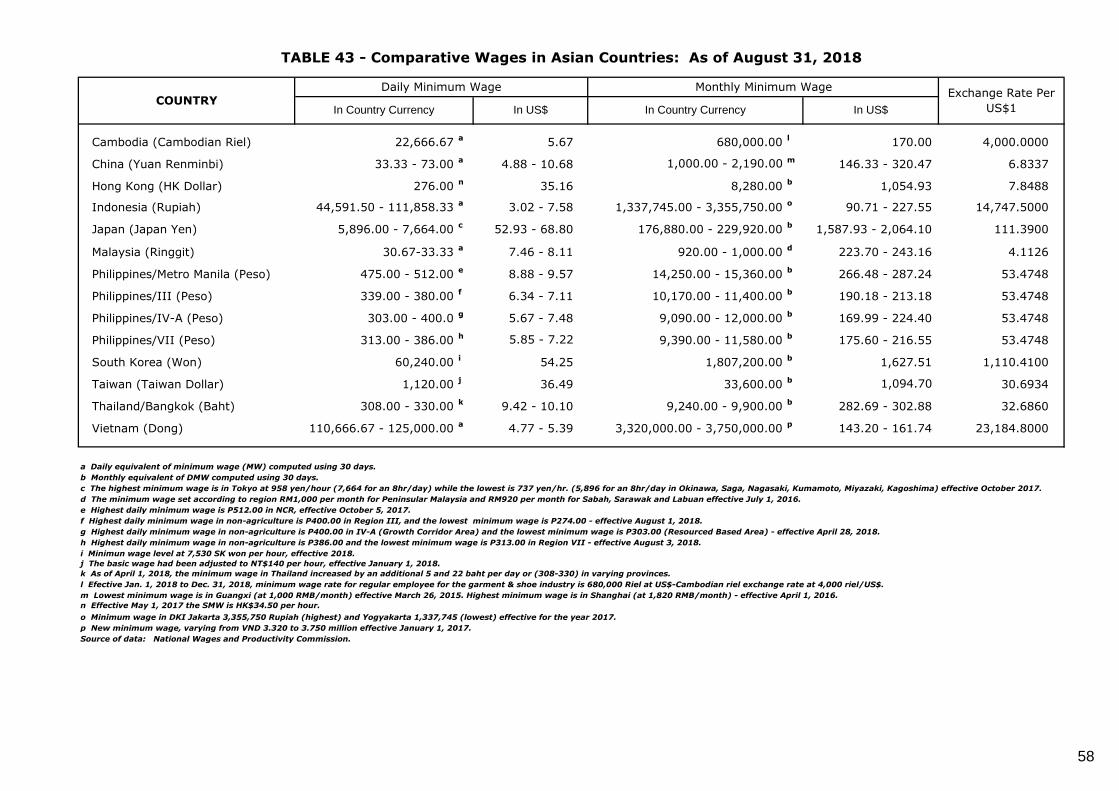
Cambodia (Cambodian Riel) 22,666.67a
5.67 680,000.00l
170.00 4,000.0000
China (Yuan Renminbi) 33.33 - 73.00a
4.88 - 10.68 1,000.00 - 2,190.00 m146.33 - 320.47 6.8337
Hong Kong (HK Dollar) 276.00n
35.16 8,280.00b
1,054.93 7.8488
Indonesia (Rupiah) 44,591.50 - 111,858.33a
3.02 - 7.58 1,337,745.00 - 3,355,750.00o
90.71 - 227.55 14,747.5000
Japan (Japan Yen) 5,896.00 - 7,664.00c
52.93 - 68.80 176,880.00 - 229,920.00b
1,587.93 - 2,064.10 111.3900
Malaysia (Ringgit) 30.67-33.33a
7.46 - 8.11 920.00 - 1,000.00d
223.70 - 243.16 4.1126
Philippines/Metro Manila (Peso) 475.00 - 512.00e
8.88 - 9.57 14,250.00 - 15,360.00b
266.48 - 287.24 53.4748
Philippines/III (Peso) 339.00 - 380.00f
6.34 - 7.11 10,170.00 - 11,400.00b
190.18 - 213.18 53.4748
Philippines/IV-A (Peso) 303.00 - 400.0g
5.67 - 7.48 9,090.00 - 12,000.00b
169.99 - 224.40 53.4748
Philippines/VII (Peso) 313.00 - 386.00h 5.85 - 7.22 9,390.00 - 11,580.00
b175.60 - 216.55 53.4748
South Korea (Won) 60,240.00i
54.25 1,807,200.00b
1,627.51 1,110.4100
Taiwan (Taiwan Dollar) 1,120.00j
36.49 33,600.00b 1,094.70 30.6934
Thailand/Bangkok (Baht) 308.00 - 330.00k
9.42 - 10.10 9,240.00 - 9,900.00b
282.69 - 302.88 32.6860
Vietnam (Dong) 110,666.67 - 125,000.00a
4.77 - 5.39 3,320,000.00 - 3,750,000.00p
143.20 - 161.74 23,184.8000
a Daily equivalent of minimum wage (MW) computed using 30 days.
b Monthly equivalent of DMW computed using 30 days.
c The highest minimum wage is in Tokyo at 958 yen/hour (7,664 for an 8hr/day) while the lowest is 737 yen/hr. (5,896 for an 8hr/day in Okinawa, Saga, Nagasaki, Kumamoto, Miyazaki, Kagoshima) effective October 2017.
d The minimum wage set according to region RM1,000 per month for Peninsular Malaysia and RM920 per month for Sabah, Sarawak and Labuan effective July 1, 2016.
e Highest daily minimum wage is P512.00 in NCR, effective October 5, 2017.
f Highest daily minimum wage in non-agriculture is P400.00 in Region III, and the lowest minimum wage is P274.00 - effective August 1, 2018.
g Highest daily minimum wage in non-agriculture is P400.00 in IV-A (Growth Corridor Area) and the lowest minimum wage is P303.00 (Resourced Based Area) - effective April 28, 2018.
h Highest daily minimum wage in non-agriculture is P386.00 and the lowest minimum wage is P313.00 in Region VII - effective August 3, 2018.
i Minimun wage level at 7,530 SK won per hour, effective 2018.
j The basic wage had been adjusted to NT$140 per hour, effective January 1, 2018.
k As of April 1, 2018, the minimum wage in Thailand increased by an additional 5 and 22 baht per day or (308-330) in varying provinces.
l Efective Jan. 1, 2018 to Dec. 31, 2018, minimum wage rate for regular employee for the garment & shoe industry is 680,000 Riel at US$-Cambodian riel exchange rate at 4,000 riel/US$.
m Lowest minimum wage is in Guangxi (at 1,000 RMB/month) effective March 26, 2015. Highest minimum wage is in Shanghai (at 1,820 RMB/month) - effective April 1, 2016.
n Effective May 1, 2017 the SMW is HK$34.50 per hour.
o Minimum wage in DKI Jakarta 3,355,750 Rupiah (highest) and Yogyakarta 1,337,745 (lowest) effective for the year 2017.
p New minimum wage, varying from VND 3.320 to 3.750 million effective January 1, 2017.
Source of data: National Wages and Productivity Commission.
TABLE 43 - Comparative Wages in Asian Countries: As of August 31, 2018
COUNTRYDaily Minimum Wage Monthly Minimum Wage
Exchange Rate Per
US$1In Country Currency In US$ In Country Currency In US$
58