1st quarter 2009 financial results - norwegian property · 10 | results 1st quarter 20089...
TRANSCRIPT

1st Quarter 2009 Financial ResultsOslo, April 30th 2009

Highlights – first quarter 2009
Improved operational performance before value adjustments
– Profit before value adjustments stable and growing– Vacancy at 0.8 per cent, small renewal volumes expected in 2009 and 2010– Reduced financial costs, rental income on expectations
Non-cash effects of market developments
– Value adjustments of minus 2.4 per cent – Goodwill reduced by MNOK 137.8– Mark to market adjustment of financial derivatives, minus MNOK 289
In compliance with all financial covenants
– Substantial debt repayments– Group Loan To Value: 81.1 per cent– Group Interest Cover Ratio: 1.49
Management addressing key financial issues
– Positive dialogue with main lenders

3 | Results 1st Quarter 20089
Results – first quarter 2009
Q1 Q1 Full year
NOK million 2009 2008 2008
Gross rental income 445.7 472.1 1 866.8
Maintenance and property related cost -35.4 -37.6 -152.2
Administrative and group expenses -33.4 -28.8 -131.6
Operating result before value adjustment 376.9 405.6 1 583.1
Net financial items excluding derivatives and currency effects -246.3 -277.6 -1 063.4
Profit before value adjustments and acq. Financing 130.6 128.0 519.6
Net financial items , acquisition financing -25.5 -57.7 -207.4
Profit before value adjustments 105.1 70.3 312.2
Net gain on disposals 10.0 29.6 34.4
Currency gains / loss (unrealised) 25.1 -2.9 -55.6
Net gain/loss on value adjustements, investment properties -647.3 -121.4 -3 987.5
Impairment of goodwill -137.8 0.0 -221.0
Change in market value of financial derivatives -289.0 -142.5 -1 201.4
Profit before income tax -933.9 -166.9 -5 118.9
Income tax 134.4 46.7 928.2
Profit for the period -799.5 -120.2 -4 190.7
Earnings per share (NOK) -3.96 -1.14 -26.65
4 | Results 1st Quarter 20089
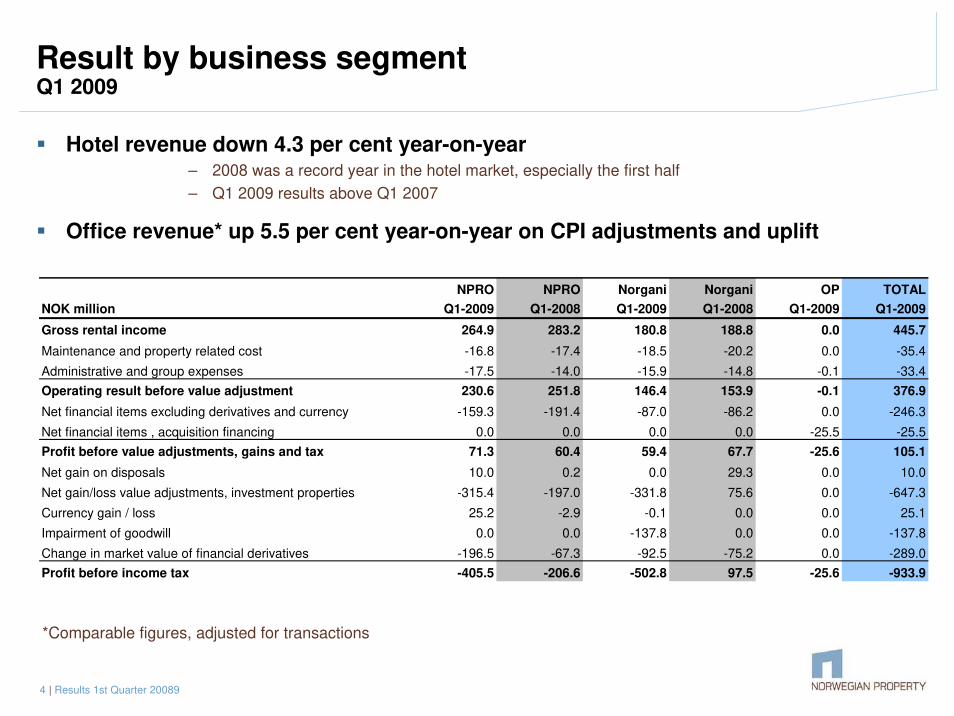
Result by business segmentQ1 2009
Hotel revenue down 4.3 per cent year-on-year– 2008 was a record year in the hotel market, especially the first half
– Q1 2009 results above Q1 2007
Office revenue* up 5.5 per cent year-on-year on CPI adjustments and uplift
*Comparable figures, adjusted for transactions
NPRO NPRO Norgani Norgani OP TOTAL
NOK million Q1-2009 Q1-2008 Q1-2009 Q1-2008 Q1-2009 Q1-2009
Gross rental income 264.9 283.2 180.8 188.8 0.0 445.7
Maintenance and property related cost -16.8 -17.4 -18.5 -20.2 0.0 -35.4
Administrative and group expenses -17.5 -14.0 -15.9 -14.8 -0.1 -33.4
Operating result before value adjustment 230.6 251.8 146.4 153.9 -0.1 376.9
Net financial items excluding derivatives and currency -159.3 -191.4 -87.0 -86.2 0.0 -246.3
Net financial items , acquisition financing 0.0 0.0 0.0 0.0 -25.5 -25.5
Profit before value adjustments, gains and tax 71.3 60.4 59.4 67.7 -25.6 105.1
Net gain on disposals 10.0 0.2 0.0 29.3 0.0 10.0
Net gain/loss value adjustments, investment properties -315.4 -197.0 -331.8 75.6 0.0 -647.3
Currency gain / loss 25.2 -2.9 -0.1 0.0 0.0 25.1
Impairment of goodwill 0.0 0.0 -137.8 0.0 0.0 -137.8
Change in market value of financial derivatives -196.5 -67.3 -92.5 -75.2 0.0 -289.0
Profit before income tax -405.5 -206.6 -502.8 97.5 -25.6 -933.9

5 | Results 1st Quarter 20089
Valuation of investment propertiesQ1 2009
Independent valuations by Akershus Eiendom and DTZ Realkapital/Maakanta
Negative fair value adjustments MNOK 647, down 2.4 per cent in total
Quarterly adjustments to fair value of properties
2.9
%
1.6
%
5.1
%
-6.6
%
-3.4
%
-4.3
%
-2.0
%
- 3.2
%
- 3.6
%
- 4.1
% - 3.0
%
-1.0
%
0.4
%
0.5
%
0.7
%
-8 %
-6 %
-4 %
-2 %
0 %
2 %
4 %
6 %
Q4 Q1 Q2 Q3 Q4 Q1 Q2 Q3 Q4 Q1
2006 2007 2008 2009
Office Hotel

6 | Results 1st Quarter 20089
Cash flow – Q1 2009
Q1 Q1 Full year
NOK million 2009 2008 2008
Profit before income tax and interest -933.9 -166.9 -5 118.9
Non cash items and reclassification 1 311.4 573.0 6 695.2
Changes in short term items -70.1 -103.7 139.4
Cash flow from operating activities 307.4 302.4 1 715.7
Net financial items (ex. market value adjustments and currency gain/loss) -271.8 -335.3 -1 270.8
Adjusted cash flow from operating activitites 35.6 -32.9 444.9
Cash received from sale of assets 1 052.4 79.3 1 311.0
Purchase of tangible assets -33.3 -51.4 -308.3
Purchase of subsidiaries 0.0 0.0 -155.5
Cash flow from investment activites 1 019.0 27.9 847.2
Net change in interest bearing debt -974.9 -118.3 -3 843.5
Capital increases 0.0 0.0 2 345.9
Dividend payments 0.0 0.0 -263.7
Other financing activities -20.0 0.0 0.0
Adjusted cash flow from financing activities -994.9 -118.3 -1 761.3
Net change in cash 59.7 -123.3 -469.3
Net cash at end of period 230.7 512.5 174.2

7 | Results 1st Quarter 20089
Balance sheet – Q1 2009
MNOK 31-Mar-09 31-Mar-08 31-Dec-08
Investment properties 1) 24 872.8 31 096.0 27 312.6
Goodwill 772.5 1 065.0 885.6
Market value financial derivatives (net) -815.3 497.5 -631.3
Cash and cash equivalents (including equity issue) 230.7 512.5 174.2
Equity 4 001.2 6 731.5 5 001.2
Long term interest bearing debt 19 201.2 21 662.3 21 022.0
Short term interest bearing debt 1 109.6 1 509.2 818.6
Short term debt to owner's of Oslo Properties AS 2) 0.0 1 621.4 0.0
Deferred tax liability 459.2 1 475.9 565.5
Net other assets 289.5 170.7 333.9
Equity ratio 15.3 % 20.0 % 17.3 %
Net asset value per share (NOK) 19.84 61.85 24.80
Net asset value per share (NOK), EPRA 25.60 70.15 30.14
1) Net of deferred tax at acquisition.
2) Majority of minorities in Oslo Properties AS classified as debt due to put / call arrangements

8 | Results 1st Quarter 20089
Debt reductions
Significant 2008 down payments
Ordinary amortisations and down payments MNOK 975 in Q1 2009
Amortisations and down payments by quarter
0
200
400
600
800
1000
1200
Q1‐2008
Q2‐2008
Q3‐2008
Q4‐2008
Q1‐2009
Q2‐2009e
Q3‐2009e
Q4‐2009e
MNOK per quarter
Down payments (quarter)
Amortisations (quarter)

9 | Results 1st Quarter 20089
Interest rate hedge book
NPROs hedge book has a diversified maturity profile
– to reduce risks associated with short term interest rate fluctuations
NPROs long term interest rate (before margins) is in the 4.00% - 4.50% band
Maturity profile - interest rate swaps
‐
1 000
2 000
3 000
4 000
5 000
6 000
2009 2010 2011 2012 2013 2014 2015 2016 2017 2018 >2018
Year
MNOK
3.00 %
3.50 %
4.00 %
4.50 %
5.00 %
Percent
Notional amount (MNOK) Average interest rate

10 | Results 1st Quarter 20089
Developments in key financial figures
NPRO is in compliance with financial covenants in all loan agreements
– Group Loan to Value 81.1%
– Group Interest Cover Ratio 1.49
Interest bearing debt and hedging 31.03.2008 31.12.2008 31.03.2009
Total interest bearing debt (NOK million) 23 206 21 879 20 345Hedging ratio (%) 70 % 84 % 100 %Unused committed credit facilities 365 521 416 Average time to maturity, hedging (years) 5.0 4.5 3.7
Average interest rate (incl. margin) 5.30 % 5.26 % 5.04 %Average margin 0.77 % 0.81 % 0.85 %Average remaining duration, borrowing (years) 4.4 3.9 3.3
Property value (gross of deferred tax at acquisition) 31 460 27 575 25 090Debt/Value 73.8 % 79.0 % 81.1 %

11 | Results 1st Quarter 20089
Overview of portfolio- commercial properties, excluding hotels
Portfolio
Number of properties 48
Total size (m²) 634,573
Average size per property (m²) 13,220
Average value per m² (NOK) 23,922
Average value per property (MNOK) 316
Average rent per gross m² (NOK) 1,657
Valuation
Market value (MNOK) 15,180
Gross rent (MNOK) 1,051.7
Opex (MNOK) *) 58.9
Net rent (MNOK) 992.8
Gross yield, contractual rent 6.93 %Net yield, contractual rent 6.54 %
Gross yield, market rent **) 7.64 %Net yield, market rent **) 7.22 %
Duration (years) 5.3
CPI adjustment (2009) 97.0 %Vacancy (excl. warehouse/parking) 0.8 %
Run Rate, 31 March 2009
*) Assuming 5,6% operating expenses on property level**) Market rent is assessed by DTZ Realkapital and Akershus Eiendom to be 10,3% (average) above current contractual rents

12 | Results 1st Quarter 20089
Office portfolio – operational highlights
Limited volumes up for lease renewal
– Limited cash flow exposure to weaker market
Positive net leasing and uplift gained on new leases
Industry-leading low area vacancy level at 0.8%
Tenant focus
– Satisfied tenants are a crucial factor in achieving best possible rent in new leases and
lease renewals.
Technical audit of all properties (NO: “Byggsertifisering”)
– Improved maintenance control and reduced insurance costs
Predictable and competitive opex
– Outsourcing of FS/FM through strategic partnership with NEAS
The Tingvalla jetty future development
– Architectural design competition concluded; winner picked from 46 contributions

13 | Results 1st Quarter 20089
Office portfolio tenants
Top 25 tenants accounting for 73% of office revenue:
High degree of public
sector tenants and/or
private sector tenants
with direct or indirect
public sector ownership
Investment Grade
tenants account for 65%
of revenue base
Very limited share of
revenue is at risk related
to tenant default or near
term renewal
EDB Business Partner ASA 83.6 9.9 8.0 % √ √Aker Solutions ASA 82.7 10.0 7.9 % √ √DnB NOR ASA 73.4 2.4 7.0 % √ √StatoilHydro ASA 48.4 3.4 4.6 % √ √Nordea 46.1 4.8 4.4 % √ √SAS Scandinavian Airlines Norge AS 42.4 7.7 4.0 % √ √If Skadeforsikring 40.6 3.6 3.9 % √ √Aker Offshore Partner AS 33.9 5.7 3.2 % √ √Total E&P Norway AS 30.4 8.6 2.9 % √Höegh Autoliners Management AS 28.0 11.0 2.7 %Get AS 27.3 2.2 2.6 %Telenor Eiendom Holding AS 27.2 6.5 2.6 % √ √NetCom AS 24.1 3.5 2.3 % √ √Skanska Norge AS 22.0 6.1 2.1 % √Fokus Bank 21.0 3.8 2.0 % √ √Atea ASA 18.7 3.5 1.8 % √TDC AS 16.1 2.3 1.5 % √NAV 15.4 2.5 1.5 % √YX Energi Norge AS 14.8 2.4 1.4 % √ √Tieto Norway AS 13.2 3.4 1.3 % √BW Offshore AS 11.7 4.7 1.1 % √Simonsen Advokatfirma DA 11.5 3.8 1.1 %Økokrim 11.4 17.5 1.1 % √ErgoGroup AS 10.6 2.5 1.0 % √Schibsted Eiendom AS 9.5 4.8 0.9 % √
Total 25 largest tenants 764.1 6.0 72.7 %
Other tenants 287.6 3.7 27.3 %
TOTAL ALL TENANTS 1 051.7 5.4 100.0 %
TenantPublic sector participation
Listed at group level
Share
of totalRent
(MNOK)
Duration
(years)

14 | Results 1st Quarter 20089
Office lease maturity profile
5.3 year duration of leases
Average current rent of NOK 1500-2000 per m²
97% of lease volume are CPI adjusted (cash flow inflation hedge)
Volume (m²) up for renewal per year
0
20 000
40 000
60 000
80 000
100 000
120 000
140 000
160 000
180 000
200 000
2009 2010 2011 2012 2013 2014 2015 2016
Gross space (m²)
Average existing rent by year of lease maturity
0
500
1 000
1 500
2 000
2 500
3 000
3 500
4 000
4 500
5 000
2009 2010 2011 2012 2013 2014 2015 2016
Average rent NOK per m²

15 | Results 1st Quarter 20089
Uplift potential (office)
NPRO has limited exposure to ‘spot market’ for office space
– less than MNOK 150 up for renegotiation over next two years (2009 and 2010)
Recent third-party forecasts confirms uplift potential from existing contractual rent levels
1 000
1 500
2 000
2 500
3 000
3 500
Oslo - CBD Oslo - Skøyen Oslo - West /
Lysaker /
Fornebu
Oslo - Nydalen Stavanger
NO
K/s
qm
Current market rent
Estimated market rent 2010
Estimated market rent 2011
NPRO 2009Q1

16 | Results 1st Quarter 20089
Location, location, location- Throughout the economic cycle, there is never one common market rate for CBD office space
NPRO’s share of Vika/Aker Brygge Prime waterfront location
17 | Results 1st Quarter 20089
0
10 000 000
20 000 000
30 000 000
40 000 000
50 000 000
Q1 Q2 Q3 Q4 Q1 Q2 Q3 Q4 Q1
2007 2008 2009
Co
ntr
ac
t v
olu
me
(N
OK
)
0 %
10 %
20 %
30 %
40 %
50 %
60 %
70 %
80 %
90 %
100 %
Pe
r c
en
t u
plift
ov
er
ex
isti
ng
re
nt
Expired contracts New contracts Percent uplift
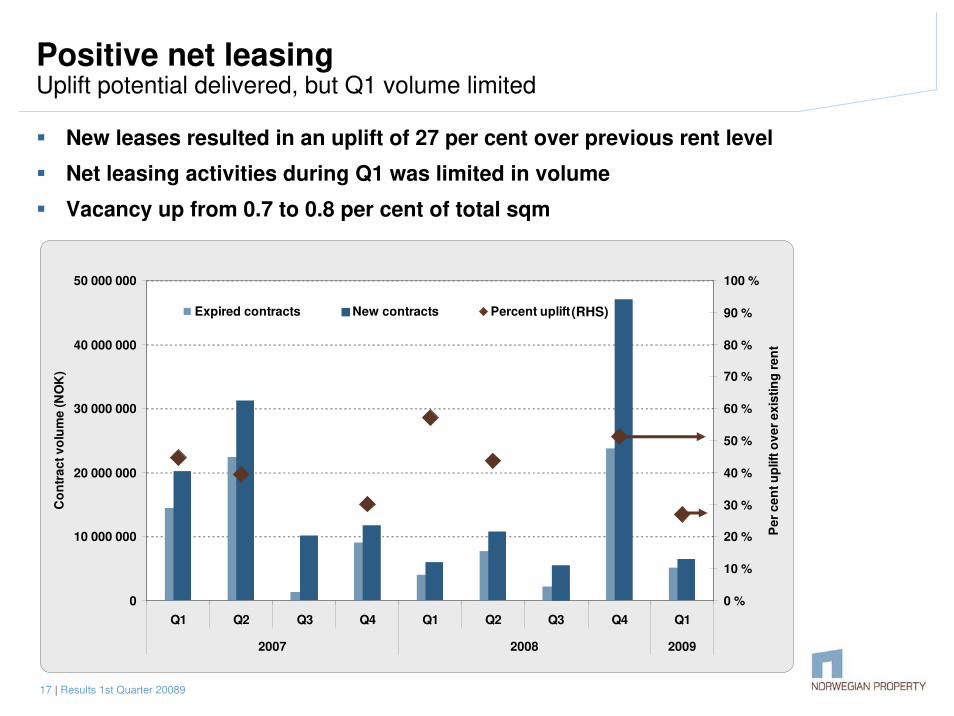
Positive net leasingUplift potential delivered, but Q1 volume limited
New leases resulted in an uplift of 27 per cent over previous rent level
Net leasing activities during Q1 was limited in volume
Vacancy up from 0.7 to 0.8 per cent of total sqm
(RHS)

18 | Results 1st Quarter 20089
Development of the Tingvalla jetty
The Tingvalla jetty is one of Oslo’s most prominent locations.
Chosen from 46 competing proposals, the winning “Bølgen”concept will add a landmark building to Aker Brygge.
The building will host a restaurant with a large roof-top seating area and bar, as well as sub-surface facilities and storage.

19 | Results 1st Quarter 20089
Overview of hotel portfolio
Portfolio
Number of properties 74
Number of rooms 12,822
Total size (m²) 671,480
Average size per property (m²) 9,074
Average value per property (MNOK) 134
Average value per room (NOK) 772,878
Average value per m² (NOK) 14,758
Valuation
Market value (MNOK) 9,910
Gross rent, as reported in 2008 (MNOK) *) 787.4
Net yield, contractual rent **) 7.2 %
Remaining duration, contracts (years) 9.8
Minimum rent and seller guarantee, 2009 ***) 632
Minimum rent, 2009 ***) 560
Seller guarantees, 2009 ***) 72
As of 31 March 2009
*) Gross rent as reported based on average exchange rates in 2008**) As reported in 2008 in local currency but translated with exchange rates as of 31 March 2008***) Based on budget currency rates, Euro (8.40), SEK (0.86) and DKK (1.13)

20 | Results 1st Quarter 20089
Norgani Hotels - the Nordic region’s number one hotel owner
Norway Sweden Finland Average
Business 54 % 75 % 44 % 58 %Vacation 46 % 25 % 56 % 42 %
Domestic 73 % 77 % 71 % 74 %International 27 % 23 % 29 % 26 %
Traditional Nordic lease contract structure
Domestic travellers main source of income in Nordic
Except for one hotel (fixed lease), the contracts are turnover-based leases, mostly with differentiated rates between lodging and food/beverages, which is the most common contract type in the Nordic region
There are no management contracts (which are common in other regions)
The majority of the contracts have defined consumer price index (CPI) adjusted minimum leases
Mainly domestic travellers which is positive for the Norgani hotels since it could be expected that the Nordic region in total offers a soft landing in today’s market environment.
Intra-Nordic travel accounts for ~ 80% of all travellers

21 | Results 1st Quarter 20089
Hotel portfolio revenue is protected through credit worthy operators and a high degree of minimum rents
0
100
200
300
400
500
600
700
800
Fixed rents Seller guarantees Turnover based 2008 rent *
Revenue composition protects cash flow (MNOK)
0
100
200
300
400
500
600
700
800
Scandic Choice Rezidor First Other
Blue chip operators (2008 revenues) Scandic/Hilton (63 per cent) and Choice (22 per cent) account for 85 per cent of 2008 revenues.
Scandic and Choice are the leading hotel operators in the Nordic market, with more than 300 hotels under operations combined
Average duration for the whole portfolio is 9.8 years, securing visible cash flows
* Gross rent as reported based on average exchange rate in 2008
Due to fixed rent component and seller
guarantees, the following will apply to further
RevPAR reductions:
– 5 per cent reduction in RevPAR to give
~ 3 per cent reduction in Norgani income
Maximum income reduction is ~ 20 per cent

22 | Results 1st Quarter 20089
RevPAR development in the Nordic markets
General market* Norgani Hotels
-25 %
-20 %
-15 %
-10 %
-5 %
0 %
5 %
Jan Jan-Feb Jan Jan-Feb Jan-Mar
Sweden Norway Finland Denmark
RevPAR development
Negative RevPAR development, but rate of decline seems to be improving towards the end of 1Q-09
Norgani Q1-09 revenues were merely 4.3% lower than Q1-08, and fixed rents are limiting the RevPAR downside
Danish hotels improving, and Sweden and Norway both stronger than Finland– Finnish properties are mainly located in the harder-hit Helsinki region
* Market data for March is not yet available** Denmark publishes occupancy rates only, Norgani showing RevPAR
Geographical split,
by rooms and by revenue
Norway
Sweden
Finland
Denmark
Rooms
Revenue

23 | Results 1st Quarter 20089
Hotel market Q1 2009
Occupancy
– The decrease has been somewhat bigger than the market expected
– The decrease pr segment follows the trends from previous downturns
– Business activity and international tourism most affected
Room rates
– Fairly stable, some adjustments in the upper range (suites etc), which slightly
influence on the ARR (average room rate)
The Nordic countries vs Europe/USA
– The Nordic countries less affected than the Euro-zone
– Sweden will have the presidency of the EU council in the second half of 2009.
– Some positive signals from the Swedish leisure market, especially due to exchange
rate effects

24 | Results 1st Quarter 20089
Among the 50 most liquid property stocks in Europe
Trading volumes strong and increasing,
currently at 1.2 million shares per day
– Based on three-month rolling daily average
NPRO is among the 50 most liquid property
stocks in Europe, and in the top 20% globally
– Based on Global Property Research global
coverage universe of 800 listed property
companies
Shareholder base has grown to ~2000
shareholders
Key shareholders:
– Norwegian investors: Awilhelmsen Capital,
Fram (Tvenge), Canica (Hagen)
– International institutions (currently holding
31% combined): Fortis, Alpine Woods,
Brevan Howard, QVT, Fidelity
Subscribe to NPRO news releases at www.npro.no

25 | Results 1st Quarter 20089
Summary
Good operational performance and predictable cash flow
Management focus and priorities:
– Strengthening the financial position
– Operational excellence
– Maintaining low vacancy and a solid tenant base
– Managed reduction of costs and capex
Emphasis on stakeholder dialogue and long term value creation,
and on maintaining a leading role in the Nordic property markets

www.npro.nowww.norwegianproperty.no
Thank you for your attention.

27 | Results 4th Quarter 2008
The office portfolio offers exposure to prime locations in Oslo…
Skøyen
CBD
Nydalen
Majorstuen
7 properties
Office SQM: 82,357
Indoor Parking SQM: 18,079
Total SQM: 108,311
Gross Rent: NOK 197.6m
3 properties
Office: 64,876 SQM
Indoor Parking: 28,825 SQM
Total SQM: 94,113
Gross Rent: NOK 140.8m
11 properties
Office SQM: 71,325
Indoor Parking SQM: 26,231
Total SQM: 109,635
Gross Rent: NOK 136.3m
1 property
Office: 26,847 SQM
Indoor Parking: 3,000 SQM
Total SQM: 33,319
Gross Rent: NOK 46.1m
One property at Oslo Airport and one at Kolstadgata
Office SQM 5,479
Warehouse SQM: 20,976
Gross Rent: NOK 34.0m
11 properties
Office SQM: 97,344
Retail SQM: 27,436
Total SQM: 148,038
Gross Rent: NOK 348.2m
Fo
rneb
u/
Lysaker
Gross rent: Run rate as per 31 March 2009

28 | Results 4th Quarter 2008
… and strategic locations in Stavanger; the oil and gas cluster in Norway
Finnestadveien 44
Office: 22,032 SQM
Total SQM: 22,032
Gross Rent: NOK 30.4m
Maskinveien 32
Office: 4,561 SQM
Total SQM: 5,086
Gross Rent: NOK 5.4m
Svanholmen 2
Office: 2,883 SQM / Retail: 6,580
Total SQM: 9,463
Gross Rent: NOK 9.2m
Grenseveien 21
Office: 27,721 SQM
Total SQM: 27,721
Gross Rent: NOK 29.7m
Badehusgaten 33-39
Office: 16,673 SQM
Total SQM: 21,528
Gross Rent: NOK 33.9m
Strandsvingen 10
Office: 2,059 SQM
Total SQM: 2,059
Gross Rent: NOK 3.0m
Forusbeen 25
Office: 17,674 SQM
Total SQM: 21,424
Gross Rent: NOK 27.0m
Grenseveien 19
Office: 5,390 SQM
Total SQM: 5,390
Gross Rent: NOK 9.9m
Gross rent: Run rate as per 31 March 2009

29 | Results 1st Quarter 20089
Norgani has a large and diversified hotel portfolio
Hotel Operator Municipality No. rooms m2 Hotel Operator Municipality No. rooms m2
Sweden Norway
Scandic Alvik Scandic Stockholm 325 12 075 Quality Hotel & Resort Kristiansand Choice Kristiansand 210 9 940
Scandic Malmen Stockholm Scandic Stockholm 327 15 130 Quality Hotel & Resort Hafjell Choice Öyer 210 9 940
Scandic Star Sollentuna Scandic Stockholm 269 18 573 Comfort Hotel Börsparken Choice Oslo 198 7 900
Scandic Kungens Kurva Scandic Stockholm 257 11 581 Quality Hotel Alexandra Choice Molde 163 17 033
Scandic Helsingborg Nord Scandic Helsingborg 237 9 399 Comfort Hotel Holberg Choice Bergen 149 5 720
Scandic Backadal Scandic Göteborg 234 9 397 Quality Hotel & Resort Fagernes Choice Fagernes 139 10 310
Scandic Elmia Scandic Jönköping 220 9 576 Clarion Collection Hotel Bastionen Choice Oslo 99 4 688
Scandic Örebro Väst Scandic Örebro 204 7 621 Quality Hotel Articus Choice Harstad 75 3 540
Scandic Gävle Väst Scandic Gävle 200 7 382 Radisson SAS Lillehammer Hotel Franchise Lillehammer 303 18 000
Scandic Uppsala Nord Scandic Uppsala 184 7 518 Radisson SAS Hotel Bodø Radisson/SAS Bodö 191 15546
Scandic Västerås Scandic Västerås 174 7 285 Scandic Bergen Airport Scandic Bergen 197 9 654
Scandic Ferrum Scandic Kiruna 171 11 100 Scandic KNA Scandic Oslo 189 11 218
Scandic Umeå Syd Scandic Umeå 161 5 955 Rica Hotel Hamar Rica Ringsaker 176 9 250
Scandic Segevång Scandic Malmö 166 6 284 Rica Hotel Bodö Rica Bodö 113 7 981
Scandic Luleå Scandic Luleå 160 5 565 Total Norway 2 412 140 720
Scandic Sundsvall Nord Scandic Sundsvall 159 4 948 Denmark
Scandic Linköping Väst Scandic Linköping 150 6 105 Comfort Hotel Europa Choice Copenhagen 230 8 000
Scandic Norrköping Nord Scandic Norrköping 150 6 768 Clarion Collecion Hotel Myfair Choice Copenhagen 106 3 805
Scandic Kalmar Väst Scandic Kalmar 148 5 485 Comfort Hotel Excelsior Choice Copenhagen 100 3 600
Scandic Bromma Scandic Stockholm 144 6 800 Total Denmark 436 15 405
Scandic Klarälven Scandic Karlstad 143 5 694 Finland
Scandia Uplandia Scandic Uppsala 133 5 402 Scandic Continental Scandic Helsinki 512 30 000
Scandic Södertälje Scandic Södertälje 131 5 630 Scandic Grand Marina Scandic Helsinki 462 23 660
Scandic Östersund Scandic Östersund 129 4 019 Scandic Tampere City Scandic Tampere 263 14 457
Scandic Växjö Scandic Växjö 123 3 982 Scandic Kajunus Scandic Kajaani 191 10 468
Scandic Hasselbacken Scandic Stockholm 112 10 025 Scandic Rosendahl Scandic Tampere 213 14 662
Scandic Bollnäs Scandic Bollnäs 111 5 150 Scandic Jyväskylä Scandic Jyväskylä 150 7 360
Quality Hotel Luleå Choice Luleå 209 12 166 Scandic Kuopio Scandic Kuopio 137 7 113
Quality Hotel Prince Philip Choice Stockholm 201 7 400 Scandic Espoo Scandic Espoo 96 5 245
Quality Hotel Ekoxen Choice Linköping 190 14 671 Scandic Luosto Scandic Luosto 59 4 230
Quality Hotel Grand Kristianstad Choice Kristianstad 149 7 524 Scandic Marina Congress Center Scandic Helsinki 11 500
Quality Hotel Winn, Göteborg Choice Göteborg 121 5 800 Hilton Helsinki Kalastajatorpaa Hilton Helsinki 238 23 291
Quality Hotel Prisma Choice Skövde 107 3 687 Hilton Helsinki Strand Hilton Helsinki 192 10 250
First Hotel Linköping First/Tribe Linköping 133 6 540 Airport Bonus Inn Citymac Travels Vantaa 211 8 414
First Hotel Mårtenson First/Tribe Halmstad 103 6 657 Serena Korpilampi Savonlinnan Espoo 150 9 777
First Hotel Royal Star First/Cadhotels Stockholm 103 4 900 Comfort Hotel Pilotti Bonfinn Vantaa 112 3 068
Best Western Royal Corner Revhaken Hotels Växjö 158 7 112 Imatran Valtionhotelli Rantasipi Imatra 92 10 097
Best Western Mora Hotell & Spa BW Mora 135 9 161 Total Finland 3 078 193 592
Ibis Stockholm Syd Accor Hotels Stockholm 190 8 339
Radisson SAS Hotell, Linköping Radisson/SAS Linköping 91 6 354 Total Norgani Group 12 822 671 480
Stadshotellet Princess Sandviken Stadshotellet AB Sandviken 84 7 003
Total Sweden 6 896 321 763

30 | Results 1st Quarter 20089
Shareholder base
Top 20 Shareholders (VPS)
Name Ownership % Shares held Acc Type Nationality
AWILHELMSEN CAPITAL 11.53 23 254 334 NOR
BGL SA S/A OPCVM 5.27 10 633 181 NOM LUX
CANICA AS 4.59 9 246 467 NOR
DEUTSCHE BANK AG LON PRIME BROKERAGE FULL 4.38 8 825 994 NOM GBR
CREDIT SUISSE SECURI (EUROPE) PRIME BROKE 3.95 7 955 885 NOM GBR
FRAM REALINVEST AS 3.60 7 250 700 NOR
FRAM HOLDING AS 3.60 7 250 700 NOR
SEB ENSKILDA ASA EGENHANDELSKONTO 3.49 7 035 826 NOR
TRONDHEIM KOMMUNALE 3.07 6 199 700 NOR
VITAL FORSIKRING ASA OMLØPSMIDLER 3.02 6 089 907 NOR
BANK OF NEW YORK, BR S/A ALPINE INTL REAL 2.88 5 805 945 USA
AWECO INVEST AS 2.72 5 486 765 NOR
WENAASGRUPPEN AS 1.98 3 984 219 NOR
BANK OF NEW YORK, BR S/A ALPINE GLOBAL PR 1.96 3 950 150 USA
FGCS NV RE TREATY FORTIS GLOBAL CUSTOD 1.91 3 855 026 NOM NLD
BANK OF NEW YORK MEL S/A BNYM AS EMEA ASI 1.61 3 252 460 NOM USA
SKAGEN VEKST 1.49 3 000 000 NOR
OPPLYSNINGSVESENETS JILL NORDAHL 1.47 2 962 731 NOR
MP PENSJON 1.14 2 302 819 NOR
ARCTIC SECURITIES AS MEGLERKONTO 1.10 2 224 500 MEG NOR
64.76 130 567 309