1st quarter 2019…$100,000 sale price. properly priced homes for sale under $350,000 are currently...
TRANSCRIPT
1st Quarter 2019
This report was written by Sandra J. Carroll, Chief Executive Officer. Information believed to be accurate, but is not warranted. Data and statistics pulled from the REALTOR’S® MLS database of properties listed for sale and sold through the services of a real estate firm holding membership. Statistics account for REALTOR® assisted sales and transfers in Berkshire County, Massachusetts. Berkshire REALTOR Members are encouraged to share this information with clients and customers to promote awareness of market trends and foster informed decisions.
Phone: (413) 442-8049 | 99 West St, Suite 200, Pittsfield, MA 01201 | AtHomeInTheBerkshires.com | BerkshireRealtors.net © Berkshire County Board of REALTORS Multiple Listing Service, Inc. (MLS)
Berkshire County MA - Nestled in the beautiful hills of western Massachusetts – Where art and nature come to play
© Berkshire County Board of REALTORS: Believed to be accurate but not warranted | 2019 1st Quarter | Page 1
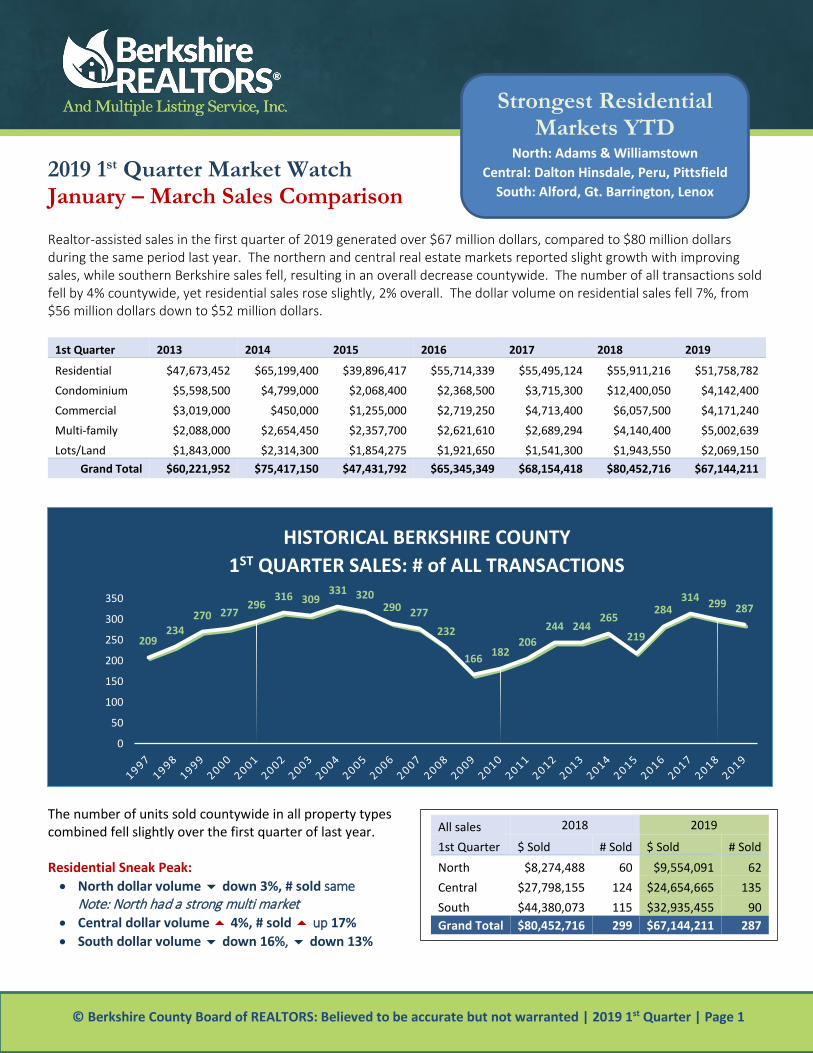
2019 1st Quarter Market Watch January – March Sales Comparison Realtor-assisted sales in the first quarter of 2019 generated over $67 million dollars, compared to $80 million dollars during the same period last year. The northern and central real estate markets reported slight growth with improving sales, while southern Berkshire sales fell, resulting in an overall decrease countywide. The number of all transactions sold fell by 4% countywide, yet residential sales rose slightly, 2% overall. The dollar volume on residential sales fell 7%, from $56 million dollars down to $52 million dollars.
1st Quarter 2013 2014 2015 2016 2017 2018 2019
Residential $47,673,452 $65,199,400 $39,896,417 $55,714,339 $55,495,124 $55,911,216 $51,758,782
Condominium $5,598,500 $4,799,000 $2,068,400 $2,368,500 $3,715,300 $12,400,050 $4,142,400
Commercial $3,019,000 $450,000 $1,255,000 $2,719,250 $4,713,400 $6,057,500 $4,171,240
Multi-family $2,088,000 $2,654,450 $2,357,700 $2,621,610 $2,689,294 $4,140,400 $5,002,639
Lots/Land $1,843,000 $2,314,300 $1,854,275 $1,921,650 $1,541,300 $1,943,550 $2,069,150 Grand Total $60,221,952 $75,417,150 $47,431,792 $65,345,349 $68,154,418 $80,452,716 $67,144,211
The number of units sold countywide in all property types combined fell slightly over the first quarter of last year. Residential Sneak Peak: • North dollar volume down 3%, # sold same
Note: North had a strong multi market • Central dollar volume 4%, # sold up 17% • South dollar volume down 16%, down 13%
209234
270 277296
316 309331 320
290 277232
166 182206
244 244265
219
284314 299 287
0
50
100
150
200
250
300
350
HISTORICAL BERKSHIRE COUNTY 1ST QUARTER SALES: # of ALL TRANSACTIONS
Strongest Residential Markets YTD
North: Adams & Williamstown Central: Dalton Hinsdale, Peru, Pittsfield
South: Alford, Gt. Barrington, Lenox
All sales 2018 2019
1st Quarter $ Sold # Sold $ Sold # Sold North $8,274,488 60 $9,554,091 62 Central $27,798,155 124 $24,654,665 135 South $44,380,073 115 $32,935,455 90 Grand Total $80,452,716 299 $67,144,211 287

© Berkshire County Board of REALTORS: Believed to be accurate but not warranted | 2019 1st Quarter | Page 2
Hot Berkshire Residential Markets: 1st Quarter 2019 Qtr. 1 Comparison 2018 2019
$ Sold # Sold $ Sold # Sold North $6,181,588 36 $6,019,512 36 Adams $1,866,288 12 $2,035,190 16 Clarksburg $338,000 3 $19,900 1 Florida $110,500 1 $0 0 New Ashford $340,000 1 $0 0 North Adams $1,868,300 13 $1,490,200 11 Savoy $186,100 1 $0 0 Williamstown $1,472,400 5 $2,474,222 8
Central $19,812,355 89 $20,546,065 104 Cheshire $1,266,100 6 $180,000 1 Dalton $2,390,900 10 $2,988,250 16 Hancock $797,000 2 $0 0 Hinsdale $790,000 4 $1,319,400 4 Lanesboro $1,618,900 6 $681,200 3 Peru $422,500 2 $1,081,450 5 Pittsfield $8,999,205 53 $12,311,230 69 Richmond $3,527,750 6 $1,363,160 3 Washington $0 0 $186,375 1 Windsor $0 0 $435,000 2
South $29,917,273 76 $25,193,205 66 Alford $460,000 1 $2,607,500 2 Becket $2,610,750 10 $1,788,000 8 Egremont $3,365,000 5 $565,000 2 Great Barrington $6,547,000 12 $7,554,500 19 Lee $2,286,800 9 $1,428,500 6 Lenox $625,000 1 $5,601,625 14 Monterey $1,896,523 5 $290,000 1 Mt Washington $550,000 1 $642,000 1 New Marlborough $2,590,000 7 $530,000 2 Otis $686,000 3 $1,200,000 3 Sandisfield $773,200 4 $0 0 Sheffield $3,227,000 9 $1,592,900 5 Stockbridge $3,950,000 8 $519,180 1 W.Stockbridge $350,000 1 $874,000 2
Grand Total $55,911,216 201 $51,758,782 206
Most Improved • Lenox! [Amazing Rebound!] • Peru • Alford • West Stockbridge • Williamstown • Dalton • Great Barrington • Adams • Pittsfield • Otis • Hinsdale • Pittsfield
With inventory at the lowest level since 2001, sales continue to challenge several Berkshire markets. It should be noted that Dalton, Peru, and Great Barrington are reporting ever increasing sales over the last several years in first quarter, not just this year. Please refer to the town-by-town residential 1st quarter sales statistics for the past 6 years to see the growth.
© Berkshire County Board of REALTORS: Believed to be accurate but not warranted | 2019 1st Quarter | Page 3
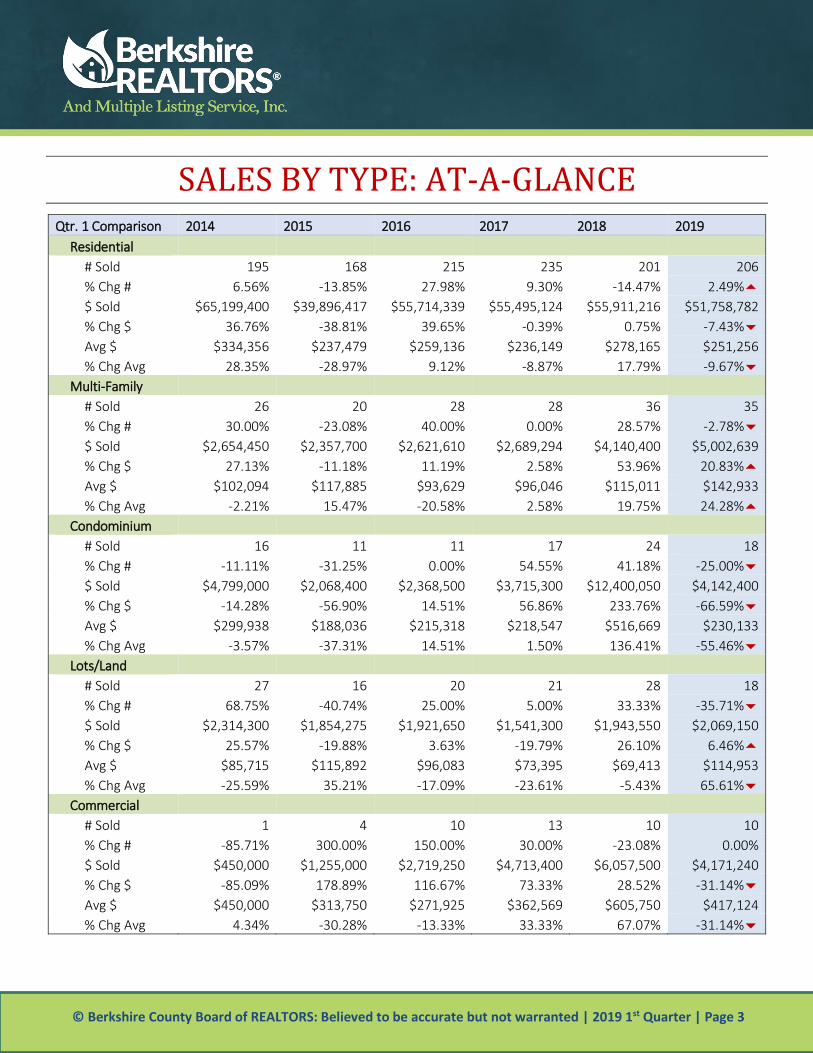
SALES BY TYPE: AT-A-GLANCE Qtr. 1 Comparison 2014 2015 2016 2017 2018 2019
Residential # Sold 195 168 215 235 201 206 % Chg # 6.56% -13.85% 27.98% 9.30% -14.47% 2.49% $ Sold $65,199,400 $39,896,417 $55,714,339 $55,495,124 $55,911,216 $51,758,782 % Chg $ 36.76% -38.81% 39.65% -0.39% 0.75% -7.43% Avg $ $334,356 $237,479 $259,136 $236,149 $278,165 $251,256 % Chg Avg 28.35% -28.97% 9.12% -8.87% 17.79% -9.67%
Multi-Family # Sold 26 20 28 28 36 35 % Chg # 30.00% -23.08% 40.00% 0.00% 28.57% -2.78% $ Sold $2,654,450 $2,357,700 $2,621,610 $2,689,294 $4,140,400 $5,002,639 % Chg $ 27.13% -11.18% 11.19% 2.58% 53.96% 20.83% Avg $ $102,094 $117,885 $93,629 $96,046 $115,011 $142,933 % Chg Avg -2.21% 15.47% -20.58% 2.58% 19.75% 24.28%
Condominium # Sold 16 11 11 17 24 18 % Chg # -11.11% -31.25% 0.00% 54.55% 41.18% -25.00% $ Sold $4,799,000 $2,068,400 $2,368,500 $3,715,300 $12,400,050 $4,142,400 % Chg $ -14.28% -56.90% 14.51% 56.86% 233.76% -66.59% Avg $ $299,938 $188,036 $215,318 $218,547 $516,669 $230,133 % Chg Avg -3.57% -37.31% 14.51% 1.50% 136.41% -55.46%
Lots/Land # Sold 27 16 20 21 28 18 % Chg # 68.75% -40.74% 25.00% 5.00% 33.33% -35.71% $ Sold $2,314,300 $1,854,275 $1,921,650 $1,541,300 $1,943,550 $2,069,150 % Chg $ 25.57% -19.88% 3.63% -19.79% 26.10% 6.46% Avg $ $85,715 $115,892 $96,083 $73,395 $69,413 $114,953 % Chg Avg -25.59% 35.21% -17.09% -23.61% -5.43% 65.61%
Commercial # Sold 1 4 10 13 10 10 % Chg # -85.71% 300.00% 150.00% 30.00% -23.08% 0.00% $ Sold $450,000 $1,255,000 $2,719,250 $4,713,400 $6,057,500 $4,171,240 % Chg $ -85.09% 178.89% 116.67% 73.33% 28.52% -31.14% Avg $ $450,000 $313,750 $271,925 $362,569 $605,750 $417,124 % Chg Avg 4.34% -30.28% -13.33% 33.33% 67.07% -31.14%

© Berkshire County Board of REALTORS: Believed to be accurate but not warranted | 2019 1st Quarter | Page 4
RESIDENTIAL PRICE RANGE REPORT Absorption is the number of months it would take to exhaust all current inventory based on the sales rate in the first quarter. Inventory levels continue to drop from last year at the same time. Below 7 months of inventory traditionally shifts to a seller-favored market. Markets with less than 4 months of inventory are considered in critical inventory deficit. 2019 1st Quarter North Central South
Price Class
Sold
YTD
Act
ive
Pend
ing
Mon
ths
of
Abs
orpt
ion
Sold
YTD
Act
ive
Pend
ing
Mon
ths
of
Abs
orpt
ion
Sold
YTD
Act
ive
Pend
ing
Mon
ths
of
Abs
orpt
ion
$0-$99K 10 25 8 8 14 22 9 5 4 5 0 4
$100K -$149K 9 9 17 3 23 18 12 2 2 8 1 12
$150K -$199K 7 16 7 7 31 26 25 3 4 16 4 12
$200K -$249K 2 5 5 8 19 20 10 3 12 25 5 6
$250K -$299K 4 9 1 7 7 12 13 5 13 24 7 6
$300K -$349K 2 3 0 5 4 11 8 8 8 31 3 12
$350K -$399K 1 2 3 6 1 16 6 48 2 37 4 56
$400K -$449K 0 3 0 -- 0 6 4 -- 6 16 3 8
$450K -$499K 0 1 1 -- 1 12 0 36 1 23 3 69
$500K -$749K 1 6 1 18 2 20 2 30 8 69 7 26
$750K -$999K 0 9 1 -- 2 7 1 11 4 42 3 32
$1M -$1.99M 0 5 1 -- 0 4 0 -- 2 56 2 84
$2,M -$2.99M 0 1 0 -- 0 4 0 -- 0 16 2 --
$3M -$4.99M 0 0 0 -- 0 0 0 -- 0 5 0 --
$5M + 0 1 0 -- 0 0 0 -- 0 4 0 --
2019 1st Qtr 36 95 45 8 104 178 90 5 66 377 44 17
2018 1st Qtr 36 105 33 9 89 214 73 7 76 415 41 16
2017 1st Qtr 42 116 42 8 103 218 72 6 87 420 76 14
2016 1st Qtr 41 153 41 11 93 267 107 9 81 524 68 19 ** Not enough sales to calculate Absorption Rate
Sale Prices North Central South
2019 Median $146,000 $174,000 $295,000
2018 Median $140,950 $188,000 $302,500
2017 Median $119,850 $169,300 $298,000
While northern Berkshire boasts the most affordable residential homes for sale, southern Berkshire has, by far, the most high-end homes. Despite the differences, all regions of the county share a similar story – a lack of inventory in the ranges that the region’s workforce can afford, and an abundance of inventory in the high-end price ranges.

© Berkshire County Board of REALTORS: Believed to be accurate but not warranted | 2019 1st Quarter | Page 5
INVENTORY AND LISTINGS
Northern Berkshire North county has the most residential listings for sale and the most sales made during the first quarter of 2019 below $100,000 sale price. Properly priced homes for sale under $350,000 are currently selling quickly due to the lack of inventory in those price ranges. Alternatively, there are 22 homes currently listed for $500,000-$5+ million price range with only 1 sale record during the first quarter of 2019 in that price range.
Central Berkshire Central Berkshire has the most residential homes for sale in the $150,000-199,000 price range, and that same range represents the area of the most home sales. All markets below $350,000 move very quickly in central Berkshire, if the home is properly priced for sale. Alternatively, there is a significant number of homes for sale (69) offered for sale between $350,000 – 3 million, yet only 6 sales this quarter. Southern Berkshire There are far more houses listed for sale in southern Berkshire homes priced over $500,000 than there are buyers. In the first quarter of this year, there were 192
homes for sale in that range, but only 14 sales. That has driven the absorpotion rate to over 17 months. Finding homes for sale in the $200,000-$300,000 continues to be a challenge.
546627 612
547
806875 901 915
1025
12091298
12121263
15171577 1546 1510
1585 1555
1411
12261121
847
RESIDENTIAL INVENTORY IN THE BERKSHIRES
© Berkshire County Board of REALTORS: Believed to be accurate but not warranted | 2019 1st Quarter | Page 6
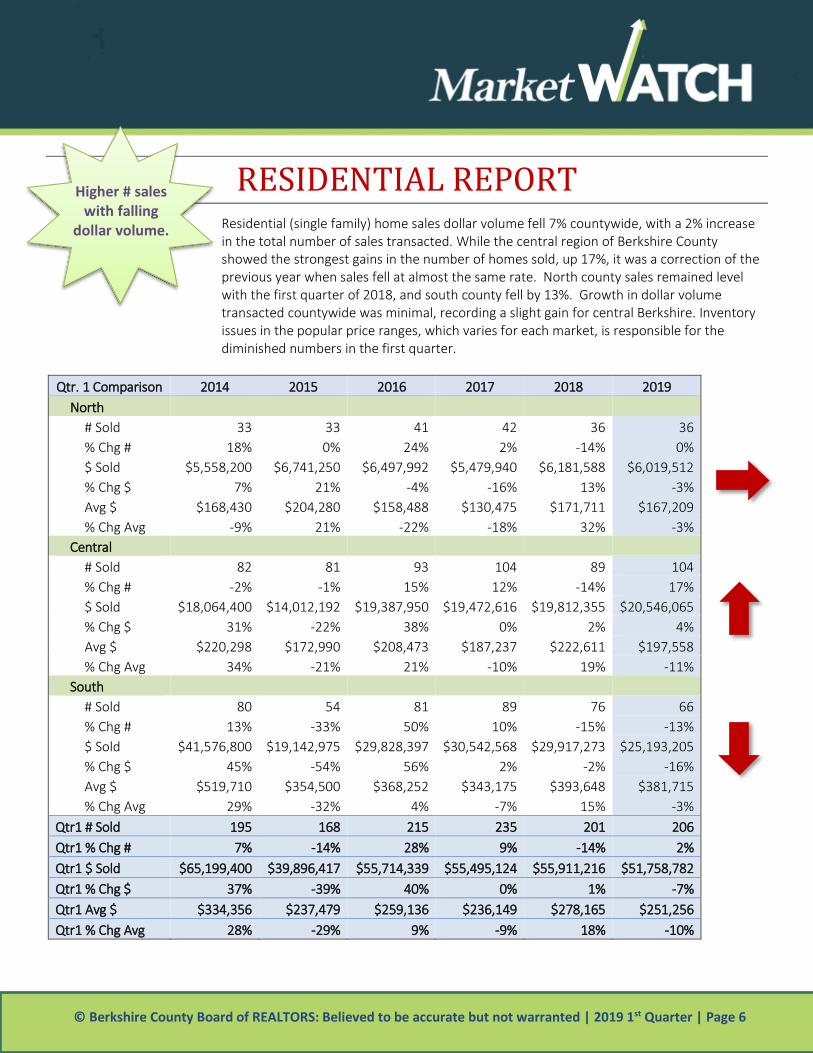
RESIDENTIAL REPORT Residential (single family) home sales dollar volume fell 7% countywide, with a 2% increase in the total number of sales transacted. While the central region of Berkshire County showed the strongest gains in the number of homes sold, up 17%, it was a correction of the previous year when sales fell at almost the same rate. North county sales remained level with the first quarter of 2018, and south county fell by 13%. Growth in dollar volume transacted countywide was minimal, recording a slight gain for central Berkshire. Inventory issues in the popular price ranges, which varies for each market, is responsible for the diminished numbers in the first quarter.
Qtr. 1 Comparison 2014 2015 2016 2017 2018 2019 North
# Sold 33 33 41 42 36 36 % Chg # 18% 0% 24% 2% -14% 0% $ Sold $5,558,200 $6,741,250 $6,497,992 $5,479,940 $6,181,588 $6,019,512 % Chg $ 7% 21% -4% -16% 13% -3% Avg $ $168,430 $204,280 $158,488 $130,475 $171,711 $167,209 % Chg Avg -9% 21% -22% -18% 32% -3%
Central # Sold 82 81 93 104 89 104 % Chg # -2% -1% 15% 12% -14% 17% $ Sold $18,064,400 $14,012,192 $19,387,950 $19,472,616 $19,812,355 $20,546,065 % Chg $ 31% -22% 38% 0% 2% 4% Avg $ $220,298 $172,990 $208,473 $187,237 $222,611 $197,558 % Chg Avg 34% -21% 21% -10% 19% -11%
South # Sold 80 54 81 89 76 66 % Chg # 13% -33% 50% 10% -15% -13% $ Sold $41,576,800 $19,142,975 $29,828,397 $30,542,568 $29,917,273 $25,193,205 % Chg $ 45% -54% 56% 2% -2% -16% Avg $ $519,710 $354,500 $368,252 $343,175 $393,648 $381,715 % Chg Avg 29% -32% 4% -7% 15% -3%
Qtr1 # Sold 195 168 215 235 201 206 Qtr1 % Chg # 7% -14% 28% 9% -14% 2% Qtr1 $ Sold $65,199,400 $39,896,417 $55,714,339 $55,495,124 $55,911,216 $51,758,782 Qtr1 % Chg $ 37% -39% 40% 0% 1% -7% Qtr1 Avg $ $334,356 $237,479 $259,136 $236,149 $278,165 $251,256 Qtr1 % Chg Avg 28% -29% 9% -9% 18% -10%
Higher # sales with falling
dollar volume.

© Berkshire County Board of REALTORS: Believed to be accurate but not warranted | 2019 1st Quarter | Page 7
CONDO REPORT Last year we saw new developments and existing condo sales rebounding to help fill the gap where residential inventory was lacking. Growth in the condo market stalled for the first quarter of 2019, with the same number of sales in the north and central region as 2018, and falling sales from last years’ high in southern Berkshire. Overall retraction in the condo market is decrease of 25% in the number sold and 67% in the dollar volume transacted, from 12 million to 4 million.
Qtr. 1 Comparison 2014 2015 2016 2017 2018 2019 North
# Sold 1 3 1 3 3 % Chg # 200% -67% 200% 0% $ Sold $109,400 $525,000 $40,000 $672,900 $900,000 % Chg $ 380% -92% 1582% 34% Avg $ $109,400 $175,000 $40,000 $224,300 $300,000 % Chg Avg 60% -77% 461% 34%
Central # Sold 6 5 4 9 9 9 % Chg # -14% -17% -20% 125% 0% 0% $ Sold $1,319,800 $904,000 $961,500 $2,168,300 $2,299,400 $1,419,900 % Chg $ -28% -32% 6% 126% 6% -38% Avg $ $219,967 $180,800 $240,375 $240,922 $255,489 $157,767 % Chg Avg -16% -18% 33% 0% 6% -38%
South # Sold 10 5 4 7 12 6 % Chg # 43% -50% -20% 75% 71% -50% $ Sold $3,479,200 $1,055,000 $882,000 $1,507,000 $9,427,750 $1,822,500 % Chg $ 21% -70% -16% 71% 526% -81% Avg $ $347,920 $211,000 $220,500 $215,286 $785,646 $303,750 % Chg Avg -16% -39% 5% -2% 265% -61%
Qtr1 # Sold 16 11 11 17 24 18 Qtr1 % Chg # -11% -31% 0% 55% 41% -25% Qtr1 $ Sold $4,799,000 $2,068,400 $2,368,500 $3,715,300 $12,400,050 $4,142,400 Qtr1 % Chg $ -14% -57% 15% 57% 234% -67% Qtr1 Avg $ $299,938 $188,036 $215,318 $218,547 $516,669 $230,133 Qtr1 % Chg Avg -4% -37% 15% 1% 136% -55%
Condo sales retract in 1st
Quarter, except north
© Berkshire County Board of REALTORS: Believed to be accurate but not warranted | 2019 1st Quarter | Page 8
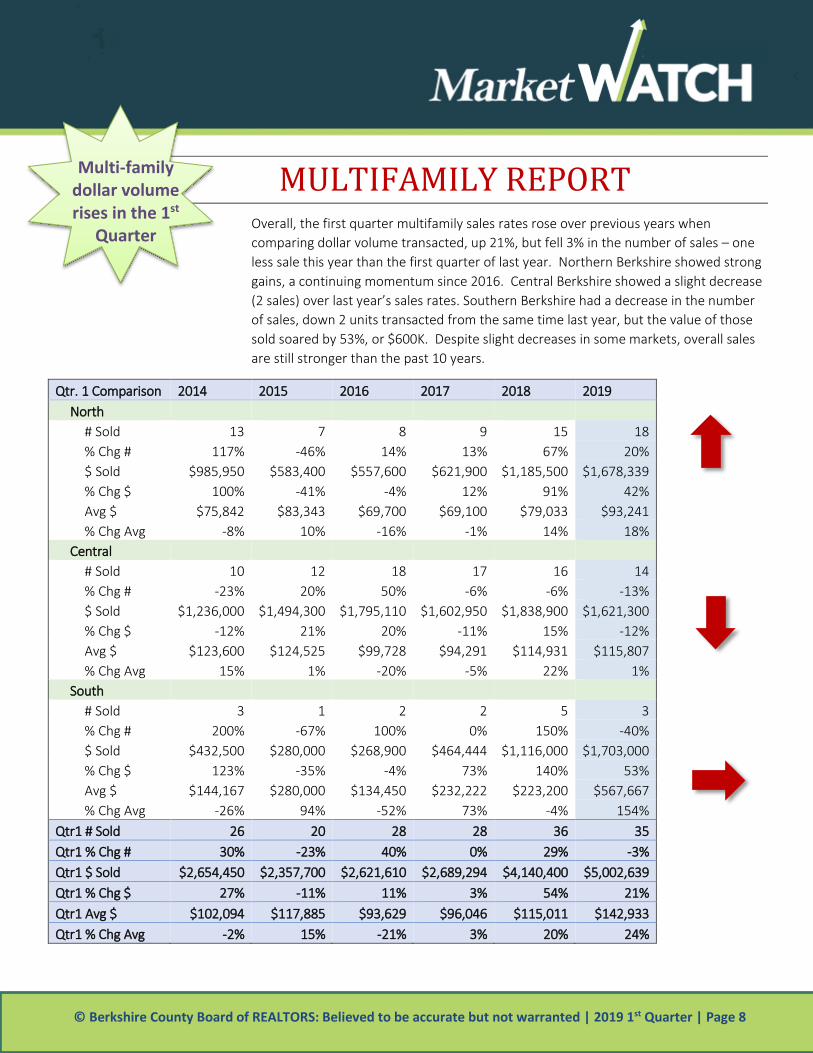
MULTIFAMILY REPORT Overall, the first quarter multifamily sales rates rose over previous years when comparing dollar volume transacted, up 21%, but fell 3% in the number of sales – one less sale this year than the first quarter of last year. Northern Berkshire showed strong gains, a continuing momentum since 2016. Central Berkshire showed a slight decrease (2 sales) over last year’s sales rates. Southern Berkshire had a decrease in the number of sales, down 2 units transacted from the same time last year, but the value of those sold soared by 53%, or $600K. Despite slight decreases in some markets, overall sales are still stronger than the past 10 years.
Qtr. 1 Comparison 2014 2015 2016 2017 2018 2019 North
# Sold 13 7 8 9 15 18 % Chg # 117% -46% 14% 13% 67% 20% $ Sold $985,950 $583,400 $557,600 $621,900 $1,185,500 $1,678,339 % Chg $ 100% -41% -4% 12% 91% 42% Avg $ $75,842 $83,343 $69,700 $69,100 $79,033 $93,241 % Chg Avg -8% 10% -16% -1% 14% 18%
Central # Sold 10 12 18 17 16 14 % Chg # -23% 20% 50% -6% -6% -13% $ Sold $1,236,000 $1,494,300 $1,795,110 $1,602,950 $1,838,900 $1,621,300 % Chg $ -12% 21% 20% -11% 15% -12% Avg $ $123,600 $124,525 $99,728 $94,291 $114,931 $115,807 % Chg Avg 15% 1% -20% -5% 22% 1%
South # Sold 3 1 2 2 5 3 % Chg # 200% -67% 100% 0% 150% -40% $ Sold $432,500 $280,000 $268,900 $464,444 $1,116,000 $1,703,000 % Chg $ 123% -35% -4% 73% 140% 53% Avg $ $144,167 $280,000 $134,450 $232,222 $223,200 $567,667 % Chg Avg -26% 94% -52% 73% -4% 154%
Qtr1 # Sold 26 20 28 28 36 35 Qtr1 % Chg # 30% -23% 40% 0% 29% -3% Qtr1 $ Sold $2,654,450 $2,357,700 $2,621,610 $2,689,294 $4,140,400 $5,002,639 Qtr1 % Chg $ 27% -11% 11% 3% 54% 21% Qtr1 Avg $ $102,094 $117,885 $93,629 $96,046 $115,011 $142,933 Qtr1 % Chg Avg -2% 15% -21% 3% 20% 24%
Multi-family dollar volume rises in the 1st
Quarter

© Berkshire County Board of REALTORS: Believed to be accurate but not warranted | 2019 1st Quarter | Page 9
LAND REPORT For the 1st quarter of 2019, land sales fell by 10 parcels (36%) but dollar volume of the land transacted rose a modest 6%. With only 18 sales countywide, overall sales are low. The market is considerably lower than our peak, when we transacted 59 parcels in the first quarter of 2003. With inventory retracting, we hope that building may begin and land sales also start to increase.
Qtr. 1 Comparison 2014 2015 2016 2017 2018 2019 North
# Sold 6 4 5 4 4 2 % Chg # 100% -33% 25% -20% 0% -50% $ Sold $344,900 $202,500 $252,650 $287,000 $54,500 $125,000 % Chg $ 144% -41% 25% 14% -81% 129% Avg $ $57,483 $50,625 $50,530 $71,750 $13,625 $62,500 % Chg Avg 22% -12% 0% 42% -81% 359%
Central # Sold 5 7 2 5 6 6 % Chg # 150% 40% -71% 150% 20% 0% $ Sold $579,500 $294,500 $198,000 $234,300 $292,500 $642,400 % Chg $ 346% -49% -33% 18% 25% 120% Avg $ $115,900 $42,071 $99,000 $46,860 $48,750 $107,067 % Chg Avg 78% -64% 135% -53% 4% 120%
South # Sold 16 5 13 12 18 10 % Chg # 45% -69% 160% -8% 50% -44% $ Sold $1,389,900 $1,357,275 $1,471,000 $1,020,000 $1,596,550 $1,301,750 % Chg $ -12% -2% 8% -31% 57% -18% Avg $ $86,869 $271,455 $113,154 $85,000 $88,697 $130,175 % Chg Avg -39% 212% -58% -25% 4% 47%
Qtr1 # Sold 27 16 20 21 28 18 Qtr1 % Chg # 69% -41% 25% 5% 33% -36% Qtr1 $ Sold $2,314,300 $1,854,275 $1,921,650 $1,541,300 $1,943,550 $2,069,150 Qtr1 % Chg $ 26% -20% 4% -20% 26% 6% Qtr1 Avg $ $85,715 $115,892 $96,083 $73,395 $69,413 $114,953 Qtr1 % Chg Avg -26% 35% -17% -24% -5% 66%
Land sales fall in parcels, but prices rise

© Berkshire County Board of REALTORS: Believed to be accurate but not warranted | 2019 1st Quarter | Page 10
COMMERCIAL REPORT . Commercial sales, while small in number, showed mixed improvements in the 1st quarter of the year in 2019 over past years. The number of sales stayed level with 10 commercial buildings sold, but the dollar volume fell 31% to $4.2 million, down from $6 million. North and south county commercial sales showed strong growth from last year. Please note: Not all Berkshire REALTOR assisted commercial sales are included in the MLS database.
Qtr. 1 Comparison 2014 2015 2016 2017 2018 2019 North
# Sold 1 2 3 2 3 % Chg # 100% 50% -33% 50% $ Sold $225,000 $458,000 $1,320,000 $180,000 $831,240 % Chg $ 104% 188% -86% 362% Avg $ $225,000 $229,000 $440,000 $90,000 $277,080 % Chg Avg 2% 92% -80% 208%
Central # Sold 2 4 5 4 2 % Chg # 100% 25% -20% -50% $ Sold $455,000 $691,250 $1,704,900 $3,555,000 $425,000 % Chg $ 52% 147% 109% -88% Avg $ $227,500 $172,813 $340,980 $888,750 $212,500 % Chg Avg -24% 97% 161% -76%
South # Sold 1 1 4 5 4 5 % Chg # -50% 0% 300% 25% -20% 25% $ Sold $450,000 $575,000 $1,570,000 $1,688,500 $2,322,500 $2,915,000 % Chg $ -75% 28% 173% 8% 38% 26% Avg $ $450,000 $575,000 $392,500 $337,700 $580,625 $583,000 % Chg Avg -50% 28% -32% -14% 72% 0%
Qtr1 # Sold 1 4 10 13 10 10 Qtr1 % Chg # -86% 300% 150% 30% -23% 0% Qtr1 $ Sold $450,000 $1,255,000 $2,719,250 $4,713,400 $6,057,500 $4,171,240 Qtr1 % Chg $ -85% 179% 117% 73% 29% -31% Qtr1 Avg $ $450,000 $313,750 $271,925 $362,569 $605,750 $417,124 Qtr1 % Chg Avg 4% -30% -13% 33% 67% -31%
Commercial sales show
steady growth since 2014
© Berkshire County Board of REALTORS: Believed to be accurate but not warranted | 2019 1st Quarter | Page 11
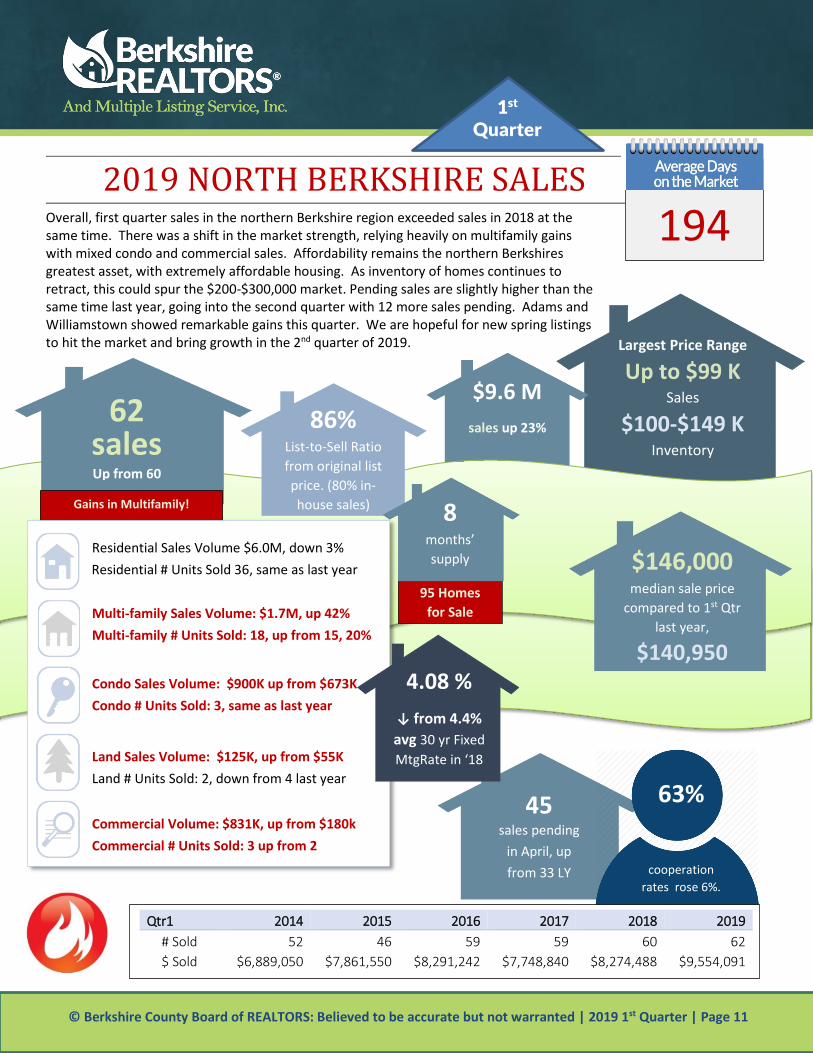
$9.6 M sales up 23%
95 Homes for Sale
45 sales pending
in April, up from 33 LY
Gains in Multifamily!
2019 NORTH BERKSHIRE SALES
Largest Price Range
Up to $99 K Sales
$100-$149 K Inventory
$146,000 median sale price
compared to 1st Qtr last year,
$140,950
62 sales Up from 60
194
86% List-to-Sell Ratio from original list price. (80% in-house sales)
Residential Sales Volume $6.0M, down 3% Residential # Units Sold 36, same as last year Multi-family Sales Volume: $1.7M, up 42% Multi-family # Units Sold: 18, up from 15, 20%
Condo Sales Volume: $900K up from $673K Condo # Units Sold: 3, same as last year
Land Sales Volume: $125K, up from $55K Land # Units Sold: 2, down from 4 last year Commercial Volume: $831K, up from $180k Commercial # Units Sold: 3 up from 2
Overall, first quarter sales in the northern Berkshire region exceeded sales in 2018 at the same time. There was a shift in the market strength, relying heavily on multifamily gains with mixed condo and commercial sales. Affordability remains the northern Berkshires greatest asset, with extremely affordable housing. As inventory of homes continues to retract, this could spur the $200-$300,000 market. Pending sales are slightly higher than the same time last year, going into the second quarter with 12 more sales pending. Adams and Williamstown showed remarkable gains this quarter. We are hopeful for new spring listings to hit the market and bring growth in the 2nd quarter of 2019.
63%
cooperation
rates rose 6%.
8 months’ supply
4.08 %
↓ from 4.4% avg 30 yr Fixed MtgRate in ‘18
Qtr1 2014 2015 2016 2017 2018 2019 # Sold 52 46 59 59 60 62 $ Sold $6,889,050 $7,861,550 $8,291,242 $7,748,840 $8,274,488 $9,554,091
1st
Quarter
© Berkshire County Board of REALTORS: Believed to be accurate but not warranted | 2019 1st Quarter | Page 12
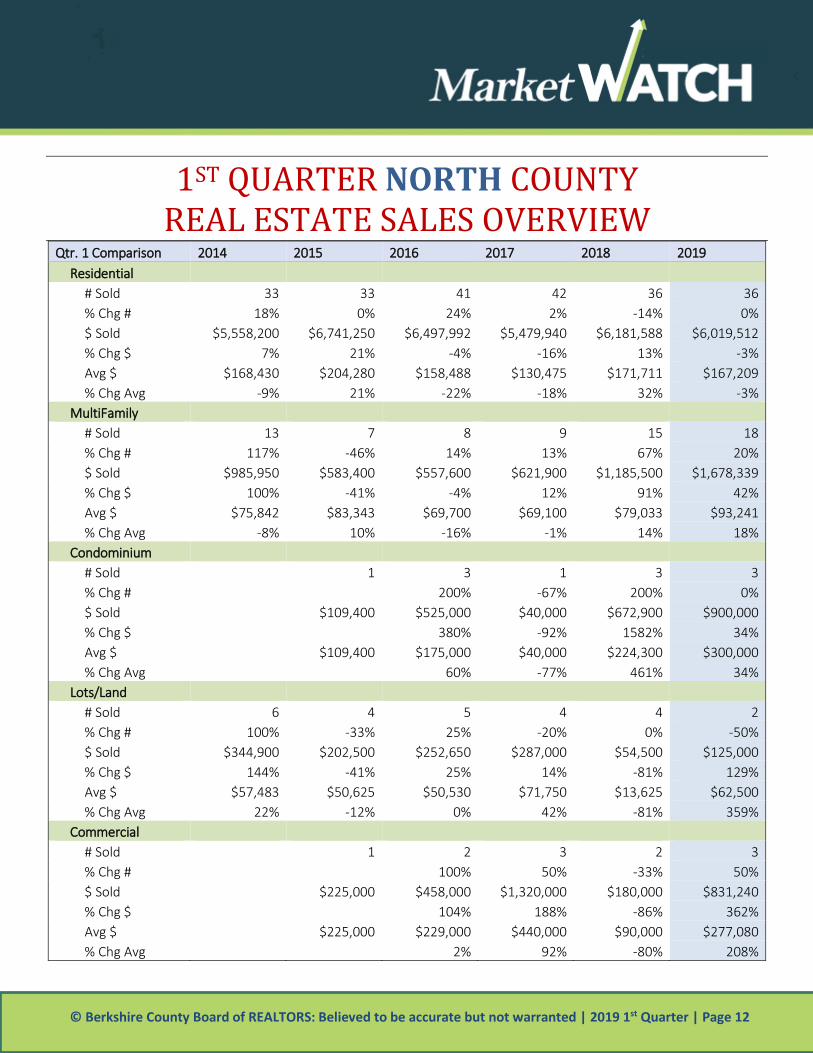
1ST QUARTER NORTH COUNTY REAL ESTATE SALES OVERVIEW
Qtr. 1 Comparison 2014 2015 2016 2017 2018 2019 Residential
# Sold 33 33 41 42 36 36 % Chg # 18% 0% 24% 2% -14% 0% $ Sold $5,558,200 $6,741,250 $6,497,992 $5,479,940 $6,181,588 $6,019,512 % Chg $ 7% 21% -4% -16% 13% -3% Avg $ $168,430 $204,280 $158,488 $130,475 $171,711 $167,209 % Chg Avg -9% 21% -22% -18% 32% -3%
MultiFamily # Sold 13 7 8 9 15 18 % Chg # 117% -46% 14% 13% 67% 20% $ Sold $985,950 $583,400 $557,600 $621,900 $1,185,500 $1,678,339 % Chg $ 100% -41% -4% 12% 91% 42% Avg $ $75,842 $83,343 $69,700 $69,100 $79,033 $93,241 % Chg Avg -8% 10% -16% -1% 14% 18%
Condominium # Sold 1 3 1 3 3 % Chg # 200% -67% 200% 0% $ Sold $109,400 $525,000 $40,000 $672,900 $900,000 % Chg $ 380% -92% 1582% 34% Avg $ $109,400 $175,000 $40,000 $224,300 $300,000 % Chg Avg 60% -77% 461% 34%
Lots/Land # Sold 6 4 5 4 4 2 % Chg # 100% -33% 25% -20% 0% -50% $ Sold $344,900 $202,500 $252,650 $287,000 $54,500 $125,000 % Chg $ 144% -41% 25% 14% -81% 129% Avg $ $57,483 $50,625 $50,530 $71,750 $13,625 $62,500 % Chg Avg 22% -12% 0% 42% -81% 359%
Commercial # Sold 1 2 3 2 3 % Chg # 100% 50% -33% 50% $ Sold $225,000 $458,000 $1,320,000 $180,000 $831,240 % Chg $ 104% 188% -86% 362% Avg $ $225,000 $229,000 $440,000 $90,000 $277,080 % Chg Avg 2% 92% -80% 208%
© Berkshire County Board of REALTORS: Believed to be accurate but not warranted | 2019 1st Quarter | Page 13
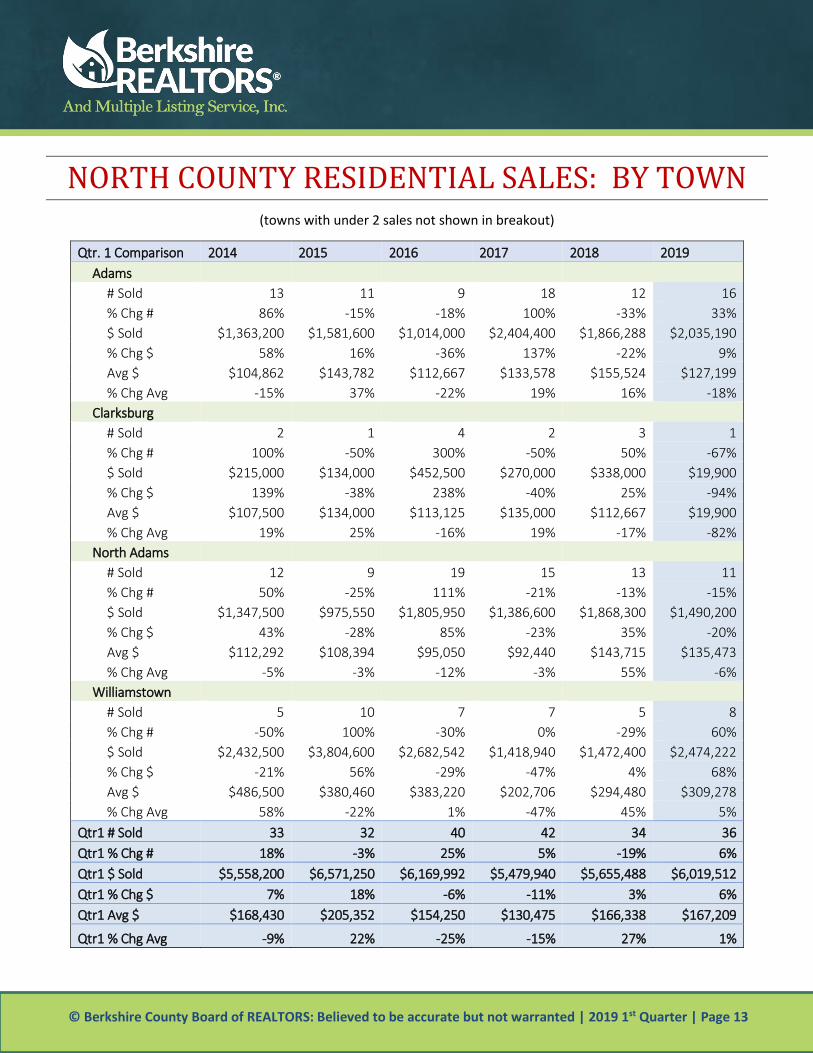
NORTH COUNTY RESIDENTIAL SALES: BY TOWN (towns with under 2 sales not shown in breakout)
Qtr. 1 Comparison 2014 2015 2016 2017 2018 2019 Adams
# Sold 13 11 9 18 12 16 % Chg # 86% -15% -18% 100% -33% 33% $ Sold $1,363,200 $1,581,600 $1,014,000 $2,404,400 $1,866,288 $2,035,190 % Chg $ 58% 16% -36% 137% -22% 9% Avg $ $104,862 $143,782 $112,667 $133,578 $155,524 $127,199 % Chg Avg -15% 37% -22% 19% 16% -18%
Clarksburg # Sold 2 1 4 2 3 1 % Chg # 100% -50% 300% -50% 50% -67% $ Sold $215,000 $134,000 $452,500 $270,000 $338,000 $19,900 % Chg $ 139% -38% 238% -40% 25% -94% Avg $ $107,500 $134,000 $113,125 $135,000 $112,667 $19,900 % Chg Avg 19% 25% -16% 19% -17% -82%
North Adams # Sold 12 9 19 15 13 11 % Chg # 50% -25% 111% -21% -13% -15% $ Sold $1,347,500 $975,550 $1,805,950 $1,386,600 $1,868,300 $1,490,200 % Chg $ 43% -28% 85% -23% 35% -20% Avg $ $112,292 $108,394 $95,050 $92,440 $143,715 $135,473 % Chg Avg -5% -3% -12% -3% 55% -6%
Williamstown # Sold 5 10 7 7 5 8 % Chg # -50% 100% -30% 0% -29% 60% $ Sold $2,432,500 $3,804,600 $2,682,542 $1,418,940 $1,472,400 $2,474,222 % Chg $ -21% 56% -29% -47% 4% 68% Avg $ $486,500 $380,460 $383,220 $202,706 $294,480 $309,278 % Chg Avg 58% -22% 1% -47% 45% 5%
Qtr1 # Sold 33 32 40 42 34 36 Qtr1 % Chg # 18% -3% 25% 5% -19% 6% Qtr1 $ Sold $5,558,200 $6,571,250 $6,169,992 $5,479,940 $5,655,488 $6,019,512 Qtr1 % Chg $ 7% 18% -6% -11% 3% 6% Qtr1 Avg $ $168,430 $205,352 $154,250 $130,475 $166,338 $167,209
Qtr1 % Chg Avg -9% 22% -25% -15% 27% 1%

© Berkshire County Board of REALTORS: Believed to be accurate but not warranted | 2019 1st Quarter | Page 14
$25 M sales ↓11%
104 Homes for Sale
90 sales pending
in April, up from 73 LY
Highest since 2007
2019 CENTRAL BERKSHIRE SALES
Largest Price Range
$100 - $200 K Sales
$100 - $200K Inventory
$174,000 median sale price
compared to 1st Qtr last year,
$188,000
135 sales
up 9%
133
92% List-to-Sell Ratio from original list price. (91% in-house sales)
Residential Sales Volume $20.5M, up 4% Residential # Units Sold 104, up 17% Multi-family Sales Volume: $1.6M, down 12% Multi-family # Units Sold: 14, down from 13
Condo Sales Volume: $1.4M, down 38% Condo # Units Sold: 9, same as last year
Land Sales Volume: $642K, up 20% Land # Units Sold: 6, same as last year Commercial Sales Volume: $425K, down 88% Commercial # Units Sold: 2, down from 2
Overall, the number of sales in central Berkshire rose 9% compared to the first quarter of 2018, yet the dollar volume fell 11%, down to $25 million from $28 million. Residential sales carried the region with steady gains in single-family sales, and land sales slightly edged up over the previous year. Multifamily, condo and commercial sales fell in the central region. Inventory continues to be an issue for central Berkshire, with a mere 5 months of supply to satisfy the demand. The most active price ranges for workforce housing has only 2 months of inventory to satisfy the majority of buyer demand. It was the strength of sales in Pittsfield and Dalton that supported the region this quarter.
80% co-broke
20% in-house
5 months’ supply
4.08 %
↓ from 4.4% avg 30 yr Fixed MtgRate in ‘18
1st Quarter 2014 2015 2016 2017 2018 2019 # Sold 103 107 121 140 124 135 $ Sold $21,199,700 $17,159,992 $23,033,810 $25,183,066 $27,798,155 $24,654,665

© Berkshire County Board of REALTORS: Believed to be accurate but not warranted | 2019 1st Quarter | Page 15
1ST QUARTER CENTRAL COUNTY REAL ESTATE SALES OVERVIEW
Qtr. 1 Comparison 2014 2015 2016 2017 2018 2019 Residential
# Sold 82 81 93 104 89 104 % Chg # -2% -1% 15% 12% -14% 17% $ Sold $18,064,400 $14,012,192 $19,387,950 $19,472,616 $19,812,355 $20,546,065 % Chg $ 31% -22% 38% 0% 2% 4% Avg $ $220,298 $172,990 $208,473 $187,237 $222,611 $197,558 % Chg Avg 34% -21% 21% -10% 19% -11%
MultiFamily # Sold 10 12 18 17 16 14 % Chg # -23% 20% 50% -6% -6% -13% $ Sold $1,236,000 $1,494,300 $1,795,110 $1,602,950 $1,838,900 $1,621,300 % Chg $ -12% 21% 20% -11% 15% -12% Avg $ $123,600 $124,525 $99,728 $94,291 $114,931 $115,807 % Chg Avg 15% 1% -20% -5% 22% 1%
Condominium # Sold 6 5 4 9 9 9 % Chg # -14% -17% -20% 125% 0% 0% $ Sold $1,319,800 $904,000 $961,500 $2,168,300 $2,299,400 $1,419,900 % Chg $ -28% -32% 6% 126% 6% -38% Avg $ $219,967 $180,800 $240,375 $240,922 $255,489 $157,767 % Chg Avg -16% -18% 33% 0% 6% -38%
Lots/Land # Sold 5 7 2 5 6 6 % Chg # 150% 40% -71% 150% 20% 0% $ Sold $579,500 $294,500 $198,000 $234,300 $292,500 $642,400 % Chg $ 346% -49% -33% 18% 25% 120% Avg $ $115,900 $42,071 $99,000 $46,860 $48,750 $107,067 % Chg Avg 78% -64% 135% -53% 4% 120%
Commercial # Sold 0 2 4 5 4 2 % Chg # 100% 25% -20% -50% $ Sold $455,000 $691,250 $1,704,900 $3,555,000 $425,000 % Chg $ 52% 147% 109% -88% Avg $ $227,500 $172,813 $340,980 $888,750 $212,500 % Chg Avg -24% 97% 161% -76%
© Berkshire County Board of REALTORS: Believed to be accurate but not warranted | 2019 1st Quarter | Page 16
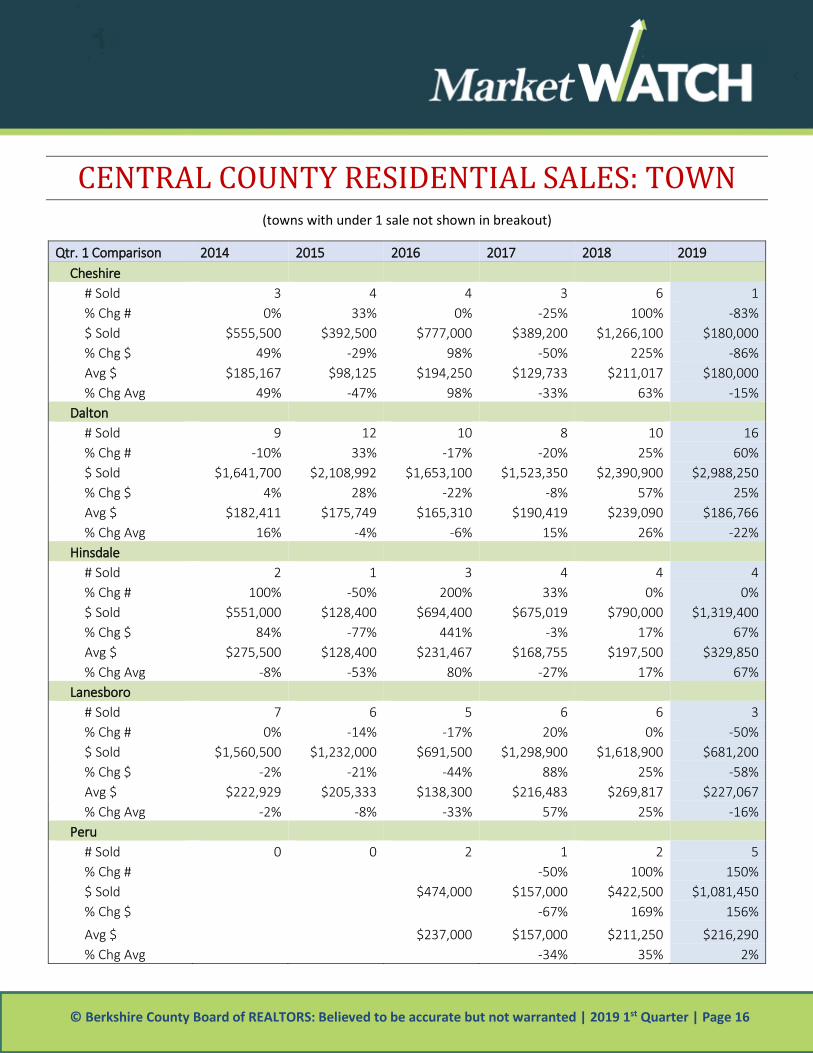
CENTRAL COUNTY RESIDENTIAL SALES: TOWN (towns with under 1 sale not shown in breakout)
Qtr. 1 Comparison 2014 2015 2016 2017 2018 2019 Cheshire
# Sold 3 4 4 3 6 1 % Chg # 0% 33% 0% -25% 100% -83% $ Sold $555,500 $392,500 $777,000 $389,200 $1,266,100 $180,000 % Chg $ 49% -29% 98% -50% 225% -86% Avg $ $185,167 $98,125 $194,250 $129,733 $211,017 $180,000 % Chg Avg 49% -47% 98% -33% 63% -15%
Dalton # Sold 9 12 10 8 10 16 % Chg # -10% 33% -17% -20% 25% 60% $ Sold $1,641,700 $2,108,992 $1,653,100 $1,523,350 $2,390,900 $2,988,250 % Chg $ 4% 28% -22% -8% 57% 25% Avg $ $182,411 $175,749 $165,310 $190,419 $239,090 $186,766 % Chg Avg 16% -4% -6% 15% 26% -22%
Hinsdale # Sold 2 1 3 4 4 4 % Chg # 100% -50% 200% 33% 0% 0% $ Sold $551,000 $128,400 $694,400 $675,019 $790,000 $1,319,400 % Chg $ 84% -77% 441% -3% 17% 67% Avg $ $275,500 $128,400 $231,467 $168,755 $197,500 $329,850 % Chg Avg -8% -53% 80% -27% 17% 67%
Lanesboro # Sold 7 6 5 6 6 3 % Chg # 0% -14% -17% 20% 0% -50% $ Sold $1,560,500 $1,232,000 $691,500 $1,298,900 $1,618,900 $681,200 % Chg $ -2% -21% -44% 88% 25% -58% Avg $ $222,929 $205,333 $138,300 $216,483 $269,817 $227,067 % Chg Avg -2% -8% -33% 57% 25% -16%
Peru # Sold 0 0 2 1 2 5 % Chg # -50% 100% 150% $ Sold $474,000 $157,000 $422,500 $1,081,450 % Chg $ -67% 169% 156%
Avg $ $237,000 $157,000 $211,250 $216,290 % Chg Avg -34% 35% 2%
© Berkshire County Board of REALTORS: Believed to be accurate but not warranted | 2019 1st Quarter | Page 17
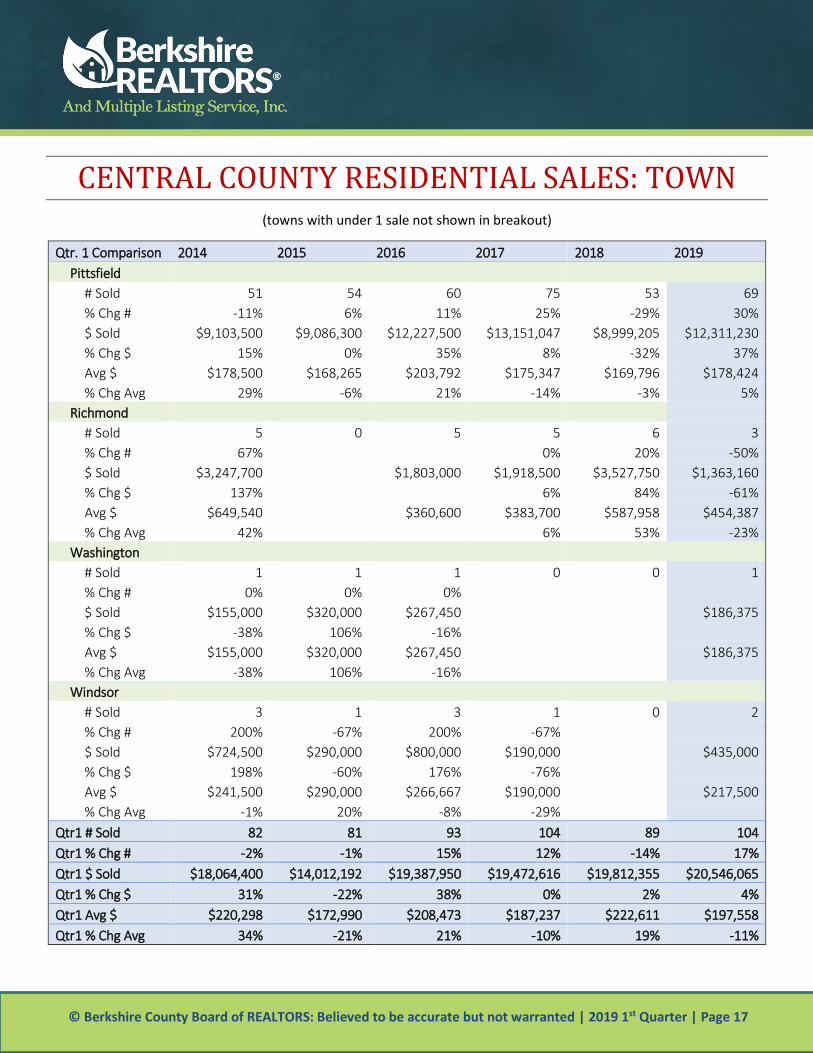
CENTRAL COUNTY RESIDENTIAL SALES: TOWN (towns with under 1 sale not shown in breakout)
Qtr. 1 Comparison 2014 2015 2016 2017 2018 2019 Pittsfield
# Sold 51 54 60 75 53 69 % Chg # -11% 6% 11% 25% -29% 30% $ Sold $9,103,500 $9,086,300 $12,227,500 $13,151,047 $8,999,205 $12,311,230 % Chg $ 15% 0% 35% 8% -32% 37% Avg $ $178,500 $168,265 $203,792 $175,347 $169,796 $178,424 % Chg Avg 29% -6% 21% -14% -3% 5%
Richmond # Sold 5 0 5 5 6 3 % Chg # 67% 0% 20% -50% $ Sold $3,247,700 $1,803,000 $1,918,500 $3,527,750 $1,363,160 % Chg $ 137% 6% 84% -61% Avg $ $649,540 $360,600 $383,700 $587,958 $454,387 % Chg Avg 42% 6% 53% -23%
Washington # Sold 1 1 1 0 0 1 % Chg # 0% 0% 0% $ Sold $155,000 $320,000 $267,450 $186,375 % Chg $ -38% 106% -16% Avg $ $155,000 $320,000 $267,450 $186,375 % Chg Avg -38% 106% -16%
Windsor # Sold 3 1 3 1 0 2 % Chg # 200% -67% 200% -67% $ Sold $724,500 $290,000 $800,000 $190,000 $435,000 % Chg $ 198% -60% 176% -76% Avg $ $241,500 $290,000 $266,667 $190,000 $217,500 % Chg Avg -1% 20% -8% -29%
Qtr1 # Sold 82 81 93 104 89 104 Qtr1 % Chg # -2% -1% 15% 12% -14% 17% Qtr1 $ Sold $18,064,400 $14,012,192 $19,387,950 $19,472,616 $19,812,355 $20,546,065 Qtr1 % Chg $ 31% -22% 38% 0% 2% 4% Qtr1 Avg $ $220,298 $172,990 $208,473 $187,237 $222,611 $197,558 Qtr1 % Chg Avg 34% -21% 21% -10% 19% -11%

© Berkshire County Board of REALTORS: Believed to be accurate but not warranted | 2019 1st Quarter | Page 18
$44.4M sales ↑26%
377 Homes for Sale
44 sales pending
in April
Gt Barrington & Lenox Strong
2019 SOUTH BERKSHIRE SALES
Largest Price Range
$250-299 K Sales
$500 -749K Inventory
$295,000 median sale price
compared to 1st Qtr last year,
$302,500
90 sales
Down from 115
262
80% List-to-Sell Ratio
selling price compared to original list price. (71% for in-house sales)
Residential Sales Volume $25M, down 16% Residential # Units Sold 66, down 13% Multi-family Sales Volume: $1.7M, up 53% Multi-family # Units Sold: 3, down 2 sales Condo Sales Volume: $1.8M down 81% Condo # Units Sold: 6, down from 12 last year
Land Sales Volume: $1.3M, down 44% Land # Units Sold: 10, down from 18 Commercial Sales Volume: $2.9M, up 26% Commercial # Units Sold: 5, up from 4 LY
While south county boasts the highest (17 months) of absorption, the inventory doesn’t currently exist where sales are most robust. There were pockets of a strong residential market in the first quarter (Lenox and Great Barrington), yet most communities saw a reduction in both number of sales and dollar volume transacted. While other parts of the county are listing homes closer to the ultimate selling price, southern Berkshire sales are taking longer to sell and lowering prices on average by 20% before selling. Half of all residential inventory is over $500,000, and 20% is over $1 million.
64% co-broke
‘
36% in-house
17 months’ supply
4.08 %
↓ from 4.4% avg 30 yr Fixed MtgRate in ‘18
Qtr1 2014 2015 2016 2017 2018 2019 # Sold 110 66 104 115 115 90 $ Sold $47,328,400 $22,410,250 $34,020,297 $35,222,512 $44,380,073 $32,935,455
1st
Quarter
© Berkshire County Board of REALTORS: Believed to be accurate but not warranted | 2019 1st Quarter | Page 19
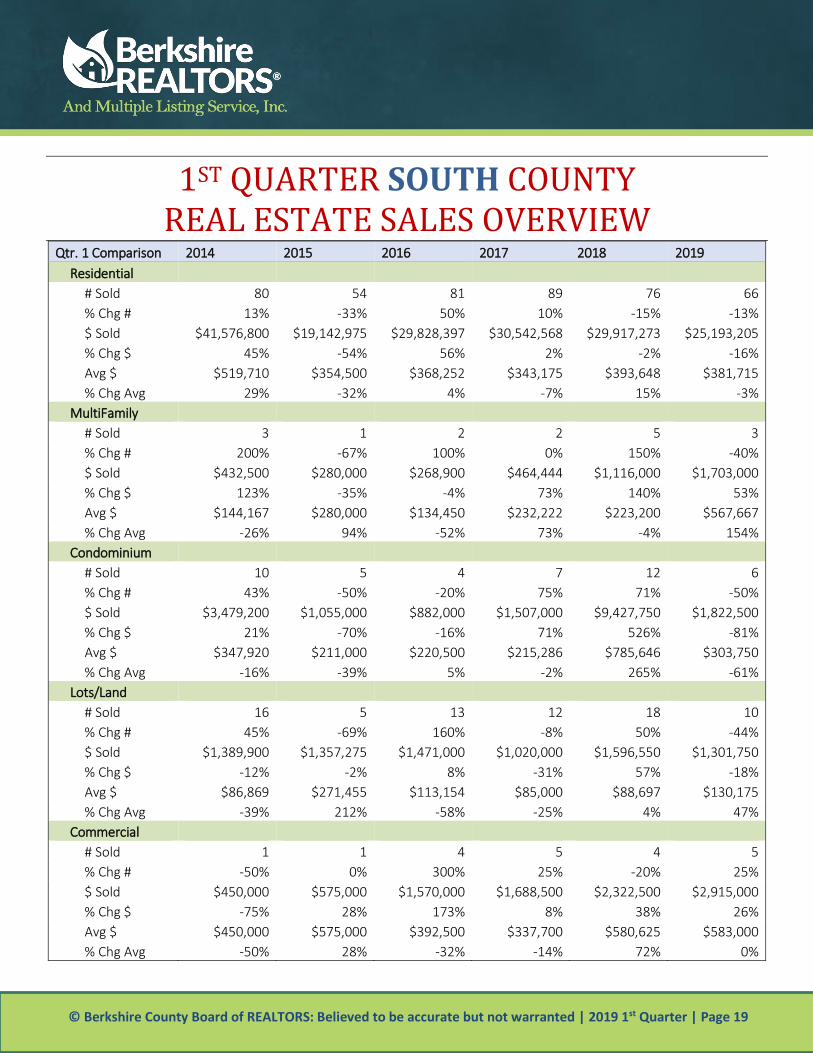
1ST QUARTER SOUTH COUNTY REAL ESTATE SALES OVERVIEW
Qtr. 1 Comparison 2014 2015 2016 2017 2018 2019 Residential
# Sold 80 54 81 89 76 66 % Chg # 13% -33% 50% 10% -15% -13% $ Sold $41,576,800 $19,142,975 $29,828,397 $30,542,568 $29,917,273 $25,193,205 % Chg $ 45% -54% 56% 2% -2% -16% Avg $ $519,710 $354,500 $368,252 $343,175 $393,648 $381,715 % Chg Avg 29% -32% 4% -7% 15% -3%
MultiFamily # Sold 3 1 2 2 5 3 % Chg # 200% -67% 100% 0% 150% -40% $ Sold $432,500 $280,000 $268,900 $464,444 $1,116,000 $1,703,000 % Chg $ 123% -35% -4% 73% 140% 53% Avg $ $144,167 $280,000 $134,450 $232,222 $223,200 $567,667 % Chg Avg -26% 94% -52% 73% -4% 154%
Condominium # Sold 10 5 4 7 12 6 % Chg # 43% -50% -20% 75% 71% -50% $ Sold $3,479,200 $1,055,000 $882,000 $1,507,000 $9,427,750 $1,822,500 % Chg $ 21% -70% -16% 71% 526% -81% Avg $ $347,920 $211,000 $220,500 $215,286 $785,646 $303,750 % Chg Avg -16% -39% 5% -2% 265% -61%
Lots/Land # Sold 16 5 13 12 18 10 % Chg # 45% -69% 160% -8% 50% -44% $ Sold $1,389,900 $1,357,275 $1,471,000 $1,020,000 $1,596,550 $1,301,750 % Chg $ -12% -2% 8% -31% 57% -18% Avg $ $86,869 $271,455 $113,154 $85,000 $88,697 $130,175 % Chg Avg -39% 212% -58% -25% 4% 47%
Commercial # Sold 1 1 4 5 4 5 % Chg # -50% 0% 300% 25% -20% 25% $ Sold $450,000 $575,000 $1,570,000 $1,688,500 $2,322,500 $2,915,000 % Chg $ -75% 28% 173% 8% 38% 26% Avg $ $450,000 $575,000 $392,500 $337,700 $580,625 $583,000 % Chg Avg -50% 28% -32% -14% 72% 0%
© Berkshire County Board of REALTORS: Believed to be accurate but not warranted | 2019 1st Quarter | Page 20
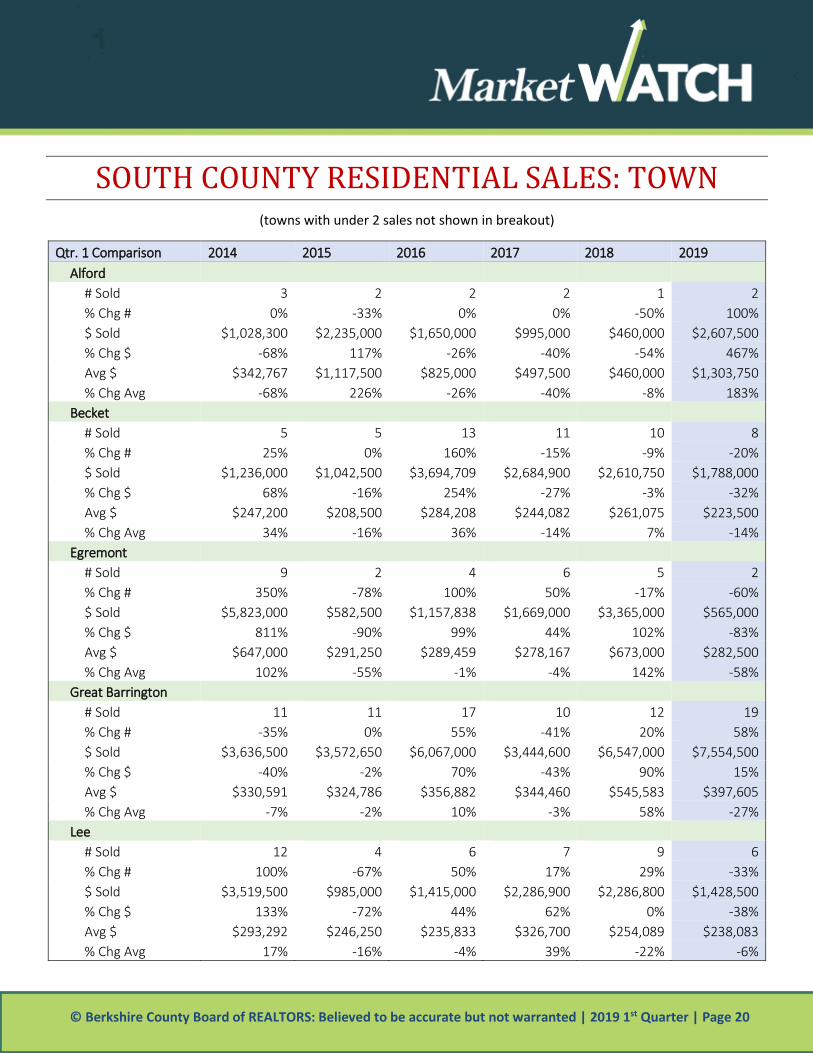
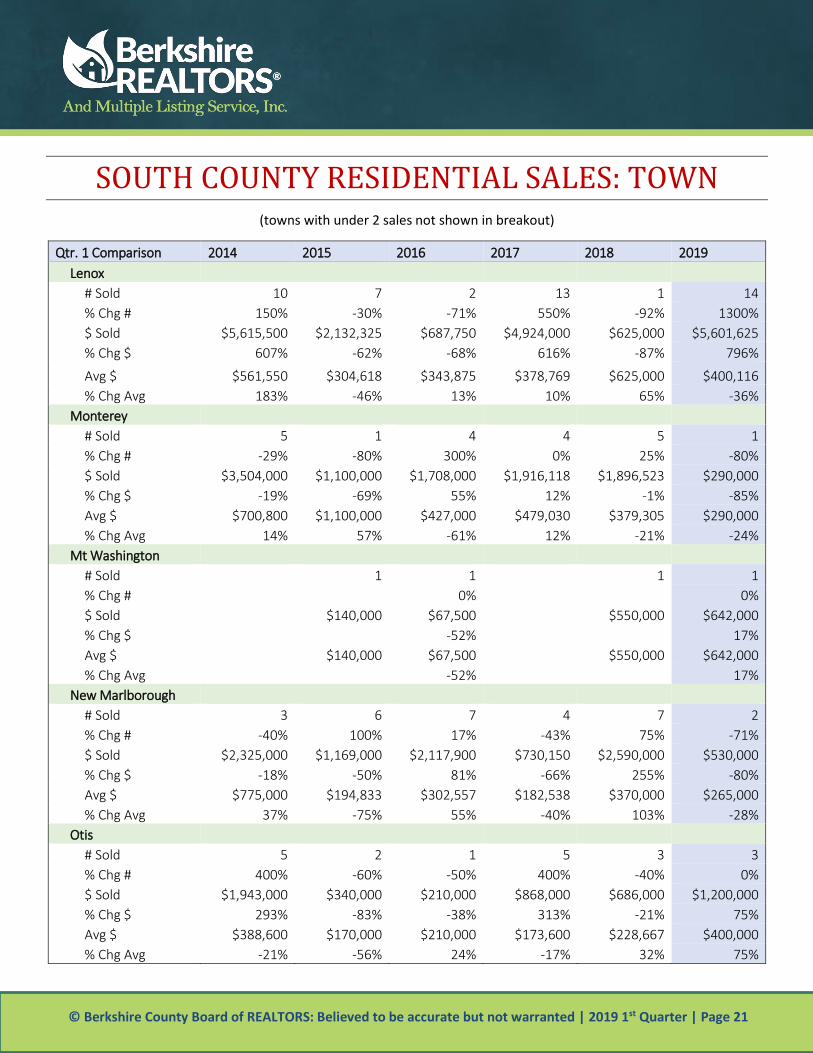
SOUTH COUNTY RESIDENTIAL SALES: TOWN (towns with under 2 sales not shown in breakout)
Qtr. 1 Comparison 2014 2015 2016 2017 2018 2019 Alford
# Sold 3 2 2 2 1 2 % Chg # 0% -33% 0% 0% -50% 100% $ Sold $1,028,300 $2,235,000 $1,650,000 $995,000 $460,000 $2,607,500 % Chg $ -68% 117% -26% -40% -54% 467% Avg $ $342,767 $1,117,500 $825,000 $497,500 $460,000 $1,303,750 % Chg Avg -68% 226% -26% -40% -8% 183%
Becket # Sold 5 5 13 11 10 8 % Chg # 25% 0% 160% -15% -9% -20% $ Sold $1,236,000 $1,042,500 $3,694,709 $2,684,900 $2,610,750 $1,788,000 % Chg $ 68% -16% 254% -27% -3% -32% Avg $ $247,200 $208,500 $284,208 $244,082 $261,075 $223,500 % Chg Avg 34% -16% 36% -14% 7% -14%
Egremont # Sold 9 2 4 6 5 2 % Chg # 350% -78% 100% 50% -17% -60% $ Sold $5,823,000 $582,500 $1,157,838 $1,669,000 $3,365,000 $565,000 % Chg $ 811% -90% 99% 44% 102% -83% Avg $ $647,000 $291,250 $289,459 $278,167 $673,000 $282,500 % Chg Avg 102% -55% -1% -4% 142% -58%
Great Barrington # Sold 11 11 17 10 12 19 % Chg # -35% 0% 55% -41% 20% 58% $ Sold $3,636,500 $3,572,650 $6,067,000 $3,444,600 $6,547,000 $7,554,500 % Chg $ -40% -2% 70% -43% 90% 15% Avg $ $330,591 $324,786 $356,882 $344,460 $545,583 $397,605 % Chg Avg -7% -2% 10% -3% 58% -27%
Lee # Sold 12 4 6 7 9 6 % Chg # 100% -67% 50% 17% 29% -33% $ Sold $3,519,500 $985,000 $1,415,000 $2,286,900 $2,286,800 $1,428,500 % Chg $ 133% -72% 44% 62% 0% -38% Avg $ $293,292 $246,250 $235,833 $326,700 $254,089 $238,083 % Chg Avg 17% -16% -4% 39% -22% -6%
© Berkshire County Board of REALTORS: Believed to be accurate but not warranted | 2019 1st Quarter | Page 21
SOUTH COUNTY RESIDENTIAL SALES: TOWN (towns with under 2 sales not shown in breakout)
Qtr. 1 Comparison 2014 2015 2016 2017 2018 2019 Lenox
# Sold 10 7 2 13 1 14 % Chg # 150% -30% -71% 550% -92% 1300% $ Sold $5,615,500 $2,132,325 $687,750 $4,924,000 $625,000 $5,601,625 % Chg $ 607% -62% -68% 616% -87% 796%
Avg $ $561,550 $304,618 $343,875 $378,769 $625,000 $400,116 % Chg Avg 183% -46% 13% 10% 65% -36%
Monterey # Sold 5 1 4 4 5 1 % Chg # -29% -80% 300% 0% 25% -80% $ Sold $3,504,000 $1,100,000 $1,708,000 $1,916,118 $1,896,523 $290,000 % Chg $ -19% -69% 55% 12% -1% -85% Avg $ $700,800 $1,100,000 $427,000 $479,030 $379,305 $290,000 % Chg Avg 14% 57% -61% 12% -21% -24%
Mt Washington # Sold 1 1 1 1 % Chg # 0% 0% $ Sold $140,000 $67,500 $550,000 $642,000 % Chg $ -52% 17% Avg $ $140,000 $67,500 $550,000 $642,000 % Chg Avg -52% 17%
New Marlborough # Sold 3 6 7 4 7 2 % Chg # -40% 100% 17% -43% 75% -71% $ Sold $2,325,000 $1,169,000 $2,117,900 $730,150 $2,590,000 $530,000 % Chg $ -18% -50% 81% -66% 255% -80% Avg $ $775,000 $194,833 $302,557 $182,538 $370,000 $265,000 % Chg Avg 37% -75% 55% -40% 103% -28%
Otis # Sold 5 2 1 5 3 3 % Chg # 400% -60% -50% 400% -40% 0% $ Sold $1,943,000 $340,000 $210,000 $868,000 $686,000 $1,200,000 % Chg $ 293% -83% -38% 313% -21% 75% Avg $ $388,600 $170,000 $210,000 $173,600 $228,667 $400,000 % Chg Avg -21% -56% 24% -17% 32% 75%

© Berkshire County Board of REALTORS: Believed to be accurate but not warranted | 2019 1st Quarter | Page 22
SOUTH COUNTY RESIDENTIAL SALES: TOWN (towns with under 2 sales not shown in breakout)
Qtr. 1 Comparison 2014 2015 2016 2017 2018 2019 Sandisfield
# Sold 4 1 4 2 4 % Chg # 300% -75% 300% -50% 100% $ Sold $4,017,000 $195,000 $1,746,500 $507,500 $773,200 % Chg $ 4921% -95% 796% -71% 52% Avg $ $1,004,250 $195,000 $436,625 $253,750 $193,300 % Chg Avg 1155% -81% 124% -42% -24%
Sheffield # Sold 4 5 8 12 9 5 % Chg # 0% 25% 60% 50% -25% -44% $ Sold $1,636,500 $2,383,000 $1,537,000 $5,029,000 $3,227,000 $1,592,900 % Chg $ 74% 46% -36% 227% -36% -51% Avg $ $409,125 $476,600 $192,125 $419,083 $358,556 $318,580 % Chg Avg 74% 16% -60% 118% -14% -11%
Stockbridge # Sold 8 5 7 6 8 1 % Chg # -43% -38% 40% -14% 33% -88% $ Sold $6,667,500 $2,579,000 $5,829,200 $1,561,900 $3,950,000 $519,180 % Chg $ 18% -61% 126% -73% 153% -87% Avg $ $833,438 $515,800 $832,743 $260,317 $493,750 $519,180 % Chg Avg 106% -38% 61% -69% 90% 5%
West Stockbridge # Sold 1 2 3 7 1 2 % Chg # -67% 100% 50% 133% -86% 100% $ Sold $625,000 $687,000 $1,395,000 $3,925,500 $350,000 $874,000 % Chg $ -54% 10% 103% 181% -91% 150% Avg $ $625,000 $343,500 $465,000 $560,786 $350,000 $437,000 % Chg Avg 38% -45% 35% 21% -38% 25%
Qtr1 # Sold 80 54 81 89 76 66 Qtr1 % Chg # 13% -33% 50% 10% -15% -13% Qtr1 $ Sold $41,576,800 $19,142,975 $29,828,397 $30,542,568 $29,917,273 $25,193,205 Qtr1 % Chg $ 45% -54% 56% 2% -2% -16% Qtr1 Avg $ $519,710 $354,500 $368,252 $343,175 $393,648 $381,715 Qtr1 % Chg Avg 29% -32% 4% -7% 15% -3%
© Berkshire County Board of REALTORS: Believed to be accurate but not warranted | 2019 1st Quarter | Page 23
2019 MARKET INDICATORS Brief Real Estate Housing Forecast, by Danielle Hale, Chief Economist of Realtor.com
• Home price growth will continue to slow, with a forecasted increase of 2.2% • Inventory increases will remain moderate with less than a 7 percent increase • High-priced markets will buck the trend, with double-digit inventory gains • Millennials will account for 45% of mortgages in 2019 vs. 17% for Boomers • New tax plan will be good for renters, mixed for homeowners
Inventory will continue to increase next year, but unless there is a major shift in the economic trajectory, we don’t expect a buyer’s market on the horizon within the next five years.
What will 2019 be like for buyers? Buying a home will be an even more expensive undertaking as mortgage rates and home prices increase. Buyers who are able to stay in the market will find less competition as more buyers are priced out, but feel an increased sense of urgency to close before it gets even more expensive. Although the number of homes for sale is increasing, the majority of new inventory is focused in the mid-to higher-end price tier, not entry-level. Rising mortgage rates and prices will make it especially tough for first time home buyers.
What will 2019 be like for sellers? Although it remains a seller’s market, sellers will need to be mindful of their increasing competition and shouldn’t necessarily expect to name their price and get it in full — a change from the past few years. Above-median priced sellers, may find it will take longer to sell and require offering incentives, such as price cuts or other offerings. With less demand in the market, there will be fewer bidding wars and multiple offers. However, with inventory expected to remain limited in most markets, sellers who price competitively can still walk away with a handsome profit.
Tax plan remains a wild card for housing In April 2019, taxpayers will go through the income tax process for the first time since the new tax plan. For most renters, the results will be good. For homeowners, it’s a mixed bag. Some will benefit from lower rates and a higher standard deduction, but many others will find limited itemized deductions and personal exemptions mean a higher tax bill. While many factors influence home sales, it could be the case that without homeownership incentives some renters are holding off on buying. How the market will react in 2019 remains a wildcard for housing.
Millennials purchase the most homes Millennials will continue to make up the largest segment of buyers next year, accounting for 45 percent of mortgages, compared to 17 percent of Boomers, and 37 percent of Gen Xers. While first-time buyers will struggle next year, older millennial move-up buyers will have more options in the mid-to upper-tier price point and will make up the majority of millennials who close in 2019. Millennials are also likely to make up the largest share of home buyers for the next decade as their housing needs adjust over time.
Report generated by Sandra J. Carroll, Chief Executive Officer, Berkshire County Board of REALTORS, Inc.
99 West Street, Pittsfield, MA 01201 | (413) 442-8049
Fax (413) 448-2852 Data derived from the Berkshire County Multiple Listing Service, Inc. Believed to be accurate but not warranted. Mortgage Rates
Taken from FreddieMac historical Rates by Month.
Economic forecast from Realtor.com