2 capacity utilisation and performance appraisal of paper...
TRANSCRIPT
2
CAPACITY UTILISATION AND PERFORMANCE
APPRAISAL OF PAPER MILLS OF KUMAUN
Efficient or optimum utilisation of capacity is desirable both for
society and management. In production the concepts used
regarding capacity are as under-
A) THEORETICAL OR MAXIMUM PLANT CAPACITY:
Maximum capacity or the ideal capacity is the
capacity for which plant is designed to operate. It is only
theoretical capacity. It does not give allowance for
waiting, delays and shutdown. The capacity is significant
for designing the plant mechanically. Ideal capacity is
never used to determine overhead rates for its disregard
to even necessary interruptions in production process.
B) PRACTICAL CAPACITY :
When this capacity is determined, allowance is
given for unavoidable interruptions like time lost for
repairs, in-efficiencies, breakdown, delay in delivery of
raw materials and supplies, labour shortages and
Estelar
absence, Sundays, holidays, vacation, inventory taking,
etc. In this way, practical capacity is the maximum
theoretical capacity with minor unavoidable interruptions.
These unavoidable interruptions are based mostly on
internal influences and do not consider main external
causes like lack of customers’ orders. The practical
capacity is determined with reference to nature of
industry and circumstances in which a particular factory
is situated. Normal unavoidable interruptions account for
15% to 25% of the maximum capacity. The practical
capacity, thus, ranges between 75% and 85% of
maximum capacity after giving allowance for normal
unavoidable interruptions.
C) NORMAL CAPACITY:
Idle capacity due to long term sales trend only is
reduced from practical capacity to get normal capacity.
Calculation of normal capacity of a plant presents
considerable problems. Normal capacity is determined for
the business as a whole. For normal capacity
determination, prime considerations are physical capacity
and average sales expectancy. It should be noted that
Estelar

average sales expectancy to be considered for this
purpose takes into account a period enough to level out
cyclical fluctuations. The determination of normal capacity
helps in (i) the preparation of flexible budgets and
computation of predetermined factory overhead rates. (ii)
the use of standard costing, (iii) estimating sales price etc.
(iv) scheduling production, (v) inventory valuation, (vi)
determination of break even point, (vii) controlling costs.
CAPACITY UTILISATION: -
The capacity utilisation depends upon several
factors like availability of raw material, working capital,
skilled labour , power, technical know-how, managerial
efficiency and so many other factors. The cost structure
and degree of variability in costs and the capacity
utilisation collectively affect the cost of production. Higher
is the capacity utilization, lower is the cost of production.
The following table shows capacity utilisation in paper
mills of Kumaun Division of Uttaranchal:
Estelar
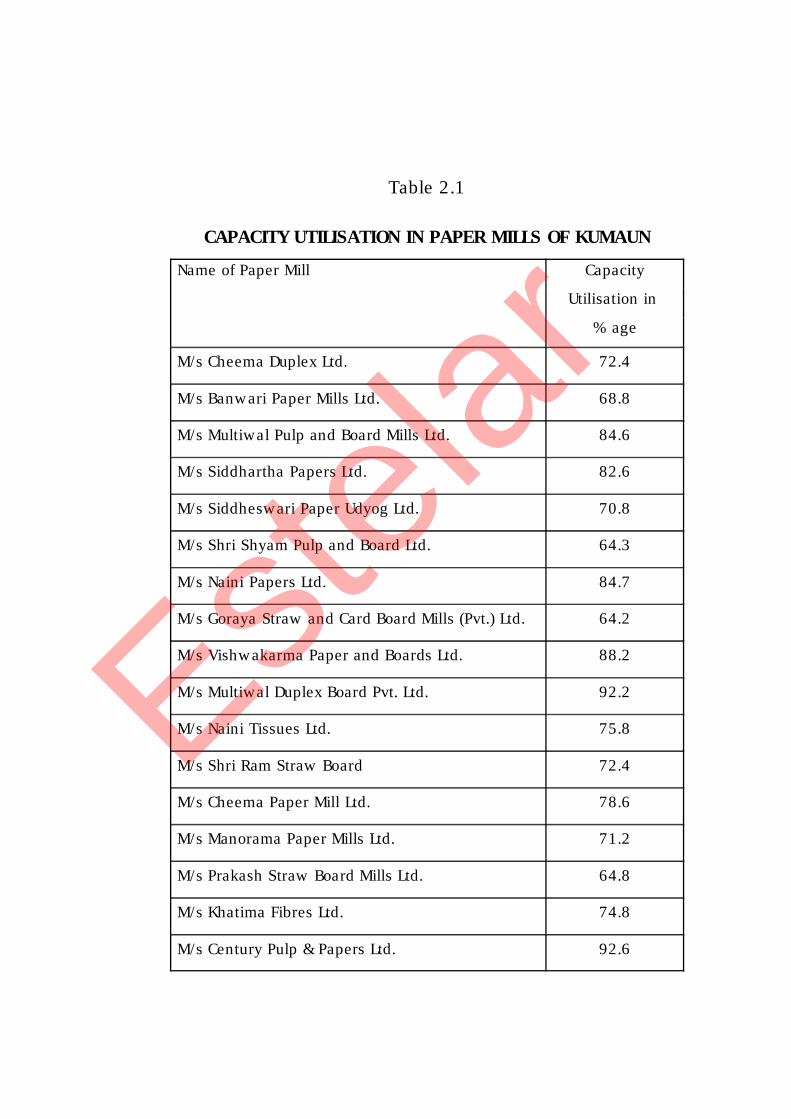
Table 2.1
CAPACITY UTILISATION IN PAPER MILLS OF KUMAUN
Name of Paper Mill Capacity
Utilisation in
% age
M/s Cheema Duplex Ltd. 72.4
M/s Banwari Paper Mills Ltd. 68.8
M/s Multiwal Pulp and Board Mills Ltd. 84.6
M/s Siddhartha Papers Ltd. 82.6
M/s Siddheswari Paper Udyog Ltd. 70.8
M/s Shri Shyam Pulp and Board Ltd. 64.3
M/s Naini Papers Ltd. 84.7
M/s Goraya Straw and Card Board Mills (Pvt.) Ltd. 64.2
M/s Vishwakarma Paper and Boards Ltd. 88.2
M/s Multiwal Duplex Board Pvt. Ltd. 92.2
M/s Naini Tissues Ltd. 75.8
M/s Shri Ram Straw Board 72.4
M/s Cheema Paper Mill Ltd. 78.6
M/s Manorama Paper Mills Ltd. 71.2
M/s Prakash Straw Board Mills Ltd. 64.8
M/s Khatima Fibres Ltd. 74.8
M/s Century Pulp & Papers Ltd. 92.6
Estelar

Sources : Based on Survey results (On average basis)
By the analysis of the above table it is obvious that the
capacity utilisation in paper mills of Kumaun Division of
Uttaranchal ranges between 64.2 to 92.6 percent. The highest
percentage of capacity utilisation is in M/s Century Pulp &
Papers Ltd., Lalkuan which is the giant paper unit not only in
Uttaranchal but all over India. This unit is based on wood so
there is no competition with other paper mills of the region.
The wood is eucalyptus, bamboo and poplar are easily available
to this mill as the mill pays remunerative price to the growers
who in turn sell these items to the mill. Other mills too do not
depend on local resources only, they manage nearly 60 percent
of their raw material requirements through imports. Till date no
restriction has been imposed by Government of Uttar Pradesh or
Delhi or Haryana on the supply of wheat straw, waste paper,
rice straw etc. to these mills. But at local level there is pressure
on the supply of wheat straw being it main fodder. As the
Estelar

number of paper mills is on growth in the region there is
pressure on the supply of raw materials. The second reason
behind low capacity utilisation is shortage of power supply.
Capacity expansion also led to pressure on raw materials.
PERFORMANCE APPRAISAL
The paper mills are playing important role in the
economy of Uttaranchal. Their contribution may be viewed
under the following heads:
PRODUCTIVE INVESTMENT
The following table reveals capital investment in crores of
rupees in paper mills of Kumaun Division of Uttaranchal:Estelar

Table 2.2CAPITAL INVESTMENT IN PAPER MILLS OF KUMAUN
(Rs. In crores)
Name of Paper Mill C a p i t a lInvestment
M/s Cheema Duplex Ltd. 37.78
M/s Banwari Paper Mills Ltd. 5.50
M/s Multiwal Pulp and Board Mills Ltd. 4.15
M/s Siddhartha Papers Ltd. 5.18
M/s Siddheswari Paper Udyog Ltd. 6.15
M/s Shri Shyam Pulp and Board Ltd. 22.70
M/s Naini Papers Ltd. 9.28
M/s Goraya Straw and Card Board Mills (Pvt.) Ltd. 4.50
M/s Vishwakarma Paper and Boards Ltd. 3.20
M/s Multiwal Duplex Board Pvt. Ltd. 3.76
M/s Naini Tissues Ltd. 50.00
M/s Shri Ram Straw Board 18.00
M/s Cheema Paper Mill Ltd. 6.89
M/s Manorama Paper Mills Ltd. 3.65
M/s Prakash Straw Board Mills Ltd. 2.85
M/s Khatima Fibres Ltd. 26.19
M/s Century Pulp & Papers Ltd. 350.00
Total 559.78
Total Industrial Capital Investment in KumaunDivision
1608.22
Share of Paper Mills (in % age) 34.81
Source : Based on Personal Survey
Estelar

It is obvious that the share of paper mills in total capital
investment is significant. It counts nearly 1/3 rd of the total. As
we are aware of the fact that the small savings form huge
capital. Capital is the amount invested in productive activities
which results in increase in the quantum of goods and services.
The production and sale of goods and services does not occur
income to Government in the form of excise duty, trade tax and
income tax only but also elevates the standard of living of the
society. Increase in supply helps in many ways tending to
economic development and prosperity. This huge investment
also incurs social liability too. As the capital investment in the
industries too is the end result of public funds, the seed capital
as well as the working capital provided by the financial
institutions and the commercial banks are indirectly money of
the general masses. This is why scarce national resources must
be utilized at their optimum.
Estelar
PRODUCTION PERFORMANCE
Production is the end result of planning and decision
making. It is the production upon which progress of a business
enterprise depends. So there is need to resort to production
planning and control. The amount of sales depends upon
market price of the goods and services which is affected by
exogenous factors. But the production volume is affected by
endogenous factors. The volume and quality of goods and
services are the true indicators of the performance of a business
enterprise. The following table shows production in tonnes of
the paper mills of Kumaun Division of Uttaranchal :Estelar

Table 2.3PRODUCTION BY THE PAPER MILLS OF KUMAUN
(In MT.)Name of Paper Mill A n n u a l
ProductionM/s Cheema Duplex Ltd. 48,600
M/s Banwari Paper Mills Ltd. 12,600
M/s Multiwal Pulp and Board Mills Ltd. 39,600M/s Siddhartha Papers Ltd. 23,400M/s Siddheswari Paper Udyog Ltd. 27,000M/s Shri Shyam Pulp and Board Ltd. 48,600
M/s Naini Papers Ltd. 27,000
M/s Goraya Straw and Card Board Mills (Pvt.) Ltd. 19,800M/s Vishwakarma Paper and Boards Ltd. 19,800M/s Multiwal Duplex Board Pvt. Ltd. 23,400M/s Naini Tissues Ltd. 39,600
M/s Shri Ram Straw Board 23,400
M/s Cheema Paper Mill Ltd. 19,800M/s Manorama Paper Mills Ltd. 12,600M/s Prakash Straw Board Mills Ltd. 16,200M/s Khatima Fibres Ltd. 48,600
M/s Century Pulp & Papers Ltd. 99,000
Total 5,49,000
Source : Based on personal survey
By the analysis of the above table it is clear that the total
production of all types of boards papers and rayon grade pulp
accounts for 5,49,000 MT. The share of M/s Century Pulp &
Estelar

Papers Ltd. Lalkuan stands to be 18.03 percent. Actual
production is nearly 60 percent higher than that of mentioned
by the paper mills in their records. During personal survey it
has been noticed that all the paper mills are working above
their licensed capacity. The big paper mills are allowed to be
operated only in two shifts but they are operating in three shifts
i.e. 24 hours. There is nexus between the tax authorities and
the mill owners who grease their palm and cause huge loss to
public exchequer. The different departments collecting different
types of taxes are causing loss to the Government in indirect
way. According to our estimate only 60 percent of the
production is on records. In this way the seriousness of tax
evasion may be understood. (Based on the facts disclosed by
senior executives of some paper mills.)
SALES PERFORMANCE
The profitability of a business enterprise depends upon the
volume of sales. Volume of sales itself depends upon the selling
price which is determined by market forces. The difference of
selling price and the total cost is the amount of profit. Hence,
the amount of profit is directly related to volume of sales. Higher
is the volume of sales, higher is the amount of profit. The
following table reveals sales performance of the paper mills of
Kumaun Division of Uttaranchal:-
Estelar
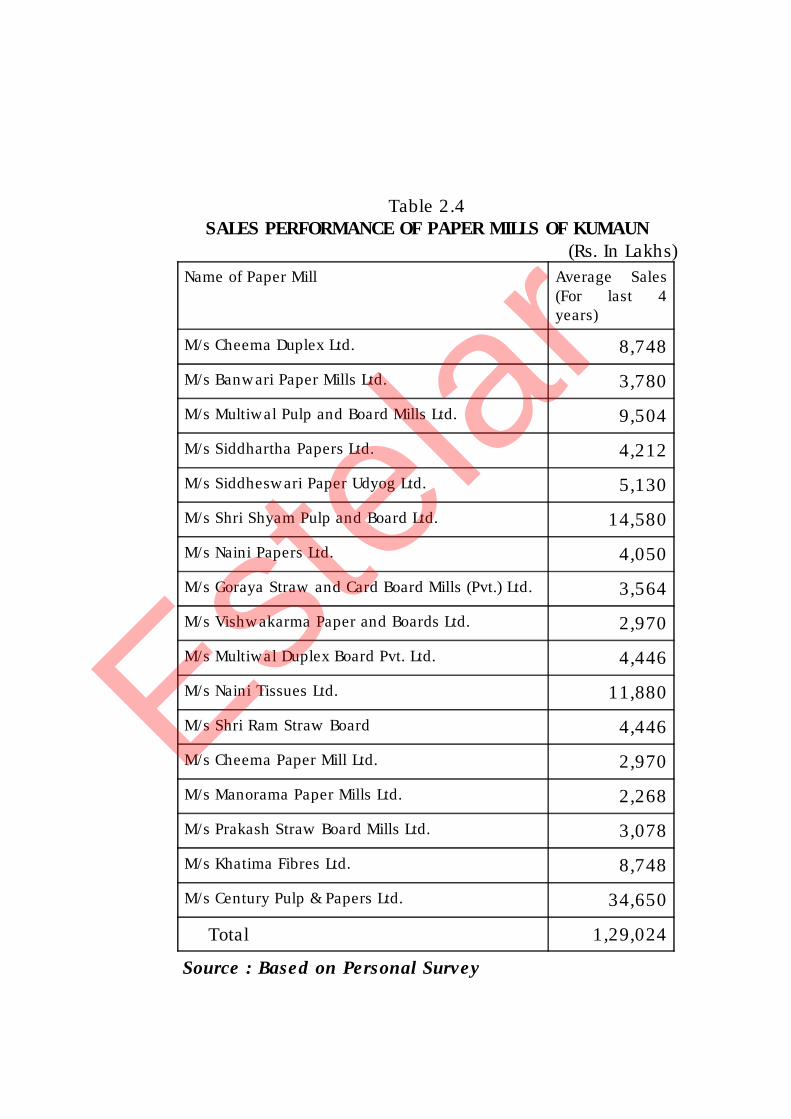
Table 2.4SALES PERFORMANCE OF PAPER MILLS OF KUMAUN
(Rs. In Lakhs)Name of Paper Mill Average Sales
(For last 4years)
M/s Cheema Duplex Ltd. 8,748
M/s Banwari Paper Mills Ltd. 3,780
M/s Multiwal Pulp and Board Mills Ltd. 9,504
M/s Siddhartha Papers Ltd. 4,212
M/s Siddheswari Paper Udyog Ltd. 5,130
M/s Shri Shyam Pulp and Board Ltd. 14,580
M/s Naini Papers Ltd. 4,050
M/s Goraya Straw and Card Board Mills (Pvt.) Ltd. 3,564
M/s Vishwakarma Paper and Boards Ltd. 2,970
M/s Multiwal Duplex Board Pvt. Ltd. 4,446
M/s Naini Tissues Ltd. 11,880
M/s Shri Ram Straw Board 4,446
M/s Cheema Paper Mill Ltd. 2,970
M/s Manorama Paper Mills Ltd. 2,268
M/s Prakash Straw Board Mills Ltd. 3,078
M/s Khatima Fibres Ltd. 8,748
M/s Century Pulp & Papers Ltd. 34,650
Total 1,29,024
Source : Based on Personal Survey
Estelar
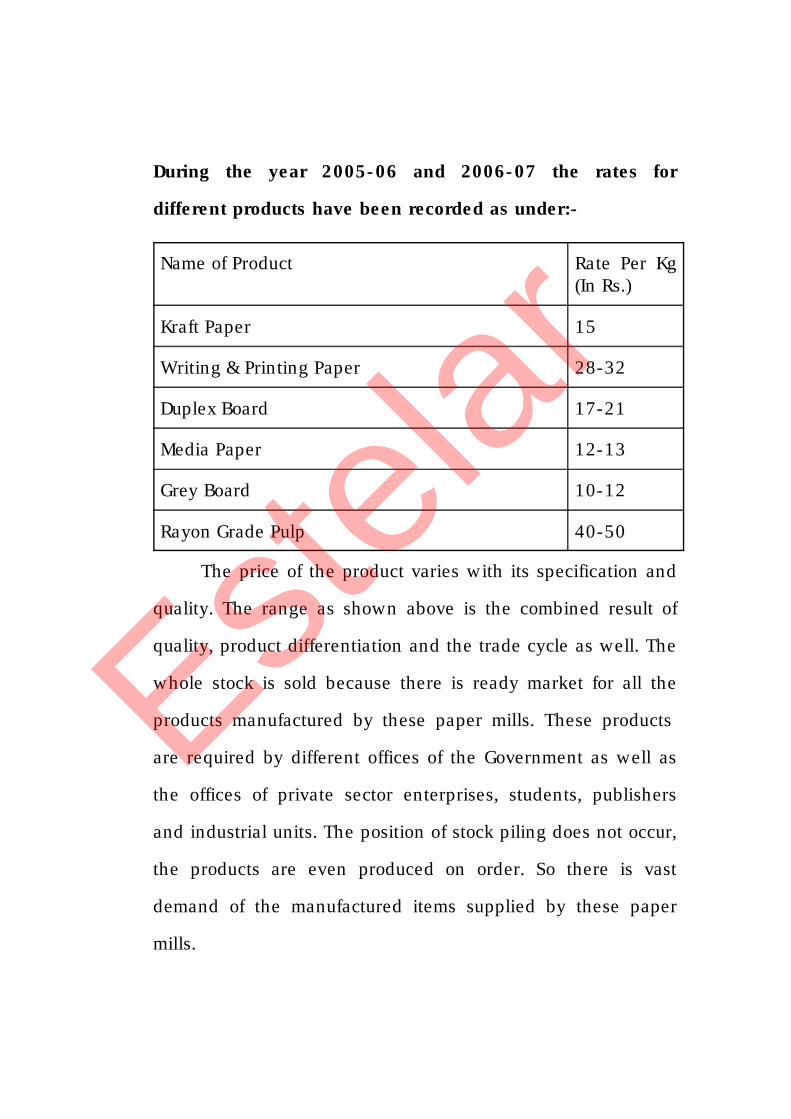
During the year 2005-06 and 2006-07 the rates for
different products have been recorded as under:-
Name of Product Rate Per Kg(In Rs.)
Kraft Paper 15
Writing & Printing Paper 28-32
Duplex Board 17-21
Media Paper 12-13
Grey Board 10-12
Rayon Grade Pulp 40-50
The price of the product varies with its specification and
quality. The range as shown above is the combined result of
quality, product differentiation and the trade cycle as well. The
whole stock is sold because there is ready market for all the
products manufactured by these paper mills. These products
are required by different offices of the Government as well as
the offices of private sector enterprises, students, publishers
and industrial units. The position of stock piling does not occur,
the products are even produced on order. So there is vast
demand of the manufactured items supplied by these paper
mills.
Estelar

REPAYMENT OF BORROWED FUNDS
The paper mills of Kumaun Division of Uttaranchal have
been financed by UPFC, PICUP, State Bank of India. Punjab
National Bank and Bank of Baroda. On account of under
utilization of capacity uneconomic size of the plant, shortage of
raw materials, low equity base, higher transportation cost etc.,
these units have witnessed hard days. Consequently there has
been delay in the payment of instalments. About 75 percent of
the total capacity investment is from borrowed funds. Our
personal discussions and survey results reveal that 35 percent
of the total paper mills failed to repay their instalments in time.
Eventually, it may be concluded that the overall
performance of these paper mills has been poor barring some
positive symptoms. Hence, there is need of coordination among
different Government agencies directly/indirectly concerned
with the development of paper mills in this region.
Estelar

HYPOTHESIS NO. 1
"The volume of agricultural production in Kumaun Division
and production of paper mills are independent of each other."
To assess relationship between agricultural production
and production of paper mills, Karl Pearson's Coefficient of
correlation (r) has been calculated as under by Product Moment
Method:-
Year AgriculturalProduction
Index
x
Paper MillsProduction
Index
y
x2 y2 x.y
2002 100 100 10,000 10,000 10,000
2003 102 108 10,404 11,664 11,016
2004 104 117 10,816 13,689 12,168
2005 107 126 11,449 15,876 13,482
2006 110 136 12,100 18,496 14,960
N=5 Sx=523 SY=587 SX2= 54,769 SY2=69,725 SXY=61,626
Estelar
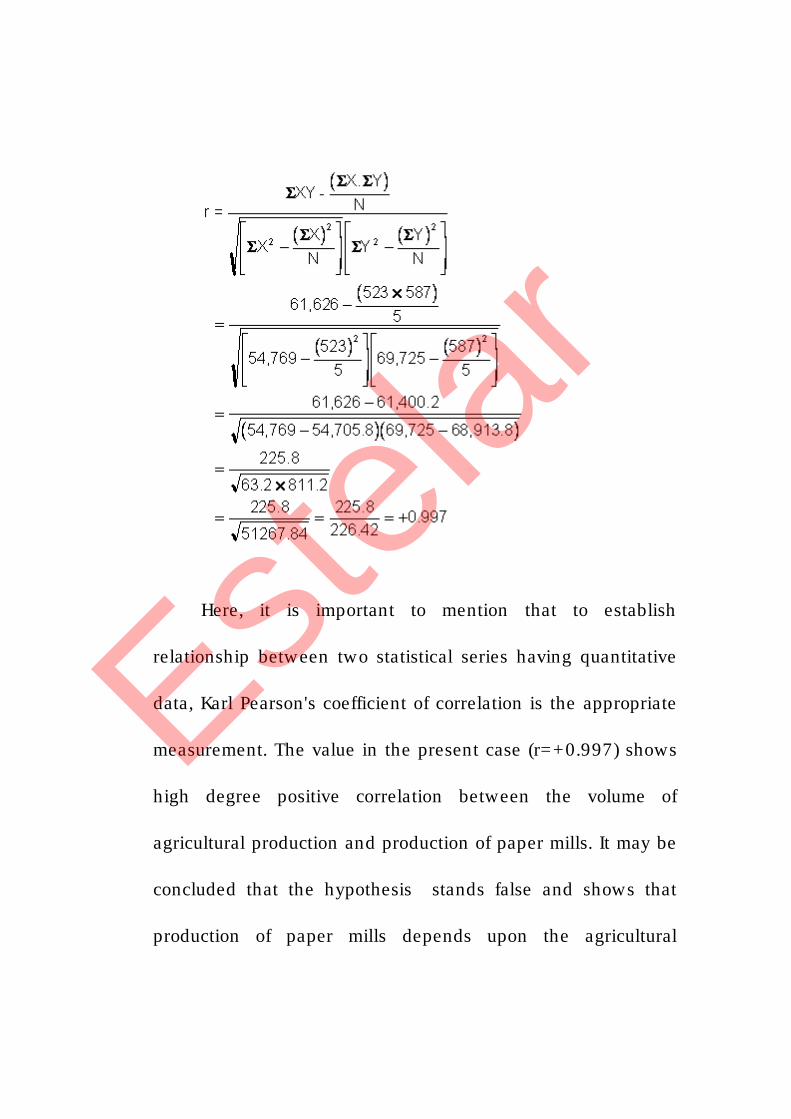
Here, it is important to mention that to establish
relationship between two statistical series having quantitative
data, Karl Pearson's coefficient of correlation is the appropriate
measurement. The value in the present case (r=+0.997) shows
high degree positive correlation between the volume of
agricultural production and production of paper mills. It may be
concluded that the hypothesis stands false and shows that
production of paper mills depends upon the agricultural
Estelar

production in the region being these agro-based industrial
units. This value of r does not mean that the whole raw
material requirements of these paper mills are met from locally
available resources. Huge quantity of raw material is imported
from nearby areas like U.P., Delhi and Haryana and even
imported from overseas countries.
In computing Karl Pearson's coefficient of correlation, the
volume of production has been converted into fixed base index
number so that both the statistical series (X and Y) may be
reduced to lowest figure resulting in easy calculation. Here, the
volume of all types of raw materials and finished products has
been combined together so that fixed base index number may
be calculated easily.
HYPOTHESIS NO 2
"The profitability of paper mills and the income of
workers are independent of each other."
Estelar

To establish relationship between profitability of paper
mills and the income of workers, rates of growth have been
taken as X and Y series. As the data are quantitative, Karl
Pearson's Coefficient of Correlation (r) is the appropriate
measurement calculated as under by Product Moment Method:-
Year Rate ofGrowth in
Profitability
x
Rate ofGrowth inWorker’sincome
y
x2 y2 x.y
2002 8 4 64 16 32
2003 10 5 100 25 50
2004 11 5 121 25 55
2005 12 6 144 36 72
2006 14 5 196 25 70
N=5 Sx=55 SY=25 SX2= 625 SY2=127 SXY=279
Estelar
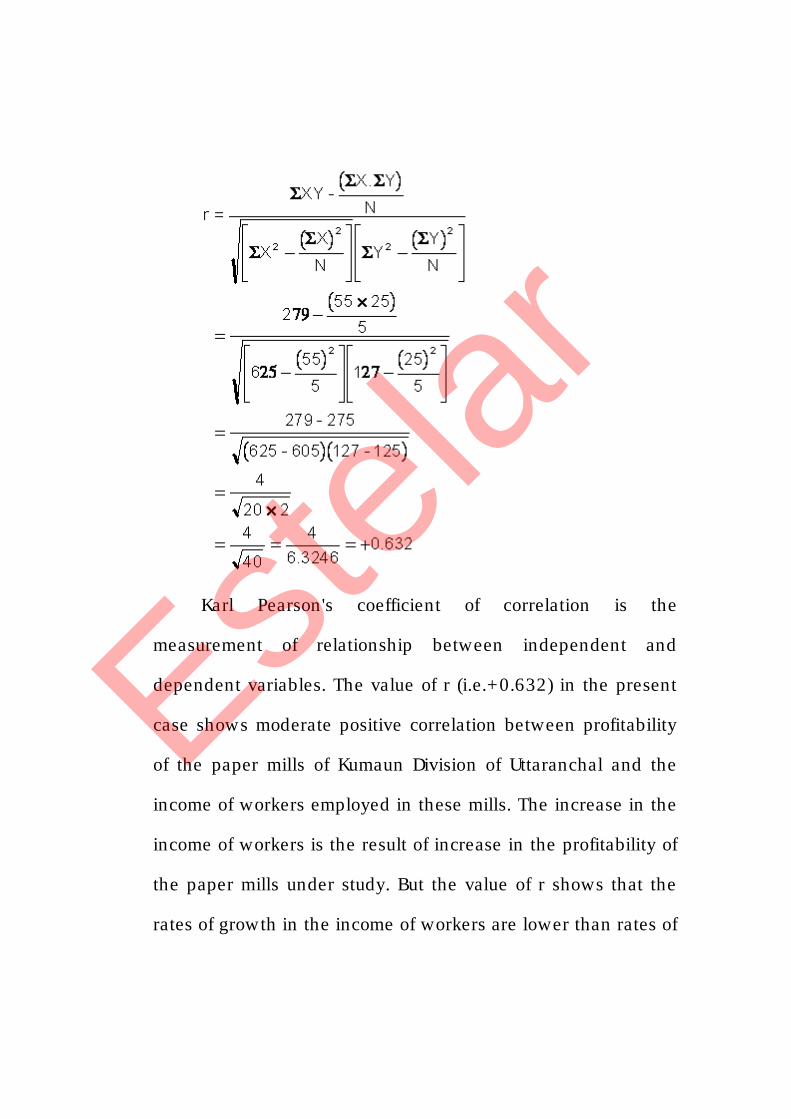
Karl Pearson's coefficient of correlation is the
measurement of relationship between independent and
dependent variables. The value of r (i.e.+0.632) in the present
case shows moderate positive correlation between profitability
of the paper mills of Kumaun Division of Uttaranchal and the
income of workers employed in these mills. The increase in the
income of workers is the result of increase in the profitability of
the paper mills under study. But the value of r shows that the
rates of growth in the income of workers are lower than rates of
Estelar

growth in the profitability of the paper mills. However, it may
be put that the mill owners get increase the wages or salaries
of their workers only if they earn profits. But the due proportion
of profits is not transferred to the workers as the bargaining
power of the workers is weak and may not force the mill
owners to increase the wages or salaries.
HYPOTHESIS NO 3
"The establishment of paper mills and the income of
farmers supplying raw materials in direct or indirect manner
are independent of each other."
Here, 100 farmers were selected randomly who supply
raw materials to paper mills and the other 100 farmers were
also selected at random who supply their raw materials to the
persons other than paper mills. The data available are:-
Category
Effect of Income
Increase Decrease No Effect
Suppliers 82 6 12
Non-Suppliers 64 20 16
Estelar

Frequency Observed Table (fo)
Category
(B)
Effect on Income (A)
Increase
A1
Decrease
A2
No Effect
A3
Total
Suppliers (B1) 82 6 12 100(B1)
Non-Suppliers (B2) 64 20 16100
(B2)
Total 146 (A1) 261 (A2) 25 (A3) 200 N
Frequency Expected Table (fe)
Category
(B)
Effect on Income (A)
Increase A1Decrease
A2
No Effect
A3
Total
Suppliers (B1) 100(B1)
Non-Suppliers
(B2)10 (B2)
Total 146 (A1) 26 (A2) 28 (A3) 200 N
Estelar

Computation of Chi-square (c2)
Combination O E (O-E) (O -E )
2
(O-E)2 ÷ E
A1B1 82 73 +9 81 1.11
A1B2 64 73 -9 81 1.11
A2B1 6 13 -7 49 3.77
A2B2 20 13 +7 49 3.77
A3B1 12 14 -2 4 0.29
A3B2 16 14 +2 4 0.29
Total O=200 E=200 c 2=10.34
df=n-1=6-1=5
The table value of c 2 for 5 d.f. at 5 % significance level is
11.07 while the computed value of c 2 is 10.34 which is less
than table value. Hence our hypothesis is true. It may be
concluded that the income of the farmers supplying raw
materials to the paper mills has nothing to do with the
establishment of these paper mills. The farmers supply wheat
straw to the cattle rearers too and get handsome price of the
same. Similarly rice straw also has many other uses.
afFA
Estelar