2. catching-up, growth and convergence of the new...
TRANSCRIPT

2. CATCHING-UP, GROWTH AND CONVERGENCE OF THE NEW MEMBER STATES
Summary This chapter attempts to identify the main policy levers – including EU cohesion policy - which could sustain a process of catching-up in the new Member States in order to achieve the EU Treaty objective of economic and social cohesion. The ten economies that acceded to the EU on 1 May 2004 all have income levels below the EU average - some significantly lower - and there are even greater income disparities at the sub-national level, with purchasing power less than half the EU-25 average in many regions of the new Member States.
Policy development must be set in the context of the EU’s past experience, which has shown, firstly, that income convergence is not necessarily a rapid, continuous or automatic process. Secondly, convergence has been faster at the regional than at the country level – partly reflecting the fact that disparities have been higher within than between Member States. Thirdly, regional specialisation and concentration have not changed significantly. Lastly, in the early stages of catching-up, growth tends to strengthen first in agglomerations: thus regional income inequalities within countries may initially increase as the national growth rate accelerates.
Looking at the situation to date in the new Member States, data on sources of growth between 1996 and 2005 show that economic convergence has been driven by investment and total factor productivity (TFP), while under-utilisation of labour has acted as a brake. A scenario for 2006 to 2010, based on a broad continuation of recent experience, shows that the contributions of capital and TFP may be expected to moderate somewhat in the future, while labour is likely to make a positive, though limited, contribution to growth. However, these projected growth rates are below 5 per cent, except for the Baltic countries, representing only limited progress in catching up to the EU average.
Existing trends reveal a number of major policy challenges. One important concern is that employment rates are fairly low in most of the new Member States - particularly among older cohorts of the population. It will therefore be especially important to review tax-benefit systems in order to provide incentives to create and take up jobs, and to extend working lives. Labour markets remain relatively inflexible owing to insufficient wage differentiation, the impact of tax-benefit systems, and low regional labour mobility.
Investment has been an important source of growth in the new Member States. Investment-to-GDP ratios are higher than in the EU-15, although production is still less capital-intensive. Given the early liberalisation of capital movements, foreign direct investment has been a major source of current account financing, closing the gap between domestic savings and investment. The heavily foreign-owned banking sector has been the main channel of financial intermediation. An important challenge for the future is to progressively mobilise higher domestic savings through channels such as pension funds and stock markets in order to promote faster, more broad-based growth.
Innovation and knowledge being important triggers for technical progress, it is worth noting that educational attainment levels in the new Member States do not differ much from those in the EU-15. Trade and foreign direct investment have been important for the cross-border transfer of knowledge in management and technology, but innovation has not yet been a central determinant of productivity growth in the new Member States. Activity and employment in R&D and innovation tend to be much lower than in the EU-15, which can best be explained by a different pattern of specialisation. The case for higher expenditure on R&D activities needs to be evaluated critically, given this specialisation, to ensure that it does not divert resources from other uses with higher economic returns.
The new Member States have made great advances in trade liberalisation since the early 1990s, and they have impressively increased trade with the EU, in particular under the Europe Agreements. This expansion of trade no doubt contributed significantly to their growth performance over the past decade. Membership brings some further trade liberalisation in sensitive sectors (agriculture, services) and reduction of non-tariff barriers – as well as a possible further reduction in transport costs as a result of lower waiting times at borders and improvements in infrastructure. Less exchange rate volatility in the case of ERM II participation and the adoption of the euro could reduce costs even further and trigger additional trade and growth.
The new Member States have also made good progress in establishing a stable macroeconomic framework, though those aiming for rapid progress towards euro-area membership will need to entrench this further, as inflation remains somewhat high and variable in some cases. ERM II can provide a framework within which to enhance policy credibility, though the alternative of keeping greater exchange rate flexibility offers more latitude for variations in inflation associated with the challenges of transformation and catching-up – thus helping to avoid a loss of external competitiveness. The majority of the new Member States still have budgetary deficits that are much higher than the 3 per cent benchmark for euro-area membership, although public debt levels are mostly below 60 per cent of GDP; however, fiscal consolidation remains a considerable challenge in the light of the need to build up and modernise infrastructure, reorient public spending, and cushion the costs of ongoing restructuring. To safeguard external and financial stability, attention needs to be paid to the interaction of monetary, prudential and fiscal policy regimes and the ways in which these may influence risk behaviour in the private sector. In particular, as the private

sector enters a phase of strong expansion, the design of fiscal policy can play an important supporting role in ensuring that imbalances are limited and that financial market confidence is maintained.
Studies increasingly stress the quality of institutions as an important factor in convergence. Here, despite impressive progress in recent years, the new Member States still have considerable gaps to make up - particularly with regard to efficiency in public administration and the judiciary. Preparation for EU accession provided an external anchor for progress in this area, helping to catalyse political support for change. With the “carrot” of EU membership no longer available, there is a need for reflection on how mechanisms at the EU level might play a stronger role in providing further support for this process.
EU cohesion policy is the final subject considered in this chapter. Despite limited financial resources, this policy could have a substantial impact on catching-up - but only if a number of conditions are met: stronger spatial concentration, improved thematic concentration, and implementation approaches that better safeguard cohesion goals. Spatial concentration means focusing Structural Funds on those regions and Member States most in need - while ensuring that this selection process works with, rather than against, market forces. Thematic concentration means choosing, in each case, an effective investment mix - based on a sound analysis of existing infrastructure endowment, human resource requirements, and limits on aid to the productive sector. Effective implementation requires that the management of Structural Funds be further simplified, and that the new Member States complete the building of necessary administrative capacity. In short, the contribution of EU cohesion policy to real convergence will depend above all on the commitment of policy-makers in Member States to coherent national and regional policies – ensuring that the environment in which Structural Funds are utilised is characterised by macroeconomic stability, continuing structural reforms, and good governance.
In view of the still limited knowledge of economists about the relative importance and detailed interaction of each of the main policy levers, policy can best foster stronger and more broad-based growth through a comprehensive approach addressing all the strongest drivers of economic growth – trade, macroeconomic stability and institutional quality - as well as making efficient use of EU cohesion policy.

TABLE OF CONTENTS
1. INTRODUCTION ................................................................................................................................................5 2. CATCHING-UP IN THE EU: WHERE DO WE STAND AND WHAT DO WE KNOW? ...................................................6
2.1 The lessons from the past ....................................................................................................................................... 6 2.2 Recent trends in convergence of the new Member States ....................................................................................... 9 2.3 Spatial dimensions of convergence ....................................................................................................................... 11 2.4 Summary .............................................................................................................................................................. 15
3. HOW TO ACCELERATE CATCH-UP GROWTH IN THE NEW MEMBER STATES? ...................................................16 3.1 The accumulation and diffusion of production factors and knowledge ................................................................ 17 3.2 Other determinants of economic growth ............................................................................................................... 24
4. WHAT CAN BE THE CONTRIBUTION FROM EU COHESION POLICY? .................................................................35 4.1 Evidence of structural funds impact ..................................................................................................................... 35 4.2 Conditions for maximising the impact .................................................................................................................. 38 4.3 Policy challenges .................................................................................................................................................. 46
REFERENCES ............................................................................................................................................................48 ANNEX I: METHODOLOGICAL CONCEPTS OF CONVERGENCE ..................................................................................55 ANNEX II: SEMI-PARAMETRIC TECHNIQUES ...........................................................................................................56

5
CATCHING UP, GROWTH AND CONVERGENCE OF THE NEW MEMBER STATES
1. Introduction
Income levels in a majority of the ten new Member States, which acceded to the EU on 1 May 2004, are significantly below the average of the former EU-15. Average GDP per capita in the enlarged EU is almost 10 per cent lower than previously, and inequalities are substantially wider. This makes the objective of achieving greater economic cohesion and convergence even more pressing than before. Graph 1, displaying the level of GDP per capita in euro and in Purchasing Power Standards (PPS) in the 25 Member States in 2004, shows the considerable disparities between old and new Member States, but also among the new Member States.1 The ranking of Cyprus, Slovenia and Malta is close to that of the “old” cohesion countries (Spain, Greece and Portugal). The Czech Republic and Hungary have a notably higher GDP per head than Slovakia, Poland and the three Baltic countries. Disparities at sub-national, regional level are even larger. GDP per head in PPS in many regions of the new Member States is less than half of the EU-25 average and the poorest ones have even less than a third of the EU-25 average.
Given that economic and social cohesion is one of the objectives specified in the EU Treaty, this chapter attempts to identify the main policy levers for a sustained process of catching-up in the new Member States, based on past experience of real convergence in the EU as well as on evidence from the broader economic literature. Relevant developments in both the EU-15 and the EU-25 are described in Section 2. Section 3 reviews potential determinants of catching-up, and analyses the empirical evidence in the EU as well as
1 Due to higher costs of living, income expressed in euro is higher than that expressed in PPS in most Member States above EU-25 average; the opposite holds for those below average.
the policy challenges for the ten new Member States. Apart from the standard determinants of growth – labour, capital and technical progress – other driving forces of growth such as trade and geography, macroeconomic stability and institutional quality are reviewed. Section 4 discusses the potential contribution
Graph 1: GDP per head in EU Member States, 2003
0 10 20 30 40 50 60
LVPLLTEECYSKHUCZMTPTSI
ELES
EU-25IT
DEEUR-15
FIFRSEBEUKNLATDKIE
LU
1000
EURPPS
Source: Commission services.

6
of EU cohesion policy, the goal of which is to enhance growth and employment in lagging Member States and regions.
2. Catching-up in the EU: Where do we stand and what do we know?
This section provides an overview of recent trends in catching-up and convergence among countries in the EU, at both national and regional levels. It focuses particularly on the EU cohesion countries - which include Spain, Portugal and Greece, as well as the 10 new Member States.2 In addition, some relevant lessons are drawn from wider experience in the EU. The analysis is based on a qualitative assessment of key trends, as well as on econometric evidence; and the experience of the new Member States during the past decade is also specifically reviewed.
2.1 The lessons from the past Experience suggests that convergence and catching-up are not automatic outcomes of accession to the EU. Graph 2 provides evidence for the former four cohesion countries. It displays their level of GDP per capita, measured in terms of Purchasing Power Standards (PPS), during the period 1960-2003.3
Ireland, now often cited as a success story, is a particularly interesting case. In 1960, it had a level of GDP per head of about 67 per cent of EU-15 average. Whereas notably during the 1960s and early 1970s the other three economies experienced rapid expansion, the Irish relative position in terms of per capita GDP per headmore or less stagnated until the mid-1980s when the Irish economy truly took off. Since then the country went on to become, by 2003, one of the richest Member States with a GDP per capita nearly twice as high as Portugal.
2 Since 1st of January 2004 Ireland is no longer eligible to the
Cohesion Fund given the level of its Gross National Income (GNI) per head compared to the EU average and therefore no longer included in the group of so-called “cohesion countries”.
3 Given that convergence refers to a long-term process, a sufficiently long period (1960-2003) is considered here while acknowledging the fact that this does not necessarily correspond to the accession dates of the cohesion countries, i.e. 1973 for Ireland, 1981 in the case of Greece and Portugal and Spain joined in 1986. Also, it should be noted that intertemporal comparison of PPS figures is limited for methodological reasons. These inconsistencies have been partly corrected in the data used here; see Eurostat (2002).
This performance in Ireland went hand-in-hand with the implementation of stability-oriented macroeconomic policies, and a new approach to industrial relations - which was also initiated in the mid-1980s. However, Ireland’s success cannot be attributed to these factors alone, but was also the result of a variety of mutually reinforcing policies, some of which had been pursued for more than 40 years under a pro-active strategy to foster economic development. Worth noting are the continuity and predictability over this long period of the policy approaches to attracting FDI and promoting clusters of export-led manufacturing and services activities. Highly important, too, were the investments made in education from the mid-1960s, which translated into labour productivity gains in the late 1980s and 1990s. The evolution of Ireland illustrates that convergence is a process having deep roots in a range of policy areas which may take time to bear fruit.
Graph 2: Evolution of GDP per head in PPS to the EU-15 average (EU-15 = 100)
40
60
80
100
120
140
1960 1964 1968 1972 1976 1980 1984 1988 1992 1996 2000
GreeceSpainIrelandPortugal
Source: Commission services.
Furthermore, the experience of these countries suggests that catching-up does not necessarily occur at a steady pace. Table 1 below provides additional evidence by reporting the 10-year average annual rate of catch-up for these countries, between 1960 and 2003. This indicator measures the average percentage change in the gap between each country’s GDP per capita and the EU-15 average.

7
Table 1: Average catch-up rate for Spain, Greece, Portugal and Ireland, 1960-2003 (%)1
Period Spain Greece Portugal Ireland 1960-1970
-4.40 -5.94 -2.23 0.53
1971-1980
0.55 -2.34 -1.05 -1.20
1981-1990
-1.41 6.13 -1.49 -2.85
1990-2003
-2.84 -1.14 -0.40 -19.752
1 A negative catch-up rate indicates that the gap between a country and the EU average is falling while a positive rate means that this
gap is widening. Catch-up rate = 100 * ( )( )*
*
11 −− −−∆
tit
tit
yyyy where yit
is the level of index of GDP per head in PPS terms for country i at time t and yt* is the average value of yt for the EU-15 and ∆ denotes absolute variation between t and t-1 with yt* being the weighted average for the EU-15.
2 Average annual catch-up rate up to 1996, given that, after this date, Irish GDP per head became higher than the EU average, see also footnote 4.
The first observation that emerges is that catching-up has been rather uneven across different periods. Overall, the 1960s were years of rapid catch-up for all these countries except Ireland. For other periods, however, the evidence is more mixed across these countries. In particular, if one looks more closely at the decade during which these three countries acceded to the EU, i.e. the 1980s, it appears that catch-up was rather slow for Portugal and Spain - with the gap between these countries’ GDP per head and the EU average level falling at an average rate of only some 1 per cent per year. The evolution was even less favourable for Greece, where there was a rather sizable in terms of GDP per head gap in the 1980s. Over the most recent period 1990 to 2003, Spain, Greece and Ireland experienced a narrowing of GDP per head gaps but at markedly differing speeds.4
While these results provide a first impression of past EU experience, a more rigorous analysis is needed to determine whether, over the long run, convergence has indeed been taking place and whether it has been significant. Several different approaches are available to assess this formally, and they are followed in turn below. The findings are quite complex and might even seem inconsistent, but on careful inspection they shed rather valuable light on the experience of convergence
4 Note that, strictly, the catch-up rate and the convergence
rate are not identical concepts. Both processes are characterized by a negative sign. But their evolution need not be the same. Catch-up is concerned with the distance left to travel, and convergence addresses the pace of advance. Thus, for any given rate of growth that shrinks the gap, the rate of catch-up will be higher for narrow residual gaps, while the convergence rate will be correspondingly lower.
Table 2: Test of β convergence for the EU Country-level results (15 countries, period: 1960-2003)
OLS Fixed-effects 5-year 10-year 5-year 10-year -0.021 -0.023 -0.024 -0.027 (0.002) (0.003) (0.003) (0.003)
Region-level results (187 regions, period: 1980-1996)
1-year 5-year 1-year 5-year -0.04 -0.043 -0.062 -0.046
(0.002) (0.002) (0.002) (0.002)
Note: Standard errors reported in parentheses.
among and within EU Member States – an experience which emerges as highly relevant, but potentially worrying, for the new Member States.
First, a common tool used in the literature is the estimation of so-called β-convergence: this provides indications how long, on average, convergence may take (see Annex I for a description of this methodology). Table 2 presents results of an estimation (of equation (i) described in Annex I) on β-convergence for the EU-15 countries for the period 1960 to 2003, and also for regions within those countries for the period 1980 to 1996, using the NUTS2 desegregation level.5 The average annual convergence rate is estimated using 5-year and 10-year intervals, respectively.
The evidence in Table 2, based on least square estimators (OLS), is that convergence has been taking place rather steadily across the EU. The rate of convergence varies between 2.1 per cent and 2.3 per cent in absolute terms, when using country-level data. This is rather similar to the β-convergence found by a number of authors in the economic literature.6 Results at the regional level show a β convergence rate that is markedly higher: between 4.0 per cent and 4.3 per cent.7 The implied time to halve per capita GDP gaps vis-à-vis the EU average varies between 30 and 33 years at the country level and between 16 and 17 years at the region level.
5 The country-level data is taken from Ameco (ECFIN)
database while the region-level data is from the Regio database (Eurostat). Note also that the regional data is available under two different classifications (ESA79 and ESA95) and cover different periods (1979-1996 under ESA79 and 1995-2001 under ESA95). Data concerning the year 1979 are rather incomplete, so the period 1980-1996 is considered instead when using the ESA79 data.
6 See Magrini (2004) for a review. 7 Note that the higher convergence rate found when using
region-level data may be partly due to the fact that the time period is different from the one used at country-level and also to the fact that income disparities at regional level in the EU are wider than the ones at country-level.

8
These results provide a first indication that convergence is indeed taking place, and how long it may take to run its course. Although it appears faster among regions than among countries, these results must be treated with caution for at least two reasons. First, as discussed above, experience shows that the pace of convergence may vary greatly across countries and time periods. Second, as the literature on β-convergence points out, least square estimators are likely to be biased since they do not control for time-invariant features that are country- or region-specific. In its simple OLS form, one implicitly assumes that all countries converge to the same steady state. In order to relax this hypothesis, a “fixed-effect panel estimator” can be used instead to take account of unidentified country-specific or region-specific features.8 Columns 3 and 4 of Table 2 provide such estimators for the EU countries and regions. The fixed-effect estimators obtained are only slightly larger than the OLS ones when considering country-level results, but when using region-level data the difference appears to be more substantial. On this approach, the estimated convergence rate oscillates between 2.4 per cent and 2.7 per cent at the country-level and 4.6 per cent and 6.2 per cent at the regional level.9 Again, convergence is present, and appears to be generally stronger among regions.
As mentioned earlier, evidence of β-convergence among countries, and across regions EU-wide, does not necessarily mean that disparities in GDP per head within the EU are falling, see Annex I. In order to get a more complete picture of the convergence process it is necessary to analyse the evolution of GDP per head disparities as σ-convergence which measures the change
8 See Islam (1995). Other authors have criticized the regression approach to convergence on the ground that this method provides no information on the dynamics of the entire cross-sectional distribution of regional income and have proposed alternative methods based on non-parametric statistical techniques which allow considering the existence of “convergence clubs” where countries and regions converge to different steady states; see for instance, Quah (1996) and 1997) and Durlauf/Quah (2002) for a review.
9 Note that the fact that fixed-effects estimators of β-convergence display larger estimates in absolute terms is a well-known fact in the literature suggesting that the bias of OLS estimators is downward. However, these estimators are more sensitive to the sample of countries or regions considered as well as to the time-length of each time-series; see Tondl (2001). For instance, the estimates found here are rather lower than the ones generally found in convergence studies. Islam (1995) finds a rate of 9 per cent for a sample of OECD countries, Canova/Marcet (1995) find a rate of 23 per cent for EU regions and Tondl (1997) a rate of 20 per cent for EU regions.
Table 3: Test of σ- convergence in the EU, 1982-1996
Year 1982 1988 1996 % annual change 82-88
% annual change 88-96-
Country-level results Gini 0.1337 0.1284 0.0977 -0.66 -2.99 Theil 0.0320 0.0291 0.0174 -1.51 -5.03 coef. var*
0.0303 0.0276 0.0167 -1.49 -4.94
Region-level results Gini 0.2127 0.2115 0.2037 -0.09 -0.46 Theil 0.0720 0.0704 0.0652 -0.37 -0.92 coef. var*
0.0703 0.0677 0.0656 -0.62 -0.39
Note: Concerns regions NUTS2 of Belgium, Germany, Spain, France, Italy, Netherlands, Greece, Portugal. * Half of the square of the coefficient of variation. in the variation around the mean GDP per head. Table 3 provides evidence using three indicators generally used in the convergence literature: the Gini index, the Theil index and the square of the coefficient of variation.10
The results depicted in Table 3 show, rather unsurprisingly, that inequalities are larger between EU regions than between countries. More importantly, these results show that inequalities have tended to decrease over the period considered, i.e. from 1982 to 1996, with an accentuated fall from 1988 onward. Interestingly, while the same result holds for both country-level and region-level data, the average annual fall in inequalities seems to be higher for countries than for regions, as shown by the last two columns of Table 3.
This suggests that, while some convergence took place, it was more pronounced at the country level than at the regional level. Although such evidence seems to be at odds with the above β-convergence analysis, this needs not to be the case. The estimated β-convergence results at the regional level show that the average convergence rate was well above 2 per cent: individual regions thus had very different experiences, explaining in turn the results obtained for the σ-convergence.11 A number of economists have also suggested that region-level and country-level convergence have not followed the same rhythm in the EU over the past decades. In particular, Esteban (1999) and Duro (2001) show that, while GDP per head dispersion between EU countries has decreased
10 Not all EU-15 countries are considered in this table since
regional data were not available for all years and all countries. The results thus only concern Belgium, Germany, Spain, France, Italy, Netherlands, Greece and Portugal. Also, for the same reason, only the years 1982, 1988 and 1996 are considered.
11 See Chatterji (1992).

9
Table 4: Decomposition of σ- convergence: within
vs. between countries components, 1982-96 1982 1988 1996 %
annual change 82-88
% annual change 88-96
Theil index Between country
0.0494 0.0464 0.0396 -1.01 -1.86
Within country
0.0225 0.0240 0.0257 1.09 0.89
Coefficient of variation Between country
0.0450 0.0410 0.0372 -1.45 -1.18
Within country
0.0253 0.0266 0.0284 0.86 0.82
Note: Concerns regions NUTS2 of Belgium, Germany, Spain, France, Italy, Netherlands, Greece and Portugal. during the 1980s and the 1990s, inequalities between regions within the same country have tended to increase.12 In order to see this, the Theil index as well as the coefficient of variation for EU regions can be decomposed into within and between countries’ variations.13 The results of such a decomposition are reported in Table 4.
According to these results, the slight decrease in regional inequalities observed in the EU between 1982 and 1996 masks in fact two opposite shifts: inequalities between countries have tended to decrease, while inequalities within countries have tended to increase. The overall picture for the EU noted above – one in which there is a general fall in regional inequalities – thus reflects the dominance of favourable changes across countries over adverse changes within countries.
A number of authors have offered potential explanations for this phenomenon. The main one put forward in the literature is that economic integration, which advanced quite strongly during the period considered here, may benefit mainly a limited number of regions, at least initially. These would include, notably, the most dynamic and innovative regions in each country – those that are also best placed to benefit from potential externalities within the EU economy as a whole.14 The resulting pattern would be that convergence increases at the country level, but that it is in practice driven mainly by a few regions. Within countries, by contrast, levels of GDP per head could well tend to diverge. (Section 2.3 will consider these issues in more detail.) Such a conclusion would be of clear relevance to the new Member States, where GDP per head disparities within countries typically are at present more marked than in
12 Duro’s (2001) result is reported by Puga (2002). 13 For the description of such decomposition, see Annex I. 14 See Giannetti (2002).
the former EU-15. It may be that – as convergence proceeds at the country level – these internal disparities could become yet wider, at least on a temporary basis.
2.2 Recent trends in convergence of the new Member States
Analysis of convergence developments in the new Member States is constrained by the fact that the time series for GDP per capita are available only for a short time span - in general, since the beginning of the 1990s.15 This poses a major problem for estimating β-convergence, for example, since this requires time series over a much longer period. The consequence is that no proper econometric tests can be carried out. Nonetheless, apparent patterns in the available data do suggest some interesting insights. Graph 3 displays the relative level of per capita GDP for Greece, Portugal, Spain and the 10 new Member States, individually, compared to the EU-25 average for the years 1991, 1997 and 2003. The figure also shows how the weighted average of GDP per capita for these respective country groups – the three existing cohesion countries and the new Member States evolved.16 On average, the relative level of GDP per head of both groups rises over the period. In 1991 the level of GDP per head of the three cohesion countries amounted to 84.2 per cent of the EU-25 average, while by 2003 it had risen to 90.3 per cent. For the group of new Member States, the increase is even more pronounced in relative terms - advancing from 42.3 per cent to 53.3 per cent of the EU-25 average.
Graph 3: Evolution of GDP per capita in Greece, Portugal, Spain and the new Member States, GDP per capita in PPS
1991-2003
CY
CZ
EE
HU
LT
LT
LV
MT
PL
PLSK
SK
ES + PT + EL
New Member States
CY
CY
CZ CZ
EEEE
ES ESES
ELEL
EL
HU
HU
LT
LV
LV
MT MT
PL
PTPT PT
SK
SLSL
SL
20
40
60
80
100
1991 1993 1995 1997 1999 2001 2003
EUR-
25 G
DP pe
r cap
ita =
100
Source: Commission services.
15 Even for that period, data are only fully comparable
between 1995 and 2003 because a revision of purchasing power standards (PPS) before 1995 has not yet been made.
16 Total population is used as weight.

10
Table 5: Average annual % catch-up rate for the new Member States, 1991-2003
1991-94
1995-98
1999-2003 1991-2003
new MS 1.84 -1.74 -2.07 -1.01 Cyprus -6.34 0.57 -2.87 -2.59 Czech Rep. 1.04 0.71 -1.29 -0.04 Estonia 0.62 -2.44 -2.48 -1.90 Hungary 0.88 -0.86 -2.73 -1.21 Lithuania 16.00 -2.56 -2.51 2.10 Latvia 14.84 -1.21 -2.88 2.11 Malta -5.18 -3.36 0.76 -2.10 Poland -1.53 -2.55 -1.05 -1.67 Slovakia -2.33 -2.08 -1.29 -1.81 Slovenia 0.36 -3.64 -4.38 -2.95 ES+EL+PT 3.37 -2.82 -2.98 -1.34 Spain 3.33 -6.12 -6.20 -3.79 Greece 3.74 1.38 -5.34 -0.83 Portugal 3.04 -3.73 2.59 0.59
Source: Commission services.
The overall evolution seems rather favourable, however, with some differences both across time and countries. The years between 1991 and 1994 represent a period of relatively slow catching-up which can be explained by the economic downturn of the early 1990s and by the transition process in new Member States.17 Some differences also appear between countries which do not necessarily correspond to the distinction between cohesion countries and new Member States. For instance, countries such as Spain, Cyprus, Slovakia and Slovenia experienced steady catching-up, while other countries such as Lithuania and Latvia - and also, to some extent, the Czech Republic and Portugal - experienced uneven developments.
In order to shed more light on how fast countries actually caught up towards average EU income during the past decade, Table 5 reports the average annual catch-up rate of the new Member States together with Greece, Portugal and Spain, using the EU-25 average as benchmark.18 Overall, Spain has experienced the fastest catching-up, with an average annual rate of convergence of -4 per cent. Other countries such as Cyprus, Estonia, Malta, Slovenia, Poland and Slovakia have displayed average catch-up rates of around -2 per cent. Again, the timing differs across these economies. Countries such as
17 During the period 1992-1994 the average growth rate of the
new Member states was equal to -0.08 per cent, 0.76 per cent for Spain, 0.01 per cent for Portugal, 0.37 per cent for Greece and 1.58 per cent for the rest of the EU.
18 Note that the differences in the catch-up rates between the first column of Table 5 and the last row of Table 3 are due to the different reference group considered which is the EU-25 average in the first case and the EU-15 average in the second case.
Table 6: Test of σ- convergence in the EU, 1995-2001
Year 1995 1998 2001 % chg. 1995-1998*
% chg. 1998-2001*
Country-level results Gini 0.177 0.165 0.160 -1.54 -0.95 Theil 0.055 0.050 0.047 -3.08 -1.96 coef. var
0.050 0.045 0.043 -2.80 -1.92
Region-level results Gini 0.284 0.259 0.248 -2.95 -1.45 Theil 0.143 0.124 0.112 -4.49 -3.11 coef. var
0.129 0.112 0.105 -4.58 -1.96
Note: Including regions NUTS2 of France, Italy, Germany, Netherlands, Portugal, Spain, Greece, Austria, Italy, United Kingdom, Belgium, Sweden, Slovakia, Hungary, the Czech Republic and Poland. * percentage annual change.
Source: Commission services.
Cyprus, Malta, Poland and Slovakia experienced catching-up during the years 1991-1994, while the rest of the countries experienced a less favourable evolution over that period due to transition crises. In particular, Lithuania and Latvia saw their GDP per capita drop on average by 16 and 15 percentage points, respectively, compared to the EU-25 level, reflecting the deep impact of transition. Following this mixed picture, the years after 1994 are marked by a general tendency for most countries to catch-up toward average EU GDP per capita levels.
While a β-convergence analysis cannot be undertaken because of a too short data time series, some results can still be obtained for σ-convergence although the results must be considered with caution for the same reason. Table 6 shows the results for all EU-15 members except Ireland, Denmark and Luxembourg (for which regional data were not available at the NUTS2 level) but, in addition, Poland, the Czech Republic, Slovakia and Hungary.19
19 Other new Member States did not have regional data on an annual basis for the period considered while others, such as Estonia, Cyprus, Latvia, Lithuania and Malta have no NUTS2 breakdown.

11
Table 7: Decomposition of σ- convergence: within vs. between countries components, 1995-2001
1995 1998 2001 % chg. 1995-1998
% chg. 1998-2001
Theil index Between countries 0.117 0.095 0.082 -6.12 -4.75
Within countries 0.027 0.029 0.031 2.65 2.36
Coefficient of variation Between countries 0.095 0.075 0.066 -6.98 -4.13
Within countries 0.034 0.036 0.039 2.12 2.54
Note: Includes NUTS2 regions of France, Italy, Germany, Netherlands, Portugal, spain, Greece, Austria, Italy, United Kingdom, Belgium, Sweden, Slovakia, Hungary, the Czech Republic and Poland. As expected, inequalities are significantly larger when including the new Member States. The results also tend to confirm the developments noted in the earlier discussion relating to the 1982-96 period. In particular, the average annual variation of the three measures of convergence shows that in all cases GDP per head disparities in the EU have narrowed. This result holds at both country-level and region-level, although it is less pronounced when considering country-level results for the period 1998-2001. Furthermore, the pace of catching-up seems to have increased compared to the earlier period, especially at regional level, although the starting level of regional inequalities is also much higher.
Table 7 indicates that the decrease in regional inequalities is essentially due to a fall in between-country inequalities, as was found in the earlier analysis. In turn, within-country inequalities have increased at rates varying between 2.4 per cent and 2.6 per cent a year depending on the indicator used. This result thus tends to reinforce the findings observed for the EU-15: while some convergence can be observed at the country level and regional level for the EU-25 as a whole, there has been a rise in regional inequalities within countries.
In sum, experience suggests that the road to convergence is far from an easy one. First, over the long run, some convergence has been taking place in the EU, but this process was rather slow. Econometric results show that the rate of convergence was just under 2 per cent over the past decade - meaning that it may take around 30 years, on average, to halve any GDP per capita gap vis-à-vis the EU average. Second, the pace of catching-up has varied a good deal across countries and time periods. Third, the experience of former cohesion countries underscores that accession does not automatically trigger rapid catching-up. Fourth, evidence at the regional level is complex. Convergence periods appear, at first glance, shorter for regions than for countries, based on EU-wide developments. But this masks a
tendency that regions within countries have, initially at least, diverged rather than converged which reflects the strong performance of the more dynamic regions in a country.
2.3 Spatial dimensions of convergence The economic literature suggests two potential trade-offs that may explain why convergence is not even across countries and regions. The first is that countries and regions differ in their initial potential to benefit from any given increase in integration as some may be more attractive for the location of economic activities than others. The second is that, over long periods of integration, regions within countries may develop along different paths. In particular, for countries starting from relatively low levels of income, fast national growth may entail rising regional inequalities given that economic development is rather localised around a limited number of growth poles. In practice, both of these effects interact and determine the way the benefits of economic integration spread across regions. These issues are considered in more detail below.
2.3.1 The location of economic activities in the EU
The question of the potential impact of economic integration on the location of economic activities has generated a sizeable amount of literature over the past decade. In particular, researchers have largely used the framework of New Economic Geography (NEG) to draw possible conclusions about the impact of EU integration on the location of economic activities and, ultimately, the relative wealth of the countries and regions concerned.20 A frequent general interpretation is that economic integration may, at least initially, improve the competitiveness of core EU regions more rapidly than peripheral areas - thus deepening income inequalities throughout the EU.21 Accordingly, the relationship between economic integration and the spatial distribution of activity would be non-monotonic: as trade costs decline, agglomeration initially increases - but subsequently it begins to decline, provided trade costs fall to a sufficient degree.22
Using this theoretical background, empirical studies on the EU have considered how the spatial distribution of
20 This literature has provided extensive discussion of the importance of elements such as market size, economic linkages, imperfect competition and returns to scale in determining the geographic location of economic activities. See Krugman (1991), Krugman and Venables (1996) and Duranton and Puga (2004).
21 See Combes and Overman (2004). 22 Martin and Ottaviano (1999) and Baldwin, Martin and
Ottaviano (2001) have built economic geography models with endogenous growth to show that the interactions between agglomeration and growth are also likely to be influenced by the decrease in transport costs and act as an additional force in favour of agglomeration.

12
economic activities evolved during the 1980s and the 1990s.23 The evidence in these studies presents a mixed picture. Studies using value added and employment data show that specialisation increased, but that this development was very slow.24 In turn, studies using trade data tend to show that export specialisation has slightly increased in the EU over similar time spans.25
By contrast, studies using regional data tend to find stable or slightly decreasing specialisation during recent decades.26 Molle’s (1997) study is noteworthy in this respect as it provides the longest time analysis – based on industry/region-level data for every 10 years between 1950 and 1990 – and thus includes years of strong and rapid economic integration. In addition, Molle includes service sectors, for which the determinant of geographical location may arguably be different. Overall, Molle’s results show no strong changes in the EU, although a minority of regions experienced a decline in specialization, rather than the rise predicted by the core-periphery hypothesis. In addition, Molle shows that the service sector tends to be relatively more dispersed than manufacturing. Further evidence, also using region/sector level gross value added data, similarly shows that the service sector is likely to favour dispersion rather than concentration, given that firms in this sector need to be geographically close to their respective market.27
Empirical studies using sector/spatial concentration measures across EU countries and regions also provide mixed evidence. Studies at the country level show again that results depend on the sectors being considered. Labour–intensive sectors display a tendency to locate preferably in southern EU countries, while sectors with high technology intensity and economies of scale, and which depend on strong backward and forward linkages, remain highly concentrated.28 However, these studies find that changes in location patterns during the 1980s and the 1990s have been, at most, very slow.
23 Note that a number of studies, in particular studies based on
micro-level data have considered more closely the spatial distribution of economic activities by considering only one EU country as, for instance, Maurel and Sédillot (1999) and Devereux et al. (2003). As these studies do not consider the potential impact of EU economic integration, they are not reviewed here.
24 See Amiti (1999), Midelfart-Knarvik et al. (2002), Aiginger/Davies (2000) and WIFO (1999). A different picture arises for trade specialisation measured by import or export data (Midelfart-Knavrik et al. 2002) or by export surplus (WIFO 1999). Here, overall national specialisation decreased between 1970 and 1988. This result may be due to increased intra-industry-trade leading to similar trade structures.
25 See Midelfart-Knarvik et al. (2002), WIFO (1999) and Sapir (1996).
26 See OECD (1999), Hallet (2000) and Molle (1997). 27 See Combes and Overman (2004). 28 See Brülhart (1998) and Midelfart-Knarvik et al. (2002).
A number of recent studies have also analysed the case of the new Member States and the candidate countries during the 1990s, although available evidence is still scarce. Landesmann (2003) analyses the trade structure of manufacturing sectors in these countries and shows that specialisation in some of them changed significantly during the last decade, and was characterised by a rise in technology-intensive branches. This was particularly true for countries such as Hungary, the Czech Republic, Slovakia, Estonia and Poland. By contrast, Bulgaria, Romania and Lithuania remained strongly specialised in traditional, low-technology sectors. Traistaru et al. (2002) instead use employment data for a number of countries at NUTS3 regional level and present rather mixed results. They find an overall increase in regional specialisation for Bulgaria and Romania, but specialisation seems to have decreased in Estonia, and no significant changes occurred in Hungary and Slovenia. Finally, von Schütz/Stierle (2003) use gross value added data at the regional/sector level to study the evolution of specialisation patterns in most old and new Member States, as well as candidate countries, during the period 1995-2000. They show that, while these countries appear to differ widely in terms of the structure of their productive activity, no strong changes can be observed – a finding that probably reflects the short time span considered.
Summing up, most studies come to the conclusion that the impact of European integration on regional specialisation and sectoral or spatial concentration has been rather insignificant during the past decades. The lack of strong shifts in the location of economic activities during economic integration in the EU probably reflects specific features of the European economy - especially low labour mobility. If workers do not move according to wage differentials, then wage inequalities will persist and act as a dispersion force by increasing production costs for firms active in relatively dense areas.29 Another possible explanation is that, over the past decades, the service sector has become increasingly important, and is also known to be less footloose than manufacturing. Because of the absence of labour mobility, the service sector is also less concentrated geographically which exerts another strong dispersion force.30
The evidence reviewed so far thus provides little support for a “spatial trade-off” in which deeper economic integration is associated with greater agglomeration. However, the methodological and conceptual limitations noted above call for caution when interpreting these results, especially when considering possible scenarios for the future.
29 See Puga (1999) for a theoretical analysis. 30 See Barrios and Strobl (2004a).

13
2.3.2 National economic development and regional inequalities in the EU
Before considering evidence for the second trade-off, namely the “national growth/regional disparities” effect, this section discusses how far location influences technological diffusion as a vehicle for growth. This issue is rather important for the national growth/regional disparities trade-off, given the potential role played by knowledge-related spillovers in transmitting growth and innovation across countries and regions.
A central starting hypothesis concerning the link between growth and location is that innovation involves interactions that are easier when agents are located close to each other.31 These arguments suggest that growth is necessarily unequal across space because of its very nature. Spatial inequalities must then arise, at least initially; and their potential reduction essentially relies on various forms of transmission mechanisms that include technological externalities, but also trade and factor mobility (including labour and capital).32 Since knowledge and innovation are crucial for growth, economic integration may trigger regional income inequalities by favouring the emergence of growth and innovation poles within EU countries. This is the hypothesis supported by Giannetti (2002), who argues that greater economic integration intensifies international knowledge spillovers (compared to within-country spillovers). This would favour convergence at the country, rather than regional, level in the EU over the period 1986-1992, which corresponds to the setting-up of the Single Market Program. Recently, Keller (2002) has also shown that global integration tends to lower country-specific barriers to knowledge spillovers. Nonetheless, innovation and technological diffusion in the EU seems to remain dominated by country-specific features. Bottazzi/Peri (2003) show this by studying the spatial distribution of research and development (R&D) and innovation spillovers, and by linking R&D and patenting activities across EU regions over the period 1977-95. They find that R&D spillovers are subject to strong distance-decay effects, with a significant influence exerted by national borders.33
Two important results emerge from this literature.
31 See Lucas (1988). This seminal paper builds on this idea to
point out that the externalities central to endogenous growth are mostly local in nature, and that they provide cities with an important role in promoting growth. A similar argument holds in Romer-type models where the location of innovative activities is crucial for growth and technological progress. See Baldwin and Martin (2004) for a review of the theoretical literature, and Audretsch and Feldman (1996) and Feldman and Audretsch (1998) for evidence.
32 See Lucas (2000). 33 In a recent paper Bode (2004) provides similar evidence
concerning German regions.
• Technological and knowledge-related spillovers, which are essential for economic growth, are likely to be geographically bounded.
• Despite the fact that increased economic integration tends to lower the barriers to technological spillovers, the diffusion of knowledge and innovation in the EU still have strong country-specific components.
For these reasons, both country-level catching-up as well as knowledge spillovers (within and between countries) appear to be fundamental in order to promote regional convergence. More generally, these results may help explain why economic growth in the EU appears to be spatially uneven.34
The existing theoretical literature on country-level growth and convergence offers a wide array of arguments pointing either to the long-term reduction or, on the contrary, to the persistence and self-reinforcing nature, of economic inequalities across countries.35 Such arguments can be combined when analysing simultaneously developments at the country level, and at the regional level within the same country. In particular, growth and development may raise regional inequalities, especially for countries lagging behind in development where barriers to regional spillovers are potentially greater. Initial investigations of these issues date back to the 1950s and the 1960s. Kuznets (1955) explicitly refers to the existence of a “long swing” in income inequalities across regions - where there is first a rise, and then a decline in income differentials, caused by the urbanisation and industrialisation process accompanying the decline of agriculture. Williamson’s (1965) seminal paper in turn provides coherence to these arguments by identifying the key elements driving the evolution of regional inequalities according to the stages of development of a nation – which are essentially related to structural changes, factor movement and public policy. This implies that regional inequalities are likely to rise while countries are engaged in a rapid catching-up process. Any attempts at reducing them may eventually run counter to this process - lowering national growth and, consequently, the potential for future regional spillovers.36
The Kuznets-Williamson hypothesis is especially helpful in understanding the EU experience where catching-up of cohesion countries (as illustrated in Section 2.2) has translated into rising inequalities within these countries. Quah (1996, 1999) shows that while Spain and Portugal experienced high growth rates and
34 Within this context, growth and development may drive rising regional inequalities, especially for countries lagging behind in development, where barriers to spillovers are potentially greater.
35 See, for instance, Solow (2000) and Lucas (2000). 36 These arguments are also well known in the urban
economics literature. See for instance Alonso (1969).

14
Graph 4: Evolution of regional GDP per capita inequalities by cohesion country, 1988-1996
0.05
0.06
0.07
0.08
0.09
0.1
0.11
0.12
1988 1989 1990 1991 1992 1993 1994 1995 1996
Gini
index
ES EL PT other EU15
Source: Commission services.
rising regional imbalances during the 1980-89 period, Greece experienced only modest growth rates, accompanied by decreasing income inequalities across its regions. Petrakos and Brada (1989) and Petrakos and Saratis (2000) find similar evidence for Greece, while de la Fuente and Vives (1995) provide arguments along the same lines for the EU as a whole. Davies and Hallet (2002), in a qualitative assessment of data, support the view that regional income imbalances tend to rise in fast-growing cohesion countries.
Further evidence pointing in this direction is presented in Graph 4 which displays the evolution of the Gini index computed at the NUTS2 geographical level for the cohesion countries compared to the EU average, except Ireland for the 1988-96 period.37 The graph shows that inequalities in Spanish regions are always greater than for the rest of the EU, although variations are rather limited; while for Greece the level of regional inequalities is always below the EU average.
As mentioned earlier, this result possibly relates to the fact that Greece is also the country which has experienced the slowest growth of GDP per head on average over the same period. For Portugal the evolution is more contrasted, with a marked rise in regional GDP per head inequalities just after EU accession in 1986, which extends until the slowdown of 1993/94.38
37 The regional data come from Eurostat following the ESA79
definition of GDP which provides data up to 1996. Regional data for Ireland was not available at NUTS2 disaggregation level. Other data were also available for other countries but they did not have enough regions in order to get a representative EU-15 average or there were data problems for some countries, in particular Portugal in the earlier period.
38 The average growth rate of Portuguese GDP was close to -0.5 per cent against 1.15 per cent for the rest of the EU.
Graph 5: Evolution of regional GDP per capita inequalities for some new Member States, 1995-2001
0.05
0.1
0.15
0.2
0.25
0.3
1995 1996 1997 1998 1999 2000 2001
Gini
index
CZ HU PLSK other EU15
Source: Commission services.
The evolution of income inequalities in some of the new Member States provides even clearer evidence in favour of the Kuznets-Williamson hypothesis. Graph 5 displays the evolution of the Gini index for the Czech Republic, Hungary, Poland and Slovakia.39 All countries but one (Poland) experienced regional inequalities that are larger than in the rest of the EU (excluding Portugal, Spain and Greece).40 More importantly, however, while for the rest of the EU regional inequalities remain fairly stable, in the four new Member States considered here we observe a clear rise in regional income inequalities, which is especially pronounced for the Czech Republic, Hungary and Poland.41
Econometric tests of the Kuznets-Williamson hypothesis have been rather limited so far. Petrakos et al. (2003) use standard econometric regression but find no clear evidence. In fact, running a simple regression of these two variables appears rather inappropriate, given the assumed non-linear nature of the relationship. In a recent study, Barrios and Strobl (2004b) makes use of semi-parametric techniques in order to tackle this issue. This allows, in particular, a graphical representation. Their approach is to regress the level of each country’s Gini inequality index on the level of national GDP per capita,
39 The data is taken from Eurostat’s REGIO database for the
1995-2001 period using ESA95 classification. No comparable regional data at NUTS2 level was available for the other new Member States.
40 Note that differences in Gini index values for the rest of the EU between Graph 4 and Graph 5 are due to the fact that datasets are taken from different accounting systems, the first being the ESA79 system and the second the ESA95.
41 Similar evidence is found in Barrios and Strobl (2004b) who consider also other new Member States.

15
Graph 6: Semi-parametric estimations for EU-15, 1980-1996
0
0.5
1
1.5
2
2.5
3
3.5
4
0.75 0.80 0.85 0.90 0.95 0.99 1.04 1.09
Country-level GDP per head / EU GDP level average
coun
try-le
vel G
ini /
EU G
ini av
erage
Note: Excludes Denmark, Ireland and Luxembourg. Based on ESA79. Dotted lines= confidence interval. Source: Commission services.
both variables being measured relative to the EU average (see Annex II for details on the econometric methodology). Graph 6 reports results of this regression, together with the confidence intervals.42
According to these results the relationship between national GDP per capita and regional inequalities is non-monotonic, following an inverted u-shaped curve in line with the Kuznets-Williamson hypothesis. This shows in particular that, for the cohesion countries which are all located at the left of the curve, i.e. with a GDP per head inferior to the EU average, regional inequalities tend to decrease as their national development proceeds.43 Graph 7 provides supplementary evidence adding to the former EU-15 Member States the Czech Republic, Hungary, Poland and Slovakia during the period 1995-2001.44
Results shown in Graph 7 again depict an inverted u-shaped curve although several differences arise compared to the previous result. First, the left hand-side of the curve is less accurately estimated as shown by the wider confidence bands. Second, the rise in regional income inequalities appear to be potentially much lower in absolute terms than the subsequent fall experienced for higher levels of GDP per head. Here the
42 Data are taken from the Regio database for the period 1980-
1996, using the ESA79 nomenclature for EU-15 countries. Note that the y-axis values are not reported given that they are estimated values with no direct interpretation.
43 Note that the end of the tail of the curve plotted in Graph 6 is slightly increasing. It is important to note that estimations become less accurate at the beginning and the end of the distribution, see Annex II.
44 Graph 7 uses instead data available under the ESA95 classification which provides regional data for the period 1995-2001.
Graph 7: Semi-parametric estimations for EU-15 and Hungary, Czech Rep., Poland and Slovakia, 1995-2001
0
0.5
1
1.5
2
2.5
3
3.5
0.70 0.75 0.80 0.86 0.91 0.96 1.01 1.06
Country-level GDP per head / EU average GDP per head
Coun
try-le
vel G
ini in
dex /
EU
avera
ge G
ini
index
Note: Dotted lines= confidence interval. Source: Commission services.
corresponding fall occurs when a country reaches approximately 70 per cent of EU GDP per head average. These results suggest that the rise in regional inequalities experienced by the countries with the lowest levels of economic development is likely to be only temporary which is in line with the descriptive statistics provided above. In addition, Graph 7 shows that the initial rise in regional inequalities is likely to be less pronounced in absolute terms than the subsequent fall as national development proceeds.
These results have also important policy implications as they point to the possibility of an equity/efficiency trade-off through which GDP per capita inequalities would necessarily rise at the earlier stages of a country’s development process. Indeed this idea fits well with the current experience of the new Member States as national growth in these countries seems to be largely localised in the most dynamic areas around the capital cities where investment, including public investment, is likely to be more productive. 45
2.4 Summary Income convergence in the EU has not proved to be a rapid, continuous or automatic process. The example of Ireland illustrates this best, with a first set of growth-oriented policies initiated in the 1960s, yet catching-up gaining momentum only in the mid-1980s.
Convergence in the EU has been faster at the regional than the country level - due to wider initial disparities at regional level and the strong catching-up of the most dynamic regions in some cohesion countries. New Member States started catching up at a moderate pace
45 From a regional policy viewpoint, these results also support the findings of a paper by de la Fuente (2003) and Castells and Solé-Ollé (2004) who estimate that, in the case of Spain, the allocation of Structural Funds was under-optimal from a national growth point of view.

16
after the transition crisis of the early 1990s. This process was accompanied by increasing within-country regional disparities.
Looking at the spatial dimensions of convergence in the EU, regional specialisation and concentration has not changed significantly during the period for which data are available, and which includes episodes of rapid economic integration. Hence, the existing core-periphery pattern has remained broadly stable. Regional inequalities appear to be influenced by national development paths with cohesion countries and the new Member States experiencing rising regional inequalities during periods of fast catching-up. Empirical evidence suggests that in the early stages of catching-up there is potentially a trade-off between national growth and regional income inequalities. Policy actions aimed at maximising national growth may come at the price of (initially) increasing regional imbalances. Against this background, economic policy in the EU aimed both at favouring national growth and at fostering more rapid technological diffusion across regions (within and between countries) could help boost convergence at country level and smooth the catching-up process of lagging regions.
Given this past experience in the EU, and the considerable income gap of the new Member States, it is very pertinent to ask how, if at all, policies can stimulate the process of catching-up. The remainder of this chapter addresses this question from two angles. In Section 3, policy-relevant insights are distilled both from the economic literature and from empirical evidence for the new Member States, with the purpose of identifying priorities for policy-making in these countries. On this basis, Section 4 discusses the role of EU Structural and Cohesion Funds.
3. How to accelerate catch-up growth in the new Member States?
A primary goal of policy-makers is to improve standards of living by stimulating economic growth – including notably where incomes are below those in neighbouring countries or trading partners. And many intuitively appealing proposals float in policy debates concerning what policy can and should do to accelerate this catching-up process. Two words of caution are thus warranted up-front.
First, the abundance of recommendations stands in sharp contrast to the difficulty of finding clear conclusions that are supported by rigorous empirical tests, and are policy-relevant. Indeed, the scope for unchallengeable results is inherently limited by three features of the growth literature: the lack of sufficient data, the problem of
endogeneity (or circular causality), and the large number of potentially relevant variables influencing growth. Nonetheless, a fair degree of consensus has emerged in this literature on the key policies likely to enhance – or, respectively, damage – the prospects for growth.
Second, given the heterogeneity of the new Member States, this section does not aim to put forward a standard recipe for rapid catching-up. These economies inherited different industrial structures, with for example a large share of agricultural activity in Poland and a strong reliance on tourism and the financial sector in Cyprus and Malta. Eight of them are transition economies whereas two are not. Five are very small economies. Due to their openness, effective growth strategies will rely much more on external competitiveness than in larger Member States, for which trends on the domestic market will be more important. This has also implications for the role of exchange rate movements or domestic capital costs. Therefore, any attempt to copy successful policies from other countries - such as Ireland, for instance - is likely to fail unless country-specific conditions are taken into account.
Economic theory presents growth as ultimately driven by individual behaviour in households, enterprises, or education and research institutions: it thus assigns to policy an indirect role only. This role is, however, critically important. While most economic activity takes place on markets, the relevance of the policy framework for private decision-making can hardly be overestimated. For instance, the security of property rights and returns from investment in capital, research or education, are decisive inputs for individual decisions – and equally important is the availability of infrastructure. Such factors are thus crucial determinants of the growth process. Moreover, it is well-recognized that an entirely market-driven allocation of resources may not lead to an optimal provision of goods. (Formally, the market may not reward goods that have features of non-excludability and non-rivalry in consumption, or produce certain externalities.) This applies notably to investment in knowledge: policy needs to design incentives appropriately so that society benefits to the maximum from individual decisions.
Despite numerous advances in the theoretical analysis of economic growth in recent years, the traditional production function approach remains the standard analytical tool. This approach assigns little importance to demand, which is generally considered to be more relevant for cyclical behaviour: rather, it focuses on the supply-side of the economy - i.e. the accumulation of labour and capital, as well as technical progress - as the drivers of any increase in output over time. Section 3.1 will take this perspective.

17
Table 8: Decomposition of the GDP growth rate in the new Member States
1996-2005 2006-2010 Growth Labour Capital TFP Growth Labour Capital TFP
Cyprus 3.41 0.73 1.53 1.24 3.63 0.46 1.82 1.29 Czech Rep. 2.20 -0.93 2.64 0.57 3.45 -0.62 2.48 1.59 Estonia 5.85 -0.61 2.85 3.48 5.76 0.30 2.85 2.42 Hungary 3.80 0.67 2.02 1.06 3.55 0.23 2.08 1.21 Latvia 6.32 -0.07 2.77 3.49 6.34 0.10 3.26 2.75 Lithuania 5.64 -0.37 2.80 3.11 5.73 0.29 2.69 2.56 Malta 2.48 0.23 2.07 0.18 1.99 0.03 1.60 0.42 Poland 4.25 -0.09 2.11 2.17 4.38 0.46 1.86 1.94 Slovakia 4.00 -0.53 2.49 2.00 3.94 0.48 1.20 2.14 Slovenia 3.76 -0.09 2.57 1.27 3.13 -0.20 2.15 1.15
Source: Commission services.
However, there are important elements of the growth process that are not captured in the production function approach: notably, the determinants of factor accumulation and innovation. Largely, these “deeper” sources of growth are attributed in the literature to trade, geography and institutions.46 While the influence of each of these factors on growth remains controversial, there is some consensus that they all matter. Moreover, many accept that policies should be considered separately from institutions. Section 3.2 will analyse the potential contributions from these driving forces of catching-up.
3.1 The accumulation and diffusion of production factors and knowledge
3.1.1 Growth decomposition and a medium-term scenario
To identify the respective contributions of labour, capital and total factor productivity (TFP, the “Solow residual”) a decomposition of actual GDP growth in the new Member States between 1996 and 2005 was calculated on the basis of the Commission’s production function method.47 The period was chosen not only for reasons of data availability, but also to avoid the influence of the early-1990s transition recession in eight of the countries.48
Table 8 shows that average GDP growth was higher than 3½ per cent in all transition economies except for the Czech Republic and even above 5 per cent in the Baltic countries. Employment made a negative contribution to growth in most of the new Member States - the main exceptions being Cyprus, Hungary and Malta. Investment made an important contribution of 2 percentage points or more in all cases except Cyprus.
46 See Rodrik et al. (2002). 47 For methodological explanations see Denis, Mc Morrow,
Roeger (2002). 48 However, it should be noted that financial crises took place
in some cases in the period under consideration.
The contribution from TFP was highest in the Baltic countries, and only clearly below 1 percentage point in the Czech Republic and Malta.
Based on a number of assumptions, in particular the Commission’s autumn 2004 forecast and trend estimates for the years after 2006, a medium-term scenario for potential GDP growth in the period 2006 to 2010 was calculated. The technical extension to the years 2006 to 2010 is in no way a forecast for these years. It is simply an attempt to illustrate what would happen if the underlying trends of the most recent years were to continue. Average GDP growth would be similar or higher than previously in most of the new Member States. In contrast to the previous period, labour should make a slightly positive contribution in most countries - with the exception of the Czech Republic and Slovenia (and a broadly neutral effect in Malta). Capital and TFP are projected to remain important, but somewhat less so than in the previous period. Again, the three Baltic countries achieve the highest contributions from capital and TFP among the ten countries.
A further exercise was to transpose the projected potential growth rates for the period 2006 to 2010 into values of GDP per capita in PPS relative to the EU-15 average (see Graph 8). According to this medium-term scenario, all countries - with the exception of Malta - would converge to the EU-15 average. The reason is that in all new Member States except for Malta potential GDP growth is projected to be significantly higher that of EU-15 (which is between 1½ per cent and 2 per cent). At the same time, the population is projected to decrease in most of the countries while there is a small increase in the EU-15 between 2001 and 2010, except for Malta and Cyprus where population is projected to increase much stronger. As a result, by 2010, Slovenia and Cyprus would be around 80 per cent of the EU-15 average income. The Czech Republic, Estonia Hungary and Malta would be in a range of 60 per cent to 70 per cent.

18
Graph 8: GDP per capita in PPS in the new Member States
0
10
20
30
40
50
60
70
80
90
CY CZ EE HU LV LT MT PL SK SI
% of
EU-
15 av
erage
2001 2005 2010 Source: Commission services
The remaining countries would converge to a range of 50 per cent to 60 per cent. Thus the scenario shows that if the currently favourable growth trends are assumed to continue and potential growth rates were actually achieved, the income gap vis-à-vis the EU-15 would still remain considerable in many of the countries at the end of this decade.
3.1.2 Labour utilisation
With a socially unacceptable high rate of unemployment and an employment rate far below the Lisbon target of 70 per cent, raising employment is a policy priority not only for the old but also for the new EU Member States. It does not only serve to stimulate growth but is also important for the distribution of income and the reduction of social exclusion. Chapter 3 in this volume gives a more detailed account of incentives on labour markets and means to raise employment and labour force participation.49
Graph 9 illustrates the differences among the new Member States regarding employment rates in the working age population of 15 to 64 years. While Cyprus almost achieved the 70 per cent target in 2003, Hungary, Malta and Poland were even below 60 per cent. The overall employment rate is to some extent influenced by the rate of the older age group of 55 to 64 years which is also given in Graph 9. In Hungary, Malta, Poland, Slovenia and Slovakia less one third of the persons in that age group are employed. In many transition economies generous schemes of early retirement were used to cushion the adverse social effects of labour-shedding enterprises in restructuring.
49 See also European Commission (2002a), Chapter 5, and
European Commission (2004a), Chapter 1.
Graph 9: Employment rates, 2003
0
10
20
30
40
50
60
70
80
EU-15 CZ EE CY LV LT HU MT PL SI SKpers
ons e
mploy
ed in
% of
popu
lation
in th
e sam
e age
ran
ge
15 to 64 years 55 to 64 years Source: Commission services.
While the unfavourable ratio of employed persons relative to those who are not employed and have to live on income distribution or savings (i.e. the dependency ratio) is mostly seen as a problem of public finance, it is also reducing the prospects of economic growth. This is in particular so in countries where a strong demographic decline in the next decades will lead to an ageing population. Between 1990 and 2003 all new Member States except Malta, Poland and Slovakia have already lost in population, the most severe losses being in the Baltic countries due to the out-migration of people of Russian origin. According to the medium scenario of the UN population projection, the median age in most of the new Member States is expected to increase by more than 10 years until 2050 from below 40 in 2005. The Czech Republic, Estonia, Latvia and Slovenia would then have a median age of above 50. Hence, there is an increasing need to redesign the tax-benefit systems in a way which gives incentives to older people to stay longer in employment and have them participate in the generation of income.
In theory, these demographic developments could deteriorate further if there were further substantial out-migration of younger people. Transition periods of up to 7 years after accession to restrict the free movement of labour from the new Member States (except for Cyprus and Malta) are applied by all old Member States except Ireland, Sweden and the United Kingdom. While some migration has already taken place before accession, most empirical studies suggest that no substantial migration flows are to be expected and estimate the long-run migration potential from the 10 central and eastern European countries (CEEC-10: 8 new Member States, Bulgaria and Romania) into the EU-15 at between 2 per cent and 4 per cent of the population. A study carried out for the European Commission projects, after full liberalisation, an initial net increase of residents from the CEEC-10 of 290,000 persons with the net increase

19
Graph 10: Employment share in the total economy, industry and services
0
20
40
60
80
100
AC 1996 AC 2003 Euro area 2003
%
Construction Agriculture et al.
Manufacturing + energy Services Source: Commission services.
peaking at around 370,000 persons and a long-run stock of 3.8 million persons (about 3.7 per cent of their population in 2003).50 Nevertheless, even if quantities are not large, there could be constraints to growth by out-migration of the most qualified (i.e. “brain drain”).
The sectoral structure of employment can also give an indication on growth prospects with a view to either future adjustment needs (e.g. reduction of agriculture) or the potential for employment in activities of higher productivity. The economic literature, following the Kuznets hypothesis, identifies several regularities as employment structures change in the course of economic development – patterns that also seem evident in the new Member States. Among these regularities is a decline of employment in agriculture, and an increasing share in services. The proportion of employment in industry follows a non-linear pattern. It first increases and later on declines.51
Graph 10 presents the change in employment structure over time, showing a decline in the share of agriculture and a build-up in services. The share in manufacturing in the new Member States as a whole has somewhat declined over the last several years but is still higher than in the euro area. Overall, while some convergence to the present euro-area employment structure is evident, the difference is still apparent. Employment in manufacturing is particularly high in the Czech Republic, Slovenia and Slovakia. The breakdown of employment in services shows that the share of employment in trade and transport is much higher, in finance lower and in public sector activities about the same as in the euro area.
50 See Alvarez-Plata et al. (2003). 51 See Raiser et al. (2003) for a model and an empirical
estimation of structural changes in employment in transition economies.
The high unemployment in some of the countries and the need for further adjustments in the future give rise to the question whether labour markets are sufficiently flexible to support a fast process of catching-up. The OECD index of the strictness of employment protection legislation for 2003 is available for the Czech Republic, Estonia, Hungary, Poland, Slovenia and the Slovak Republic. It suggests that employment protection is less strict than in many of the old Member States with the exception of Slovenia where the index turns out to be rather high and thus indicates some excessive rigidity. However, in some of the countries the wage bargaining system and the tax-benefit system lack flexibility and reduce the incentives to create jobs or take up a job. For example, the tax wedge on labour costs for low-wage earners is higher than the EU-15 average in all new Member States except for Estonia, Cyprus and Malta. Although most quantitative indicators do not show this to be a problem in the new Member States, there is some evidence of quality problems to provide a well-educated and trained labour force which is key to high labour market flexibility.
High disparities in regional unemployment also point to problems of labour market flexibility. At the level of NUTS3 statistical regions in 2002, about one third of the labour force were unemployed in some Polish regions and about one quarter of the labour force were unemployed in several Polish and Slovakian regions whereas their capitals had single-digit rates of unemployment. Analyses of similar cases of high disparities in regional unemployment in Germany, Spain and Italy give a number of explanations which also tend to hold for the new Member States:52 low level of regional development, insufficient labour force qualification, a wage bargaining system which does not take into account regional differences in labour productivity, and insufficient geographic labour mobility. The latter is particularly the case in many of the new Member States due to the frequently applied privatisation approach of giving housing to the tenants and an inadequate regulation of the housing market - which leads to a high share of owner-occupation and an almost negligible rental market.
3.1.3 Capital deepening
Investment is considered a key driver of economic growth in general and in the new Member States in particular. When capital is scarce in an economy, the working of market forces should result in high returns on capital, which provides incentives to further accumulation of capital either financed through domestic savings or from abroad.
52 See for example Davies and Hallet (2001).

20
Graph 11: Investment share in GDP in the new Member States
0
5
10
15
20
25
30
35
CZ EE CY LV LT HU MT PL SI SK EUR-12
% of
GDP
, curr
ent p
rices
1995-992000-03
Source: Commission services.
Data on aggregate investment are available in the national accounts. Graph 11 shows that the investment share is higher in most Member States than in the euroarea. In those countries, where the decomposition into private and public investment is possible, the higher investment share is not explained by higher public investment and the share of private investment is higher than in the euro area. It is, however, not evident whether this finding implies a higher capital intensity of production inherited from past production structures or rapid capital accumulation required by a low capital stock. The change of the investment share over time – here 1995-99 vis-à-vis 2000-2003 – can shed some light on this issue. In all countries except the Czech Republic, Malta and Slovakia, the investment share increased, suggesting that a too capital-intensive production structure is unlikely to be the reason.53
Employment structures provide some further indication whether the new Member States are characterised by rather capital-intensive production. Employment in industry was typically far higher in 2003 than in the euro area - and particularly in those that also have a high investment share (see Graph 11). Whether these economies have a comparative advantage in industrial production seems to depend very much on the availability of cheap skilled labour. They would face increased pressure for structural change if this comparative advantage ended - i.e. if productivity growth does not keep pace with wage growth.
53 It is not evident that the decline in the investment share
indicates an already very capital-intensive production in the mentioned three countries. On the other hand, the fact that the investment share was already high in 1990 in these countries supports this interpretation.
Graph 12: FDI inflows into the new Member States
0
1
2
3
4
5
6
1993 1994 1995 1996 1997 1998 1999 2000 2001 2002
% of
GDP
10 new Member StatesExcl. SK
Note: No data available for Slovakia 2001 and 2002. Source: IMF; Commission services.
A less positive assessment of the new Member States could be brought forward in view of their current account deficits. According to Orlowski (2004), external imbalances caused restrictive stabilisation policies that constrained growth in almost all transition economies. He quotes the episodes of Hungary 1995-96, Czech Republic 1997-99, the Baltic States in 1999, Slovakia in 1999-2000 and Poland in 2001-02. The only exception was Slovenia which has a high domestic saving ratio.
Since the new Member States opened their capital accounts at a relatively early stage of economic transition, a large share of investment was financed from abroad.54 Given a shortage of domestic savings, financing of investment relies to a strong degree on foreign savings, particularly in the form of foreign direct investment (FDI). However, since at least a part of FDI inflows were related to privatisation, which is initially only a change of ownership from the state to a foreign investor, FDI is not equal to capital formation. Over the past years, FDI inflows to these economies amounted, overall, to about 4 per cent of GDP, meaning that FDI was the main way of financing their current account deficits. Graph 12 demonstrates that FDI inflows picked-up only in the late 1990s, and seem to have weakened somewhat after 2000 when global capital flows also softened in the wake of slower global economic growth. Comparing FDI flows to other regions of the world in the 1990s, Campos/Kinoshita (2003) conclude that the high expectations in transition economies had not materialised. Disproportionately more capital was diverted into Asia and Latin America than into the transition economies.
The composition of FDI flows to the new Member States can inform about the direction of structural change. Lovino (2003) identified some patterns on the
54 Relatively means in comparison to western economies, which only gradually opened capital accounts during the Bretton Woods period.

21
basis of the stock of FDI in 2000 which are consistent with the direction of sectoral change derived from employment shares:55
• More than a third of the FDI stock (36 per cent) was invested in manufacturing in the new Member States in 2000, compared to 28 per cent in the EU. In 1997, the share was still about 50 per cent.
• FDI flows into services have become more important over time, in particular in the sub-sectors financial intermediation and trade.
• In 2000, 77 per cent of FDI stocks were concentrated in the Czech Republic and Poland.
• The lion’s share of 73 per cent of FDI stocks in the new Member States had its origin in the EU-15. The Netherlands, Germany, France and Austria were particularly important investors.
While the ultimate assessment of the new Member States’ liberalisation strategy is still outstanding, the large inflow of FDI is generally viewed as positive. For the host country, it meant the import not only of capital but also of technology and managerial skills.56 Empirical estimates of the impact of FDI on domestic economic activity have also shown that FDI interacts positively with domestic investment, i.e. higher FDI spurs domestic investment and vice versa.57 Mody et al. (2003) find evidence that FDI has also a positive impact of the efficiency of the capital stock and its allocation across firms in a sample of industrial countries, i.e. not covering the new Member States. According to the empirical estimates of Tondl and Vuksic (2003), FDI inflows were the key driver for economic growth in central and eastern European regions in the second half of the 1990s. In particular capitals and border regions benefited from FDI.
As regards the motivation of foreign investors, the available evidence suggests that both access to domestic markets and lower production costs play a role in the case of the new Member States.58 For instance, Carstensen and Tourbal (2003) found market potential, relative low real unit labour costs, skilled workforce and relative endowment to be significant determinants in their estimates. Among transition-specific factors they find support in favour of the importance of the level and method of privatisation and country-specific risk. This
55 Due to problems of data availability, the new Member States in this study exclude Cyprus, Hungary and Malta.
56 Razin (2002) considers the import of management skills a major advantage of FDI, improving the efficiency of the economy and therewith making FDI more than a simple substitute for trade.
57 According to Hecht et al. (2002), the effect is, however, smaller than initial estimates had suggested.
58 Campos and Kinoshita (2003) find evidence that endowment with resources and infrastructure matter more as determinants of FDI in the former Soviet Union than in the Baltic States and other CEECs.
evidence in favour of microeconomic determinants, which is in line with the findings of Campos and Kinoshita(2004), who find institutions, openness and agglomeration effects to matter most in Eastern European countries, differs from the previous finding that macroeconomic factors had been key driving factors of FDI inflows in the earlier time of transition.59
Graph 13: Saving rates in the new Member States, 2003
0
5
10
15
20
25
30
CZ EE LV LT HU MT PL SI SK EUR-12
% of
GDP
NationalPrivate
Source: Commission services.
3.1.4 Innovative activity and knowledge
Although it is widely acknowledged that stimulating innovative activity and generating technical progress are crucial determinants of economic growth, the economic literature still offers surprisingly little policy-relevant insights. The most promising venue in economic theory has been the modelling of knowledge creation whereas the empirical literature has identified a number of potentially important determinants of total factor productivity growth. In general terms it can be claimed that knowledge creation through research, knowledge diffusion through education and training and its application are important pre-conditions, but they have to be combined with incentives to draw economic benefits from it. It is, however, difficult to translate the academic insights into more concrete policy advice. This section aims at highlighting two aspects that are of relevance for catch-up growth in the new Member States, namely the role of knowledge transfer from other countries and a comparable evaluation of factors that are considered of relevance for stimulating domestic innovative activity.
The most apparent form of knowledge diffusion across borders is education abroad and labour migration. Ireland is currently seen as the prime example that brain drain, which is usually regarded with scepticism when it occurs, can be of benefits in the long term. Key elements of such a “development strategy” is the preparedness of students and workers abroad to return to their home country and make use of newly acquired knowledge. In
59 See Garibaldi et al. (2001).

22
this context, the main insights from the Irish experiment are more of social than of economic nature. The number of researchers from the new Member States at universities and research facilities has undeniably increased over the last decade and a similar trend can realistically also be present for workers. However, little is known in quantitative terms about this phenomenon.
A second important mechanism for importing knowledge is through trade and FDI. The endogenous growth literature has provided some support for the view that imports, in particular of intermediate goods, have a positive impact on productivity growth in the importing country. Concerning FDI, Barba, Navareti and Tarr (2000) paint a less upbeat picture. Although the productivity of the recipient economies increases through the activity of multinational enterprises and industry-level studies suggest that spill-overs are positive, studies on firm-level are less positive. Activity of foreign-owned firms may have negative spill-over effects if it reduces domestic firm’s ability to benefit from scale economies.60 A crucial intervening element in this debate seems to be the time period and the degree of competition prevalent on the market. Boeri and Bruecker (2000) found that FDI was often directed to underdeveloped market segments to make use of first-mover advantage in markets with little competition. They claim that the strategy of extracting rents might explain why the new Member States benefited relatively little from FDI in terms of technological spillovers.61
The new Member States’ ability to benefit from importing technology can be considered to depend largely on the same factors that would allow them to develop domestically-driven innovative activity. In order to structure the discussion and highlight Member States’ potential, the subsequent part builds on the Commission’s 2003 European Innovation scoreboard indicators, which distinguish among four main factors of innovative activity. These are determinants governing human resources, knowledge creation, transmission and application of knowledge, and innovation, finance, output and markets.
While indicators are available for almost all EU-15 Member States, gaps are still common for the new Member States, in particular for indicators in the fourth category data. Since the innovation scoreboard is based on the most recent data available, data entries can be different across countries. In most cases, data is from 2001 or 2002.62
60 See Djankov and Hoekmann (2000) for an analysis of
Czech firms. 61 See also Barrel et al. (2001) and Holland and Pain (1998). 62 For more detailed information on the innovation scoreboard
see European Commission (2003a). Key input to the innovation scoreboard is the Community Innovation Survey, which is conducted all four years. The latest data was released in August 2003.
Graph 14: Educational attainment and high-tech employment in the new Member States, 2002
0
2
4
6
8
10
12
14
16
40 50 60 70 80 90 100Youth education attainment level
high-t
ech e
mploy
ment
(mfg
and s
ervice
s)
EU-15new Member StatesLinear (EU-15)
Note: Youth education attainment level - total - Percentage of the population aged 20 to 24 having completed at least upper secondary education. Source: Commission services.
Higher education is an important determinant of human resources. For instance, Tondl and Vuksic (2003) reasons that higher growth in the new Member States’ capitals is due to these regions’ endowment with a more qualified labour force which makes them more attractive as a location for FDI. Graph 14 shows on the horizontal axis that upper secondary education among the currently young people in the new Member States’ labour force is not systematically different from that in the EU-15 Member States. With the exception of a low share of secondary education in Malta, the range is about the same in the old and the new Member States. A similar picture would emerge for tertiary education. One observes an extraordinarily high share of tertiary education in Latvia, but the range is about the same in the old and the new Member States.
One finding is the absence of a clear relationship between higher education and employment in high-tech manufacturing and services. The existence of such a relationship for the old Member States is suggested by the trend line in Graph 14. It is similar when tertiary education is used instead of upper secondary education.63 If the share of graduates in science and engineering is related with employment in high-tech sectors, there is a positive correlation for the old Member States but an inverse one for the new Member States. That is, employment in high-tech sectors in the
63 Since there is no breakdown in the tertiary education into
age classes and education of elderly people in the work force under the previous regimes may not be worth much today, this indicator is probably less telling.

23
Table 9: Innovation indicators for the new Member States
CY CZ EE HU LT LV MT PL SI SK EUR-15
Public R&D expenditure, % of GDP 0.22 0.52 0.53 0.57 0.49 0.28 -- 0.43 0.69 0.22 0.69 Business R&D expenditure, % of GDP 0.05 0.78 0.26 0.38 0.2 0.16 -- 0.24 0.94 0.45 1.3 High tech patent applications (per mio inhabitants, EPO+USPTO) 3.2 0 0 4.6 1 0 4.1 0.3 9.1 1.3 44
Patent applications (per Mio inhabitants, EPO+USPTO) 17.1 13.7 13.2 26.3 3.8 8.4 15.3 3.6 53.8 6.8 241
SMEs innovating in-house (% of SME, mfg.) -- 25.8 39.1 -- 26 19.1 15.4 4.1 22 14.1 37.4
SMEs involved in innovative co-operation (% of SMEs, mfg.) -- 5.8 11.8 -- 12.1 4.1 4.9 -- 8.4 4.4 9.4
Innovation expenditure (% of turnover, mfg. and services) 2.2 3.35 3.89 5.31 6.8 16.3 5.28
ICT expenditures (% of GDP) -- 9.5 9.6 8.9 5.9 7.9 4.1 5.9 4.7 7.5 7 Share of value added in high tech sectors (mfg.) -- -- -- 14.9 22.3 -- 22.4 -- 15.9 -- 14.1
Note: Data not completely comparable since the methodology in some cases is different and the data processing has not been harmonised.
Source: WITSA/IDC, Commission services.
new Member States is rather invariant to their endowment with human resources.64 Although an explanation for this finding is not straightforward, it could suggest that most new Member States have not (yet) specialised into high-tech sectors.
Numerous factors related to knowledge creation and diffusion have been highlighted in the economic literature. Some of them stand as proxies for input in research, such as R&D expenditures. Others measure the number of patents as the intermediate output. Since SME’s are expected to play a central role in innovation, indications of how they actually perform can be informative. While the theoretical link of these variables with technical progress is apparent, complications occur when it comes to presenting empirical evidence. Relationships over time or across countries are often weak and seldom stable if other control variables are included.
Table 9 gives an overview of selected indicators on innovation in the new Member States. Although data are not fully comparable across countries, there are clear signs of a lag in innovative activity in the new Member States relative to the EU-15 Member States. Ignoring problems of data comparability, one would expect that Member States that fare high with the innovation indicators should also have higher labour productivity growth and vice versa. By plotting the coefficient of correlation between labour productivity growth and innovation indicators across countries, Graph 15 shows that this is neither the case for the EU-15 nor for the new
64 This result is consistent with the empirical analysis of Tondl and Vuksic (2003) that finds own innovative activity not to be a significant growth factor in the new Member States.
Member States.65 But again the empirical patterns are different between new and old Member States. In the old Member States labour productivity growth across countries is positively correlated with all innovation indicators bar innovation in SMEs. For the new Member
Graph 15: Correlation of innovation indicators with labour productivity growth, coefficient of correlation of ranks across
new and old Member States
-1.00
0.00
1.00Public R&D
Private R&D
High tech patents
Patents
SMEs innovationSMEs cooperation
Innov. exp.
ICT exp.
high tech VA
new Member States
EUR-15
Note: The dark dots show the coefficient of correlation between the rank of the innovation indicator among new Member States and the new Member States’ rank of labour productivity growth 1999-2003. The light line shows the result of the same exercise for the old Member States. For more explanations on the variables, see Table 10. Source: Commission services.
65 More precisely, it shows the correlation between the rank
among countries of labour productivity growth and the rank of innovation indicators.

24
States, it is negatively related to 5 of the indicators and close to zero for a sixth indicator. Only in SME innovation and ICT expenditure is the relationship among new Member States more consistent than across the old Member States. This seems to suggest that innovation has not yet been a central determinant of productivity growth in the new Member States.
3.1.5 Policy challenges
The decomposition of growth in the new Member States indicates that, between 1996 and 2004, it was driven by investment and total factor productivity, while labour utilisation had a negative effect. In a scenario from 2005 to 2010, which is a projection of what would happen if the trends of the most recent years were to continue, contributions from capital and total factor productivity moderate somewhat and labour is expected to have a positive, although limited contribution to growth. Except for the Baltic countries, growth rates are projected to be below 5 per cent which allows only limited progress in catching-up vis-à-vis the EU average.
Employment rates, in particular in the old age group, are fairly low in most of the new Member States. In view of the expected demographic trend of an ageing population, tax-benefit systems need to be reviewed to provide incentives for creating and taking up jobs and to increase the actual age of retirement. Deficits in the adaptability of the labour market do not appear to arise from excessively rigid employment protection legislation but rather from insufficient wage differentiation, the tax-benefit system and a lack of regional labour mobility for a number of reasons such as an inflexible housing market. In view of the still high importance of agricultural employment in some of the new Member States, an unduly generous support to this sector should be avoided in order not to decelerate the required structural change to employment of higher productivity in other sectors.
Capital deepening has been an important source of growth in the new Member States which tend to have a much higher investment-to-GDP ratio than the EU-15, although they still have a less capital-intensive production. Given the early liberalisation of capital movements, FDI was a major source of financing the current account deficit as a reflection of the gap between domestic savings and investment. The mostly foreign-owned banking sector, rather than the stock exchange, was the main channel of financial intermediation. Given that the net inflow of foreign capital to finance continuing high investment will not last forever, the main challenge will be to gradually mobilise more domestic savings through other channels than banks such as pension funds and the stock markets.
Innovative activity and knowledge are important triggers for technical progress. Educational attainment levels in the new Member States do not differ much from those in the EU-15, but anecdotal evidence suggests that there could still be a quality problem which require
improvements in the education systems in several of the countries.66 Although less than one would expect, trade and FDI have been important for the cross-border transfer of knowledge in management and technology. However, innovation has not yet been a central determinant of productivity growth in the new Member States. Activity and employment in R&D and innovation tend to be much lower which can best be explained by a different pattern of specialisation. One should however be cautious in urging the new Member States and their business sector to spend substantially more on R&D activities at the current stage given that, due to their specialisation, spending in other areas could have much higher returns at this stage.
3.2 Other determinants of economic growth
3.2.1 Trade and geography
Trade and geography are among the factors that have long been considered as the most important driving forces of long-term growth and development.
It is a well-established fact in economic theory that trade liberalisation promotes economic efficiency and consumer welfare, but proper modelling of the link to growth is more recent. In the context of studies on the expected Single Market effects, Baldwin (1989) argued in a Solow-type model that the first-round allocation effects due to a larger market would induce a second-round effect of higher income, savings and investment as medium-term growth effects. The intuition would be that export-oriented and import-competing firms would invest to improve their competitiveness. New growth theory focussed on knowledge spillovers that can go along with the trade of goods.67 Taking into account that trade often goes along with FDI, this argument of technology transfer seems rather plausible. However, the empirical evidence on the trade-growth links is rather weak and has been subject to scepticism.68 Causality (or endogeneity) is a major problem. For example, the standard result that more open economies tend to be richer can either prove the growth effects of trade or prove that richer economies find it easier to liberalise their trade. Investment in export-oriented sectors can have positive effects on both growth and trade simultaneously. Furthermore, trade liberalisation often goes in parallel with other economic policies which makes it difficult to isolate the effect of trade liberalisation. Lee et al. (2004) are trying to deal with these problems more explicitly by applying sophisticated econometric methodology and find a robust effect from growth to openness and a positive, although small effect of openness on growth.
66 See European Commission (2002a), Chapter 5. 67 See Rivera-Batiz and Romer (1991). 68 See, for example, Rodriguez and Rodrik (2000) and Wälde
and Wood (2004).

25
Other authors argue that geography is the most important determinant of growth and point to the influence through resource endowments, productivity and access to markets.69 Some models of imperfect competition of New Economic Geography illustrate how small initial differences in market size can lead to the formation of a high-wage centre and a low-wage periphery. The EU itself provides some evidence of the importance of geography when considering that, although with several exceptions, the richest regions tend to be located in the centre of the EU whereas the poorest regions tend to be located at its periphery. Again, causality is a major methodological problem since high-income countries have the possibility to mitigate the adverse effects of geography, for example through investment in infrastructure and technology.
Whatever the difficulties of providing empirical evidence on the individual effects of trade or geography on growth, the gravity model is a powerful empirical tool combining economic size and distance between countries to predict bilateral trade flows without implying strong causality among them.70 Rose (2000) used the gravity approach to find that currency unions have a tripling effect on trade. This finding was subsequently critically discussed and revised somewhat downwards but there tends to be agreement on the overall large effects of currency unions. Applying this approach to EMU, trade effects of up to 50 per cent were found.71
The situation in the new Member States
Trade between the EU and the 10 new Member States has been liberalised to a large extent already before accession in the context of the Europe Agreements signed in the early 1990s. This was done in an asymmetric way, i.e. the EU opened up its markets faster.
Baldwin (1994) used a gravity model to compare the potential trade of central and eastern European countries in the absence of trade barriers to the actual trade in 1989. The ratio potential to actual trade was nearly always larger than unity and exceeded 2 in the case of Poland and 4 in the case of Czechoslovakia. The largest potential EU exporter to CEECs would be Germany
69 For example, Gallup et al. (1998) demonstrate that location
and climate have large effects on income levels and income growth through their effects on transport costs, disease burdens, and agricultural productivity, among other channels.
70 In physics, gravity is a function of mass and distance. However, economic theory has problems to model the results of the gravity model. For such an attempt see for example Evenett and Keller (2002).
71 For an overview on trade effects of EMU see European Commission (2004b), Chapter IV.
Graph 16: Change in exports and imports of goods and services in constant prices from 1995 to 2003 in %
8
28
48
68
88
108
128
148
168
188
CZ EE CY LV LT HU MT PL SI SK
% ch
ange
1995
-2003
Exports Imports
Note: Data are from national accounts. Source: Commission services.
followed by Italy. While at the time these were only rough estimates due to limitations of data, it clearly illustrated how trade barriers can impede potential trade on the basis of geographic and economic conditions.
Although time periods are not fully comparable due to problems of data availability, Graph 16 shows the enormous growth in total trade of the new Member States. Trade in constant prices has doubled in all of them except for Cyprus, Slovenia and Malta between 1995 and 2003. Imports have been growing much faster than exports and several of the countries are running large trade deficits. The relatively slow growth of trade in Slovenia could be related to the low FDI inflows, due to the special way of privatisation, which triggers fewer imports of intermediate goods for the production and export of manufactured goods.
In their transition process most of the eight new Member States have substantially reoriented their trade from the ex-communist trade partners towards the EU-15. Except for Lithuania, more than half of all their merchandise trade in 2002 was with EU-15 countries and in all central European Member States (except Slovakia) as well as in Estonia the share exceeded 60 per cent. The EU-15’s share in the new Member States’ total exports was considerably higher than the share in total imports except for Malta, Cyprus and Slovenia. Within the new Member States, the regions closest to EU-15 usually had the strongest trade and growth effects. The most important trade partners in EU-15 are those closest to new Member States, i.e. above all Germany, but also Italy, Austria, Greece and Finland. Over the last years the EU-15 had a trade surplus with the new Member States which can be explained by strong demand for durable consumer goods and investment goods which are still hardly produced locally. Trade specialisation is still in labour-/low-skill-intensive production but Hungary, the Czech and Slovak Republics, Slovenia and

26
Estonia are gradually moving into more technology-/high-skill intensive production.72
Policy challenges
The new Member States have undergone considerable trade liberalisation since the early 1990s and have impressively increased their trade, in particular with the EU in the context of the Europe Agreements. A part of the growth performance in the past is likely to have benefited from this increase in trade.
Membership brings some further trade liberalisation regarding sensitive sectors (agriculture, steel, services) and non-tariff barriers as well as a possible further reduction of transport costs arising from reduced waiting times at borders and from improvements in infrastructure. The latter will also depend on more efficient network industries as a result of their successful liberalisation. Less exchange rate volatility in the case of ERM II participation and later the adoption of the euro could even further reduce trade costs and could have substantial trade effects.
Improving even further the already good market access should enhance their competitive position in the Single Market. The gravity model suggests that these reductions in trade costs will result in further increases in trade. It also points to the importance of the growth performance of the core euro area economies for the trade and growth performance of the new Member States. For those among the new Member States, whose location puts them at a geographic disadvantage in developing closer economic ties with the EU (such as the Baltic countries, Cyprus and Malta), particular efforts on reducing trade costs will be key to further growth from trade integration with the EU. Given that they are likely to specialise their intra EU-trade in those goods and services with lower transport costs, such as the exchange of data and information, developing the relevant infrastructure and education - in particular in information and communication technologies - could be particularly important.
The expected trade-related growth effects will also depend on the external competitiveness of local firms and their incentives to improve their efficiency through investment. In order to be able to compete on EU and global markets, flexible and liberalised product markets are of major importance. While aspects of capital and labour markets have already been discussed above, there are indications that there is a considerable potential to increase the efficiency of product markets in most of the countries.73
72 See Landesmann (2003). 73 See European Commission (2004a), chapter 4.
3.2.2 Macroeconomic policies
Accomplishing and preserving macroeconomic stability is consistently seen as an essential contribution of public policy to economic growth. The justification is apparent. Volatility in macroeconomic conditions entails that long-term planning is exposed to a higher degree of uncertainty. Investment projects with long gestation periods and high sunk costs are likely to be most responsive to changes in macroeconomic stability. This does not only hold for investment into physical capital but also for investment in research, skills and education.74 The more uncertain the macroeconomic environment, the less resources are used for long-tem investments and the lower is the potential rate of growth.
Whereas economic theory allows postulating that high inflation must not impede economic growth, high inflation tends to mean in practice also a high variation in the rate of inflation, which is an obstacle to longer-term planning and could result in distorted relative prices. For instance, it is often argued that high inflation leads to over-investment in assets such as real estate that are considered to offer a safeguard against inflation. The interaction of inflation with the tax system implies distorted incentives to invest and this might entail significant economic costs even at moderate rates of inflation.75 As regards fiscal policy, a high level of taxation may lead to distorted incentives to invest and to bear risks. An unsustainable path of public debt implies austerity measures in the future. Current investment decisions will be framed in anticipation of high future taxes and less public spending, with practical experience showing that investive public spending is often strongest curtailed when public finances are consolidated.
While the empirical evidence of an inverse relationship between very high inflation and economic growth is undisputed, the case is less clear for moderate rates of inflation.76 Despite some reservations on their robustness, several empirical studies on the basis of data for the OECD countries, which have low to moderate rates of inflation, were able to establish a link between the two variables.77 It might be that for low rates of inflation, it is less the efficiency of the price system in the allocation of resources that matters for growth but the distortion of incentives due to the interaction of inflation with capital taxes in particular. Thus, empirical results may depend on the kind of investment or fiscal variables that are included in the regressions.
74 For a literature review of the theory and evidence on the
link between macroeconomic stability and growth, see Ahn and Hemmings (2000).
75 See Feldstein (1996). 76 For example, Bruno and Easterly (1998) argued that the
inverse relationship between inflation and growth was only due to outliers with very high rates of inflation and the use of high frequency data.
77 See Ahn and Hemmings (2000) for an overview.

27
Studies that analyse the impact of public finances on economic growth tend to find a negative correlation between public deficits or debt and economic growth. A caveat is, however, related to the direction of causality since it is difficult to establish whether either high deficits are hampering growth or be themselves a consequence of low growth. While moderate changes in fiscal policy may have little or no negative effect on economic growth, especially if the government has access to finance on the global capital market, there may be a country-specific threshold above which market participants perceive the fiscal stance as not sustainable and demand a higher risk premium for holding the country’s assets. This may then give rise to crowding-out effects to private investment.78
Evidence is generally more robust on that the composition of public expenditure and their financing matters rather than global variables such as total public expenditure, revenues, debts or deficits. This is why the policy discussion on this issue has increasingly focused on the quality of public finances.79
The OECD’s growth project 2000-2001 aimed at compiling all the available evidence on the factors driving economic growth.80 As regards inflation, the results provide support for the notion that evidence in favour of a negative impact of moderate inflation on economic growth (or investment) is hard to obtain. Evidence is more apparent for the impact on growth of the volatility of inflation. Whenever the variable was included, it turned out with a significantly negative sign. As regards public finance variables, the estimates suggest that the share of tax and non-tax revenues in GDP is inversely related to economic growth and investment. This, however, leaves open whether the level of taxes is negatively affecting growth or whether high taxes are correlated with a high level of distortive taxes. The ratio of direct taxes to indirect taxes, where the latter are supposed to be less distortive to investment/saving decisions, turned out to have the
78 Identifying such a threshold would be a serious challenge for theoretical as well as empirical work. Even if it were possible, it would be of no help for practical policy making as these estimates were subject to the Lucas critique, i.e. change once they are known.
79 An obvious indication for this shift can be seen in the fact that the World Competitiveness Report has replaced the variable public spending relative to GDP with an index capturing the amount of distortive public activity. It consists of three sub-indices measuring distortive subsidies, diversion of public funds and public trust in politicians’ fiscal honesty. See Sala-i-Martin (2003).
80 More detailed explanation of this research, which provides some kind of benchmark estimates for industrialised countries, is given in Bassanini et al. (2001). As regards the impact of macroeconomic variables on growth, the empirical approach was a pooled-mean group estimator that exploits the information content of both differences across 21 OECD countries and variation over time (1971-98) while imposing some coefficients to be uniform in all countries.
expected negative relationship to growth. Public investment and consumption tend to have different signs in most estimates. The positive impact of public investment on growth has also been found in some but not all other studies. European Commission (2003b) concluded that results appear weak and fragile, pointing to the consensus that public investment is less important for growth than other factors.
The situation in the new Member States
The new Member States’ performance varied with respect to a number of macroeconomic variables, including inflation, public finance and the current account deficit.
Graph 17 plots both average inflation (x-axis) and inflation variability (y-axis) in the new Member States (light squares) in two periods, namely 1997-99 (dark diamonds) and 2001-03 (light squares). For comparison, the observation for the euro area in 2001-03 (light triangle) is also included.81 It shows that inflation rates have come down markedly in the new Member States. In the later period, the difference to the euro area is small for some of them. The reasons for the success of monetary authorities in the new Member States in engineering disinflation are still disputed in the economic literature. Disinflation is attributed to favourable developments in import prices, institutional developments driven by the prospect of EU accession and conducive to a sounder policy-mix, and the diminishing need for adjustments and liberalisation of administered and regulated prices.82
Graph 17: Level and variability of consumer price inflation in the 10 new Member States
0.0
0.5
1.0
1.5
2.0
2.5
3.0
3.5
4.0
0 2 4 6 8 10 12 14 16HICP inflation (avg over 3 yrs)
varia
bility
(std
over
3 yrs)
1997-99
2001-03
Euro area 2001-03
Source: Commission services.
Graph 17 also shows that the variability of consumer price inflation is considerably higher in the new Member States than in the euro area. It was more volatile despite
81 1997 is the first observation of HICP inflation for some of the new Member States.
82 See Brada and Kutan (2002) and Wachtel and Kurhonen (2004).
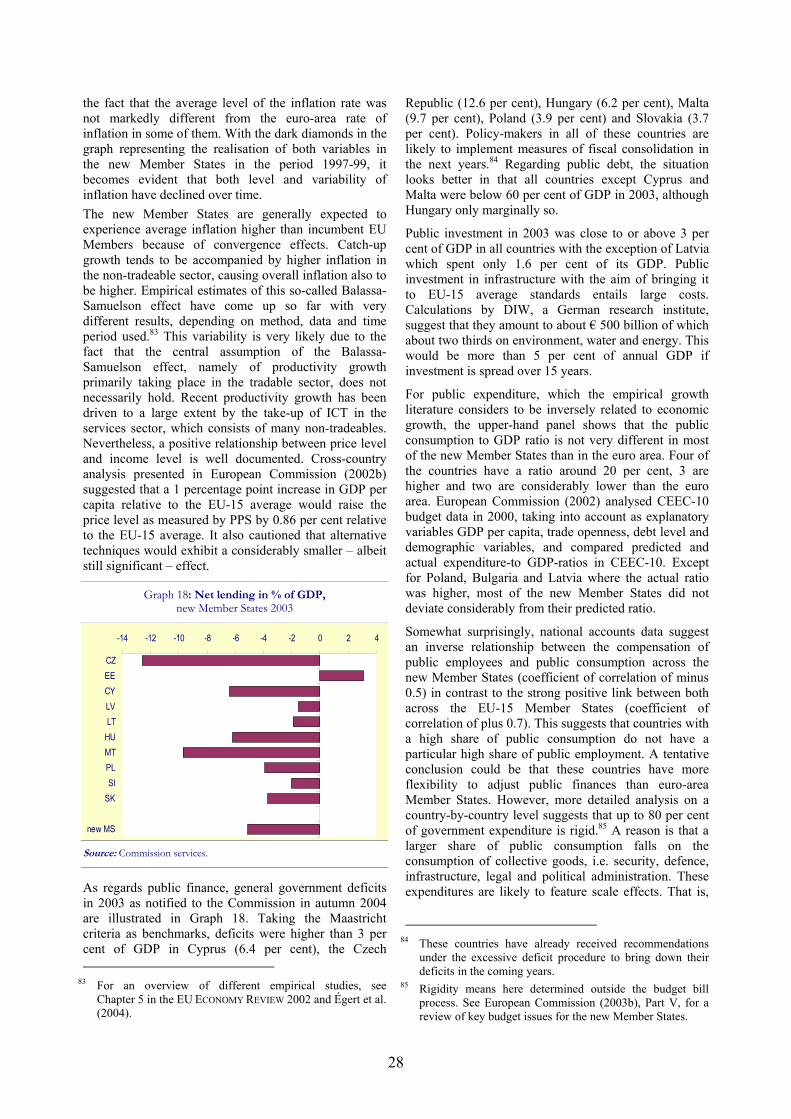
28
the fact that the average level of the inflation rate was not markedly different from the euro-area rate of inflation in some of them. With the dark diamonds in the graph representing the realisation of both variables in the new Member States in the period 1997-99, it becomes evident that both level and variability of inflation have declined over time. The new Member States are generally expected to experience average inflation higher than incumbent EU Members because of convergence effects. Catch-up growth tends to be accompanied by higher inflation in the non-tradeable sector, causing overall inflation also to be higher. Empirical estimates of this so-called Balassa-Samuelson effect have come up so far with very different results, depending on method, data and time period used.83 This variability is very likely due to the fact that the central assumption of the Balassa-Samuelson effect, namely of productivity growth primarily taking place in the tradable sector, does not necessarily hold. Recent productivity growth has been driven to a large extent by the take-up of ICT in the services sector, which consists of many non-tradeables. Nevertheless, a positive relationship between price level and income level is well documented. Cross-country analysis presented in European Commission (2002b) suggested that a 1 percentage point increase in GDP per capita relative to the EU-15 average would raise the price level as measured by PPS by 0.86 per cent relative to the EU-15 average. It also cautioned that alternative techniques would exhibit a considerably smaller – albeit still significant – effect.
Graph 18: Net lending in % of GDP, new Member States 2003
-14 -12 -10 -8 -6 -4 -2 0 2 4
CZEECYLVLT
HUMTPLSI
SK
new MS Source: Commission services.
As regards public finance, general government deficits in 2003 as notified to the Commission in autumn 2004 are illustrated in Graph 18. Taking the Maastricht criteria as benchmarks, deficits were higher than 3 per cent of GDP in Cyprus (6.4 per cent), the Czech
83 For an overview of different empirical studies, see Chapter 5 in the EU ECONOMY REVIEW 2002 and Égert et al. (2004).
Republic (12.6 per cent), Hungary (6.2 per cent), Malta (9.7 per cent), Poland (3.9 per cent) and Slovakia (3.7 per cent). Policy-makers in all of these countries are likely to implement measures of fiscal consolidation in the next years.84 Regarding public debt, the situation looks better in that all countries except Cyprus and Malta were below 60 per cent of GDP in 2003, although Hungary only marginally so.
Public investment in 2003 was close to or above 3 per cent of GDP in all countries with the exception of Latvia which spent only 1.6 per cent of its GDP. Public investment in infrastructure with the aim of bringing it to EU-15 average standards entails large costs. Calculations by DIW, a German research institute, suggest that they amount to about € 500 billion of which about two thirds on environment, water and energy. This would be more than 5 per cent of annual GDP if investment is spread over 15 years.
For public expenditure, which the empirical growth literature considers to be inversely related to economic growth, the upper-hand panel shows that the public consumption to GDP ratio is not very different in most of the new Member States than in the euro area. Four of the countries have a ratio around 20 per cent, 3 are higher and two are considerably lower than the euro area. European Commission (2002) analysed CEEC-10 budget data in 2000, taking into account as explanatory variables GDP per capita, trade openness, debt level and demographic variables, and compared predicted and actual expenditure-to GDP-ratios in CEEC-10. Except for Poland, Bulgaria and Latvia where the actual ratio was higher, most of the new Member States did not deviate considerably from their predicted ratio.
Somewhat surprisingly, national accounts data suggest an inverse relationship between the compensation of public employees and public consumption across the new Member States (coefficient of correlation of minus 0.5) in contrast to the strong positive link between both across the EU-15 Member States (coefficient of correlation of plus 0.7). This suggests that countries with a high share of public consumption do not have a particular high share of public employment. A tentative conclusion could be that these countries have more flexibility to adjust public finances than euro-area Member States. However, more detailed analysis on a country-by-country level suggests that up to 80 per cent of government expenditure is rigid.85 A reason is that a larger share of public consumption falls on the consumption of collective goods, i.e. security, defence, infrastructure, legal and political administration. These expenditures are likely to feature scale effects. That is,
84 These countries have already received recommendations under the excessive deficit procedure to bring down their deficits in the coming years.
85 Rigidity means here determined outside the budget bill process. See European Commission (2003b), Part V, for a review of key budget issues for the new Member States.

29
Graph 19: Public consumption in the new Member States, % of GDP
0
5
10
15
20
25
CZ EE CY LV LT HU MT * PL SI SK EUR-12
% of
GDP
0
5
10
15
20
25
Collective government consumption Other government consumption
Compensation of public employees Note: Malta is 2001 observation for total government consumption, no breakdown available. No comparable data on compensation of public employees for Slovenia. Source: Commission services.
they are higher than in the old Member States because the new Member States still have a lower level of GDP per capita but these expenditure items should grow under proportional to GDP.
Most of the new Member States have similar or smaller revenue/GDP levels than euro area and the average tax burden is also consistently lower. This does not necessarily imply that taxes have a less distortive effect on individual incentives in the new Member States than in the euro are because the variable of interest is the marginal tax rate rather than the average tax burden shown in the graph. Absent comparable information on marginal tax rates, at least at the aggregate level, the graph can nevertheless be expected to give a good proxy for tax incentives.
Finally, the tax system is not less supportive to growth in the new Member States compared to the euro area in the aggregate perspective. A higher share of tax revenue falls on indirect taxes, which are perceived to be less distortive to the allocation of income to consumption and investment/savings than direct taxes. A qualification to this finding, however, results from the size of social security contributions, which - though smaller relative to GDP than in the euro area - are rather large in relation to the tax base, leading to high rates of taxation on labour. This negatively affects incentives for job-intensive growth and for work in the official economy.
Regarding the external balance, the economies of the new Member states, at the time of accession, display important strengths that should help ward off risks of instability. Nonetheless, policy-makers need to ensure that the process of convergence is not punctuated by external or financial sector stresses. Among the key favourable elements in this regard are reforms that have restructured the financial sector and buttressed external positions against possible shocks.
Graph 20: Current account deficits and net foreign direct investment in % of GDP, 2003
-2
0
2
4
6
8
10
12
14
CZ EE CY LV LT HU MT PL SI SK
% of
GDP
CA deficit Net FDI
Note: No FDI graphs for Slovakia. Source: Commission services.
Policy-makers have made great strides in strengthening frameworks for financial supervision. Banking systems are on average well capitalised and sizable foreign ownership stakes have typically helped to improve management. Already in the transition decade, hard budget constraints were imposed on former state-owned enterprises – removing a key source of quasi-fiscal pressures on banks and governments. And in general the leverage of households and corporations is low.
In the external sector, current account deficits have been covered significantly by foreign direct investment (see Graph 20). Short-term debt typically is well covered by reserves. Monetary and exchange regimes are mostly the “corner solutions” of hard pegs or qualified inflation targeting, reducing vulnerability to capital flows. Moreover, adjustment mechanisms in the real economy display greater flexibility than in other Member States – notwithstanding some rigidities that keep structural unemployment high – and competitiveness has been quite well preserved.
In terms of possible vulnerabilities over the medium term, however, the discussion above of current trends in the public finances presents a decidedly more mixed picture. The larger economies in central Europe, as well as Cyprus and Malta, have experienced sizable fiscal deficits; and in a number of cases debt ratios are quite high relative to income levels. This argues for a steady reduction in deficits – so that policy is positioned to respond flexibly to possible shocks. In the Baltic region and in Slovenia deficits are much smaller, and three of these economies have already entered ERM II.86 It remains important, nonetheless, to ensure that policy is free to allow automatic stabilisers to operate – and in particular to avoid a fiscal stimulus to demand at times when, as at present in the Baltics, credit growth is strong.
86 These are Estonia, Lithuania and Slovenia.

30
While policy-makers can feel considerable confidence about the present robustness of their economies, the strong real and financial convergence ahead carries inherent risks. Experience in emerging market economies points to the potential stresses that can emerge as financial systems expand in an open capital account setting. Experience in some central European economies has already illustrated the scope for financial market exuberance to drive risk premia on external debt and domestic instruments to levels lower than warranted by fundamentals. Under such circumstances, strong inflows, rapid credit growth, and buoyant asset prices can lead to a cycle of real appreciation – and potential stresses when expectations at some point reverse. The new Member States in the Baltics and central Europe need to guard against such a cycle – given the setting of positive credit supply shocks, rising permanent income expectations, and open capital accounts.
Policy challenges
Overall, abstracting from sizable variations across the new Member States, policy-makers have made good progress in establishing stable macroeconomic frameworks, conducive to growth. Looking ahead, macroeconomic policies will remain a key focus of attention in connection with potential euro-area membership. At least in those new Member States contemplating a concrete schedule for introducing the euro, policy-makers will need to set their priorities so as to achieve the nominal convergence criteria set by the Maastricht treaty.
Where inflation has come down markedly, it will be crucial to keep it at a low level. The still high variability of inflation indicates that inflation expectations might not yet have followed the downward trend in actual inflation. Therefore, inflation surprises will challenge monetary authorities. On the one hand, ERM II could provide an external anchor for the credibility of monetary policy. On the other hand, catch-up in price levels, wages and growth may cause temporarily higher rates of inflation in some of the countries. In these cases, keeping the option of a more flexible adjustment of exchange rates for some time could be conducive to securing external competitiveness.
Budgetary deficits in most new Member States are still much higher than the 3 per cent benchmark enshrined in the Treaty. The experience of some of the current euro-area Member States taught that stringent budgetary consolidation can bring deficits down quite quickly. The new Member States, however, differ in two important respects. First, they are faced with the need to build up and modernise their infrastructure. However, public investment does not necessarily need to be financed by budget deficits. Second, economic restructuring is an ongoing process in the new Member States and may require the use of public spending to cushion adjustment costs by compensating the losers of structural change and economic reforms.
Fiscal discipline facilitates the task of monetary authorities in keeping inflation under control. Some even argue that it represents a pre-condition for accomplishing price stability on a sustainable basis. In this respect, the tensions to which public finances in new Member States are exposed, with the objective of consolidating deficits below the 3 per cent ceiling on the one hand and improving infrastructure and social cohesion on the other hand, are a crucial challenge. Moreover, still high public deficits and outstanding spending necessities also warrant a tone of caution on whether the above painted snapshot of the favourable structures of public revenues is lasting. Unsustainable public finances can mean crowding-out effects and distortive taxation in the future.
Regarding external and financial stability, the striking success of policy-makers in navigating the uncharted waters of transition over the past decade has left these economies well-braced against external or financial sector stresses. Nonetheless, the period ahead will bring new challenges. To safeguard external and financial stability, attention needs to be paid to the interaction of monetary, prudential and fiscal policy regimes, and to the ways in which these may influence the risk behaviour in the private sector. And in particular, as the private sector enters a phase of strong expansion, the design of fiscal policy can play an important supporting role in ensuring that imbalances are limited and that private sector confidence is maintained.
3.2.3 Institutional quality
There is a growing emphasis in the economic literature on the role of institutions for long-term economic developments. The IMF and the World Bank are increasingly focusing on the role of institutions in their strategies of macroeconomic stabilisation and poverty reduction.87 In Europe, the most prominent example of attention given to the quality of institutions are the so-called Copenhagen criteria (political, economic and legislative) which candidate countries have to fulfil in order to become members of the EU.
In general, institutions are defined as the "rules of the game" which can be formal and informal rules, enforcement mechanisms and organisations.88 Policies should aim at efficient institutions by ensuring the rule of law in order to avoid unclear property rights, providing a well-functioning administration and integrating markets by reducing trade costs. Hence, the public sector has a crucial role to play in providing the conditions for a functioning market economy by guaranteeing the exclusivity of private property rights, in particular by fighting crime and corruption, and by reducing the costs of trading property rights, in
87 For a more extensive overview of how institutions and political factors impact on economic growth, see IMF (2003a) and Borner et al. (2004).
88 See North (1990).

31
particular through the provision of macroeconomic stability, good infrastructure, clear legal procedures for the enforcement of contracts etc. Efficient institutions are essential for economic development since they provide incentives for private agents to fully benefit from the investment and production of goods and to trade them with those who value them most. Furthermore, without well-defined private property rights, financial intermediation of savings and investment and hence the accumulation of capital do not function smoothly due to a lack of collateral.89
A fundamental problem for both theoretical analysis and empirical research on institutional economics is endogeneity or the direction of causality, i.e. whether income is high because of good institutions or whether institutions are good because a high-income country can better afford to have them.90 Empirical research in this area is quite recent and has only become possible after different researchers and institutions had compiled data on institutions and governance across countries, which has allowed for the empirical backing of the importance of institutions for economic activity.
The most comprehensive database on institutions and governance currently available has been established by the World Bank. It covers six different variables for governance for 199 countries (including the new Member States) and observations for four points in time (1996, 1998, 2000 and 2002). The raw data is from surveys and opinion polls carried out by various different organisations (international organisation, risk-rating agencies, think-tanks, NGOs).91 The main variables, of which some are apparently more of importance for developing countries rather than for the EU, are voice and accountability, political stability and absence of violence, government effectiveness, regulatory quality, rule of law, and control of corruption.
Despite the progress made in data collection on the quality of institutions, this data is not without problems and results should be regarded with a certain caution. For instance, it is well known that institutions are context-specific because they develop on a longer-term historical and cultural background. It is also questionable whether the legal characteristics are sufficient to describe the actual impact of institutions. A
89 See Bassanini et al. (2001, Annex) or Romer (2001, Chapter 3.11) for two alternative approaches how institutions could be integrated in traditional growth models.
90 Taking corruption as an example it is both difficult to imagine that a country with a high degree of corruption can achieve a high level of income given the disincentives to invest and that a poor country could afford public service wages that are sufficiently high to reduce the incentive to take bribes. Moreover, due to a less developed system of control and justice, the risk of being discovered or sanctioned for taking or giving bribes may be lower.
91 A detailed explanation of data and methodology is given in Kaufman and Kray and Mastruzzi (2003). The data itself is published on the World Bank website.
solution is that most of the empirical measures for institutional quality tend to be based on opinion polls and expert surveys about the data. The advantage is that it reflects economic actors’ perception of the actual institutional quality rather than the legal or social norms that govern institutions.92
In spite of these data problems, the empirical results are very robust. The main outstanding question from this line of research is not whether institutions are important for growth but how important they are. While some authors conclude that “the quality of institutions trumps everything else” others consider geographical variables as equally important and stress the interaction between “institutions, policies and geography”.93 Applying the IMF (2003a) methodology to the World Bank data for the EU Member States, candidate countries and other industrial economies, shows the expected positive relationship between the quality of institutions and GDP per capita (Graph 21). Here, the quality of institutions is able to explain about two third of cross-country variation in growth. By adding further control variables, the more sophisticated econometric approach used in IMF (2003a) is able to explain three fourth of the variations in cross-country growth regressions. It also
Graph 21: GDP level and the quality of institutions, industrial economies
y = 14.147x + 4.7983R2 = 0.6634
2.57.5
12.517.522.527.532.537.542.547.552.5
1 1.2 1.4 1.6 1.8 2Average of institution indicator
GDP
per c
apita
Source: World Bank, IMF, Commission services.
92 A potential drawback of this approach is that survey results could be culturally biased, which reduces the extent to which policy recommendations can be drawn from cross-country analyses or case studies. Kaufmann et al. (2003), who built up a data set for the World Bank, found little evidence of ideological biases in the assessment of corruption in the surveys.
93 See Rodrick et al. (2002) for the first and Sachs (2003) for the latter quote. Easterly and Levine (2003) find that institutions matter most for the long-term level of income whereas geography and policies do not if their effects on institutions are controlled for. Dollar and Kraay (2003) give evidence of a strong effect of trade on growth and a much smaller role for improvements in institutions.

32
finds that improving the institutional quality by 1 standard deviation would raise GDP per capita by 1.4 percentage point.
Identifying the institutions that have the largest impact on economic activity is difficult. The first column in the table below displays that coefficients of correlation with the World Bank indices of institutions are all high, except for the one that captures political stability. Moreover, each indicator is strongly correlated with the other indicators, again with the exception of political stability. This probably reflects the importance of interactions among institutions, i.e. good institutions in one field are supportive to the quality of institutions in another field.
Table 10: Correlation of institutional variables with GDP level (2002, PPS)
35 ind. countries 25 EU MS
Voice and accountability 0.77 0.59 Political stability 0.48 0.28 Government effectiveness 0.87 0.73 Regulatory control 0.79 0.66 Rule of law 0.88 0.72 Control of corruption 0.85 0.70
Source: IMF, World Bank, Commission services.
The situation in the new Member States
Eight of the ten new Member States underwent the transition from a central planning to a market economy within a very short time. They experienced an immense deterioration in living standards in the early phase of transition which the economic literature often attributes to the “institutional collapse”, in particular the lack of market-oriented legal structures.94 It is now tempting to relate the strong growth, which some of the new Member States witnessed over the past years, to their progress with institutional reforms. Although the imprecision of measurement described above requires some caution in cross-country comparisons of institutional variables, it allows a broad snapshot of the perception of how efficient institutions work in the new Member States relative to the EU-15.
While the average is lower for the new Member States than for the EU-15 in all categories and particularly lower for the three sub-indicators of effectiveness of governments, rule of law and control of corruption, there is at least one new Member State in each category that performs better than the lowest ranked Member State in the EU-15. It is also apparent that the gap between the EU-15 average and the new Member States is particularly large in those categories where the EU-15 has a high rank, i.e. performs especially well relative to
94 For an overview of the economics of transition, see Campos and Coricelli (2002), Svenjar (2002) and, for a review of the determinants of enterprise restructuring during transition, Djankov and Murrell (2002).
the rest of the world. The gap between East and West is lowest for the sub-indicator of political stability, which, according to Table 11, has the smallest relevance for economic activity and quality of other institutions, respectively.
An advantage of the World Bank data set is that it allows tracing developments over time, although only for a small period. Whereas institutions are usually seen as rather invariant over time, this might not be true for the new Member States, which had undergone huge political, economic and social transformation in the 1990s. Since the indicators of institutional quality are derived from experts’ or citizens’ perception of the institutions and this perception can reasonably be expected to adjust with a lag to actual improvements in quality, it could be telling to consider the improvements measured between 1996 and 2002.95 Given the kind of measurement, all improvements in the indicators are not in absolute terms but relative to all the other countries in the panel.
Graph 23 illustrates the enormous progress the new Member States made. Between 1996 and 2002 they were able to improve the quality of their institutions - as assessed by citizens and experts - by 0.3 standard deviations. Assuming, for both simplicity and illustration, that the convergence process is linear and
Graph 22: Quality of institutions in the old and new Member States, 2002
00.20.40.60.8
11.21.41.61.8
Voice and accountabili ty
Political st
ability
Government effectiveness
Regulatory quality
Rule of law
Control for co
rruption
EU-15 avgAC-10 avg
Note: The graph shows the average of EU-15 and AC-10. The scale is expressed in standard deviations with zero being the average of 198 countries. Source: World Bank.
95 For the sample of all countries, there is no evidence that there could be a negative relationship between the quality of institutions in 1996 and the improvement in the quality between 1996 and 2002.

33
Graph 23: Catch up of institutional quality to EU-15 Change 1996-2002 in % of the gap to EU-15 in 1996
0 10 20 30 40 50 60 70 80 90
Voice and accountability
Political stability
Government effectiveness
Regulatory quality
Rule of law
Control for corruption
% of gap in 1996 to EU-15
0 0.1 0.2 0.3 0.4 0.5 0.6Standard deviations
Relative to gap to EU-15 in 1996 in % (lower scale) Absolute catch up in s.d. (upper scale) Source: Commission services.
that the trend continues in the years ahead at same speed, the gap to the EU-15 would be closed in 12 to 15 years.96
When translated into terms of the gap to the EU-15, the improvement in the perceived quality of institutions means that more than 70 per cent of the gap in 1996 was closed between 1996 and 2002 for the sub-indicators of political stability and regulatory quality. Somewhat less assuring is the observation that catch-up has been more limited in government effectiveness, rule of law and especially control for corruption. These are categories where the EU-15 fares very well compared to the rest of the world as evidenced by a high level of these indicators in the EU-15 Member States.97 This somewhat puts into perspective the observation of less progress made in the new Member States.
Taking the IMF estimates quoted above at face value, this improvement of the institutional quality by 0.3 points has contributed to raising average annual GDP growth in the new Member States by 0.4 percentage points. Applying a more simplistic view, Graph 24 relates the variations in the improvement in institutional quality across the new Member States to their average growth performance 1996-2002. While the slope is positive, it is borderline significant at the 10 per cent level. The graph shows that the observation for Malta apparently interferes with the stronger relationship
96 In another project on indicators of “Doing Business”
including 145 countries, the World Bank (2004) notes the reform progress in 2003 of Poland, Lithuania and Slovakia which brought the latter two countries into the top 20 economies on the ease of doing business.
97 It should be noted, however, that the US records a still slightly better assessment of their quality in the institutions in these three categories, though the distance is small.
Graph 24: GDP growth and the improvement in institutional quality in the new Member States
CZ
EE
CY
LV
LT
HU
MT
PL SI SK
y = 4.5036x + 2.7345R2 = 0.2625
0
1
2
3
4
5
6
7
8
0 0.1 0.2 0.3 0.4 0.5 0.6 0.7Improvement in the quality of institutions 1996-2002, sd
real G
DP gr
owth
1996
-2002
; avg
% p.
a.
Source: Commission services. visible for the other nine new Member States. Excluding Malta from the sample would yield a significant relationship that suggests growth gains from the improvements in institutions far higher than calculated by the IMF researchers.
In a panel of the ten Member States and the six sub-categories for the quality of institutions, the improvement of only two sub-categories displays a strong positive correlation with GDP growth. These are the effectiveness of government (0.85) and control of corruption (0.74). Cross-country variations in the other variables are not correlated with differences in the growth performance across the new Member States or, very surprisingly, even weakly negative for the case of improvements in regulatory control. This might be due to the time lags with which improvements in regulation usually impact on economic activity.98
When analysing how the new Member States managed to improve the quality of their institutions, the literature unanimously points to the role of EU integration.99 In this context, at least three factors were important. First, accession to the EU required the adoption of the acquis communautaire, i.e. the direct import of legislation that has advanced integration between the old EU Member States. EU pre-accession funding from the Phare instrument spent considerable amounts on institution-building to help achieving the accession criteria (see Box 1). Secondly, the accession process provided an external anchor for policy makers’ constraints and incentives, which helped overcoming domestic obstacles to reform. Thirdly and related, the path towards EU accession brought to the fore the importance of
98 According to the literature on the credibility of monetary policy, which can be applied to this case, the track record is a more important determinant of reputation than announcements. It is therefore reasonable to expect changes in the perception of the quality of institutions to materialise with a lag only.
99 For a review, see IMF (2003a), Box 3.2.

34
stimulating openness, competition and an administrative environment supportive to business activity.
While the path towards EU accession seems to have favourably impacted on institutions and economic performance, it remains to be seen which factors could stimulate further progress in the quality of institutions. In this context, economic surveillance within the EU could play an important role, substituting the external anchor of EU accession by the one of peer pressure and best practices. IMF (2003a) points to some fundamental factors that have proven conducive to institutional reform. These are openness to trade, stronger competition, information and higher transparency. Ownership of and commitment to reforms are considered overriding determinants of progress with the quality of institutions.
Policy challenges
The available literature points to a strong link between the quality of institutions and catching-up or GDP per capita levels. For a number of indicators of institutional quality and in spite of impressive progress between 1996 and 2002, the new Member States still have considerable gaps compared to most old Member States, in particular with a view to the efficiency of public administration and judiciary. The preparation for EU accession as an external anchor is the most frequently used explanation for the progress in institutional reforms in the new Member States (see Box 1).
Further progress in reforming institutions will be of major importance for the new Member States’ process of catching-up. To the extent that it is difficult to carry out institutional reforms on a purely domestic political basis, the disappearance of the EU membership “carrot” prompts a question whether comparable new external anchors have become available after accession. Mechanisms of Community law and of economic policy coordination could be thought of as possible substitutes after accession. However, the Treaty is relatively silent on what is considered here as institutions and mostly based on co-operation between Member States rather than on Community procedures. Economic policy coordination addresses issues of institutional quality only marginally when it comes to assessing the progress
in structural reforms (“Cardiff process”) in the context of the business environment. Sanctioning mechanisms here are relatively weak and mainly based on exchange of best practice and peer pressure.
It could therefore be useful to reflect how to reinforce mechanisms at the EU level which could serve as external anchors, to help further improve the quality of institutions in the new Member States. A first option could be to widen the scope of monitoring structural reforms to aspects covering institutional quality. A second option is to use existing instruments in the EU cohesion policies to reorient them to the performance of institutions or the implementation of recommendations in that area. Finally, spending on institution-building, as under the pre-accession instrument Phare, should also have more importance in Structural Funds programmes.
It would seem preferable to implement the link between institutions and EU policies as an incentive to make further progress, and as an attempt to improve the efficiency of EU funding - not as a sanction. The most difficult part will be to agree on indicators for the quality of institutions which are not contestable and based on sound methodology. When implementing recommendations to improve the quality of their institutions, Member States should be able to make use of the important function of the EU as an external anchor which allows more courageous reforms than mere within-country political forces would do. However, it should be taken care that the focus should only be on the "function" and not on the "form" of institutions (Rodrik et al. 2002) since there is broad agreement in the literature that universally good institutions do not exist. Institutions are context-specific and therefore depending on the historical, cultural and political background of a country or region. When building institutions, norms and culture as well as existing institutions need to be taken into account. Therefore, the World Bank (2002) holds that "best practice in institutional design is a flawed concept" and suggests four key approaches to institution-building: complement what exists, innovate to identify institutions that work, connect communities through information flows and trade, and promote competition.
Box 1: Institution-building in the pre-accession process
The Copenhagen European Council in June 1993 concluded that “membership requires that the candidate country has achieved stability of institutions guaranteeing democracy, the rule of law, human rights and respect for and protection of minorities, the existence of a functioning market economy as well as the capacity to cope with competitive pressure and market forces within the Union. Membership presupposes the candidate's ability to take on the obligations of membership including adherence to the aims of political, economic and monetary union.” Since 1998 the European Commission publishes annually a Regular Report on each candidate country’s progress towards accession to provide an assessment of progress in meeting these political, economic and acquis criteria for accession.
Regarding the economic criteria, the existence of a functioning market economy requires that prices, as well as trade, are liberalised and that an enforceable legal system, including property rights, is in place. Macroeconomic stability and consensus about economic policy enhance the performance of a market economy. A well-developed financial sector and the absence of any significant barriers to market entry and exit improve the efficiency of the economy. The capacity to cope with competitive pressure and market forces within the Union depends on the existence of a market economy and a stable macroeconomic

35
framework, allowing economic agents to make decisions in a climate of predictability. It also requires a sufficient amount of human and physical capital, including infrastructure. State enterprises need to be restructured and all enterprises need to invest to improve their efficiency. Furthermore, the more access enterprises have to outside finance and the more successful they are at restructuring and innovating, the greater will be their capacity to adapt. Overall, an economy will be better able to take on the obligations of membership the higher the degree of economic integration it achieves with the Union before accession. Both the volume and the range of products traded with EU Member States provide evidence of such integration.
With the objective of supporting the achievement of the Copenhagen criteria, the Commission regularly adopts "Accession Partnerships" which provide an assessment of the priority areas in which the candidate country needs to make progress in order to prepare for accession and on the basis of which "National Programmes for the Adoption of the Acquis" provide a single framework for the programming of the EU pre-accession financial instruments. These include the "Phare" Programme to finance institution-building and for investment to help adopt the acquis, "ISPA" for the financing of large infrastructure projects in transport and environment sectors, and "SAPARD" to support agricultural and rural development. Community assistance for financing projects through these three pre-accession instruments is conditional on respect of commitments under the Europe Agreements, further steps towards satisfying the Copenhagen criteria and progress in meeting the specific priorities of the Accession Partnership. The financial framework 2000-2006 makes available €3.12 billion (in 1999 prices) per year for all three financial instruments of which about half is spent on Phare projects. The main objectives of Phare are to strengthen their public administrations and institutions to function effectively inside the Union, to promote convergence with the European Community’s extensive legislation and reduce the need for transition periods, as well as to promote economic and social cohesion (also to prepare the transition to Structural Funds). Around 70 per cent of Phare resources are allocated for investment in the regulatory framework and for economic and social cohesion, while approximately 30 per cent is being used to meet institution-building needs.
4. What can be the contribution from EU cohesion policy?
The EU spends about one third of its budget on supporting cohesion by assisting Member States and their regions in efforts to promote catching-up (see Box 2). Though the policy has a distributive dimension, evidenced by significant net transfers to the poorer Member States, it aims primarily to enhance efficiency and growth. The goal of the Structural and Cohesion Funds is precisely to support the main determinants of catching-up highlighted above in Section 3. A number of questions will help to identify the potential contribution of EU funds to the catching-up of the new Member States: Have Structural Funds contributed to real convergence in Europe? What are the conditions under which they have an impact on growth and employment? How will and how should Structural Funds be changed?
4.1 Evidence of structural funds impact Some authors have criticised the Structural Funds as having - if any - only a marginal impact on real convergence in Europe.100 However, most of these studies use growth regressions subject to methodological, econometric and data weaknesses. Moreover, the role of the Structural Funds is, in essence, to co-finance investments in physical and human capital, using financial means coming mainly from other economies. EU regional policy should therefore be expected to have a positive impact on growth and employment in the recipient regions and Member States.
Standard growth regressions testing for absolute or conditional ß-convergence cannot as such provide any evidence on the impact and effectiveness of the EU
100 See e. g. Boldrin and Canova (2001), Ederveen and Gorter (2002) or Midelfart (2004).
cohesion policy. No causality can be inferred from either the occurrence or the lack of convergence or from its speed which may result from many economic, social and policy factors other than the EU assistance.
Two main methods have thus been adopted to assess the direct effect of the EU cohesion policy: model simulations and econometric growth regressions incorporating the amount of cohesion funding as an explanatory variable among other variables.
A variety of macroeconomic models, based on different theoretical foundations, have been used to assess the impact of the Structural Funds. The Commission mainly relies on two combined demand-side and supply-side models, QUEST II and Hermin. 101
101 For other models see e.g. Pereira (1994) or Bourguignon,
Lolos and Zonzilos (1995). A complementary approach used by the Commission is a predominantly demand-side model based on input-output techniques allowing to assess how Structural Funds expenditures affect the structure and level of final demand including investment and induce changes in imports, value-added, labour and capital use. See Beutel (2002).

36
Box 2: What is the EU cohesion policy?
In the less developed regions of the EU (“Objective 1”), the EU Structural Funds co-finance programmes in the fields of physical infrastructure, human resources development as well as aid to the private sector. Structural Funds also support the conversion of areas facing structural difficulties ("Objective 2") and policies and systems of education, training and employment outside Objective 1 regions ("Objective 3"). For the EU-15 in the period 2000 to 2006, about 70 per cent of the €195 billion (at 1999 prices) are allocated to Objective 1 regions. In the so-called "cohesion countries" (Greece, Spain, Portugal and, until 2003, Ireland), whose gross national income per capita is below 90 per cent of the EU average, the EU Cohesion Fund finances projects on the environment and on trans-European transport networks and has a volume of €18 billion (at 1999 prices) in the period 2000 to 2006. The Structural Funds and Cohesion Fund together have a certain macroeconomic importance in some countries, peaking at levels of around 3 per cent of GDP in Greece and Portugal at the end of the 1990s. The European Council meeting in Copenhagen in December 2002 decided, and this was later inserted into the Accession Treaty and implemented in programmes, that the 10 Acceding Countries would benefit from €14.2 billion of Structural Funds and €7.6 billion of Cohesion Fund (at 1999 prices) from 2004 to 2006. In addition, a transitional sub-heading on institution-building measures of €380 million has also been agreed. The draft Framework Regulation for the new programming period starting in 2007, adopted by the European Commission in July 2004, aims at reinforcing the financial focus on real convergence, thematic concentration and further simplifying the management systems.
QUEST II embodies a neo-classical-Keynesian synthesis. While in the short run the model is influenced by standard Keynesian features, the behavioural equations are based on microeconomic principles of intertemporal optimising behaviour of households and firms and the supply side of the economy is modelled explicitly via a neo-classical production function.102
Hermin is basically a neo-Keynesian model with some neo-classical features in the supply-side.103 The model
102 Real interest and exchange rates are determined endogenously. Thus, the initial positive effect of the cohesion policy through an increase in the public capital stock may be reduced by a temporary crowding-out of private investment. In the longer run, the increase in GDP is higher than the induced short term demand effect due to positive supply-side effects which continue beyond the period of aid payments. For a description of the model, see Roeger and in’t Veld (1997).
103 Two sectors are modelled behaviourally: a tradable sector (manufacturing) and a non-tradable sector (market services). Output is primarily driven by world demand and cost and price competitiveness in the former and by final demand in the latter. Wages are determined in the traded sector in a bargaining model and are sensitive to the tax wedge, unemployment and productivity. Expectations are auto-regressive and interest and exchange rates are exogenous to the model. For a description of the model, see Bradley et al. (1995).
attempts to capture the effect of public investment by incorporating the beneficial externalities associated with increased stocks of infrastructure and human capital. The elasticities used are taken from existing empirical studies.
The Hermin results of the ex-post evaluation for the last programming period (1994-1999) identify their continuing supply-side effects by assuming that funding terminates after the programming period. The results for the cohesion countries (see Graph 25) range from a relatively modest long-term impact in the cases of Greece and Spain to a real GDP level in Portugal that is more than 2 per cent higher in 2010 than in the absence of Structural Funds and national co-financing, both ending in 2000 according to the assumption made for the calculation.
The results of the ex-ante macroeconomic evaluations for the new Member States are not easily comparable as the applied methodologies are heterogeneous. However, they also show a substantial impact. In Poland, for example, according to the Hermin model’s impact assessment, real GDP would be higher in 2010 by approximately 1 per cent due to the support provided in the period 2004 to 2006.

37
Graph 25: Impact of the European regional policy, programming period 1994-99
0
0.5
1
1.5
2
2.5
3
3.5
4
4.5
5
1993 1995 1997 1999 2001 2003 2005 2007 2009
Greece ExpenditureGreece GDP
0
0.5
1
1.5
2
2.5
3
3.5
4
4.5
5
1993 1995 1997 1999 2001 2003 2005 2007 2009
Ireland Expenditure
Ireland GDP
0
0.5
1
1.5
2
2.5
3
3.5
4
4.5
5
1993 1995 1997 1999 2001 2003 2005 2007 2009
Spain ExpenditureSpain GDP
0
0.5
1
1.5
2
2.5
3
3.5
4
4.5
5
1993 1995 1997 1999 2001 2003 2005 2007 2009
Portugal ExpenditurePortugal GDP
Note: Bars: CSF expenditure as percentage of GDP of the programming period 1994 – 1999, i.e. under the assumption of ending support in 2000; lines: CSF induced change of GDP level against baseline in percent. Source: European Commission 2003d.
Model simulations all conclude that cohesion support contributes significantly to growth and employment at national and, when analysed, at regional level. The magnitude of the impact may vary depending on the model specifications, the economy’s characteristics, the amount of assistance and the types of public investments targeted. Modelling has two main advantages. It shows how the policy affects the demand and supply sides of the domestic economy depending on a wide range of other factors and allows for a counterfactual (i.e. without policy) situation. On the other hand, simulations tend to assume that cohesion support is fully turned into productive public investment, overlooking possible weaknesses in policy delivery. They may thus assess the potential rather than the actual impact of the cohesion policy.104
Econometric regressions would be expected to give a better “ex-post” assessment. However, attempts to link national and regional GDP or productivity growth to cohesion assistance are plagued with methodological, econometric and data weaknesses. No structural model
104 See Ederveen et al. (2002).
of such a complex mechanism as growth can be represented by a single equation linking the former to one variable i.e. the amount of Structural Funds transfers as done in Boldrin and Canova (2001) or two variables if initial income per capita is also considered. Such regressions are not exempt from econometric problems. For instance, since the beneficiaries of EU cohesion policy are poor economies, the amount of EU assistance works as a proxy for the omitted variables that presumably explain why they have below average incomes.105 As a result, the estimated coefficient on the volume of aid is negative while the inclusion of additional variables in the equation, even in a simple form, leads to a positive impact of EU assistance on growth. 106
105 See de la Fuente (2003). 106 This is illustrated by Ederveen et al. (2001) Their results, at
NUTS II regional level for the period 1981-1996, suggest a negative impact of the cohesion policy when other factors than initial productivity and cohesion support are not controlled for. When they are, the estimated impact is positive and significant. An additional amount of cohesion

38
In other words, imposing the assumption of absolute convergence creates a downward bias on the estimated impact of cohesion support while it can be significant and positive if convergence is only conditional, which seems to be the consensus view today.
In addition, such regressions, when performed at regional (NUTS II) level, are faced with acute problems of data availability and reliability. Not only is the bulk of cohesion support national or transregional and thus difficult to attribute to regions. But available statistics hardly allow controlling for other factors that can influence growth.
Against this background, results have to be considered with caution as they are very sensitive to the different methods, time periods and data sets on which they are based. With few exceptions,107 most econometric studies tend to find a significantly positive effect of cohesion support on national growth and convergence.108 At the regional level, across the EU and in some case within countries, many studies also identify a positive impact.109
In addition to their impact on growth and convergence, the implementation methods of Structural Funds have an effect on governance, i.e. they improve the efficiency of public administration and public expenditure:
• The bottom-up approach and the partnership principle between all actors involved allow programmes to better reflect the real needs in the regions.
• The set-up of an integrated development strategy in a multi-annual framework enforces the planning capacity and strategic thinking for regional development.110
• The introduction or strengthening of the monitoring and evaluation culture leads to a more efficient selection of projects and a better targeting of spending.111
• Rules on financial management and control help to improve the quality and efficiency of public administration.112
• Inter-regional and international exchange of good practices for regional policy can be a helpful tool
support of 1 per cent of GDP leads to an annual increase in GDP per capita of 0.7 per cent.
107 See e.g. Ederveen and Goerter (2002). 108 See e.g. Bosca et al. (1999); Garcia Solanes and Maria
Dolores (2001); Beugelsdijk and Eijffinger (2003). 109 See e.g. Fayolle and Lecuyer (2000); Garcia Solanes
(2001); de la Fuente (2003), although some do not find a positive impact such as Boldrin and Canova (2001); Basile et al. (2002).
110 See e.g. Fitzgerald (1999). 111 See Fitzgerald (1999) and Barry (2003). 112 See Barca (2003).
for better targeting and a more efficient regional policy.
EU Structural Funds can thus have an important impact not only on the efficiency of regional policy, but also on national administration and overall public spending in the corresponding Member States.
4.2 Conditions for maximising the impact Several of the above mentioned studies give also interesting insights on the conditions that can affect the effectiveness of EU cohesion policy. If public investment has an impact on productivity and growth and a leverage rather than a crowding-out effect on private investment, EU cohesion policy can be expected under both the neo-classical and the endogenous growth models to be effective since it adds to physical and human capital stocks and promotes technological progress. There is nevertheless a range of factors that could hamper such effectiveness. Some factors may go beyond the control of policy-makers. Others, such as domestic policies and the design of the development strategy co-financed by the EU may, however, be targeted for improvement.
In view of the very limited budgetary means of EU cohesion policy, representing less than 0.5 per cent of the EU-15 GDP, the following conditions can be identified to be important for a significant impact: First, sound and supportive national policies, including macroeconomic policies, national regional policies and good governance, are an essential precondition for the achievement of a real impact. Second, the scarce financial means must be concentrated spatially, i.e. on the poorest Member States and regions, and two issues have to be considered: (a) whether to concentrate on national growth or on equalising living conditions across the country and (b) whether to focus on growth poles and cluster or target more dispersion of economic activity. Third, the strategic design of Structural Funds programmes must allow for a concentration on those types of expenditures most likely leading to growth and employment. Fourth, ways have to be found to achieve the most effective use of EU Structural Funds.
4.2.1 The role of national policies
Since the effects of Structural Funds depend to a large extent on triggering additional private investment, a sound and supportive national economic and political environment can be regarded as a necessary condition for maximising the impact of Structural Funds. In this context, the importance of the national political environment has three main aspects:
• Macroeconomic and regulatory framework,
• National regional policies, and
• Governance including the administrative capacity.

39
In the general and country-specific recommendations of the Broad Economic Policy Guidelines (BEPGs) several countries have also been given specific recommendations concerning their regional labour market. In particular, measures allowing wages to better reflect productivity and skill differentials would facilitate the attraction of investment flows into higher unemployment areas. However, the 2004 report on the implementation of the 2003-2005 BEPGs indicates that progress made by the EU-15 Member States remains insufficient and uneven.
Empirical studies show that a sound economic-political environment not only increases the growth and employment perspectives of the corresponding country and its regions, but is also crucial for the effectiveness of international support. Based on an econometric analysis including a set of policy indicators into a neoclassical growth model, Burnside and Dollar (2000) find that “aid has a positive impact on growth in developing countries with good fiscal, monetary, and trade policies but has little effect in the presence of poor policies”, concluding that “aid would be more effective if it were more systematically conditioned on good policies” (p. 847). While EU Member States are not comparable with the developing countries analysed, the underlying idea remains valid and is supported by other empirical studies. Drawing on Burnside and Dollar (2000), Ederveen et al. (2002) perform cross-country regressions with panel data for 13 EU countries and 7 year-periods from 1960 to 1995, based on a standard neo-classical growth model as introduced by Mankiw, Romer and Weil (1992). Testing only part of the Structural Funds, they find a non-significant impact. The result is markedly different when they introduce a variable that proxies openness; the interaction is significantly positive. Similar results are obtained with some variables which proxy the institutional context, namely a corruption perception index and an index of institutional quality. These results, in line with previous studies on the determinants of long-term growth, tend to confirm that the effectiveness of the cohesion policy is highly dependent on the growth-orientation of national policies.
EU Structural Funds have to a certain extent internalised some of the implications: First, the payments of the Cohesion Fund are conditional upon sound public finances. Second, a reference to the key role of national policies for the impact of Structural Funds has been introduced, in particular, in the programming documents 2004-2006 for the new Member States. These include, inter alia, macroeconomic stability, the continuation of privatisation and restructuring, a reduction and re-orientation of state aid, the implementation of mechanisms reducing labour costs and improving flexibility (and mobility) in the labour market. They can translate into concrete requirements e.g. on the pursuit of labour market reforms including the obligation to report to the Commission on progress and results.
Besides the macroeconomic environment, an effective national regional policy is needed for the achievement of
real convergence between European regions. Regional policy instruments used by the Member States can be classified mainly into two categories: on the one hand instruments with a rather redistributive character, aiming at an equalisation of public finance resources or living conditions among regions; on the other hand pro-active policy measures aiming at achieving economic development in the poorest regions. However, even if a “tendency for the policy focus to shift to wealth creation from wealth distribution” can be observed,113 national regional policies, if compared with the pro-active design of EU Structural Funds, are still rather redistributive in nature (for a discussion on the investment mix of Structural Funds see Section 4.2.3). In Germany, for example, estimates on the gross transfer to eastern Germany arrive at € 116 billion in 2003 and net transfers representing nearly one third of eastern German GDP. The main part of these transfers is redistributive as transfers via the social security system or unconditional grants represent 45 per cent and 21 per cent of gross transfers respectively. In contrast, only 9 per cent of gross transfers are spent for support to the private sector and 13 per cent for infrastructure investment.114 Also in other Member States like Spain a mix of fiscal transfer schemes and active regional policy exists.115 Active regional national policy has in some Member States shifted its focus from large infrastructure investments and sectoral state aid to selected large enterprises towards more human resource development (HRD) and technological progress related projects.116 Nevertheless, even if expenditures are dedicated to an active regional policy, this does not automatically mean that the projects directly impact on growth and employment.117
A further factor of crucial importance for the impact of Structural Funds is a sound institutional and public administrations environment. One of the expected effects of Structural Funds is the improvement of the administrative capacity due to capacity-building measures and the introduction of corresponding legislations. This is of particular importance to the new Member States as first their institutional quality is in general poorer than in the old Member States (see Section 3.2.3) and second because they still have to adapt to the management system of the Structural Funds as most incumbent Member States have done more than a decade ago. Consequently, guaranteeing a substantial absorption of the Structural Funds can be seen as one of the crucial challenges for the new Member States (see also Section 4.2.4).
113 See Yuill and Wishlade (2001). 114 See Institut für Wirtschaftsforschung Halle (2003). 115 See e.g. Davies and Hallet (2001). 116 See e.g. for Italy IMF (2003a). 117 See e.g. Wurzel (2001); on parallel issues on EU regional
policy see Section 4.2.4.

40
4.2.2 Achieving spatial concentration
For the achievement of a significant impact on convergence in Europe, cohesion policy has in the first place to concentrate its scarce financial means on those regions and Member States most in need. In addition, two strategic decisions have to be made: first, addressing national growth or trying to increase growth in poorer regions; second, trying to support concentration through clusters and growth centres or dispersion of economic activity in areas of slow growth.
Eligibility criteria for Cohesion and Structural Funds try to achieve a spatial focus on those regions and Member States in need. While the Cohesion Fund is supporting Member States having in the reference period a Gross National Income (GNI) per capita in Purchasing Power Standards (PPS) below 90 per cent of the EU, some 65 per cent of Structural Funds (SF) are allocated to the poorest, so-called Objective 1 regions with a GDP per capita in PPS below 75 per cent of the EU average. Over the period 2000 to 2006, Structural funds transfers to EU-15 Objective 1 regions are equivalent to € 127.5 billion at 1999 prices (€18.2 billion p. a.), amounting approximately to 2.3 per cent of GDP in Portugal, 2.2 per cent in Greece and 0.9 per cent in Spain.
Table 11: GDP per capita (EU-15=100) and Structural Funds (all objectives average 2000-2006) in % of GDP
GDP SF EL 67 2.9 PT 71 2.9 ES 84 1.4 IT 100 0.4 DE 100 0.2 FI 104 0.2 FR 105 0.2 UK 105 0.2 SE 106 0.1 BE 107 0.1 AT 112 0.1 NL 113 0.1 DK 115 0.1 IE 118 0.6 LU 194 0.1
Notes: GDP per capita in PPS in relation to the average of the EU-15 in 2001; SF: all Objectives in relation to national GDP by country, 2000-2006.
Source: European Commission (2004c).
Table 11 shows on the one hand that these eligibility criteria have been instrumental in achieving a spatial focus and on the other hand, that at the same time relatively rich countries, well above the EU average, also receive substantial Structural Funds support. This has led to strong criticisms and proposals to grant Structural Funds only to poorer Member States, while comparatively rich Member States should support their
poor regions by own financial means and reduce their contributions to the EU budget accordingly.118
Enlargement has not only increased the diversity within the EU substantially but also the average level of GDP per head has decreased statistically by nearly 10 per cent. Consequently, the need to spatially concentrate Structural Funds has become even more urgent with the accession of ten countries that have income levels below – and often far below - the EU average.
An additional effect of accession is that some regions in EU-15 Member States having a GDP per capita in PPS below the ceiling of 75 per cent surpass this threshold when measured against the EU-25, exclusively due to the inclusion of poorer Member States. On the one hand, it can be argued that their economic situation has not changed through the purely statistical effect and therefore support has to be continued. On the other hand, allocation of scarce financial means requires prioritisation and Structural Funds should favour only the poorest, i.e. nearly exclusively new Member States and their regions.
According to the Kuznets-Williamson hypothesis (see Section 2.3.2) the possibility of an equity/efficiency trade-off exists. Particularly in earlier stages of a country’s catching-up process the maximisation of national growth can be accompanied by a (temporary) rise in regional inequalities as economic growth is driven by only few growth poles. Current experience of the new Member States supports this argument as national growth in these countries seems to be largely localised in the most dynamic areas around the capital cities and other major agglomerations where investment, including public investment, is likely to be more productive.
These findings have implications for regional policy. Namely, consideration should be given to proper sequencing when designing the strategy for EU regional policy by taking into account the differences between the stages of development achieved in the catch-up process. In those countries where the convergence gap is highest, in particular when the territory is completely covered under Objective 1 like in most new Member States, more emphasis should be given to national growth as trying to counteract market forces would be inefficient if not even unsuccessful. In the incumbent Member States, which have already reached an income level which is closer to the EU average, relatively more focus can be given to the reduction of regional income dispersion.
Sequencing and prioritisation have, to some extent, been implemented in the EU-15 cohesion countries. In Ireland, the country with the most impressive growth performance, the main objective since the 1960s has been the maximisation of national growth. It is only
118 See Ederveen et al. (2002), Weise (2002) or Sapir et al.
(2003).

41
towards the end of the 1990s that a specific regional policy has emerged and more emphasis has been given to the reduction of regional inequality. In the other countries and southern Italy a “mixed” but prioritised strategy has been pursued. Structural expenditures have initially been focused on national/interregional measures with specific regional programmes accounting for a small share of total funding. Only from 2000 on there has been a shift towards more regional expenditures, notably in Portugal and southern Italy. Similarly, in the 2004-2006 period, structural expenditures in the new Member States have been mainly focused on national, interregional measures.
Linked to the trade-off between equity and efficiency within a country is the issue of the intra-regional focus of regional policies. According to the New Economic Geography (NEG), enterprises tend to locate in clusters and areas with high purchasing power and close to other enterprises in order to benefit from agglomeration economies. In particular in the new Member States, business activities tend to locate in the most developed areas (see Section 2.3.1).
In this context a strategic decision has to be made between supporting on the one hand the development of clusters and growth poles and therewith increasing overall growth or trying on the other hand to favour the dispersion of economic activities. The latter may be particularly inefficient at early development stages and may run counter to market forces. For instance, the relocation of public enterprises to southern Italy from the 1960s to the mid-1970s with national support under the form of capital grants and wage subsidies did not succeed in attracting small and medium-sized private firms and thus in enlarging the industrial basis in the South. While clusters have developed in the Centre-North, no similar agglomeration effects can be found in the Mezzogiorno. On the other hand, the promotion of clusters has been a major feature of the Irish development strategy since the 1970s and horizontal and vertical linkages between industries and research centres are promoted in Portugal. However, as has been argued by some authors, creating artificially comparative advantages has in most cases proved to have little impact.119 Therefore, regional policy should rather try to build upon existing clusters than try to create new ones.
Dispersion of activities is more an issue in relatively wealthy member states where costs of agglomeration, such as high factor prices, pollution, and congestion tend to overwhelm agglomeration benefits. However, a more complete internalisation of negative externalities through efficient pricing and environmental taxes may be more efficient instruments than regional policy to divert activities towards other areas.
119 See e. g. Midelfart-Knarvik, Overman (2002) and Midelfart
2004).
4.2.3 The strategy and the investment mix
EU regional policy is based on a pro-active, allocative approach which targets the determinants of long-term sustainable growth with the aim of:
• improving the availability of public goods, i.e. mainly basic infrastructure,
• enhancing human capital, and
• improving the business environment for investment and offering investment support.
However, empirical evidence indicates that not all of these investments are equally effective under all circumstances. Rodriguez-Pose and Fratesi (2002) test the design of the development strategies co-financed by the Structural Funds. They regress Structural Funds commitments for each of the four main areas of intervention (infrastructure – business/tourism – human resources – agriculture/rural development) on regional growth in all NUTS 2 and Objective 1 regions for three periods from 1989 to 1999, also taking into account a number of structural variables. They find that agricultural/rural support has a strong immediate effect on growth in Objective 1 regions but this impact vanishes almost immediately and turns negative in later years, suggesting that it fulfils an income support rather than a sustainable development objective. Returns to infrastructure in transport and environment as well as business/tourism are relatively disappointing having little or no short-term or medium-term impact. However, for infrastructure, this result may be due to a too short period to assess its full impact. Human resources, on the other hand, have both short-term and medium-term impacts if some characteristics of the labour market are controlled for. On the whole, regions with a balanced distribution of funds have performed well while those with unbalanced strategies (e.g. emphasis on business support or agricultural/rural preferences) have not. Such results contribute to highlight the importance of adequate regional development strategies.
Consequently, the effectiveness of EU cohesion policy in enhancing productivity growth and employment depends on the national or regional strategy, i.e. the investment mix chosen for co-financing. Evidence on the effectiveness of different types of investment is first discussed before analysing the strategy chosen for Structural Funds support in the old and the new Member States.
Infrastructure projects are one of the main areas of Structural Funds co-financed investment. A relatively abundant literature argues that enhanced endowments in transport infrastructure raise the total factor productivity of all inputs (i.e. via reduced transaction costs for enterprises and also improving workers’ labour mobility) and thus the growth perspectives of regional or national economies. This is supported by evaluations of Structural Funds programmes and numerous empirical

42
studies.120 However, the available empirical evidence is still subject to debate as causality and econometric issues have not been fully clarified. Three main points seem to emerge from the existing literature. First, the provision of transport infrastructure can be regarded as a necessary precondition for economic development, but will not per se solve all problems of lagging regions, especially if they lack adequate factors of production. Second, the returns to such investments are probably high when infrastructure is scarce and basic networks have not been completed but may be decreasing if a certain threshold has been reached.121 This is to be taken into account in the context of EU enlargement, where regions with a substantial lack of infrastructure (in most new Member States) co-exist with regions with higher endowments. Finally, according to the New Economic Geography, infrastructure opening up interregional trade may have the paradoxical effect of concentrating production in the wealthier regions. However, the evidence is quite mixed. Concentration has been highlighted in some cases122 while a positive effect on disadvantaged regions has been evidenced for others.123 Besides transport infrastructure, increasing support is given to environmental infrastructure like waste water treatment plants.
Recent theories of economic growth, in particular the literature on endogenous growth, point to the important role of human capital. The result that economies only grow fast if they have high levels of human capital seems robust both theoretically and empirically.124 However, studies tend to assess human capital at a very aggregate level without precisely defining the mechanisms through which it influences growth. The specific types of educational and training expenditures to be undertaken by policy-makers are thus less clear.
A recent study125 provides policy suggestions, to be adapted to the specific national and regional conditions, in favour of a moderate increase in human capital investment but not in favour of an across-the-board increase in subsidies for post-compulsory education as incentives for individuals to invest are found to be adequate. More important may be the elimination of implicit barriers to access to higher education such as
120 See e.g. Moreno et al. (2002) or Del Mar Salinas-Jiménez
(2004). 121 A non-monotonic relationship between infrastructure and
long-run growth is found e.g. by Bougheas et al. (2000). 122 See Combes and Lafourcade (2001), Faini (1983). 123 See e.g. Martin and Rogers (1995). 124 This is confirmed by cross-country empirical evidence, see
Mankiw, Romer and Weil (1992) and Barro and Lee (1994). Some studies (e.g. Pritchett (1998) or Caselli et al. (1996)) using different (panel data) techniques have questioned the link between education and productivity, but recent investigations explain their negative results by poor data and econometric problems.
125 De la Fuente and Ciccone (2002). See also Chapter 3 in the EU ECONOMY REVIEW 2003.
liquidity constraints and lower basic skills levels among individuals from disadvantaged backgrounds. In addition, guidance on the most productive types of investments include giving technology-related skills to a broad segment of the population, supporting life-long learning and improving conditions for the accumulation of research-related human capital.
Although some part of the Structural Funds are used to co-finance the provision of technical and business services (mainly to SMEs), technology diffusion and more market-based forms of investment financing, the co-financing of direct state aid to enterprises remains a main area of intervention.126 Such aid can have important deadweight, displacement or substitution effects which can question the impact of support and subsequently the effectiveness of EU cohesion policy.127
Evaluations of state aid are relatively scarce. Nevertheless, the extent of such effects has been assessed by some studies, in most cases concluding that only 10 per cent to 20 per cent of the projects are not subject to deadweight.128 There is thus some evidence, though quantitatively limited, that co-financing of state aid may not be the most effective channel for EU cohesion policy. Therefore, EU cohesion policy should be targeted to those investments where deadweight seems lower according to existing studies, namely in start-up companies, in small businesses and for technological upgrading, research and development and human capital training.
Besides these types of investment, support for rural development, mainly for the agricultural sector, is quantitatively important. However, the economic importance of primary agriculture for the economy as a whole is limited. Even in predominantly rural NUTS3 areas within the enlarged EU, the largest part of economic activities stems from service (62 per cent) and industry (32 per cent) activities. In addition, the trends clearly indicate a further decline in the agricultural share in gross value added and employment. Thus, in order to help lagging rural areas, it seems necessary to concentrate the efforts increasingly outside the agricultural sector.
126 However, it is incorrect to assume, EU Structural Funds
would mainly distribute state aid, and conclude, based on this assumption that Structural Funds are ineffective like in Midelfart-Knarvik and Overman 2002 or Midelfart 2004.
127 A deadweight effect is if the enterprise would have invested even without support; a displacement effect is if it would have invested anyway but in a different region and a substitution effect is if a different enterprise would have undertaken the investment.
128 For a literature review incl. a discussion of the methologies applied see Gerling (2002). For empirical studies, applying heterogeneous methodologies and analysing different kinds of aid schemes see e.g. Honohan (1998), Barry (2003) and Lenihan (2004) for Ireland, Arup Economics and Planning (2000) for the UK or Gerling (2002) and Ragnitz (2003) for Germany.

43
The standard measures targeted to the agricultural sector are, furthermore, not exempt from criticism. Early retirement schemes for instance have little proven effects on the restructuring of the sector and run counter to the Community employment strategy by reducing the participation rate. The lump sum support to farmers in rural areas is neither targeted nor supportive to a positive sectoral restructuring. Finally, farm investment support seems not to be implemented efficiently.129
Furthermore, Structural Funds also offer co-financing of projects where the link to economic growth and employment is at least doubtful. For example, a positive impact on regional development will be difficult to find for cultural projects or sport facilities. .
The investment mix in the EU-15 and the new Member States
As the list of eligible expenditures for EU Structural Funds support is long and not all eligible expenditures can be regarded as equally effective, the strategy and main areas of support have to be adapted to the needs of the corresponding Member States and regions. Regional and national authorities present development plans which are then negotiated with the European Commission and adopted as multi-annual programmes.
For the EU-15 Objective 1 regions (see Tables 12 and 13) there is mixed evidence on whether financial support is shifting over time towards investments that are more conducive to growth and employment or not. Using very rough categories and only considering Structural Funds, the share of basic infrastructure has increased in the first years of the current programming period compared with the late 1990s. In contrast, the share of the support for human resource development has been reduced. However, as Table 13 displays, this is not only due to investments in “concrete rather than brain”, but it is also due to a stronger focus on environmental and ICT investments. In addition, Structural Funds can be more easily absorbed by large projects, such as infrastructure investments, than by smaller and more complex projects, such as in the area of human resources.
129 See e.g. studies by Striewe, Loy, Koester (1996), Ebers
(1998) and Forstner and Clemens (1998).
Table 12: Financial allocation of public spending eligible under Objective 1 in % of total
Old MS 1994/99
Old MS 2000/02
New MS 2004/06
INFR 53.8 45.2 58.4
HRD 30.0 36.9 19.8
National
PROD 16.2 17.9 21.8
INFR 40.9 40.1 43.3
HRD 18.2 23.9 24.4
National co-
PROD 40.9 36.0 32.3
INFR 31.8 36.9 44.9
HRD 31.8 28.4 25.8
EU
PROD 36.5 34.7 29.3
Notes: Percentage share of investment area in expenditures on infrastructure (INFR), human resources development (HRD) and aid to the productive sector (PROD), excluding other spending of each source of finance, national eligible expenditure without co-financing, national co-financing and EU funds. Graphs for the new Member States are ex-ante graphs. Calculations based on tables submitted for the verification of additionality of Objective 1 programmes.
Table 13: Financial allocation of EU Structural Funds in EU-15 in % of total
Objective 1 Non-Obj.1
1994-99 2000-06 2000-06 Infrastructure 29.8 41.3 14.1 Transport 15.7 19.8 3.5 ICT 1.6 3.5 1.7 Energy 2.3 1.2 0.4 Environment & water 7.5 12.8 7.5 Health & social inf. 1.7 3.9 0.7 Other 1.1 0 0.3 Human resources 24.5 23.1 53.3 Education 6.9 n/a n/a Training 17.4 n/a n/a Other 0.1 n/a n/a Productive Environment 41 33.8 29.1 Industry and services 19.9 11.3 15.8 RDTI 3.5 6 4.5 Agric./rural dev./ fishery 15.2 13.7 5.1 Tourism 2.4 2.7 3.7 Other 4.6 1.8 3.4
Total 100 100 100
Notes: n/a = not available.
Source: European Commission (2003d).

44
In the recent process of Objective 1 programming for the new Member States, the focus was on the main determinants of higher productivity and, in those countries where the labour market situation is a key challenge, on a rapid improvement in the use of human resources. Growth and employment have thus been the two main criteria against which priorities, investments and measures were selected. The approach was to maximise measures with higher growth and employment potential, promote concentration by avoiding a scattering of resources into numerous small projects, suppress or at least reduce redistributive types of measures and to avoid the creation of distortions in economic activity. Against the background of uneven effectiveness of different investment areas as highlighted by available evidence, the aim was to select both adequate priorities and an effective mix of measures within each priority. This, in turn, has translated into shifts in financial allocations between and within priorities. The major adjustments between priorities in the initially submitted development plans and the finally adopted programmes are illustrated by Table 14 for the largest four new Member States. Even if agriculture is still of major importance for some rural areas in the new Member States, it is questionable if this sector will be a driving force for growth and employment. In contrast, major restructuring and labour adjustment are still needed in some countries which will add to the expected decrease of the share of agriculture in gross value added and employment. Consequently, assistance for agriculture was reduced. The highest reduction was agreed on in the case of Slovakia where the Structural Funds allocation was reduced from 27.7 per cent to 17.6 per cent. As mentioned above, there is no evidence on the contribution to national growth and employment of some regional and local measures such as cultural investment or sport facilities. Therefore, it was agreed with several countries to scale down such programmes. In addition, due to the high deadweight and displacement effects of state aid and because of the already high level of state aid in most new Member States,130 it was in most cases agreed to reduce the support of EU Structural Funds to this area. This resulted, if not counterbalanced by increasing support for the business environment like in the Czech Republic, into a reduction of the competitiveness/enterprises financial allocations like in Poland and Hungary. In contrast, more emphasis was put on infrastructure as this is regarded as a major weakness impeding higher growth in several new Member States. This was particularly the case for Poland where the allocation was increased from 8.6 per cent to 14.1 per cent (excluding regional infrastructure) and for the Slovak Republic from 30.4 per cent to 40.6 per cent (including regional
130 European Commission (2002c).
infrastructure)131 and to a lesser extent for the Czech Republic. Since the development of human resources is key to long-term growth, the allocations to the corresponding programmes were increased both where employment is a major challenge as in Poland and where higher qualifications are called for by the upgrading of economic activity and by the need to activate participation in the labour market as in Hungary.
The final allocations are thus significantly different from the ones of the National Development Plans (see Table 15).132 Even if the graphs on the financial allocation between priorities are not directly comparable,133 they indicate that the higher investment need, compared to the EU-15, in the area of basic infrastructure has been reflected in the programmes and that more emphasis has been given to human resource development.
Table 14: Comparison of the financial allocation in the National Development Plans (NDP) and the
Community Support Frameworks (CSFs)
Priorities /OPs PL HU CZ SK
NDP Competitiveness and enterprises CSF
17.8 15.1
23.3 21.5
15.0 17.9
14.5 14.5
NDP Human resources CSF
17.4 17.8
23.9 28.2
21.0 21.9
27.5 27.3
NDP Agri/food/rural (incl. fishery) CSF
16.8 16.8
18.2 15.9
12.0 12.0
27.7 17.6
NDP Infrastructure*
CSF
8.6 14.1
16.5 16.4
13.5 16.9
30.4 40.6
NDP Regional development CSF
39.2 35.9
17.9 18.0
38.5 31.2
Notes: Figures given in % of total, Cohesion Fund excluded. The figures for the Technical Assistance Priority are not included in the table. *Excluding regional and local infrastructure, except for Slovakia. Calculations based on National Development Plans (NDP) and Community Support Frameworks (CSF).
131 These shares do not include infrastructure like Trans-
European Networks (TENs) financed by the Cohesion Fund.
132 Note that Table 14 gives only a partial picture of the reallocation of funds agreed on between the national authorities in charge and the Commission services as already in the officially submitted NDPs major shifts had been included compared to the preliminary draft plans submitted informally end 2001/early 2002.
133 Programmes with similar objectives are in different countries not identically designed. For example, a major part of the Polish Integrated Regional Development Programme is devoted to infrastructure, largely explaining the differences compared to other new Member States in the percentage shares of the corresponding two Operational Programmes.

45
For competitiveness, not only was EU co-financing of direct state aid reduced. Simultaneously, state aid was re-oriented towards SMEs and targets ensuring that priority is given to SMEs in the financial allocation have been set for example in Poland, Hungary and the Czech Republic. All sectoral preferences were suppressed to avoid “protecting” declining industries or trying to pick up winners by targeting manufacturing or specific “high-tech” sectors.134 The remaining measures in this priority are thus more focused on soft aid for knowledge, innovation and technology and the business environment.
Especially for human resources the measures have to be tailored to the country’s situation. For example in Hungary where both unemployment and the participation rate are low and where in some sectors and regions shortages of highly skilled workers can be observed, the focus was put on those measures likely to increase participation and on education and training. In contrast, for example in Poland and Slovakia where unemployment is a key challenge, measures for social inclusion were granted limited financial allocation to the benefit of active labour market policies and in the latter support was shifted towards groups with the highest possibility to (re-)enter the labour market like youth.
In transport, a hierarchy of priorities for the period 2004-2006 were followed with a view to maximising investments that yield higher returns in terms of enterprises competitiveness while facilitating labour mobility. This has lead, depending on the situation in the country, to giving international and interregional transport infrastructure clear priority like in the Czech Republic and Hungary and to suppress (Hungary) or condition (Czech Republic) aid for regional airports.
For regional programmes the aim was to avoid that they mimic the CSFs at regional level and widely disperse resources into numerous priorities and measures with most likely little effect on long-run growth and employment. Consequently, an even distribution of the Structural Funds across the whole territory (like in Slovakia) as well as one favouring the most backward regions (like in Poland) had to be avoided. Focus was given on investment in areas and urban centres with growth potential while providing the necessary infrastructure to allow for their inter-connections and connections with major transit routes, notably in Slovakia and Poland. Financing of small-scale regional
134 E.g. in the case of Poland it was originally envisaged to
give preference to projects in “high technology sectors” and in “traditional industrial branches, which have potential for efficient export and may become competitive in the future (e.g. steel industry, …, ship-building industry, heavy machine-building industry, heavy chemistry, industry of copper …”). Ministry of the Economy, Labour and Social Policy: Sectoral Operational Programme Improvement, of Competitiveness of the Economy for 2004-2006, adopted by the Committee for European Integration 14. 02. 2003, p. 48.
transport infrastructure was substantially reduced (e.g. in Poland and the Czech Republic). The numerous requests for regional/local cultural or sport facilities were reduced in terms of financial allocations and made subject to conditions, in particular economic sustainability and significant regional economic impact.
In agriculture, finally, efforts were made to give higher importance to rural development aimed at offering alternative employment at the expense of state aids for the processing industry and on-farm investment support. For example in Poland, the financial allocation to rural development has more than tripled at the expense of direct aid measures.
4.2.4 Effective use of funds
The extent to which EU cohesion policy will be turned into capital formation depends on the magnitude of the administrative costs as these divert expenditures from productive investments. Costs can result form insufficient management and can be improved by capacity-building measures increasing public administrative efficiency. Though necessary, such measures will in turn diminish resources for investment. They can also result from regulatory complexity. The requirements of the Structural Funds regulations imply somewhat complex procedures and thus transaction costs for programming, monitoring, evaluations and control systems. Simplifications have been introduced, but there is a trade-off between simplicity and accountability. All the more so since the final accountability for the use of Structural Funds lies in the hands of the European Commission.
The regulation for the current 2000-2006 programming period has tried to set incentives to achieve high quality in the implementation of Structural Funds programmes by introducing the performance reserve as a new instrument. The allocation of the reserve of about 4 per cent of total funding 2000-2006, which took place in 2004, has led to rather heterogeneous results. Three groups of indicators have been used to determine which programmes can be regarded as performing: indicators related to output, to management and to financial absorption. The use of these indicators is regarded as an incentive to improve the administrative situation. In practice, however, the necessary information was not always available and a variety of methods have been used for the allocation ofthe reserve in different Member States so that in some cases also less-performing programmes benefited.

46
Table 15: Compliance with the principle of additionality for Objective 1
Ex- post
1994/1999 (1)
Ex-ante 2000/2006
(2)
Mid-term 2000/2002
(3) Belgium 118 98 117 Germany 80 93 88 Greece 124 146 139 Spain 98 101 104 France 120 105 99 Ireland 166 200 189 Italy 80 104 98 Netherlands 124 231 253 Austria 136 103 103 Portugal 118 116 119 Finland 127 108 110 Sweden 114 249 264 UK n/a n/a n/a Notes: Indices for annual averages of national public eligible expenditures. (1) Ex-post 1994/1999 compared with ex-ante 1994/99. (2) Ex-ante 2000/2006 compared with ex-post 1994/99. (3) Ex-post 2000/2002 compared to ex-post 1994/99.135
Calculations based on tables submitted for the verification of additionality of Objective 1 programmes.
The second condition for effectiveness is that transfers contribute to increase investment and do not lead to crowding-out. The principle of additionality enshrined in the Structural Funds regulations requires for Objective 1 programmes that Member States agree ex-ante with the European Commission on a target for national public eligible expenditure that generally should not be lower than the level achieved during the former programming period. Ex-post and mid-term verifications for the periods 1994-99 and 2000-06 show that in most Member States additionality has at least nearly been met and that this result can be expected as well for the current period (see Table 15).
4.3 Policy challenges In spite of its limited financial means, EU cohesion policy can have a substantial impact on catching-up - as has been shown by impact assessments based on macroeconomic modelling. However, it can only have significant effects if several conditions are fulfilled, and here experience in the recent years shows that room for improvement exists. Among the various factors influencing the effectiveness of Structural Funds in achieving convergence, particularly against the background of enlargement, the following aspects are important:
135 Note that in the mid-term and ex-post verifications the
graphs are compared with the (in some cases modified) ex-ante graphs for the same period and not with the ex-post graphs of the previous programming period. Note also that in exceptional cases a reduction of national eligible expenditures can be accepted if the former expenditures have been of an exceptional magnitude.
• Stronger spatial concentration,
• Better thematic concentration,
• More effective use of funds.
Spatial concentration means concentrating Structural Funds on those regions and Member States most in need. This implies, first, a decision whether to continue supporting regions in relatively rich Member States; and, second, if and to what extent to continue the support in regions whose eligibility is affected negatively by the statistical effect of enlargement. These issues are considered in the Draft Framework Regulation of Structural Funds for the programming period 2007 – 2013 proposing to strengthen the focus on the new Convergence Objective by allocating 78.5 per cent of the resources to this objective, in comparison to 72 per cent for the Objective 1 regions in the current programming period. Structural Funds in “statistical effect regions” would be continued, but only on a transitional and decreasing basis that cannot be prolonged for the years after 2013.
Spatial concentration also means not counteracting market forces in the selection of areas for support. As a response to the possible equity-efficiency trade-off, i.e. that high catch-up growth might temporarily be accompanied by higher inequalities between regions, a sequencing approach initially emphasising growth of the national economy as a whole and at a later stage giving more prominence to addressing regional disparities could be followed in order to make regional policy more efficient. In parallel, the catching-up process of poorer regions might be accelerated by supporting their growth poles and by building on existing clusters. But one should avoid any artificial dispersion of economic activities or creation of new clusters.
Thematic concentration, in turn, means choosing an effective investment mix. The question what an effective investment mix is can only be answered on a case by case basis after a sound analysis of the situation in the corresponding Member State and region. However, some general arguments can be made. First, infrastructure endowment can be seen as a precondition for growth, though not as a growth-enhancing investment per se. Second, even if it generally takes time to achieve a needed enhancement of human capital, this can be regarded as key to long-term growth. Third, aid to the productive sector should be limited to specific projects enhancing the business environment, and support for start-ups and SMEs. Thus, in the draft new ERDF regulation business support is always directly linked to SMEs. Fourth, support for rural areas should take into account the limited and declining importance of agriculture in the process of catching-up, and should be focused on providing alternative employment and development opportunities. Fifth, projects of doubtful economic benefit – such as for example cultural projects –- should not be financed. Finally, and in the light of the

47
subsidiarity principle, thematic concentration implies concentrating EU Structural Funds on larger projects, in order to achieve a significant impact - while leaving smaller projects to national, regional and local financing.
In order to guarantee the effective use of Structural Funds, two areas will have to be addressed. First, simplifications for the management of Structural Funds will help to reduce administrative problems and costs. Second, particularly in the new Member States, building up the necessary administrative capacity will be of crucial importance.
While the draft new regulation for Structural Funds aims to introduce a stronger regional and thematic concentration, the contribution of EU cohesion policy to real convergence will depend predominantly on Member States’ own national and regional policies. The role of regional and national authorities in setting up strategies to support and implement Structural Funds programs will be of key importance. More broadly, for the Structural Funds to have a favourable impact, it will be important to assure a stable macroeconomic setting, effective structural reforms, and good governance practices.

48
References
AIGINGER, K. AND S. W. DAVIES (2001), “Industrial specialisation and geographic concentration: the two sides of the same coin?” University of Linz Working Paper 23.
AHN, S., AND P. HEMMINGS (2000), “Policy influences on economic growth in OECD countries: an evaluation of the evidence”, OECD Economics Department Working Paper No 246, Paris.
ALONSO, W. (1969), “Urban and Regional Imbalances in Economic Developments”, in: Economic Development and Cultural Change 17, pp. 1-14.
ALVAREZ-PLATA, P., H. BRÜCKER, B. SILIVERSTOVS, AND DIW BERLIN (2003), “Potential Migration from Central and Eastern Europe into the EU-15 – An Update”, Report for the European Commission, DG Employment and Social Affairs, Berlin.
AMITI, M. (1999), “Specialization patterns in Europe”, in: Weltwirtschaftliches Archiv 135, pp. 1-21.
ARUP ECONOMICS AND PLANNING (Contractor: Ecotec Research and Consulting Ltd. in association with GVA Grimley and the Centre for Urban and Regional Development Studies, University of Newcastle-upon-Tyne) (2000), “Planning for Clusters”, London.
AUDRETSCH, D. B. AND M. P. FELDMAN. (1996), “Knowledge Spillovers and the Geography of Innovation and Production”, in: American Economic Review, 8, pp. 630-640.
BALDWIN, R. (1989), “The growth effects of 1992“, in: Economic Policy, pp. 248-281.
BALDWIN, R. (1994), “Towards an integrated Europe“, London.
BALDWIN, R. E., P. MARTIN, AND G. I. P. OTTAVIANO, (2001). “Global income divergence, trade and industrialization: the geography of growth take-offs”, in: Journal of Economic Growth No 6, pp. 5-37.
BALDWIN, R. E. AND P. MARTIN (2004), “Agglomeration and regional growth”, in: Henderson, V. and J.-F. Thisse, (eds.), Handbook of Regional and Urban Economics, forthcoming.
BARCA, F. (2003), “Regional Policy Experience in Southern Italy”, in: Bernard Funck and Lodovico Pizzati (eds.): European Integration, Regional Policy, and Growth, Washington D.C., pp. 129–133.
BARRELL, R. ET AL. (2001), “Openness, integration and transition: prospects and policies for economies in transition”, NIESR Discussion Paper No 177.
BARRIOS, S. AND E. STROBL, (2004a), “Industry mobility and geographic concentration in the European Union”, in: Economics Letters 82, pp. 71-75.
BARRIOS, S. AND E. STROBL, (2004b), “Revisiting the link between national development and regional inequalities: evidence for Europe”, Université catholique de Louvain, forthcoming.
BARRO, R. J. AND J.-W. LEE (1994), ”Sources of Economic Growth”, Carnegie-Rochester Conference Series on Public Policy, 40, pp. 1-46.
BARRO, R. AND X. SALA-I-MARTIN (1992), “Convergence”, in: Journal of Political Economy 100(2), pp. 223-51.
BARRO, R. AND X. SALA-I-MARTIN (1995), “Economic Growth”, New York, Mc Graw Hill.
BARRY, F. (2003), “European Union Regional Aid and Irish Economic Development”, in: Bernard Funck and Lodovico Pizzati (eds.): European Integration, Regional Policy, and Growth; Washington D.C., pp. 135–151.
BASILE R. AND KOSTORIS PADOA SCHIOPPA F. (2002), “Unemployment dynamics of the Mezzogiornos of Europe: lessons for the Mezzogiorno of Italy”, ISAE, Istituto di Studi e Analisi Economica and ISAE, Istituto di Studi e Analisi Economica.
BASSANINI, A., S. SARPETTA AND P. HEMMINGS (2001), “Economic growth: The role of policies and institutions. Panel data evidence from OECD countries”, OECD Economics Department Working Paper No 283, Paris.
BEUGELSDIJK M. AND EIJFFINGER S. C. W. (2003), “The Effectiveness of Structural Policy in the European Union: An Empirical Analysis for the EU-15 during the Period 1995-2001”; CEPR (Centre for Economic Policy Research) Discussion Paper 3879; London.
BEUTEL J. (2002) “The economic impact of objective 1 interventions for the period 2000 – 2006; Final report to the Directorate General for Regional Policies”, http://europa.eu.int/comm/regional_policy/sources/docgener/studies/pdf/objective1/final_report.pdf.

49
BLUNDELL R. AND DUNCAN A. (1998), “Kernel Regression in Empirical Microeconomics”, The Journal of Human Resources, Vol. 33 (1), pp. 62-87.
BODE, E. (2004), “The spatial pattern of localized R&D spillovers: an empirical investigation for Germany”, in: Journal of Economic Geography 4, pp. 43-64.
BOERI, T., BRÜCKER, H. ET.AL. (2000), “Study on the impact of eastern enlargement on employment and labour markets in the EU Member States”, study commissioned by the European Commission, DG Employment and Social Affairs, Berlin/Milano 2000.
BOLDRIN M. AND F. CANOVA (2001), “Inequality and Convergence in Europe’s Regions: Reconsidering European Regional Policies”, in: Economic Policy, No 32.
BORNER, S. ET AL. (2004), “Institutional efficiency and its determinants – The role of political factors in economic growth”, OECD Development Centre Studies, Paris.
BOTTAZZI L. AND G. PERI (2003), ”Innovation and Spillovers in Regions: Evidence from European Patent Data”, in: European Economic Review 47(4), pp. 687-710.
BOUGHEAS S., P. O. DEMETRIADES AND T.P. MAMUNEAS (2000), “Infrastructure, Specialization and Economic Growth”, in: Canadian Journal of Economics, Vol. 33, No 3, pp. 506-522.
BOURGUIGNON F., LOLOS S., ZONZILOS N., SUWA-EISENMANN A. (1995), “Evaluating the CSF With an Extended Computable General Equilibrium Model: The Case of Greece (1988-1995)”, Journal of Policy Modeling , Vol. 17, Issue 2, pp. 177-197.
BRADA, A. C. AND A. M. KUTAN (2002), “The end of moderate inflation in three transition economies?”, David Williamson Institute Working Paper No 433.
BRADLEY J., MODESTO L. AND SOSVILLA-RIVERO S. (1995), “HERMIN: A macroeconometric modelling framework for the EU periphery”, Economic Modelling, 12(3), pp. 221-47.
BRÜLHART, M. (1998), “Trading places: Industrial specialization in the European Union”, in: Journal of Common Market Studies No 36, pp. 319-346.
BRUNO, M. AND W. R. EASTERLY (1998), “Inflation Crises and Long-Run Growth”, in: Journal of Monetary Economics, Vol. 41, No 1, pp. 3-26.
BURNSIDE, C. AND D. DOLLAR (2000), “Aid, Policies, and Growth”, in: American Economic Review, Vol. 40, pp. 289- 329.
CAMPOS, N. F. AND F. CORICELLI (2002), “Growth in transition: What we know, what we don’t and what we should”, in: Journal of Economic Literature, Vol. 40, pp. 793-836.
CAMPOS, N. F. AND Y. KINOSHITA (2003). “Why does FDI go where it goes? New evidence from the transition economies”, IMF Working Paper No 03/228.
CANOVA, F. AND A. MARCET, (1995). “The poor stay poor: non-convergence across countries and regions”, CEPR discussion paper No 1265.
CARSTENSEN, K. AND F. TOURBAL (2003), “Foreign direct investment in Central and Eastern European countries: A dynamic panel analysis”, Kiel Working Paper No 1143, forthcoming in: Journal of Comparative Economics.
CASELLI, F., G. ESQUIVEL AND F. LEFORT (1996): “Reopening the Convergence Debate: a New Look at Cross-country Growth Empirics”, in: Journal of Economic Growth, Vol. 1 No 3, pp. 363-389.
CASTELLS, A. AND A. SOLLÉ-OLLÉ (2004), “The regional allocation of infrastructure investment: The role of equity, efficiency and political factors”, forthcoming in: European Economic Review.
CHATTERJI, M. (1992), “Convergence clubs and endogenous growth”, in: Oxford Review of Economic Policy 8(4), pp. 57-69.
COMBES, P.-P. AND M. LAFOURCADE (2001), “Transportation Cost Decline and Regional Inequalities: Evidence from France”, CEPR Discussion Paper No 2894.
COMBES, P.-P. AND H. OVERMAN, (2004). “The spatial distribution of economic activities in the European Union”, in: Henderson, V. and Thisse, J.-F. (eds.), Handbook of Urban and Regional Economics, Vol. 4. Elsevier-North Holland, Amsterdam; forthcoming.
DAVIES, S. AND M. HALLET, (2001). “Policy responses to regional unemployment: Lessons from Germany, Spain and Italy”, DG ECFIN Economic Paper No 161, Brussels.

50
DAVIES, S. AND M. HALLET (2002), “Interactions between National and Regional Development”, HWWA Discussion Paper 207, Hamburg Institute of International Economics.
DE LA FUENTE, A., (2002), “Convergence across countries and regions: theory and empirics”, Insituto de Análisis Económico (CSIC), forthcoming.
DE LA FUENTE, A. (2003), “Second-best Redistribution Through Public investment: A Characterization, an Empirical Test and an Application to the Case of Spain”, Regional Science and Urban Economics, forthcoming.
DE LA FUENTE, A. AND X. VIVES (1995), “Infrastructure and Education as instruments of regional policy: evidence from Spain”, in: Economic Policy No 20, pp. 13-51.
DE LA FUENTE, A. AND A. CICCONE (2002), “Human Capital in a Global and Knowledge-Based Economy”, Report for the European Commission, DG Employment and Social Affairs, Brussels.
DEL MAR SALINAS-JIMÉNEZ, M (2004), “Public infrastructure and private productivity in the Spanish regions”, in: Journal of Policy Modelling, Vol. 26, issue 1, pp. 47-64
DENIS, C., K. MC MORROW AND W. ROEGER (2002), “Production function approach to calculating potential growth and output gaps – estimates for the EU Member States and the US”, DG ECFIN Economic Paper No 176, Brussels.
DEVEREUX, M., R. GRIFFITH, AND H. SIMPSON (2003), “The geographic distribution of productive activity in the UK”, in: Regional Science and Urban Economics, forthcoming.
DJANKOV, S. AND B. M. HOEKMANN (2000), “Foreign investment and productivity growth in Czech Enterprises”, World Bank Review, Vol. 14, pp. 49-64.
DJANKOV, S. AND P. MURRELL (2000), “Enterprise restructuring in transition: A quantitative survey”, in: Journal of Economic Literature, Vol. 40, pp. 739-792.
DOLLAR, D. AND A. KRAAY (2003), “Institutions, Trade, and Growth”, in: Journal of Monetary Economics No 50, pp.133-162.
DURLAUF, S AND D. QUAH (2002), “The new empirics of economic growth”, NBER Working Paper No 6422.
DURANTON, G. AND D. PUGA, (2004), “Micro-foundations of urban agglomeration economies”, in: Henderson, V. and Thisse, J.F. (eds.), Handbook of Urban and Regional Economics, Vol. 4. Elsevier-North Holland, Amsterdam, forthcoming.
DURO, J.A., (2001), “Regional income inequalities in Europe: an updated measurement and some decomposition results”, Instituto de Anlásis Económico, CSIC, forthcoming.
EASTERLY, W. AND R. LEVINE (2003), “Tropics, germs and crops: how endowments influence economic development”, in: Journal of Monetary Economics No 50, pp. 3-39.
EBERS, H. (1998) “Erfolgskontrolle investiv geförderter landwirtschaftlicher Unternehmen im Bereich der Landwirtschaftskammer Hannover“, Diplomarbeit, Göttingen.
EDERVEEN, S., J. GORTER, R. DE MOOIJ AND R. NAHUIS (2002), “Funds and Games: The Economics of European Cohesion Policy”, The Hague.
EDERVEEN, S. AND J. GORTER (2002): “Does European cohesion policy reduce regional disparities?” CPB Discussion Paper No 15, The Hague.
ÉGERT, B. ET AL. (2004), “Inflation differentials in Europe: Past experience and future prospects”, Österreichische Nationalbank, Monetary policy and the economy, Q1/04, pp. 47-72.
ESTEBAN, J. M. (1999), “L’euro y la desigualtat territorial: implications per a Catalunya”, in: J.M. Esteban and J. Gual (eds.), Catalunya dins l’Euro, Barcelona: Antoni Bosh Editor, pp. 165-210.
EUROPEAN COMMISSION (1996), “European System of Accounts ESA95”, Eurostat, Luxembourg.
EUROPEAN COMMISSION (2002a), “Employment in Europe 2002”, Luxembourg.
EUROPEAN COMMISSION (2002b), “Public Finance Report 2002”, Luxembourg.
EUROPEAN COMMISSION (2002c): “State Aid Scoreboard, autumn 2002 update, Special edition on the candidate countries”, Luxembourg
EUROPEAN COMMISSION (2003a), “2003 European innovation scoreboard”, Commission Staff Working Paper SEC(2003) 1255.

51
EUROPEAN COMMISSION (2003b): “Public Finances in EMU – 2003”; Luxembourg (= European Economy 3/2003).
EUROPEAN COMMISSION (2003c): “Second progress report on economic and social cohesion”, Luxembourg.
EUROPEAN COMMISSION (2003d): “Ex-Post Evaluation of Objective 1 1994-1999; A Final Report to the Directorate General for Regional Policy, European Commission”, Brussels.
EUROPEAN COMMISSION (2004a), “Employment in Europe 2004”, Luxembourg.
EUROPEAN COMMISSION (2004b), “EMU after five years”, European Economy Special Report 1/2004, Brussels.
EUROPEAN COMMISSION (2004c): “A new partnership for cohesion: convergence competitiveness cooperation, Third report on economic and social cohesion”, Luxembourg.
EUROSTAT (2002): “Statistics in Focus”, Theme 3, 56/2002, Luxembourg.
EVENETT, S. J. AND W. KELLER (2002), “On Theories Explaining the Success of the Gravity Equation”, in: Journal of Political Economy 110 (2), pp. 281-316.
FAINI, R. (1983): “Cumulative Process of Deindustrialisation in an Open Region: The Case of Southern Italy”, 1953 – 1971; in: Journal of Development Economics, Vol. 12, pp. 277–301.
FAYOLLE J. AND LECUYER A. (2000), “Regional growth, national membership and European structural funds: an empirical appraisal”; OFCE (Observatoire Français des Conjonctures Èconomiques) Working Paper No 00-02, Paris.
FELDMAN, M. P. AND D. B. AUDRETSCH. (1998), “Innovation in Cities: Science-based Diversity, Specialization, and Localized Competition”, in: European Economic Review, 43: pp. 409-429.
FELDSTEIN, M. (1996), “The costs and benefits of going from low inflation to price stability”, NBER Working Paper No 5469.
FITZ_GERALD J. (1999), “Impact of NDP on the Economy", in: Stationery Office: Ex Ante Evaluation of the National Development Plan, 2000-2006; Dublin.
FORSTNER, B. AND D. CLEMENS (1998), “Einzelbetriebliche Investitionsförderung in Schleswig-Holstein effizient und nachhaltig?“, in: Bauernblatt für Schleswig-Holstein und Hamburg, issue 51/52, pp. 74-78.
GALLUP, J. L., J. SACHS AND A. D. MELLINGER (1998), “Geography and Economic Growth”, Paper prepared for the Annual Bank Conference on Development Economics, Washington, D.C., April 20-21, 1998.
GARIBALDI, P. ET AL. (2001), “What moves capital to transition economies?”, IMF Staff Papers, Vol. 48, pp. 109-145.
GERLING, K. M. (2002), “Subsidization and Structural Change in Eastern Germany“, Berlin.
GIANNETTI, M. (2002), “The effects of integration of regional disparities: Convergence, divergence or both?”, in: European Economic Review No 46, pp. 539-567.
HAERDLE, W. (1992), “Applied nonparametric regression”, Econometric Society Monographs Series 19, Cambridge University Press.
HALLET, M. (2000), “Regional Specialisation and Concentration in the EU”, DG ECFIN Economic Paper No 141, Brussels.
HECHT, Y., A. RAZIN AND N. G. SHINAR (2002), “Interactions between capital inflows and domestic investment: international panel data”, Central Bank of Israel, Mini Conference, May 2002.
HIRSCHHAUSEN, C. VON (2002), “Infrastrukturentwicklung in den mittel- und osteuropäischen EU-Beitrittsländern: Auf dem Weg nach Europa“, DIW Wochenbericht 37/02 2002.
HOLLAND, D. AND N. PAIN (1998), “The diffusion of innovation in Central and Eastern Europe, A study of determinants and impact of foreign direct investment”, NIESR Discussion Paper No 137.
HONOHAN, P. (1998), “Key Issues of Cost-Benefit Methodology for Irish Industrial Policy”, General Research Series 172, The Economic and Social Research Institute, Dublin.
INSTITUT FÜR WIRTSCHAFTSFORSCHUNG HALLE (2003), “Wie hoch sind die Transferleistungen für die neuen Länder?“, IWH-Pressemitteilung 21/2003.
INTERNATIONAL MONETARY FUND (IMF) (2003a), “World Economic Outlook 2003”, Washington D. C.
INTERNATIONAL MONETARY FUND (IMF) (2003b), “Italy: Selected Issues”, Country Report No 03/352.

52
ISLAM, N. (1995), “Growth empirics: a panel data approach”, in: Quarterly Journal of Economics No 4, pp. 1127-1170.
JENKINS, S. P. (1991). “The measurement of income inequality”, in: Osberg (ed.), Economic Inequality and Poverty: International Perspectives, Armonk NY, M.E. Sharpe.
JENKINS, S. P. (1995), “Accounting for inequality trends: decomposition analyses for the UK, 1971-86”, in: Economica 62, pp. 29-63.
KAUFMANN, D., A. KRAAY AND M. MASTRUZZI (2003), “Governance Matters III: Governance Indicators for 1996-2002“, World Bank Policy Research Department Working Paper No 3106.
KELLER, W. (2002). “Geographic Localization of International Technology Diffusion”, in: American Economic Review 92(1), pp. 120-142.
KRUGMAN, P. (1991), “Increasing returns and economic geography”, in: Journal of Political Economy 99 (3), pp. 483-499.
KRUGMAN, P. AND A. J. VENABLES (1996), “Integration, specialization, and adjustment”, in: European Economic Review 40 (3-5), pp. 959-967.
KUZNETS, S., (1955), “Economic Growth and Income Inequality”, in: American Economic Review 65, pp. 1-28.
LANDESMANN, M. A. (2003), “Structural features of economic integration in an enlarged Europe: patterns of catching-up and industrial specialisation”, European Commission, DG for Economic and Financial Affairs, Economic Paper No 142, Brussels.
LEE, H. Y., L. A. RICCI AND R. RIGOBON (2004), “Once Again, is Openness Good for Growth?” IMF Working Paper WP/04/134, Washington D.C.
LENIHAN, H. (2004), “Evaluating Irish industrial policy in terms of deadweight and displacement: A quantitative methodological approach”, in: Applied Economics, Vol. 36 No 3, pp. 229-252.
LOVINO, I. (2003), “Acceding countries: still attractive to foreign direct investors”, Eurostat, Statistics in Focus, Theme 2, No 51.
LUCAS, R. E. Jr. (1988), “On the Mechanics of Economic Development”, in: Journal of Monetary Economics No 22: pp. 3-42.
LUCAS, R. E. Jr. (2000). “Some Macroeconomics for the 21st Century”, in: Journal of Economic Perspectives 14(1), pp. 159-168.
MAGRINI, S., (2004), “Regional (Di)convergence”, in: Henderson, V. and Thisse, J.-F. (eds.), Handbook of Urban and Regional Economics, Vol. 4. Elsevier-North Holland, Amsterdam, forthcoming.
MANKIW, N. G., D. ROMER, AND D. N. WEIL (1992), “A Contribution to the Empirics of Economic Growth“, in: Quarterly Journal of Economics, Vol. 107, pp. 407-437.
MARTIN, P. AND C. A. ROGERS (1995), “Industrial location and public infrastructure”, in: Journal of International Economics, Vol. 39, pp. 335-351.
MARTIN, P. AND G. OTTAVIANO (1999), “Growing Locations: Industry Location in a Model of Endogenous Growth”, in: European Economic Review No 43, pp. 281-302.
MAUREL, F. AND B. SÉDILLOT (1999), “A measure of the geographic concentration in French manufacturing industries”, in: Regional Science and Urban Economics 29, pp. 575-604
MIDELFART K. H. (2004), “Regional Policy Design: An analysis of relocation, efficiency and equity”, CEPR Discussion Paper No 4321, London.
MIDELFART-KNARVIK, K. H. AND H. G. OVERMAN (2002), “Delocation and European Integration: Is structural spending justified?”, in: Economic Policy, Vol. 35, pp. 322–359.
MIDELFART-KNARVIK, K.H., H. G. OVERMAN, S. R. REDDING AND A. J. VENABLES, (2002), ”The location of European industry”, European Economy 2, pp. 216-273
MODY, A., A. RAZIN AND E. SHADKA (2003), “The role of information in driving FDI flows: Host country transparency and source-country specialisation”, NBER Working Paper No 9662.

53
MOLLE, W. (1997), “The regional economic structure of the European Union: an analysis of long term developments” in: K. Peschel, ed., Regional Growth and Regional Policy within the Framework of European Integration (Physica-Verlag, Heidelberg) pp. 66-86.
MORENO, R., E. LÓPEZ-BAZO AND M. ARTÍS (2002), “Public infrastructure and the performance of manufacturing industries: short- and long-run effects”, in: Regional Science and Urban Economics, Vol. 32, issue 1, pp. 97-121.
NADARAYA, E. (1964), “On Estimating Regression”, in: Theory of Probability and its Applications 9, PP. 141-42.
NORTH, D. C. (1990): “Institutions, Institutional Change and Economic Performance”, New York.
ORLOWSKI, W. M. (2004), “Accelerate change”, IMF Finance and Development, June 2004, pp. 34-35.
PETRAKOS, G. AND J. C. BRADA (1989): ”Metropolitan Concentration in Developing Countries”, in: KYKLOS: The International Review of Social Sciences, Vol.42, Fasc.4, pp. 556-578.
PETRAKOS, G. AND Y. SARATSIS (2000), “Regional Inequalities in Greece”, in: Papers in Regional Science 79(1), pp. 57-74.
PETRAKOS, G., A. RODRÍGUEZ-POSE AND A. ROVOLIS (2003), “Growth, integration and regional inequality in Europe”, in: Research papers in Environmental and Spatial Analysis No 81, London School of Economics.
PRITCHETT L. (1995), “Patterns of Economic Growth: Hills, Plateaus, Mountains, and Plains”, World Bank Working Paper No 1947; Washington D.C.
PUGA, D. (1999), “The rise and fall of regional inequalities”, in: European Economic Review 43(2), February 1999, pp. 303-334.
PUGA, D. (2002), “European regional policies in light of recent location theories”, in: Journal of Economic Geography No 2, pp. 373-406.
QUAH, D. (1997), “Empirics for Growth and Distribution: Stratification, polarization, and Convergence Clubs”. In: Journal of Economic Growth 2(1), pp. 27-59.
QUAH, D. (1996), “Regional convergence clusters across Europe”, in: European Economic Review, 40 (3-5), pp. 951-958.
QUAH, D. (1999), “Models of explicit distribution dynamics”, in: European Commission (ed), The Socio-Economic Impact of Projects Financed by the Cohesion Fund: a modelling approach, 79-219. Luxembourg.
RAGNITZ, J. (2003), “Wirkungen der Investitionsförderung in Ostdeutschland“, Institut für Wirtschaftsforschung Halle: Diskussionspapiere No 186; Halle.
RAHMAN M. A. (1963), “Regional allocation of investment”, in: Quarterly Journal of Economics 77, pp. 26-39.
RAISER M. ET AL. (2001), “Social capital in transition, a first look at the evidence”, EBRD Working Paper No 61.
RAISER M., M. SCHAFFER AND J. SCHUCHART (2003), “Benchmarking structural change in transition”, EBRD Working Paper No 79.
RAZIN, A. (2002), “FDI contribution to capital flows and investment in capacity”, NBER Working Paper No 9204.
RIVERA-BATIZ, L. A. AND P. ROMER (1991), “Economic Integration and Endogenous Growth”, in: The Quarterly Journal of Economics 106, pp. 531-555.
RODRIGUEZ, F. AND D. RODRIK (2000), “Trade policy and economic growth: A skeptic’s guide to cross-national evidence” in: B. Bernanke and K. S. Rogoff (eds.): Macroeconomics Annual 2000, MIT Press, Cambridge, MA, 2001.
RODRIK, D., A. SUBRAMANIAN, F. TREBBI (2002), “Institutions Rule: The Primacy of Institutions over Geography and Integration in Economic Development“, IMF Working Paper No 189.
ROEGER, W. AND J. IN’T VELD (1997), “Quest II – A multi country business cycle and growth model”, DG ECFIN Economic Paper No 123.
ROMER, D. (2001), “Advanced macroeconomics”, 2nd edition, McGraw-Hill, Irwin.
ROSE, A. K. (2000), “One money, one market: The effect of currency unions on trade”, in: Economic Policy April 2000, pp. 9-45.
SACHS, J. D. (2003), “Institutions don't rule: direct effects of geography on per capita income”; NBER Working Paper 9490.

54
SALA-I-MARTIN, X. (1997), “I just ran 4 million regressions”, NBER Working Paper No 6252.
SALA-I-MARTIN, X. (2003), “Executive summary to the world competitiveness report 2003/04”.
SAPIR, A. (1996), “The effects of Europe’s internal market programme on production and trade: a first assessment“, in: Weltwirtschaftliches Archiv 132 (3), pp. 457-475.
SAPIR, A. ET AL. (2003), “An Agenda for a growing Europe: Making the EU Economic System Deliver”, Report of an Independent High-Level Study Group established on the imitative of the President of the European Commission, Brussels.
SILBER, J. (1989), “Factor Components, Population Subgroups and the Computation of the Gini Index of Inequality”, in: Review of Economics and Statistics, No 71: pp. 107-115.
STRIEWE, L., J.-P. LOY AND U. KOESTER (1996), “Analyse und Beurteilung der einzelbetrieblichen Investitionsförderung in Schleswig-Holstein“, in: Agrarwirtschaft, Vol.45, No 12, pp. 423-434.
SOLANES J.G. AND RAMÓN M.D. (2001), “The Impact of European Structural Funds on Economic Convergence in European Countries and Regions; in: W. Meeusen and J. Villaverde Castro (eds): Convergence Issues In The European Union, Edward Elgar Publishing Ltd, 2002, pp. 61–82.
SOLOW, R., (2000), “Toward a Macroeconomics of the Medium run”, in: Journal of Economic Perspectives 14(1), pp. 151-158.
SVEJNAR, J. (2002), “Transition economies: performance and challenges”, in: Journal of Economic Perspectives, Vol. 16, No 1, pp. 3-28.
TONDL, G. (1997), “The ups and downs of regional income convergence in Europe”, Robert Schuman Centre working paper No 97/53, European University Institute, Florence.
TONDL, G., (2001), “Convergence after divergence? Regional growth in Europe“, Springer-Verlag: Wien.
TONDL, G. AND G. VUKSIC (2003), “What makes regions in Eastern Europe catching-up? The role of foreign investment, human resources and geography”, ZEI Working Paper B12.
TRAISTARU, I., P. NIJKAMP AND S. LONGHI (2002), “Regional specialization and concentration of industrial activity in Accession Countries”, ZEI working Paper No 16, Bonn.
VON SCHÜTZ, U. AND M. STIERLE (2003), ”Convergence in an enlarged EU? An empirical analysis of regional specialisation and sectoral concentration”, in: C. Hausen, M. S. Resinek, N. Schürmann and M. Stierle (eds.) Determinants of Growth and Business Cycles: Theory, Empirical Evidence and Policy Implications INFER Annual Conference 2003 Reihe: INFER Research Edition, Vol. 9
WACHTEL, P. AND I. KURHONEN (2004), “Observations on dis-inflation in transition economies“, Bank of Finland Discussion Paper No 5/2004.
WÄLDE, K. AND C. WOOD (2004), “The empirics of trade and growth: where are the policy recommendations?” DG ECFIN Economic Paper No 204, Brussels.
WATSON, G. (1964), “Smooth Regression Analysis”, in: Sankhya 26, PP. 359-72.
WEISE, Christian (2002): “How to finance Eastern Enlargement of the EU: The need to reform EU policies and the consequences for the net contributor balance“, DIW Discussion Paper No 287, Berlin.
WIFO (1999), “Specialisation and (Geographic) Concentration for European Manufacturing – Background Paper for ’The Competitiveness of European Industry 1999 report’ ”, European Commission, DG Enterprise working paper 1, Brussels.
WILLIAMSON, J., (1965), “Regional inequality and the process of national development”, in: Economic Development and Cultural Change 14, pp. 3-45.
WORLD BANK (2002), “World Development Report 2002”, Washington D.C.
WORLD BANK (2004), “Doing Business in 2005: Removing obstacles to growth”, Washington D.C.
WURZEL, E. (2001), “The Economic Integration of Germany’s New Länder”, OECD Economics Department Working Papers, No 307, Paris.
YUILL, D. AND F. WISHLADE (2001), “Regional Policy Developments in the Member States: A Comparative Overview of Change“, European Policies Research Centre, University of Strathclyde, Regional and Industrial Policy Research Paper No 45, Glasgow.

55
ANNEX I: METHODOLOGICAL CONCEPTS OF CONVERGENCE
Three concepts of convergence are generally found in the literature. The first one concerns the evolution of the distribution of income per capita, i.e., the so-called σ-convergence. The other two ask whether poorer countries tend to catch-up with the richer ones or whether the relative position of each country within the income distribution, considering its fundamentals, tends to stabilize over time. In the first case we talk about absolute β-convergence while in the second we talk about conditional β-convergence. While the concept of σ-convergence refers to a single statistic, the other two deal with the causality between two variables: the growth rate of income per capita and its initial level. Considering the following expression:
∆yit = αxi - βyit (i) where yit is the level of income per capita in country (or region) i and ∆yit is the rate of growth of this variable between t=T and t=0. The variable xi, is assumed, for simplicity, to be constant over time and represents the fundamentals of each country i (i.e., change in population, investment rate, technological capability, etc.) that are likely to determine the steady-state level of per capita income of each economy. With ∆yit=0 in the steady state we have:
y* =(αxi) / b (ii) Then if 0<β<1, there is conditional β-convergence. If, in addition, xi is the same across all i, that is, all countries (regions) converge to the same income per capita, then there is absolute β-convergence. This is equivalent to estimate econometrically (i) with common intercept and no other explanatory variable besides the initial level of per capita income. Starting from the neo-classical model of convergence described, for instance, in Barro and Sala-i-Martin (1995), one can derive the corresponding convergence time, i.e., the time it takes for a given country to converge to the steady-state. Using the logarithm expression of the convergence equation:
ln(yt) = (1-e-βt) ln(y*) + e-βt ln (y0) (iii) where y* denotes the steady state level of income and yo the initial level of income, the convergence time t can be derived by plugging the estimate of β into the following expression:
e-βt = H where H denotes the position of yt compared to yo and y*. For instance, in order to know how long it takes for a country’s GDP per head yt to be half-way between yo and yt, the corresponding convergence time will be:
T = ln(1/2)/β Note also that, while β-convergence is a necessary condition for σ-convergence, it is not sufficient for convergence to actually take place since a positive value of β is compatible with a transitory rise of income dispersion (due, for instance, to transitory shocks to the economy). It is only when poor economies grow faster than richer ones that the reduction of income disparities will in fact happen. It follows that a negative value of β does not guarantee that the dispersion of incomes is smaller at the end of a period than at the beginning or even that regions converge to a common steady state. In particular, Chatterji (1992) showed that for both β-convergence and σ-convergence to take place, the value of β must be such that -2 < β <0.
Note also that, related to this latter point, the concepts of absolute and conditional β-convergence have not the same implications in terms of inequality since the first implies that all economies will, in the long run, converge exactly to the same level of income while in the second case, each economy converges toward its own steady-state. Hence, in the latter case, inequalities could persist even if conditional convergence is taking place.
Several indices can be used to describe income disparities across countries and regions. Three main indices have generally been used in the literature: the Gini index, the Theil index and the coefficient of variation. These inequality indices differ in their sensitivities to income differences in different parts of the distribution, in particular, the Gini coefficient being most sensitive to income differences at the mode of the distribution while the coefficient of variation is more sensitive to high incomes. An advantage of the Theil index and of the coefficient of variation, however, is that they are easily decomposable into group-contribution. In particular, EU countries can be considered as specific groups with regions belonging to the same country sharing common features in terms of GDP per head.136 One can thus use the coefficient of variation and the Theil index to derive the relative contribution of within-country variation and between-country variation in explaining the total variation in GDP per head across EU regions.
136 The Gini index can also, in principle be decomposed into within and between groups components. However, while such
decomposition is not straightforward, it also involves an interaction terms which may capture a large part of income variability across regions, see Silber (1989).

56
ANNEX II: SEMI-PARAMETRIC TECHNIQUES
Non-parametric techniques are especially suited when considering the possibility for non-linear relationship between a set of variables, see for an introduction. Robinson (1988) shows in addition that these techniques can also allow for the effect of other conditioning variables by using the Kernel regression estimator. This second class of estimator is often termed semi-parametric estimator.137 Accordingly, the following equation is estimated:
Yit = α + g(Xit) + βZit + uit (1)
where Z is a set of explanatory variables that are assumed to have a linear effect on Y. The variable Y represents the level of regional inequalities measured as before by the Gini index. The function g() is smooth and continuous while X is the level of GDP per head measured in PPS and u is a random error term. Time and country indices are represented by i and t respectively. In addition, both the dependent and explanatory variables are measured with respect to the EU average. Note also that the set of control variables Z contains time and country dummies in order to control for time and country-specific characteristics that can influence the relationship between national GDP per head and the level of regional inequalities.138
A commonly used non-parametric estimator of an unknown function like g(X) without allowing for the effect of other conditioning variables is the well-known Nadaraya-Watson estimator:139
)(ˆ Xmh =
∑
∑
=
−
=−
−
−
n
iih
n
iiih
XXKn
yYXXKn
1
1
11
)(
)( (2)
such that i=1…n are the n number of observations, Kh() is the shape function, commonly referred to as the Kernel, that is a continuous, bounded and real function that integrates to one and acts as a weighting function of observations around X and depends on the choice of bandwidth h. This technique corresponds to estimating the regression function at a particular point by locally fitting constants to the data via weighted least squares, where those observations closer to the chosen point have more influence on the regression estimate than those further away, as determined by the choice of h and K. This allows avoiding any parametric assumptions regarding the conditional mean function m(X), and thus about its functional form or error structure. Furthermore, Robinson (1988) showed that in controlling for other conditioning variables the (semi-parametric) Kernel regression estimator for g(X) simply becomes:140
( ) ( ) ( )XmXmXg Zy ˆˆˆˆ ~ δ−= (3)
where ( )Xmy~ˆ and ( )XmZˆ are the (non-parametric) Kernel regression estimates of E( y X) and E(ZX), and
δ is the OLS estimator of:
( ) ( )( ) εδ +−=− XmZXmY Zy ˆˆ ~ (4) where ε is a random error term. Intuitively, ĝ(X) is the estimate of g(X) after the independent effect(s) of Z on Y has been removed. The semiparametric estimator presents a number of limitations. First, given that the estimate of ( )Xg is at least in part based on non-parametric estimation techniques, one cannot subject it to the standard statistical type tests (e.g., t-test). A possibility, adopted here, is to calculate upper and lower pointwise confidence bands as shown by Haerdle (1990). Another limitation comes from the fact that the shape function Kh is a weighting function of observation around X and depends on the choice of bandwidth which, again, limits the possibility of hypothesis testing. Finally, the estimator tends to be biased at sudden peaks of the estimation of g(X) and at the left and right boundaries of the data, simply because observations at the neighbourhood of these points are necessarily less informative. For this reason, estimates at the extreme points of the distribution are less reliable.
137 See Blundell and Duncan (1998) for a useful introduction. 138 This is especially important given that, for instance, the number of regions could have an influence on the value of the
Gini index; see Barrios and Strobl (2004b). Time dummies can also allow controlling for annual specific shocks due to business cycle fluctuations.
139 See Nadaraya (1964) and Watson (1964). 140 The fact that δ is in part estimated using OLS makes this a semi- rather than non-parametric estimator.

57