2 fulcrum guide to data collection · 2018-06-08 · case study: premier utility services case...
TRANSCRIPT


2 Fulcrum Guide to Data Collection

3
CONTENTS
INTRODUCTION
The Value of Field Data
Data Collection 101
Building Your Survey
Survey Best Practices
Guide to Field Data Collection
Post-collection Considerations
Case Study: Premier Utility Services
Case Study: Century Engineering
Glossary
Attribution
5
6
10
15
20
23
26
28
31
37
49
Table of Contents


5
Welcome and thank you for downloading Fulcrum’s Guide to Data Collection!
In this guide, you will find:
• A guide to learning the ins and outs of data collection• Best practices for designing your survey• Tips for field data collection• A glossary of common data collection, mapping, and analysis terms
If you’ve ever wanted to learn how to collect data in the field, build a custom map, or just want to know more about the world of map making, this book is for you. If you’ve never conducted a field survey or collected data before, you’ll find the tips you need in this book to confidently conduct your first field data collection and mapping project.
It’s everything you’ll need to get started collecting better data with forms and surveys.
We hope this will help you better understand the planning and process that goes into any successful data collection and mapping project. As always if you have any questions, concerns, or comments, you can always reach out to us at [email protected]
Who Is This Guide For?
INTRODUCTION
Introduction

6 Fulcrum Guide to Data Collection
While most organizations collect some form of data in the field - whether it’s asset inventory, sales meetings, or facility inspections - many don’t make effective use of that data throughout their organizations. Data captured in the field is some of the most valuable business information at a company’s disposal. It reflects what’s happening at the point of transaction or the real picture of what’s going on at the job site.
Historically, it’s been a challenge to maintain close ties between a field service operation’s ground-level personnel and upper level management. Pen and paper data capture processes using triplicate forms meant that results couldn’t be delivered to decision makers without first going through a time-consuming process of transcription, cleanup, aggregation, and report-building. Often, by the time the results reach into the higher echelons, it’s been months since the information was collected.
In all cases, more timely flow of intelligence from the field is an enormous asset to an organization, allowing managers to make better decisions with up-to-the-minute answers to their questions.
Field data collection is one of the best ways to gain insights into the facts of an operation:
• What condition are our assets in?• Have we performed safety audits on all our job sites?• Are we in compliance at all our facilities?• Which work orders are completed and which aren’t?
Whether they’re inspectors, auditors, technicians, or salespeople, empowering your field staff with tools to contribute information they collect into an institutional knowledge base can benefit everyone.
The Value of Field Data

7
With a well-planned and designed field data collection process, you’ll be able to get rapid feedback from the field to save money, stay in compliance, and create more value from your field operations investments throughout your organization.
The Value of Field Data

8 Fulcrum Guide to Data Collection
From planning where to put a new business to maximize traffic, to plotting the shortest route for a delivery schedule, knowing the world around you is crucial to making better business decisions.
Geographers use a variety of tools to collect, process, and analyze their data to create maps, charts, and graphs that empower decision makers to make more informed choices. Collectively known as GIS, these tools make use of spatial data, or data collected with a spatial component, in order to plot information on maps. Collecting this data can be time-consuming, but has massive value for an organization.
The boom in location data available today has expanded the market for geographic data and tools. GIS software gives analysts the ability to use location data and spatial relationships to derive novel information. For many businesses, maintaining an accurate inventory is crucial for knowing what items are in stock, but that same data can be used in ways that make the business even more efficient.
For example, if one product sells more frequently in some locations but not in others, spatially tagged sales data can inform management to stock more in those locations, in order to maximize the number of products sold and reduce wasted shelf space. For decades, data analysis has focused on the “what” and “why” of data, but the spatial component adds more context by including the “where”.
Adding the Spatial Dimension

9
For a transportation company, having accurate and timely knowledge of which roads are blocked, the current weather conditions in an area, or the shortest path to a delivery can be critical. Mapping routes and alternate courses of travel can save hours of time and gallons of fuel, which add up to substantial cost savings in a short period of time.
For those fighting pandemics, knowing where ill people reside, and where they’ve traveled can help researchers track down the cause or source of a pathogen, saving lives and preventing future outbreaks. In fact, this approach is the same used by epidemiologist John Snow, who identified the pump that was causing London’s Cholera outbreak in 1854, by mapping the location of Cholera victims. By using this location data, he identified the source of the outbreak as a single water pump on Broad Street.
The collection and analysis of field data can help businesses, governments, and organizations make better use of resources. By better understanding the world around them, decision makers can make better choices. The real value of spatial information isn’t just in the knowledge of the world around you, it’s what you can do with that knowledge that makes it so valuable and powerful.
The Value of Field Data

10 Fulcrum Guide to Data Collection
What do I want to learn?
Having a clear and defined purpose for your field data collection project is imperative. On-the-ground surveys can be expensive, both in terms of time and money. You should clearly define your goals and objectives before conducting your data collection activities.
Begin by defining your purpose by analyzing precisely what data you need to collect to answer your question. There will likely be additional
Purpose
Every data collection process is composed of several distinct steps. From the initial scoping and design to the final results, understanding the overview of your workflow helps you comprehend the entire start-to-finish process. With a successful project design, you should have a good idea of not only what you want to collect, but also what you expect to do with the data at the end.
Data Collection 101

11
data you could collect while in the field but take caution against scope creep, or adding new work not contained in the original project. Any additional data collected can quickly increase costs and time spent conducting and completing your survey.
If what you’re looking to learn can be determined back in the office, don’t include it in your field data collection process. For example, why collect information that can be pre-loaded into your survey for collectors to validate, rather than collecting it from scratch?
Framing the question: What should I collect?
How you set up your data collection survey will be critical to its success. The way you design how observations are recorded will have a tremendous impact on the way the data is collected and how its later processed and analyzed. An effective survey is one that is specific and focused. You don’t want to go on a tangent away from your original purpose. “Nice to have” information can quickly take away from the precious time it takes for your team to conduct the survey; it should be scrutinized as to whether it really needs to be captured.
For your questions, provide appropriate answer choices to pick from. This includes framing your questions fairly and being inclusive while also keeping them brief and direct. Consider how the data will be processed and analyzed as you’re designing your survey. For example: do you want to allow a question to be answered with an open-ended response, or provide a range of structured answers to choose from instead?
Other things to consider surrounding your survey design include whether you will need supporting reference information while collecting the data. If a field user needs to verify that they’re within a certain area while collecting the observation, how will they be able to confirm that? Design and logistics go hand-in-hand. For example, will you be working in an area requiring access to cellular connectivity? Detailed tips and suggestions can be found in a later section on Survey Best Practices.
Survey Design
Data Collection 101

12 Fulcrum Guide to Data Collection
How will I collect it?
Your protocol should include training the personnel who will be collecting your data. The level of understanding and competency of your field staff will be reflected in the quality of your data. It will also be beneficial to have a long-term project timeline and schedule of daily activities.
Identify what personnel will be on your data collection team and determine if they will need to work together. Consider the logistics to safely and efficiently perform your survey. For example, your project may warrant a team of two - one driver and one person collecting data.
You may require certain conditions regarding weather and seasonality to be met before you can or when you cannot conduct your survey. As you define your procedure you will need to determine if you’ll be collecting the data while driving in vehicles, on-foot, or even remotely. Establish a schedule if there will be any revisit frequency to your data collection.
Protocol

13
How will I process the information?
What insights can I gather? What does the data suggest?
After you collect a batch of data, it may require processing for your eventual analysis or visualization. This step in the process can vary greatly depending on how the data is being collected and what’s required to make the raw data usable. Placing emphasis upon optimal design and an effective protocol step will benefit the processing piece of your workflow. If your protocol dictates that data will be collected with paper and pencil, you will require a post-collection processing task where results are transcribed into a computer spreadsheet or database.
Each additional step in the processing portion of data collection can introduce opportunities for error. Whether it’s human error while transferring data from paper to electronic form, or using incorrect parameters in a programmatic conversion - each additional step added introduces an opportunity for error.
After defining the original purpose for collecting, gathering, and processing your data, you will need to analyze your results. Diving deep into the information collected from your survey provides the answer to what you were originally motivated to find out - and sometimes more! A thorough evaluation of the findings from your data may suggest conclusions which were only hypothesized before. If your analysis can replace subjective decision support with measurable facts, you will have more confidence in your conclusion.
Processing
Analysis
Data Collection 101
How will I share the data?
After your data has been processed and analyzed, you will likely want to distribute or publish the findings. There are various methods to convey
Distribution

14 Fulcrum Guide to Data Collection
your results: tabular, map, charts, graphics, etc. Often, a combination of methods will be helpful to tell your story but it is important to use the right approach in order to achieve maximum effectiveness.
Not all data collection workflows are created equally! Some tools are built upon platforms which allow your data to be instantly distributed in a variety of formats once it’s collected. There are also other integrations to consider, such as the ability to publish your data once and then connect it to other 3rd-party services.

15
The best approach to building a survey is to work backwards. Identify what you want to learn and how you want to measure the results before you begin designing. Much of effective survey design is about not just what to collect, but also how it’s collected. Thinking about the end goal keeps you focused on results first, and process second. Starting at the end lets you create a process that matches your desired end state. Once you’ve identified what “success” looks like, you can analyze the details of what observations you need to collect and in what order.
The first step is to identify the information you need to reach a successful result — does your data answer all the right questions? By starting at the end, you can visualize how you want to present your information. Create a hypothesis that is testable and measurable, and from that determine what data you need to collect.
What do I want to know?
Building Your Survey
Building Your Survey

16 Fulcrum Guide to Data Collection
The next step is to identify metrics that will guide your decision making. Identifying these before conducting your survey will ensure objectivity in your survey by avoiding bias through after-the-fact analysis. The point in conducting a survey is to gain real-world knowledge, not to prove a specific point. Your data should be factual information that you can then use to derive answers. Identifying these key indicators will feed into the specific data to capture in your survey.
If your data supports your hypothesis, great! If it doesn’t, it’s never advisable or ethical to bend the data in a way to support your position. Also, avoid framing questions in a way that leads people to a desired conclusion, in order to avoid bias in your data.
What metrics should I use?
Next, you should break down your desired result into its individual components. Perhaps to answer your questions, your survey needs 25 different pieces of data. In that case, organize them in a fashion that makes it efficient for a field collector to fill out the survey. People often make 2 major mistakes in this process: They either try to collect everything they can, or as little as they can, and both of these approaches can cause problems.
Collecting too little data can make your survey lack enough information for meaningful answers. Collecting too much data can lead to people terminating a survey midway through. Both have their advantages, of course. A short and sweet survey means rapid data capture, but light on the depth. An incredibly detailed survey maximizes the time in the field with a lot of content in the end, but takes longer to perform. Get a feel for the time it takes to complete the survey by conducting some mock collection. The goal should be to strike the right balance of data depth and efficiency.
Try to isolate the fewest number of key data needed for your project, and add additional fields or a comment section as a catchall for general use. It’s a good idea to have general “comments” fields for collectors to leave notes or other insightful info from the field.
What data should I collect?
17
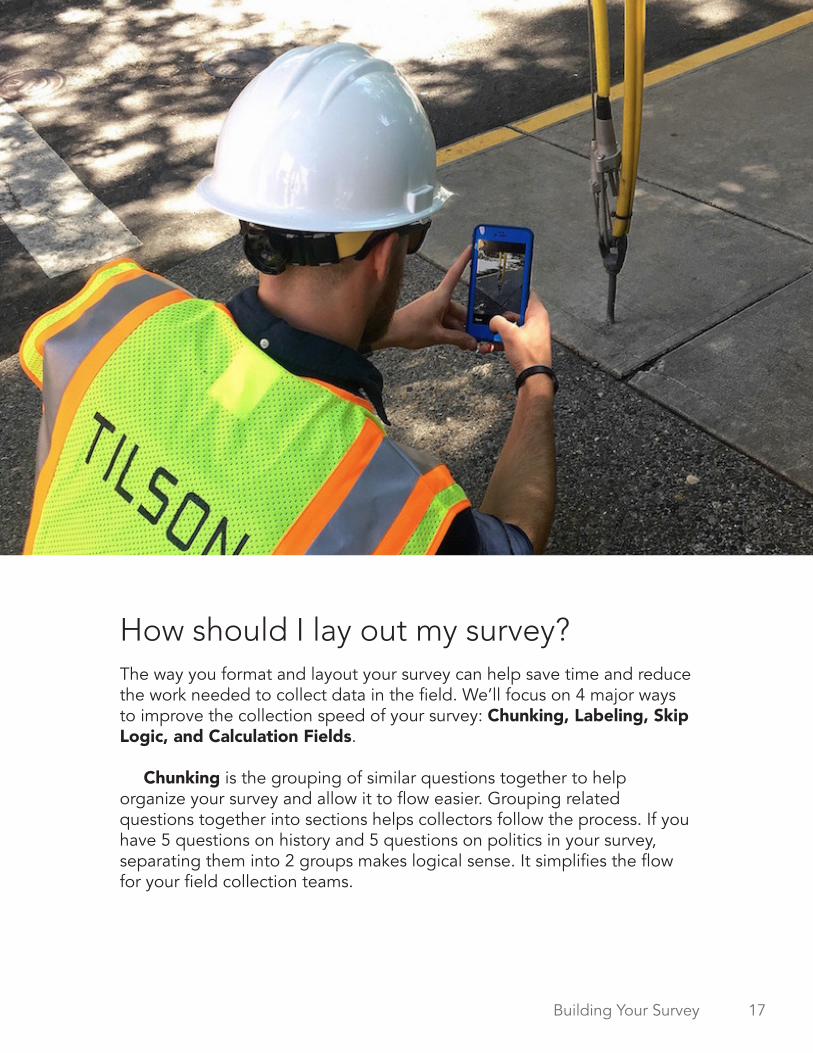
The way you format and layout your survey can help save time and reduce the work needed to collect data in the field. We’ll focus on 4 major ways to improve the collection speed of your survey: Chunking, Labeling, Skip Logic, and Calculation Fields.
Chunking is the grouping of similar questions together to help organize your survey and allow it to flow easier. Grouping related questions together into sections helps collectors follow the process. If you have 5 questions on history and 5 questions on politics in your survey, separating them into 2 groups makes logical sense. It simplifies the flow for your field collection teams.
How should I lay out my survey?
Building Your Survey

18 Fulcrum Guide to Data Collection
Labeling is the method of adding a label to chunks of questions you’ve already grouped together. This helps the surveyor understand the purpose behind the various of blocks of questions they are collecting, and gives them an idea as to how far along they are in the survey. When a survey is well labeled, a surveyor can parse a long question set easily, and find a specific question without having to read each question and entry to find a piece of information later on.
Skip Logic refers to the use of logical conditions to determine how the survey flows. Skip logic is key for keeping only the relevant questions in front of a collector. If a user answers a question that makes later questions irrelevant, skip logic allows you to bypass those questions entirely rather than wasting time having to scroll past them. In an ideal setup, a survey should only ever present relevant questions to the data collector.
Calculation Fields allow you to conduct simple or complex calculations instantly by using other questions as inputs. For example, rather than having to tally up responses by hand, or use a calculator to determine the volume or area of a space, a calculation field can be used to take your initial measurements and generate an answer instantly. This is useful for individuals in engineering and construction who have to take specific measurements to create an estimate, right on site.
After you initially deploy a survey to a collection team, there will usually be modifications to make after it’s in the field. In the days of pen and paper surveys, this was naturally a hassle to deal with, requiring editing PDF templates and re-printing new batches of forms to distribute. As a result, organizations using a method like this are tempted to overload their survey with every possible thing (see the chapter on best practices). Because of the inefficiency of making changes to paper surveys, many positive survey structure changes would never be made.
Handling Changes

19
With digital tools like Fulcrum, updating survey template structures ismore realistic. Given that the survey on a collector’s device is digital, syncing with the server allows the user to receive the latest version automatically, without any need for memos or meetings to bring a team up to speed.
Building Your Survey

20 Fulcrum Guide to Data Collection
Conducting surveys can provide useful answers to specific questions. Surveys don’t need to be complex or exhausting to provide valuable information and insights. If you’ve ever wondered how to conduct a good survey, these tips will help.
Ensure you’re asking for pertinent information only. Avoid unnecessary details, feelings, and opinions unless they are important to your investigation. Staying focused on data critical to your objectives also keeps the process working smoothly without unnecessary delay. The “nice to have” information is great to collect if you can, but you don’t want the collection of optional data to detract from your primary data points.
Keep questions relevant and specific
Keep your questions as direct and to-the-point as possible. The more specific the question, the less risk there is of a collector misreading the question and answering incorrectly. Breaking up a survey into many smaller questions versus a few long ones results in richer, more useful data in the end. An added benefit of short, direct questions is the data capture process can flow with fewer delays and require less thinking from element to element.
Make questions short
Survey Best Practices

21
Use simple languageBe clear and obvious about what you’re asking. Avoid flowery language, terminology, and euphemisms, and ask questions in an unbiased, objective fashion. Sometimes, technical jargon may be required, but keep in mind the audience that’s being asked to complete the survey. Ask yourself: Is this term something my target audience will understand? The best data collection surveys can often be deployed and used with minimal training of collectors in the specifics.
One question, one answer. Ask for one thing at a time, and avoid open-ended questions without a clear answer. Breaking up a survey into more small questions rather than few large ones provides the added benefit of being able to slice up the data in myriad different ways once you’ve finished your project. Analysts can get more granular in querying the data for answers.
Ask about one thing at a time
Phrase your questions to be considerate, inclusive, and respectful. Don’t frame up or lead the question with unnecessary adjectives and adverbs that may bias a respondee’s answer. Remain objective and avoid asking questions that may direct or lead the subject to answer in a particular way.
Avoid biased language & leading questions
Phrasing questions negatively can be confusing and may bias your responses. It can be confusing to ask about what is not, instead ask about what is. If you can reduce questions down to a binary “yes or no” question, that makes things even simpler for the collector to understand.
Put questions in a positive form
Survey Best Practices

22 Fulcrum Guide to Data Collection
Give a range of answers that are inclusive and thorough. Avoid errors of omission by including multiple options that cover all possible responses to the question. Using an “Other” option within choice lists helps avoid getting overly specific with options that are predetermined.
Offer a balanced set of responses
Sometimes in the field, you might find important notes, data, or additional information you may want to relay to the analysts. An optional comments section at the bottom of your survey allows the addition of important information that otherwise might have been overlooked. It functions as a good catch-all for anything your survey model might not have accommodated for.
Add a comments section for field notes
The order in which you display the questions on your survey form can make the difference between correct and inaccurate data. This is where field testing helps you iterate your design process to get the structure just right. For ease-of-use, most of the time your questions should flow in the order the collector typically conducts the survey. If they’re doing a construction site walkthrough inspection, structure the survey in the order the inspector moves through the site.
Consider the ordering of questions
23
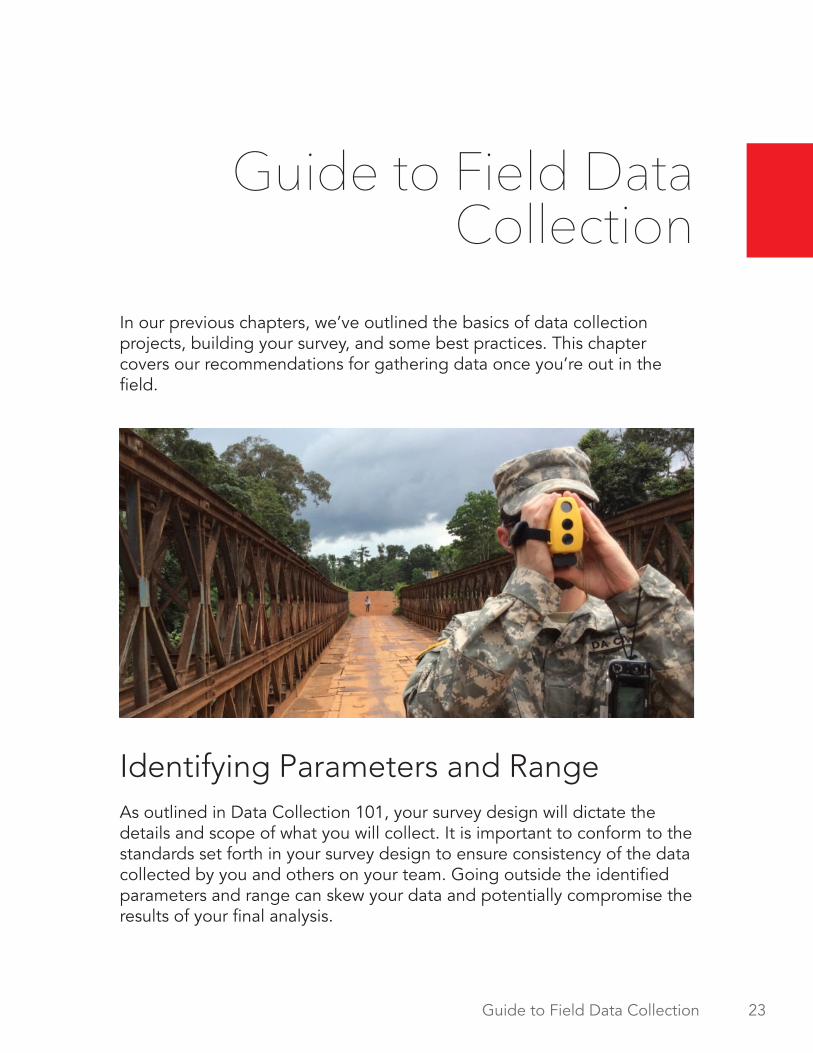
In our previous chapters, we’ve outlined the basics of data collection projects, building your survey, and some best practices. This chapter covers our recommendations for gathering data once you’re out in the field.
As outlined in Data Collection 101, your survey design will dictate the details and scope of what you will collect. It is important to conform to the standards set forth in your survey design to ensure consistency of the data collected by you and others on your team. Going outside the identified parameters and range can skew your data and potentially compromise the results of your final analysis.
Identifying Parameters and Range
Guide to Field Data Collection
Guide to Field Data Collection

24 Fulcrum Guide to Data Collection
Before you depart for your data collection mission, it may seem obvious that you know ‘where’ you’re going to do your work, but there is more to it than that. Having a plan before you start gathering data in the field is an essential first step. A few things you’ll want to take into consideration are: how many hours in the day it will be possible to collect data, the spatial relationship between collection sites, and how long it takes to complete your survey at each location. Does it makes more sense to travel to the furthest location first - and work backwards? If you have multiple sites to visit, there will be an optimal route you can take rather than doing so in a random order.
Plotting Course

25
Other logistics to include in your planning:
• Do you have any needed permission, codes, or keys for access to sites on private property?
• Will you need personal protection from the elements, pests, animals, etc?
• What is your plan in the case of an emergency or injury?• (If traveling by vehicle) Is your vehicle properly maintained, capable,
and with adequate fuel?
A core component of Fulcrum as a field data collection tool is the included set of basemaps. Fulcrum mobile users are provided map reference information from Google when they are within a (Internet) connected environment. The Streets, Aerial/Satellite, Hybrid, and Terrain basemaps are available to choose from, as well as the ability to choose ‘None’.
There are situations where you will want to collect data in a disconnected environment and you require map reference information to complete your task. Not only does Fulcrum have the functionality to collect data offline but it also allows you to use interactive offline maps. There are examples on the website for using both the vector and raster GIS data types in your offline map creation.
Another basemap layer type which is available to the mobile user is Tile XYZ. If you seek access to layers hosted in a Tile XYZ tiling scheme, they can be added as a reference layer within Fulcrum.
Using Basemaps
Guide to Field Data Collection

26 Fulcrum Guide to Data Collection
Not only does Fulcrum make it easy to import and collect data but it also has robust options for exporting your data. All Fulcrum plans support exporting data in these 9 different formats: CSV, Microsoft Excel, KML (Google Earth), Esri Shapefile, GeoJSON, Esri File Geodatabase, SQLite, SpatiaLite, PostGIS. Along with these formats are various export options to control exactly what you need to export, including: filtering by geographic area or the date the record was created or updated and whether to export multiple apps and/or projects’ data at once.
After you’ve built your survey, deployed it, and collected some data in the field - you will likely be ready to visualize, analyze, or process that data. One of the benefits of conducting field data collection with the Fulcrum platform is that your data is entered into a system that’s capable of powerful integrations with other services and platforms. Here are a few examples of how you can leverage Fulcrum’s extensibility:
• Data Shares• Fulcrum API• Data Events• Zapier
Exporting the Data
Integration with Other Platforms
Post-collection Considerations

27

28 Fulcrum Guide to Data Collection
When Premier began transitioning their fieldwork operations to the Fulcrum platform, they requested technical support to help facilitate this transition. Premier was preparing for a large gas meter inspection and leak detection project in upstate New York. This project involved surveying
Fulcrum Integration
• Est. 2001• Offices in Hauppauge, NY• usicllc.com
Our Oil, Gas, and Energy case study focuses around Premier Utility Services, a global contractor specializing in energy infrastructure.
Case Study: Premier Utility Services

29
After a series of conference calls, Fulcrum staff spent a full day on-site at Premier’s office to review their existing forms and process workflow. We worked together to define a standard process for importing records, filtering the data, scheduling field work, and tracking inspection results. This collaboration also helped accelerate the development of several key features in Fulcrum, including hyperlink functionality.
Since Premier was already using CartoDB as part of their internal GIS, they took advantage of Fulcrum webhooks to push field data directly to CartoDB. Where Fulcrum excels at mobile data collection and management, CartoDB excels at dynamic data visualization and mapping. This workflow provided additional tools for querying, displaying, and exporting the data as it streamed in from the field.
Custom dashboard applications were developed using the CartoDB.js API to give Premier staff and their clients tools for viewing, analyzing, and updating their data. Once an inspection was scheduled by office staff, that information was immediately available to field staff on their mobile device. Project Managers and clients could access the dashboard to filter data on various fields, run standard reports, search records, and export spreadsheets.
“Fulcrum is revolutionizing the way we conduct damage prevention and leak detection.”
over 3,300 miles of pipeline and the inspection of over half a million gas meters, which included a scheduling component to facilitate field visits for meters located inside buildings.
Working Together
CartoDB Coupling
Case Study: Premier Utility Services

30 Fulcrum Guide to Data Collection
Premier is utilizing Fulcrum to push the boundaries of large scale digital data collection in the utility industry. All of their field technicians are equipped with mobile devices capable of retrieving and submitting critical information on the assets they manage. The result is a streamlined workflow that not only saves time and money, but provides more accurate results that are easily accessible to decision makers.
A Revolutionary Technology

31
Century Engineering, Inc. (Century) is proud to work with the Delaware Department of Transportation Railroad Program (DelDOT) providing engineering design and technology solutions services related to over 500
Program Management Solutions with Fulcrum
Case Study: Century Engineering
• Est. 1974• Offices: Maryland, Delaware, Pennsylvania, Virginia• centuryeng.com
Our Asset Management case study focuses around Century Engineering, Inc., a full service engineering consulting firm offering expertise in Civil, Mechanical, Structural, and Geospatial Technology Solutions.
Case Study: Century Engineering

32 Fulcrum Guide to Data Collection
railroad crossings that they manage and maintain statewide. DelDOT is responsible for ensuring that all crossings promote safe travel for Delaware citizens, visitors, and railroad operators. This responsibility comes with the task of ensuring all railroad crossing structures are operational and compliant based on Federal and State regulations (ADA and MUTCD). In addition to maintaining the physical assets of the State’s railroad crossings, DelDOT also handles public complaints, reported incidents, and coordinates / monitors all construction activities related to maintenance and redesign projects.
Century has developed an enterprise data solution to allow DelDOT to better manage their assets, as well as improve accessibility to the information that supports their decision-making. Fulcrum enabled the rapid development of a comprehensive data model for the storage of all crossing-related data including: physical crossing assets, recorded incidents, maintenance schedules and construction projects. Multiple teams are able to access this database though the sophisticated Fulcrum iOS and Android apps for the collection of numerous field assets. Through the use of the Fulcrum API, Century was able to build a suite of web-based applications to allow DelDOT to see the collected data in real-time.
DelDOT’s RPMS leverages several leading technologies that support flexibility and scalability, as the client’s needs change over time and through continued use.
• Fulcrum for core database and mobile data capture• CartoDB for presentation, and interactivity• AngularJS for web application development• Bootleaf for map presentation• D3.js for data visualization
DelDOT Railroad Program Management System

33
Fulcrum was used to perform a statewide asset inventory/assessment to construct DelDOT’s railroad database. Features collected include crossing surface limits, warning devices, rail equipment, signs and striping. The location of each feature was captured along with photo documentation and descriptors about the condition of each asset. Fulcrum streamlines this process by integrating all photo handling natively, eliminating the need to post-process data and providing decision-makers instant access to ground conditions. Since each railroad crossing contains multiple assets, we were able to leverage Fulcrum’s Repeatable data type to support the complex data relationships required. The asset inventory serves as the information core by which all decisions related to maintenance, reconstruction planning, and budgeting are derived.
The Incident Reporting app supports the recording of all railroad-related incidents including auto/pedestrian accidents, citizen complaints, and any reported structure malfunction or failure. The application is structured as a web-based entry tool, supported by the Fulcrum API, which enabled integrated dispatch and incident remediation tracking. Once a new incident is created, the record is highlighted for field review via the Fulcrum status data type. Using the Fulcrum mobile app, field inspectors document the ground conditions, capture photographs, and recommend necessary action steps for remediation. All completed action steps are entered into the incident record. This provides a lineage of remediation steps and supports DelDOT’s incident response accountability.
Asset Inventory and Inspection
Incident Reporting
Case Study: Century Engineering
“Fulcrum is far more than just a mobiledata collection platform.”

34 Fulcrum Guide to Data Collection
Century has also assisted DelDOT in the migration from analog (paper/pencil) construction monitoring practices to a fully digital approach with Fulcrum. The Construction Monitoring application provides inspectors with a tool to document all aspects of construction projects from materials, personnel, and equipment quantities to representative signatures and detailed photo documentation. Since railroad construction projects often stretch over multiple days, if not weeks or months, it is important to be able to track progress and quantities to ensure projects are not at risk of falling behind schedule or beyond budget. The collected data is made available, in real-time, via a custom webhook that pushes Fulcrum data to CartoDB, and is presented to office team members through the Construction Monitoring web application. This supports real-time decision-making in the event of unforeseen issues so that potential impacts to construction can be immediately addressed.
To date, Century has leveraged Fulcrum to assist DelDOT with the inventory of over 600 public and private, at-grade and grade separated railroad crossings, as well as the detailed tracking of over 30 crossing
Construction Monitoring
RPMS Summary

35
Century chose Fulcrum for many reasons, but primarily for its unmatched mobile data collection capabilities, and the ability to easily integrate with other technologies to provide our clients with comprehensive program management solutions. Additionally, Fulcrum provides:
• The ability to centralize data for enterprise consumption and dissemination
• Support for complex data structures characteristic of most field survey tasks
• Adaptability and flexibility to adjust database and mobile interfaces on the fly based on field comments and modifications to data requirements
• A clean and simple mobile app interface that enables us to hide unnecessary data complexities and allows field teams to focus solely on
redesign/reconstruction projects. This includes:
• The collection of over 700 active railroad crossing warning devices• Capture of over 3,600 railroad-related equipment, striping and warning
signs• Monitoring and documentation of over 1,200 hours of active
construction• Cataloging over 15,000 asset and construction photographs
RPMS provides DelDOT with several benefits including:
• Accountability and transparency through detailed documentation and action reporting
• Centralization of all data used to support the daily operations of the DelDOT Railroad Program
• Real time data delivery allowing project managers to make informed decisions based on current conditions
• Fulfillment of internal and federal reporting requirements (Federal Railroad Administration (FRA))
• Seamless, multi-lateral communication between office and field teams
Why Fulcrum?
Case Study: Century Engineering
36 Fulcrum Guide to Data Collection
the job of inventory, inspection, and documentation• Data accessibility made easy through the Fulcrum Dashboard, Data
Shares or through custom applications driven by the Fulcrum API and/or webhooks
• Real-time synchronization and information sharing• Automated handling of voluminous collections of photographs
and videos without the extensive post-processing found in legacy workflows
• Support for pairing peripheral Bluetooth GNSS/GPS receivers for high precision location capture on tablets and smart phones
• Multi-team deployment and data conflict resolution
Fulcrum has become a core component of the services provided by Century’s Geospatial Technologies (GIS) team. The ability to access Fulcrum from external software/web-based solutions allows us to build enterprise-level tools to fulfill our clients’ asset management, mapping, and reporting requirements. We find that industry alternatives are far more expensive while offering far less than what we can achieve with the Fulcrum platform. In 2014, Century leveraged Fulcrum to construct over 30 individual apps comprised of over 30,000 data points and over 40,000 photographs. We look forward to seeing what the Fulcrum Team brings in the future, and we are constantly searching for new ways to use the product for improved data management practices and enhanced decision-making.

37
AddressA location of a residence or workplace, designated with numbers and/or letters, and arranged in a format for easy reference on a map.
Alphanumeric GridA grid with letter and number ordination used to easy locate places and features.
AnnotationText, images, or notes on a map used to provide information to the user.
APIA set of commands, tools, and protocols used to interact directly with information in a program.
AssessmentAn evaluation of something to determine its quality, quantity, or state.
AttributeA piece of information which describes an object or feature.
BasemapA foundational layer for a map that provides context and reference information for other data layers to be overlaid.
Glossary
Glossary

38 Fulcrum Guide to Data Collection
BiogeographyThe study of how species are distributed across the planet and their evolution.
BoundaryA line which delineates an area.
Boolean ValueA data type or variable with two possible values: true or false.
Boundary SurveyAn evaluation by measurements, conducted by a professionally licensed surveyor which establishes the corners of a legal parcel of land.
CADComputer-aided design - CAD, utilizes computer software to facilitate drawing, analyzing, and disseminating technical designs. It is typically used in architectural, engineering, and machining workflows.
Calculation FieldCalculation fields can be used to write simple expressions to calculate values dynamically based on inputs given to other fields in your forms. This can be simple ‘total’ calculations or complex equations referencing other calculation fields and even data contained in repeatable sections. Calculated field expressions can be written in JavaScript, even as complex functions (and entire programs).
CalibrationReadings and adjustments compared against a standard to ensure accuracy, typically with instruments or equipment.
CartographyThe science of map creation.

39
CellWith spreadsheets or raster data, cells are the intersections of rows and columns.
Cartographic GeneralizationThe process of reducing the detail of the features being represented within a visualization.
CentroidThe center point of a geometric object such as a line or polygon.
CharacterA letter or symbol.
CompassA device which indicates the direction of magnetic north and references the bearing to the other cardinal directions.
CompressionA process run upon some data whereby it is transported or stored in a smaller size than its original composition.
ConcatenateTo link or chain things together, in series.
ConditionalA concept in programming where different actions are executed depending upon whether a boolean value is met.
ContourA line joining points of equal elevation, typically represented on a map or as a dataset.
Glossary

40 Fulcrum Guide to Data Collection
CoordinateA set of numbers representing a position.
Cultural GeographyThe study of various aspects of human culture across the globe and throughout time.
DatabaseA collection of data that is stored in a manner which enables efficient retrieval.
Data CollectorA data collector can be a person and/or a device. The data collector records observations, states, or quantities of a particular subject.
Data Collection/Data CaptureA process whereby observations are documented according to a predetermined set of criteria.
DatasetA collection of related data.
Data TypeThe classification of data which determines what sort of values can be stored and how it can be used.
DatumIn Geodesy, a datum is a mathematical equation which defines a reference from which measurements can be taken.
DegreeA unit of measurement of angles.

41Glossary
DensityThe distribution or quantity of something per unit of area.
DimensionA physical measurement of a property of an object.
DistributionThe spatial arrangement of an object or species.
EdgeThe outside limit of an object, area, or surface.
ElevationThe height above a given point.
EnvelopeThe box drawn around one or many features, also known as a Bounding Box.
EquatorThe line of latitude that falls equidistant between the north and south poles, with the measurement of 0°.
ErrorA mistake, inaccuracy, or miscalculation.
ExtrapolationThe act of projecting a conclusion based upon existing data and current trends.
ExportIn computing, an output of data in a particular format type.

42 Fulcrum Guide to Data Collection
FeatureA distinct attribute or property.
Form FieldAn element of a record, representing a single piece of data.Form Fields have different available types, including:
• Text• Numeric• Yes / No• Label• Single Choice• Multiple Choice• Classification Set• Photo Fields• Video• Audio• Barcode• Date & Time• Sections
FilterThe process of including only a desired subset from the original dataset.
GeocodingThe process of deriving coordinates from a physical address.
GeodatabaseA database with the specialized ability to create, handle, and store geographic data.
GeodesyThe science and mathematics related to the shape of the earth, its position in space, and gravity.

43Glossary
GeographyThe science and study of the earth, its inhabitants, physical features, and atmosphere.
GeometryThe branch of mathematics concerned with the properties and relations of shapes.
GISAn acronym for Geographic Information System - A collection of hardware, software, data, and personnel which together form a system for creating, updating, and disseminating geographic information.
GPSA navigation system which consists of a network of orbiting satellites, ground control stations, and user receivers. One way signals are transmitted to users with positioning, navigation, and timing data as long as devices have a clear line-of-sight with four or more satellites.
GMTAn acronym for Greenwich Mean Time, GMT is the former world time standard but has been since replaced by Coordinated Universal Time (UTC). They are generally considered equivalent.
Ground TruthingVerifying a record of observation directly at the subject’s site.
International Date LineThe imaginary line running approximately along 180° longitude which demarcates one day from another.
InterpolationThe act of estimating a value within two known values.

44 Fulcrum Guide to Data Collection
JoiningWhen two or more columns from tables in a relational database are combined using values common to each.
LatitudeThe angular distance of a point, north or south of the equator.
LongitudeThe angular distance of a point, east or west of the Prime Meridian.
LayerIn GIS, a layer is a graphical representation of geographic data.
LegendA map element which helps the user understand the symbology.
MeanThe average in a set of numbers; add together the numbers in the set and divide by how many numbers there are.
MedianThe middle number in a set of numbers; if there are two numbers in the middle position, take the average of those.
Metes And BoundsA method of documenting land (as property), in which ‘metes’ describe the distances between points and ‘bounds’ refer to the prominent features and general layout of the area.
MonitoringA repeated process or workflow which observes or records something.
NadirThe direction below a position - opposite of zenith.

45Glossary
NavigationThe practice of determining ones location and accurately orienting your course to an intended destination.
NoiseDistortions in a signal which interfere with the intended message.
Null IslandAn invented geography with the coordinates 0°, 0°. Null Island is a concept derived from the results of geocoding data where the intended coordinates could not be matched for the entered address - resulting in a “0,0” being returned.
ParcelA legal boundary of land ownership.
PlatA map document which primarily details land ownership parcels, but also describes boundaries and other relevant reference information. Also known as a Cadastral Map.
PrecisionThe closeness of measured values.
PilotingTesting or trial of a process before fully conducting it.
QualitativeOf or pertaining to analysis of the quality of something.
QuantitativeOf or pertaining to analysis of the quantity of something.

46 Fulcrum Guide to Data Collection
QueryA detailed request for information made against some data.
RasterA type of GIS data which consists of a series of gridded cells that contain values representing various information such as elevation.
RecordAn individual collection of values in a larger dataset.
Sample / SamplingAn observation or collected record / the process of collecting data.
ScaleThe conversion factor between the distance on a map and that actual distance on the ground.
ShapefileDeveloped by the company Esri, a Shapefile is a combination of files which together represent vector geometry and attributes of GIS data.
SQLAn acronym for Structured Query Language, SQL is the primary language for manipulating databases.
SurveyingThe science of assessing and documenting lands for precise measurement and evaluation.
SymbologyIn cartography, the use of characters, symbols, or styles for representation of meaning.

47
Spatial DataA piece of information with a spatial or geographic component.
TableNumbers or values arranged in rows and columns.
TheodoliteA surveying instrument for measuring horizontal and vertical angles.
TileSmall and numerous images of map data that together combine to form a larger map - typically viewed on the web.
Tile ServerA collection of databases, libraries, and software which work together to return the correct map tiles to the requesting client.
URLAn acronym for Uniform Resource Locator, URL is a reference to a resource on the Internet.
USGSA scientific agency of the US Govenrment focusing on geography, natural sciences, earth science and biology.
UTMAn acronym for Universal Transverse Mercator, UTM is a coordinate system for the earth. UTM is not one single coordinate system but instead divides the earth into 60 different zones - each with their own projection.
VariableA name which is assigned a value.
Glossary

48 Fulcrum Guide to Data Collection
VectorIn GIS, features composed of point, line, or polygon geometry.
WaypointA point of reference generally associated with GPS units as stored coordinates with a few basic attributes.
WGS84An acronym for World Geodetic Survey 1984, WGS is the standard coordinate system for the earth. It was established in 1984 and is used by GPS.
ZenithThe direction above a position - opposite of nadir.
ZoomThe action of increasing or decreasing a viewshed.

49Attribution
Attribution
Wildlife biologists (page 7)https://www.flickr.com/photos/usgs_uas_project_office/19472017876/
Helping people injured (page 9)https://www.flickr.com/photos/dfid/17204679049/
Water sampling (page 10)https://www.flickr.com/photos/iaea_imagebank/10723081213/
Irish Summer (page 12)https://www.flickr.com/photos/23629083@N03/6098106484/
Surveying birds (page 22)https://www.flickr.com/photos/alaskanps/16290334145/
Bridge recon (page 23) https://www.flickr.com/photos/europedistrict/15760316759/
Field map (page 24)https://www.flickr.com/photos/yancy9a/6073564952/
Portland GPS Logs - 2008-2012 (page 27)https://www.flickr.com/photos/aaronpk/6958109913/

50 Fulcrum Guide to Data Collection
Fulcrum Mobile Solutions, LLC