2. fy2021 financial forecast 3. business highlight
TRANSCRIPT
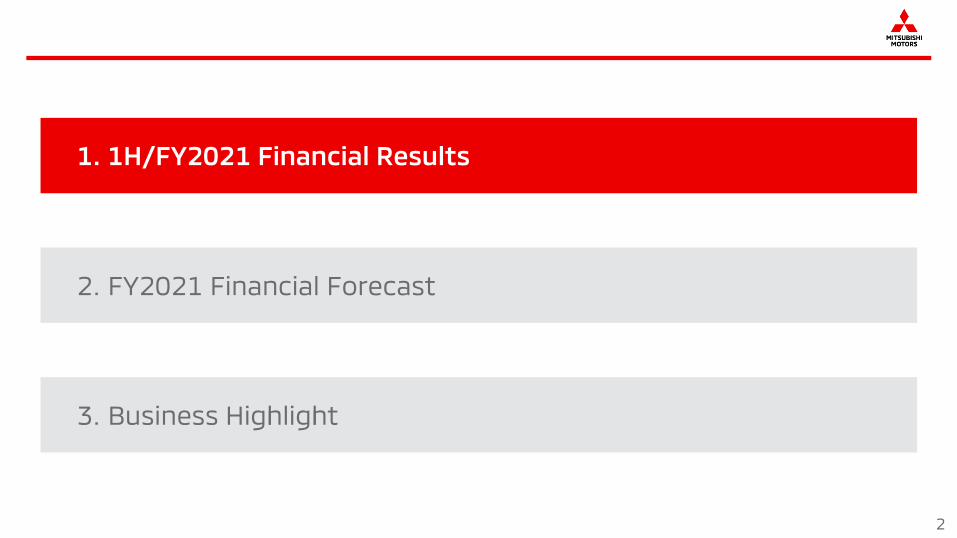
3. Business Highlight
2
1. 1H/FY2021 Financial Results
2. FY2021 Financial Forecast
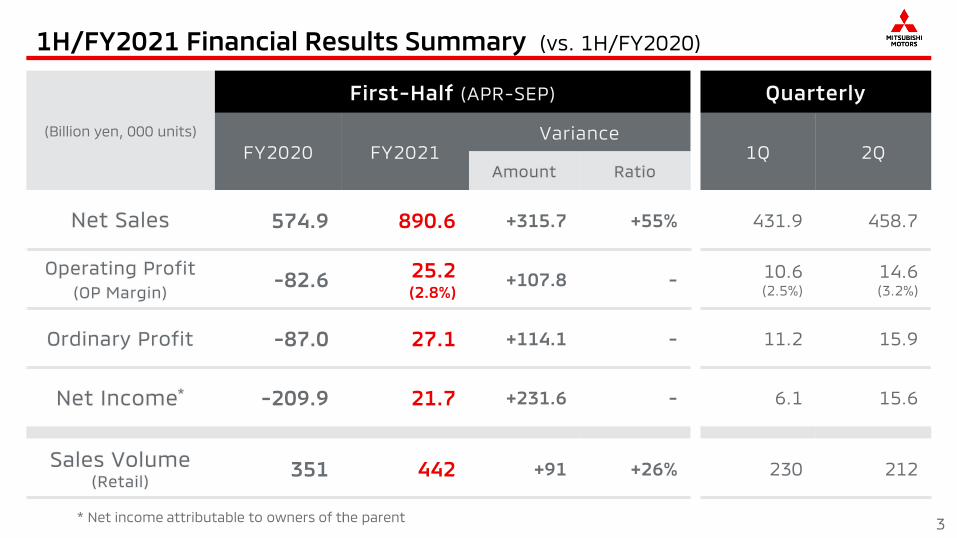
* Net income attributable to owners of the parent
1H/FY2021 Financial Results Summary (vs. 1H/FY2020)
3
(Billion yen, 000 units)
574.9 890.6 +315.7 +55% 431.9 458.7
-82.6 25.2(2.8%)
+107.8 - 10.6(2.5%)
14.6(3.2%)
-87.0 27.1 +114.1 - 11.2 15.9
-209.9 21.7 +231.6 - 6.1 15.6
351 442 +91 +26% 230 212
1H/
FY2020 (APR-SEP 2020)
1H/
FY2021(APR-SEP 2021)
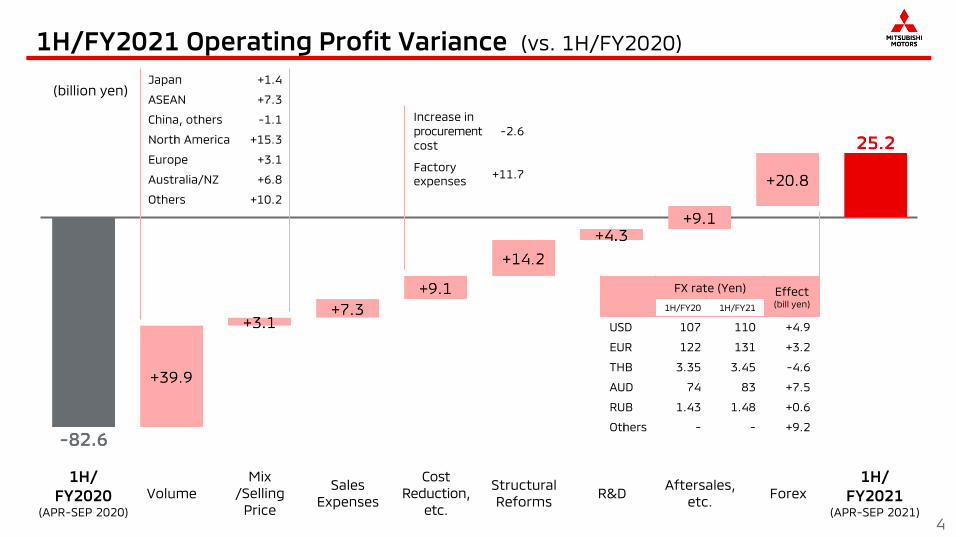
(billion yen)
1H/FY2021 Operating Profit Variance (vs. 1H/FY2020)
4
Aftersales,
etc.ForexVolume
Sales
Expenses
Cost
Reduction,
etc.
Mix
/Selling
Price
Structural
ReformsR&D
FX rate (Yen) Effect(bill yen)1H/FY20 1H/FY21
USD 107 110 +4.9
EUR 122 131 +3.2
THB 3.35 3.45 -4.6
AUD 74 83 +7.5
RUB 1.43 1.48 +0.6
Others - - +9.2
Japan +1.4
ASEAN +7.3
China, others -1.1
North America +15.3
Europe +3.1
Australia/NZ +6.8
Others +10.2
Increase in
procurement
cost
-2.6
Factory
expenses +11.7

2Q/
FY2020 (JUL-SEP 2020)
2Q/
FY2021(JUL-SEP 2021)
(billion yen)
2Q/FY2021 Operating Profit Variance (vs. 2Q/FY2020)
5
Others ForexVolumeSales
Expenses
Cost
Reduction,
etc.
Mix
/Selling
Price
Structural
ReformsR&D
FX rate (Yen) Effect(bill yen)2Q/FY20 2Q/FY21
USD 106 110 +3.2
EUR 124 130 +1.1
THB 3.37 3.39 -1.0
AUD 76 82 +1.2
RUB 1.45 1.50 +0.3
Others - - +4.2
Japan +0.6
ASEAN -2.1
China, others -1.0
North America +3.9
Europe +1.4
Australia/NZ +2.3
Others +5.4
Procurement
cost
reduction
+1.4
Factory
expenses +5.6
Aftersales +2.0
Indirect labor
cost, etc.+6.9
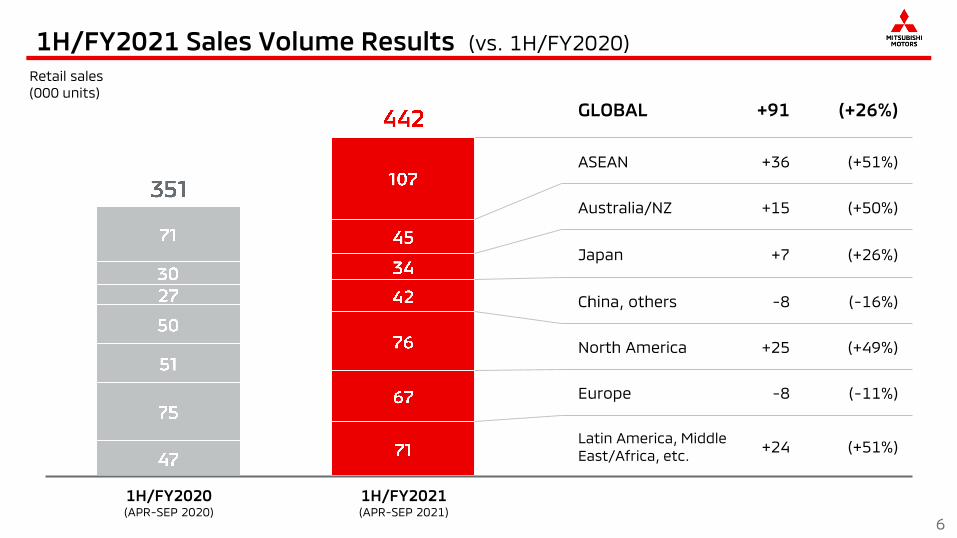
1H/FY2021 Sales Volume Results (vs. 1H/FY2020)
6
Retail sales
(000 units)
1H/FY2020(APR-SEP 2020)
1H/FY2021(APR-SEP 2021)
GLOBAL +91 (+26%)
ASEAN +36 (+51%)
Australia/NZ +15 (+50%)
Japan +7 (+26%)
China, others -8 (-16%)
North America +25 (+49%)
Europe -8 (-11%)
Latin America, Middle
East/Africa, etc.+24 (+51%)

Sales in Our Core Market: ASEAN
7
ASEAN
Struggled to sell in Thailand, Philippines and Vietnam, where COVID-19 reemerged
In Indonesia, not only XPANDER enjoying luxury tax exemptions, but also mainstay
models, such as TRITON attracting strong inquiries due to strong mining and
logistics demand, are performing well
Continue to work on measures to strengthen sales in each country, such as
strengthening digital marketing and improving the success rate through the use of
loan programs, in addition to continuing to strengthen product appeal
Sales Volume / Market ShareAccording to research
1H/FY2020 1H/FY2021
ASEAN 71k units 107k units
Thailand 24k units (7.0%) 21k units (6.2%)
Philippines 14k units (15.6%) 15k units (11.8%)
Vietnam 12k units (9.2%) 10k units (9.0%)
Indonesia 16k units (8.3%) 53k units (12.6%)
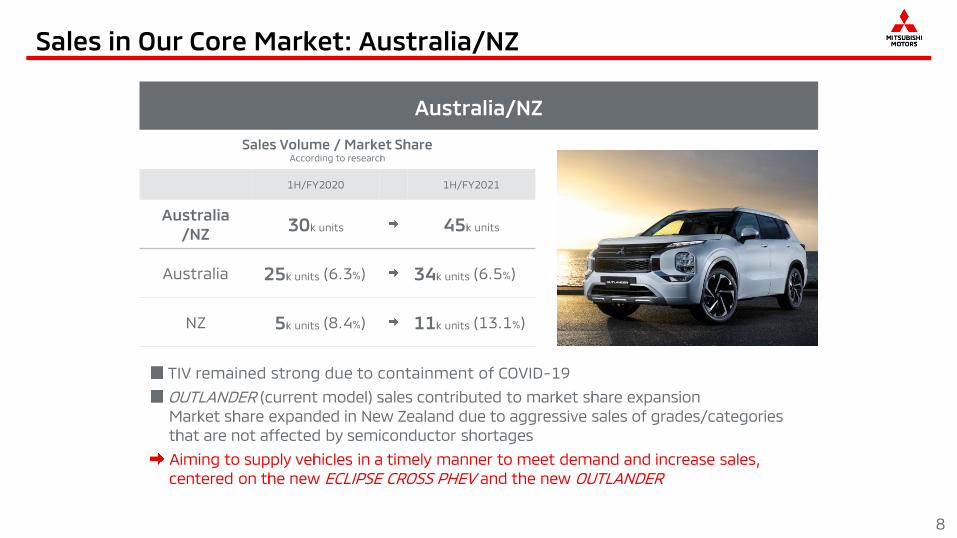
Sales in Our Core Market: Australia/NZ
8
Australia/NZ
TIV remained strong due to containment of COVID-19
OUTLANDER (current model) sales contributed to market share expansion
Market share expanded in New Zealand due to aggressive sales of grades/categories
that are not affected by semiconductor shortages
Aiming to supply vehicles in a timely manner to meet demand and increase sales,
centered on the new ECLIPSE CROSS PHEV and the new OUTLANDER
1H/FY2020 1H/FY2021
Australia
/NZ30k units 45k units
Australia 25k units (6.3%) 34k units (6.5%)
NZ 5k units (8.4%) 11k units (13.1%)
Sales Volume / Market ShareAccording to research
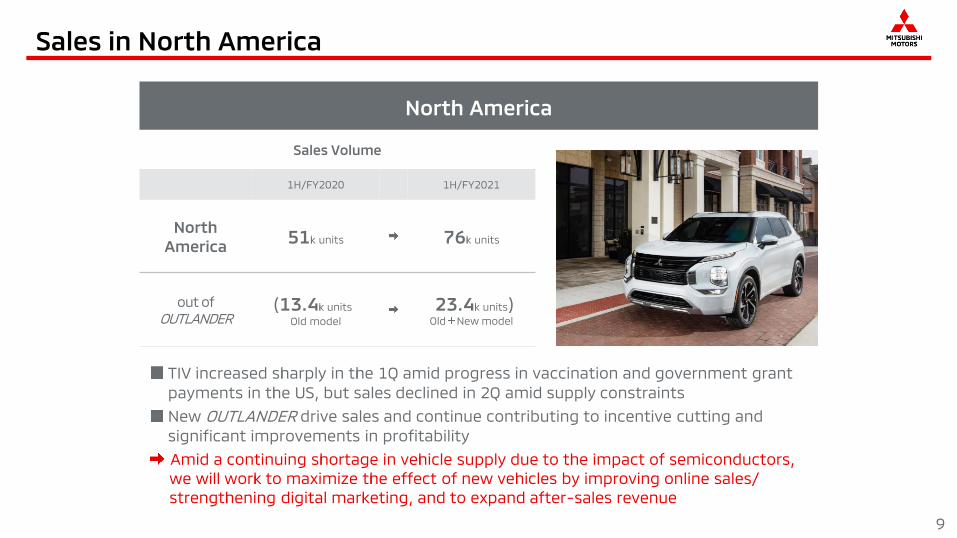
Sales in North America
9
North America
TIV increased sharply in the 1Q amid progress in vaccination and government grant
payments in the US, but sales declined in 2Q amid supply constraints
New OUTLANDER drive sales and continue contributing to incentive cutting and
significant improvements in profitability
Amid a continuing shortage in vehicle supply due to the impact of semiconductors,
we will work to maximize the effect of new vehicles by improving online sales/
strengthening digital marketing, and to expand after-sales revenue
1H/FY2020 1H/FY2021
North
America51k units 76k units
out of
OUTLANDER(13.4k units)
Old model
(23.4k units)Old New model
Sales Volume
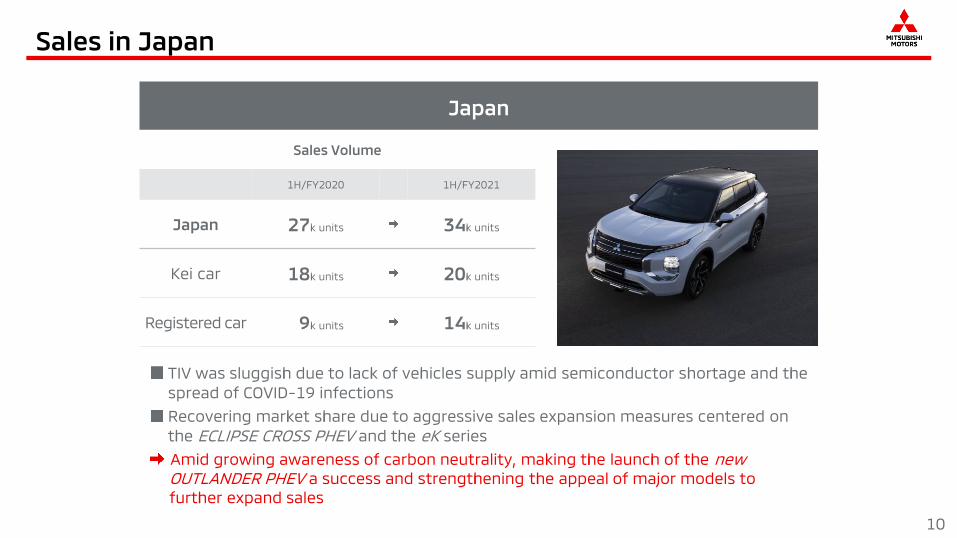
Sales in Japan
10
Japan
TIV was sluggish due to lack of vehicles supply amid semiconductor shortage and the
spread of COVID-19 infections
Recovering market share due to aggressive sales expansion measures centered on
the ECLIPSE CROSS PHEV and the eK series
Amid growing awareness of carbon neutrality, making the launch of the new OUTLANDER PHEV a success and strengthening the appeal of major models to
further expand sales
1H/FY2020 1H/FY2021
Japan 27k units 34k units
Kei car 18k units 20k units
Registered car 09k units 14k units
Sales Volume
3. Business Highlight
11
1. 1H/FY2021 Financial Results
2. FY2021 Financial Forecast

* Net income attributable to owners of the parent
FY2021 Financial Forecast (vs. FY2020)
12
(Billion yen, 000 units)
1,455.5 2,010.0 +554.5 +38% -70.0
-95.3 60.0(3.0%)
+155.3 - +20.0
-105.2 58.0 +163.2 - +22.0
-312.3 40.0 +352.3 - +25.0
801 903 +102 +13% -64
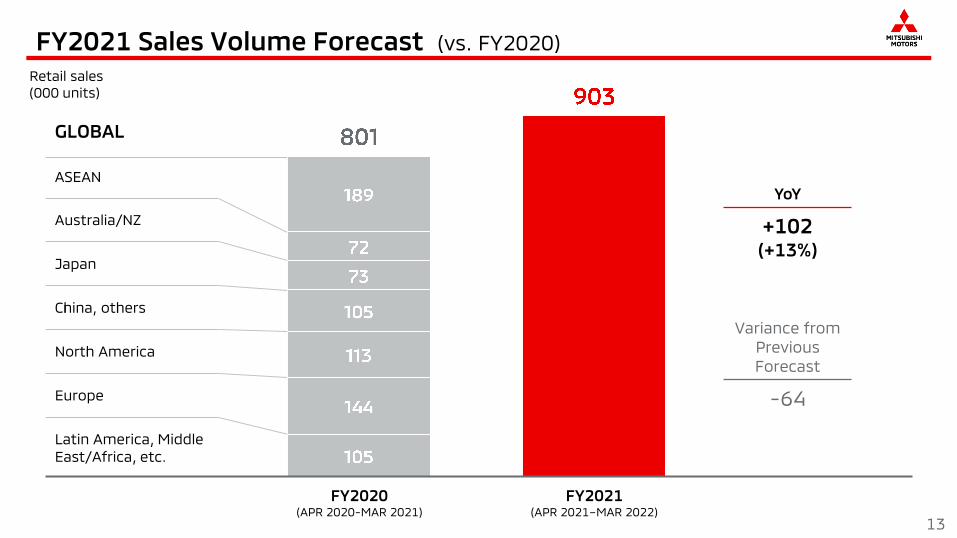
FY2021 Sales Volume Forecast (vs. FY2020)
13
Retail sales
(000 units)
GLOBAL
ASEAN
Australia/NZ
Japan
China, others
North America
Europe
Latin America, Middle
East/Africa, etc.
YoY
+102(+13%)
Variance from
Previous
Forecast
-64
FY2020(APR 2020-MAR 2021)
FY2021(APR 2021–MAR 2022)
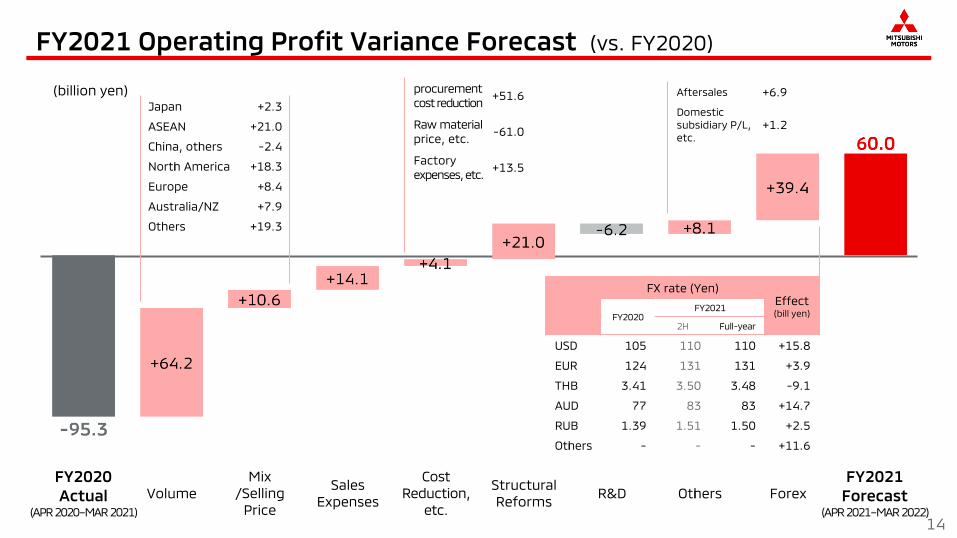
FY2020
Actual (APR 2020–MAR 2021)
FY2021
Forecast(APR 2021–MAR 2022)
(billion yen)
FY2021 Operating Profit Variance Forecast (vs. FY2020)
14
Others ForexVolumeSales
Expenses
Cost
Reduction,
etc.
Mix
/Selling
Price
Structural
ReformsR&D
Japan +2.3
ASEAN +21.0
China, others -2.4
North America +18.3
Europe +8.4
Australia/NZ +7.9
Others +19.3
procurement
cost reduction +51.6
Raw material
price, etc.-61.0
Factory
expenses, etc.+13.5
Aftersales +6.9
Domestic
subsidiary P/L,
etc.
+1.2
FX rate (Yen)Effect(bill yen)FY2020
FY2021
2H Full-year
USD 105 110 110 +15.8
EUR 124 131 131 +3.9
THB 3.41 3.50 3.48 -9.1
AUD 77 83 83 +14.7
RUB 1.39 1.51 1.50 +2.5
Others - - - +11.6
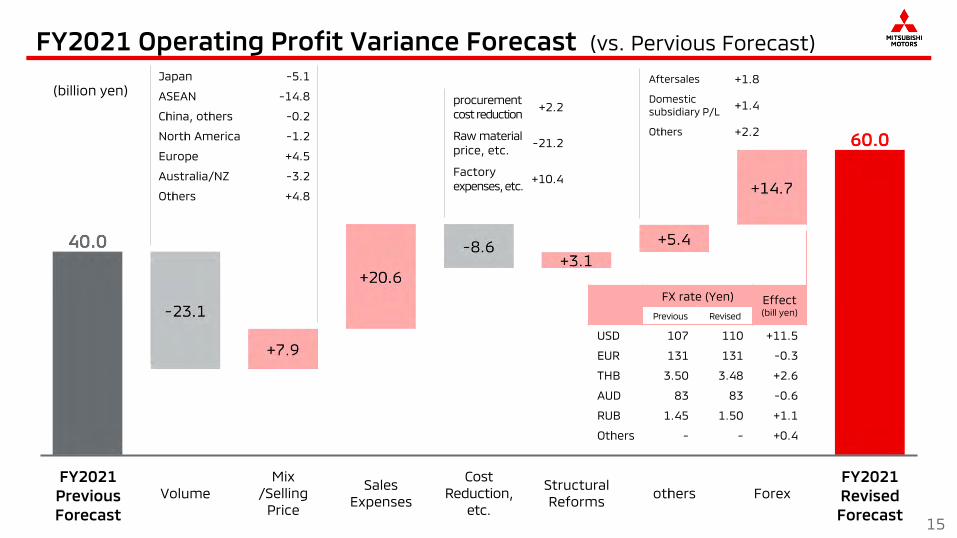
(billion yen)
FY2021
Previous
Forecast
FY2021
Revised
Forecast
FY2021 Operating Profit Variance Forecast (vs. Pervious Forecast)
15
ForexSales
Expenses
Cost
Reduction,
etc.
Mix
/Selling
Price
Structural
Reformsothers
Japan -5.1
ASEAN -14.8
China, others -0.2
North America -1.2
Europe +4.5
Australia/NZ -3.2
Others +4.8
procurement
cost reduction +2.2
Raw material
price, etc.-21.2
Factory
expenses, etc.+10.4
Volume
FX rate (Yen) Effect(bill yen)Previous Revised
USD 107 110 +11.5
EUR 131 131 -0.3
THB 3.50 3.48 +2.6
AUD 83 83 -0.6
RUB 1.45 1.50 +1.1
Others - - +0.4
Aftersales +1.8
Domestic
subsidiary P/L+1.4
Others +2.2

3. Business Highlight
16
1. 1H/FY2021 Financial Results
2. FY2021 Financial Forecast
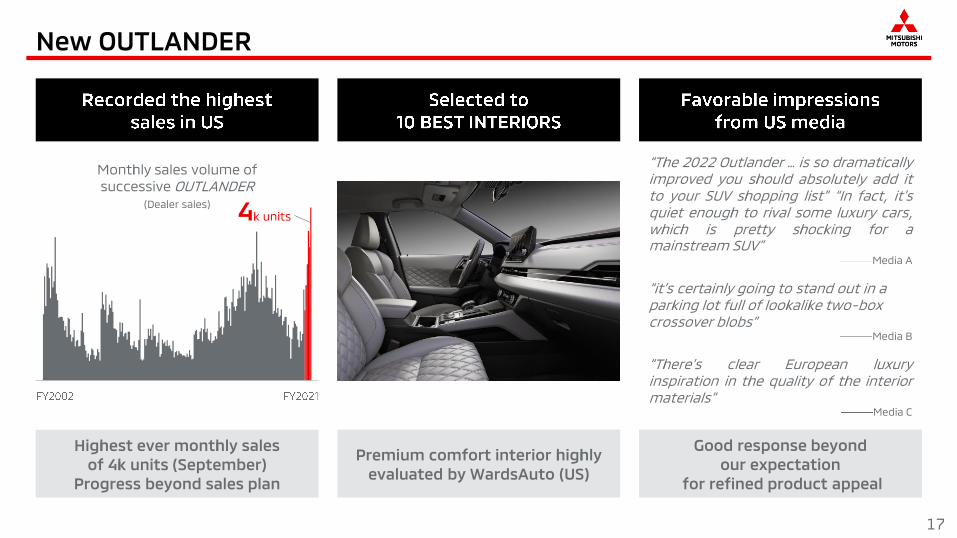
New OUTLANDER
17
Highest ever monthly sales
of 4k units (September)
Progress beyond sales plan
Monthly sales volume of
successive OUTLANDER(Dealer sales)
Good response beyond
our expectation
for refined product appeal
Premium comfort interior highly
evaluated by WardsAuto (US)
“The 2022 Outlander … is so dramaticallyimproved you should absolutely add itto your SUV shopping list” “In fact, it'squiet enough to rival some luxury cars,which is pretty shocking for amainstream SUV”
Media A
“it’s certainly going to stand out in a parking lot full of lookalike two-box crossover blobs”
Media B
“There’s clear European luxuryinspiration in the quality of the interiormaterials”
Media C
4k units

New OUTLANDER PHEV
18
“Premium electric SUV commensurate with
MMC’s flagship model” “Comfortable driving”
“Raised basic performance with the new
platform; and greatly improved athletic
performance with the evolved PHEV/S-AWC”
“Powerful styling with a strong presence”
“Premium luxury interior that has never been
seen in MMC cars”
Evaluation at prototype test drive events
N e w g e n e r a t i o n
P H E V s y s t e m
Interior and exterior
that won the Good Design Award in Japan
Safe,secureandcomfortable driving
in all weather/road situations

New Model
19
COMING SOON
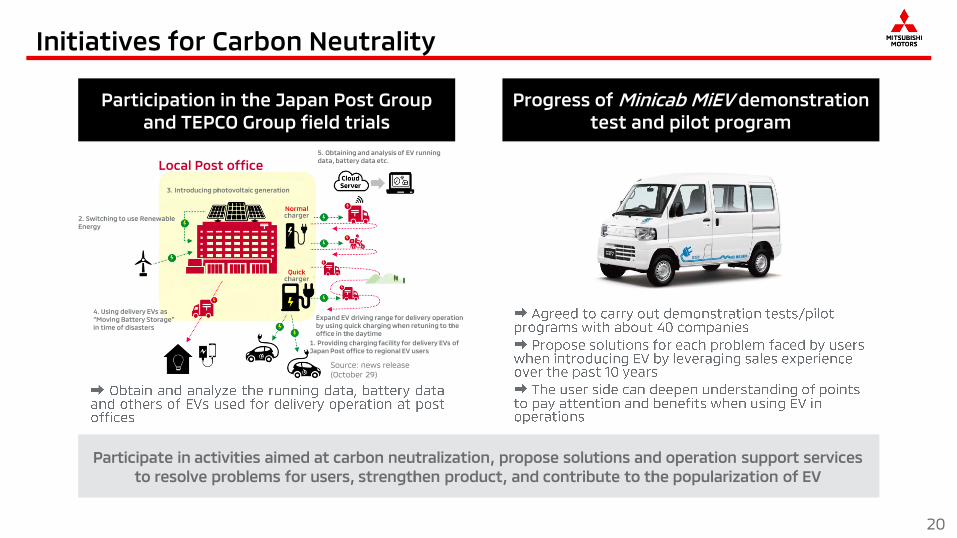
Initiatives for Carbon Neutrality
20
Progress of Minicab MiEV demonstration
test and pilot program
Participation in the Japan Post Group
and TEPCO Group field trials
Source: news release
(October 29)
Local Post office
3. Introducing photovoltaic generation
5. Obtaining and analysis of EV running
data, battery data etc.
2. Switching to use Renewable
Energy
4. Using delivery EVs as
“Moving Battery Storage”
in time of disasters
Normalcharger
Quickcharger
Expand EV driving range for delivery operation
by using quick charging when retuning to the
office in the daytime
1. Providing charging facility for delivery EVs of
Japan Post office to regional EV users
Participate in activities aimed at carbon neutralization, propose solutions and operation support services
to resolve problems for users, strengthen product, and contribute to the popularization of EV


22
APPENDIX
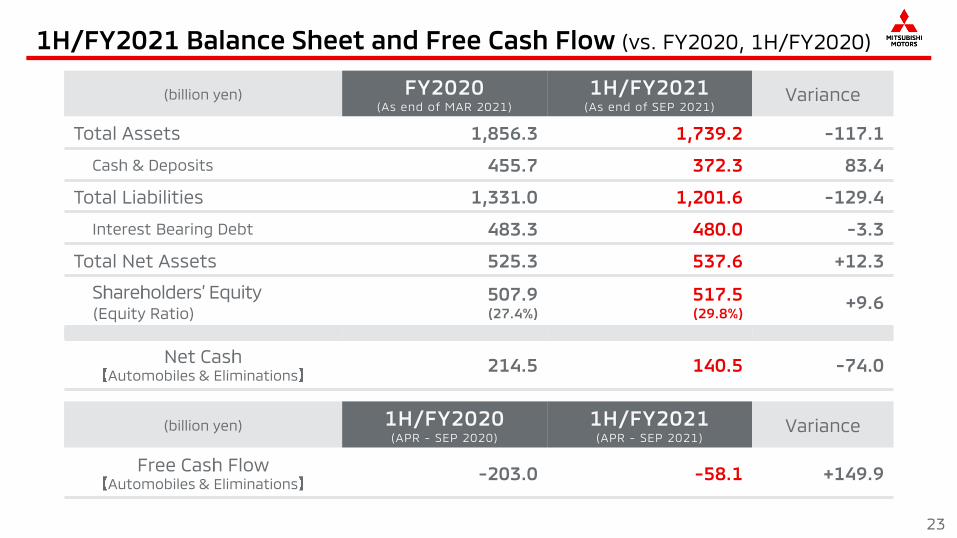
1H/FY2021 Balance Sheet and Free Cash Flow (vs. FY2020, 1H/FY2020)
23
(billion yen) Variance
Total Assets 1,856.3 1,739.2 -117.1
Cash & Deposits 455.7 372.3 83.4
Total Liabilities 1,331.0 1,201.6 -129.4
Interest Bearing Debt 483.3 480.0 -3.3
Total Net Assets 525.3 537.6 +12.3
Shareholders’ Equity(Equity Ratio)
507.9(27.4%)
517.5(29.8%)
+9.6
Net Cash Automobiles & Eliminations
214.5 140.5 -74.0
(billion yen) Variance
Free Cash FlowAutomobiles & Eliminations
-203.0 -58.1 +149.9
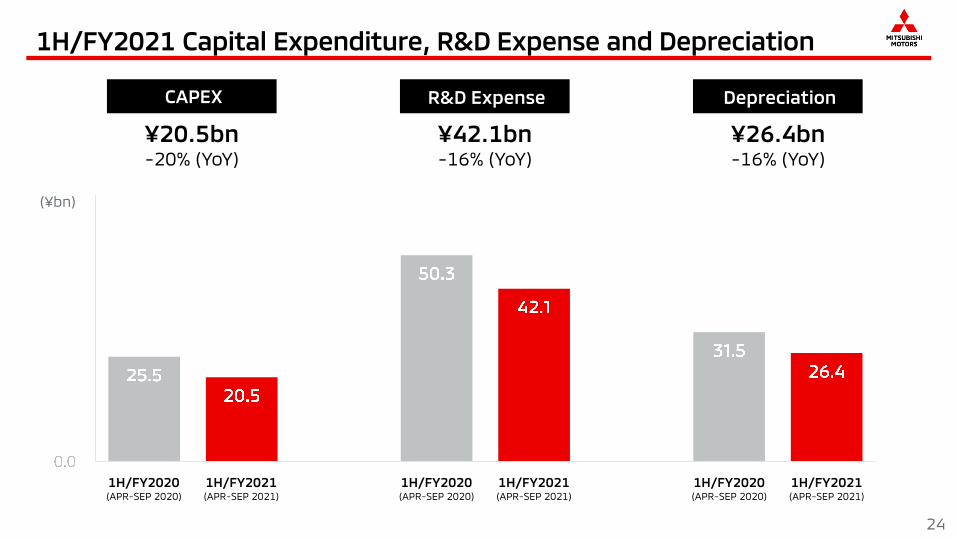
1H/FY2021 Capital Expenditure, R&D Expense and Depreciation
24
CAPEX DepreciationR&D Expense
¥20.5bn-20% (YoY)
¥42.1bn-16% (YoY)
¥26.4bn-16% (YoY)
0%
1%
2%
3%
4%
5%
6%
1 2 3 4 5 6 7 8
(¥bn)
1H/FY2020(APR-SEP 2020)
1H/FY2021(APR-SEP 2021)
1H/FY2020(APR-SEP 2020)
1H/FY2021(APR-SEP 2021)
1H/FY2020(APR-SEP 2020)
1H/FY2021(APR-SEP 2021)
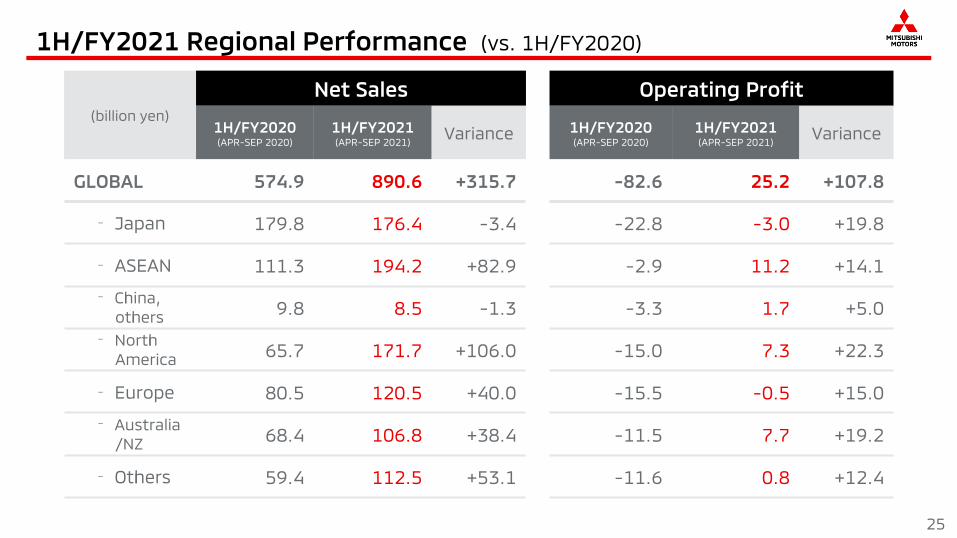
1H/FY2021 Regional Performance (vs. 1H/FY2020)
25
(billion yen)
Net Sales Operating Profit
1H/FY2020(APR-SEP 2020)
1H/FY2021(APR-SEP 2021)
Variance 1H/FY2020(APR-SEP 2020)
1H/FY2021(APR-SEP 2021)
Variance
GLOBAL 574.9 890.6 +315.7 -82.6 25.2 +107.8
‐ Japan 179.8 176.4 -3.4 -22.8 -3.0 +19.8
‐ ASEAN 111.3 194.2 +82.9 -2.9 11.2 +14.1
‐ China,
others9.8 8.5 -1.3 -3.3 1.7 +5.0
‐ North
America65.7 171.7 +106.0 -15.0 7.3 +22.3
‐ Europe 80.5 120.5 +40.0 -15.5 -0.5 +15.0
‐ Australia
/NZ68.4 106.8 +38.4 -11.5 7.7 +19.2
‐ Others 59.4 112.5 +53.1 -11.6 0.8 +12.4
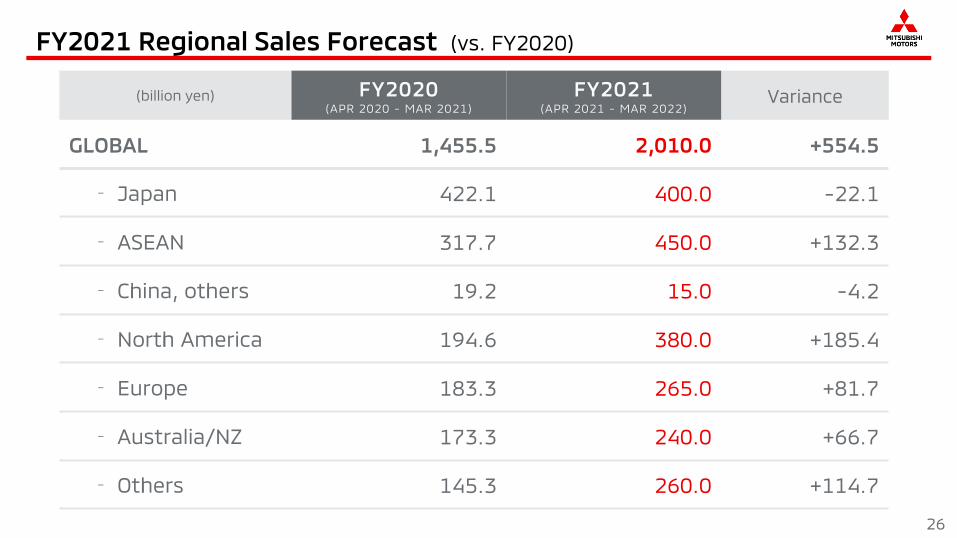
FY2021 Regional Sales Forecast (vs. FY2020)
26
(billion yen) Variance
GLOBAL 1,455.5 2,010.0 +554.5
‐ Japan 422.1 400.0 -22.1
‐ ASEAN 317.7 450.0 +132.3
‐ China, others 19.2 15.0 -4.2
‐ North America 194.6 380.0 +185.4
‐ Europe 183.3 265.0 +81.7
‐ Australia/NZ 173.3 240.0 +66.7
‐ Others 145.3 260.0 +114.7

FY2021 Capital Expenditure, R&D Expense and Depreciation Forecast
27
CAPEX DepreciationR&D Expense
¥85.0bn+11% (YoY)
¥99.0bn-2% (YoY)
¥57.0bn-14% (YoY)
0%
1%
2%
3%
4%
5%
6%
1 2 3 4 5 6 7 8
(¥bn)
FY2020(APR 2020-MAR 2021)
FY2021(APR 2021-MAR 2022)
FY2020(APR 2020-MAR 2021)
FY2021(APR 2021-MAR 2022)
FY2020(APR 2020-MAR 2021)
FY2021(APR 2021-MAR 2022)
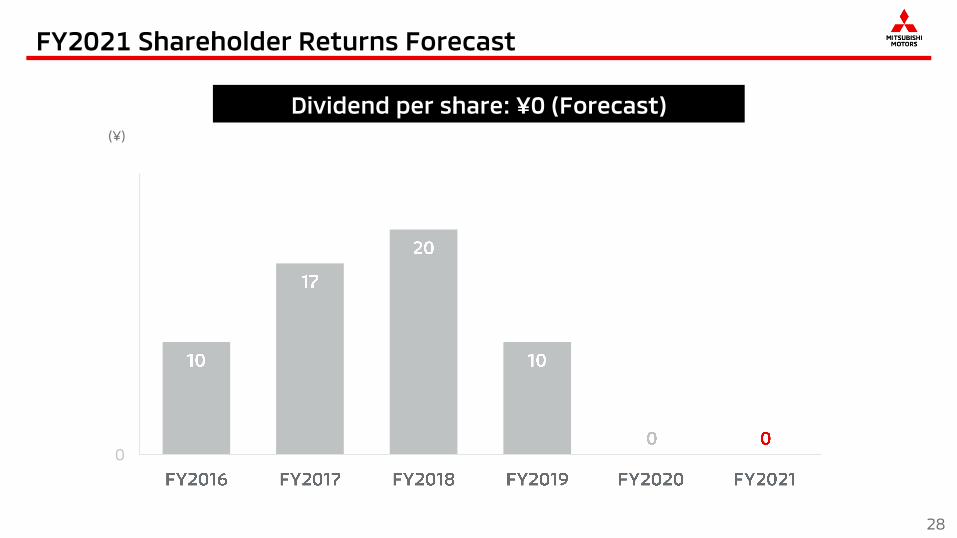
FY2021 Shareholder Returns Forecast
28
Dividend per share: ¥0 (Forecast)(¥)
0
5
10
15
20
25
29
This presentation contains forward-looking statements, based on judgments and estimates that
have been made on the basis of currently available information. By nature, such statements are
subject to uncertainty and risk. Therefore, you are advised that the final results might be
significantly different from the aforementioned statements due to changes in economic
environments related to our business, market trends, fluctuations in interest rates and exchange
rate, changes in laws, regulations and government policies, etc.
Potential risks and uncertainties are not limited to the above and Mitsubishi Motors is not under
any obligation to update the information in this presentation to reflect any developments or events
in the future.
If you are interested in investing in Mitsubishi Motors, you are requested to make a final
investment decision at your own risk, taking the foregoing into consideration. Please note that
neither Mitsubishi Motors nor any third party providing information shall be responsible for any
damage you may suffer due to investment in Mitsubishi Motors based on the information shown in
this presentation.