2 groundwater exploitation and overexploitation … v/v_ch2.pdf · 2 groundwater exploitation and...
TRANSCRIPT
2 GROUNDWATER EXPLOITATION AND OVEREXPLOITATION
The advantage of groundwater exploitation for water supply by wells as compared to the use of river or spring waters consists of being widely independent from short-term variations
• in precipitation and its immediate consequences for discharges or storage in open reservoirs and
• in the chemical and microbial composition of waters.
Water supply from natural or artificial lakes occupies an intermediate position in between ground and surface water exploitation.
Contaminant reach rivers and springs faster than groundwater and may affect groundwaters much longer than spring and river waters. These differences arise from mean residence times that are important for physical, chemical and microbial elimination and disintegration processes with slow kinetics. Mean residence times of lake waters are longer than river- and springwaters, but still shorter than in groundwaters. Although surface contaminations have easy access to lakes, elimination processes and remediation techniques in lakes are usually quite efficient, because microbial processes occur quite efficiently in the presence of light (photolytic processes).
Mean residence times can be determined using artificial or environmental tracer techniques. Generally the first deliver sectorial information of the system (Moser & Rauert 1980, Kaess 1998). Environmental isotope techniques, on the contrary, provide integrated and mostly time-invariant data on mean residence times.
• In rivers and springs often variations of environmental isotopes in the isotopic input and output are compared to determine mean residence times. Applying the stable isotopes 2H and 18O, the mean residence time can be calculated using damping effects from the input to the output function (Oeschger & Siegenthaler 1972) or from the phase shift between both functions. This method is limited by the measuring accuracy of the stable isotopes (routinely δ18O: ± 0.1‰, δ2H: ± 1‰) and consequently, mostly covers not more than 4 years.
• For determining somewhat larger mean residence times radioactive environmental isotopes with short half-lives are more appropriate (3H: 12.43 years, 85Kr: 10.6 years). The input functions of both radioactive isotopes are well known (e.g. IAEA 1975), however, both isotopes behave in the unsaturated zone somewhat different. With 3H the
21
Chapter 2
mean residence time of water since infiltration is determined, with 85Kr the time since percolation water reaches the groundwater surface. Evaluation of longer mean residence times using 39Ar (half-life 269 years), 14C (half-life 5730 years) or 36Cl (half-life 301000 years) requires an exact knowledge of the long-term input function which mostly is supposed to be constant over geologic periods of time. To evaluate these functions, an appropriate hydrogeological concept is needed to select the respective hydraulic model. Best-known models in this respect are the piston flow, the exponential, the dispersion model (Maloszewski & Zuber 1982), all for unconsolidated rocks, and the single fissure model for consolidated fissured rocks with matrix porosity (Maloszewski & Zuber 1993). All these models are low parameterized and do not substitute high-parameterized numerical or analytic models. A comparison of the results of both types of models is documented in detail in DVWK (1995).
For hydrodynamic and economic reasons groundwater exploitation requires hydraulic conductivities exceeding 10-6 m/s and a water table not too far from land’s surface. It cannot be recommended to orient the drilling and screening of wells only on depth-related hydraulic conductivities, although this might be considered a favorable economic prerequisite. Groundwater exploitation should be based on the effective, aquifer related recharge (Sect.1.7) and not on the overall groundwater recharge. High hydraulic conductivities in the passive recharge zone facilitating groundwater abstraction (e.g. aquifers in desert areas or deep aquifers in humid climates) should not be misinterpreted as an abundant availability of groundwaters for sustainable exploitation.
Operation wells deform a groundwater flow field by gathering streamlines (Fig.2.1). The stronger the abstraction from an individual well, the more streamlines become focused and the width of the flow field contributing to the well increases. In an excess state of exploration, however, groundwater flow may convert from laminar into turbulent first at the well and later in the surroundings of the well. Such turbulent flow may accelerate subsurface erosion (suffusion) in the aquifer, thus locally increasing its hydraulic conductivity, and possibly harming the stability of the bore hole or pumping system, or favor fouling and corrosion of the screen by iron, manganese or carbonate precipitation, thus reducing hydraulic conductivities of the abstraction installation (McLaughlan et al. 1993).
As an empirical rule in practice, the draw down for exploitation in the active groundwater recharge zone should be less than half the thickness of the aquifer system encountered by the well. This does not apply in the passive groundwater recharge zone.
The geometry and degree of the deformation of the groundwater flow field through pumping depends not only from the pumping rate, but also from the depth in which the screen is sited in the well or the construction of the well itself (Sect.2.1.3).
Groundwater exploitation of an individual well creates a local cone of depression of hydraulic heads; exploitation of well groups additionally creates a zone of depression of the groundwater table. As a rule the cone of depression develops within short times; contrary, the
22

Groundwater exploitation and overexploitation
zone of depression provokes transient conditions for longer times (months to years). Both phenomena have to be considered individually in judging the assessment of exploitation of groundwater on the groundwater flow field.
Overexploitation occurs as far as groundwater abstraction exceeds available groundwater recharge from precipitation or surface water contribution. In such a case one aquifer of the aquifer system undergoes pressure reduction changing the effective stresses in aquifers (grain to grain stress) and initiating subsidence in fine grained, unconsolidated silt and clay aquifers (Magara 1978) (Fig.2.2). This may endanger constructions (e.g. Mexico City), move coast lines (e.g. Maracaibo Lake, Venezuela) and change even the surface drainage system of catchment areas (Leipzig area, Germany).
production well stream line
Fig.2.1 Typical deformations of groundwater flow lines in the vicinity of wells with (A) and without (B) groundwater abstraction.
Subsidence of sediments reduces the storage capacity of aquifers. If overexploitation finishes, the reduced porosity will mostly not return to initial conditions, because in unconsolidated rocks plastic deformations dominate over elastic deformations. Therefore, groundwater levels rise after finishing overexploitation often closer to the surface and changes in coastal lines will never restore to their original position. Thus in some cases a stop of overexploitation after a long run of groundwater mining might even create hygienic and geotechnical problems.
Overexploitation of groundwater resources may also favor the subsurface inflow of saline waters either from deep aquifers (Fig. 2.14) or from oceans, thus harming crops, soil fertility and drinking water quality as well (e.g. costal aquifer of Israel and Gaza, Caribbean islands).
23

Chapter 2
Overexploitation of groundwater resources - also named groundwater mining because a non-rechargeable portion of extracted groundwater is lost - causes mostly long-term transient hydrodynamic conditions and provokes hydraulic short cuts between different aquifer systems. This may lead to undesired water quality changes (Sect.1.7).
Often overexploitation of groundwater resources exceeds the available groundwater recharge only slightly. It may even not result in an immediate draw down of the groundwater table because the aquifer is linked to adjacent aquifers substituting the missing groundwaters (Andres & Egger 1985). These processes, however, become well documented in their respective changes of the isotope stratification of groundwaters. They may be evaluated in a process-oriented manner, using mathematical models that include isotope information.
PRESSURE
DEP
TH
initialwater level
loweredwater level
HYDROSTATIC PRESSURE
EFFECTIVE STRESS
before
afterloweringwater level}
Fig.2.2 Increase of effective stresses in unconsolidated aquifers due to lowering the hydraulic
head.
TRITIUM-LAYER
TRITIUM, ARGON- and C-14-LAYER
C-14, TRITIUM- andARGON-LAYER
TNL
ANL
Fig.2.3 Stratification of environmental isotopes and non-reactive chemical tracers in an aquifer system.
24
Groundwater exploitation and overexploitation
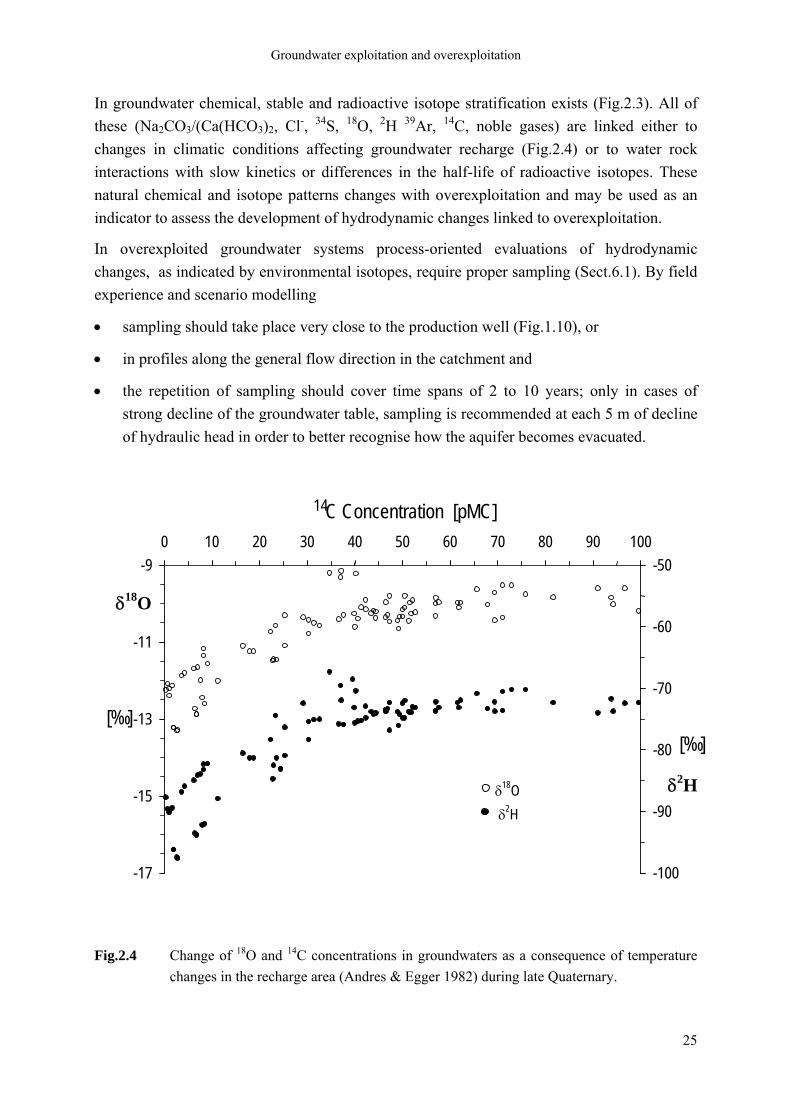
In groundwater chemical, stable and radioactive isotope stratification exists (Fig.2.3). All of these (Na2CO3/(Ca(HCO3)2, Cl-, 34S, 18O, 2H 39Ar, 14C, noble gases) are linked either to changes in climatic conditions affecting groundwater recharge (Fig.2.4) or to water rock interactions with slow kinetics or differences in the half-life of radioactive isotopes. These natural chemical and isotope patterns changes with overexploitation and may be used as an indicator to assess the development of hydrodynamic changes linked to overexploitation.
In overexploited groundwater systems process-oriented evaluations of hydrodynamic changes, as indicated by environmental isotopes, require proper sampling (Sect.6.1). By field experience and scenario modelling
• sampling should take place very close to the production well (Fig.1.10), or
• in profiles along the general flow direction in the catchment and
• the repetition of sampling should cover time spans of 2 to 10 years; only in cases of strong decline of the groundwater table, sampling is recommended at each 5 m of decline of hydraulic head in order to better recognise how the aquifer becomes evacuated.
Fig.2.4 Change of 18O and 14C concentrations in groundwaters as a consequence of temperature changes in the recharge area (Andres & Egger 1982) during late Quaternary.
-17
-15
-13
-11
-9 0 10 20 30 40 50 60 70 80 90 100
14C Concentration [pMC]
[‰]
-100
-90
-80
-70
-60
-50
[‰]
δ 18O δ 2H
δ18O
δ2H
25

Chapter 2
Changes in the hydraulic properties of sediments due to subsidence or compaction as well as the overall array of influence of groundwater abstraction can be controlled using the single well dilution technique (Fig.2.5, Box 2.1). This technique (Moser & Rauert 1980) allows determining flow velocities and directions of groundwater in a single borehole. These flow velocities (vb) can be transformed into a filter velocity (vf) in the aquifer as far as the aquifer is unconsolidated and the deformation of the groundwater flow field (α) through the well - without exploitation - can be calculated (Drost et al. 1973, Klotz 1977) (see box 2.1).
Within consolidated fissured aquifers the transformation of the borehole flow velocity into a filter velocity is hardly possible, but the measurement of flow directions indicate the direction of fissures involved in groundwater flow.
The single well dilution techniques apply only for sections of the well screen no larger than the length of the scintillation or Geiger-Mueller counter. This section is limited by packers (Fig.2.5), which suppress - if possible - vertical flow along the well axis. Reliable data are obtained with this method if the following boundary conditions are fulfilled:
1) laminar groundwater flow,
2) homogeneous distribution of the tracer concentrations in the measuring volume,
3) non-reactive tracers that do not produce density flow,
4) horizontal flow through the measuring volume, and
5) dilution exceeding that of molecular diffusion.
BOX 2.1
SINGLE WELL DILUTION TECHNIQUE
1) Determination of flow velocity in the well
Measured concentration decline of a tracer within a defined level of the filter with diameter r1
Ct = C0 e−ßt (2.1)
ln Ct = −ßt + ln C0
ßt = ln C0 − ln Ct (2.2)
With VQ
=β (2.3)
and Q = vb Ab = vb 2r1 H (2.4)
and V = π r12 H (2.5)
26
Groundwater exploitation and overexploitation
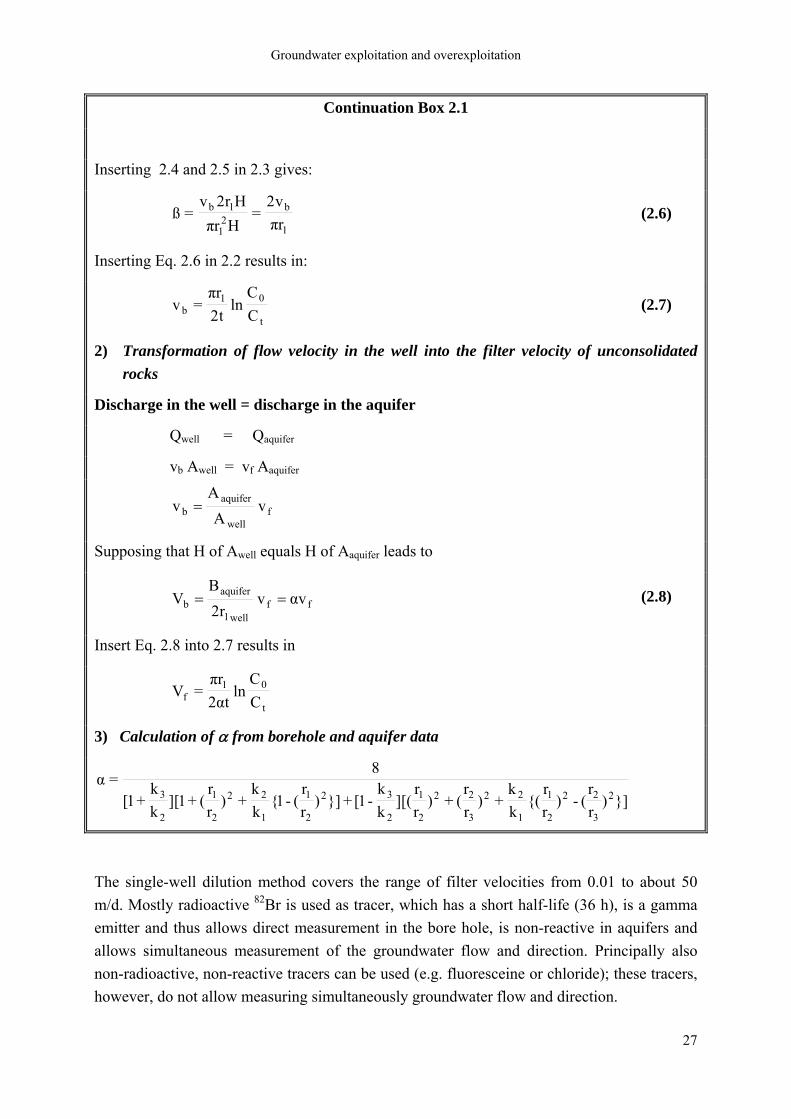
Continuation Box 2.1
Inserting 2.4 and 2.5 in 2.3 gives:
1
b2
1
1b
rπv2
=HrπHr2v
=ß (2.6)
Inserting Eq. 2.6 in 2.2 results in:
t
01b C
Cln
t2rπ
=v (2.7)
2) Transformation of flow velocity in the well into the filter velocity of unconsolidated rocks
Discharge in the well = discharge in the aquifer
Qwell = Qaquifer
vb Awell = vf Aaquifer
fwell
aquiferb v
AA
v =
Supposing that H of Awell equals H of Aaquifer leads to
ffwell1
aquiferb vαv
r2B
V == (2.8)
Insert Eq. 2.8 into 2.7 results in
t
01f C
Cln
tα2rπ
=V
3) Calculation of α from borehole and aquifer data
}])rr
(-)rr
{(kk
+)rr
(+)rr
][(kk
-1[+}])rr
(-1{kk
+)rr
(+1][kk
+1[
8=α
2
3
22
2
1
1
22
3
22
2
1
2
32
2
1
1
22
2
1
2
3
The single-well dilution method covers the range of filter velocities from 0.01 to about 50 m/d. Mostly radioactive 82Br is used as tracer, which has a short half-life (36 h), is a gamma emitter and thus allows direct measurement in the bore hole, is non-reactive in aquifers and allows simultaneous measurement of the groundwater flow and direction. Principally also non-radioactive, non-reactive tracers can be used (e.g. fluoresceine or chloride); these tracers, however, do not allow measuring simultaneously groundwater flow and direction.
27

Chapter 2
2.1 GROUNDWATER ABSTRACTION FROM DEEP WELLS IN THE MOLASSE BASIN OF SOUTH GERMANY
2.1.1 INTRODUCTION
The Molasse Basin in south Germany forms the immediate foreland of the Alps and is overthrusted by the Alps in its southern part. The Molasse sediments exceed 6000 m in thickness in the South and crop out along the Danube river in the North (Fig.2.6). Sediments are alternatively of marine and continental origin and end to the actual surface with a limno-fluviatile sand to clay facies. Groundwaters of marine origin are still to be met in 400 to 500 m depth below floor, as connate waters.
2.1.2 THE TNL IN THE STUDY AREA
Groundwater exploitation was first focused on the active groundwater recharge zone and shifted in the urban areas of Munich and Augsburg (Fig.2.6) and also in areas with intensive agricultural activities to an exploitation depth of up to 200 m. Groundwater recharge at the surface of the Molasse sediments averages to 5 L/s km2 or 155 mm/a; the TNL (Tritium naught line, Sect.1.7) is situated at about 50 m depth (Fig.2.7). Consequently, exploitation at 100 m to 200 m depth takes place in the passive groundwater recharge zone, which does not dispose of the total groundwater recharge determined at the ground surface of a catchment area.
Most of the wells in the study area have been sampled to analyze stable and radioactive environmental isotopes as well as the chemical composition of waters. As a result of all this sampling the chemical/isotope profiles (Figs. 1.9 and 2.7) have been drawn (Egger 1978).
They indicate that all investigated compounds change more or less simultaneously and significantly along the TNL.
A profile in the investigation area (Fig.2.7) shows (Egger 1978) that the TNL is straight running from Munich to Augsburg at 50 m below surface, but declines below both towns because of a significant exploitation from the passive recharge zone (1977: 2.8 m³/s in Munich and 1.5 m³/s in Augsburg). This decline of the TNL is not accompanied with any significant decline of the water table in the Quaternary/Tertiary aquifer systems, but shows only by the abnormal environmental isotope distribution an additional input from the active to the passive recharge zone as compared to the normal. As a consequence not only 3H but also contaminants like hydrocarbons may significantly enter the passive recharge zone with originally old (> 100 years) waters (Rauert et al. 1993).
From this decline of the TNL Egger and Andres (1985) calculated an additional contribution of the active recharge zone to the effective, depth related groundwater recharge in the passive zone of 2 L/(s km2).
28

Groundwater exploitation and overexploitation
compass
Lead shielding
connection for data logging
scintillation-counterelastic packermixing motor
by-pass for vertical flow
mixing coil
collimator
tracer reservoir pistoninjektion unit
collimator motor
measuring volume
injektion tube
ground water/sediment
tracer runoff
groundwater flowfield and flow direction detector
scintillation-counter
scintillation-counterelastic packer
filter tube
A B
A B
time t
LN (C
)
Initial tracer-concentration Co
-90 0 90 180 270 360azimuth
conc
entr
atio
n
azimuth-signalFlow direction
Flow direction log
Tracer dilution log
Fig.2.5 The single well dilution probe. The semi logarithmic decline of the radioactive tracer
concentration is due to in- and out flowing groundwater within the measuring section. The maximum in the distribution of radioactivity along the filter screen expresses the outflow, the minimum the inflow site of groundwater.
ULM
MEMMINGENLANDSBERG
MÜNCHEN
MOOSBURG
JURA
JURA
LAKE OF CONSTANCE ALPES
AUSTRIA
BAVARIAN FOREST
FAULTS
RESOURCES OF PETROLOR GAS
0 30 km
Fig.2.6 The Molasse Basin in South Germany.
29
Chapter 2
2.1.3 HYDRODYNAMIC FLOW FIELD IN THE VICINITY OF DEEP WELLS
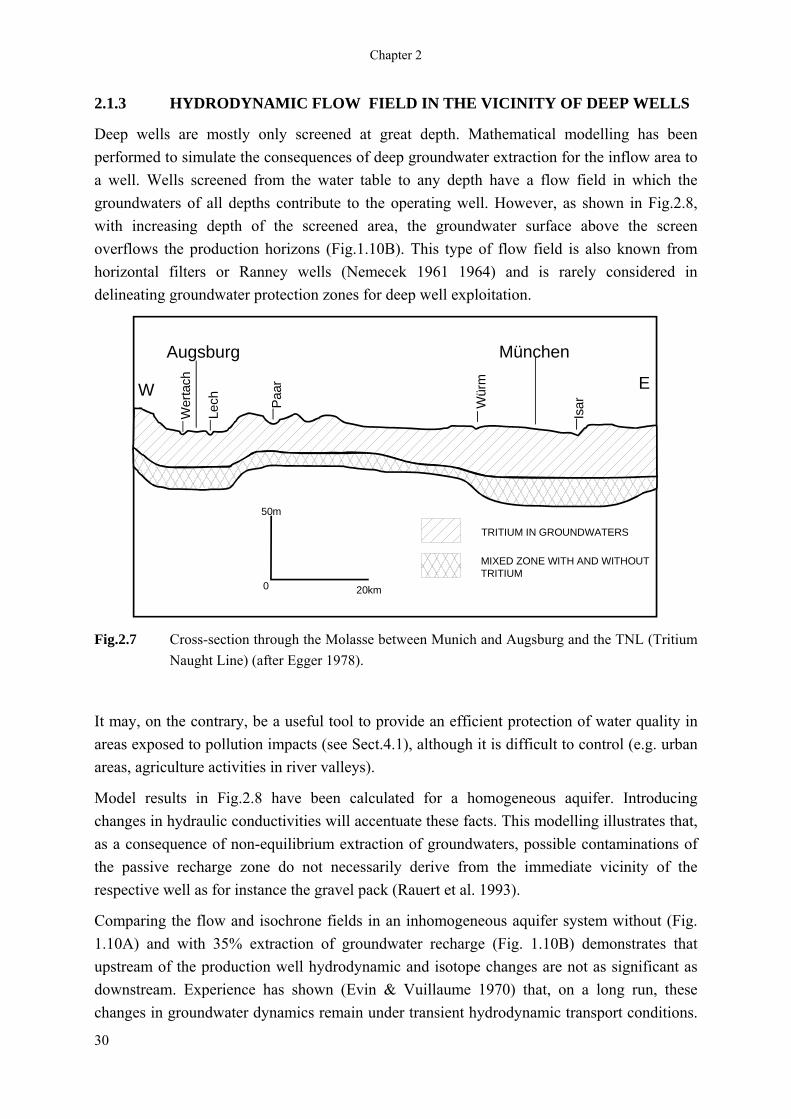
Deep wells are mostly only screened at great depth. Mathematical modelling has been performed to simulate the consequences of deep groundwater extraction for the inflow area to a well. Wells screened from the water table to any depth have a flow field in which the groundwaters of all depths contribute to the operating well. However, as shown in Fig.2.8, with increasing depth of the screened area, the groundwater surface above the screen overflows the production horizons (Fig.1.10B). This type of flow field is also known from horizontal filters or Ranney wells (Nemecek 1961 1964) and is rarely considered in delineating groundwater protection zones for deep well exploitation.
Augsburg München
W E
Wer
tach
Lech Pa
ar
Wür
m
Isar
20km
50m
0
TRITIUM IN GROUNDWATERS
MIXED ZONE WITH AND WITHOUTTRITIUM
Fig.2.7 Cross-section through the Molasse between Munich and Augsburg and the TNL (Tritium
Naught Line) (after Egger 1978).
It may, on the contrary, be a useful tool to provide an efficient protection of water quality in areas exposed to pollution impacts (see Sect.4.1), although it is difficult to control (e.g. urban areas, agriculture activities in river valleys).
Model results in Fig.2.8 have been calculated for a homogeneous aquifer. Introducing changes in hydraulic conductivities will accentuate these facts. This modelling illustrates that, as a consequence of non-equilibrium extraction of groundwaters, possible contaminations of the passive recharge zone do not necessarily derive from the immediate vicinity of the respective well as for instance the gravel pack (Rauert et al. 1993).
Comparing the flow and isochrone fields in an inhomogeneous aquifer system without (Fig. 1.10A) and with 35% extraction of groundwater recharge (Fig. 1.10B) demonstrates that upstream of the production well hydrodynamic and isotope changes are not as significant as downstream. Experience has shown (Evin & Vuillaume 1970) that, on a long run, these changes in groundwater dynamics remain under transient hydrodynamic transport conditions.
30

Groundwater exploitation and overexploitation
There is no instantaneous response of transport changes due to hydrodynamic changes because the mass deficit is first replaced by stored water before it becomes substituted by an increased inflow of water from other aquifers. Therefore, monitoring of the changes of isotope and chemical composition of groundwaters in the surroundings of deep exploitation wells has to concentrate on the well itself or the downstream area, need repeated sampling and non-steady state model evaluation of the monitoring results.
0
500
1000
1500
2000
2500
0 5 10 15 20 25
Exploitation rate in % of total recharge
Rech
arge
area
explo
ited:
Dista
nce f
rom
pump
ing lo
catio
n pumped at a depth of:
150 m
100 m
50 m
Fig.2.8 Stream lines representing the geometry and width of the inflow zone to a well extracting from great depth (upper picture). The graph below demonstrates how far the boundary stream lines of the production well move away from the well (point of the ordinate) and how the width increases both with depth and exploration rate as a percentage of groundwater recharge at the catchment surface. Modelling has been performed for a homogeneous aquifer.
31
Chapter 2
2.2 THE ORIGIN OF SALINE GROUNDWATERS IN THE AREA OF THE VALENCIA LAKE, VENEZUELA
2.2.1 INTRODUCTION
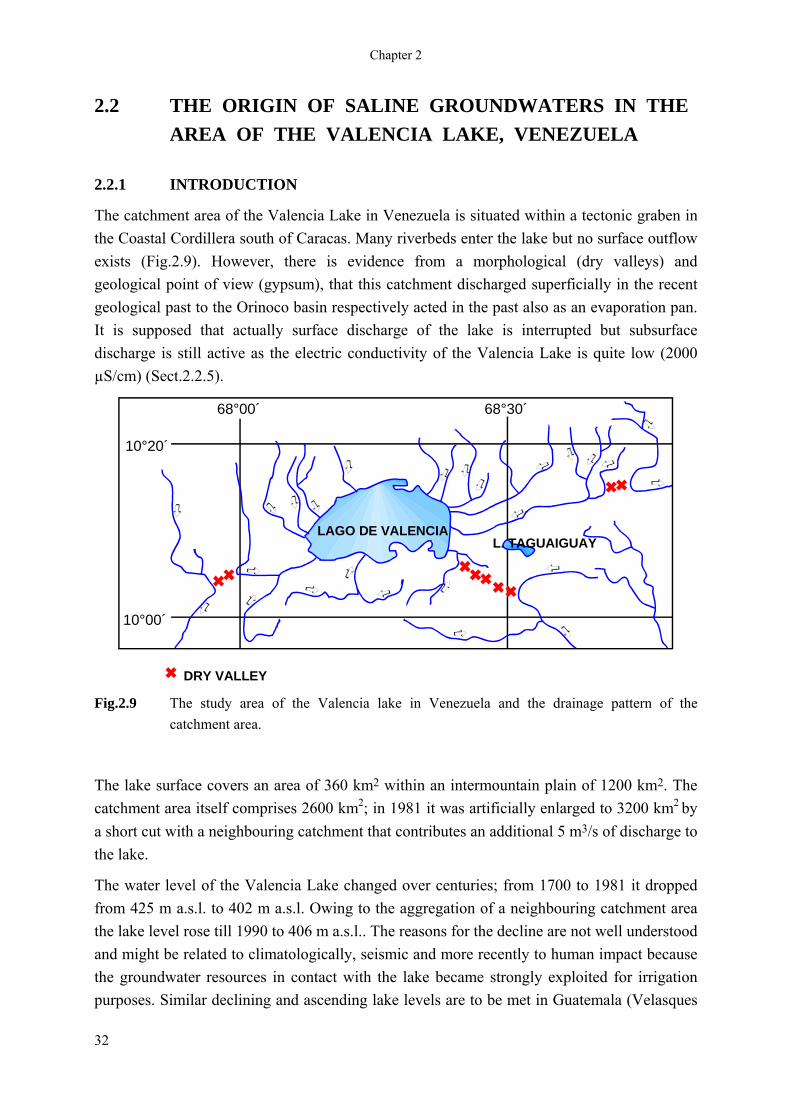
The catchment area of the Valencia Lake in Venezuela is situated within a tectonic graben in the Coastal Cordillera south of Caracas. Many riverbeds enter the lake but no surface outflow exists (Fig.2.9). However, there is evidence from a morphological (dry valleys) and geological point of view (gypsum), that this catchment discharged superficially in the recent geological past to the Orinoco basin respectively acted in the past also as an evaporation pan. It is supposed that actually surface discharge of the lake is interrupted but subsurface discharge is still active as the electric conductivity of the Valencia Lake is quite low (2000 µS/cm) (Sect.2.2.5).
10°20´
10°00´
68°00´ 68°30´
LAGO DE VALENCIAL. TAGUAIGUAY
DRY VALLEY Fig.2.9 The study area of the Valencia lake in Venezuela and the drainage pattern of the
catchment area.
The lake surface covers an area of 360 km2 within an intermountain plain of 1200 km2. The catchment area itself comprises 2600 km2; in 1981 it was artificially enlarged to 3200 km2 by a short cut with a neighbouring catchment that contributes an additional 5 m3/s of discharge to the lake.
The water level of the Valencia Lake changed over centuries; from 1700 to 1981 it dropped from 425 m a.s.l. to 402 m a.s.l. Owing to the aggregation of a neighbouring catchment area the lake level rose till 1990 to 406 m a.s.l.. The reasons for the decline are not well understood and might be related to climatologically, seismic and more recently to human impact because the groundwater resources in contact with the lake became strongly exploited for irrigation purposes. Similar declining and ascending lake levels are to be met in Guatemala (Velasques
32
Groundwater exploitation and overexploitation
et al. 1989, Baldison & Seiler 1994), but none of these are simultaneous and all seem to have local meteorological causes in these tropical zones.
Today the Valencia Lake receives the untreated wastewaters of the cities of Maracay and Valencia (each with more than 1 million inhabitants), as well as from wood processing and chemical factories, and from livestocks. About 10 ton/year of N and 3 ton/year of S reach the lake. This chemical charge led to a complete eutrophication of the lake; as a consequence, today's fishing and swimming is forbidden.
The intermountain plain is intensively urbanised and irrigated for agriculture. Irrigation waters mostly originate from groundwaters (3000 wells); locally the groundwater table was lowered to below the lake level. Only in the south and southeast of the Valencia lake two surface reservoirs store surface waters for irrigation; in between these the Taguaiguay reservoir is the most important (Fig.2.9).
Since ever groundwater quality was low in the south and southeast; recently it deteriorated also by an increase of sulphur concentrations in both drinking and irrigation waters in the North and East. This recent deterioration may be attributed to
• infiltration of lake waters to groundwaters in areas with a respective hydraulic gradient inland,
• infiltration of deep sulphated groundwaters from beneath the fresh waters of the active groundwater recharge zone or
• return waters from irrigation, having become enriched in agrochemicals.
Using hydrochemical, hydraulic and environmental isotope tools, the origin of sulphate waters and a possible subsurface outflow of the lake was quantified. Based on these data a water balance for the area was elaborated for the first time.
2.2.2 HYDROGEOLOGIC OVERVIEW
The catchment area bordering the intermountain basin is composed of crystalline rocks; its alteration products filled the intermountain plain. The fluvio-lacustrine sediments consist of silts, gravels and sands and in some places also gypsum sediments are exposed from a former evaporation pan.
The storage capacity of crystalline rocks is quite limited and expresses in a quite dense network of rivers; on the contrary, the intermountain plain filled with the weathering products of the adjacent crystalline rocks has a high storage capacity and hydraulic conductivity. Therefore, most of the creeks loose their discharge by bank infiltration hydrogeologically, so that this does not reach the lake as surface discharge.
Groundwater recharge occurs only in the intermountain plain, either by bank infiltration or by aerial infiltration of precipitation. In the southeastern part of the catchment, rivers are scarce and therefore bank infiltration is weaker and water quality is worthier (Sect. 2.2.3.2) than in
33

Chapter 2
the northern part. Actual groundwater abstraction by wells is in the range of 14 m3/s; 58% of the extracted waters are applied for irrigation, 32% for domestic and 10% for industrial use. It is estimated that about 10% of irrigation water returns to the groundwater.
2.2.3 THE ORIGIN OF GROUNDWATERS
To study the origin and interconnections between ground-, surface and irrigation waters by means of environmental isotopes, repeated sampling took place in selected rivers, springs, wells and in vertical profiles within the Valencia Lake. The stable environmental isotope results are shown in Figs.2.10 and 2.13.
-60
-50
-40
-30
-20
-10
0
10
20
30
-8 -7 -6 -5 -4 -3 -2 -1 0 1 2 3 4 5
EVAPORATION LINEVALENCIA -
LAKE
METEORIC WATER LINE
MIXING ZONE
Taguaiguay - Lagune
?
?
δ2H (‰)
δ18O (‰)
Fig.2.10 δ18O / δ2H relation of waters in the area east of the Valencia Lake.
2.2.3.1 HYDROCHEMISTRY AND ISOTOPES EAST AND SOUTH-EAST OF
THE LAKE
The stable isotopic composition of ground- and surface waters from this area follows the meteoric water line (Fig.2.10) with a Deuterium Excess of 10‰. The variation of the isotope concentrations along the meteoric water line is attributed to both seasonal variations of direct infiltrating precipitation and to an altitude effect inherent in surface waters infiltrating by means of bank infiltration. Only δ2H/δ18O relations of groundwaters in the south-eastern irrigation area with low groundwater recharge do not group along the meteoric water line; these waters must be influenced by mixing of non-evaporated with evaporated waters either from the lake or from return waters from irrigation waters from surface reservoirs (Fig.2.10).
34

Groundwater exploitation and overexploitation
Since isotopically enriched waters are to be found in areas with a groundwater level above as well as below the lake level, lake infiltration should be completely or partly be ruled out.
From all water samples also lump parameters (electric conductivity, pH, Eh, O2, temperature) have been measured during sampling. In the southeast sulphate (maximum 2000 mg/L) and chloride concentrations (maximum 150 mg/L) are much higher than elsewhere and electric conductivities even may become higher than in the Valencia Lake or the Taguaiguay reservoir. In this region chlorides as well as stable isotopes in groundwater can only originate from precipitation or surface water, because in the fluvio-lacustrine sediments no chloride evaporites exist. Consequently, the fate of both tracers since precipitation must change in parallel, as both became enriched by evaporation. The correlation between 18O and Cl- (Fig.2.11) clearly demonstrates that the chloride enrichments of the Valencia Lake and of the Taguaiguay reservoir are different. The groundwaters from the east mix obviously only with Taguaiguay waters, although in many parts of this area the groundwater table was lowered below the lake level. This indicates that return water from irrigation infiltrated and became mixed with groundwater of this area. Furthermore, the sulphate concentrations in groundwater in this region is locally much higher than ever measured in the Valencia Lake. Since no relations with the lake become obvious and irrigation water has only low sulphate concentration, a sulphate source must exist that is not related to the lake. 3H measurements from groundwaters east of the lake (Table 2.1) show that actually at sampling depth below 80 m there is no measurable 3H. Tamers (1967) showed for this area that 14C ages for the deep groundwaters are in the range of 10 000 years and thus belong to the passive recharge zone (Seiler & Lindner 1995). On the contrary, in waters between ground surface and 80 m 3H occurs (Table 2.1).
0
50
100
150
-4-3 -2 -1 0 1 2 3 4
Cl - [mg/L]
-6 -5
Lago de Valencia
Taguaiguay
MIXING AREA
δ18O (‰)
Fig.2.11 Correlation between chlorides and 18O in groundwaters east of the Valencia Lake.
35

Chapter 2
Obviously, groundwater of the active recharge zone was explored and by means of overexploitation hydraulic heads had been lowered to an extend that groundwater with high mean residence times intruded from the passive into the active groundwater recharge zone (Fig.2.12). This water with high mean residence times or low flow velocities has not yet completely leached sedimentary gypsum and thus contributes to the actual deterioration of the groundwater quality through forced hydraulic short cuts.
METAMORPHIC ROCKS
SO42- SO4
2-
SUBSURFACEOUTFLOW
UN
CO
NS.
RO
CK S
LAKE OF VALENCIA
CONE OFDEPRESION
CONE OFDEPRESION
LAGUNA DETAGUAIGUAY
HYDRAULIC HEADS OF
VALENCIA LAKE
GROUNDWATERGROUNDWATER
ACTIVE RECHARGE ZONE(CARBONATE WATERS)PASSIVE RECHARGE ZONE(SULPHATE WATERS)
W E
Fig.2.12 Generalised groundwater flow system in the sourroundings of the Valencia Lake and the influence of groundwater abstraction on the interaction between the active and passive groundwater recharge zone.
2.2.3.2 GROUNDWATER IN THE WEST AND NORTH OF THE LAKE
This study area is only irrigated with groundwater, and in the north there occur some warm waters. In the 2H/18O diagram water mostly follow the meteoric water line; a few indicate an evaporation impact, whereas individual values show only an enrichment in 18O but not in 2H (Fig.2.13).
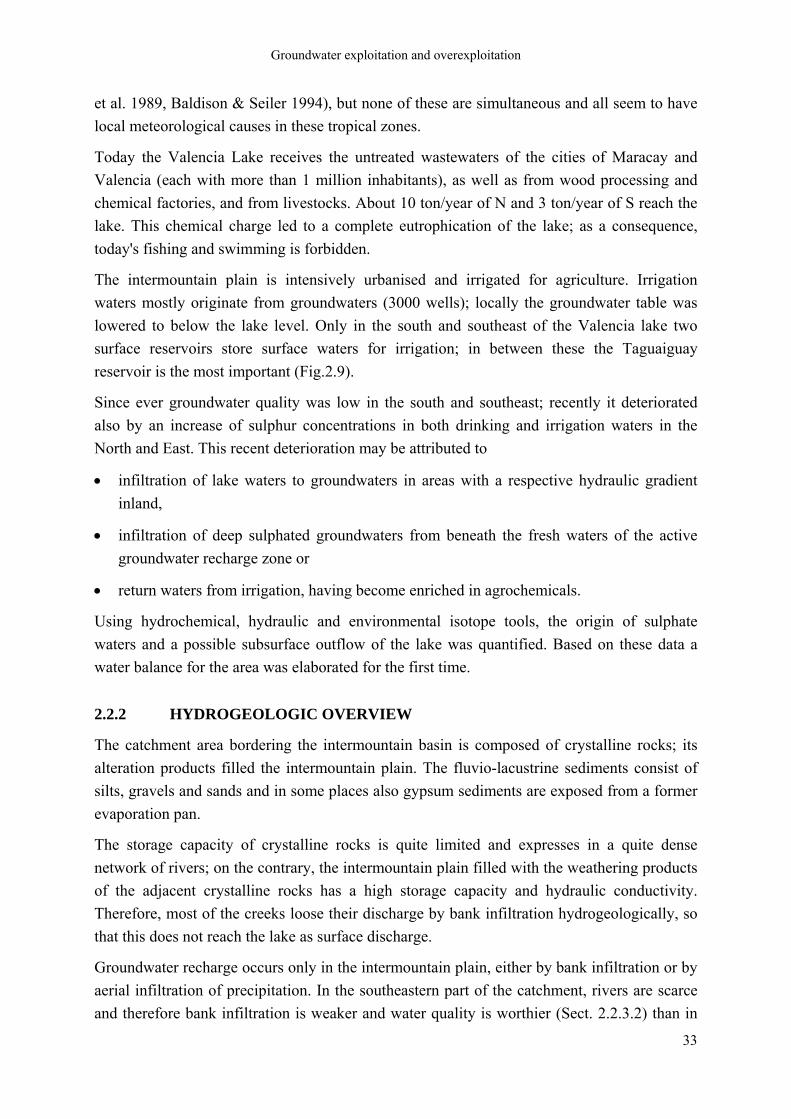
As expected, return waters from irrigation by groundwater have no stable isotope enrichment because it mainly underwent transpiration and only very little evaporation. The few stable isotope values showing enrichment occur along a quite narrow zone between La Culebra and Flor Amarilla (Fig.2.14), follow a tectonic fault (La Victoria) and correspond to Lake waters
36

Groundwater exploitation and overexploitation
discharging subsurface to the West. This subsurface outflow explains the low electric conductivity of the Valencia Lake (2000μS/cm).
-40
-35
-30
-25
-20
-15
-1
Fig.2.13 δ2H/δ18O diagram of groundwaters from the North, West and Southwest of the Valencia Lake.
Some groundwaters in the north of the lake group not along the meteoric water line. These waters were probably not subject to evaporation, because meteoric water in this region near the equator with still lower δ18O and δ2H is unlikely. Since these waters have elevated temperatures, they probably underwent only 18O enrichment by 18O exchange with mineral oxides at high temperatures (100 - 150 °C) and sufficient reaction time (Moser & Rauert 1980).
2.2.4 WATER BALANCE FOR THE STUDY AREA
Since isotope studies gave clear insights in the subsurface flow and recharge mechanisms, it approximate up a water balance for the study area. Mean annual precipitation (1962-1981) for the watershed is 1110 mm/a and for the Valencia Lake 1000 mm/a. It is obvious from the electric conductivity of the lake (2000 µS/cm) and from stable isotopes, that there exists a through flow and subsurface outflow of the Valencia Lake.
0
-5
0
5
10
15
-7 -6 -5 -4 -3 -2 -1 0 1 2 3 4
LAKE
PRECIPITATION
EVAPORATION
GEOTHERMAL
δ2H (‰)
δ18O (‰)
37

Chapter 2
This outflow (D) can be estimated from:
D = (Plake - EPlake) Alake + (Pcatchment - ETcatchment) Acatchment Plake = 1.0 m3/m2/a Elake = 2.28 m3/m2/a (measured with an evaporation pan class A) Alake = 360 x 106 m2 Pcatchment = 1.11 m3/m2/a ETcatchment = ? Acatchment = 2200 x 106 m2
Table 2.1 3H concentrations in wells east (AR) and west (CA) of the Valencia Lake.
Well Sampling Date
Sampling Depth (m)
3H (TU)
AR 6158 615A 17.03.1993 82 3.6 ± 0.7
AR 6158 616A 16.03.1993 60 1.8 ± 0.7
AR 6258 288A 17.03.1993 80 <1
AR 6258 132A 21.06.1991 80 0.6 ± 0.7
AR 6258 149A 21.06.1991 100 0.5 + 0.7
AR 6258 SN20 21.06.1991 48 0.9 + 0.7
CA 6160 029A 18.03.1993 80 <0.7
CA 6160 03 A 18.03.1993 75 0.9 + 0.7
CA 6160 069A 19.03.1993 105 0.9 + 0.7
CA 6160 137A 18.03.1993 <0.7
CA 6169 SN 4 19.03.1993 80 <0.7
CA 6161 052A 21.09.1991 60 3.8 + 0.7
CA 6259 SN01 21.06.1991 60 0.3 + 0.7
CA 6259 SN02 21.06.1991 16 0.8 + 0.7
CA 6260 080A 21.06.1991 82 3.5 + 0.7
CA 6260 097A 21.06.1991 160 0.6 + 0.7
Assuming the abscence of subsurface discharge in the area, the actual evapotranspiration was 892 mm/a. Since subsurface discharge does exist, ET must be lower. According to calculations of ET in the Dominican Republic and Guatemala (Febrillet et al. 1989, Baldison & Seiler 1989, Baldison & Seiler 1994), 850 mm/a might be close to reality in this tropical region. Based on this value the subsurface discharge was
D = 3.5 m3/s or D = 42 mm/a.
The exploitation of 14 m3/s together with the 3.5 m3/s subsurface outflow of the Valencia Lake caused the observed decline of the lake level. However, the recent aggregation of 5 m3/s
38
Groundwater exploitation and overexploitation
from a neighbouring catchment area made the lake table rising. Obviously the available groundwater recharge ranges between 12.5 and 17.5 m3/s and is very variable in this zone with tropical climate conditions.
0 5 km
FLOR AMARILLA LA CULEBRA
SUBSURFACE
DISCHARGE
LAGO DEVALENCIA
unevaporated watersevaporated waters
Fig.2.14 Subsurface outflow of lake waters in the West and the geothermal waters in the North of the Valencia Lake.
39

Chapter 2
40