2. implement combined heat and power in the electric … · 2. implement combined heat and power...
TRANSCRIPT

2. Implement Combined Heat and Power in the Electric Sector
2-1
1 US Energy Information Administration. (2012). Electric Power Annual Report, Table 8.1. Average Operating Heat Rate for Selected Energy Sources. Available at: http://www.eia.gov/electricity/annual/html/epa_08_01.html
2 Note that because the heat needs to be extracted at a higher temperature and pressure than the large thermal loss in the condensers, recovering this heat from a power plant typically results in losses in power capacity. This is discussed in greater detail below.
3 Total US CHP capacity was 83 gigawatts in 2014. ICF International for the US DOE and Oak Ridge National Laboratory. (2014, March). CHP Installation Database. Available at: http://www.eea-inc.com/chpdata/
4 CHP can be said to be underutilized in the US market in comparison to high penetration rates in Europe. For example, CHP accounts for over 45 percent of electricity in Denmark and over 30 percent in the Netherlands (2009).
2. Implement Combined Heat and Power in the Electric Sector
1. Profile
One strategy for reducing carbon dioxide (CO2) emissions is to capture the waste heat from electric generating units (EGUs) as a secondary output to serve other purposes,
typically central heating and cooling or industrial processes in neighboring facilities. As described in the context of boiler optimization in Chapter 1, heat losses can be recovered from the flue gases or cooling system to improve plant efficiency (see Table 1-2). In addition to using waste heat to preheat boiler feedwater and meet other operational thermal requirements, plants can also capture and pipe heat locally to satisfy other co-located demand for thermal energy. Combined heat and power (CHP), also known as cogeneration, is the term used to describe this variety of technology configurations that sequentially generates both electric and useful thermal output from a single fuel source.
Generating only electricity, the average US coal-fired power plant has a conversion efficiency of 33 percent, which means that two-thirds of the energy input is lost
CHP can also be regarded as underutilized on the basis that cost-effective investment opportunities are widely available. Assessments of economic feasibility are discussed below, but estimates typically range between 40 and 50 gigawatts of potential. See: European Environment Agency. (2012, April). Combined Heat and Power Assessment: ENER 020. Available at: http://www.eea.europa.eu/data-and-maps/indicators/combined-heat-and-power-chp-1/combined-heat-and-power-chp-2; McKinsey & Company. (2009). Unlocking Energy Efficiency in the US Economy. Available at: http://www.mckinsey.com/client_service/electric_power_and_natural_gas/latest_thinking/unlocking_energy_efficiency_in_the_us_economy; US DOE. (2008, December 1). Combined Heat and Power: Effective Energy Solutions for a Sustainable Future. Available at: http://www.energy.gov/sites/prod/files/2013/11/f4/chp_report_12-08.pdf
5 US DOE, at supra footnote 4.
through heat, largely in the condensation of steam.1 CHP captures much of this waste heat as useful thermal output, substituting for heat that would have been produced separately.2 Whereas generating electricity and thermal energy separately might have an overall efficiency ranging from 40 to 55 percent, CHP applications can achieve system efficiencies of 60 to 80 percent (Figure 2-1). These efficiency gains are accompanied by fuel savings that make CHP a cost-effective and commercially available solution for reducing CO2 emissions. CHP both improves businesses’ bottom lines and delivers system-wide benefits like reduced air pollution, improved grid reliability, and avoided electric losses on transmission and distribution networks. With CHP currently accounting for 8 percent of US generating capacity and 12 percent of electricity,3 it is regarded as a widely underutilized opportunity for emissions reductions.4 The US Department of Energy (DOE) has estimated that increasing CHP to 20 percent of electric power capacity by 2030 would reduce CO2 emissions by more than 800 million metric tons per year.5
However, because the benefits of CHP accrue economy-wide and not just in the electric power sector, adequately

Implementing EPA’s Clean Power Plan: A Menu of Options
2-2
accounting for them poses challenges. Modifying a generating unit to optimize for electric and thermal output, for example, improves overall energy utilization, but could result in an increase in the facility’s direct emissions and an increase in emissions per unit of electric output. Therefore, although the technology is mature and although the emissions reduction potential is large, tapping that potential requires specialized accounting conventions and other carefully constructed regulatory, legal, and financial approaches that look at the total useful energy output of CHP (electric and thermal) and that look at impacts beyond the source of emissions.
Proposed federal regulations for greenhouse gas (GHG) emissions under sections 111(b) and 111(d) of the Clean Air Act are structured to create broad exemptions for CHP facilities. They affect only a portion of the existing CHP units in the power sector, larger units designed to deliver electricity to the grid (criteria provided in Section 2). For those units that are affected, the rules stipulate an accounting method that grants credit for a facility’s useful thermal output and avoided line losses as a means of rewarding the environmental benefits of CHP (see Section 4). For other affected EGUs, the viability of retrofitting for CHP would be contingent on site-specific factors, such as plant equipment, local demand for thermal energy, fuel costs, market conditions, and so on, but retrofitting would also allow an EGU to claim the thermal and avoided line loss credits to improve its CO2 emissions rate toward compliance. Alternatively, retrofitting could provide an opportunity for a unit to qualify for exemption. States could also use the energy efficiency or clean energy building blocks of the US Environmental Protection Agency’s (EPA) Best System of Emission Reduction framework to incorporate CHP as a GHG abatement strategy, especially those installations that are exempt from EPA rules, both in and outside the power sector.
There are two basic types of CHP: topping and bottoming systems. In a “bottoming-cycle” configuration, also known as waste heat to power, the primary function is to combust fuel to provide thermal input to an industrial process, such as in a steel mill, cement kiln, or refinery. Waste heat is then recovered from the hot process exhaust for power generation, usually through a heat recovery boiler that makes high pressure steam to drive a turbine generator. More common is a “topping-cycle” system, a configuration
ConventionalGeneration
ConventionalGeneration
Combined Heat & Power5 MW Natural Gas
Combustion Turbine
Combined Heat & Power5 MW Natural Gas
Combustion Turbine
Power Station Fuel
Power Station Fuel(US Fossil Mix)
Electricity
Electricity
Emissions32 kTons
Emissions13 kTons
Emissions23 kTons
Heat
Heat
Electricity
Electricity
Heat
Heat
56 Units Fuel
91 Units Fuel
147 Units Fuel 100 Units Fuel
CHP Fuel (Gas)
30 Units
Electricity
35,000MWh
45 Units
Steam
179,130MMBtu
Boiler Fuel
Boiler Fuel (Gas)
EFFICIENCY:33%
EFFICIENCY:33%
Power Plant
Power Plant
Boiler
Boiler
Combined Heat & Power (CHP)
Combined Heat & Power (CHP)
EFFICIENCY:80%
EFFICIENCY:80%
51% ... Overall Efficiency ... 75%
45 k tons/yr ... Total Emissions ... 23k tons/yr
Figure 2-1
Comparison of Separate and Combined Heat and Power Efficiencies and CO2 Emissions6
in which a steam turbine, gas turbine, or reciprocating engine has the primary purpose of generating electricity. Heat is then captured, usually as steam, and directed to nearby facilities, where it can be used to meet co-located demand for central heating or manufacturing processes. This chapter discusses topping-cycle CHP applications at central station EGUs as a means of reducing the carbon intensity of the electric power sector. Alternatively, CHP can be distributed across the electric grid at individual facilities, where energy users such as institutional, commercial, and manufacturing facilities have both power and heating or
6 US EPA. (2014, August). CHP Partnership. Available at: http://www.epa.gov/chp/. A power plant efficiency of 33 percent (higher heating value) denotes an average delivered efficiency based on 2009 data from eGRID for all fossil fuel power plants (35.6 percent), plus 7 percent transmission and distribution losses.
2. Implement Combined Heat and Power in the Electric Sector
2-3
cooling requirements. Potential applications of this kind are more abundant than for large centralized CHP generating units, and are considered a specific type of distributed generation. CHP as a form of distributed generation is the subject of Chapter 3.
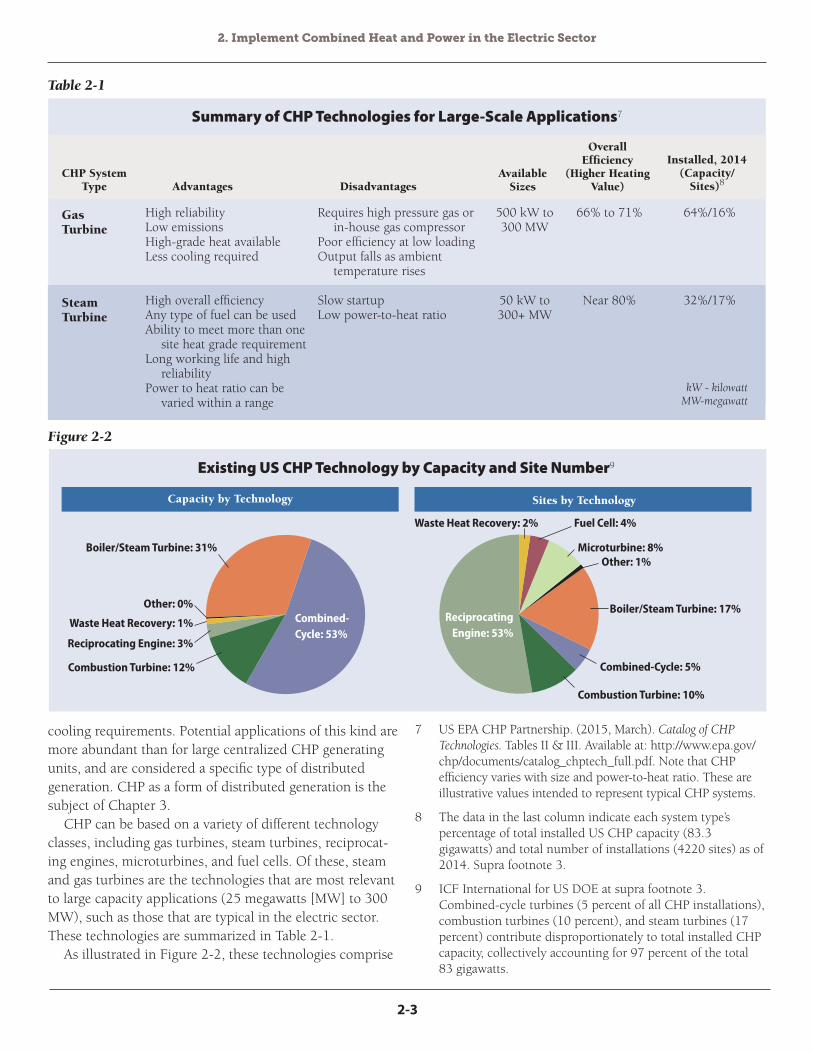
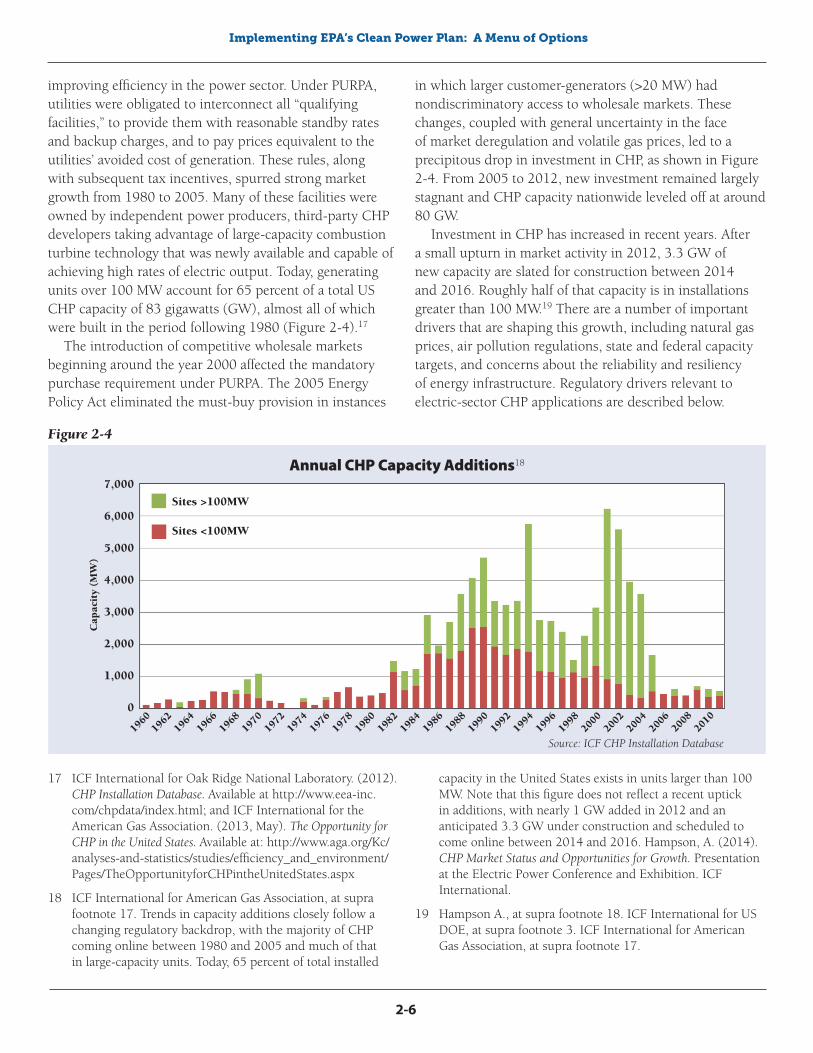
CHP can be based on a variety of different technology classes, including gas turbines, steam turbines, reciprocat-ing engines, microturbines, and fuel cells. Of these, steam and gas turbines are the technologies that are most relevant to large capacity applications (25 megawatts [MW] to 300 MW), such as those that are typical in the electric sector. These technologies are summarized in Table 2-1.
As illustrated in Figure 2-2, these technologies comprise
Table 2-1
Summary of CHP Technologies for Large-Scale Applications7
CHP System Type Advantages Disadvantages
Available Sizes
Overall Efficiency
(Higher Heating Value)
Installed, 2014 (Capacity/
Sites)8
Gas Turbine
Steam Turbine
500 kW to 300 MW
50 kW to 300+ MW
66% to 71%
Near 80%
64%/16%
32%/17%
High reliability Low emissions High-grade heat available Less cooling required
High overall efficiencyAny type of fuel can be used Ability to meet more than one
site heat grade requirement Long working life and high
reliabilityPower to heat ratio can be
varied within a range
Requires high pressure gas or in-house gas compressor
Poor efficiency at low loading Output falls as ambient
temperature rises
Slow startupLow power-to-heat ratio
7 US EPA CHP Partnership. (2015, March). Catalog of CHP Technologies. Tables II & III. Available at: http://www.epa.gov/chp/documents/catalog_chptech_full.pdf. Note that CHP efficiency varies with size and power-to-heat ratio. These are illustrative values intended to represent typical CHP systems.
8 The data in the last column indicate each system type’s percentage of total installed US CHP capacity (83.3 gigawatts) and total number of installations (4220 sites) as of 2014. Supra footnote 3.
9 ICF International for US DOE at supra footnote 3. Combined-cycle turbines (5 percent of all CHP installations), combustion turbines (10 percent), and steam turbines (17 percent) contribute disproportionately to total installed CHP capacity, collectively accounting for 97 percent of the total 83 gigawatts.
Figure 2-2
Existing US CHP Technology by Capacity and Site Number9
Boiler/Steam Turbine: 31%
Boiler/Steam Turbine: 17%
Combined-Cycle: 5%Combustion Turbine: 12%
Combustion Turbine: 10%
Other: 0%
Waste Heat Recovery: 1%
Waste Heat Recovery: 2% Fuel Cell: 4%
Microturbine: 8%Other: 1%
Reciprocating Engine: 3%
Combined-Cycle: 53%
Reciprocating Engine: 53%
Capacity by Technology Sites by Technology
kW - kilowattMW-megawatt

Implementing EPA’s Clean Power Plan: A Menu of Options
2-4
96 percent of all US installed CHP capacity, but account for only 33 percent of CHP sites, reflecting the large capacity of installations in these technology categories.
Whether the boiler is fueled by coal, biomass, solid waste, or other energy source, steam turbine applications are the most well established of utility-scale EGU technologies. CHP can be adapted as a retrofit to steam turbine power plants to capture heat that would otherwise exit the system through the cooling water. The cooling water itself, however, is usually not hot enough for district or process heating purposes. Therefore, depending on the thermal requirements, energy must be extracted farther upstream in the thermodynamic cycle, usually from the turbine, before the pressure and temperature are dropped to condense the steam.10 This modification to the plant will result in reduced electrical output, although the overall energy utilization (electricity and useful thermal) is greater than would be the case if power and heat were produced separately. Because steam turbines are expensive to operate and generally have long startup times, the economics of a steam generator CHP are often more favorable for medium- to large-scale facilities outside the electric sector, such as chemical plants and primary metal processing plants with high capacity factors. However, the economics of CHP may be favorable at steam generator EGUs that are expected to operate with high capacity factors.11
CHP can also be applied to combustion turbine generation, whether burning natural gas, synthetic gas, or another gaseous fuel, in both simple-cycle and combined-cycle natural gas power plants. Natural gas is the most common fuel in CHP applications, accounting for more than 70 percent of capacity in the United States,12 and although simple-cycle gas turbine CHP is often used in smaller installations (<40 MW), roughly half of the total US capacity is built around large, combined-cycle gas turbines
that primarily generate electric output for the grid while also supplying steam to neighboring facilities.
In simple-cycle plants, fuel is combusted to generate electricity by heating and compressing air, the resulting force of which drives the power turbine. The exhaust gas leaving the turbine is very hot, between 800° and 1100° Fahrenheit, depending on the type of unit. In simple-cycle CHP applications, the exhaust gas directly serves as a source of process energy or, more likely, it is run through a heat exchanger, typically a heat recovery steam generator, after which steam serves as the energy carrier for thermal purposes. Although simple-cycle gas turbines have an electric efficiency ranging from 15 to 42 percent, simple-cycle CHP units usually achieve 65 to 70 percent.13
A combined-cycle turbine (see Figure 2-3) runs high temperature exhaust through a waste heat recovery unit to produce steam for a second cycle of power generation based on a steam turbine. This configuration has an electric efficiency ranging from 38 to 60 percent. CHP applications to this configuration will usually extract mid- to high-pressure steam before the steam turbine, or low pressure steam after the steam turbine, depending on the required performance specifications of the thermal user. In this way, combined-cycle CHP can achieve system efficiencies of 60 to 70 percent.
Achieving high rates of efficiency depends on having a dedicated thermal load that is compatible in size with the thermal output of the CHP system. A CHP system sited at a commercial or industrial facility will usually be sized and designed to accommodate the thermal demand, but for retrofits to existing power plants, optimizing the CHP system in this way is not an option. Instead, the design objective for EGU retrofits would require balancing the tradeoff between thermal energy sales and reduced power production on steam turbines. In practice, achieving this
10 There are two kinds of steam turbine CHP. In a non-condensing or back-pressure system, the flow of steam exiting the turbine is fed entirely to the process requirements, usually at low to medium pressure. In an extraction turbine, higher pressure steam is extracted through openings in the turbine casing, while the rest of the steam continues its expansion in the turbine to be exhausted into the condenser. An extraction turbine may be designed to allow for regulation of heat-to-power ratio and for extraction of steam at different pressure levels. For more, see: supra footnote 7.
11 In some instances at existing CHP units, the revenue associated with the non-generation (heat supply) aspects of CHP operation can enable particular units to remain economically viable. Steam generator operation may be maintained even when there is no short-term market for the generated electricity. When these types of instances occur, the units tend to be operating very inefficiently.
12 ICF for DOE at supra footnote 3.
13 US EPA. Emission Factors and AP42. Emission Factors: Stationary Internal Combustion Sources. Chapter 3: Stationary Gas Turbines. Available at: http://www.epa.gov/ttnchie1/ap42/ch03/final/c03s01.pdf

2. Implement Combined Heat and Power in the Electric Sector
2-5
CHP also faces the challenge of finding concurrent load. In other words, to maximize energy savings, CHP is most advantageous for end-users with high and steady demand for thermal heat. Yet many of the power plants at which the installation of CHP might be technically feasible are gas turbines used as peaking units. Dispatched to meet peak demand for only a few hours or few hundred hours a year, these units would not generate a continuous enough supply of heat to satisfy industrial or district heat users.
Given the complexity of retrofitting existing EGUs, opportunities for developing new, utility-scale CHP using
an industrial or energy park model may be more promising. Successful partnerships have created many opportunities in which cogeneration power plants and industrial facilities co-locate to take advantage of low-cost steam. A majority of CHP capacity in the United States today is made up of partnerships between large CHP generators (>100 MW) and industrial facilities. Looking forward, some of the new capacity additions required to offset anticipated coal-fired EGU retirements could be met through this sort of new and efficient utility-scale CHP.
2. Regulatory Backdrop
In response to the energy crisis of 1973, the United States enacted the Public Utilities Regulatory Policies Act (PURPA) in 1978, which required utilities to purchase electricity from cogeneration facilities as a means of
14 Supra footnote 7. In a combined-cycle gas turbine, high temperature exhaust is used to produce steam for a second cycle of power generation based on a steam turbine. If steam from the heat recovery steam generator is directed instead to meet space or process heating needs, it is considered a simple-cycle CHP unit.
15 In northern Europe, where CHP penetration is highest and much of it serves district heating demands, large transmission pipelines typically have a grid length of between 12 and 50 miles (20 to 80 kilometers). One of the European Union’s largest networks, located in Aarhus, Denmark, has 81 miles (130 kilometers) of interconnected bulk heat pipeline fed by more than one source of thermal energy, rivaling the Con Ed Steam System in Manhattan,
New York, which on a customer basis is considered the largest district steam system in the world. Cost effectiveness of piping thermal energy depends on demand density and total load, with losses decreasing with scale and pipe diameter. See: European Commission Joint Research Centre. (2012). Background Report on EU-27 District Heating and Cooling Potentials, Barriers, Best Practices and Measures of Promotion. Available at: https://setis.ec.europa.eu/system/files/JRCDistrictheatingandcooling.pdf; and International District Energy Association. (2005, August 5). IDEA Report: The District Energy Industry. Available at: http://lincoln.ne.gov/city/mayor/arena/assets/idea_district_energy.pdf
16 Great River Energy’s facility in Underwood, North Dakota provides an example, described below.
Figure 2-3
Heat Recovery From a Gas Combustion Turbine Using a Heat Recovery Steam Generator14
objective will be highly dependent on site-specific factors — for example, plant equipment, geographic constraints, market conditions, steam requirements, pollution control equipment — which may make this category of GHG reduction potential fairly limited, particularly when considering only the electricity sector.
One practical and substantial constraint for CHP is the limited ability to move steam to where it can still be useful. Because steam can only be transported effectively over short distances, a power plant must be situated within close prox-imity to a district steam network or large industrial user.15 Alternatively, the guarantee of long-term, low-priced steam energy can attract industrial, institutional, or commercial partners to build facilities or district steam networks adjacent to central station power plants, although the unique financial and partnership circumstances underlying such an investment decision are difficult to generalize.16
Gas Turbine
Electricity
Feed water
HRSG
Steam Turbine(Combined-Cycle) Low pressure steam to
process or condenser
Medium/high pressure steam to process (Simple-cycle with heat recovery)
Electricity
Implementing EPA’s Clean Power Plan: A Menu of Options
2-6
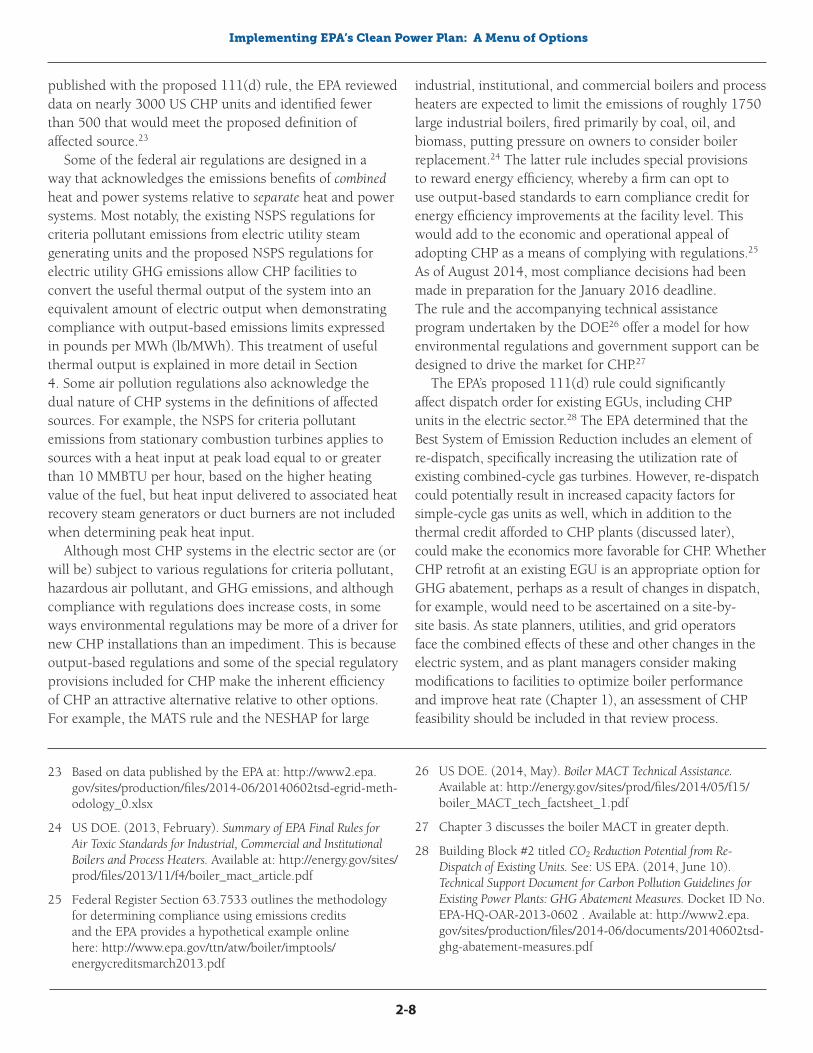
improving efficiency in the power sector. Under PURPA, utilities were obligated to interconnect all “qualifying facilities,” to provide them with reasonable standby rates and backup charges, and to pay prices equivalent to the utilities’ avoided cost of generation. These rules, along with subsequent tax incentives, spurred strong market growth from 1980 to 2005. Many of these facilities were owned by independent power producers, third-party CHP developers taking advantage of large-capacity combustion turbine technology that was newly available and capable of achieving high rates of electric output. Today, generating units over 100 MW account for 65 percent of a total US CHP capacity of 83 gigawatts (GW), almost all of which were built in the period following 1980 (Figure 2-4).17
The introduction of competitive wholesale markets beginning around the year 2000 affected the mandatory purchase requirement under PURPA. The 2005 Energy Policy Act eliminated the must-buy provision in instances
7,000
6,000
5,000
4,000
3,000
2,000
1,000
0
1960
1962
1964
1966
1968
1970
1972
1974
1976
1978
1980
1982
1984
1986
1988
1990
1992
1994
1996
1998
2000
2002
2004
2006
2008
2010
Sites >100MW
Sites <100MW
Cap
acit
y (M
W)
Source: ICF CHP Installation Database
Figure 2-4
Annual CHP Capacity Additions18
17 ICF International for Oak Ridge National Laboratory. (2012). CHP Installation Database. Available at http://www.eea-inc.com/chpdata/index.html; and ICF International for the American Gas Association. (2013, May). The Opportunity for CHP in the United States. Available at: http://www.aga.org/Kc/analyses-and-statistics/studies/efficiency_and_environment/Pages/TheOpportunityforCHPintheUnitedStates.aspx
18 ICF International for American Gas Association, at supra footnote 17. Trends in capacity additions closely follow a changing regulatory backdrop, with the majority of CHP coming online between 1980 and 2005 and much of that in large-capacity units. Today, 65 percent of total installed
capacity in the United States exists in units larger than 100 MW. Note that this figure does not reflect a recent uptick in additions, with nearly 1 GW added in 2012 and an anticipated 3.3 GW under construction and scheduled to come online between 2014 and 2016. Hampson, A. (2014). CHP Market Status and Opportunities for Growth. Presentation at the Electric Power Conference and Exhibition. ICF International.
19 Hampson A., at supra footnote 18. ICF International for US DOE, at supra footnote 3. ICF International for American Gas Association, at supra footnote 17.
in which larger customer-generators (>20 MW) had nondiscriminatory access to wholesale markets. These changes, coupled with general uncertainty in the face of market deregulation and volatile gas prices, led to a precipitous drop in investment in CHP, as shown in Figure 2-4. From 2005 to 2012, new investment remained largely stagnant and CHP capacity nationwide leveled off at around 80 GW.
Investment in CHP has increased in recent years. After a small upturn in market activity in 2012, 3.3 GW of new capacity are slated for construction between 2014 and 2016. Roughly half of that capacity is in installations greater than 100 MW.19 There are a number of important drivers that are shaping this growth, including natural gas prices, air pollution regulations, state and federal capacity targets, and concerns about the reliability and resiliency of energy infrastructure. Regulatory drivers relevant to electric-sector CHP applications are described below.

2. Implement Combined Heat and Power in the Electric Sector
2-7
Air Pollution RegulationsCHP units may be subject to permitting requirements
and a variety of existing federal air pollution standards for criteria and hazardous air pollutant emissions, depending on the fuels combusted, the heat input or electrical output of the system, how much electricity is delivered to the grid versus used onsite, and the date of construction, reconstruction, or modification. Criteria pollutant emissions from CHP systems may be subject to New Source Performance Standards (NSPS) under one of the 40 C.F.R. Part 60 regulations, as follows:
• Subpart Da, for electric utility steam generating units;• Subpart Db, for large industrial, commercial, and
institutional steam generating units;• Subpart Dc, for small industrial, commercial, and
institutional steam generating units;• Subpart IIII, for stationary compression ignition
internal combustion engines;• Subpart JJJJ, for stationary spark ignition internal
combustion engines; or• Subpart KKKK, for stationary combustion turbines. Hazardous air pollutant emissions from CHP systems
may be subject to National Emission Standards for Hazardous Air Pollutants (NESHAP) under one of the 40 C.F.R. Part 63 regulations, as follows:
• Subpart YYYY, for stationary combustion turbines;• Subpart ZZZZ, for stationary reciprocating internal
combustion engines;• Subpart DDDDD, for large industrial, commercial,
and institutional boilers and process heaters;• Subpart UUUUU, for coal- and oil-fired electric
utility steam generating units (often referred to as the Mercury and Air Toxics Standard or MATS rule); or
• Subpart JJJJJJ, for small industrial, commercial, and institutional boilers and process heaters.
As mentioned earlier, the proposed federal regulations for new and existing electric utility GHG emissions under sections 111(b) and 111(d) of the Clean Air Act would also
apply to some CHP systems. Under the proposed existing source performance standard (the 111(d) rule), an affected EGU is defined as any steam generating unit, integrated gasification combined-cycle, or stationary combustion turbine that commences construction on or before January 8, 2014 and meets either of the following conditions:
• A steam generating unit or integrated gasification combined-cycle that has a base load rating greater than 73 MW (250 MMBTU20/h) heat input of fossil fuel (either alone or in combination with any other fuel) and was constructed for the purpose of supplying one-third or more of its potential electric output and more than 219,000 megawatt-hours (MWh) net-electric output to a utility distribution system on an annual basis; or
• A stationary combustion turbine that has a base load rating greater than 73 MW (250 MMBTU/h), was constructed for the purpose of supplying, and supplies, one-third or more of its potential electric output and more than 219,000 MWh net-electrical output to a utility distribution system on a three-year rolling average basis, combusts fossil fuel for more than 10 percent of the heat input during a three-year rolling average basis, and combusts over 90 percent natural gas on a heat input basis on a three-year rolling average basis.21
The EPA proposed a nearly identical definition for new sources in the 111(b) rule. What is noteworthy for the purposes of this chapter is that the definition of affected source in both of the proposed electric sector GHG rules is crafted in a way that would exclude most CHP systems outside of the electric sector (the subject of Chapter 3) from regulation, because those systems are usually designed to deliver more than two-thirds of their electrical output for onsite use. CHP systems within the electric power sector are often larger and designed to deliver electricity to the grid, and thus are more likely to be affected by these proposed GHG regulations.22 In support documents
20 MBTU stands for one million BTUs, which can also be expressed as one decatherm (10 therms). MBTU is occasionally expressed as MMBTU, which is intended to represent a thousand thousand BTUs.
21 US EPA. (2014). 40 C.F.R. Part 60. Carbon Pollution Emission Guidelines for Existing Stationary Sources: Electric Utility Generating Units. Available at: http://www.gpo.gov/fdsys/pkg/FR-2014-06-18/pdf/2014-13726.pdf
22 In a similar fashion, the regulatory definition of electric utility steam generating unit in existing NSPS and NESHAP
rules is limited to units constructed for the purpose of supplying more than one-third of potential electric output capacity for sale rather than onsite use. This is significant because the existing NSPS and NESHAP rules for electric utility steam generating units are more stringent than for the other combustion technologies noted herein. This is also one of the reasons this document draws a distinction between CHP systems serving the electric power sector (the subject of this chapter) and CHP systems serving other sectors (the subject of Chapter 3).
Implementing EPA’s Clean Power Plan: A Menu of Options
2-8
published with the proposed 111(d) rule, the EPA reviewed data on nearly 3000 US CHP units and identified fewer than 500 that would meet the proposed definition of affected source.23
Some of the federal air regulations are designed in a way that acknowledges the emissions benefits of combined heat and power systems relative to separate heat and power systems. Most notably, the existing NSPS regulations for criteria pollutant emissions from electric utility steam generating units and the proposed NSPS regulations for electric utility GHG emissions allow CHP facilities to convert the useful thermal output of the system into an equivalent amount of electric output when demonstrating compliance with output-based emissions limits expressed in pounds per MWh (lb/MWh). This treatment of useful thermal output is explained in more detail in Section 4. Some air pollution regulations also acknowledge the dual nature of CHP systems in the definitions of affected sources. For example, the NSPS for criteria pollutant emissions from stationary combustion turbines applies to sources with a heat input at peak load equal to or greater than 10 MMBTU per hour, based on the higher heating value of the fuel, but heat input delivered to associated heat recovery steam generators or duct burners are not included when determining peak heat input.
Although most CHP systems in the electric sector are (or will be) subject to various regulations for criteria pollutant, hazardous air pollutant, and GHG emissions, and although compliance with regulations does increase costs, in some ways environmental regulations may be more of a driver for new CHP installations than an impediment. This is because output-based regulations and some of the special regulatory provisions included for CHP make the inherent efficiency of CHP an attractive alternative relative to other options. For example, the MATS rule and the NESHAP for large
industrial, institutional, and commercial boilers and process heaters are expected to limit the emissions of roughly 1750 large industrial boilers, fired primarily by coal, oil, and biomass, putting pressure on owners to consider boiler replacement.24 The latter rule includes special provisions to reward energy efficiency, whereby a firm can opt to use output-based standards to earn compliance credit for energy efficiency improvements at the facility level. This would add to the economic and operational appeal of adopting CHP as a means of complying with regulations.25 As of August 2014, most compliance decisions had been made in preparation for the January 2016 deadline. The rule and the accompanying technical assistance program undertaken by the DOE26 offer a model for how environmental regulations and government support can be designed to drive the market for CHP.27
The EPA’s proposed 111(d) rule could significantly affect dispatch order for existing EGUs, including CHP units in the electric sector.28 The EPA determined that the Best System of Emission Reduction includes an element of re-dispatch, specifically increasing the utilization rate of existing combined-cycle gas turbines. However, re-dispatch could potentially result in increased capacity factors for simple-cycle gas units as well, which in addition to the thermal credit afforded to CHP plants (discussed later), could make the economics more favorable for CHP. Whether CHP retrofit at an existing EGU is an appropriate option for GHG abatement, perhaps as a result of changes in dispatch, for example, would need to be ascertained on a site-by-site basis. As state planners, utilities, and grid operators face the combined effects of these and other changes in the electric system, and as plant managers consider making modifications to facilities to optimize boiler performance and improve heat rate (Chapter 1), an assessment of CHP feasibility should be included in that review process.
23 Based on data published by the EPA at: http://www2.epa.gov/sites/production/files/2014-06/20140602tsd-egrid-meth-odology_0.xlsx
24 US DOE. (2013, February). Summary of EPA Final Rules for Air Toxic Standards for Industrial, Commercial and Institutional Boilers and Process Heaters. Available at: http://energy.gov/sites/prod/files/2013/11/f4/boiler_mact_article.pdf
25 Federal Register Section 63.7533 outlines the methodology for determining compliance using emissions credits and the EPA provides a hypothetical example online here: http://www.epa.gov/ttn/atw/boiler/imptools/energycreditsmarch2013.pdf
26 US DOE. (2014, May). Boiler MACT Technical Assistance. Available at: http://energy.gov/sites/prod/files/2014/05/f15/boiler_MACT_tech_factsheet_1.pdf
27 Chapter 3 discusses the boiler MACT in greater depth.
28 Building Block #2 titled CO2 Reduction Potential from Re-Dispatch of Existing Units. See: US EPA. (2014, June 10). Technical Support Document for Carbon Pollution Guidelines for Existing Power Plants: GHG Abatement Measures. Docket ID No. EPA-HQ-OAR-2013-0602 . Available at: http://www2.epa.gov/sites/production/files/2014-06/documents/20140602tsd-ghg-abatement-measures.pdf

2. Implement Combined Heat and Power in the Electric Sector
2-9
State and Federal Capacity Targets State and federal capacity targets have been powerful
tools in support of CHP. An Executive Order to Accelerate Investment in Industrial Energy Efficiency issued by the Obama Administration in 2012 set a national target of 40 GW of new, cost-effective CHP to be added by 2020.29 Many states have also enacted capacity targets or included energy-efficient CHP as a qualifying resource in their energy efficiency or renewable portfolio standards (discussed in Chapters 11 and 16, respectively). As of 2013, 23 states had included CHP in either their energy efficiency or renewable portfolio standards,30 which typically both puts a procurement obligation on utilities and offers financial incentives. California, New York, North Carolina, New Jersey, and Massachusetts are states that have adopted specific initiatives to support the development of CHP. Because most of the outreach related to these capacity targets has focused on CHP in sectors other than the electric power sector, this topic is covered in more detail in Chapter 3.
Reliability and Resiliency of Energy Infrastructure
CHP systems can serve as low-cost generation additions to the power system that reduce congestion and strain on transmission and distribution networks. Integrated with micro-grid and islanding capabilities, particularly to support hospitals, public security, and other critical infrastructure, CHP can enhance reliability and resiliency during grid disruptions. Recent natural disasters causing widespread and extensive grid failure have demonstrated the resiliency benefits of CHP and called attention to CHP as an important component of building robust energy infrastructure.31 Following Hurricanes Sandy and
29 Executive Order 13624. (2012, August 30). Accelerating Investment in Industrial Energy Efficiency. 77 FR 54779. Available at: http://www.gpo.gov/fdsys/pkg/FR-2012-09-05/pdf/2012-22030.pdf
30 US DOE, EPA, & SEE Action Network. (2013, March). The Guide to Successful Implementation of State Combined Heat and Power Policies. Available at: https://www4.eere.energy.gov/seeaction/publication/guide-successful-implementation-state-combined-heat-and-power-policies
31 A. Chittum. (2012, December 6). How CHP Stepped Up When the Power Went Out During Hurricane Sandy. [Web log post]. Available at: http://www.aceee.org/blog/2012/12/how-chp-stepped-when-power-went-out-d
32 CT P.A. 12 148 Section 7. (2012, July). Microgrid Grant and Loan Pilot Program. Available at: http://www.cga.ct.gov/2012/act/pa/pdf/2012PA-00148-R00SB-00023-PA.pdf
33 Texas HB 1831. Available at: http://www.capitol.state.tx.us/tlodocs/81R/billtext/pdf/HB01831F.pdf. Texas HB 4409. Available at: http://www.capitol.state.tx.us/tlodocs/81R/billtext/pdf/HB04409F.pdf. Louisiana Senate resolution No. 171. Available at: http://www.legis.la.gov/legis/BillInfo.aspx?s=12RS&b=SR171&sbi=y. For more extensive information on case studies see: ICF International for Oak Ridge Nation- al Lab. (2013, March). Combined Heat and Power: Enabling Resilient Energy Infrastructure for Critical Facilities. Available at: http://www.energy.gov/eere/amo/downloads/chp-enabling- resilient-energy-infrastructure-critical-facilities-report-march
Irene, Connecticut, New York, and New Jersey adopted CHP incentives.32 And earlier, in response to devastating storms in the Gulf region, Texas and Louisiana adopted laws requiring critical government buildings to undertake feasibility studies for implementing CHP.33
3. State and Local Implementation Experiences
A review of US Energy Information Administration data for steam turbines at electric utility and independent power producer facilities indicates that in 2012 there were 121 EGUs at 81 facilities that were classified as topping-cycle steam CHPs. The nameplate capacity ratings for these EGUs ranged from 5 to 750 MW.
CHP installations across all sectors are regionally concentrated, as depicted in Figure 2-5, underscoring differences in electricity prices, policy environments, and industrial and manufacturing activities that are chief factors in CHP development. Large-scale petrochemical plants and refineries dominate in the Gulf Coast, where some of the country’s largest cogeneration facilities are located. Biomass-fired cogeneration in the pulp and paper industry dominate in the Southeast and in Maine. In contrast, in states like California, New York, Massachusetts, Connecticut, and Rhode Island, CHP has been driven by a combination of high electricity prices and government initiatives. Proximity to buildings that have a high demand for thermal energy can also be a driver for CHP, especially in large northern cities where district heating and cooling is viable. State and local experiences with large-scale CHP facilities similarly demonstrate the local circumstances that create economic and partnership opportunities and lead to successful project development.

Implementing EPA’s Clean Power Plan: A Menu of Options
2-10
Although most large CHP plants are owned by third-party independent power producers or industrial facilities themselves, a common lesson from state and local experience is that utility involvement can be critical to project development. Customer-side generation signifies a decline in retail energy sales and has therefore traditionally presented a challenge to the utility business model. Utilities are in a unique position, however, to address many of the barriers facing CHP and take a leadership role in developing partnerships and designing projects to maximize benefits to both the customer and the electric system.
With a strong understanding of the electric delivery system, utilities can help identify where CHP projects would most effectively relieve grid congestion and reliability deficits. Owning and operating an EGU onsite may not be a feasible step for facilities that might benefit from the electrical and thermal output of CHP. However, utilities with the requisite technical expertise could help address those knowledge gaps. If the regulatory environment allows, a utility may own and operate the assets directly, or negotiate a package of services to provide support to the CHP owner. Another role for utilities is in
Alabama
ArizonaArkansas
Colorado
Delaware*
Georgia
Idaho
Illinois Indiana
Iowa
Kansas
Kentucky
Louisiana
Maine
Maryland
Minnesota
Mississippi
Missouri
Montana
NebraskaNevada
NH
MA
New Jersey
Washington DC
New Mexico
New York
North Carolina
NorthDakota
Oklahoma
Oregon
Rhode Island
SouthCarolina
SouthDakota
Tennessee
Utah
VT
CT
Virginia
Washington
WestVirginia
Wyoming
California
Florida
Michigan
Ohio
Pennsylvania
Texas
Wisconsin
< 100 MW
100-399 MW
400-999 MW
1,000-1,999 MW
> 2,000 MW
Figure 2-5
Existing CHP Capacity by State (2012)34
34 ICF International for American Gas Association, at supra footnote 17.
35 Ibid.
36 Chittum, A. (2013, July). How Electric Utilities Can Find Value in CHP. ACEEE. Available at: http://aceee.org/files/pdf/white-paper/chp-and-electric-utilities.pdf
project finance, where utilities typically have a lower cost of capital and are able to tolerate longer investment periods.
That utility ownership accounts for only three percent of CHP capacity may indicate a large untapped opportunity for utilities to capitalize on their unique position in this market.35 A growing number of policymakers are exploring ways to enable utility participation in the CHP market as a means of addressing persistent administrative and financial barriers, and this may be a focus of regulatory efforts moving forward. Both a 2013 State and Local Energy Efficiency Action Network (SEE Action) study and a 2013 report from the American Council for an Energy-Efficient Economy (ACEEE) highlight possible considerations for utility participation in CHP markets; see these reports for more detail.36

2. Implement Combined Heat and Power in the Electric Sector
2-11
37 Database of State Incentives for Renewables & Efficiency. Available at: http://www.dsireusa.org/. US EPA. (2014, August). CHP Policies and Incentives Database. Available at: http://epa.gov/chp/policies/database.html. Along with other examples discussed peripherally, the policy and implementation experiences of the state of Massachusetts are provided in detail in Chapter 3.
38 ICF International for US DOE and Oak Ridge National Laboratory. (2014). CHP Installation Database: Alabama. Available at: http://www.eea-inc.com/chpdata/States/AL.html
39 US DOE, EPA, & SEE Action Network. (2013, March). The Guide to Successful Implementation of State Combined Heat and Power Policies. Available at: https://www4.eere.energy.gov/
Some specific trends and examples, highlighting utility-owned CHP, are discussed below. Additional case studies can be found online at the Database of State Incentives for Renewables and Efficiency and at the EPA’s database of policies and incentives in support of CHP.37
The Alabama Power Company Alabama Power, a subsidiary of Southern Company,
exemplifies a model in which a vertically integrated utility both owns CHP units directly and coordinates customer ownership. Costs of utility-owned CHP and of power purchase agreements for customer-generated electricity are part of the company’s rate base.
Alabama Power has approximately 2000 MW of CHP on its system, of which roughly 1500 MW is owned by customers. The remaining utility-owned CHP is composed of four large units located at industrial sites, including:
• 97 MW combined-cycle cogeneration plant located at Sabic Plastics in Burkville;
• 102 MW combined-cycle Washington County Cogeneration plant located at Olin Chemicals in McIntosh;
• 130 MW coal-biomass Gadsden Cogeneration plant located at Goodyear Tires and Rubber company; and
• 250 MW combined-cycle cogeneration plant located at the Phenolchemie facility in Theodore.38
Many of Alabama Power’s CHP units were developed in response to the need to expand generating capacity to meet load obligations during the 1990s. Both utility-owned and customer-owned generation facilities were certified by the Alabama Public Service Commission through a flexible regulatory process, which allows non-steam aspects of the CHP facilities to be included in the utility’s rate base. Alabama Power estimates that customer-owned generation
has allowed it to avoid building 1.7 GW of central station capacity.39
Great River Energy In the Midwest, Great River Energy (GRE) has taken a
joint venture/subsidiary approach to address the financing and partnership challenges associated with integrated thermal-power applications in the biochemical sector. GRE is a member-owned transmission and generation non-profit serving distribution cooperatives in Minnesota and Wisconsin. It has two CHP facilities among its generation assets. The first, at Coal Creek Station in Underwood, North Dakota, was a retrofit to an 1100-MW mine mouth lignite-fired plant originally built in 1979-1980.40 Although the retrofit itself required minimal modifications, GRE partnered with Headwaters Inc. to build a new ethanol plant at the site. Blue Flint Ethanol came online in 2007 with an annual capacity of 50 million gallons. Access to low-priced steam energy through a long-term contract, in addition to the roughly $5 million in avoided capital expenditure for the boiler and associated compliance requirements, gave the ethanol plant a competitive advantage over other, typically gas-fired, bio-refineries.41
GRE’s second CHP facility is a new build. Spiritwood Station near Jamestown, North Dakota is the product of a partnership with Cargill Malt. In 2005, GRE was managing growth in electric demand of five percent per year and looking for sites to add new generation. Simultaneously, Cargill Malt was considering options to expand processing capacity and reduce energy costs at its plant in Spiritwood, a facility that dates back to the 1970s. Discussions led to siting a 99-MW lignite-fired power plant adjacent to the Cargill Malt plant. Originally designed to meet the needs of two users of thermal energy, plans stalled in 2008
seeaction/publication/guide-successful-implementation-state-combined-heat-and-power-policies
40 GRE. (2014, August). About Coal Creek Station. Available at: http://www.greatriverenergy.com/makingelectricity/coal/coalcreekstation.html
41 This was true despite additional costs associated with transporting corn feedstock to the refinery, which were expected at the time of construction from 2005 to 2007 when Coal Creek was located on the margins of corn growing regions (corn agriculture has expanded in years since). GRE. (2014, August 15). Telephone conversation with Sandra Broekema, Business Development Manager.
Implementing EPA’s Clean Power Plan: A Menu of Options
2-12
when financing for the second user withdrew during the economic recession. GRE invested itself in the second user, Dakota Spirit AgEnergy, a conventional dry mill ethanol refinery, through its majority-owned Midwest AgEnergy Group.42 The new facility, a 65-million gallon plant, is scheduled to come online in April 2015. The use of CHP steam has allowed the ethanol plant to meet the EPA’s Renewable Fuel Standard 2, one of the first ethanol plants in the country to be approved under the lifecycle GHG performance standards added in 2007, which require a 20-percent reduction in emissions below a gasoline baseline.43 Even with the ethanol plant, Spiritwood Station will have excess steam energy. Fully subscribed, the system is designed to achieve more than 65-percent efficiency.44
Other Utility-Ethanol PartnershipsThe ethanol industry has many other instances of
joint utility-customer CHP ownership. Two examples of municipal utility partnerships come from Missouri and are considered here. The City of Macon shares joint ownership of a gas-turbine CHP system with Northeast Missouri Grain, LLC, which runs an ethanol plant powered by steam from the CHP unit. This experience served as a model for another joint venture in Laddonia, Missouri. There, a partnership between the Missouri Joint Municipal Electric Utility Commission and Missouri Ethanol resulted in a 14.4-MW gas turbine system launched in 2006, which delivers 5 MW of power and 100,000 lb/h of steam to the adjacent 45-million gallon/year ethanol plant. In both examples, the utilities own and manage the gas turbine, while the ethanol companies have responsibility for the waste heat recovery unit and downstream steam system.45
4. GHG Emissions Reductions
Thermal recovery at an existing power plant reduces electrical output, but it improves energy utilization system-wide, thereby reducing fuel use and associated GHG emissions. Total GHG emissions from a CHP system can be roughly half the emissions that would occur from separate heat and power operations, as shown in Figure 2-1.
Output-based emissions factors are calculated using the measured emissions (in pounds of CO2) and the productive output (whether MWh of electricity or MMBTU of steam) of the equipment under consideration. The two outputs of a CHP plant, electricity and thermal energy, are typically measured in different units (MWh and MMBTU). To express a plant’s overall emissions factor and properly recognize the emissions benefits of CHP, the two outputs need to be converted into a single unit. A 2013 EPA guidance document on “Accounting for CHP in Output-Based Regulations” provides two approaches for incorporating a secondary output into emissions rate calculations.46
Equivalence MethodUnder the equivalence approach, thermal output
is converted to equivalent electrical units (e.g., 3.412 MMBTU/MWh) and added to the electric output to determine the total system output. The emissions of the CHP system are then divided by the total output to determine an emissions rate in terms of lb/MWh.
The equivalence method is used, for example, by the state of Texas in its Permit by Rule and Standard Permit regulations, and in California in its conventional emissions limits and emissions performance standards for CHP.47
42 Midwest Energy News. (2014, May 13). Prospects Turning Around for Embattled Spiritwood Coal Plant. Available at: http://www.midwestenergynews.com/2014/05/13/prospects-turning-around-for-embattled-spiritwood-coal-plant/
43 US EPA Office of Air and Radiation. (2013, February 6). RFS2 Petition From and Letter of Approval to Dakota Spirit AgEnergy.
44 GRE. (2014, August). About Spiritwood Station. Available at: http://www.greatriverenergy.com/makingelectricity/newprojects/spiritwoodstation.html
45 Bronson, T., Crossman, K., & Hedman, B. (2007, 2nd Quarter). Utility-Ethanol Partnerships: Emerging Trend in District Energy/CHP. International District Energy Association. Available at: http://www.epa.gov/chp/documents/district_energy_article.pdf
46 US EPA CHP Partnership. (2013, February). Accounting for CHP in Output-Based Regulations. Available at: http://www.epa.gov/chp/documents/accounting.pdf
47 Ibid.
2. Implement Combined Heat and Power in the Electric Sector
2-13
In some instances, regulations may specify a certain percentage of credit to be allotted. The NSPS for utility boilers originally issued in 1998 stipulated the equivalence method, but originally applied a 50-percent credit48 — later amended to 75 percent in 2006 — such that only that portion of the thermal output would be factored into the total system output. Note the value of the conversion factor depends on the underlying regulatory objectives. States like California, Texas, and Massachusetts ascribe a 100-percent credit for thermal output as a way to encourage CHP.
The proposed 111(b) and 111(d) rules for electric power sector GHG emissions use the equivalence method to award CHP systems with a MWh credit equivalent to 75 percent of the useful thermal output. The EPA provides an example of this accounting approach in correspondence with the Office of Management and Budget,49 based on the following hypothetical plant specifications:
• 100 MW electric output; • 500 MMBTU/h of useful steam output; and • 200,000 lb CO2/h measured emissions rate. The thermal output rate of 500 MMBTU/h would
be converted to an equivalent MW of output (3.412 MMBTU/h = 1 MWh), whereby 500 MMBTU/h = 147 MW. The resultant value would be multiplied by 75 percent
48 Discussion of this point can be found in Section 5.2.5 of: US EPA. (1998, September). New Source Performance Standards, Subpart Da and Db – Summary of Public Comments and Response. Available at: http://www.epa.gov/ttn/oarpg/t1/reports/nox-fdoc.pdf
49 US EPA. (2013, August 2). Summary of Interagency Comments on US Environmental Protection Agency’s Notice of Proposed Rulemaking “Standards of Performance for Greenhouse Gas Emissions from New Stationary Sources: Electric Utility Generating Units” (RIN 2060-AQ91), EPA-HQ-OAR-2013-0495-0045. Available at: http://www.eenews.net/assets/2014/02/04/document_daily_02.pdf
to get a value of 110 MW, which would be added to the electric output to calculate the facility’s emissions rate. For comparison against the applicable emissions standard — whether the 1000 lb CO2/MWh or 1100 lb CO2/MWh standard — the facility emissions rate would be (200,000 lb CO2/h) / (100 MW + 110 MW) or 950 lb CO2/MWh.
The EPA’s proposed 111(b) and 111(d) rules would further reward CHP by applying an additional five-percent line loss credit to the net electric output to capture the transmission and distribution losses that are avoided through onsite power generation. The line loss credit would apply to CHP facilities where useful thermal output and electric output (or direct mechanical output) both account for at least 20 percent of total gross output.
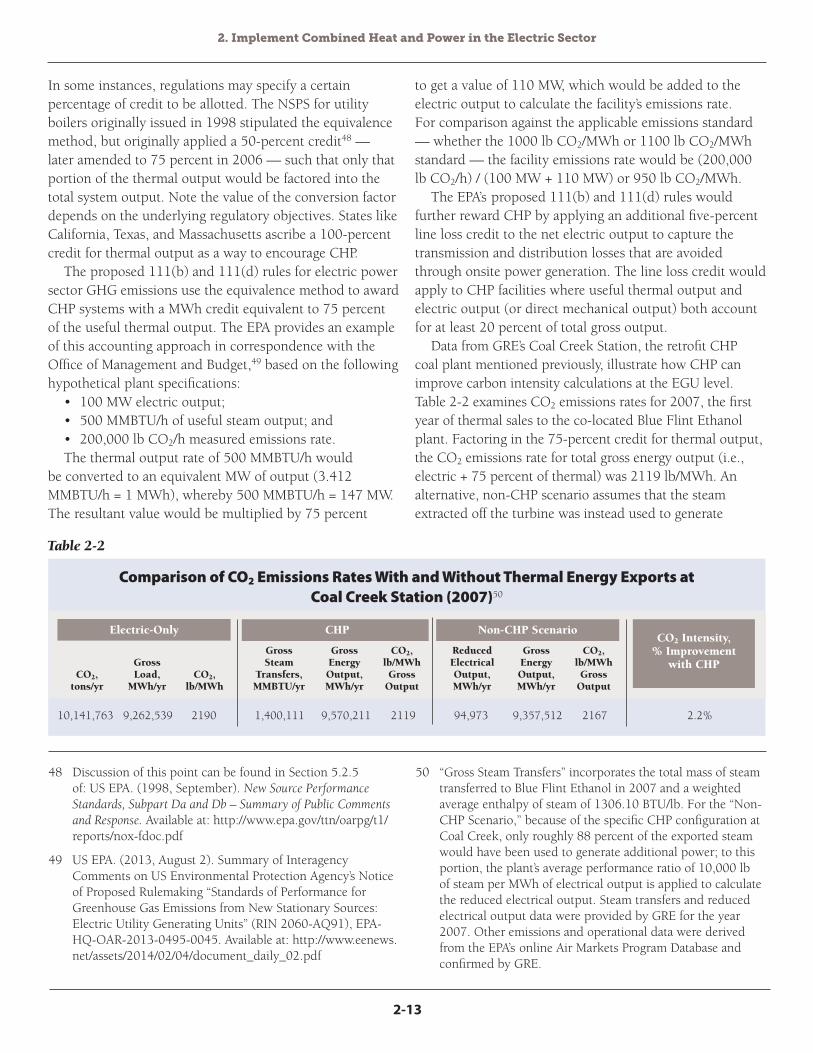
Data from GRE’s Coal Creek Station, the retrofit CHP coal plant mentioned previously, illustrate how CHP can improve carbon intensity calculations at the EGU level. Table 2-2 examines CO2 emissions rates for 2007, the first year of thermal sales to the co-located Blue Flint Ethanol plant. Factoring in the 75-percent credit for thermal output, the CO2 emissions rate for total gross energy output (i.e., electric + 75 percent of thermal) was 2119 lb/MWh. An alternative, non-CHP scenario assumes that the steam extracted off the turbine was instead used to generate
50 “Gross Steam Transfers” incorporates the total mass of steam transferred to Blue Flint Ethanol in 2007 and a weighted average enthalpy of steam of 1306.10 BTU/lb. For the “Non-CHP Scenario,” because of the specific CHP configuration at Coal Creek, only roughly 88 percent of the exported steam would have been used to generate additional power; to this portion, the plant’s average performance ratio of 10,000 lb of steam per MWh of electrical output is applied to calculate the reduced electrical output. Steam transfers and reduced electrical output data were provided by GRE for the year 2007. Other emissions and operational data were derived from the EPA’s online Air Markets Program Database and confirmed by GRE.
Table 2-2
Comparison of CO2 Emissions Rates With and Without Thermal Energy Exports at Coal Creek Station (2007)50
Electric-Only CHPCO2 Intensity,
% Improvement with CHP
Non-CHP Scenario
CO2, tons/yr
Gross Steam
Transfers, MMBTU/yr
Reduced Electrical Output, MWh/yr
Gross Load,
MWh/yr
Gross Energy Output, MWh/yr
Gross Energy Output, MWh/yr
CO2, lb/MWh
CO2, lb/MWh Gross
Output
CO2, lb/MWh Gross
Output
10,141,763 9,262,539 2190 1,400,111 9,570,211 2119 94,973 9,357,512 2167 2.2%
Implementing EPA’s Clean Power Plan: A Menu of Options
2-14
additional electricity at a rate of 1 MWh of electrical output per 10,000 lb of steam. Under this scenario, the plant would have had an emissions rate of 2167 lb/MWh. In this way, the export of thermal energy at Coal Creek Station resulted in a 2.2-percent improvement in the facility’s CO2 emissions rate in 2007. Because exported steam at Coal Creek amounted to less than 20 percent of gross energy output in 2007, the five-percent line loss credit would not apply.
The amount of energy output calculated by the equivalence method varies significantly depending on the power-to-heat ratio of a CHP unit. The power-to-heat ratio is an important factor with regard to CHP system efficiency. Owing to the low conversion efficiency of electric generation (e.g., an average 33 percent for coal-fired steam turbines), CHP units that produce proportionally more electricity relative to thermal energy (i.e., units with a high power-to-heat ratio) will have a lower total useful output, and therefore a higher emissions factor. As a result, the more thermal output from a system, the lower that system’s CO2 emissions factor would be.
On the one hand, the equivalence method recognizes thermal output, but the effect of this accounting method is largely a function of the relative amounts of thermal and electric energy produced by the CHP system. The method does not reflect the actual environmental benefit provided by CHP in displacing conventional emitting thermal units.
Avoided Emissions ApproachAlternatively, the avoided emissions approach compares
the emissions of the CHP system with the emissions that would have been produced had the thermal energy been generated separately in a conventional boiler.51 Under this approach, the output-based emissions rate for a CHP system is expressed in terms of its electrical output. This approach assumes the CHP system displaces emissions that would have otherwise occurred in the separate production of electricity and useful thermal output. The net emissions are then divided by the unit’s electrical output to determine the emissions rate in terms of lb/MWh. The calculation
incorporates only the system’s electrical output. Regulations would specify default assumptions; avoided thermal emissions, for example, may be based on the performance of a new source, such as a natural gas-fired boiler with 80-percent efficiency and a standard emissions rate of 0.05 lb per MMBTU of heat input. The avoided emissions approach is particularly relevant to CHP systems at industrial, commercial, and institutional facilities and thus is explained in greater detail in Chapter 3.
Delaware and Rhode Island have used the avoided emissions method in conventional emissions limits for CHP; Connecticut and Massachusetts also use this approach in accounting for small distributed generation.52 There is general consensus that the avoided emissions approach more closely approximates the environmental attributes of a CHP application, although the equivalence approach is often preferred for its simplicity.
5. Co-Benefits
CHP systems within the electric power sector can deliver a wide range of benefits to the utility system and to society. To begin with, although the earlier discussion focused on the GHG emissions reductions that can be achieved through CHP, similar reductions in criteria and hazardous air pollutant emissions are possible. The methods for quantifying those reductions are essentially the same as the methods used to calculate GHG reductions, with the avoided emissions approach offering a more accurate picture of the impacts.
In addition to reduced pollution, CHP provides broader societal benefits. For instance, installations can be configured with micro-grids to support critical infrastructure and enhance resiliency for emergency response and preparedness. By improving competitiveness, CHP can play a role in strengthening the US manufacturing sector. Furthermore, investment in the energy sector can also be expected to stimulate demand for skilled jobs.53 A DOE study found that achieving the national goal of
51 The Regulatory Assistance Project. (2003). Output Based Emissions Standards for Distributed Generation. Available at: http://www.raponline.org/docs/RAP_IssuesLetter-OutputBasedEmissions_2003_07.pdf
52 Supra footnote 47. Other examples can be found in Appendix B of the EPA’s 2003 handbook for air regulators on output-based regulations. US EPA. (2004). Output-Based Regulations: A Handbook for Air Regulators. CHP Partnership.
53 A 2008 Oak Ridge National Laboratory study found a CHP goal of 20 percent of generation capacity would stimulate $234 billion in capital investment and create nearly one million new jobs by 2030. Shipley, A., Hampson, A., Hedman, B., Garland, P., & Bautista, P. (2008, December 1). Combined Heat and Power: Effective Energy Solutions for a Sustainable Future. ORNL for US DOE. Available at: http://www.energy.gov/sites/prod/files/2013/11/f4/chp_report_12-08.pdf

2. Implement Combined Heat and Power in the Electric Sector
2-15
developing 40 GW of additional CHP would save one quadrillion BTUs of energy annually, prevent 150 million metric tons of CO2 emissions annually, and save $10 billion per year in energy costs, while attracting $40 to $80 billion in new capital investment in manufacturing and other US facilities over the next decade.54
From the perspective of utilities, CHP avoids significant line losses, allows deferral of costly investments in new transmission and distribution infrastructure, and represents low-cost capacity additions, all of which can in turn translate into lower bills for rate-payers. The full range of
54 US DOE & US EPA. (2012, August). Combined Heat and Power: A Clean Energy Solution. http://www.epa.gov/chp/documents/clean_energy_solution.pdf
55 Those projects would result in reductions of 100 million metric tons of CO2 across the country annually through 2020. Updating that analysis to incorporate today’s natural gas prices would likely improve those estimates substantially. McKinsey & Company, at supra footnote 4.
56 Technical potential as defined in the ICF analysis accounts for sites that have concurrent thermal and electric demands suitable to CHP, but does not consider economic factors relevant to project investment decisions, nor does it include existing EGUs.
57 Economic viability was screened by incorporating energy prices (excluding other economic incentives). ICF International for American Gas Association, at supra footnote 17.
Type of Co-Benefit
Benefits to SocietyNon-GHG Air Quality Impacts Nitrogen Oxides Sulfur Dioxide Particulate Matter Mercury OtherWater Quantity and Quality Impacts Coal Ash Ponds and Coal Combustion Residuals Employment Impacts Economic Development Other Economic Considerations Societal Risk and Energy Security Reduction of Effects of Termination of Service Avoidance of Uncollectible Bills for Utilities
Benefits to the Utility System Avoided Production Capacity Costs Avoided Production Energy Costs Avoided Costs of Existing Environmental Regulations Avoided Costs of Future Environmental Regulations Avoided Transmission Capacity Costs Avoided Distribution Capacity Costs Avoided Line Losses Avoided Reserves Avoided Risk Increased ReliabilityDisplacement of Renewable Resource Obligation Reduced Credit and Collection Costs Demand Response-Induced Price EffectOther
Provided by This Policy or Technology?
YesYesYesYesYesYesYesYes YesYesYesYesNoNo
YesYesYesYesYesYesYesYesYesYes
MaybeNoYes
Table 2-3
Types of Co-Benefits Potentially Associated With Combined Heat and Power
in the Electric Sector
potential co-benefits for society and the utility system are summarized in Table 2-3.
When a utility customer receives the thermal output from a utility-owned CHP system, the customer may enjoy additional benefits not shown in Table 2-3. From the perspective of these customers, CHP can improve competitiveness by reducing energy costs. Using thermal energy from an adjacent CHP facility can result in avoided capital expenditure and may help mitigate the customer’s own environmental compliance costs. Another motivating factor for participants is greater supply reliability, because CHP can reduce risks posed by grid disruptions. Many of these co-benefits have been alluded to earlier and are further discussed in Chapter 3.
6. Costs and Cost-Effectiveness
CHP is generally regarded as one of the most cost-effective ways to reduce CO2 emissions economy-wide, a finding confirmed by numerous studies in recent years. A 2009 report by McKinsey & Company, for example, found that 50 GW of CHP in industrial and large commercial/institutional applications would yield positive net-present values over the lifetime of the investment.55 Economic potential of the same order of magnitude was found by a more recent ICF study, which concluded that 42 GW of CHP technical potential56 (across all sectors, not just the electric power sector) had an investment payback period of less than ten years across the United States.57
New CHP installations can be particularly cost-effective, whereas retrofitting existing EGUs to a CHP configuration
Implementing EPA’s Clean Power Plan: A Menu of Options
2-16
can be cost-effective in the right circumstances. Capital costs for new boiler/steam and gas turbine CHP units vary significantly based on size, fuel type, fuel accessibility, geographic area, operational specifications, and market conditions, among other factors.58 Using 2013 dollars, the EPA estimates that for simple installations, new gas turbine CHP costs typically range from $1200/kW to $3300/kW (4 to 50 MW), and new steam turbine CHP units may range anywhere from $670/kW to $1100/kW, with complete plant costs typically greater than $5000/kW. Retrofit costs for boiler/steam and gas turbine CHP units are even more highly dependent on site-specific configuration requirements. This makes it difficult to generalize about costs and cost-effectiveness.
One of the factors that strongly influences the cost-effectiveness of CHP systems is the price of fuel. Increased domestic natural gas production has radically altered the market outlook for gas, reducing prices and volatility.59 Most forecasts anticipate an increase in electricity prices against continuously low natural gas prices, improving the economic viability of gas-powered demand-side generation. Clean burning gas, already the preferred fuel for CHP applications, will likely enable future growth and greater investment in CHP.
The underlying economics of retrofit opportunities will weigh the capital cost of modifications to the plant against the tradeoffs between reduced power capacity on the one hand and steam energy output on the other. Factors including fuel costs, operating hours, wholesale power prices, the terms of steam contracts, and investment and management arrangements at the facility, would all bear strongly on this financial analysis. Therefore, although retrofitting CHP as a means of improving emissions performance is theoretically an option for EGUs facing compliance with GHG regulations, in practice, whether
these factors amount to a favorable investment opportunity would likely be determined by unique circumstances. The EPA has done some evaluation of costs of retrofitting turbines into existing boiler/steam systems, but in the course of research for this chapter no studies were found to have surveyed retrofits at EGUs specifically.
Given the complexity of EGU retrofits, opportunities for developing utility-scale CHP as a source of new generating capacity may have greater relevance. A 2012 report by the DOE and the EPA included an analysis of delivered electricity costs in New Jersey.60 Figure 2-6 compares costs of power generated from small-, medium-, and large-sized CHP systems, with retail rates and the cost of delivered electricity from central power generators across a mix of resources. The light gray block at the top of the CHP bars denotes the thermal energy cost savings. Net costs of electricity from medium- and large-scale CHP are lower than retail rates in their respective customer classes, and are more competitive than the combined-cycle gas turbine, coal, wind, and photovoltaic when transmission and distribution costs are taken into account. Producing power for the grid, new CHP EGUs would retain associated transmission and distribution costs for offsite electric customers. Adding these costs back in, large CHP would still be roughly on par with the combined-cycle gas plant, and medium-sized CHP would continue to hold an advantage against wind and coal.
Whether through pay-back period, net-present value, levelized costs of energy, or return on investment metrics, there are numerous ways to evaluate cost-effectiveness. And there are various perspectives from which to evaluate it, whether from that of the participants, the gas utility, the electric utility, the ratepayer, or society generally. Additional analyses of the cost-effectiveness of CHP generally are summarized in Chapter 3.
58 See Table 3-4 of Chapter 3 for cost estimates across technology classes. Within the same fuel and configuration class, costs display a clear scale effect, with costs per kW of capacity generally decreasing as size increases. Also, the amount of steam extracted for thermal purposes, and thus not available for electricity generation, significantly affects the costs (in $/kW) of electricity output. US EPA. (2014, September). Catalog of CHP Technologies. Available at: http://www.epa.gov/chp/documents/catalog_chptech_full.pdf
59 Known as a “spark spread,” this favorable ratio of gas prices to electricity prices provides increased motivation to CHP producers.
60 Supra footnote 54.

2. Implement Combined Heat and Power in the Electric Sector
2-17
output to different customer classes. Finally, the risk of stranded assets will also be a significant concern for utility regulators, who must concern themselves with the possibility that a customer who is expected to purchase the thermal output from a long-lived, expensive CHP system, will in the future no longer need the thermal output, or be able to pay for it. Without a customer for the thermal load, the CHP system might someday be uneconomical, but utility customers will still be expected to pay for it. This is what utility regulators call a “stranded asset.”
Figure 2-6
CHP Can Be a Cost-Effective Source of New Generation Capacity61
Cost of Delivered Electricity — New Jersey
9
0
Small CHP
Medium C
HP
Large C
HP
Large U
ser
Retail R
ate
Medium U
ser
Retail R
ate PVW
ind
Pulveriz
ed C
oal
Natura
l Gas
Combined C
ycle
18
20
16
14
12
10
8
6
4
2
Cos
t to
Gen
erat
e P
ower
(ce
nts
/kW
h d
eliv
ered
)
Thermal Credit T&D Fuel O&M Capital
7. Other Considerations
Utility ownership of CHP assets can pose interesting challenges for utility regulators. One issue that often arises is the challenge of deciding how much of the system costs should be paid by electric utility customers in general (and recovered in utility rates) versus how much should be paid by the customer(s) using the CHP system’s thermal output. There may also be questions about how to allocate system costs and any revenues from the sale of thermal
61 Supra footnote 54. Costs of delivered electricity across resource classes and retail rates show that CHP can provide cost-effective generation capacity additions. Note that the light gray block at the top of the CHP bars denotes the thermal energy costs savings. Assumptions: capital and operations and maintenance costs for coal, natural gas combined-cycle, wind, and photovoltaics, and annual capacity factors for wind and photovoltaics based on EIA AEO 2011; annual capacity factors for coal and natural gas
combined-cycle based on 2009 national averages (64 and 42 percent, respectively); utility coal and natural gas prices $4.40/MMBTU and $5.50/MMBTU, respectively, CHP based on 100-kW engine system and $7.50/MMBTU natural gas (small CHP), 1-MW engine system and $6.25 natural gas (medium CHP), 25-MW gas turbine and $6.25 natural gas (large CHP); cost of capital 12 percent for CHP and 8 percent for central station systems.

Implementing EPA’s Clean Power Plan: A Menu of Options
2-18
8. For More Information
Interested readers may wish to consult the following reference documents for more information on CHP in the electric sector.• ACEEE. Technical Assistance Toolkit, Policies and Resources
for CHP Deployment. Available at: http://aceee.org/sector/state-policy/toolkit/chp
• ICF International for the American Gas Association. (2013, May). The Opportunity for CHP in the United States. Available at: http://www.aga.org/Kc/analyses-and-statistics/studies/efficiency_and_environment/Pages/TheOpportunityforCHPintheUnitedStates.aspx
• NASEO. (2013). Combined Heat and Power: A Resource Guide for State Energy Officials. Available at: http://www.naseo.org/data/sites/1/documents/publications/CHP-for-State-Energy-Officials.pdf
• SEE Action Network. (2013, March). The Guide to Successful Implementation of State Combined Heat and Power Policies. US DOE and US EPA. Available at: https://www4.eere.energy.gov/seeaction/publication/guide-successful-implementation-state-combined-heat-and-power-policies
• US DOE. CHP Technical Assistance Partnerships website: http://www1.eere.energy.gov/manufacturing/distributedenergy/chptaps.html
• US DOE and Oak Ridge National Laboratory. (2012). Guidance for Calculating Emission Credits Resulting From Implementation of Energy Conservation Measures. Available at: http://info.ornl.gov/sites/publications/Files/Pub37258.pdf
• US DOE and Oak Ridge National Laboratory. (2008, December). Combined Heat and Power: Effective Energy Solutions for a Sustainable Future. Available at: http://www.energy.gov/sites/prod/files/2013/11/f4/chp_report_12-08.pdf
• US EPA. (2014, July 30). CHP Emissions Calculator. Available at: http://www.epa.gov/chp/basic/calculator.html
• US EPA. (2014, July 30). AVERT. Available at: http://epa.gov/avert/
• US EPA. (2013, February). Accounting for CHP in Output-Based Regulations. Available at: http://www.epa.gov/chp/documents/accounting.pdf
• US EPA. (2012, August). Fuel and Carbon Dioxide Emissions Savings Calculation Methodology for Combined Heat and Power Systems. Available at: http://www.epa.gov/chp/documents/fuel_and_co2_savings.pdf
• US EPA. (2014). Output-Based Regulations: A Handbook for Air Regulators. Available at: http://www.epa.gov/chp/documents/obr_handbook.pdf
• US EPA CHP Partnership website: http://www.epa.gov/chp/
• US EPA CHP Partnership. (2015, March). Catalog of CHP Technologies. Available at: http://www.epa.gov/chp/documents/catalog_chptech_full.pdf
9. Summary
CHP provides a cost-effective, commercially available solution for near-term reductions in GHG emissions, with large technical potential distributed across the country. CHP results in direct energy savings to the user, and offers a host of wider societal benefits, including reductions in air pollution, enhanced grid reliability, low-cost capacity additions, and improved resiliency of critical infrastructure. Retrofit opportunities at existing EGUs will be limited, however, by site-specific factors. Such factors include the geographic proximity to suitable users of thermal energy, and the need to incorporate enough thermal recovery to bring the unit into compliance, while balancing the tradeoff between reduced power production on steam turbines and thermal energy sales. Assessments of CHP feasibility could be undertaken by plant management as they review options for improving heat rate performance, such as those outlined in Chapter 1. As for new construction, larger-scale CHP facilities that integrate the operations of generators with industrial partners offer a cost-competitive alternative to central power production and cost-effective replacement capacity for aging plants poised for retirement. CHP projects are often complex, custom installations with equally complex legal and financial arrangements between partnering entities. Therefore, despite the technology being mature, substantial administrative burdens persist and keep rates of adoption low even in jurisdictions with favorable regulatory environments. Supportive policies and regulations will be required to take full advantage of CHP opportunities, whether as stipulated in the EPA’s final 111(b) and 111(d) rules or otherwise in plans and accounting requirements developed by states.