2 literature review - the max planck institute for demographic
TRANSCRIPT

2
Literature Review
2.1 Introduction
This literature review is divided into two major parts. First, a causal chainis constructed which outlines how a change in temperature triggers certainbiomedical reactions in the body, which may lead to morbidity and ultimatelyto mortality, and how social factors can mediate this impact. Secondly, anoverview of the development of seasonal mortality over time is given. It startswith studies on Roman Egypt, and presents results from the 16th to the 19th
century, based on family reconstitution data. Results are shown from the firststudies based on census data in the middle of the 19th century and, finally,points at recent development in Western countries. The Appendix startingon page 177 gives a sketch on how the literature review has been conductedmethodologically.
2.2 Causal Chain
2.2.1 Introduction
The influence of the seasons on human mortality has been known since Hip-pocrates’ seminal essay “On Airs, Waters, and Places” written more than2000 years ago. Surprisingly, misconceptions are still commonplace. For ex-ample, in the summer of 2003, excess mortality from heat was heavily coveredin the media. While the number of cold-related deaths typically receives lessattention, although the latter far outnumbers the former in many countriesin almost every year. It has been noted, for instance, that in Great Britain40,000 cold-related deaths occur annually [16]. Also noteworthy is the oftenpredicted risk of an increase of heat-related mortality due to global warm-ing during the following decades is unlikely. “Populations in Europe [. . . ] canbe expected to adjust to global warming predicted for the next half centurywith little sustained increase in heat related mortality.” [190, p. 670]. On the

6 2 Literature Review
contrary, the number of excess deaths can even be expected to shrink. In thewords of Keatinge et al: “Our data suggest that any increases in mortality dueto increased temperatures would be outweighted by much larger short termdeclines in cold related mortalities” [190, p. 672].
Besides the timing of deaths, mistaken ideas also prevail about the causesof deaths. It is a widespread belief in the general public that deaths peakin winter because of the high suicide rate. This assumption is wrong for tworeasons: suicides only make a small contribution to the overall death pattern:between one and two percent of all deaths are attributable to that cause.1
This contribution is not enough to cause the observed differences between theseasons. Secondly, Durkheim’s well-known studies in the 19th century showthat suicides do not peak (late) in winter but in late spring and early summer.Another cause of death often put forward to explain seasonal mortality aredeaths from influenza. This might have been true for long periods of time.2
In Western countries in recent decades, however, the influence of influenzaon cold-related mortality is highly overestimated. Donaldson and Keatingecalculated that only 2.4% of all excess winter deaths during the last 10 yearswere directly or indirectly due to influenza [78].
This section should therefore outline which causes of deaths are responsiblefor the observed pattern, which biomedical reactions are happening in thebody and what we do know so far to fight the annual cold-related death toll.
2.2.2 A Simple Chain of Causality for Seasonal Mortality:Biomedical Factors
A relatively naive approach would assume a very short chain of causality:the cold decreases the body temperature under a certain level below whichthe body ceases functioning and then dies of hypothermia. Only a very smallproportion of all cold-related deaths are induced by hypothermia, though. Inthe year 1998, more than 2.34 million people died in the US aged 50 yearsor older. Only in 316 cases the stated cause of death was hypothermia. Thismakes it an even less likely cause of death than dying of breast cancer formen.
A view which is a bit more elaborated takes only natural/biological forcesand their consequences into account. This causal chain, where climate (andmost notably cold temperatures) triggers a biomedical reaction in the bodywhich may lead to an elevated mortality risk and, ultimately, to death, is out-lined in Figure 2.1. Although the detrimental influence of cold on the body isknown for ages, the actual underlying mechanism is not yet fully understood.As pointed out by Bull and Morton: “The studies to this point have not estab-lished a clear chain of events leading from a change in external temperature to1 All results are based on own calculations if no explicit reference is given.2 See, for example, Vaupel et al. (1997) where the effect of the Spanish Flu in
various countries in the years 1918 and 1919 is easily visible on Lexis surfacemaps [388].

2.2 Causal Chain 7
death. Nevertheless, it remains very likely that changes in external tempera-tures cause changes in death rates especially in the elderly” [37, p. 223]. Morethan 20 years have passed since this assessment and many studies on seasonalmortality have been conducted in the meantime. Yet, James Mercer and Sig-urd Sparr come to the unsatisfying conclusion in their editorial to a specialissue of the “International Journal of Circumpolar Health” dedicated to un-derstanding excess winter mortality in the elderly: “The mechanisms by whichseemingly mild exposure to cold ambient conditions can increase the risk ofdeath does not seem to be much clearer today than when Bull & Morten wereinvestigating the problem in 1978” [258, p. 152].3 Thus, the exact mechanismcan not be described here, but only the current state of knowledge.�
�
�
�
�
�
�
�
�
�
�
�
Climate
Cold
Temperature
Biomedical
Reaction to
Climate
Blood Clotting,
Infections of the
Respiratory Tract,
etc.,
’Demographic’
Reaction to
Biomedical
Changes
Increased
Mortality Risk
⇒ ⇒
Fig. 2.1. A Simple Chain of Causality for Seasonality in Mortality
Many studies confirm the provocative judgement of Kunst et al. [209,p. 338]: “Man is a tropical animal”. Lowest mortality is usually recorded whenthe ambient temperature is between 18◦ and 20◦C. Despite dependencies onthe geographic location (“Europe”: 18◦C [98], Germany: 20◦C [220], South-east England 18◦C [77], Netherlands, nursing home patients: 15-19◦C [232],Barcelona, Spain: 21◦C [322], England and Wales [37]), the “optimal” temper-ature is also determined by humidity [322] and by the age of the people [57].The World Health Organization, for example, mentions that sedentary elderlyface lowest mortality risks if the temperature is 2–3◦C higher. If the tempera-ture drops below or rises above this optimal level, death becomes more likely.This increase in mortality is well-documented [e.g. 209]. The most thoroughinvestigation in this direction is the so-called “Eurowinter” study headed byWilliam Keatinge. Table 2.1 shows how mortality increases in percent for each1◦C fall from 18◦C. Mortality in this model is lowest at 18◦C, yet, there is still3 In this article, the name “Morten” (instead of Morton) has been misspelled in
the source document.

8 2 Literature Review
considerable variation concerning the proportional increase in mortality witha drop in temperature.The most moderate increase in mortality is observedin southern Finland where mortality rises 0.27% for each drop of 1◦C in tem-perature below 18◦C. The steepest increase is recorded in Athens (increasehigher than 2%). It should be mentioned, however, that this phenomenon cannot be applied universally. In Yekaterinburg, Russia, mortality increased onlyat temperatures below 0◦C [81], in Yakutsk (Russia), the world’s coldest city,mortality was completely independent in the temperature range of 10.2◦C to−48.2◦C [76, 185].
Table 2.1. Increase of Mortality by Fall in Temperature in Selected EuropeanRegions
Region Deaths per Percent Increase in106 Population Mortality for Each
(per day at 18◦C) 1◦C Fall from 18◦CNorth Finland 42.8 0.29South Finland 43.0 0.27Baden-Wurttemberg 31.0 0.60Netherlands 36.5 0.59London 40.3 1.37North Italy 34.3 0.51Athens 34.4 2.15Palermo — 1.54
Source: Eurowinter Study 1997 [98, p. 1343]
It has already been mentioned that the often associated causes of death,influenza and suicides, play only a negligible or no role at all for the increase inmortality late in winter. The causes of deaths which are of crucial importanceto explain the mortality peak in winter are cardiovascular, cerebrovascularand respiratory diseases. The latter group has the strongest seasonal patternamong all major groups of causes of death [102, 148, 319]. Aubenque et al., forexample, standardized mean annual mortality in France for the years 1968–72to an index of 100 [13]. All cause mortality varied between 120 (January) and87 (August) whereas deaths from respiratory diseases showed a peak of 172(January and February) and a trough of 51 in August. However, respiratorydiseases are not the leading cause of death in Western developed countries[e.g. 264]. Thus, they do not the largest share to the number of excess winterdeaths — despite their highly seasonal pattern. About half of the cold-relatedmortality can be attributed to ischaemic heart disease and cerebrovasculardiseases [82, 98, 376]. If all cardiovascular diseases are included, the share ofcirculatory diseases increases to about 2/3 of the whole cold-related mortalitybased on estimates for the Netherlands in the years 1979–1987/88 [208, 235].Consequently, research on seasonal mortality mainly focused on cardiovascu-lar, cerebrovascular and respiratory diseases. Deaths from circulatory diseases

2.2 Causal Chain 9
peak usually one or two days after the peak of a cold spell; respiratory deathsrise more slowly, peaking about ten days after the peak of cold period [37, 185].Section A.2.1 in the Appendix gives an overview which study analyzed whichdisease/cause of death.4
So far, the first and the last box in Figure 2.1 have been discussed, namelythe change in temperature and the elevated mortality risks for various causesof death. The following paragraphs explain the biomedical reactions in thebody caused by detrimental environmental conditions, resulting in a higherchance of dying from those aforementioned diseases. It is probably best todifferentiate between the triggering effects for cardio- and cerebrovascular dis-eases on the one hand and for respiratory diseases on the other hand.
If respiratory diseases lead to death during winter, two effects are usuallymentioned [eg. 97, 98, 169]: On the one hand, low temperatures facilitatethe survival of bacteria in droplets. On the other hand, cold has adverseeffects on the immune system’s resistance against respiratory infections. Asa result from breathing cold air, the risk for a pulmonary infection rises dueto bronchoconstriction [169]. “Bronchospasm precipitated by breathing coldair is now well recognised, and the finding of inflammatory cells in sputumafter breathing cold air has raised the possibility that cold air breathing mightinduce this by causing inflammatory changes in the airways” [97, p. 155].
Deaths due to circulatory diseases is a large group consisting of cardio-vascular diseases on the one hand and cerebrovascular diseases on the otherhand. Cold stress acts on the body in two ways: either on the blood vessels(“vasoconstriction” [e.g. 97, 169]) or on the composition of the blood (“haemo-concentration” [e.g. 76, 81, 98, 169, 187]). Several indicators which cause thesechanges in blood viscosity have been singled out: an increase in white bloodcells and red blood cells [97, 169, 188], hypertension [187, 199, 322, 340, 412],platelet [97, 188], plasma fibrinogen [16, 81, 97, 169, 199, 411], and plasmacholesterol [169, 188, 322, 340] — and especially high density lipoproteins[413].
2.2.3 A More Advanced Chain of Causality for SeasonalMortality: Social and Biological Factors
The causal model, so far, is still too simple. At this point it would be logicalpermitted to conclude: if cold temperatures determine excess winter deaths,then countries where a colder climate prevails have to face higher seasonalfluctuations in mortality. The opposite is true, though. Figure 2.2 shows ascatterplot based on results of the study by McKee [252]. Similar findings havebeen also described in [135] or [147]. On the x-axis, the minimum monthly
4 For sure, the literature mentioned there is not a complete bibliography on cause-specific seasonal mortality among adults in developed countries during recentdecades. It provides, nevertheless, a good starting point on cause-specific studieson winter excess deaths.
10 2 Literature Review
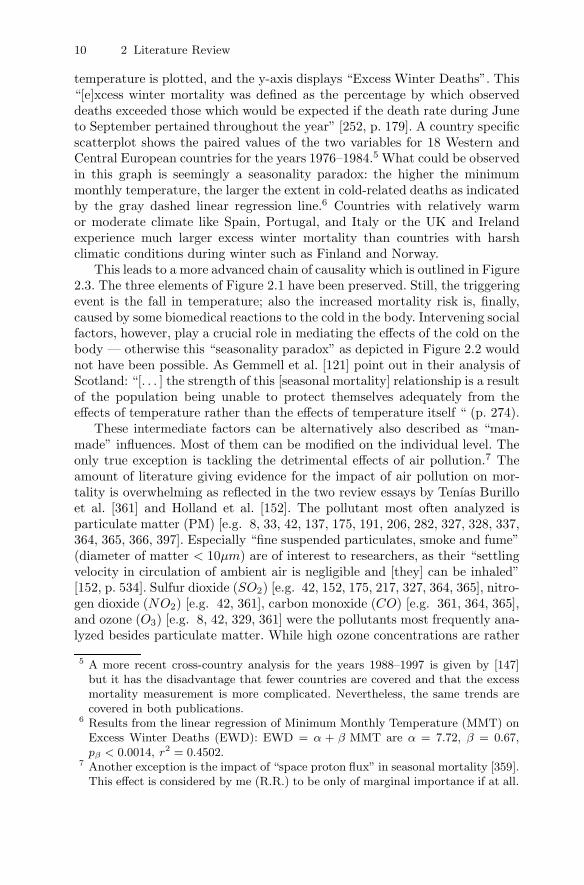
temperature is plotted, and the y-axis displays “Excess Winter Deaths”. This“[e]xcess winter mortality was defined as the percentage by which observeddeaths exceeded those which would be expected if the death rate during Juneto September pertained throughout the year” [252, p. 179]. A country specificscatterplot shows the paired values of the two variables for 18 Western andCentral European countries for the years 1976–1984.5 What could be observedin this graph is seemingly a seasonality paradox: the higher the minimummonthly temperature, the larger the extent in cold-related deaths as indicatedby the gray dashed linear regression line.6 Countries with relatively warmor moderate climate like Spain, Portugal, and Italy or the UK and Irelandexperience much larger excess winter mortality than countries with harshclimatic conditions during winter such as Finland and Norway.
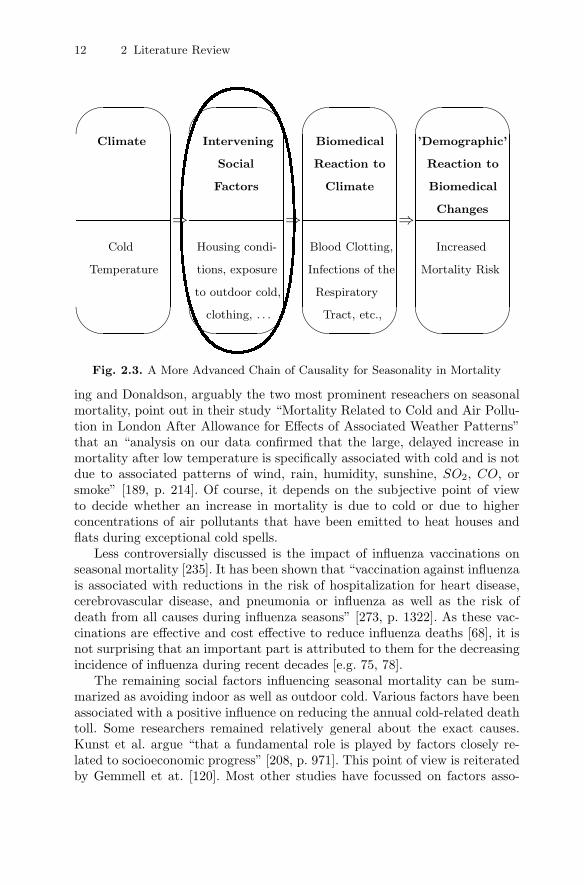
This leads to a more advanced chain of causality which is outlined in Figure2.3. The three elements of Figure 2.1 have been preserved. Still, the triggeringevent is the fall in temperature; also the increased mortality risk is, finally,caused by some biomedical reactions to the cold in the body. Intervening socialfactors, however, play a crucial role in mediating the effects of the cold on thebody — otherwise this “seasonality paradox” as depicted in Figure 2.2 wouldnot have been possible. As Gemmell et al. [121] point out in their analysis ofScotland: “[. . . ] the strength of this [seasonal mortality] relationship is a resultof the population being unable to protect themselves adequately from theeffects of temperature rather than the effects of temperature itself “ (p. 274).
These intermediate factors can be alternatively also described as “man-made” influences. Most of them can be modified on the individual level. Theonly true exception is tackling the detrimental effects of air pollution.7 Theamount of literature giving evidence for the impact of air pollution on mor-tality is overwhelming as reflected in the two review essays by Tenıas Burilloet al. [361] and Holland et al. [152]. The pollutant most often analyzed isparticulate matter (PM) [e.g. 8, 33, 42, 137, 175, 191, 206, 282, 327, 328, 337,364, 365, 366, 397]. Especially “fine suspended particulates, smoke and fume”(diameter of matter < 10µm) are of interest to researchers, as their “settlingvelocity in circulation of ambient air is negligible and [they] can be inhaled”[152, p. 534]. Sulfur dioxide (SO2) [e.g. 42, 152, 175, 217, 327, 364, 365], nitro-gen dioxide (NO2) [e.g. 42, 361], carbon monoxide (CO) [e.g. 361, 364, 365],and ozone (O3) [e.g. 8, 42, 329, 361] were the pollutants most frequently ana-lyzed besides particulate matter. While high ozone concentrations are rather
5 A more recent cross-country analysis for the years 1988–1997 is given by [147]but it has the disadvantage that fewer countries are covered and that the excessmortality measurement is more complicated. Nevertheless, the same trends arecovered in both publications.
6 Results from the linear regression of Minimum Monthly Temperature (MMT) onExcess Winter Deaths (EWD): EWD = α + β MMT are α = 7.72, β = 0.67,pβ < 0.0014, r2 = 0.4502.
7 Another exception is the impact of “space proton flux” in seasonal mortality [359].This effect is considered by me (R.R.) to be only of marginal importance if at all.

2.2 Causal Chain 11
Minimum Monthly Temperature ( C)
Exc
ess
Win
ter
Dea
ths
(%)
05
1015
−10 −5 0 5 10 15
Austria
Belgium
Denmark
Finland
France
Hungary
Iceland
Ireland
Italy
Netherlands
Norway
Portugal
Spain
Sweden
Switzerland
United Kingdom
West Germany
Yugoslavia
Fig. 2.2. Excess Winter Mortality in Several European CountriesData Source: McKee 1989 [252, p. 179]
common during summer, the other substances can be labeled “winter type”air pollution [365, p. 547]. As nicely presented in Touloumi et al. [364] for SO2,smoke and CO2, the emission of these pollutants peaks typically in winter.The main reason for these peaks is the extensive usage of fossil fuels during thecold season for heating. The two causes of deaths which are most often associ-ated with air pollution are also the two main causes of winter excess mortality:respiratory diseases [e.g. 33, 92, 93, 94, 137, 175, 206, 282, 328, 338, 364] andcardiovascular diseases [e.g. 33, 92, 94, 137, 175, 206, 328, 338]. The effectsthat “[s]mall particles penetrate deeply into sensitive parts of the lungs andcan cause or worsen respiratory disease, such as emphysema and bronchitis,and aggravate existing heart disease” [92, p. 2] is questionable, though. Keat-
12 2 Literature Review
�
�
�
�
�
�
�
�
�
�
�
�
�
�
�
�
Climate
Cold
Temperature
Biomedical
Reaction to
Climate
Blood Clotting,
Infections of the
Respiratory
Tract, etc.,
’Demographic’
Reaction to
Biomedical
Changes
Increased
Mortality Risk
Intervening
Social
Factors
Housing condi-
tions, exposure
to outdoor cold,
clothing, . . .
⇒ ⇒ ⇒
Fig. 2.3. A More Advanced Chain of Causality for Seasonality in Mortality
ing and Donaldson, arguably the two most prominent reseachers on seasonalmortality, point out in their study “Mortality Related to Cold and Air Pollu-tion in London After Allowance for Effects of Associated Weather Patterns”that an “analysis on our data confirmed that the large, delayed increase inmortality after low temperature is specifically associated with cold and is notdue to associated patterns of wind, rain, humidity, sunshine, SO2, CO, orsmoke” [189, p. 214]. Of course, it depends on the subjective point of viewto decide whether an increase in mortality is due to cold or due to higherconcentrations of air pollutants that have been emitted to heat houses andflats during exceptional cold spells.
Less controversially discussed is the impact of influenza vaccinations onseasonal mortality [235]. It has been shown that “vaccination against influenzais associated with reductions in the risk of hospitalization for heart disease,cerebrovascular disease, and pneumonia or influenza as well as the risk ofdeath from all causes during influenza seasons” [273, p. 1322]. As these vac-cinations are effective and cost effective to reduce influenza deaths [68], it isnot surprising that an important part is attributed to them for the decreasingincidence of influenza during recent decades [e.g. 75, 78].
The remaining social factors influencing seasonal mortality can be sum-marized as avoiding indoor as well as outdoor cold. Various factors have beenassociated with a positive influence on reducing the annual cold-related deathtoll. Some researchers remained relatively general about the exact causes.Kunst et al. argue “that a fundamental role is played by factors closely re-lated to socioeconomic progress” [208, p. 971]. This point of view is reiteratedby Gemmell et at. [120]. Most other studies have focussed on factors asso-

2.2 Causal Chain 13
ciated with housing conditions [e.g. 18, 54]. The spread of central heating isargued to be the main cause for the decline in seasonality of mortality dur-ing recent decades [e.g. 16, 75, 77, 188, 251, 324, 325, 340]. District heatingschemes as common in Russia [253] where heating is provided for a fixed an-nual sum might serve as an explanation for the small fluctuations in mortalityin Russia.8 With a heating system where your apartment can be heated asmuch as wanted irrespective of the costs, would avoid the often cited “fuelpoverty” (=a household has to spend more than 10% of its disposable incometo keep the home heated) in the UK [121, 178, 280].9 People suffering fromfuel poverty often find themselves in a vicious circle. They tend to live inhouses of lower quality with poor insulation which means that they have toinvest proportionally more in fuel for heating than higher quality apartments.The risk of dying during winter is further increased as dampness, condensa-tion and mould in those apartments are more likely [121, 245, 404]. Fightingfuel poverty including poor housing conditions might not be enough, though.The behavioral component of the people should not be neglected. As shownby Keatinge for elderly people with unrestricted home heating, mortality rosefor them during winter in the same manner as for individuals without thispossibility — due probably to the “residents’ preference for open windowsand no heating at night” [187, p. 732].
But “warm housing is not enough” [186, p. 166]. It is equally important toavoid exposure to outdoor cold as its impact is independent of indoor cold [98].From a public policy perspective, this can be performed by building windproofbus shelters and in extreme cases heated waiting rooms [186]. On the individ-ual level, increased car ownership has probably also influenced the decreasein seasonal mortality fluctuations over time [75, 77, 188]. The most influentialcomponent on the individual level is adequate clothing worn outdoors. Severalarticles give evidence that people in colder regions wear warmer clothes whenthey leave the house during winter than their counterparts in warmer regions[76, 80, 81, 97, 98, 186]. In addition, on extremely cold days, the mortalityrisk is lowered if the time spent outdoors is reduced [76].10
Surprisingly, there is not much literature in the field of seasonal mortalityon the “classical” social mortality determinants such as income, deprivation,wealth, marital status, education, occupation, . . . [e.g. 124, 168, 195, 210,234, 314]. To my knowledge no study at all so far has addressed the questionwhether married people experience smaller annual fluctuations in mortality
8 I would like to thank Arseniy Karkach for explaining to me the Russian systemof heating. Another reason for the minor differences between winter and summermortality in Russia is, unfortunately, the relatively high summer mortality dueto accidents [253].
9 The British government started a programme that by 2010 “no vulnerable house-hold [. . . ] need to risk ill health, or worse, because of a cold home” [178, p. 510].
10 Again, British people present divergent behavior: the study of Goodwin et al.[127] showed that the duration of outside excursions of younger as well as elderlypeople did not differ between summer and winter.

14 2 Literature Review
than divorced, widowed or single individuals, an association which could beexpected from previous studies on mortality in general [e.g. 125, 129, 163]. Theanalyses in Chapters 4 and 5 include besides other factors also marital status.They represent therefore a novel approach in seasonal mortality research.
While the negative social gradient is well known for mortality in general,the impact of economic factors such as deprivation, income, wealth, socialclass, etc. is still discussed ambiguously [16, 79, 147, 213, 214, 215, 342, 376].Surprisingly most of these analyses — regardless of whether they support oroppose an effect — studied the same country (UK) using similar methodsbased on ecological data.
Literature on the influence of nutrition on seasonal mortality is sparse.Woodhouse and Khaw hypothesize that low Vitamin C intakes during thecold season may increase cardiovascular risk by raising fibrinogen levels inthe blood [194, 411]. As pointed out in the review article of Ness and Powles[272, p. 1], “[a]lthough null findings may be underreported the results areconsistent with a strong protective effect of fruit and vegetables for strokeand a weaker protective effect on coronary heart disease.” Thus, the seasonalconsumption of fruits and vegetables (lower in winter than in summer) mayalso play an important role for seasonal mortality [60]. The other side of thecoin is highlighted by Kloner et al [199]. They assume that “overindulgence”in food, salt and alcohol consumption during the Christmas period mightcontribute to excess winter mortality.
2.2.4 Summary
The influence of seasonal factors on mortality has been well-known for morethan 2000 years. Surprisingly, the exact mechanism of how a change in ambienttemperature increases mortality is not yet full understood. Only a negligibleproportion of these excess winter deaths is actually caused by hypothermia.The causes of death that contribute most to the seasonal mortality patternare cardiovascular, cerebrovascular, and respiratory diseases. Contradictingintuition, the often cited influenza (which belongs, of course, to respiratorydiseases) causes less than two percent of excess winter deaths either directlyor indirectly. The major biomedical reactions to cold temperature in the bodywhich have been singled out so far are increased risks for blood clotting viahigher haemoconcentration (⇒ cardiovascular and cerebrovascular diseases)and for infections of the airways (⇒ respiratory diseases). This approach,however, could not explain the “seasonality paradox”: countries with rela-tively cold winter temperatures (e.g. Sweden, Canada) experience consistentlylower excess winter mortality than countries with warm or moderate climate(e.g. Portugal or the UK). Therefore, social factors have be referred to. In-fluenza vaccinations may have helped to reduce seasonal mortality over time.But as this cause of death is only of borderline significance nowadays andinoculations are available all over Europe, this can not be used as an argu-ment to explain the observed large differences within Europe in the 1990s.

2.3 Seasonal Mortality from a Historical Perspective 15
Also the impact of air pollution is questioned. If there is any agreement atall in the literature on seasonal mortality, it is the positive impact of a warmindoor climate in connection with central heating and a high standard in thequality of housing. This constitutes a “conditio sine qua non” as no scientistin this field denies the importance. It is usually supplemented by the adviceto also avoid cold stress outdoors by wearing adequate clothing, reduced timespent outdoors and using bus shelters or possibly a car. The impact of socio-economic factors measured, for example, as social class or deprivation, findssupport as well as opposing opinions in the literature on cold-related mortal-ity. Other factors, such as lack of exercise, smoking [246], or the amount ofpublic spending on health care [147] have not been investigated in detail sofar. The impact of marital status has not been investigated so far at all. Thequestion whether people who are living alone face higher excess mortality risksduring winter has only been addressed once so far — without any significantfinding [405]. Although many studies have been completed up to this point,further research is required in order to reduce the annual number of excesswinter deaths — a figure, which outnumbers heat-related deaths considerably.
2.3 Seasonal Mortality from a Historical Perspective
2.3.1 Introduction
The following sections review the literature on seasonal mortality from a his-torical perspective. The main results are briefly presented over time and byage. Special attention is given to the potential impact of social factors alreadyin historical times. The division of sub-chapters is driven by the origins ofdata:
Seasonal Mortality before 1400. No written records are available for thetime before 1400. Therefore, mainly archaeological studies exist.
Seasonal Mortality between 1400 and 1800. Most studies using parishregister data to disclose the annual fluctuations in mortality start in the15th or 16th century.
Seasonal Mortality from 1800 until the Present. With the introductionof modern censuses, the quality of the data improved greatly. Therefore,it was useful to make another distinction for the turn of the 19thcentury.Since the middle of the 20th century, these aggregate level governmentstatistics have been gradually supplemented and or substituted with ret-rospective surveys, prospective follow-up studies, register data, etc. Bothkinds of data sources have greatly improved our understanding of seasonalmortality.

16 2 Literature Review
2.3.2 Seasonal Mortality before 1400
Introduction, Data & Methods
The main problem researchers face when analyzing (seasonal) mortality pat-terns for this period is the lack of written death records. Two data sources,which have been extensively studied by Walter Scheidel [330, 331, 332, 333,334] provide, nevertheless, a sound basis for the analysis of seasonal mortality:for Roman Egypt, information can be derived from mummy labels or from fu-nery inscriptions. Several samples have been collected there covering between109 and 172 individuals. Data from the ancient city of Rome provide the bestdata-source for the analysis of antique seasonal mortality: Below the streets,thousands of inscriptions were found in the Chrisian catacombs, where theearly Christians buried the deceased in niches.The trustworthiness of thesedata stem on the hand from the large sample-size: depending on the studybetween 568 and 3,725 inscriptions originating from the 3rd to the 6th cen-tury were analyzed [331, 343]. On the other hand, the reported dates of deathand/or burial are expected to be considerably accurate. As Scheidel pointsout “[T]hese early Christians were anxious to record precise days of deathand/or burial of the deceased since the moment of death was considered thebeginning of true life in eternity” [331, p. 139]. These early Christians didnot only report date of burial, they also frequently denoted the approximatelength of life. Therefore a rough analysis by age-group can be performed aswell.
In contrast to these studies set in countries with a warm, Mediterraneanclimate, Fichter and Volk analyzed a population with harsher environmentalconditions in a region which would now be part of South-West Germany andFrance [106].
Results
We can see in Figure 2.4 that Roman Egypt, as well as the ancient city ofRome, both exhibit a summer peak. The one in Ancient Rome (Figure 2.4)is mainly generated by infectious diseases. It has been argued before and isnow verified by modern biomolecular methods that the single most importantcause of death in Rome was endemic falciparian malaria [326, 330, 333]. Inaddition to the relatively high temperatures in the Mediterranean climate,the spread of these diseases was facilitated by the poor sanitary standards inconjunction with a high population density [339].
The earlier peak in Egypt as shown in Figure 2.4 is misleading. At a firstglance, it would suggest that the same infectious diseases of Rome — whichare dependent on stable high temperatures — “would have spread, killed,and run out of steam earlier in the year than in Italy” [331, p. 153]. Thereis little doubt that the population in Egypt also had to suffer from highmortality in summer. However, we now know that the peak was even earlier

2.3 Seasonal Mortality from a Historical Perspective 17
Fig. 2.4. Seasonal Distribution of Deaths: Rome and EgyptSource: Scheidel 1996 [331, p. 155]
than Figure 2.4 suggests: While the date of death has been recorded in theRoman catacombs, the dates on the mummy labels in Egypt usually indicatethe end of the mummification process [332]. This means that the actual deathoccurred about 70 days before the given date, implying a peak in mortality notin summer but in April/May. One can only speculate about the main causesof death: dysentery, typhoid, and tuberculosis. The main “killer” in Rome -malaria - seems to be unlikely as Walter Scheidel pointed out [334]: The annualonset of Malaria usually coincided with the fall of the Nile which happenedin the fall and not in sping. However, we are far from being able to generalizethat this peak is a general population pattern: adult ages are over-representedwhile children and elderly people are hardly among the mummies.11
With the presence of some information on age, we are able to further in-vestigate the seasonal pattern, at least for Ancient Rome. Figure 2.5 showsthe seasonal distribution of deaths for 20–49 year old people in the upperpicture and in the lower picture for people above age 50 and 60, respectively.Elderly people still exhibit a peak in summer. However, the extent is less pro-nounced than at younger ages (cf. Fig. 2.5: 20–49years: 180; 50+years: 140).The risks for the elderly lurk in other months: While their younger counter-parts show a below-par mortality in winter, mortality is elevated for peopleabove age 50 during that period. Brent Shaw attributes this rise in winter tothe higher susceptibility of elderly people to “winter” diseases such as respi-
11 I would like to thank Prof. Walter Scheidel, now at Stanford University, for thevaluable information he gave in our e-mail correspondence.

18 2 Literature Review
Upper Graph: Ages 20–49 (N=857);Lower Graph: Ages 50+, 60+ (N=313);
Fig. 2.5. Seasonal Mortality in Ancient Rome by AgeSource: Shaw 1996 [343, p. 120]
ratory infections [343]. It is interesting to note that the differences betweenmen and women have been fairly small. Figure 2.6 shows that both sexes havehighest mortality late in summer. With the exception of the months August

2.3 Seasonal Mortality from a Historical Perspective 19
to October, mortality is evenly distributed throughout the year.12 The onlydifference we have observed is that women’s susceptibility towards the envi-ronmental hazards of summer begins earlier and is not as excessively high asmen’s fluctuations.
N=3,725;
Fig. 2.6. Seasonal Mortality in Ancient Rome by SexSource: Shaw 1996 [343, p. 117]
The study of Fichter and Volk of the cemeteries in Sasbach-Behans andBischof-fingen-Bigarten had to be conducted carefully 13 and resulted in apeak in winter. More specifically, the mortality maximum was reached “in thelast phase of winter and in the portions of spring and autumn closest to winter”[106, p. 57]. Similar to the Roman findings, no significant differences couldbe detected for women and men.14 The authors suggested that the peak inwinter was probably caused by infectious diseases. However, their reasoning isfounded on a vague basis: especially bones with a “winter orientation” showedmalformations which are typical of severe anemia. “This blood disease causesa deficiency of those components which convey in the blood the vital oxygen12 The less stable pattern of women may be explained by a smaller sample size. A
separate number of women and men in addition to the whole sample size is notgiven in the literature.
13 They had to overcome several methodological problems since the date of deathhas been derived from the angle people have been buried. According to Fichterand Volk [106], people in that region during that era were buried in the directionwhere the sun rose in the morning on the day of the interment. Consequently,people could have been buried in the same direction although the burial seasonswere different. The maximum difference is 6 months, when person A died on 21March and person B on 21 September.
14 Also children showed the same pattern.

20 2 Literature Review
to the tissues. The chronic oxygen deficiency in the tissues leads to a severlyincreased susceptibility to infection as a consequence of lowered resistance”[106, p. 56].
Problematic Studies
Besides these studies with relatively large sample sizes, there are several,mainly archaeological, approaches using indirect methods to estimate the sea-sonal distribution of deaths in pre-historic populations.
The study for the period that is probably the longest time ago is theanalysis by Klevezal and Shislina of cementum annual layers in teeth fromhuman skeletons [198]. They analyzed five skeletons from the Bronze Agefound in Kalmyckia. Two out of them had no cementum layers. The remain-ing three individuals are supposed to have died in spring/early summer (2)and in late winter (1). This approach can be questioned in several perspec-tives. Obviously, a sample of three does not allow to for any conclusions tobe drawn about the general seasonal pattern in a population. One may alsodoubt the methodological approach. This so-called Tooth Cementum Annu-lation (TCA) Method allows to estimate the age of the subject better thanprevious morphological methods [409, 410]. As shown in Figure 2.7,15 teethdisplay similar patterns as trees. The biological basis for these rings is stillquestioned. According to Lieberman [222] it is related to seasonal variation indiet and growth. Consequently, Klevezal and Shislina tried to use this methodto assess the season of death of humans, as done successfully before for severalmammalian species [100]. The opinion of experts on the TCA method for hu-man seasonal mortality studies [100, 408] and the fact that only one study hasbeen conducted so far raises serious doubts about the validity of the method.
Another indirect approach has been performed by Christine White in 1993[401]. She analyzed the hair of 15 mummies found in the Nubian desert (partof The Sudan) dating from AD 350–1300. The rationale of the study is thedifferential carbon composition of C3- and of C4-plants which are seasonallycultivated and consumed.16 These C3 and C4 diets have a strong influenceon the δ13C content of hair. Analyzing the δ13C of hair near the root andthe skin of these mummies reflects relatively accurately the diet at about thetime of death [401]. “The point in the seasonal cycle when the individualdied is determined by how the δ13C value closest to the scalp relates to valuesrepresenting previous months. An individual whose δ13C becomes increasinglylighter from the first to the fourth segments must have died well into theseason when more C4 plants were consumed” [401, p.664]. Christine White’s
15 I would like to thank Prof. Dr. Ursula Wittwer-Backofen, Dr. Alexander Fabigand Uta Cleven from the Tooth Laboratory at the Max Planck Institute forDemographic Research for the picture.
16 C3 such as wheat, barley as well as most fruits and vegetables are eaten in winter;C4-plants such as sorghum and millet are part of the summer diet.

2.3 Seasonal Mortality from a Historical Perspective 21
Fig. 2.7. Human Tooth Cementum under the Light Microscope
results echo the previous results for Rome and Roman Egypt, though on aless statistical foundation due to the small sample size. First, 11 out of 15mummies died in summer indicating a peak in mortality during the warmseason. Secondly, no substantial differences between women and men couldbe detected.
Summary
The available evidence lets us conclude that during these early historical times,there were two opposing seasonal mortality regimes: In rather warm regions(Roman Egypt, Rome, The Sudan) mortality peaked during the warm sea-son. This peak was probably caused by infectious diseases such as falciparianmalaria. Higher temperatures caused an earlier spread of diseases and, con-sequently, hotter regions experienced the peak earlier in the summer. Coldregions, contrastingly, showed maximum mortality in winter. The season withthe least number of deaths was spring and early summer.
Demographic phenomena can be explained by three mechanisms: bad data(Level-0), direct effect (Level-1) and compositional effects (Level-2) [382, 383].One must be very careful to avoid Level-0 and Level-2 effects when interpret-

22 2 Literature Review
ing and, especially, generalizing the results of the archaeological studies. Thereare too many potential trapdoors for an unrepresentative sample [155]: First,samples with less than 100 analyzable individuals are unlikely to yield satis-factory interpretations of mortality patterns. Secondly, does the sample reallyresemble the population in its age-structure? As we have seen briefly (ancientRome), people at different ages show different seasonal patterns. Thirdly, isthe sample representative for the whole period? Maybe it was a special burialsite for people with certain characteristics? “Given that most samples willbe subject, differentially, to biases at a variety of levels, comparative studiesbased on palaeodemographic data cannot realistically be considered reliablewithout careful control for those biases.” [155, page 151, emphasis inoriginal document].
2.3.3 Seasonal Mortality Between 1400 and 1800
Introduction
The first modern census has been conducted in Sweden in 1748 [360]. MostEuropean countries did not follow until the beginning or the middle of the19th century. Statistical analyzes of seasonal mortality, however, did not haveto rely on archaeological data and methods any longer to study (seasonal)mortality between (about) 1400 and 1800. The introduction of parish reg-isters enabled researchers to investigate historical population patterns. Twoapproaches have been used since: First, parish registrations have been aggre-gated to give weekly figures for vital events. These counts have been publishedin England as Bills of Mortality [154, p. 145]. The scientific value of these num-bers had been recognized as early as 1662, when John Graunt first publishedNatural and Political Observations Mentioned in a Following Index and MadeUpon the Bills of Mortality [130], which displays “all of the characteristicsof modern, empirical research” [406, p. 5]17. These bills of mortality did notonly include the number of deaths but also the cause of death.The secondapproach started after World War II, when “French scholars began to apply anew technique to nominative records of the periode prestatistique, i.e. the pe-riod for which government statistics were not readily available” [323, p. 537].The most prominent among these researchers was Louis Henry. His methodof applying the method of family reconstitution to parish registers has beennamed after him, the Henry method [318]. Even the critics [320] acknowledgethat the approach to reconstruct the population history by using parish regis-ters provides valuable results [146]. Depending on the country and region onecould estimate the seasonal variation in mortality starting in about 1400.
17 Peter Laslett actually wrote “To the trained reader Graunt writes statisticalmusic”[212].

2.3 Seasonal Mortality from a Historical Perspective 23
Seasonal Mortality over Time
Figure 2.8 shows the results of seasonal mortality over time in England be-tween 1580 and 1837 by [415]. Each line — with the exception of the firstand last interval — represents 50 years of pooled data. The first thing we canrecognize is the relative stable pattern over time where we observe a winterpeak and a summer trough. Mortality usually peaks late in winter and reachesa trough around July/August. Similar results have been reported for medievaltimes for Westminster Abbey by Harvey and Oeppen [144]. This basic pattern— with relatively high winter and relatively low summer mortality — is notonly stable over time but also across different geographic locations as studiesfrom Canada, Estonia, Finland, and France suggest [27, 45, 182, 216, 298].The stability of seasonal mortality is even more surprising when one keepsin mind the general mortality pattern during the ancien regime: First, deathrates were relatively high during that period reflected by a low level of theparameter e0 of about 35 years. Secondly, these high levels of mortality weresubject to immense annual fluctuations [109, 143, 161] caused by “Epidem-ical Diseases” superimposing “Chronic Diseases” as already pointed out byGraunt [130].
Fig. 2.8. The Seasonality of Deaths by Half-Century PeriodsSource: Wrigley et al. 1997 [415, p. 325]

24 2 Literature Review
By comparing this modern pattern, with a peak in winter and trough insummer, to results from Italy [331], Spain [353] and parts of France [27], wedetect that the following finding of Dobson for south-east England can notbe attributed to being a universal phenomenon. She wrote: “The seasonalrise and fall of burials worked in the opposite direction of the movement ofthe thermometer — an inverse relationship that was maintained throughoutthe seventeenth and eighteenth centuries” [73, p. 203]. These more southerncountries displayed a seasonal pattern similar to the one found in Rome 1500years earlier: highest mortality in summer and lowest mortality in winter.Although this might lead one to assume that the main influence was theMediterranean climate, it should be stressed that social factors were also ofcrucial importance in that period. By looking at Philadelphia’s (Table 2.2)differences in seasonal mortality between blacks and whites, we can see thatclimate could not possibly shape two totally different patterns for the sametime and place [197].
Table 2.2. Seasonal Mortality Ratios for Blacks and Whites in Philadelphia, 1722and 1730
Standardized StandardizedNumbers Ratio
White Black White Black
Winter 81 22 86 166Spring 75 10 86 75Summer 122 7 130 53Fall 98 14 104 106
Source: Klepp 1994 [197, p. 479]
While blacks seem to suffer from the highest mortality during the coldseason (standardized ratio in winter and fall 166 and 106, respectively), whitesexperience the largest risk of death during summer (standardized ratio insummer: 130).
Two causal explanations come to mind:
• The relatively low summer mortality among blacks might by linked to aselection effect: Many blacks were brought to the US as slaves and havealready survived some contagious diseases which typically occur duringsummer. As a consequence, they were immune to them.
• It can be expected that a larger proportion of this seasonal mortalitydifferential can be explained by social factors: Keeping in mind the poorsocio-economic conditions blacks had to suffer from during that period,one can easily imagine that blacks had insufficient protection against the

2.3 Seasonal Mortality from a Historical Perspective 25
cold in winter: they were more likely to work outside and to have bad orno heating at all in their homes compared to whites.18
The importance of other factors other than climate on seasonal mortalityduring that period is also supported by other sources. As Bideau et al. showedin Dupaquier’s monograph series Histoire de la population francaise [27],France varied largely in its seasonal mortality fluctuations geographically.However, the major cleavage was not between north and south but betweenurban and rural areas.
Fig. 2.9. Urban vs. Rural Seasonal Mortality Patterns in France 1740–89Source: Bideau et al. 1988 [27, p. 240]
Rural areas in France showed a relatively modern pattern with maxi-mum mortality during the colder half of the year and minimum mortalityin summer. “Pour la France urbaine au contraire, les indices de saison froidedepassent a peine de moyenne, le creux d’ete est moins marque, mais la pointede septembre est exceptionellement forte, sans doute parce que la conservationdes ailments est encore pire en ville qu’a la campagne” [27, p. 242].19
This pattern and its causal explanation is not exclusively present in France.Studies from the United Kingdom point in the same direction as well: Thestudies from the “Cambridge Group for the History of Population and So-cial Structure”, which focussed on the countryside of England, show a shapesimilar to France rurale [416, p. 294], whereas Landers’ analysis of London re-sembles, rather, France urbaine with its summer peak until the middle of the18 Theresa Singleton’s review article gives an overview of historical living conditions
of blacks in the United States [348].19 Author’s translation: “In urban France, on the contrary, the indices of the cold
season were above the average, the summer trough is less pronounced, but thepeak in September is exceptionally strong, without any doubt because the con-servation of food was even worse in towns and cities than on the countryside”.
26 2 Literature Review
eighteenth century [211, p. 206]. As indicated by Bideau’s quotation above,we can recognize that the higher temperatures during summer were not theactual cause of death for the people. The hot weather only provided the basisfor certain bacteria to develop. Only in conjunction with social factors suchas high population density and bad hygienic and sanitary conditions, diseasescould spread among humans and actually wipe out considerable proportions ofthe population. For example, during the epidemic of 1665–66, 70,594 individ-uals died of plague in London [12], a typical summer disease [353] transmittedby rats and flies. By the end of the 1670s, the plague was almost non-existentin London. Slack gives three possible explanations for this [350]:
• Rats, as the main carrier of the disease, became immune to the bacteriumPasteurella Pestis. But he considers this to be rather unlikely. He favorstwo other explanations:
• On the one hand, improvements had been made in the housing and livingconditions such as building brick houses instead of wooden houses. There,rats had more problems spreading. But also on the individual level, majorimprovements had been made such as the increased usage of soap andchanging bed linen more frequently.
• On the other hand, public health policies were — as surprising as it maysound — also in effect. For example, in Edinburgh 1664 restrictions wereimposed on ships coming from infected ports. Almost simultaneously, thenumber of plague deaths diminished remarkably [350].
The erosion of the summer peak in urban areas can be nicely illustrated bythe example of London. Fig. 2.10 shows the development of seasonal mortalityin the capital of the British Empire between 1670 and 1779 by 25-year-periods.In the first period 1670–99 (solid black line), maximum mortality was reachedin September. During the next century this peak gradually transformed into alocal maximum. By the end of the eighteenth century, excess mortality duringsummer was almost non-existent. It is quite likely that this development canalso be traced back to improvements in living conditions (hygiene, publichealth policies, etc.).
Seasonal Mortality by Age
Besides the development over time, it is also worthwhile to investigate thetrend in seasonal mortality in various age-groups. Unfortunately, not manystudies have analyzed death by month and age. In addition, it is seriouslydoubted whether adult mortality can be accurately estimated from the exist-ing data. Finlay, for example, assumes that this is not possible for parts of theLondon Parish Registers [107]. Nevertheless, I would like to present a shortanalysis by age as most studies showed relatively congruent results.
Figure 2.11 presents selected age-groups from [415]. One can easily recog-nize two features:

2.3 Seasonal Mortality from a Historical Perspective 27
Month of Death
Inde
x (M
ean=
100)
Jan Feb Mar Apr May Jun Jul Aug Sep Oct Nov Dec
8090
100
110
120
1670−991700−241725−491750−741775−79
Fig. 2.10. Monthly Burial Indices in London 1670–1779 Based on Weekly Bills ofMortality
Data Source: Landers 1993 [211, p. 206]
• The older people become, the larger the differences between winter andsummer.
• Except for the oldest people we can see an intermediary summer peak.
This is in accordance with Dobson who stated that the elderly were par-ticularly susceptible to cold winter conditions [73, p. 216]. Similar results havebeen found for France and Canada [27, 45, 216]. The higher susceptibility ofthe elderly is reflected by the actual causes of death: As shown by [153] forplague mortality rates by age, younger people have a higher propensity to-wards summer diseases than elderly people. Whereas the proportion of plaguedeaths from all deaths was probably over 50 percent for children, the percent-age was less than 10 percent for people aged 60 years and more [153]. Thelatter, however, were more affected by typical air-borne winter diseases suchas tuberculosis [114, 211]. Typical diseases of winter were influenza, whoop-ing cough, typhus, and respiratory tuberculosis. These diseases, which weremainly responsible for the winter peak, were harder to combat than just usingbetter sanitary conditions. Duncan et al. conclude that the evolution of thewhooping cough epidemics in London are directly related to two factors: pop-

28 2 Literature Review
Month of Death
Inde
x (M
ean=
100)
Jan Feb Mar Apr May Jun Jul Aug Sep Oct Nov Dec
5075
100
125
150
0−440−7475+
Fig. 2.11. Seasonality of Deaths by Age, England, 1580–1837Data Source: Wrigley et al. 1997 [415, p. 326]
ulation density and malnutrition [83, p. 450]. Malnutrition is often especiallysingled out as one of the main causes of mortality during those times [e.g.116, 218].20 Richards [307], for example, estimates that the price of wheatwas more important to determine mortality than winter or summer temper-ature. Livi-Bacci [225] also ascribes the nutritional level a clear influence ontuberculosis, whooping cough and respiratory diseases in general. This causallinkage between malnutrition, infectious diseases and high mortality has beendocumented well for populations during that historical period [43, 254, 399].“Malnutrition progressively enhances infection in an individual, and [. . . ] in-fection often causes further malnutrition. An ill person does not eat well, eventhough his metabolic needs are greater. Similarly, poorly nourished individ-uals rapidly exhaust protein and caloric reserves in the process of fightinginfection” [43, p. 249]. It can be assumed that this mechanism did not onlywork during crisis years with especially poor harvest but also seasonally eachyear when late in winter the possibility of malnutrition was highest.
20 Vladimir Shkolnikov re-iterated this assumption in a discussion during the work-shop “Seasonality in Mortality”, Duke University, NC, 07–08 March 2002.

2.3 Seasonal Mortality from a Historical Perspective 29
Summary
The major advantage of studies examining seasonal mortality patterns be-tween 1400 and 1800 is the basis of the data: Researchers no longer had torely on archaeological methods to make inferences about population histories.French and British researchers (most notably Louis Henry and the “Cam-bridge Group for the History of Population and Social Structure”) used parishregisters to reconstruct demographic events of populations.
The general pattern observed for seasonal mortality in many countriesresembles modern findings rather closely: deaths peak late in winter and hita trough around July/August. English data suggest that seasonality was notequal across all age-groups. The older the people the higher the differencesbetween winter and summer mortality.
The modern pattern with a peak in winter and a trough in summer isnot found everywhere, though. Several examples show that within the sameclimatic region, different seasonality regimes persist which could not be ex-plained, consequently, by climatic variation but rather by social factors: socio-economic differences may be the root for the differential in seasonal mortalitybetween blacks and whites in 18th century Philadelphia. Poor hygienic sit-uations allowed a summer peak in urban regions of France and the UK (∼London). Malnutrition is the most likely cause for excess mortality duringwinter for the elderly.
2.3.4 Seasonal Mortality from 1800 until Present Times
Introduction
The beginning of the 19thcentury was chosen — similar to the previous cut-off point 1400 — rather for methodological reasons rather than for a generalchange in seasonal mortality regimes. Sweden started to collect demographicdata resembling the first modern census [360] in 1748.21. Many other Euro-pean countries followed in subsequent decades, so researchers no longer hadto rely on archaeological methods or on parish reconsitution data to constructdemographic patterns. In addition to retrospective articles using those newlyavailable country-wide official data written during recent decades, some orig-inal articles written at that time were already analyzing seasonal mortality.
With the new wealth of available data in the 19thcentury, scientific knowl-edge expanded rapidly. It is worth adding that this time period was also heav-ily influenced by “back to nature” ideas exemplified by Thoreau’s “Walden”[24]. It comes, thus, as no surprise that scientists became interested in theimpact of nature on human health [156]. A typical example is the article “AnAttempt to Determine the Influence of the Seasons and Weather on Sicknessand Mortality” by Guy and Cantab in 1843 [136] or the analysis of mortality21 The population count of Quebec in 1666 can merely be called a prototype of a
census [9]

30 2 Literature Review
in “Remote Corners of the World” by Westergaard in 1880 [400] as he calledthe Faroe Island and Greenland.
Since the middle of the 20th century, new data collection methods havebecome widespread. The introduction of retrospective surveys, prospectivecohort follow-ups,. . . allowed to investigate phenomena in more detail. Onemajor dimension is the analysis of individual level data. While previously,data were typically aggregated, the usage of individual level data allowedrelating the phenomenon of interest with covariates without the problem ofthe ecological fallacy [311]. The other major dimension is the time-horizon:data have typically been cross-sectional. By following cohorts over time orby asking retrospective questions in surveys, it was possible to reconstructindividuals’ life-courses which makes it easier to find out which variables (e.g.long-time smoker) change the risk for an individual to experience a certainevent (e.g. death). Typical examples in the field of seasonal mortality are vanRossum et al. [376] for a cohort follow up and Donaldson et al. [81] for aretrospective survey. The various (social) factors which have been associatedwith excess winter mortality have been discussed in Section 2.2.
Seasonal Mortality over Time
The analysis of seasonal mortality by period exhibits two patterns and oneunconfirmed recent pattern:
Pattern 1: Loss of Summer Peak An intermediary summer peak disappearedover time if it existed at the beginning of the observation period. Europeancountries with colonies were especially prone to such a sudden increasein mortality during the hot season. McKeown and Record (1962) [255]suggest for England that typical summer epidemics such as cholera werebrought to Europe from India. An illustrative example is shown in Fig-ure 2.12. The gray dashed line displays the seasonality pattern observedfor the urban French population in the middle of the 19th century. It isreminiscent of Figure 2.9 (page 25) which plotted the pattern of Franceobserved less than one hundred years earlier: a bimodal pattern is exhib-ited with a minor peak in February and a maximum in September. Thiskind of pattern with relatively high summer mortality has been reportedfor London and other parts of England [11, 221, 304], too. Roughly sixtyyears later, summer excess mortality was no longer persistent in Franceas indicated by the solid black line. The highest number of deaths wasobserved in February, whereas September has been transformed from themonth with highest mortality to minimum mortality. This shift, of course,can not be the outcome of a climatic change during such a short periodof time. Clearly, social factors have to be attributed to this development.The cause for this loss of the summer peak is most likely a considerable

2.3 Seasonal Mortality from a Historical Perspective 31
improvement in hygiene which almost completely eradicated intestinaldiseases, the major reason for excess summer mortality [26, p. 283].22
Month of Death
Seas
onal
ity
Inde
x
Jan Feb Mar Apr May Jun Jul Aug Sep Oct Nov Dec
9010
011
0
Urban French Population,1855−57
Urban French Population,1912−13
Fig. 2.12. Seasonality of Deaths in Urban France 1855–57 and 1912–13Data Source: Bideau et al. (1988, p. 285) [26]
Pattern 2: Decline in Seasonality In 1912, March [240] noted that no Euro-pean country he had analyzed showed a local summer peak.23 Highestmortality was found between January and March, minimum mortalitytypically occured late in summer. One consequence of the disappear-ance of the summer peak was an increase in the differences betweenwinter and summer deaths. During the following decades the annualmortality amplitude remained relatively stable. Only by the middle ofthe 20thcentury did seasonal fluctuations decrease. This development hasbeen reported for various countries such as Japan, the United States,Spain, the Netherlands, Germany, the GDR, Northern Italy, Finland . . .[17, 99, 119, 208, 220, 224, 231, 241, 242, 268, 269, 319, 325]. The decrease
22 “Le point essentiel, c’est la disparition, pour tous les ensembles consideres et pourtous le groupes d’ages [. . . ], de la surmortalite d’aout-septembre : l’hygiene estvenue presque a bout des maladies intestinales” [26, p. 283].
23 Those countries were: Austria, Belgium, Denmark, Finland, France, Germany,Hungary, Italy, Norway, Scotland, Spain, Sweden.

32 2 Literature Review
over time did not start, however, simultaneously in all countries. Figure2.13 displays this by giving two examples. Both panels show a measure-ment of seasonality where winter mortality is related to summer mortality.Because those methods differed, one can not directly compare the resultsin the left panel for the United Kingdom with the right panel for Finland.This nordic country shows a decreasing trend since the 1930s whereas thedifferences between winter and summer mortality in the UK started tobecome smaller only in the 1970s [63, 251].
Calendar Time
Seas
onal
ity
Rat
io
UK
1840 1860 1880 1900 1920 1940 1960 1980
100
110
120
130
Calendar Time
Seas
onal
Var
iati
on
Finland
1840 1860 1880 1900 1920 1940 1960 1980
1.0
1.1
1.2
1.3
1.4
1.5
Fig. 2.13. Seasonal Mortality in the UK and Finland over TimeCoefficients for the UK and Finland are not directly comparable.
Data Source for UK: McDowall 1981 [251, p. 16]Data Source for Finland: Nayha 1980 [268, p. 44]
The general trend towards de-seasonalization was related to the changingcomposition of causes of death over time — most notably the reductionof diseases of the respiratory tract [2, 255]. Various arguments are pro-posed in the literature as causal factors that have influenced this declinein respiratory-related mortality. On the one hand, public health measuressuch as influenza vaccinations are mentioned. It is argued, though, thatthe remarkable declines in mortality do not coincide with the introductionof any public health measures [402]. It can be assumed, rather, that thegeneral trend towards improved diagnosis [115] and better living condi-tions, especially the spread of central heating, for instance, is more likely

2.3 Seasonal Mortality from a Historical Perspective 33
to be the cause of this change [208, 220]. Also the possibility of less airpollution over time has been attributed to the decline in seasonality overtime [e.g. 251]. Nevertheless, this decrease in seasonality did not result ina uniform distribution of mortality during the year. With the exception ofIceland, considerable differences still exist between mortality during thehot and cold season in all countries [135, 147, 252].24
Unconfirmed recent development: Recently, a new trend has been observedfor the United States: Feinstein [102] reports an increase in seasonality ofmortality for the elderly since the mid-1970s, a finding for which Seretakiset al. [340] found some indications as well in their analysis of seasonalmortality from coronary heart disease. It is argued that this is not causedby an increase of mortality during winter but by an accelerated decreaseof mortality during summer: “If the reversal is real, then it could reflectthe increase in use of air-conditioning” [340, p. 1014].
Seasonal Mortality by Age
The first detailed analysis of seasonal mortality by age was conducted forBelgium by Adolphe Quetelet [300] in his study: “De l’influence des saisons surla mortalite aux differens ages dans la Belgique”.25 Data from the Appendix ofhis monograph were taken to produce the two panels in Figure 2.3.4. Resultsare shown in the left part of the figure for women and in the right partfor men. A dashed gray line indicates the value for a uniform distribution( 112 = 8.3%). In both cases the relative contribution of the numbers of death
from each month have been calculated, standardizing each month to the samelength. The general trend is easily visible: seasonal fluctuations become biggerwith increasing age. The youngest age-group shown here still displays a slightsecondary peak during summer. Nevertheless this sudden rise is still belowaverage mortality (=lower than the dashed gray line). At more advanced ages,this peak is non existent. Excess mortality during winter is steadily increasingwith age. Although January and February make up only one sixth of the wholeyear, their contribution to all deaths for women as well as for men above age90 (gray dashed line) is about one quarter of all deaths for each sex.
During recent decades, studies of seasonality in mortality have rarely fo-cused on the influence of age — despite its paramount influence on mortal-
24 The lack of differences in mortality between winter and summer in Iceland hasbeen attributed to the widespread availability of low cost geothermal energy whichmakes it easy to keep a warm indoor climate [252].
25 It is worth mentioning a few highlights of Adolphe Quetelet’s biography [cf. 177]:Among his professors were Poisson and Laplace; the Quetelet Index was inventedby him, nowadays often called Body-Mass-Index (BMI); while he is mostly re-membered for his work as a social statistician, he started as a mathematician,changed to physics where he specialized in astronomy; this brought him to me-teorology. The study of climate was the stepping stone for him to analyze theinfluence of the seasons on mortality.

34 2 Literature Review
Month of Death
Rel
ativ
e M
onth
ly F
requ
enci
es (
in %
)Women
Jan Feb Mar Apr May Jun Jul Aug Sep Oct Nov Dec
57.
510
12.5
15
40−50y50−65y65−75y75−90y90+y
Month of Death
Rel
ativ
e M
onth
ly F
requ
enci
es (
in %
)
Men
Jan Feb Mar Apr May Jun Jul Aug Sep Oct Nov Dec
57.
510
12.5
15
40−50y50−65y65−75y75−90y90+y
Fig. 2.14. Seasonal Distribution of Deaths, Belgium, 1830sData Source: Quetelet 1838 [300, p. 37–38]
ity in general [cf. 314]. Sometimes no age distinction was made at all [e.g.13, 21, 319, 367] which turns out to be especially problematic if compar-isons are made over time or across countries. If any age-effect exists, suchcomparisons may lead to erronenous conclusions because of the varying age-composition in the analyzed populations. Many other studies controlled forage or performed analyses for separate age-groups. Unfortunately, the highestincluded age or the beginning of the last, open-ended, age-category is chosenat an age after which most deaths in a population occur. For instance, Huynenet al. [169] uses a category “≥ 65 years of age”, the maximum age-categoryin the “Eurowinter Study” was “65–74 years” [98]; at those ages, however,most people are still alive in Western populations at present [cf. 165]. Theconclusions drawn from those studies are not necessarily wrong, but they maysimplify or blur the relationship between age and seasonal fluctuations in mor-tality. Only a few studies investigated seasonal mortality into advanced ages[102, 232, 251, 262, 268]. One study [309] even analyzed seasonal mortalityamong centenarians and supercentenarians (110 years and older).
According to Robine, demographers assume that “mortality measures es-sentially the current conditions: the quality of the ecological and social envi-ronment. For biologists, mortality measures mainly the ageing process” [310,p. 911]. If we combine these two assumptions, we could postulate that duringwinter, when environmental conditions are especially challenging, mortality is
2.3 Seasonal Mortality from a Historical Perspective 35
45−49
50−54
55−59
60−64
65−69
70−74
75−79
80−84
85−89
90−94
95−99
100−104
105−109
Agegroups
Fei
nste
in’s
Sea
sona
lity
Coe
ffic
ient
0.0
0.1
0.2
0.3
0.4
0.5
0.6
United States, 1994−1998
45−54
45−54
55−64
55−64
65−74
65−74
74−84
74−84 85+ 85+
Agegroups
McD
owal
l’s S
easo
nalit
y R
atio
100
105
110
115
120
125
MenWomen
England and Wales, by Sex, 1970−72
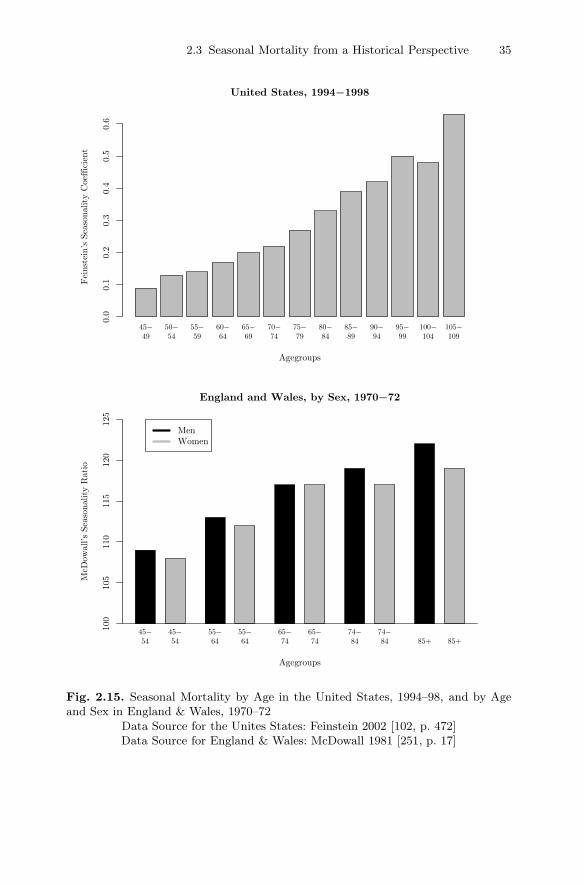
Fig. 2.15. Seasonal Mortality by Age in the United States, 1994–98, and by Ageand Sex in England & Wales, 1970–72
Data Source for the Unites States: Feinstein 2002 [102, p. 472]Data Source for England & Wales: McDowall 1981 [251, p. 17]
36 2 Literature Review
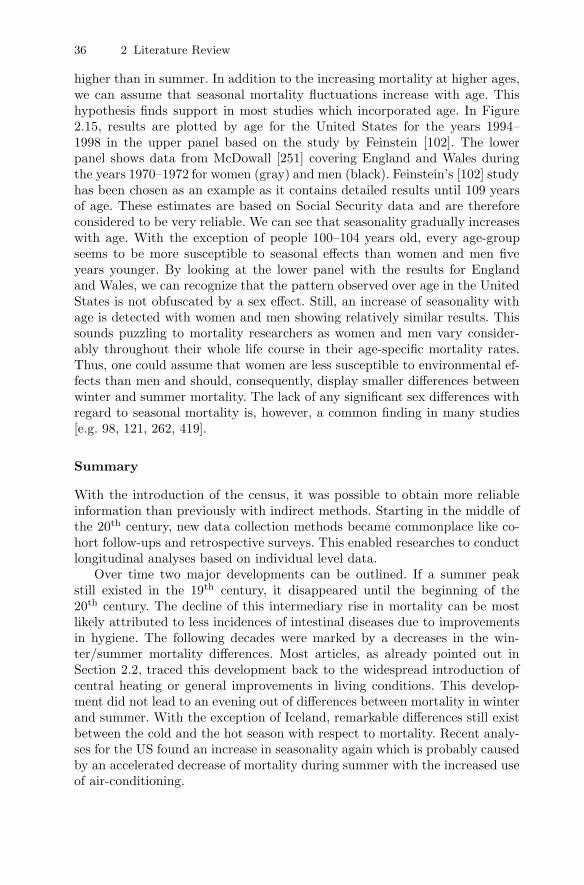
higher than in summer. In addition to the increasing mortality at higher ages,we can assume that seasonal mortality fluctuations increase with age. Thishypothesis finds support in most studies which incorporated age. In Figure2.15, results are plotted by age for the United States for the years 1994–1998 in the upper panel based on the study by Feinstein [102]. The lowerpanel shows data from McDowall [251] covering England and Wales duringthe years 1970–1972 for women (gray) and men (black). Feinstein’s [102] studyhas been chosen as an example as it contains detailed results until 109 yearsof age. These estimates are based on Social Security data and are thereforeconsidered to be very reliable. We can see that seasonality gradually increaseswith age. With the exception of people 100–104 years old, every age-groupseems to be more susceptible to seasonal effects than women and men fiveyears younger. By looking at the lower panel with the results for Englandand Wales, we can recognize that the pattern observed over age in the UnitedStates is not obfuscated by a sex effect. Still, an increase of seasonality withage is detected with women and men showing relatively similar results. Thissounds puzzling to mortality researchers as women and men vary consider-ably throughout their whole life course in their age-specific mortality rates.Thus, one could assume that women are less susceptible to environmental ef-fects than men and should, consequently, display smaller differences betweenwinter and summer mortality. The lack of any significant sex differences withregard to seasonal mortality is, however, a common finding in many studies[e.g. 98, 121, 262, 419].
Summary
With the introduction of the census, it was possible to obtain more reliableinformation than previously with indirect methods. Starting in the middle ofthe 20th century, new data collection methods became commonplace like co-hort follow-ups and retrospective surveys. This enabled researches to conductlongitudinal analyses based on individual level data.
Over time two major developments can be outlined. If a summer peakstill existed in the 19th century, it disappeared until the beginning of the20th century. The decline of this intermediary rise in mortality can be mostlikely attributed to less incidences of intestinal diseases due to improvementsin hygiene. The following decades were marked by a decreases in the win-ter/summer mortality differences. Most articles, as already pointed out inSection 2.2, traced this development back to the widespread introduction ofcentral heating or general improvements in living conditions. This develop-ment did not lead to an evening out of differences between mortality in winterand summer. With the exception of Iceland, remarkable differences still existbetween the cold and the hot season with respect to mortality. Recent analy-ses for the US found an increase in seasonality again which is probably causedby an accelerated decrease of mortality during summer with the increased useof air-conditioning.

2.3 Seasonal Mortality from a Historical Perspective 37
The first detailed study on the effect of the season in mortality whichtook the factor age explicitly into account was conducted by Quetelet in 1838[300]. His findings are still in accordance with modern studies: With increasingage, seasonal fluctuations in mortality are gradually becoming larger. This isin accordance with the theory that mortality measures the aging process ofthe body as well as the subjective environmental conditions for the individual.Common sense suggests that women should have smaller seasonal fluctuationsthan men as their lower age-specific mortality rates throughout their wholelife-course reflect less susceptibility to environmental hazards. Surprisingly,many studies could not detect any significant differences between the seasonalfluctuations in mortality of women and men.