2. methods for spectrophotopmeric determination of vitamin...
TRANSCRIPT
33
2. METHODS FOR SPECTROPHOTOPMERIC
DETERMINATION OF VITAMIN C
Page No.
2.1 Use of Iron(III)-3-Hydroxy-2-aryl-4H-chromen-4-one complex 34
in the Spectrophotometric determination of vitamin C.
2.2 Spectrophotometric determination of vitamin C using 3-Hydroxy- 48
2-(3-methyl thiophen-2-yl)-4H-chromen-4-one as a reagent.
2.3 Spectrophotometric determination of vitamin C in pharmaceuticals using 62
Iron(III)-6-Chloro-3-hydroxy-2(4-methoxyphenyl)-4H-chromen-4-one
complex.
2.4 Spectrophotometric determination of vitamin C using Fe(II)-5-Chloro-7- 76
iodo-8-hydroxyquinoline complex.
2.5 Use of calmagite in the determination of vitamin C involving 90
Ce(IV)-Ce(III) redox couple.
2.6 Spectrophotometric determination of vitamin C using Iron(II)-Batho- 104
phenanthroline complex.
34
2.1 Use of Iron(III)-3-Hydroxy-2-aryl-4H-chromen-4-one complex
in the Spectrophotometric determination of vitamin C
During the last few decades, many methods based on iron(III)-iron(II) system
have been proposed for the assay of ascorbic acid samples of diverse nature. These
procedures involve the reagents such as 2,2‟-bipyridyl229-237
, 1-10-phenanthroline238-
248, ferrozine
254-256, 2-(5-bromo-2-pyridylazo)-5-dimethylaminophenol
265, TPTZ
258-260
and nitroso-R-salt262
etc. Of them, the methods involving 2-2‟-bipyridyl and 1,10-
phenanthroline find extensive use in the development in the analysis of vitamin C.
Many of these methods are time consuming as full colour development takes 30-60
min. Recently simplification of the procedure involving 3-hydroxy-2-(2-thienyl)-4H-
chromen-4-one complex has been reported from our laboratory which requires only
one min waiting time instead of 30 or 60 min. Many methods using 1,10-
phenanthroline need either background correction as done by Cu-catalysed oxidation
or the addition of NH4F as the inhibitor of the light reduction of iron(III)-O-phen
complex. An improvement has been made using the orange- red iron(II)-O-phen
chelate in aqueous miscellar medium formed in presence of the cationic surfactant
cetylpyridinium bromide. The methods using ferrozine or 2-OCHT suffer
interferences from metal ions such as Co(II), Ni(II) ,Cu(II), Pd(II) and iron (II) in
addition to the interferences caused by tartaric acid, citric acid, oxalic acid, riboflavin
and oxidants.
3-Hydroxy-2-aryl-4H-chromen-4-one (HAC) has been found to be an
appropriate reagent that forms a colored complex with iron (III) in almost neutral
solutions. The complex gets extracted into chloroform to give a reddish brown extract.
The proportionate decrease in absorbance of the complex with the addition of
increasing amount of ascorbic acid forms the basis of the proposed method. The
method based on the extraction of iron (III) –HAC complex provides the desirable
features of simplicity and rapidly besides having better sensitivity and selectivity. The
detailed studies pertaining to the proposed method are presented here.
35
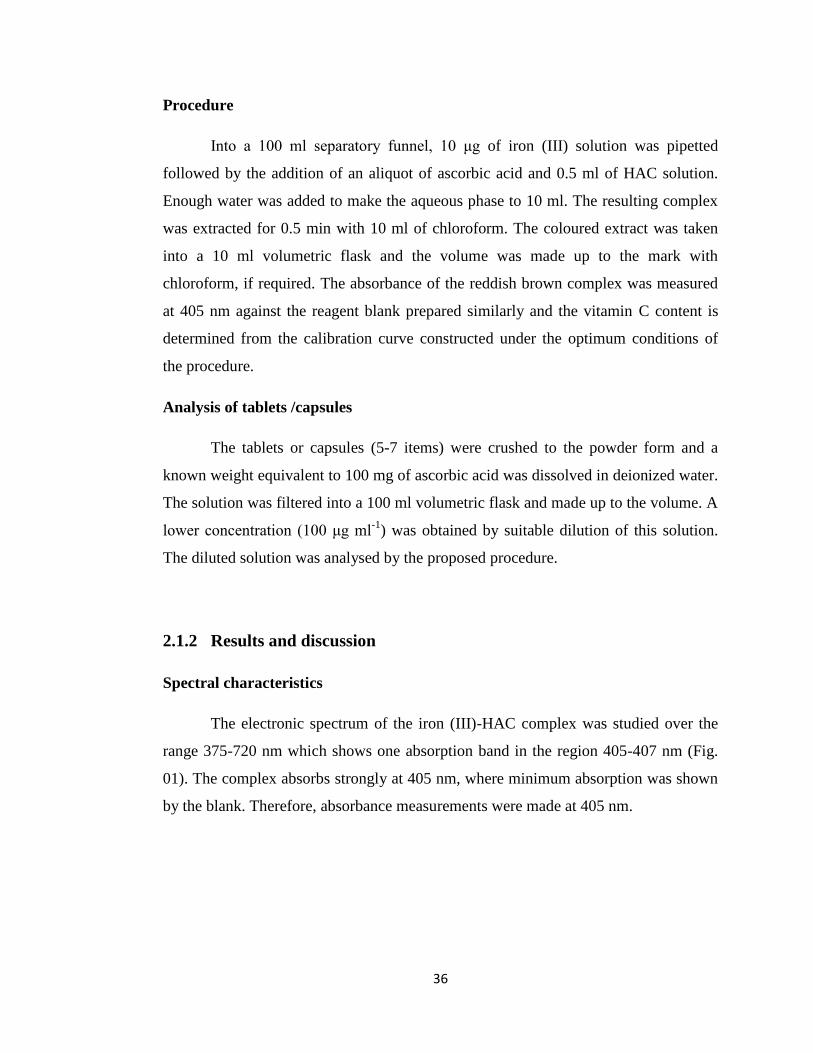
2.1.1 Experimental
Instrument
A Hitachi schimadzu spectrophotometer (model UV-140-02) with a pair of
matched 1cm quartz cells was used for absorbance measurements.
Reagents and Solutions
Iron (III) solution
A (1mg ml-1
) iron (III) solution was prepared by dissolving accurately weighed
amount of Ammonium ferric sulphate in 100 ml of deionised water containing 0.5 ml
of concentrated sulphuric acid. A lower concentration (10 μg ml-1
) was obtained by
dilution of the stock solution.
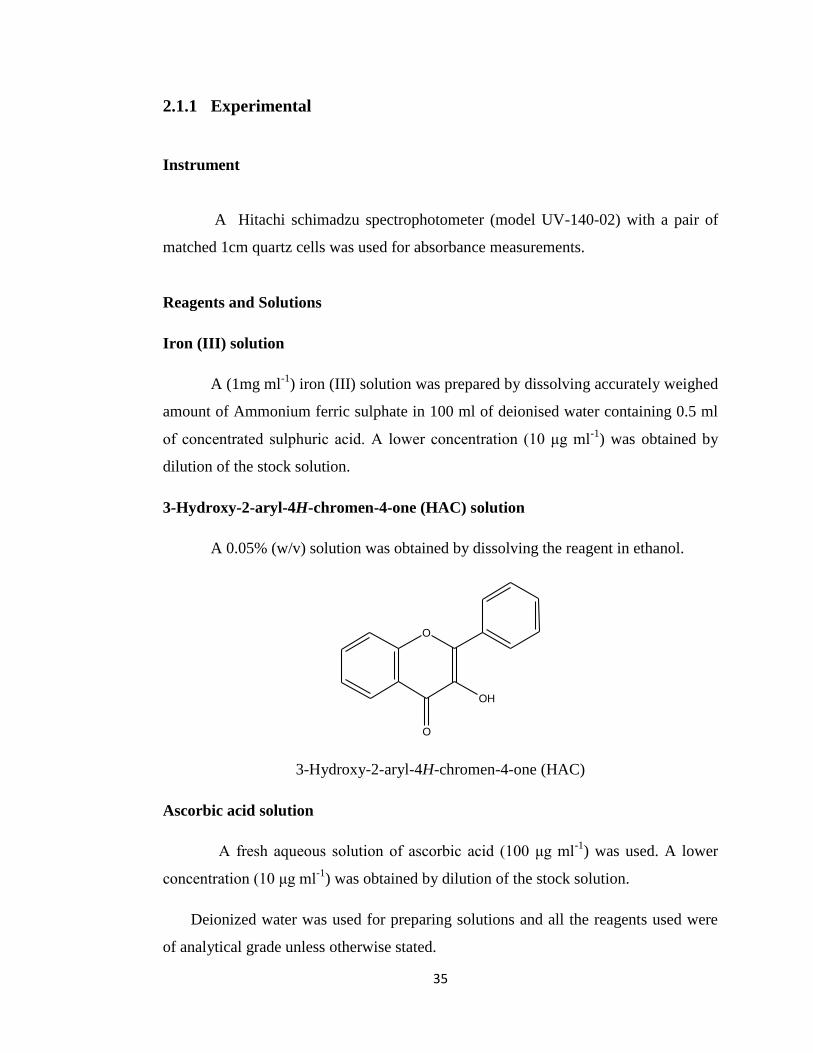
3-Hydroxy-2-aryl-4H-chromen-4-one (HAC) solution
A 0.05% (w/v) solution was obtained by dissolving the reagent in ethanol.
O
O
OH
3-Hydroxy-2-aryl-4H-chromen-4-one (HAC)
Ascorbic acid solution
A fresh aqueous solution of ascorbic acid (100 μg ml-1
) was used. A lower
concentration (10 μg ml-1
) was obtained by dilution of the stock solution.
Deionized water was used for preparing solutions and all the reagents used were
of analytical grade unless otherwise stated.
36
Procedure
Into a 100 ml separatory funnel, 10 μg of iron (III) solution was pipetted
followed by the addition of an aliquot of ascorbic acid and 0.5 ml of HAC solution.
Enough water was added to make the aqueous phase to 10 ml. The resulting complex
was extracted for 0.5 min with 10 ml of chloroform. The coloured extract was taken
into a 10 ml volumetric flask and the volume was made up to the mark with
chloroform, if required. The absorbance of the reddish brown complex was measured
at 405 nm against the reagent blank prepared similarly and the vitamin C content is
determined from the calibration curve constructed under the optimum conditions of
the procedure.
Analysis of tablets /capsules
The tablets or capsules (5-7 items) were crushed to the powder form and a
known weight equivalent to 100 mg of ascorbic acid was dissolved in deionized water.
The solution was filtered into a 100 ml volumetric flask and made up to the volume. A
lower concentration (100 μg ml-1
) was obtained by suitable dilution of this solution.
The diluted solution was analysed by the proposed procedure.
2.1.2 Results and discussion
Spectral characteristics
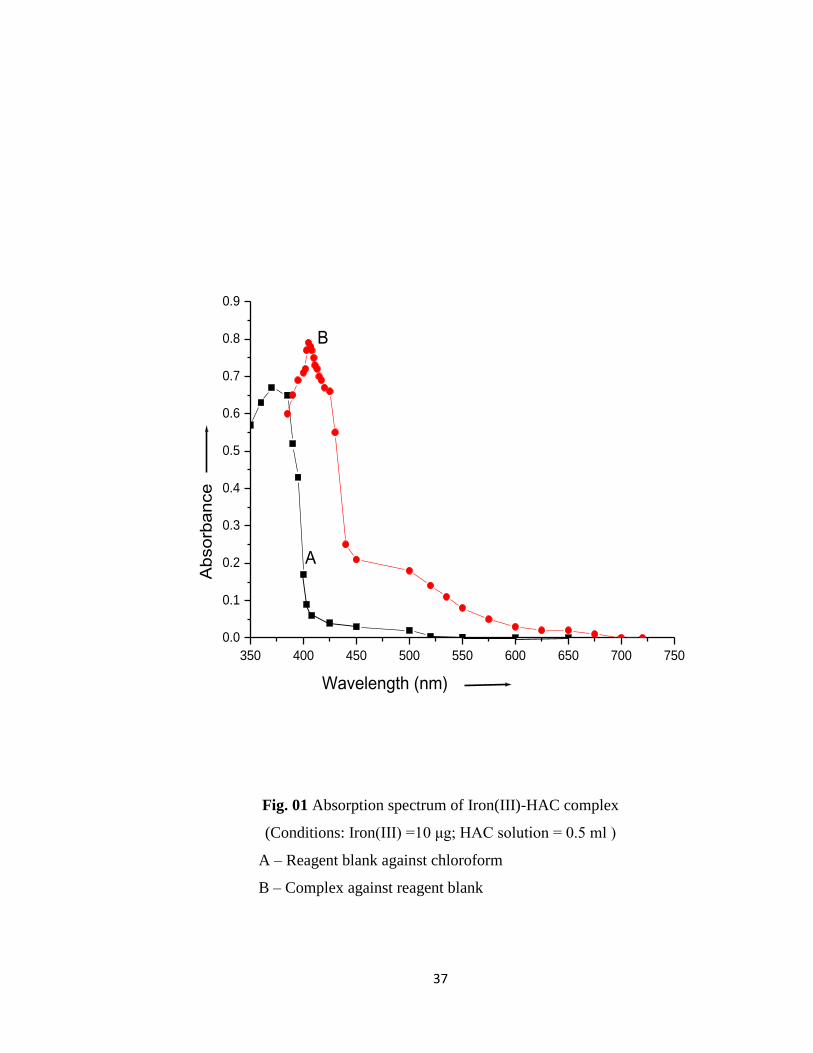
The electronic spectrum of the iron (III)-HAC complex was studied over the
range 375-720 nm which shows one absorption band in the region 405-407 nm (Fig.
01). The complex absorbs strongly at 405 nm, where minimum absorption was shown
by the blank. Therefore, absorbance measurements were made at 405 nm.
37
Fig. 01 Absorption spectrum of Iron(III)-HAC complex
(Conditions: Iron(III) =10 μg; HAC solution = 0.5 ml )
A – Reagent blank against chloroform
B – Complex against reagent blank
350 400 450 500 550 600 650 700 750
0.0
0.1
0.2
0.3
0.4
0.5
0.6
0.7
0.8
0.9
B
A
Absorb
ance
Wavelength (nm)
38
Choice of solvent
The extraction behaviour of the complex in different solvents viz.
Dichloromethane, benzene, chloroform, carbontetrachloride, xylene, n-hexane, iso-
Amyl acetate and iso-Propyl alcohol was studied as shown in Table 3. Among the
solvents tested, dichloromethane, benzene, chloroform, carbon tetrachloride,
xylene were found to extract the complex but little extraction was observed into iso-
amyl acetate and iso-propyl alcohol. Chloroform was chosen as an extractant because
it gave the highest absorbance.
Table 3
Extraction Behaviour of the complex in Different solvents
Solvent Absorbance*
Chloroform 0.73
Dichloromethane 0.70
Carbon tetrachloride 0.69
Benzene 0.65
Xylene 0.39
n-Hexane 0.17
iso-Amyl acetate 0.00
iso-Propyl alcohol 0.00
* Measured against respective blank
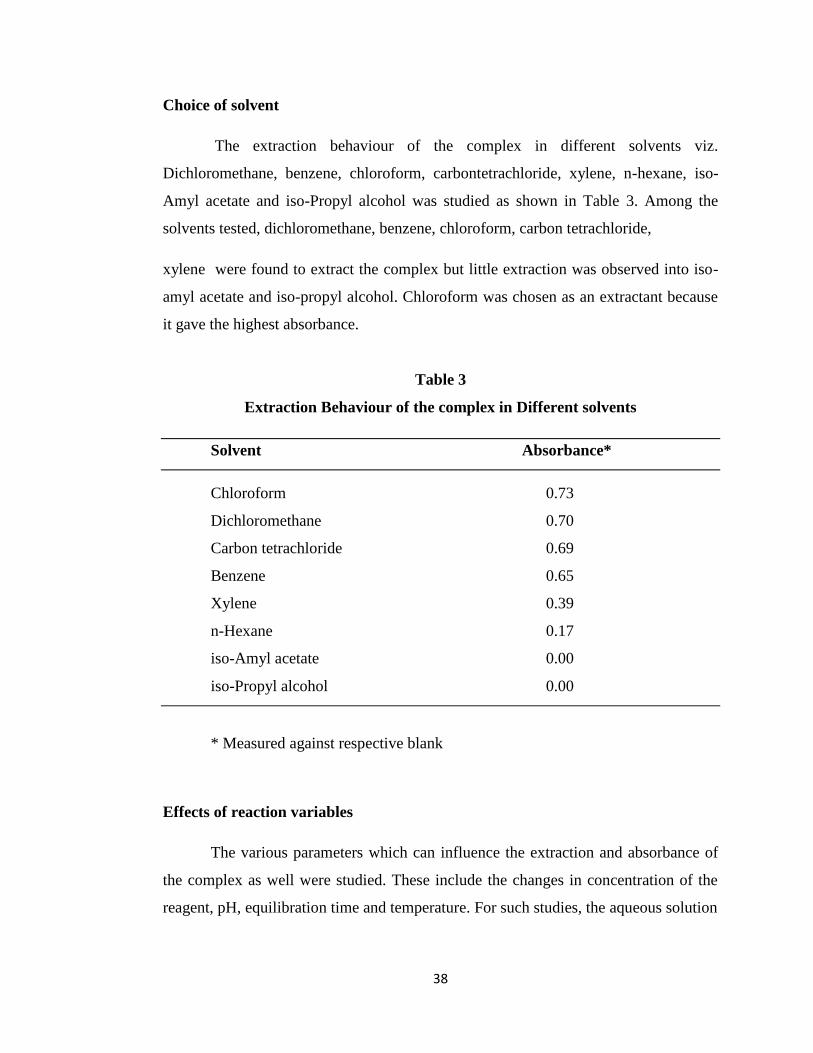
Effects of reaction variables
The various parameters which can influence the extraction and absorbance of
the complex as well were studied. These include the changes in concentration of the
reagent, pH, equilibration time and temperature. For such studies, the aqueous solution
39
Fig. 02 A - Effect of HAC concentration
B - Effect of pH
0.0 0.5 1.0 1.5 2.0
0.2
0.3
0.4
0.5
0.6
0.7
0.80 2 4 6 8 10
0.30
0.35
0.40
0.45
0.50
0.55
0.60
0.65
0.70
0.75
0.80
B
A
B
Ab
so
rba
nce
Ab
so
rba
nce
HAC Concentration (ml)
A
pH
40
Fig.03 Effect of equilibration time
0.2 0.4 0.6 0.8 1.0 1.2 1.4 1.6 1.8 2.0 2.2
0.60
0.62
0.64
0.66
0.68
0.70
0.72
0.74
0.76
0.78
0.80
Ab
so
rba
nce
Equilibration Time (min)
41
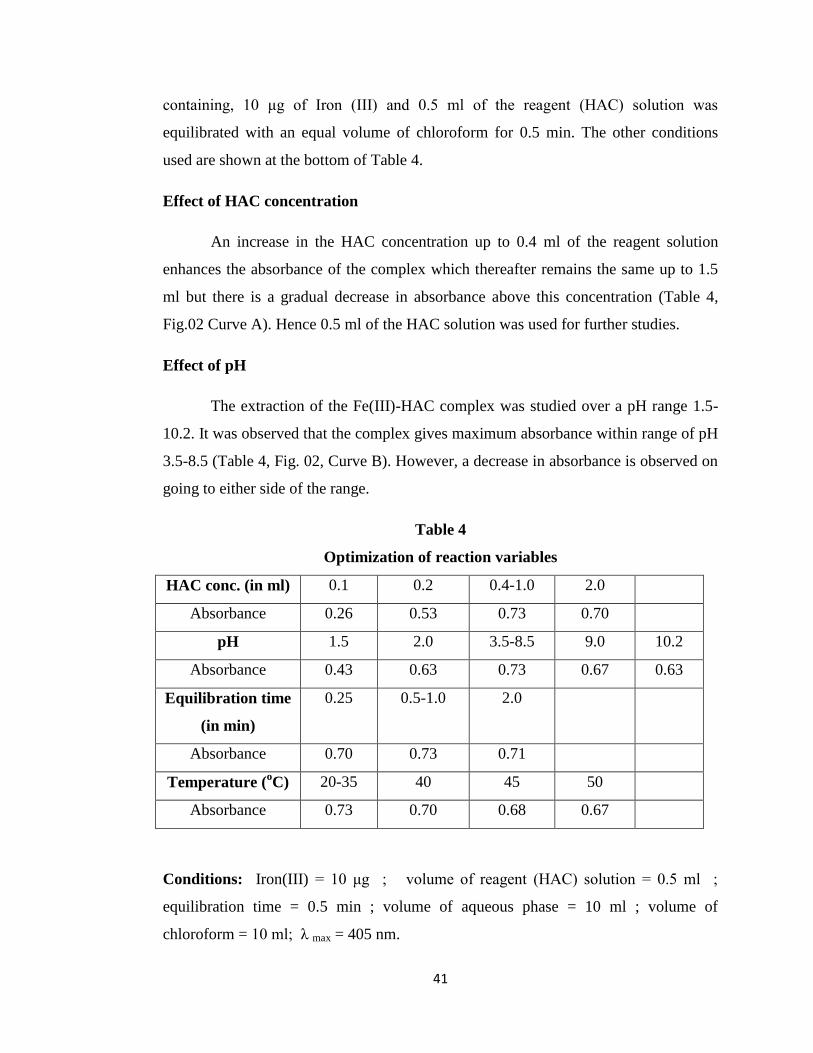
containing, 10 μg of Iron (III) and 0.5 ml of the reagent (HAC) solution was
equilibrated with an equal volume of chloroform for 0.5 min. The other conditions
used are shown at the bottom of Table 4.
Effect of HAC concentration
An increase in the HAC concentration up to 0.4 ml of the reagent solution
enhances the absorbance of the complex which thereafter remains the same up to 1.5
ml but there is a gradual decrease in absorbance above this concentration (Table 4,
Fig.02 Curve A). Hence 0.5 ml of the HAC solution was used for further studies.
Effect of pH
The extraction of the Fe(III)-HAC complex was studied over a pH range 1.5-
10.2. It was observed that the complex gives maximum absorbance within range of pH
3.5-8.5 (Table 4, Fig. 02, Curve B). However, a decrease in absorbance is observed on
going to either side of the range.
Table 4
Optimization of reaction variables
HAC conc. (in ml) 0.1 0.2 0.4-1.0 2.0
Absorbance 0.26 0.53 0.73 0.70
pH 1.5 2.0 3.5-8.5 9.0 10.2
Absorbance 0.43 0.63 0.73 0.67 0.63
Equilibration time
(in min)
0.25 0.5-1.0 2.0
Absorbance 0.70 0.73 0.71
Temperature (oC) 20-35 40 45 50
Absorbance 0.73 0.70 0.68 0.67
Conditions: Iron(III) = 10 μg ; volume of reagent (HAC) solution = 0.5 ml ;
equilibration time = 0.5 min ; volume of aqueous phase = 10 ml ; volume of
chloroform = 10 ml; λ max = 405 nm.

42
Effect of the equilibration time
An increase in the time contact between two phases up to 0.5 min enhances the
extraction as seen by the corresponding by the increase in absorbance of the complex.
It remains constant up to 1 min of equilibration time (Table 4, Fig.03). Thereafter, a
slight decrease in absorbance is observed with the equilibration time of 2 min or more.
Therefore, equilibration time of 0.5 min was chosen.
Effect of temperature
The effect of temperature of aqueous solution was found to have little effect on
the absorbance of the complex over the range 20-350C (Table 4). Further increase in
temperature of the aqueous phase causes a gradual decrease in the absorbance of the
complex.
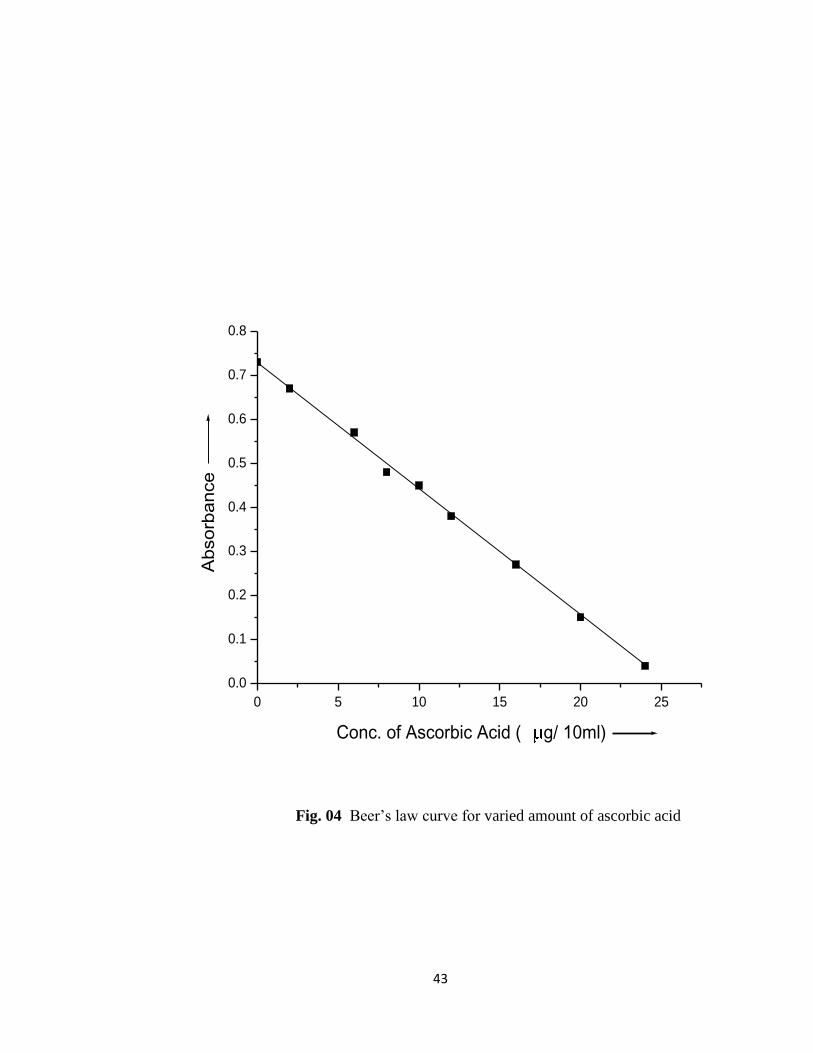
Beer’s law
Under the optimum conditions, a standard calibration curve was constructed at
405 nm by adding different amount of ascorbic acid to iron(III) solution. A linear
relationship between absorbance and concentration of the analyte was observed up to
2.4 μg ml-1
of ascorbic acid (Table 5, Fig. 04).
Table 5
Absorbance Values at Different Concentration of Ascorbic Acid
Amount of ascorbic acid (µg/ 10ml) Absorbance
0 0.73
2 0.67
6 0.57
8 0.48
10 0.45
12 0.38
16 0.27
20 0.15
24 0.04
43
Fig. 04 Beer‟s law curve for varied amount of ascorbic acid
0 5 10 15 20 25
0.0
0.1
0.2
0.3
0.4
0.5
0.6
0.7
0.8
Ab
so
rban
ce
Conc. of Ascorbic Acid ( g/ 10ml)
44
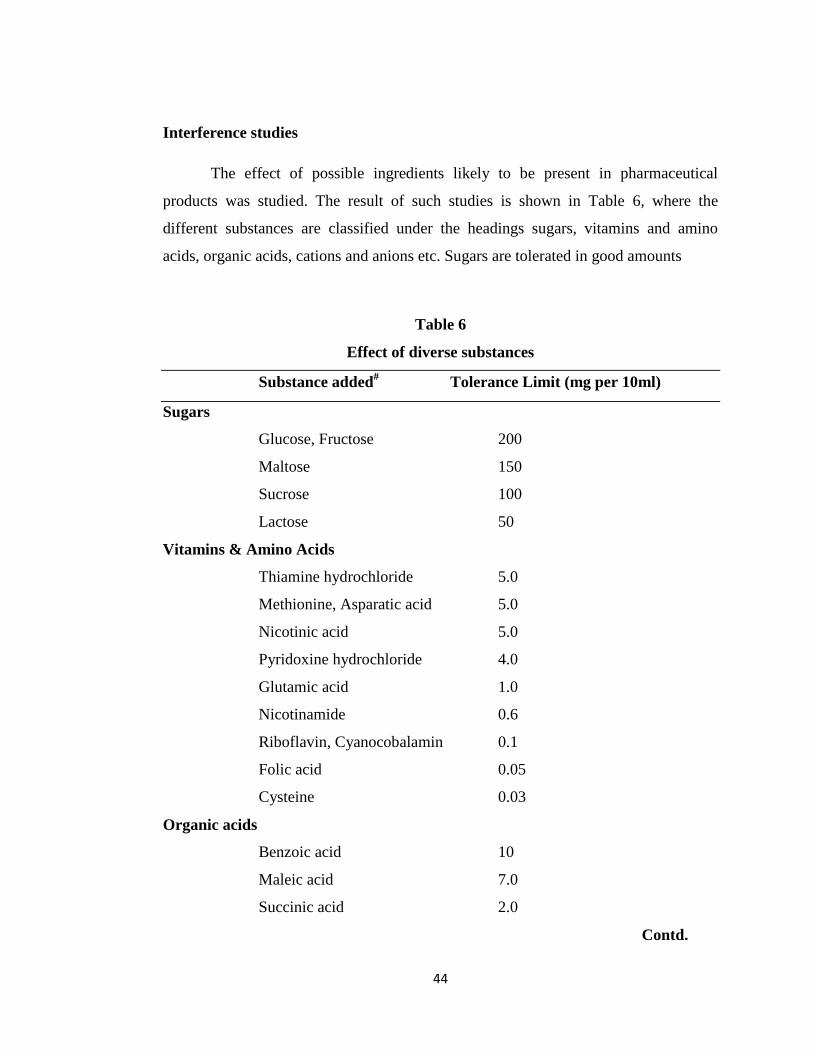
Interference studies
The effect of possible ingredients likely to be present in pharmaceutical
products was studied. The result of such studies is shown in Table 6, where the
different substances are classified under the headings sugars, vitamins and amino
acids, organic acids, cations and anions etc. Sugars are tolerated in good amounts
Table 6
Effect of diverse substances
Substance added# Tolerance Limit (mg per 10ml)
Sugars
Glucose, Fructose 200
Maltose 150
Sucrose 100
Lactose 50
Vitamins & Amino Acids
Thiamine hydrochloride 5.0
Methionine, Asparatic acid 5.0
Nicotinic acid 5.0
Pyridoxine hydrochloride 4.0
Glutamic acid 1.0
Nicotinamide 0.6
Riboflavin, Cyanocobalamin 0.1
Folic acid 0.05
Cysteine 0.03
Organic acids
Benzoic acid 10
Maleic acid 7.0
Succinic acid 2.0
Contd.
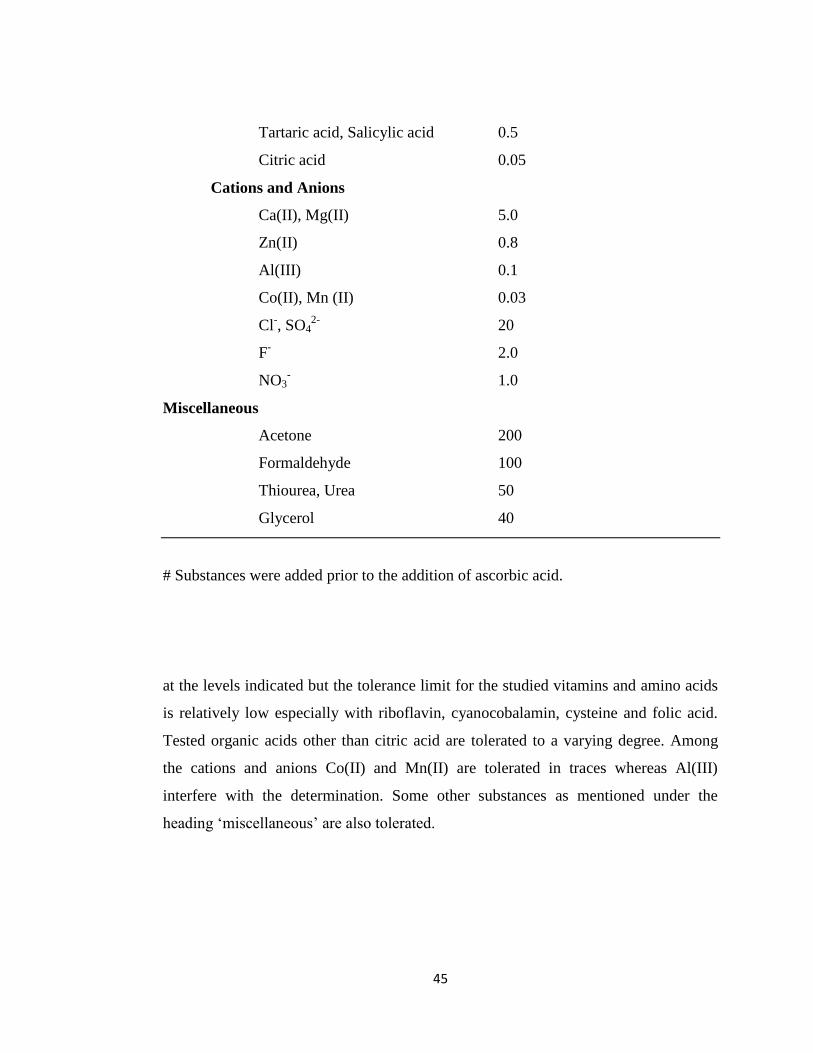
45
Tartaric acid, Salicylic acid 0.5
Citric acid 0.05
Cations and Anions
Ca(II), Mg(II) 5.0
Zn(II) 0.8
Al(III) 0.1
Co(II), Mn (II) 0.03
Cl-, SO4
2- 20
F-
2.0
NO3- 1.0
Miscellaneous
Acetone 200
Formaldehyde 100
Thiourea, Urea 50
Glycerol 40
# Substances were added prior to the addition of ascorbic acid.
at the levels indicated but the tolerance limit for the studied vitamins and amino acids
is relatively low especially with riboflavin, cyanocobalamin, cysteine and folic acid.
Tested organic acids other than citric acid are tolerated to a varying degree. Among
the cations and anions Co(II) and Mn(II) are tolerated in traces whereas Al(III)
interfere with the determination. Some other substances as mentioned under the
heading „miscellaneous‟ are also tolerated.
46
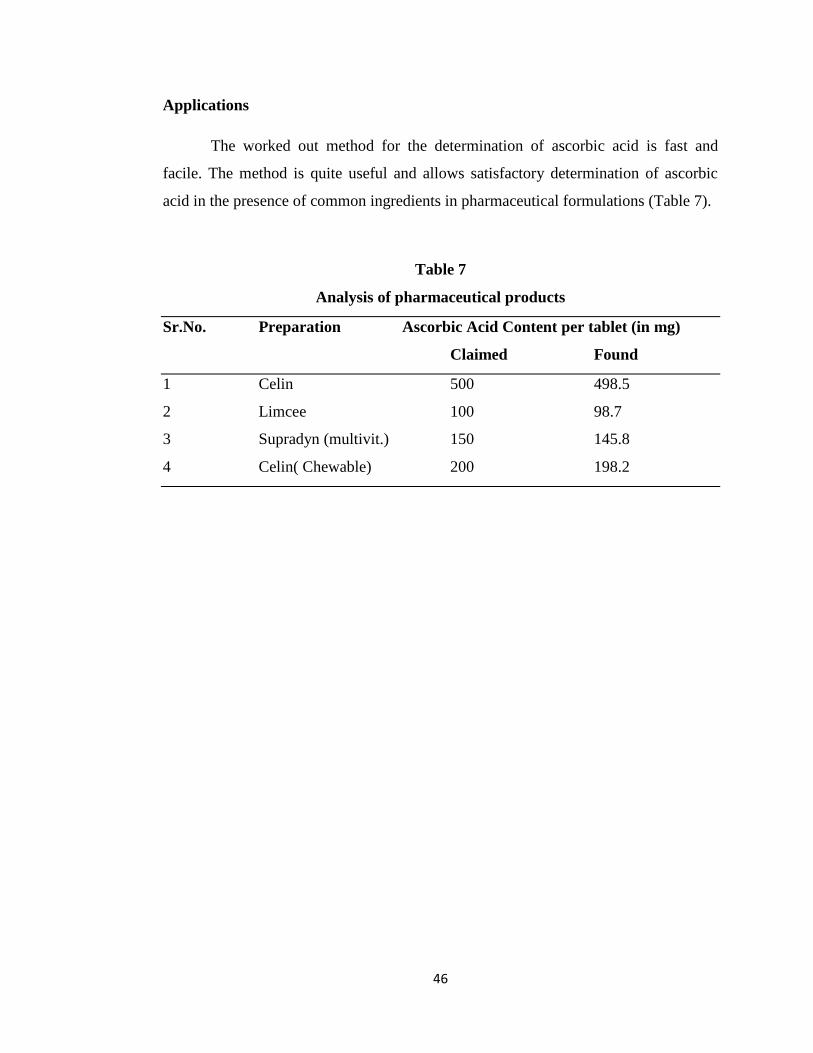
Applications
The worked out method for the determination of ascorbic acid is fast and
facile. The method is quite useful and allows satisfactory determination of ascorbic
acid in the presence of common ingredients in pharmaceutical formulations (Table 7).
Table 7
Analysis of pharmaceutical products
Sr.No. Preparation Ascorbic Acid Content per tablet (in mg)
Claimed Found
1 Celin 500 498.5
2 Limcee 100 98.7
3 Supradyn (multivit.) 150 145.8
4 Celin( Chewable) 200 198.2
47
2.1.3 Abstract
A rapid spectrophotometric method for
the determination of ascorbic acid is described.
It involves the reduction of iron(III) to iron(II)
with ascorbic acid and the formation of brown
coloured complex by the reaction of iron(III)
with 3-Hydroxy-2-aryl-4H-chromen-4-one,
followed by the extraction of the complex into
chloroform and measuring the absorbance at
405 nm. The Beer’s law is obeyed up to 2.4 µg ml-
1 of ascorbic acid having molar absorptivity and
Sandell’s sensitivity of 5.897 x 10⁵ l mol-1 cm-1 and
2.986 x 10⁻⁴ µg cm-2 respectively. The interference
of various substances commonly added to
pharmaceuticals were studied. The procedure
has been applied to the assay of pharmaceutical
preparations containing vitamin C.
48
2.2 Spectrophotometric determination of vitamin C using 3-
Hydroxy-2-(3-methyl thiophen-2-yl)-4H-chromen-4-one as a
reagent
Ascorbic acid commonly known as vitamin C, is an important water soluble
vitamin. Humans and apes cannot synthesize ascorbic acid due to lack of
gulonolactone oxidase enzyme and hence ascorbic acid has to be supplemented from
external sources, mainly through vegetables, fruits and pharmaceutical products.
Vitamin C is one of the most essential vitamin for both pharmaceutical and food
processing industries in view of its nutritional significance, varied use in food products
and its daily dose requirement for optimum health.
A large number of methods for determination of ascorbic acid include
titrimetry22-29
, voltametry116-120
, amperometry128-132
, potentiometry136-141
,
chemilumescence69-81
and flow injection154, 227, 228
analysis. These methods have been
used to increase the analytical sensitivity for ascorbic acid and some of them are
automated, but specialized equipments are required for these procedures. Besides,
spectrophotometric methods are commonly used for the determination of ascorbic
acid. Many reagents such as; fast red186,187
, leucomalachite green189
, rhodamine B90-92
and methyl viologen188
etc.to mention a few, are used in the determination of ascorbic
acid.
A simple and sensitive analytical method is required for the analysis of a
variety of samples. The method using 3-hydroxy-2-(3-methyl thiophen-2-yl)-4H-
chromen-4-one (HMTC) is described which meets such requisite characteristics of a
photometric method. The proposed method is based on the proportionate decrease in
the colour intensity of iron (III)-HMTC complex by the addition of ascorbic acid
followed by its extraction into chloroform.
49
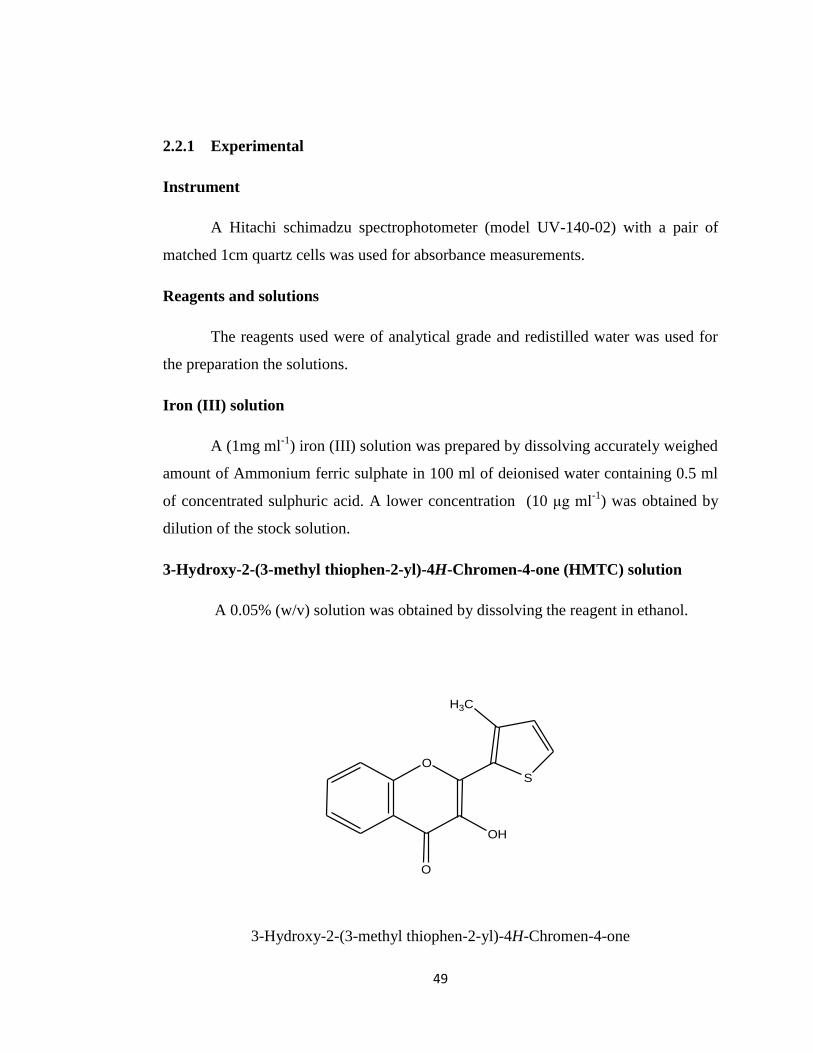
2.2.1 Experimental
Instrument
A Hitachi schimadzu spectrophotometer (model UV-140-02) with a pair of
matched 1cm quartz cells was used for absorbance measurements.
Reagents and solutions
The reagents used were of analytical grade and redistilled water was used for
the preparation the solutions.
Iron (III) solution
A (1mg ml-1
) iron (III) solution was prepared by dissolving accurately weighed
amount of Ammonium ferric sulphate in 100 ml of deionised water containing 0.5 ml
of concentrated sulphuric acid. A lower concentration (10 μg ml-1
) was obtained by
dilution of the stock solution.
3-Hydroxy-2-(3-methyl thiophen-2-yl)-4H-Chromen-4-one (HMTC) solution
A 0.05% (w/v) solution was obtained by dissolving the reagent in ethanol.
O
O
S
H3C
OH
3-Hydroxy-2-(3-methyl thiophen-2-yl)-4H-Chromen-4-one
50
Ascorbic acid solution
A fresh aqueous solution of ascorbic acid (100 μg ml-1
) was used. A lower
concentration (10 μg ml-1
) was obtained by dilution of the stock solution.
Procedure
In a 100 ml seperatory funnel, 10 μg of iron (III) solution was taken followed
by addition of an aliquot of ascorbic acid and 0.5 ml of HMTC solution. Enough water
was added to make the aqueous phase to 10 ml. The brown colored complex so
formed was extracted for one min with 10 ml of chloroform. The colored extract was
taken into a 10 ml volumetric flask and the volume was made up to the mark with
chloroform, if required. The absorbance of the reddish brown complex was measured
at 415 nm against the reagent blank prepared similarly. The contents of ascorbic acid
were calculated from the standard calibration curve prepared by taking different
concentration of ascorbic acid.
Analysis of pharmaceutical products
An accurately weighed amount of the powder, obtained by crushing 5-10
tablets and equivalent to 10 mg ascorbic acid was transferred to a 100 ml volumetric
flask. After dissolving the powder, the volume was made up to the mark with
deionized water. The working solution (10 μg ml-1
) was obtained by dilution of the
stock solution. An aliquot of this solution was analysed for ascorbic acid contents by
the recommended procedure.
2.2.2 Results and discussion
Spectral Characteristics
During preliminary investigation it was observed that the color intensity of
iron(III)–HMTC complex diminishes with the increase in the amount of ascorbic acid.
This fact was exploited in the development of the proposed method. The complex gets

51
Fig.05 Absorption spectrum of Iron(III)-HMTC complex in chloroform.
(Conditions: Fe(III) =10 μg; HMTC solution = 0.5 ml )
A– Reagent blank against chloroform
B – Complex against reagent blank
400 450 500 550 600 650 700
0.0
0.1
0.2
0.3
0.4
0.5
0.6
0.7
0.8
B
A
Ab
so
rban
ce
Wavelength (nm)
52
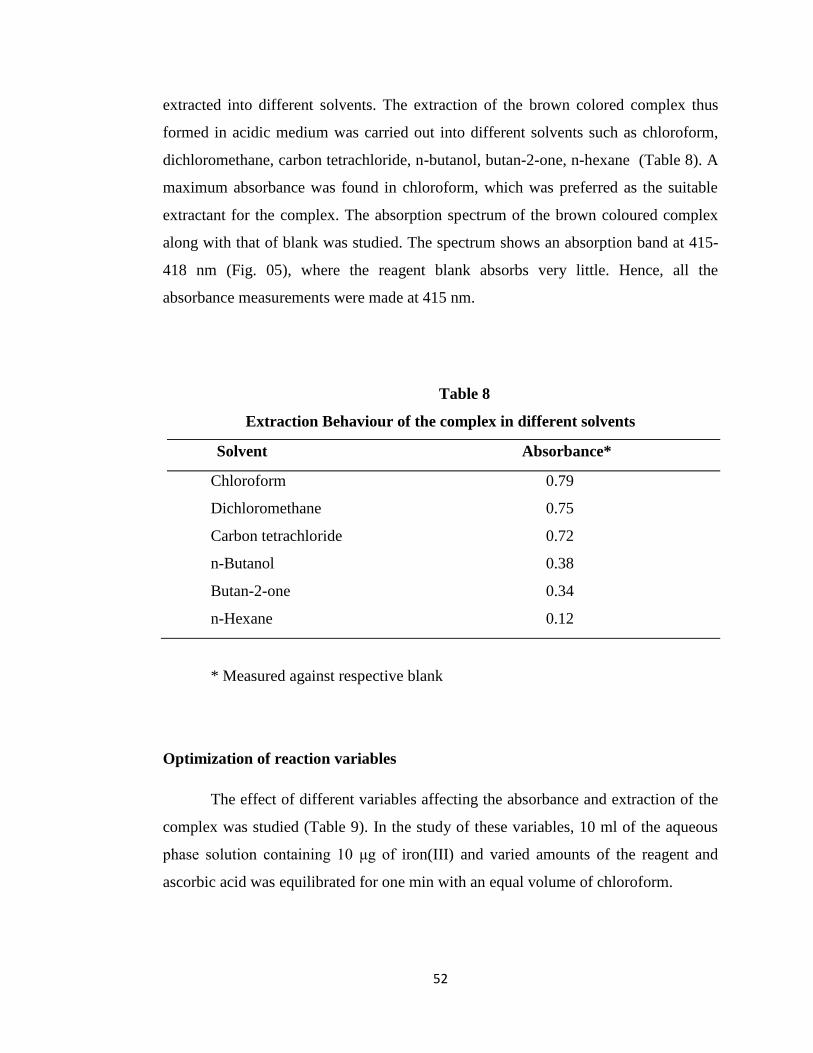
extracted into different solvents. The extraction of the brown colored complex thus
formed in acidic medium was carried out into different solvents such as chloroform,
dichloromethane, carbon tetrachloride, n-butanol, butan-2-one, n-hexane (Table 8). A
maximum absorbance was found in chloroform, which was preferred as the suitable
extractant for the complex. The absorption spectrum of the brown coloured complex
along with that of blank was studied. The spectrum shows an absorption band at 415-
418 nm (Fig. 05), where the reagent blank absorbs very little. Hence, all the
absorbance measurements were made at 415 nm.
Table 8
Extraction Behaviour of the complex in different solvents
Solvent Absorbance*
Chloroform 0.79
Dichloromethane 0.75
Carbon tetrachloride 0.72
n-Butanol 0.38
Butan-2-one 0.34
n-Hexane 0.12
* Measured against respective blank
Optimization of reaction variables
The effect of different variables affecting the absorbance and extraction of the
complex was studied (Table 9). In the study of these variables, 10 ml of the aqueous
phase solution containing 10 μg of iron(III) and varied amounts of the reagent and
ascorbic acid was equilibrated for one min with an equal volume of chloroform.
53
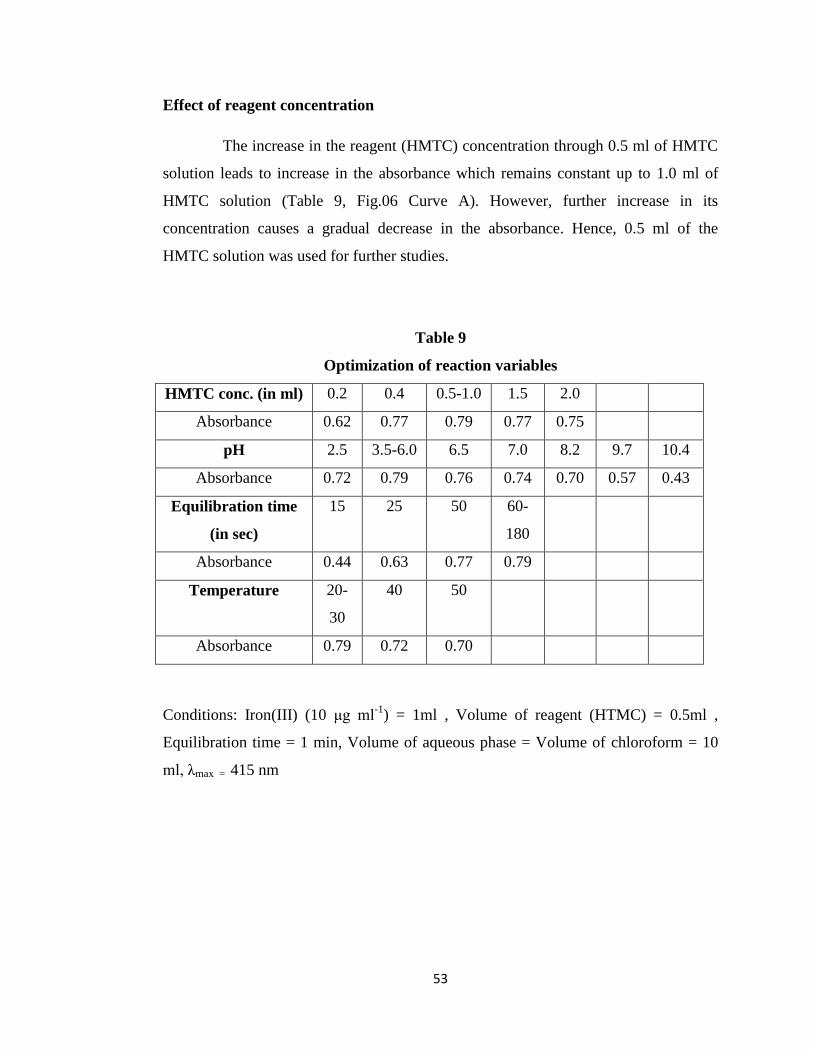
Effect of reagent concentration
The increase in the reagent (HMTC) concentration through 0.5 ml of HMTC
solution leads to increase in the absorbance which remains constant up to 1.0 ml of
HMTC solution (Table 9, Fig.06 Curve A). However, further increase in its
concentration causes a gradual decrease in the absorbance. Hence, 0.5 ml of the
HMTC solution was used for further studies.
Table 9
Optimization of reaction variables
HMTC conc. (in ml) 0.2 0.4 0.5-1.0 1.5 2.0
Absorbance 0.62 0.77 0.79 0.77 0.75
pH 2.5 3.5-6.0 6.5 7.0 8.2 9.7 10.4
Absorbance 0.72 0.79 0.76 0.74 0.70 0.57 0.43
Equilibration time
(in sec)
15 25 50 60-
180
Absorbance 0.44 0.63 0.77 0.79
Temperature 20-
30
40 50
Absorbance 0.79 0.72 0.70
Conditions: Iron(III) (10 μg ml-1
) = 1ml , Volume of reagent (HTMC) = 0.5ml ,
Equilibration time = 1 min, Volume of aqueous phase = Volume of chloroform = 10
ml, λmax = 415 nm

54
Fig.06 A-Effect of HMTC concentration
B-Effect of pH
0.0 0.2 0.4 0.6 0.8 1.0 1.2 1.4 1.6
0.60
0.62
0.64
0.66
0.68
0.70
0.72
0.74
0.76
0.78
0.80
0 2 4 6 8 10 12
0.40
0.45
0.50
0.55
0.60
0.65
0.70
0.75
0.80
BA
Absorb
ance
Absorb
ance
HMTC Conc. (ml)
B
A
pH

55
Fig.07 Effect of Equilibration Time
0 20 40 60 80 100 120 140 160 180 200
0.40
0.45
0.50
0.55
0.60
0.65
0.70
0.75
0.80
Ab
so
rba
nce
Equilibration Time (sec)
56
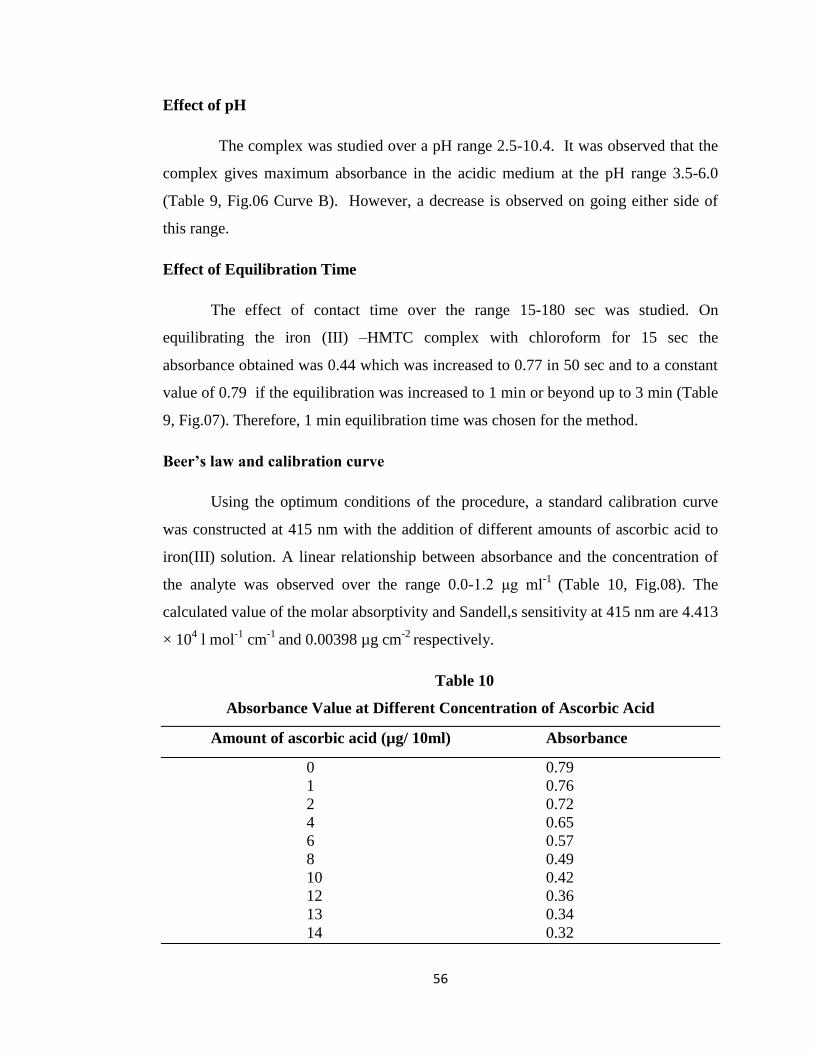
Effect of pH
The complex was studied over a pH range 2.5-10.4. It was observed that the
complex gives maximum absorbance in the acidic medium at the pH range 3.5-6.0
(Table 9, Fig.06 Curve B). However, a decrease is observed on going either side of
this range.
Effect of Equilibration Time
The effect of contact time over the range 15-180 sec was studied. On
equilibrating the iron (III) –HMTC complex with chloroform for 15 sec the
absorbance obtained was 0.44 which was increased to 0.77 in 50 sec and to a constant
value of 0.79 if the equilibration was increased to 1 min or beyond up to 3 min (Table
9, Fig.07). Therefore, 1 min equilibration time was chosen for the method.
Beer’s law and calibration curve
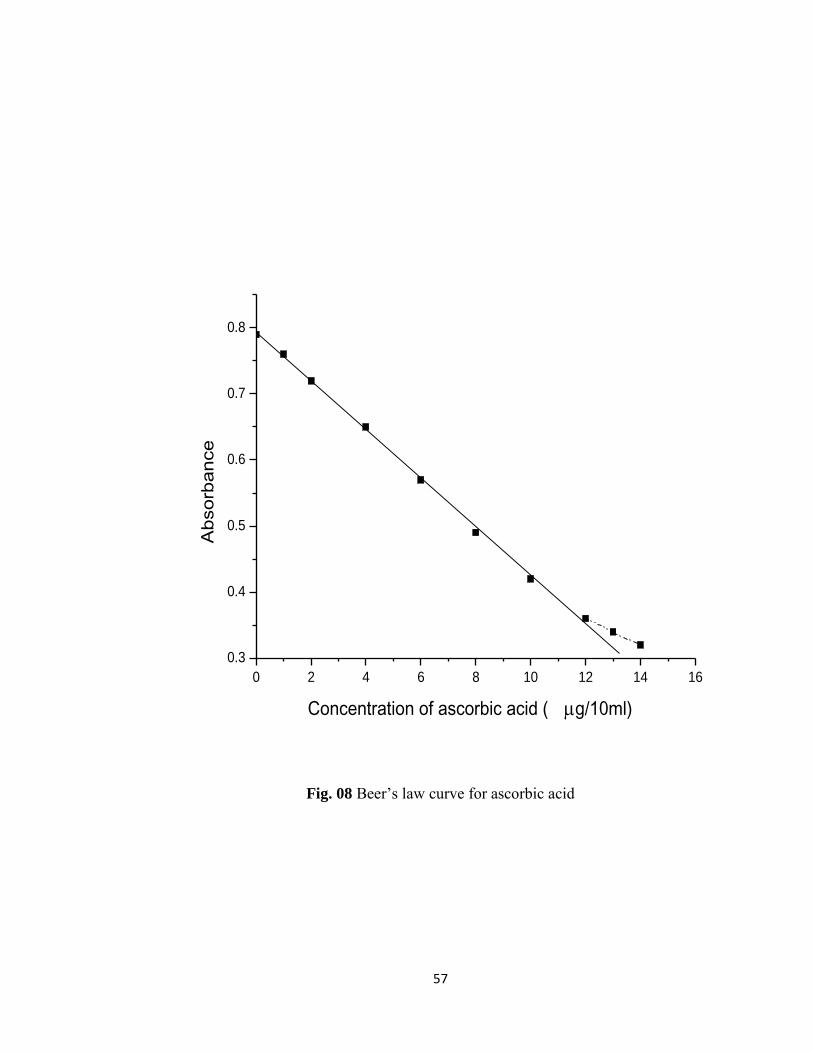
Using the optimum conditions of the procedure, a standard calibration curve
was constructed at 415 nm with the addition of different amounts of ascorbic acid to
iron(III) solution. A linear relationship between absorbance and the concentration of
the analyte was observed over the range 0.0-1.2 μg ml-1
(Table 10, Fig.08). The
calculated value of the molar absorptivity and Sandell,s sensitivity at 415 nm are 4.413
× 104 l mol
-1 cm
-1 and 0.00398 µg cm
-2 respectively.
Table 10
Absorbance Value at Different Concentration of Ascorbic Acid
Amount of ascorbic acid (µg/ 10ml) Absorbance
0 0.79
1 0.76
2 0.72
4 0.65
6 0.57
8 0.49
10 0.42
12 0.36
13 0.34
14 0.32
57
Fig. 08 Beer‟s law curve for ascorbic acid
0 2 4 6 8 10 12 14 16
0.3
0.4
0.5
0.6
0.7
0.8
Absorb
ance
Concentration of ascorbic acid ( g/10ml)
58
Interference studies
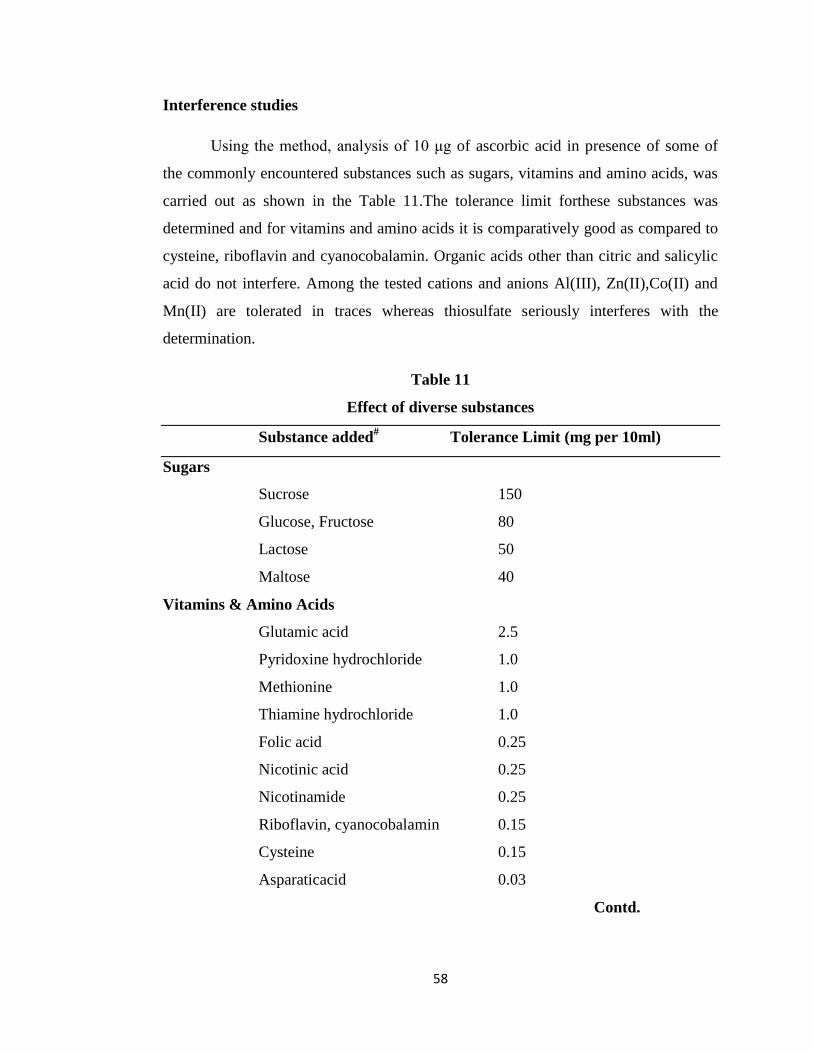
Using the method, analysis of 10 μg of ascorbic acid in presence of some of
the commonly encountered substances such as sugars, vitamins and amino acids, was
carried out as shown in the Table 11.The tolerance limit forthese substances was
determined and for vitamins and amino acids it is comparatively good as compared to
cysteine, riboflavin and cyanocobalamin. Organic acids other than citric and salicylic
acid do not interfere. Among the tested cations and anions Al(III), Zn(II),Co(II) and
Mn(II) are tolerated in traces whereas thiosulfate seriously interferes with the
determination.
Table 11
Effect of diverse substances
Substance added# Tolerance Limit (mg per 10ml)
Sugars
Sucrose 150
Glucose, Fructose 80
Lactose 50
Maltose 40
Vitamins & Amino Acids
Glutamic acid 2.5
Pyridoxine hydrochloride 1.0
Methionine 1.0
Thiamine hydrochloride 1.0
Folic acid 0.25
Nicotinic acid 0.25
Nicotinamide 0.25
Riboflavin, cyanocobalamin 0.15
Cysteine 0.15
Asparaticacid 0.03
Contd.
59
Organic acids
Benzoic acid 20
Succinic acid 8.0
Maleic acid 3.0
Tartaric acid 1.5
Salicylic acid 0.4
Citric acid 0.1
Cations and Anions
Ca(II),Mg(II) 5.0
Zn(II), Al(III) 0.6
Co(II) , Mn (II) 0.03
Cl-, SO4
2- 80
F-
1.0
Miscellaneous
Formaldehyde 200
Glycerol 100
Thiourea, Urea 80
Starch 30
# Substances were added prior to the addition of ascorbic acid.
Applications
The method proposed for determination of ascorbic acid is quite simple and
sensitive. Most of the substances commonly found in pharmaceutical products were
found to be tolerated to a varying degree. The procedure is free from the various
interfering substances including sugars, amino acids and other additives. The method
is quite simple and rapid as it takes only 3-4 min for determination of ascorbic acid

60
after the preparation of sample solution. The method can be compared favourably with
the existing spectrophotometric methods. Some of the common pharmaceutical
preparations were successfully analysed by the proposed method as shown in the
Table 12.
Table 12
Analysis of pharmaceutical products
Sr. No. Preparation Ascorbic Acid Content per tablet (in mg)
Claimed Found
1 Celin 500 501.5
2 Limcee 100 100.5
3 Supradyn 150 149.5
4 Sym-o-vit 75 74.7

61
2.2.3 Abstract
The proposed method for ascorbic acid
determination is based on the extraction of a
Fe(III)- 3-hydroxy-2-(3-methyl thiophen-2-yl)-
chromen-4-one (HMTC) complex in acidic
medium (pH 3.5-6.0), where the absorbance of
the formed Fe(III)-HMTC chelate is measured at
415 nm after extraction with chloroform. The
absorbance of the complex gets decreased with
the increasing amount of ascorbic acid. The
proportionate decrease in absorbance forms the
basis of the proposed procedure and the molar
absorptivity and Sandell’s sensitivity for
vitamin C is found to be 4.413 × 10⁴ l mol-1 cm-1
and 0.oo398 µg cm-2. Beer’s law is obeyed up to
1.2 μg ml-1 of ascorbic acid. The method has been
successfully applied to determination of ascorbic
acid in the pure state, dosage forms and
multivitamin formulations.

62
2.3 Spectrophotometric determination of vitamin C in
pharmaceuticals using Iron(III)-6-Chloro-3-hydroxy-2(4-
methoxyphenyl)-4H-chromen-4-one complex
A number of methods based on instruments67,80,128-130,142
, titrations30-32
or color
formation reactions254-256
are available in the literature for the determination of vitamin C.
Instrument- based methods are reported but a specialized and expensive equipment is
needed for these procedures. Titrimetric methods are suggested for ascorbic acid assay,
but such methods in general, lose their applicability to colored solutions due to the
interference from other reducing substances.
The purpose of the present work was to develop a simple and rapid method for the
determination of ascorbic acid. The proportionate decrease observed in the color intensity
of iron(III)-6-Chloro-3-hydroxy-2(4-methoxyphenyl)-4H-chromen-4-one (CHMC)
complex by the addition of ascorbic acid and its extraction into dichloromethane forms
the basis of the proposed method.
2.3.1 Experimental
Instrument
A Systronics spectrophotometer (model 166) with a pair of matched 1cm
quartz cells was used for measurement of absorbance.
Reagents and solutions
All reagents were of analytical grade, and double distilled water was used for
preparing solutions.

63
Iron (III) solution
A (1mg ml-1
) iron (III) solution was prepared by dissolving accurately weighed
amount of Ammonium ferric sulphate in 100 ml of deionised water containing 0.5 ml
of concentrated sulphuric acid. A lower concentration (100 μg ml-1
) was obtained by
appropriate dilution of the stock solution.
6-Chloro-3-hydroxy-2(4-methoxyphenyl)-4H-chromen-4-one (CHMC) solution
A 0.05% (w/v) solution of reagent was prepared by dissolving the reagent in
ethanol.
O
O
OH
OCH3
Cl
6-Chloro-3-hydroxy-2(4-methoxyphenyl)-4H-chromen-4-one (CHMC)
Ascorbic acid
Ascorbic acid solution 20 μg ml-1
was obtained by dilution of the freshly
prepared concentrated solution.
Procedure
Into a 100 ml separatory funnel, 50 μg of iron (III) solution and an aliquot of
ascorbic acid were added. After mixing the contents, 1 ml of CHMC solution was
added. The volume was made to 10 ml with water. The colored complex was extracted
64
for 1 min into 10 ml of dichloromethane. The extract was then transfered to a 10 ml
volumetric flask and its volume was made up with dichloromethane. The absorbance
of the brown complex was measured at 405nm against the reagent blank prepared
similarly. The amount of the ascorbic acid was calculated from the standard
calibration curve prepared by taking different amounts of ascorbic acid up to 8.0 μg
ml-1
and using the conditions of the procedure.
Determination of Ascorbic acid in pharmaceuticals
A known number of vitamin C tablets or capsules (5-7 items) were ground to
the powder form. An accurately weighed amount equivalent to 100 mg of ascorbic
acid was dissolved in deionized water. The solution was filtered and the filterate was
transferred to 100 ml volumetric flask. The volume was made up to the mark with
water. A lower concentration (100 μg ml-1
) was obtained by suitable dilution of this
solution. The diluted solution was analysed by the recommended procedure.
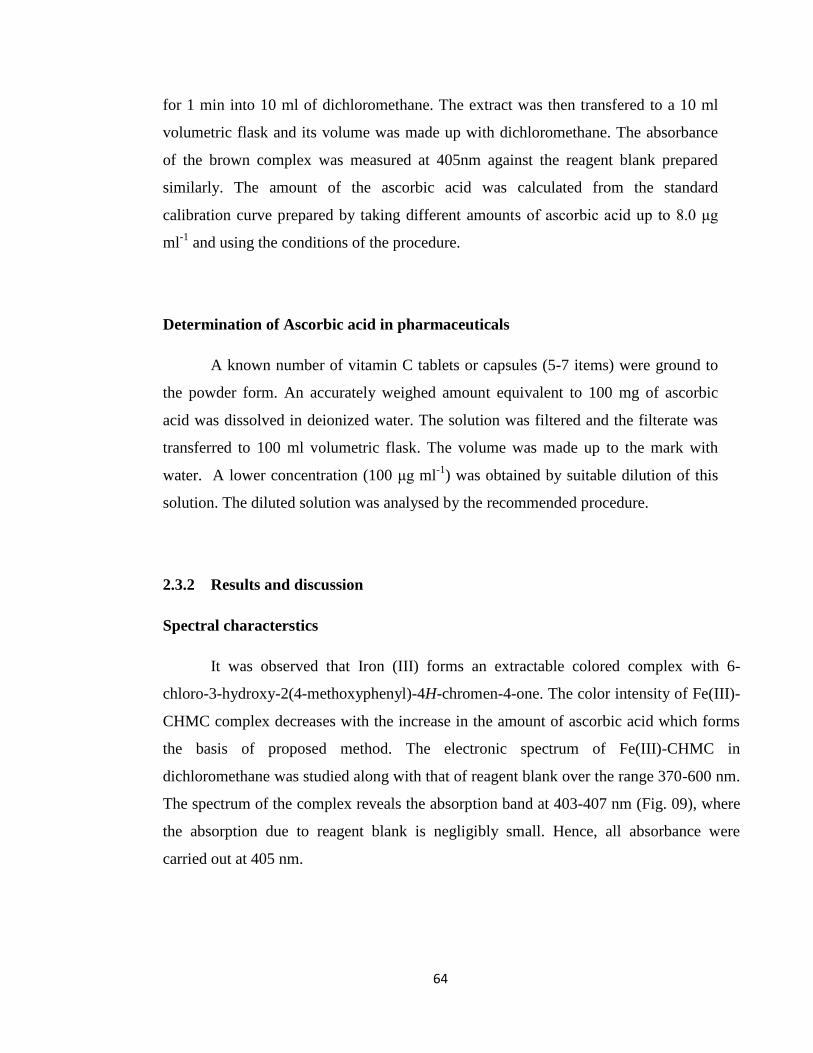
2.3.2 Results and discussion
Spectral characterstics
It was observed that Iron (III) forms an extractable colored complex with 6-
chloro-3-hydroxy-2(4-methoxyphenyl)-4H-chromen-4-one. The color intensity of Fe(III)-
CHMC complex decreases with the increase in the amount of ascorbic acid which forms
the basis of proposed method. The electronic spectrum of Fe(III)-CHMC in
dichloromethane was studied along with that of reagent blank over the range 370-600 nm.
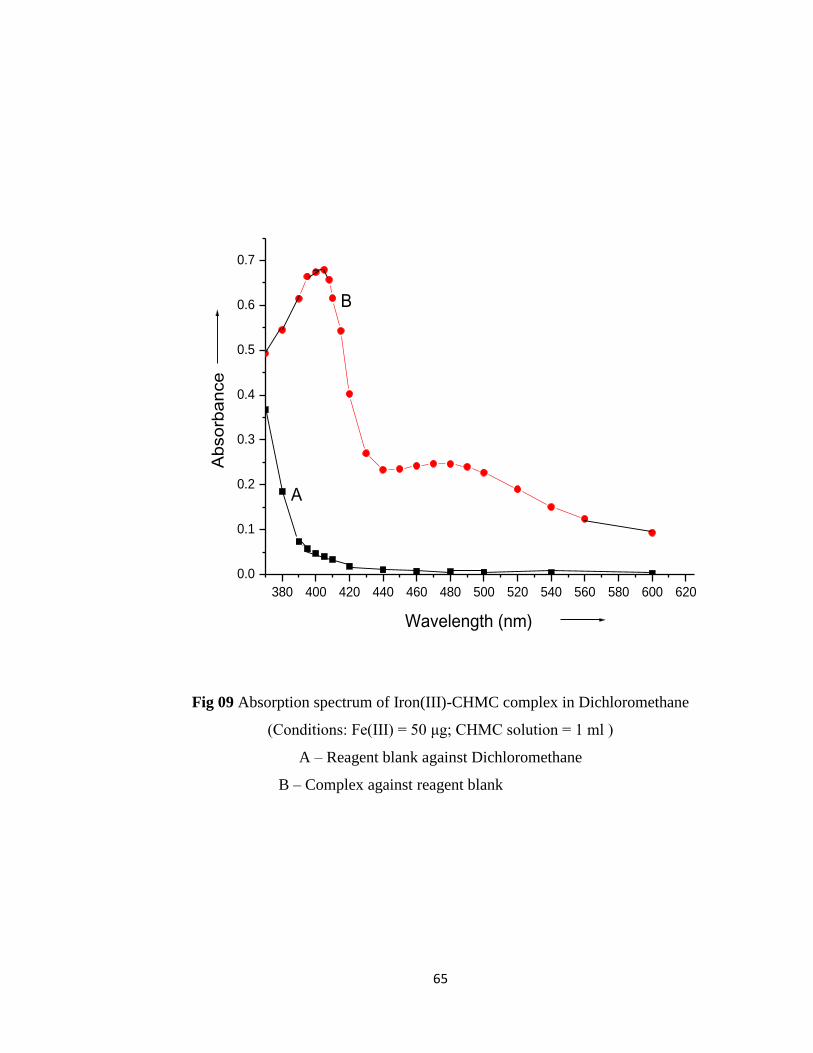
The spectrum of the complex reveals the absorption band at 403-407 nm (Fig. 09), where
the absorption due to reagent blank is negligibly small. Hence, all absorbance were
carried out at 405 nm.
65
Fig 09 Absorption spectrum of Iron(III)-CHMC complex in Dichloromethane
(Conditions: Fe(III) = 50 μg; CHMC solution = 1 ml )
A – Reagent blank against Dichloromethane
B – Complex against reagent blank
380 400 420 440 460 480 500 520 540 560 580 600 620
0.0
0.1
0.2
0.3
0.4
0.5
0.6
0.7
A
B
Absorb
ance
Wavelength (nm)

66
Choice of extractant
The extraction of complex was studied in to different solvents including
dichlorometane, chloroform, carbontetrachloride, benzene, xylene, iso-Amylalcohol and
n-hexane as studied (Table 13). The colored complex gets extracted in to dichlorometane,
chloroform, carbon tetrachloride and benzene. However, iso-Amyl acetate and n-hexane
were found to extract the complex incompletely. Among these solvents, dichloromethane
was found to have maximum absorbance value, so chosen for the further studies.
Table 13
Extraction Behaviour of the complex in Different solvents
Solvent Absorbance*
Dichloromethane 0.679
Chloroform 0.663
Carbon tetrachloride 0.637
Benzene 0.443
Iso-Amyl alcohol 0.174
n-Hexane 0.078
* Measured against respective blank
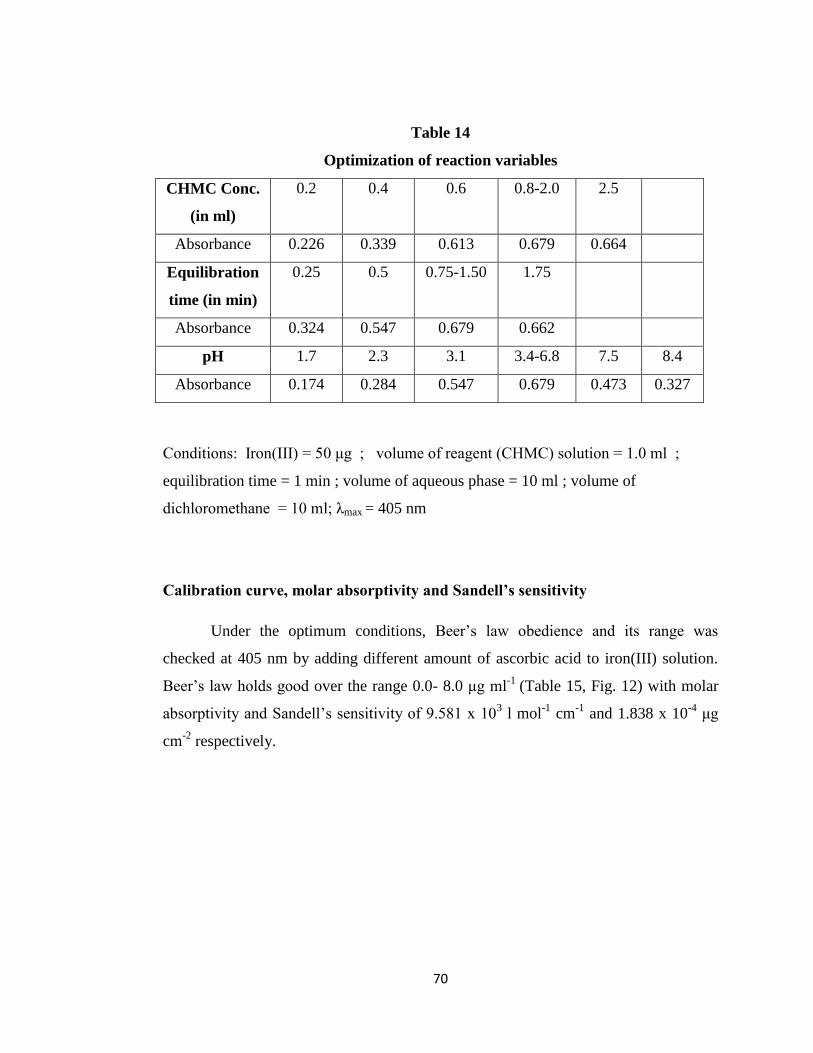
Optimization of reaction variables
The parameters which influence the absorbance of the complex were studied as
shown in the Table 14. In the study of each parameter, 10 ml of the aqueous phase
containing 50 μg of Iron(III) was equilibrated with an equal volume of
dichloromethane. The other conditions used therein are indicated in Table 14.

67
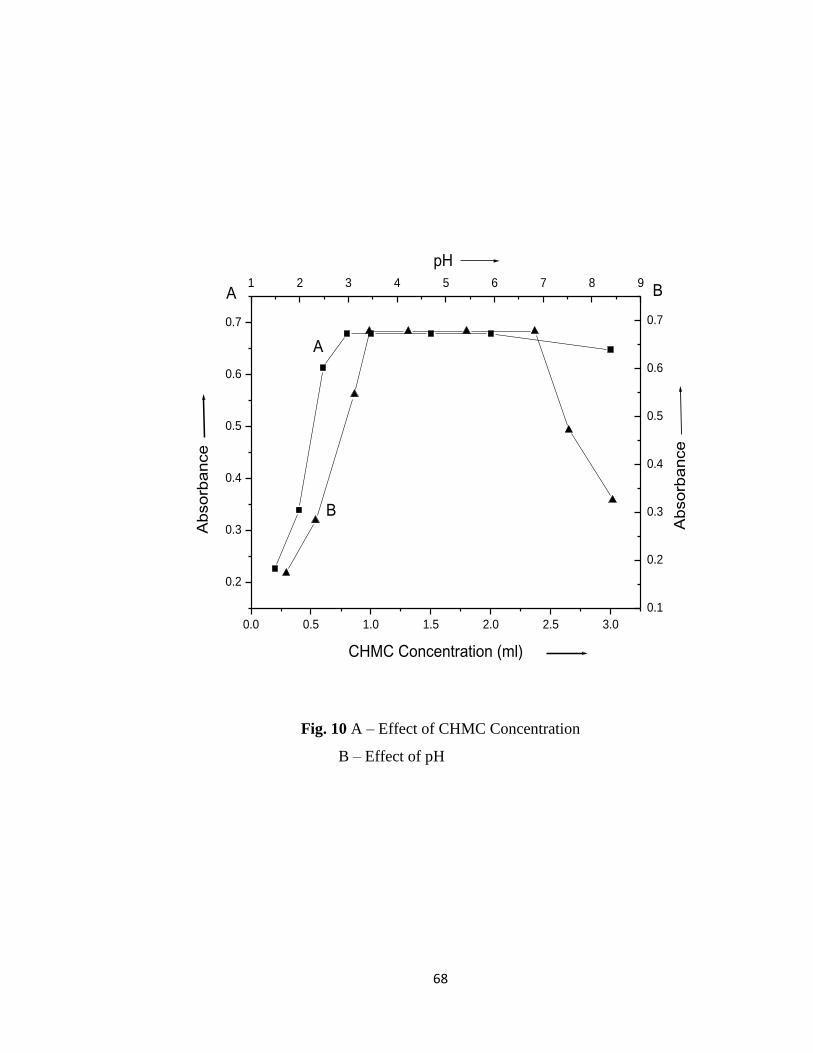
Effect of the reagent (CHMC) concentration
An increase in the CHMC concentration up to 0.8 ml of the reagent solution
enhances the absorbance of the colored complex which thereafter remains constant up
to 2.0 ml but there is a gradual decrease in absorbance above this concentration (Table
14, Fig.10 Curve A). Hence 1.0 ml of the CHMC solution was used for further studies.
Effect of pH
The extraction of the Fe(III)-CHMC complex was studied over a pH range 1.7-
8.4. It was observed that the complex gives maximum absorbance within pH range of
3.4-6.8 (Table 14, Fig.10 Curve B). However a decrease in absorbance is observed on
both sides of the range.
Effect of the equilibration time
An increase in the contact time between two phases up to 0.75 min enhances
the extraction as shown by corresponding increase in the absorbance of the complex. It
remains constant up to 1.50 min of equilibration time (Table 14, Fig.11). Therefore,
equilibration time of 1 min was chosen for effecting the extraction of the complex.
68
Fig. 10 A – Effect of CHMC Concentration
B – Effect of pH
0.0 0.5 1.0 1.5 2.0 2.5 3.0
0.2
0.3
0.4
0.5
0.6
0.7
1 2 3 4 5 6 7 8 9
0.1
0.2
0.3
0.4
0.5
0.6
0.7
CHMC Concentration (ml)
Ab
so
rba
nce
BA
pH
Ab
so
rba
nce
B
A

69
Fig. 11 Effect of Equilibration Time
0.2 0.4 0.6 0.8 1.0 1.2 1.4 1.6 1.8 2.0 2.2
0.30
0.35
0.40
0.45
0.50
0.55
0.60
0.65
0.70
0.75
Absorb
ance
Equilibration Time (min)
70
Table 14
Optimization of reaction variables
CHMC Conc.
(in ml)
0.2 0.4 0.6 0.8-2.0 2.5
Absorbance 0.226 0.339 0.613 0.679 0.664
Equilibration
time (in min)
0.25 0.5 0.75-1.50 1.75
Absorbance 0.324 0.547 0.679 0.662
pH 1.7 2.3 3.1 3.4-6.8 7.5 8.4
Absorbance 0.174 0.284 0.547 0.679 0.473 0.327
Conditions: Iron(III) = 50 μg ; volume of reagent (CHMC) solution = 1.0 ml ;
equilibration time = 1 min ; volume of aqueous phase = 10 ml ; volume of
dichloromethane = 10 ml; λmax = 405 nm
Calibration curve, molar absorptivity and Sandell’s sensitivity
Under the optimum conditions, Beer‟s law obedience and its range was
checked at 405 nm by adding different amount of ascorbic acid to iron(III) solution.
Beer‟s law holds good over the range 0.0- 8.0 μg ml-1
(Table 15, Fig. 12) with molar
absorptivity and Sandell‟s sensitivity of 9.581 x 10³ l mol
-1 cm
-1 and 1.838 x 10
-4 μg
cm-2
respectively.

71
Fig 12 Beer‟s law curve for varied amount of ascorbic acid
0 20 40 60 80 100
0.0
0.1
0.2
0.3
0.4
0.5
0.6
0.7
Ab
so
rban
ce
Conc. of Ascorbic Acid ( g/ 10 ml)

72
Table 15
Variation in the Absorbance with Amount of Ascorbic Acid
Amount of ascorbic acid (µg/ 10ml) Absorbance
0 0.679
10 0.595
20 0.526
30 0.446
40 0.359
50 0.272
60 0.177
70 0.105
80 0.032
90 0.018
100 0.014
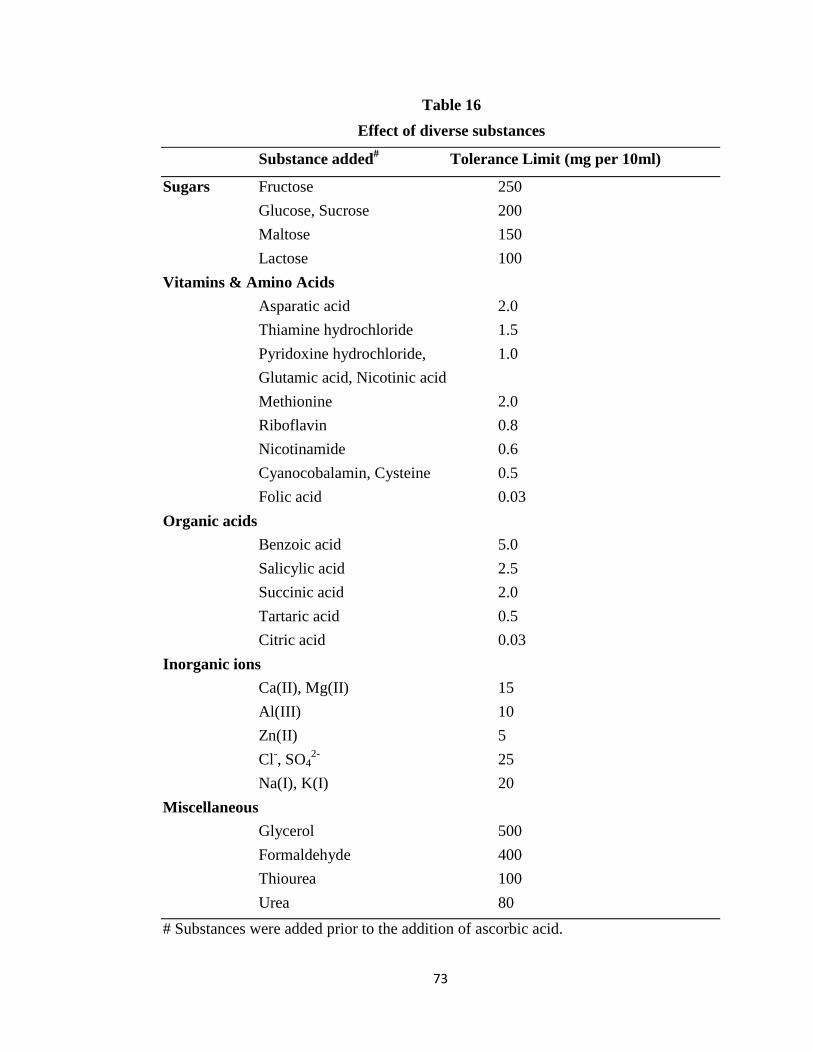
Effect of diverse substances
Effects of the substances commonly found in pharmaceutical formulations
were studied and the results are shown in the Table 16. These include some of the
additives, vitamins and organic acids. The data pertaining to the tolerance of each of these
substances for the determination of 50 μg ascorbic acid are as follows (mg amounts given
in the parenthesis): glycerol (500); formaldehyde (400); fructose (250); glucose, sucrose
(200); maltose (150); lactose , thiourea (100); urea (80); Cl-, SO4
2- (25); Na(I) and K(I)
(20); Ca (II), Mg (II) (15); Al(III) (10); Zn(II), benzoic acid (5); salicylic acid (2.5);
Asparatic acid, methionine, succinic acid (2.0); thiamine hydrochloride (1.5); pyridoxine
hydrochloride, glutamic acid and nicotinic acid (1.0); riboflavin (0.8); Nicotinamide (0.6);
tartaric acid (0.5); cyanocobalamin, cysteine (0.5); folic acid, citric acid (0.03).
73
Table 16
Effect of diverse substances
Substance added# Tolerance Limit (mg per 10ml)
Sugars Fructose 250
Glucose, Sucrose 200
Maltose 150
Lactose 100
Vitamins & Amino Acids
Asparatic acid 2.0
Thiamine hydrochloride 1.5
Pyridoxine hydrochloride, 1.0
Glutamic acid, Nicotinic acid
Methionine 2.0
Riboflavin 0.8
Nicotinamide 0.6
Cyanocobalamin, Cysteine 0.5
Folic acid 0.03
Organic acids
Benzoic acid 5.0
Salicylic acid 2.5
Succinic acid 2.0
Tartaric acid 0.5
Citric acid 0.03
Inorganic ions
Ca(II), Mg(II) 15
Al(III) 10
Zn(II) 5
Cl-, SO4
2- 25
Na(I), K(I) 20
Miscellaneous
Glycerol 500
Formaldehyde 400
Thiourea 100
Urea 80
# Substances were added prior to the addition of ascorbic acid.
74
Applications
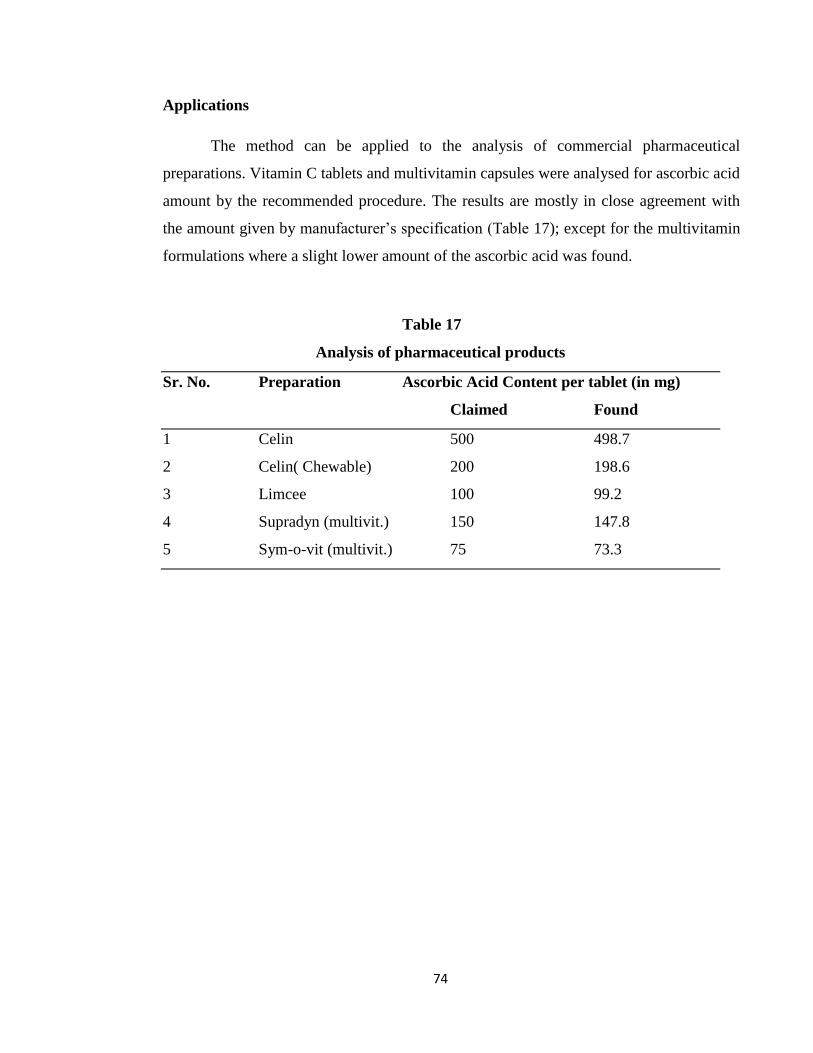
The method can be applied to the analysis of commercial pharmaceutical
preparations. Vitamin C tablets and multivitamin capsules were analysed for ascorbic acid
amount by the recommended procedure. The results are mostly in close agreement with
the amount given by manufacturer‟s specification (Table 17); except for the multivitamin
formulations where a slight lower amount of the ascorbic acid was found.
Table 17
Analysis of pharmaceutical products
Sr. No. Preparation Ascorbic Acid Content per tablet (in mg)
Claimed Found
1 Celin 500 498.7
2 Celin( Chewable) 200 198.6
3 Limcee 100 99.2
4 Supradyn (multivit.) 150 147.8
5 Sym-o-vit (multivit.) 75 73.3
75
2.3.3 Abstract
A simple procedure is described for the
determination of L-ascorbic acid, based on the reduction
of Iron (III) by L-ascorbic acid. The Iron(III) is
complexed with 6-chloro-3-hydroxy-2(4-methoxyphenyl)-
4H-chromen-4-one (CHMC) in acidic medium. The
absorbance is measured at 405 nm after extracting the
brown colored complex in to dichloromethane. Beer’s
law is obeyed over the concentration range up to 8.0 μg
of ascorbic acid. The method has been applied to the
analysis of various pharmaceutical formulations.
76
2.4 Spectrophotometric determination of vitamin C using Fe(II)-5-
Chloro-7-iodo-8-hydroxyquinoline complex
Many methods have been reported for the determination of ascorbic acid in
pharmaceutical preparations and food products. These include indirect
spectrophotometric methods based on the reduction of compounds such as DCIP175-180
,
Iron(III)229-248
, iodate34
, the ketone derivatisation method with o-phenylenediamine53-
57. Electrochemical, fluorimetric
53-59, kinetic
82-87, enzymatic
147-148, and
chemiluminescence69-77
methods have also been proposed. These methods have been
used to increase the analytical sensitivity for ascorbic acid and some of them have
been automated, but specialised equipments are required for these procedures.
5-Chloro-7-iodo-8-hydroxyquinoline (CIHQ) has been found to form a colored
complex with Iron (II) and Iron(III) in slightly acidic medium. However, the reaction
of Fe(III) with the 5-Chloro-7-iodo-8-hydroxyquinoline can be effectively masked by
the addition of citrate. The Fe(II)- CIHQ complex is extracted into chloroform to give
a reddish brown extract. The method based on the extraction of Iron(II)–CIHQ
complex has been worked out to look for better characteristics of a spectrophotometric
method. The detailed studies pertaining to the proposed method are presented here.
2.4.1 Experimental
Instrument
A Systronic spectrophotometer (model 166) with a pair of matched 1cm
quartz cells was used for absorbance measurements.
Reagents and solutions
All reagents were of analytical grade and double distilled water was used for
preparing solutions.

77
Iron (III) solution
A stock solution of iron(III) (1 mg ml-1
) was prepared by dissolving accurately
weighed amount (0.8632 g) of Ammonium ferric sulphate in 100 ml of deionised
water containing 0.5 ml of concentrated sulphuric acid. A lower concentration (100 μg
ml-1
) was obtained by suitable dilution of the stock solution with distilled water.
5-Chloro-7-iodo-8-hydroxyquinoline (CIHQ) solution
A 0.05% (w/v) solution was obtained by dissolving the reagent in ethanol.
N
OH
I
Cl
5-Chloro-7-iodo-8-hydroxyquinoline
Ascorbic acid Solution
A fresh aqueous solution of ascorbic acid (50 μg ml-1
) was used.
Potassium Citrate solution
A 5% (w/v) aqueous solution of Potassium Citrate was prepared in distilled
water.
Procedure
Into a 100 ml separating funnel, 1ml (100 μg) of Iron(III) solution was taken
and an aliquot of ascorbic acid was added. After swirling the contents, 2 ml of
78
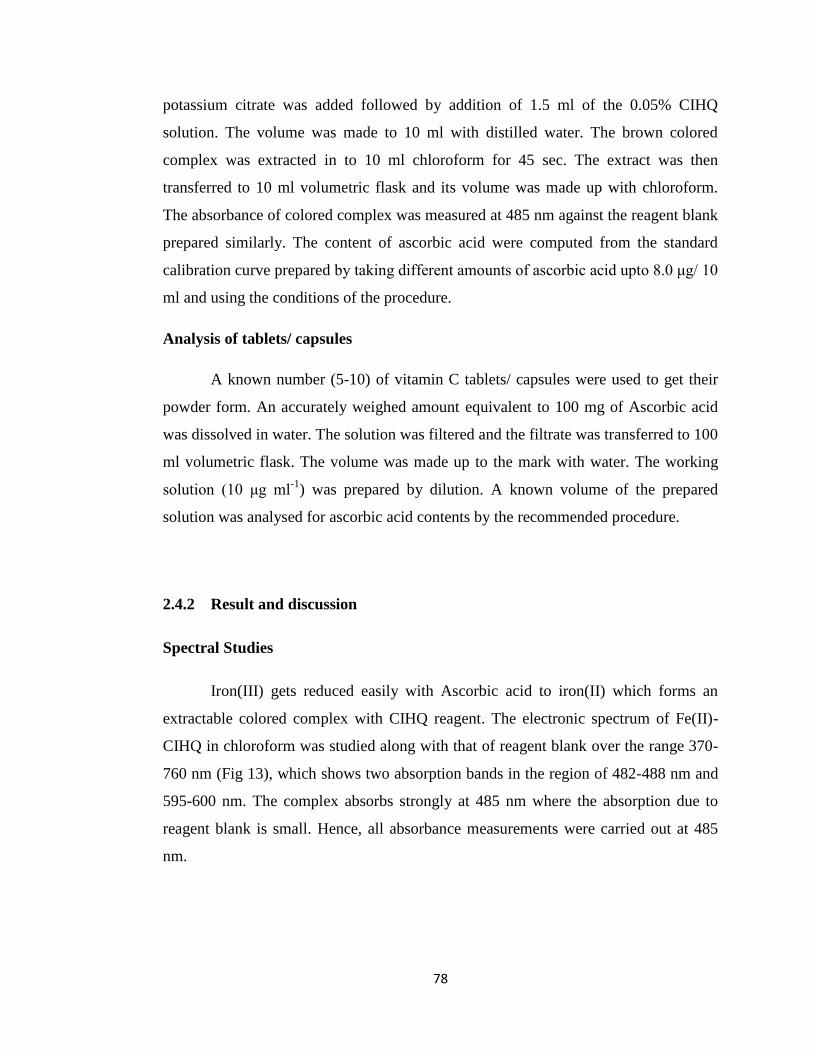
potassium citrate was added followed by addition of 1.5 ml of the 0.05% CIHQ
solution. The volume was made to 10 ml with distilled water. The brown colored
complex was extracted in to 10 ml chloroform for 45 sec. The extract was then
transferred to 10 ml volumetric flask and its volume was made up with chloroform.
The absorbance of colored complex was measured at 485 nm against the reagent blank
prepared similarly. The content of ascorbic acid were computed from the standard
calibration curve prepared by taking different amounts of ascorbic acid upto 8.0 μg/ 10
ml and using the conditions of the procedure.
Analysis of tablets/ capsules
A known number (5-10) of vitamin C tablets/ capsules were used to get their
powder form. An accurately weighed amount equivalent to 100 mg of Ascorbic acid
was dissolved in water. The solution was filtered and the filtrate was transferred to 100
ml volumetric flask. The volume was made up to the mark with water. The working
solution (10 μg ml-1
) was prepared by dilution. A known volume of the prepared
solution was analysed for ascorbic acid contents by the recommended procedure.
2.4.2 Result and discussion
Spectral Studies
Iron(III) gets reduced easily with Ascorbic acid to iron(II) which forms an
extractable colored complex with CIHQ reagent. The electronic spectrum of Fe(II)-
CIHQ in chloroform was studied along with that of reagent blank over the range 370-
760 nm (Fig 13), which shows two absorption bands in the region of 482-488 nm and
595-600 nm. The complex absorbs strongly at 485 nm where the absorption due to
reagent blank is small. Hence, all absorbance measurements were carried out at 485
nm.

79
Fig. 13 Absorption spectrum of Iron(II)-CIHQ complex
(Conditions: Iron(III) = 100 μg; CIHQ solution = 1.5 ml )
A – Reagent blank against chloroform
B – Complex against reagent blank
400 500 600 700 800
0.00
0.05
0.10
0.15
0.20
0.25
0.30 B
A
Ab
so
rban
ce
Wavelength (nm)
80
Choice of extractant
The extractability of the complex in various solvents was studied as shown in
Table 18. The complex gets extracted into chloroform, dichloromethane, carbon
tetrachloride, benzene to give a brown colored extract in each case (extraction
decreases in that order) While it was little extracted into Ethyl acetate and n-hexane.
As the absorbance in chloroform is maximum, hence, it was chosen as an extractant.
Table 18
Extraction Behaviour of the complex in Different solvents
Solvent Absorbance*
Chloroform 0.299
Dichloromethane 0.283
Carbon tetrachloride 0.242
Benzene 0.156
Ethyl acetate 0.098
n-Hexane 0.010
* Measured against respective blank
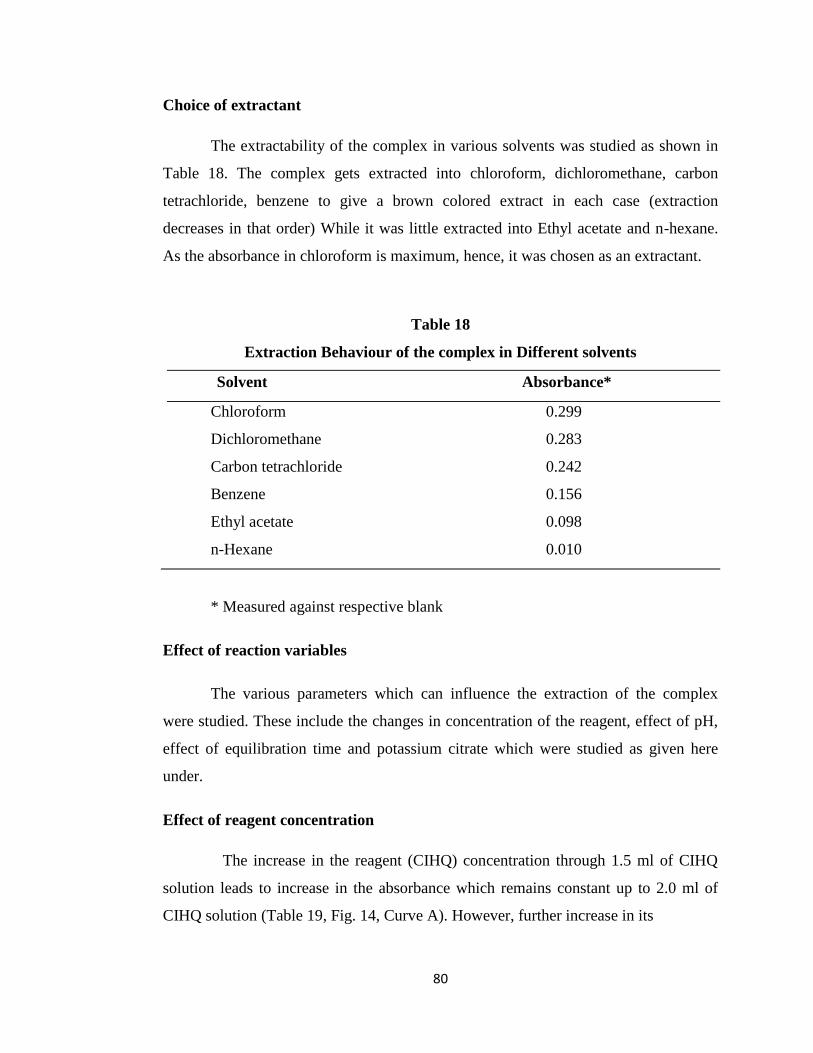
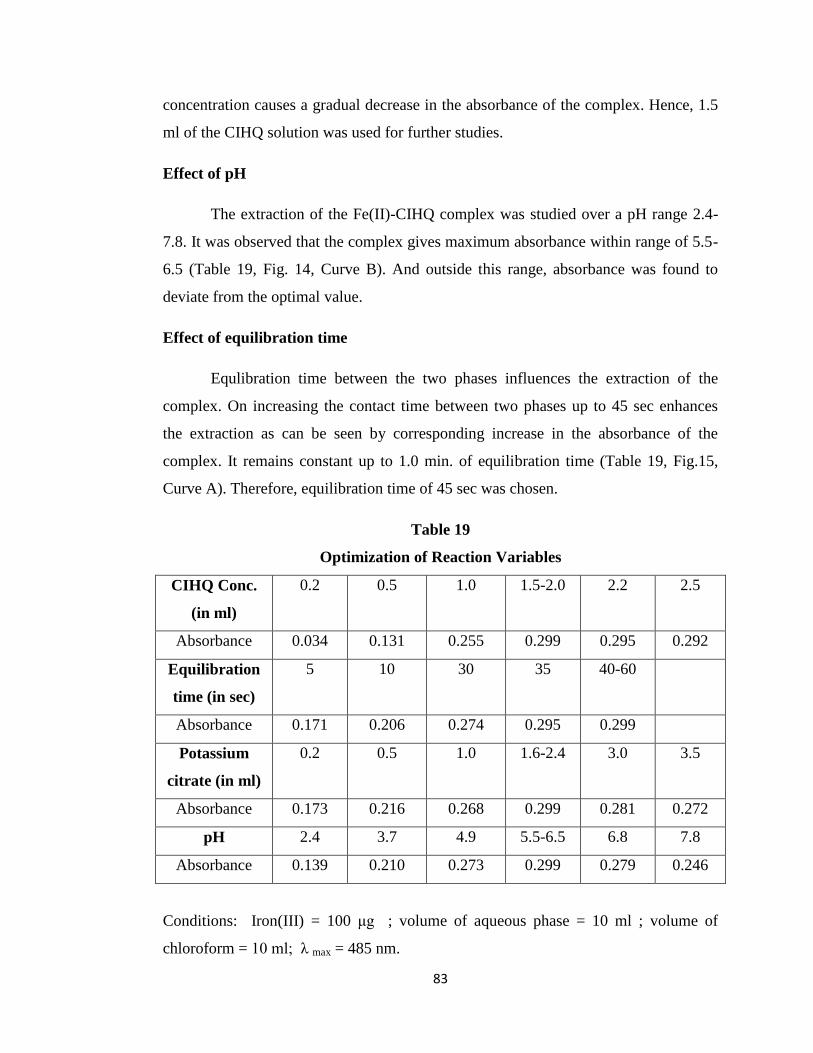
Effect of reaction variables
The various parameters which can influence the extraction of the complex
were studied. These include the changes in concentration of the reagent, effect of pH,
effect of equilibration time and potassium citrate which were studied as given here
under.
Effect of reagent concentration
The increase in the reagent (CIHQ) concentration through 1.5 ml of CIHQ
solution leads to increase in the absorbance which remains constant up to 2.0 ml of
CIHQ solution (Table 19, Fig. 14, Curve A). However, further increase in its

81
Fig. 14 A- Effect of CIHQ concentration
B- Effect of pH
0.0 0.5 1.0 1.5 2.0 2.5
0.00
0.05
0.10
0.15
0.20
0.25
0.30
2 3 4 5 6 7 8
0.12
0.14
0.16
0.18
0.20
0.22
0.24
0.26
0.28
0.30
0.32 BA
B
A
pH
Absorb
ance
Absorb
ance
CIHQ Conc. (in ml)
82
Fig.15 A- Effect of equilibration time
B- Effect of Potassium citrate concentration
0 20 40 60 80 100
0.16
0.18
0.20
0.22
0.24
0.26
0.28
0.30
0.0 0.5 1.0 1.5 2.0 2.5 3.0 3.5 4.0
0.16
0.18
0.20
0.22
0.24
0.26
0.28
0.30
0.32
Potassium citrate Conc. (in ml)
Ab
so
rban
ce
Ab
so
rban
ce
Equilibration Time (in seconds)
BA
A
B
83
concentration causes a gradual decrease in the absorbance of the complex. Hence, 1.5
ml of the CIHQ solution was used for further studies.
Effect of pH
The extraction of the Fe(II)-CIHQ complex was studied over a pH range 2.4-
7.8. It was observed that the complex gives maximum absorbance within range of 5.5-
6.5 (Table 19, Fig. 14, Curve B). And outside this range, absorbance was found to
deviate from the optimal value.
Effect of equilibration time
Equlibration time between the two phases influences the extraction of the
complex. On increasing the contact time between two phases up to 45 sec enhances
the extraction as can be seen by corresponding increase in the absorbance of the
complex. It remains constant up to 1.0 min. of equilibration time (Table 19, Fig.15,
Curve A). Therefore, equilibration time of 45 sec was chosen.
Table 19
Optimization of Reaction Variables
CIHQ Conc.
(in ml)
0.2 0.5 1.0 1.5-2.0 2.2 2.5
Absorbance 0.034 0.131 0.255 0.299 0.295 0.292
Equilibration
time (in sec)
5 10 30 35 40-60
Absorbance 0.171 0.206 0.274 0.295 0.299
Potassium
citrate (in ml)
0.2 0.5 1.0 1.6-2.4 3.0 3.5
Absorbance 0.173 0.216 0.268 0.299 0.281 0.272
pH 2.4 3.7 4.9 5.5-6.5 6.8 7.8
Absorbance 0.139 0.210 0.273 0.299 0.279 0.246
Conditions: Iron(III) = 100 μg ; volume of aqueous phase = 10 ml ; volume of
chloroform = 10 ml; λ max = 485 nm.

84
Effect of potassium citrate solution
It is essential to add citrate solution since it helps not only in preventing the
extraction of corresponding Fe(III)-CIHQ complex but also in adjusting the optimum
pH to 5.5-6.5 (Table 19, Fig. 15, Curve B).
Beer’s law
Varied amounts of ascorbic acid were added to check the range of Beer‟s law
obedience and it was found that a linear relationship between absorbance and the
concentration of ascorbic acid holds good upto 8.0 μg/ 10ml (Table 20, Fig. 16). The
molar absorptivity and sandell‟s sensitivity at 485 nm are found to be 8.5 x 10⁵ l mol
-
1cm
-1 and 0.2072 x 10
-3 μg cm
-2.
Table 20
Absorbance Values at Different Concentration of Ascorbic Acid
Amount of ascorbic acid (µg/ 10ml) Absorbance
0 0.003
1 0.057
2 0.123
4 0.241
6 0.356
8 0.484
9 0.512
10 0.537
12 0.559

85
Fig. 16 Beer‟s law curve for ascorbic acid
0 2 4 6 8 10 12
0.0
0.1
0.2
0.3
0.4
0.5
0.6
Ab
so
rban
ce
Conc. of Ascorbic Acid ( g/ 10 ml)
86
Interference studies
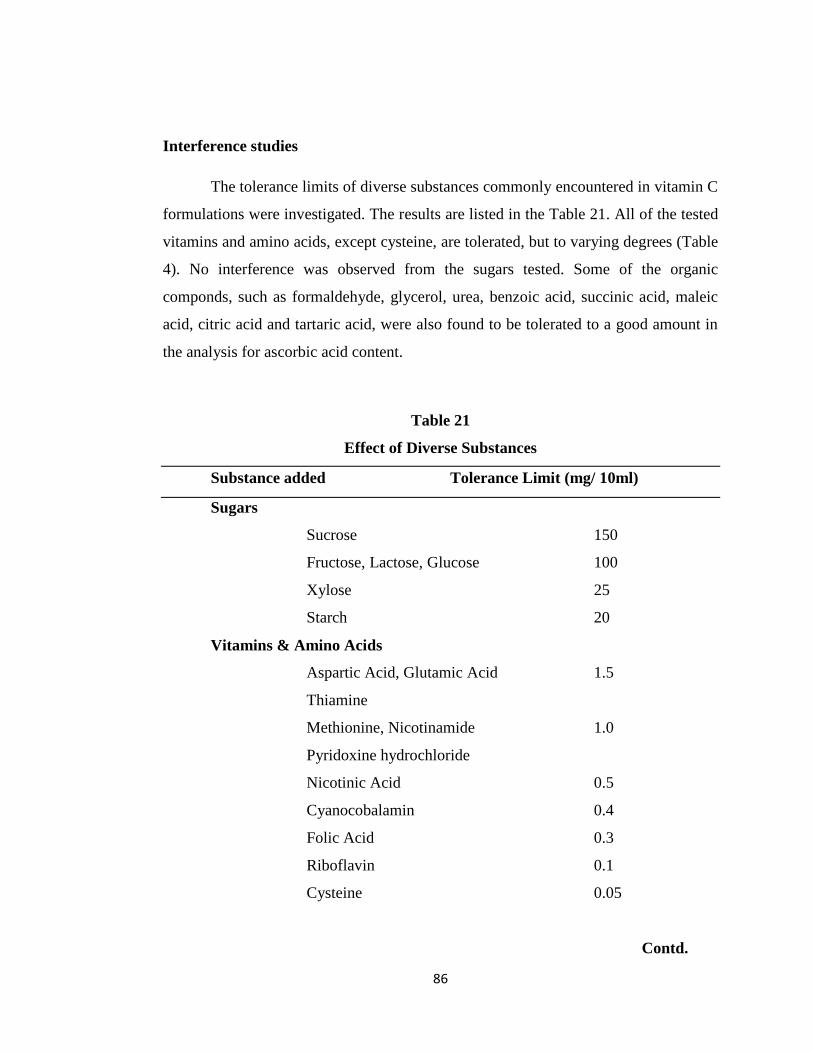
The tolerance limits of diverse substances commonly encountered in vitamin C
formulations were investigated. The results are listed in the Table 21. All of the tested
vitamins and amino acids, except cysteine, are tolerated, but to varying degrees (Table
4). No interference was observed from the sugars tested. Some of the organic
componds, such as formaldehyde, glycerol, urea, benzoic acid, succinic acid, maleic
acid, citric acid and tartaric acid, were also found to be tolerated to a good amount in
the analysis for ascorbic acid content.
Table 21
Effect of Diverse Substances
Substance added Tolerance Limit (mg/ 10ml)
Sugars
Sucrose 150
Fructose, Lactose, Glucose 100
Xylose 25
Starch 20
Vitamins & Amino Acids
Aspartic Acid, Glutamic Acid 1.5
Thiamine
Methionine, Nicotinamide 1.0
Pyridoxine hydrochloride
Nicotinic Acid 0.5
Cyanocobalamin 0.4
Folic Acid 0.3
Riboflavin 0.1
Cysteine 0.05
Contd.
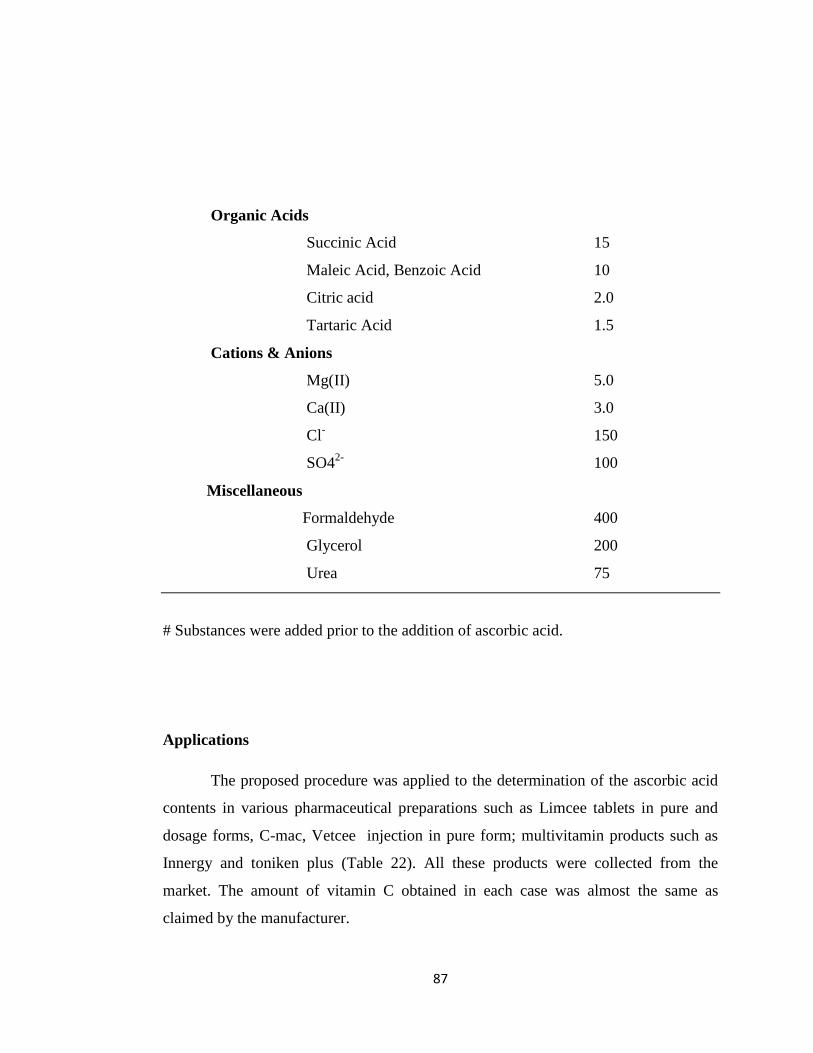
87
Organic Acids
Succinic Acid 15
Maleic Acid, Benzoic Acid 10
Citric acid 2.0
Tartaric Acid 1.5
Cations & Anions
Mg(II) 5.0
Ca(II) 3.0
Cl- 150
SO42-
100
Miscellaneous
Formaldehyde 400
Glycerol 200
Urea 75
# Substances were added prior to the addition of ascorbic acid.
Applications
The proposed procedure was applied to the determination of the ascorbic acid
contents in various pharmaceutical preparations such as Limcee tablets in pure and
dosage forms, C-mac, Vetcee injection in pure form; multivitamin products such as
Innergy and toniken plus (Table 22). All these products were collected from the
market. The amount of vitamin C obtained in each case was almost the same as
claimed by the manufacturer.

88
Table 22
Analysis of pharmaceutical products
Sr. No. Preparation Ascorbic Acid Content per tablet/cap./inj. (in mg)
Claimed Found
1 C-mac (inj.) 40 38.5
2 Vetcee (inj.) 50 47.8
3 Limcee 500 496.9
4 Innergy 50 48.3
5 Toniken Plus 1.0 0.9
89
2.4.3 Abstract
An extractive spectrophotometric
procedure based on the complexation of reduced
Iron(II) with 5-Chloro-7-iodo-8-hydroxyquinoline
(CIHQ) for the estimation of micro amounts of
vitamin C is described. The resulting complex is
extracted into chloroform to give a reddish brown
extract which shows an absorption band at 485 nm.
Linear relationship between absorbance and
concentration of ascorbic acid is observed up to 0.8 μg
ml-1. Interference studies of different substances
including sugars, vitamins and amino acids, metal
ions and organic acids were carried out. The utility of
the method was tested by analysing some of the
marketed products of vitamin C.

90
2.5 Use of calmagite in the determination of vitamin C involving
Ce(IV)-Ce(III) redox couple
Many of the colorimetric methods developed for the determination of ascorbic
acid involve iron(III)-iron(II)238,248,253
redox couple. Though some of them are quite
sensitive yet some of these methods cannot be used for routine analysis due to their
associated problems. Attempts have been made to improve the desirable
characteristics of such spectrophotometric methods using other redox couples such as
V(V)-V(VI)217,218
, Cu(II)-Cu(I)193,194,200
and Cr(VI)-Cr(III)192,174
but without much
success. We also thought of using a different redox couple in devising a method for
the estimation of ascorbic acid. During our preliminary investigation, we found the
suitability of the Ce(IV)-Ce(III) redox couple for the determination of ascorbic acid.
The enediol [-CH(OH)=C(OH)-] present in ascorbic acid is responsible for its
reducing properties. The reduced cerium(III) gives the formation of an brown colored
complex with calmagite in the presence of pyridine that has been used for the
development of proposed method. The detailed studies pertaining to the optimization
of the conditions affecting the absorbance of the complex, construction of calibration
curve, effect of foreign substances and its applicability to pharmaceutical products are
presented here.
2.5.1 Experimental
Instrument
A pH meter (model HPG-2001 A) and systronics spectrophotometer (model-
166) with a pair of matched 1cm quartz cells were used for pH and absorbance studies.
Reagents and solutions
All reagents were of analytical grade and double distilled water was used for
preparing solution.

91
Ascorbic acid solution
A fresh stock solution of ascorbic acid was prepared by dissolving 0.100 g of
ascorbic acid in 100 ml of deionized water to get ascorbic acid solution of
concentration (1mg ml-1
). A lower concentration (10 μg ml-1
) was obtained by suitable
dilution of the stock solution.
Cerium(IV) solution
A (1mg ml-1
) solution of cerium(IV) was prepared by dissolving 0.4514 g of
Ceric ammonium sulphate in 100 ml of deionized water containing 1 ml of
concentrated sulphuric acid. A lower concentration (200 μg ml-1
) was obtained by
dilution of the stock solution.
Calmagite (3-Hydroxy-4-[(2-hydroxy-5-methylphenyl)azo]-1-naphthalene
sulfonic acid) solution
A 0.02% (w/v) solution was obtained by dissolving the reagent in deionized
water.
S
O
O
HO N
N
CH3
HO
OH
Calmagite
Pyridine solution
A 1 % (v/v) solution of pyridine was prepared in distilled ethanol.
92
Procedure
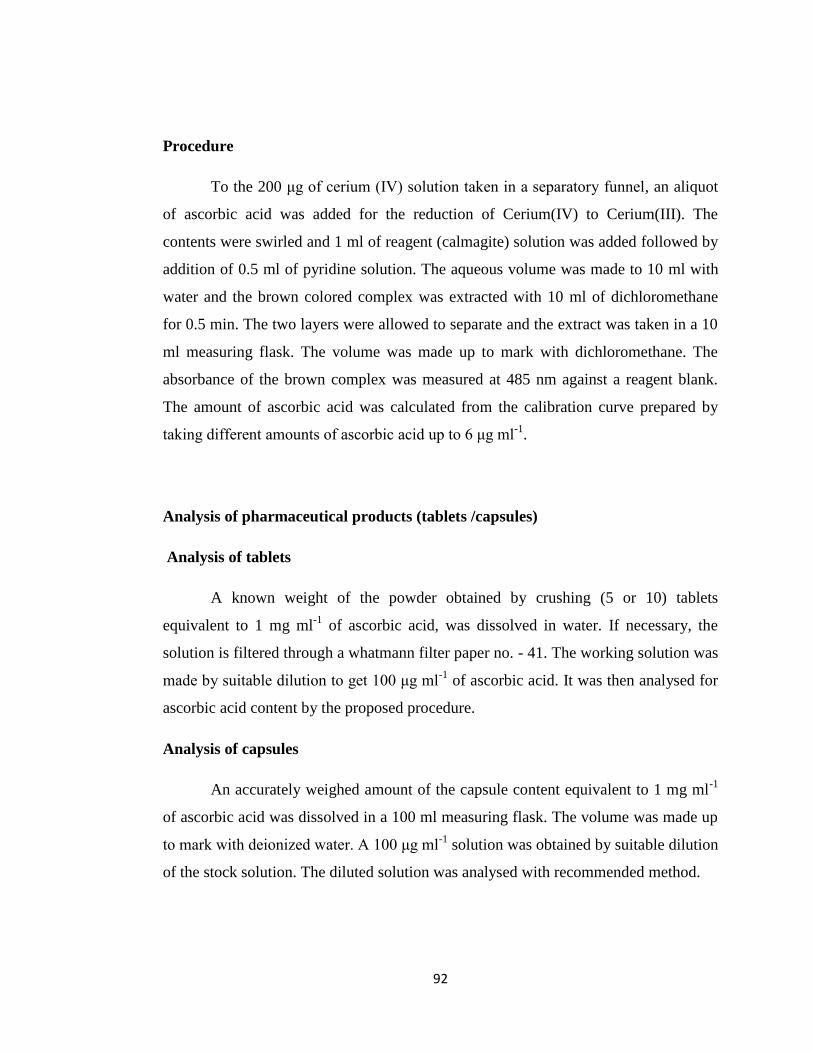
To the 200 μg of cerium (IV) solution taken in a separatory funnel, an aliquot
of ascorbic acid was added for the reduction of Cerium(IV) to Cerium(III). The
contents were swirled and 1 ml of reagent (calmagite) solution was added followed by
addition of 0.5 ml of pyridine solution. The aqueous volume was made to 10 ml with
water and the brown colored complex was extracted with 10 ml of dichloromethane
for 0.5 min. The two layers were allowed to separate and the extract was taken in a 10
ml measuring flask. The volume was made up to mark with dichloromethane. The
absorbance of the brown complex was measured at 485 nm against a reagent blank.
The amount of ascorbic acid was calculated from the calibration curve prepared by
taking different amounts of ascorbic acid up to 6 μg ml-1
.
Analysis of pharmaceutical products (tablets /capsules)
Analysis of tablets
A known weight of the powder obtained by crushing (5 or 10) tablets
equivalent to 1 mg ml-1
of ascorbic acid, was dissolved in water. If necessary, the
solution is filtered through a whatmann filter paper no. - 41. The working solution was
made by suitable dilution to get 100 μg ml-1
of ascorbic acid. It was then analysed for
ascorbic acid content by the proposed procedure.
Analysis of capsules
An accurately weighed amount of the capsule content equivalent to 1 mg ml-1
of ascorbic acid was dissolved in a 100 ml measuring flask. The volume was made up
to mark with deionized water. A 100 μg ml-1
solution was obtained by suitable dilution
of the stock solution. The diluted solution was analysed with recommended method.
93
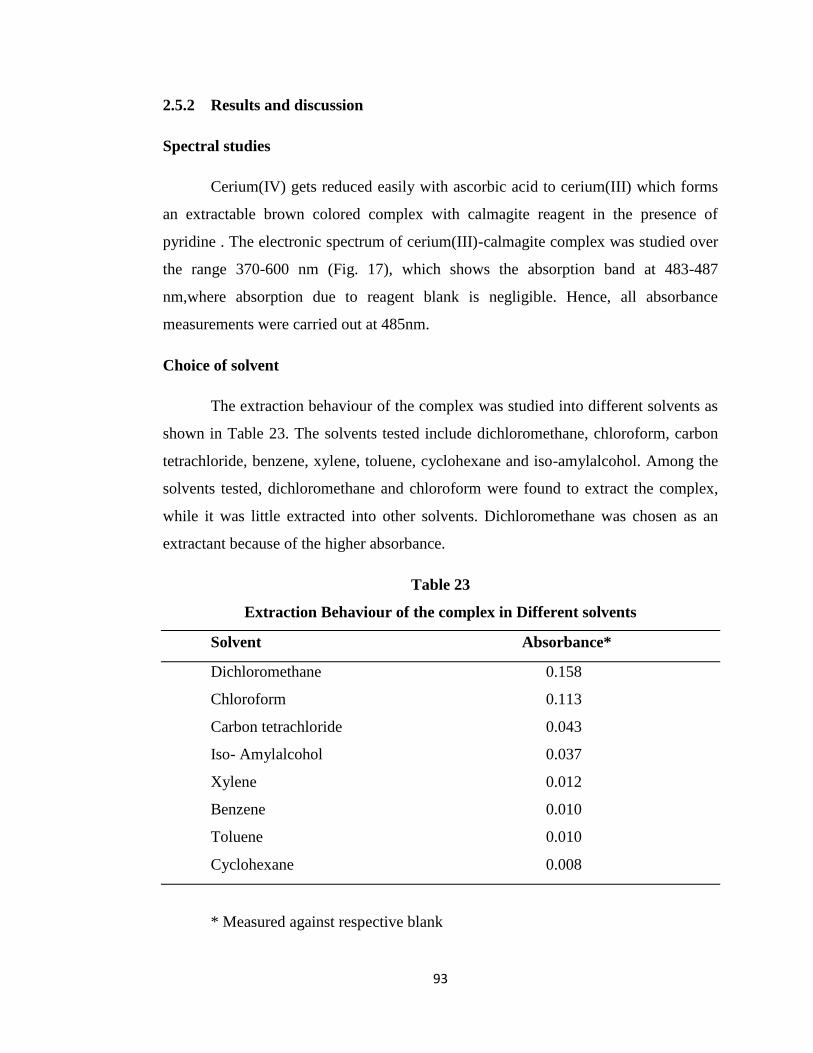
2.5.2 Results and discussion
Spectral studies
Cerium(IV) gets reduced easily with ascorbic acid to cerium(III) which forms
an extractable brown colored complex with calmagite reagent in the presence of
pyridine . The electronic spectrum of cerium(III)-calmagite complex was studied over
the range 370-600 nm (Fig. 17), which shows the absorption band at 483-487
nm,where absorption due to reagent blank is negligible. Hence, all absorbance
measurements were carried out at 485nm.
Choice of solvent
The extraction behaviour of the complex was studied into different solvents as
shown in Table 23. The solvents tested include dichloromethane, chloroform, carbon
tetrachloride, benzene, xylene, toluene, cyclohexane and iso-amylalcohol. Among the
solvents tested, dichloromethane and chloroform were found to extract the complex,
while it was little extracted into other solvents. Dichloromethane was chosen as an
extractant because of the higher absorbance.
Table 23
Extraction Behaviour of the complex in Different solvents
Solvent Absorbance*
Dichloromethane 0.158
Chloroform 0.113
Carbon tetrachloride 0.043
Iso- Amylalcohol 0.037
Xylene 0.012
Benzene 0.010
Toluene 0.010
Cyclohexane 0.008
* Measured against respective blank

94
Fig.17 Absorption spectrum of Cerium(III)-Calmagite complex
(Conditions: Ce(IV) (200 μg) = 1 ml; Calmagite solution (0.02 % w/v) = 1.0 ml ;
pyridine solution (1 % v/v) = 0.5 ml; Vol. of aqueous = Vol. of DCM = 10 ml)
A– Complex against reagent blank
B – Reagent blank against dichloromethane
400 450 500 550 600
0.00
0.02
0.04
0.06
0.08
0.10
0.12
0.14
0.16
0.18
Ab
so
rba
nce
Wavelength (nm)

95
Effect of reaction variables
The parameters which affect the extraction and the absorbance of the complex
were studied as shown in Table 24. In the study of each parameter, 10 ml of aqueous
phase containing 200 μg of cerium(IV) and 40 μg of ascorbic acid and 0.5 ml of
pyridine was equilibrated with equal volume of dichloromethane. The other conditions
used therein are indicated at the bottom of the Table 24.
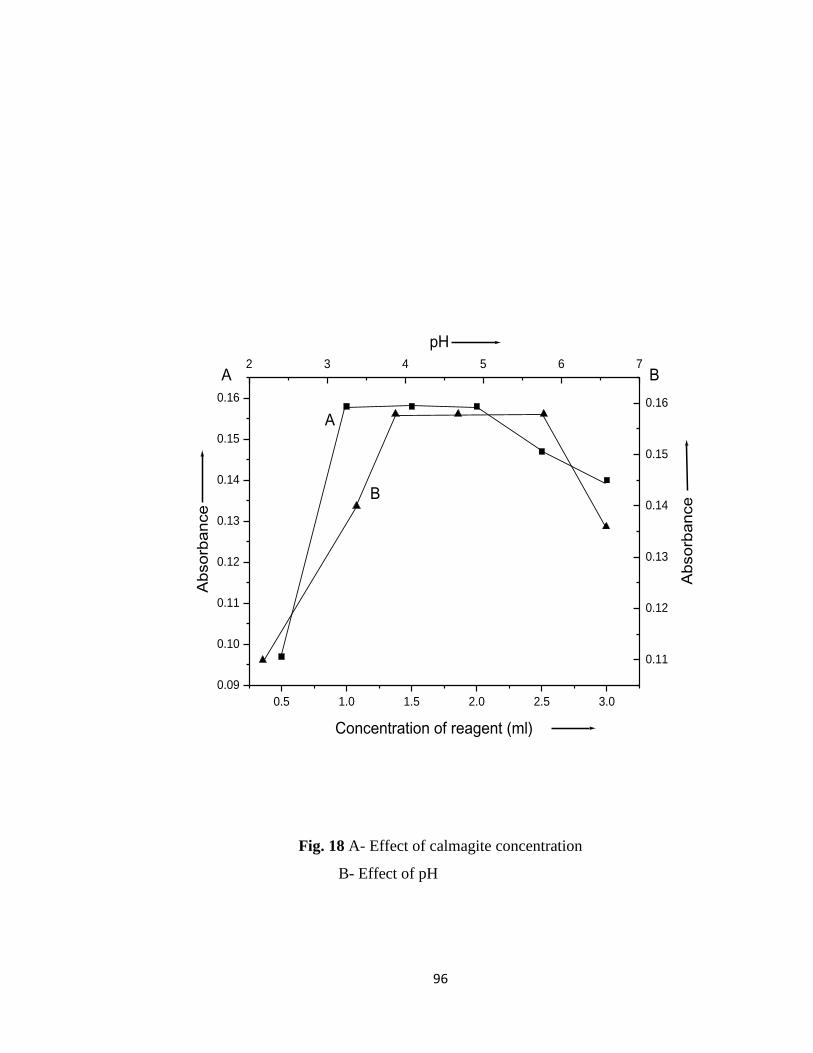
Effect of reagent (calmagite) concentration
An increase in the amount of calmagite concentration up to 1 ml enhances the
absorbance of the complex, which remains the same up to 2 ml of its solution (Table
24, Fig. 18, Curve A). But further increase in its concentration caused gradual
decrease in absorbance. Hence, 1 ml of the reagent solution that gives highest
absorbance was used for subsequent studies.
Table 24
Optimization of reaction variables
Calmagite conc.
(in ml)
0.5 1.0-2.0 2.5 3.0
Absorbance 0.097 0.158 0.147 0.140
pH 2.2 3.4 3.9-5.8 6.6
Absorbance 0.110 0.140 0.158 0.136
Equilibration time
(in min)
0.25 0.5-1.5
Absorbance 0.126 0.158
Pyridine conc.
(in ml)
0.2 0.4-0.8 1.0 1.2
Absorbance 0.113 0.158 0.152 0.147
Conditions: Cerium(IV) = 200 μg ; volume of ascorbic acid (20 μg ml-1
) solution =
2.0 ml ; volume of aqueous phase = 10ml ; volume of dichloromethane =10 ml; λmax
= 485 nm.
96
Fig. 18 A- Effect of calmagite concentration
B- Effect of pH
0.5 1.0 1.5 2.0 2.5 3.0
0.09
0.10
0.11
0.12
0.13
0.14
0.15
0.16
2 3 4 5 6 7
0.11
0.12
0.13
0.14
0.15
0.16
Concentration of reagent (ml)
Ab
so
rban
ce
A
B
BA
Ab
so
rban
ce
pH

97
Fig.19 A- Effect of equilibration time
B- Effect of pyridine concentration
0.2 0.4 0.6 0.8 1.0 1.2 1.4 1.6
0.12
0.13
0.14
0.15
0.16
0.17
0.2 0.4 0.6 0.8 1.0 1.2
0.11
0.12
0.13
0.14
0.15
0.16
B
B
A
A
Absorb
ance
Equilibration time (min)
pyridine concentration (ml)
Absorb
ance

98
Effect of pH
The pH of the aqueous solution was varied over the range 2.2-6.6 (Table 24,
Fig. 18, Curve B) which was adjusted with 0.1N hydrochloric acid and 0.1N sodium
hydroxide. The optimum pH range giving higher absorbance is 3.9-5.8.
Effect of pyridine
The addition of pyridine is essential as the complex formation occurs only in
the presence of pyridine. In case there is no addition of pyridine, the absorption band
at 485 nm is not observed. The absorbance of the complex increases with the increase
in pyridine concentration up to 0.4 ml, thereafter it remains constant up to 0.8 ml
(Table 24, Fig 19, Curve B). Further addition of pyridine is responsible for a gradual
decrease in respective absorbance. Hence, further studies were made with the addition
of 0.5 ml of pyridine solution.
Effect of equilibration time
The aqueous phase containing the complex was equilibrated with 10 ml of
dichloromethane for different intervals of time (Table 24, Fig. 19, Curve A) and 0.5
min was found sufficient for the quantitative extraction of complex into non-aqueous
phase and which remains constant upto 1.5 min of equilibration time.
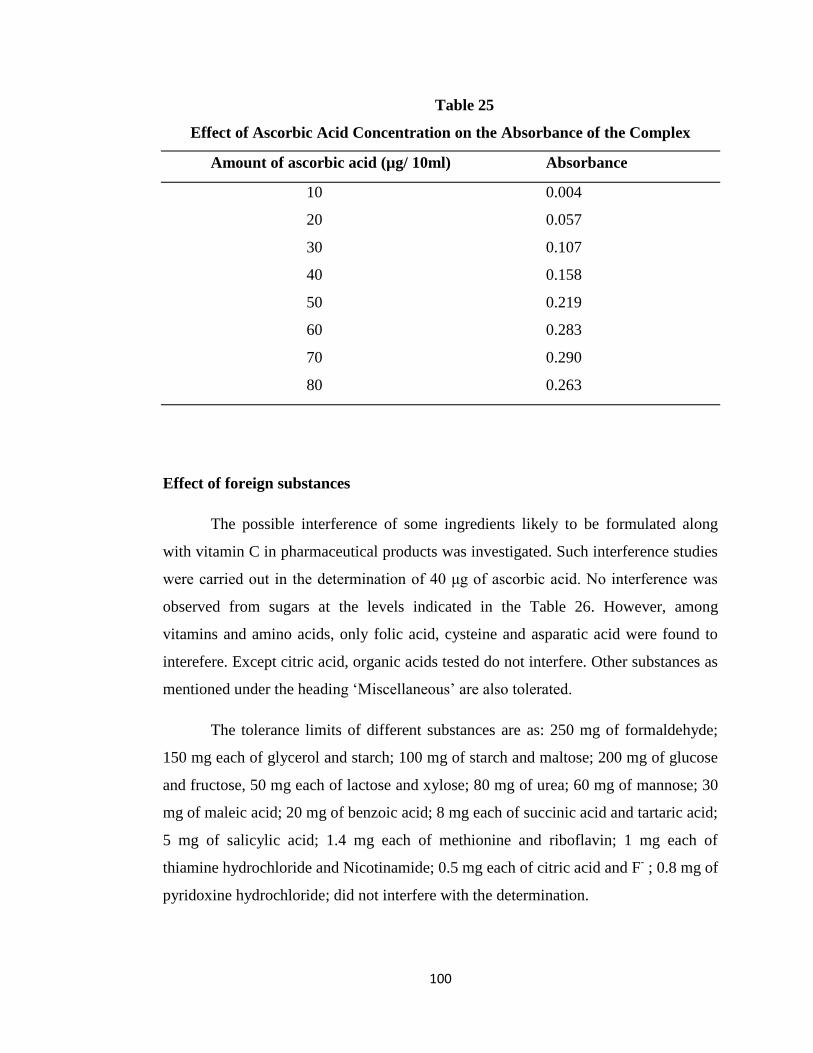
Beer’s law and statistical data
Under the optimum conditions, Beer‟s law plot was constructed at 485 nm by
adding different amount of ascorbic acid to Cerium(IV) solution and a linear
relationship between absorbance and concentration of the analyte was observed over
the range 0.5-6.0 μg ml-1
(Table 25, Fig. 20) of ascorbic acid. The calculated molar
absorptivity and sandell‟s sensitivity are 6.957 x 10³ l mol
-1 cm
-1 and 0.02532 μg cm
-2
respectively.
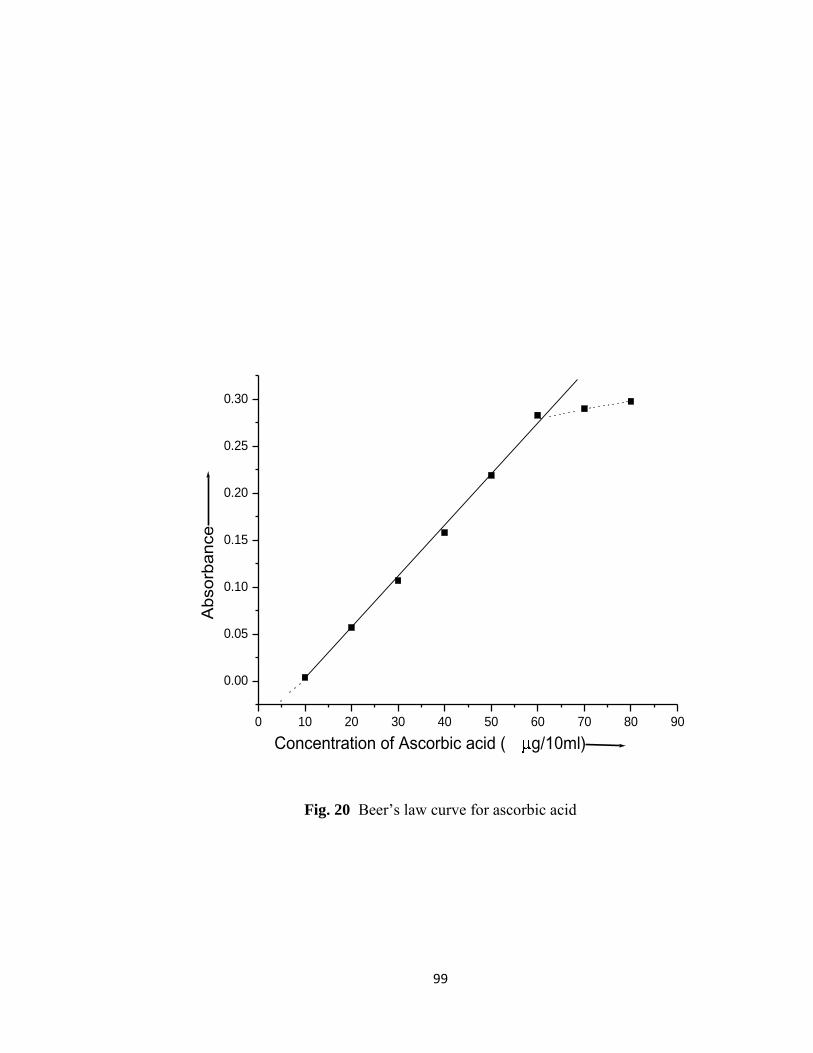
99
Fig. 20 Beer‟s law curve for ascorbic acid
0 10 20 30 40 50 60 70 80 90
0.00
0.05
0.10
0.15
0.20
0.25
0.30
Absorb
ance
Concentration of Ascorbic acid ( g/10ml)
100
Table 25
Effect of Ascorbic Acid Concentration on the Absorbance of the Complex
Amount of ascorbic acid (µg/ 10ml) Absorbance
10 0.004
20 0.057
30 0.107
40 0.158
50 0.219
60 0.283
70 0.290
80 0.263
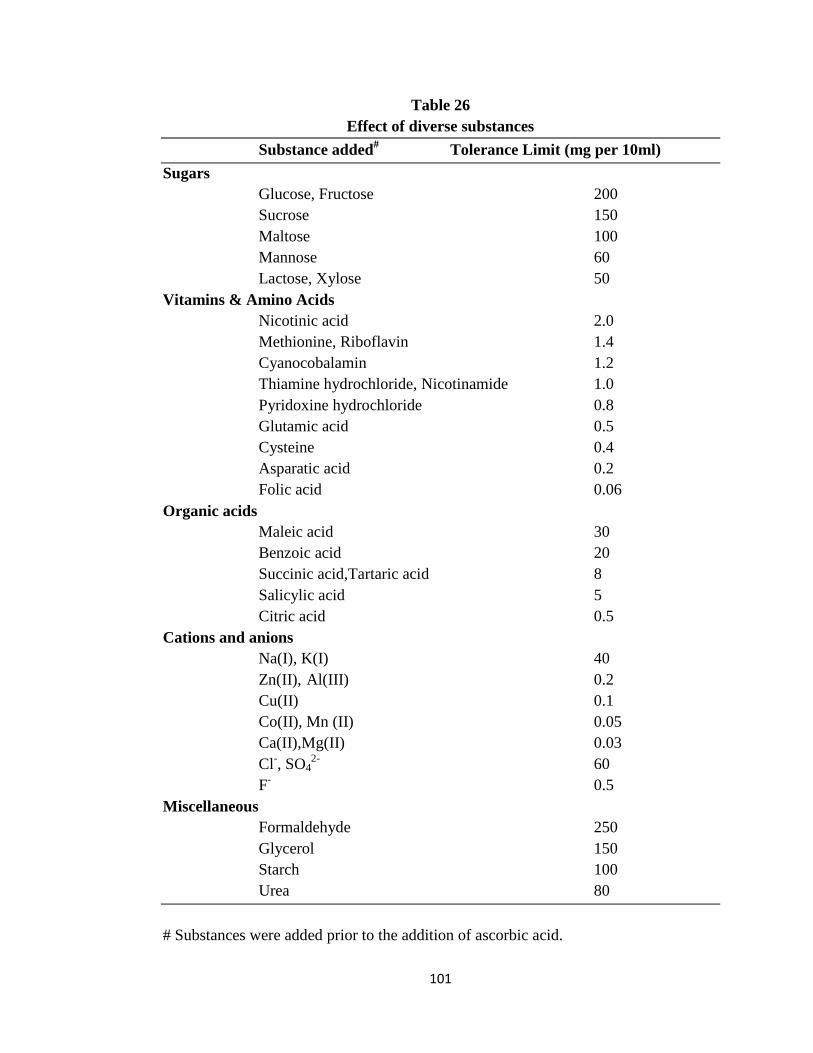
Effect of foreign substances
The possible interference of some ingredients likely to be formulated along
with vitamin C in pharmaceutical products was investigated. Such interference studies
were carried out in the determination of 40 μg of ascorbic acid. No interference was
observed from sugars at the levels indicated in the Table 26. However, among
vitamins and amino acids, only folic acid, cysteine and asparatic acid were found to
interefere. Except citric acid, organic acids tested do not interfere. Other substances as
mentioned under the heading „Miscellaneous‟ are also tolerated.
The tolerance limits of different substances are as: 250 mg of formaldehyde;
150 mg each of glycerol and starch; 100 mg of starch and maltose; 200 mg of glucose
and fructose, 50 mg each of lactose and xylose; 80 mg of urea; 60 mg of mannose; 30
mg of maleic acid; 20 mg of benzoic acid; 8 mg each of succinic acid and tartaric acid;
5 mg of salicylic acid; 1.4 mg each of methionine and riboflavin; 1 mg each of
thiamine hydrochloride and Nicotinamide; 0.5 mg each of citric acid and F- ; 0.8 mg of
pyridoxine hydrochloride; did not interfere with the determination.
101
Table 26
Effect of diverse substances
Substance added# Tolerance Limit (mg per 10ml)
Sugars
Glucose, Fructose 200
Sucrose 150
Maltose 100
Mannose 60
Lactose, Xylose 50
Vitamins & Amino Acids
Nicotinic acid 2.0
Methionine, Riboflavin 1.4
Cyanocobalamin 1.2
Thiamine hydrochloride, Nicotinamide 1.0
Pyridoxine hydrochloride 0.8
Glutamic acid 0.5
Cysteine 0.4
Asparatic acid 0.2
Folic acid 0.06
Organic acids
Maleic acid 30
Benzoic acid 20
Succinic acid,Tartaric acid 8
Salicylic acid 5
Citric acid 0.5
Cations and anions
Na(I), K(I) 40
Zn(II), Al(III) 0.2
Cu(II) 0.1
Co(II), Mn (II) 0.05
Ca(II),Mg(II) 0.03
Cl-, SO4
2- 60
F-
0.5
Miscellaneous
Formaldehyde 250
Glycerol 150
Starch 100
Urea 80
# Substances were added prior to the addition of ascorbic acid.
102
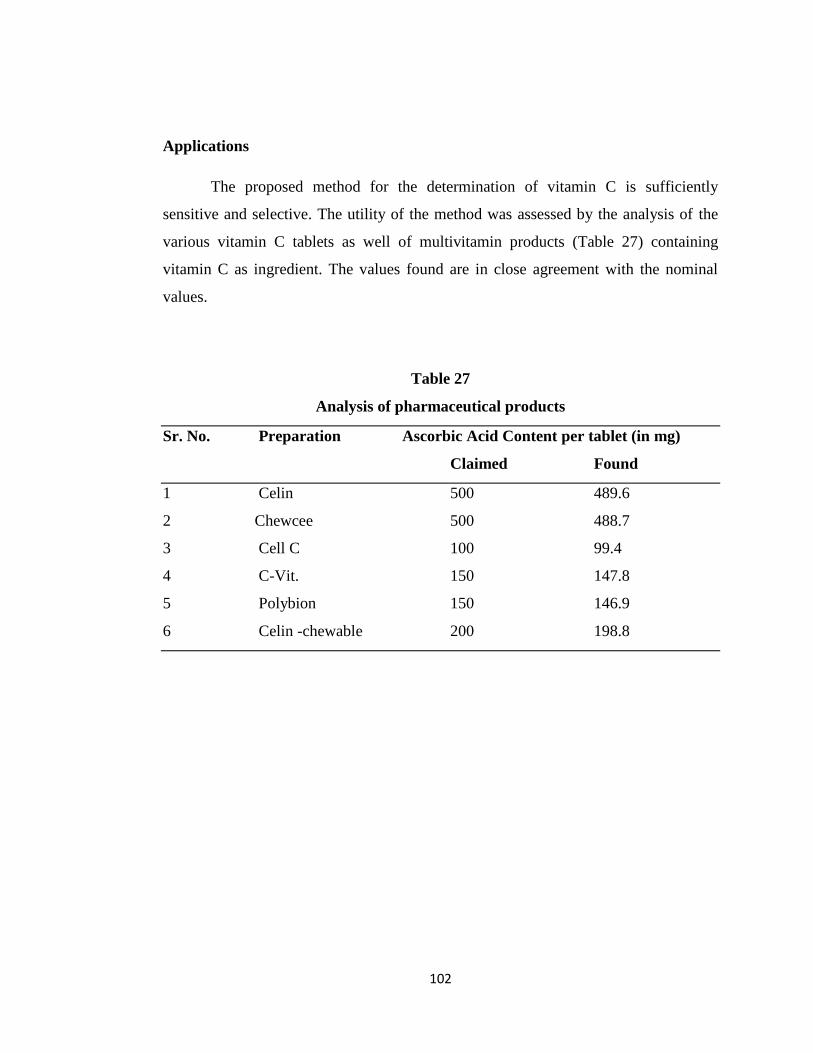
Applications
The proposed method for the determination of vitamin C is sufficiently
sensitive and selective. The utility of the method was assessed by the analysis of the
various vitamin C tablets as well of multivitamin products (Table 27) containing
vitamin C as ingredient. The values found are in close agreement with the nominal
values.
Table 27
Analysis of pharmaceutical products
Sr. No. Preparation Ascorbic Acid Content per tablet (in mg)
Claimed Found
1 Celin 500 489.6
2 Chewcee 500 488.7
3 Cell C 100 99.4
4 C-Vit. 150 147.8
5 Polybion 150 146.9
6 Celin -chewable 200 198.8

103
2.5.3 Abstract
An extractive spectrophotometric method for
the determination of micro amounts of ascorbic acid
has been developed by exploiting its reducing nature.
Ce(IV) is converted to Ce(III) by the addition of
ascorbic acid, which forms a brown colored complex
with calmagite and pyridine. The absorbance is
measured at 485 nm after extracting the colored
complex into dichloromethane. Beer’s law holds good
in the concentration range of 0.5-6 μg ml-1. The effect
of various substances such as vitamins, amino acids,
sugars and other additives has been investigated. The
applicability of the method was tested by analysing
pure vitamin C and multivitamin pharmaceuticals.

104
2.6 Spectrophotometric determination of vitamin C using Iron(II)-
Bathophenanthroline complex
A number of spectrophotometric methods have been developed using a wide
variety of reagents but are associated with shortcomings of one type or the other, for
example methods using 2,2‟-bipyridyl229-231
, 1,10-phenanthroline238-240
, ammonium
molybdate86,206-208
, folin-coicalteu216
etc. are time consuming; these methods need at
least 1 h for a single determination. Methods based on ferrozine254-256
,
dimethoxydiquinone184
and 2,3,5-triphenyltetrazolium chloride219
must indure many
interferences.
While seeking for the development of a method with improved characteristics,
bathophenanthroline has been found to be a suitable reagent that forms a red colored
complex with reduced iron(II) over the pH range 4.0-5.5. The method based on the
extraction of iron(II)-bathophenanthroline complex in dichloromethane provides the
desirable features of simplicity and rapidity besides having better sensitivity and
selectivity.
2.6.1 Experimental
Instrument
A systronics spectrophotometer (model-166) with a pair of matched 1cm
quartz cells was used for absorbance measurements.
Reagents and solutions
All reagents were of analytical grade and double distilled water was used for
preparing solutions.
Buffer solution
Acetate buffer solution (pH 5.0) was prepared by mixing 35.7 ml of 1M acetic
acid and 64.3 ml of 1M sodium acetate (Trihydrate) solution.

105
Ascorbic acid solution
A fresh aqueous solution of ascorbic acid (100 μg ml-1
) was used. A lower
concentration (10 μg ml-1
) was obtained by dilution of the stock solution.
Iron (III) solution
A (1 mg ml-1
) iron (III) solution was prepared by dissolving accurately
weighed amount of ammonium ferric sulphate in 100 ml of deionised water containing
0.5 ml of concentrated sulphuric acid. A lower concentration (100 μg ml-1
) was
obtained by dilution of the stock solution.
Bathophenanthroline (Bphen) solution
A 0.05% (w/v) solution was obtained by dissolving the reagent in ethanol.
N N
Bathophenanthroline
Procedure
An aliquot of ascorbic acid was added to the 100 µg of iron(III) solution taken
in a separatory funnel followed by addition of 2 ml of acetate buffer solution for
adjusting the pH in the range of 4.0-5.5 and 1ml of bathophenanthroline solution.
Enough water was added to make the aqueous phase to 10 ml. The resulting red
colored complex was extracted for 30 sec with 10 ml of dichloromethane (DCM). The
coloured extract was taken into a 10 ml volumetric
106
flask and the volume was made up to the mark with DCM, if required. The absorbance
of the red colored complex was measured at 485 nm against the reagent blank
prepared similarly and the vitamin C contents is determined from the standard
calibration curve prepared by taking different amounts of ascorbic acid up to 12 μg/
10ml and using the optimum conditions of the procedure.
Determination of ascorbic acid in pharmaceutical products (tablets /capsules)
The tablets or capsules (5-10 items) were crushed to the powder form. An
accurately weighed amount equivalent to 100 mg of ascorbic acid was dissolved in
deionized water. The solution was filtered into a 100 ml volumetric flask and made up
to mark with deionized water. The working solution of lower concentration (10 μg ml-
1) was obtained by suitable dilution of this solution. The diluted solution was analysed
by the proposed procedure.
2.6.2 Results and discussion
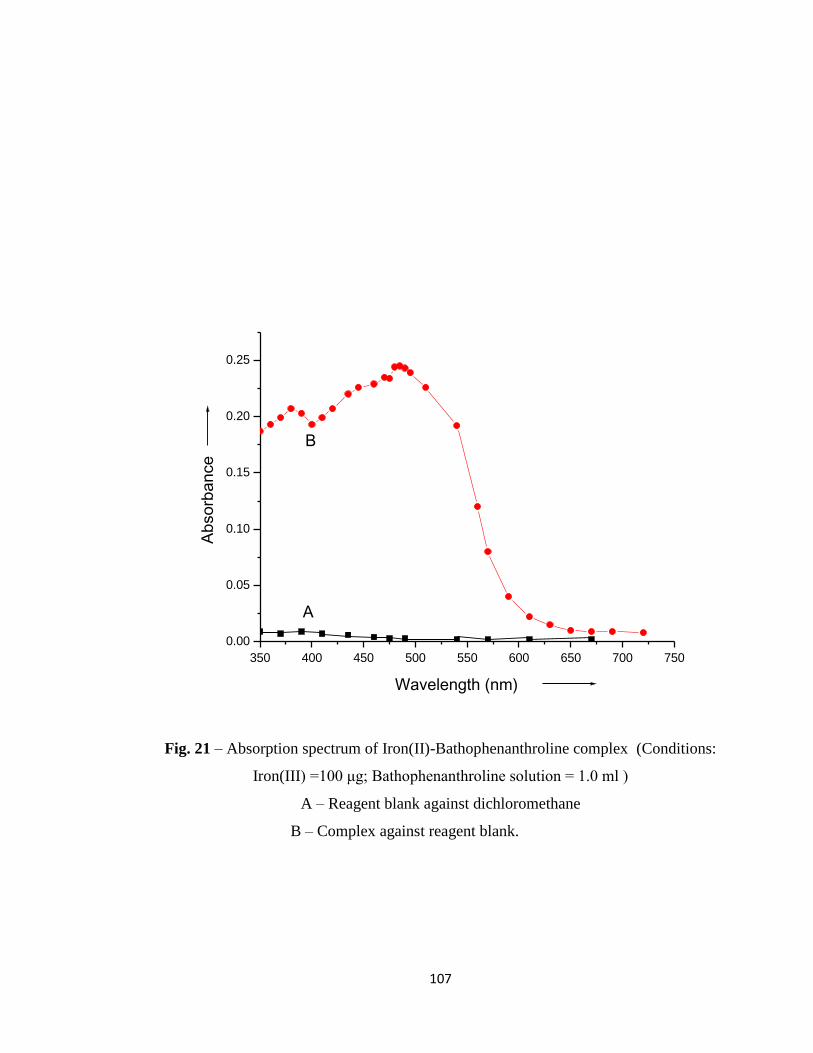
Spectral studies
Iron(II) forms an extractable red colored complex with bathophenanthroline in
acidic medium. Preliminary investigations revealed a quantitative increase in color
intensity of iron(II)-Bathophenanthroline complex by the addition of increasing
amount of ascorbic acid. The absorption spectrum of iron(II)-Bathophenanthroline
complex was studied over the range 350-720 nm, which shows the absorption band at
480-487 nm (Fig. 21), where absorption due to reagent blank is very small. Hence, all
absorbance measurements were carried out at 485 nm.
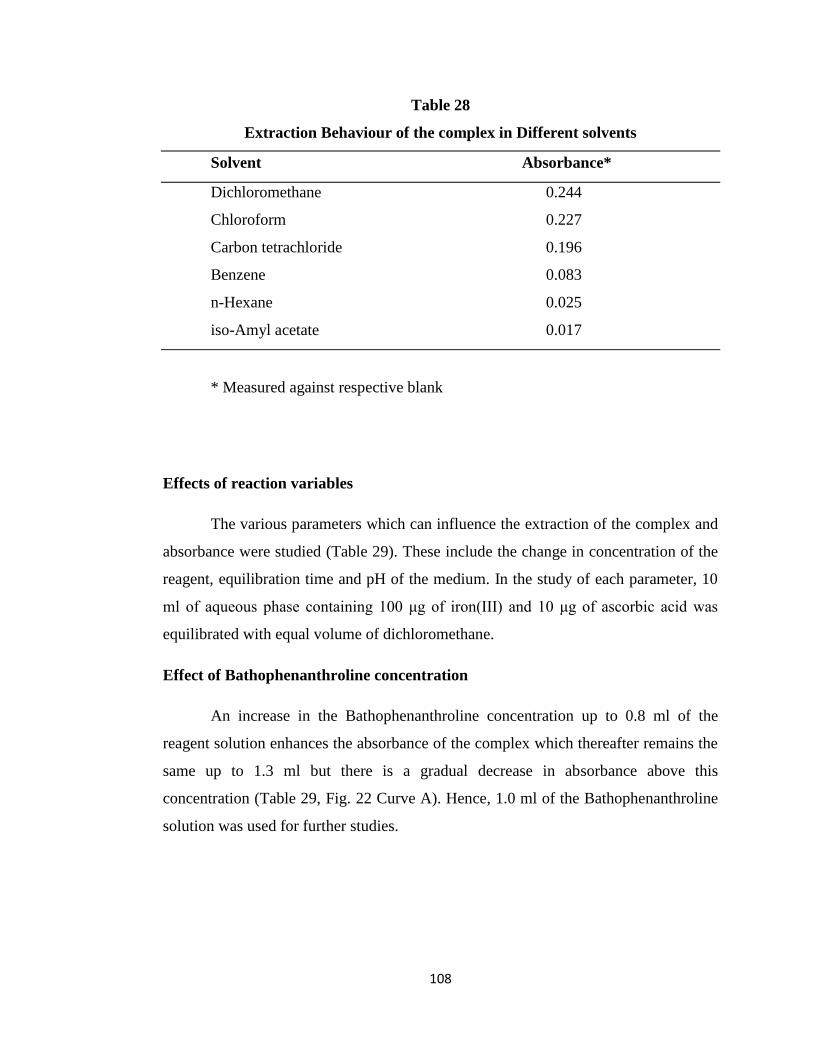
Choice of solvent
Various solvents were tested to extract the Fe(II)-Bathophenanthroline complex as
shown in Table 28. The solvents include dichloromethane, chloroform, carbon
tetrachloride and benzene. However, n-Hexane, iso-Amyl acetate were found to
extract the complex partially. Dichloromethane was chosen as an extractant because of
the highest absorbance in this solvent.
107
Fig. 21 – Absorption spectrum of Iron(II)-Bathophenanthroline complex (Conditions:
Iron(III) =100 μg; Bathophenanthroline solution = 1.0 ml )
A – Reagent blank against dichloromethane
B – Complex against reagent blank.
350 400 450 500 550 600 650 700 750
0.00
0.05
0.10
0.15
0.20
0.25
B
A
Ab
so
rban
ce
Wavelength (nm)
108
Table 28
Extraction Behaviour of the complex in Different solvents
Solvent Absorbance*
Dichloromethane 0.244
Chloroform 0.227
Carbon tetrachloride 0.196
Benzene 0.083
n-Hexane 0.025
iso-Amyl acetate 0.017
* Measured against respective blank
Effects of reaction variables
The various parameters which can influence the extraction of the complex and
absorbance were studied (Table 29). These include the change in concentration of the
reagent, equilibration time and pH of the medium. In the study of each parameter, 10
ml of aqueous phase containing 100 μg of iron(III) and 10 μg of ascorbic acid was
equilibrated with equal volume of dichloromethane.
Effect of Bathophenanthroline concentration
An increase in the Bathophenanthroline concentration up to 0.8 ml of the
reagent solution enhances the absorbance of the complex which thereafter remains the
same up to 1.3 ml but there is a gradual decrease in absorbance above this
concentration (Table 29, Fig. 22 Curve A). Hence, 1.0 ml of the Bathophenanthroline
solution was used for further studies.
109
Table 29
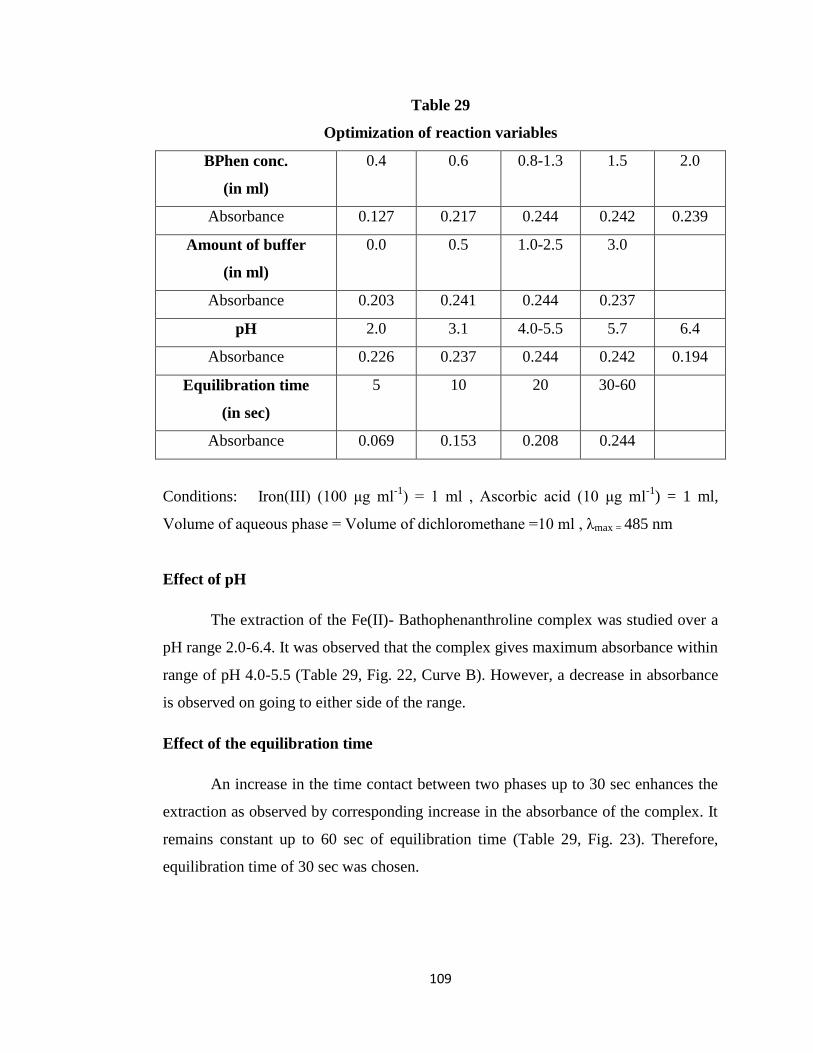
Optimization of reaction variables
BPhen conc.
(in ml)
0.4 0.6 0.8-1.3 1.5 2.0
Absorbance 0.127 0.217 0.244 0.242 0.239
Amount of buffer
(in ml)
0.0 0.5 1.0-2.5 3.0
Absorbance 0.203 0.241 0.244 0.237
pH 2.0 3.1 4.0-5.5 5.7 6.4
Absorbance 0.226 0.237 0.244 0.242 0.194
Equilibration time
(in sec)
5 10 20 30-60
Absorbance 0.069 0.153 0.208 0.244
Conditions: Iron(III) (100 μg ml-1
) = 1 ml , Ascorbic acid (10 μg ml-1
) = 1 ml,
Volume of aqueous phase = Volume of dichloromethane =10 ml , λmax = 485 nm
Effect of pH
The extraction of the Fe(II)- Bathophenanthroline complex was studied over a
pH range 2.0-6.4. It was observed that the complex gives maximum absorbance within
range of pH 4.0-5.5 (Table 29, Fig. 22, Curve B). However, a decrease in absorbance
is observed on going to either side of the range.
Effect of the equilibration time
An increase in the time contact between two phases up to 30 sec enhances the
extraction as observed by corresponding increase in the absorbance of the complex. It
remains constant up to 60 sec of equilibration time (Table 29, Fig. 23). Therefore,
equilibration time of 30 sec was chosen.

110
Fig. 22 A Effect of Bathophenanthroline concentration
B Effect of pH
0.2 0.4 0.6 0.8 1.0 1.2 1.4 1.6 1.8 2.0 2.2
0.10
0.12
0.14
0.16
0.18
0.20
0.22
0.24
0.262 3 4 5 6 7
0.10
0.12
0.14
0.16
0.18
0.20
0.22
0.24
0.26
0.28
Ab
so
rban
ce
Ab
so
rban
ce
Conc. of Bathophenanthroline (in ml)
B
B
A
A
pH

111
Fig.23 Effect of equilibration time
0 10 20 30 40 50 60
0.06
0.08
0.10
0.12
0.14
0.16
0.18
0.20
0.22
0.24
0.260.0 0.5 1.0 1.5 2.0 2.5 3.0
0.20
0.21
0.22
0.23
0.24
0.25
Amount of Buffer solution (ml)
Ab
so
rba
nce
Ab
so
rba
nce
Equilibration time (sec)
BA
B
A
112
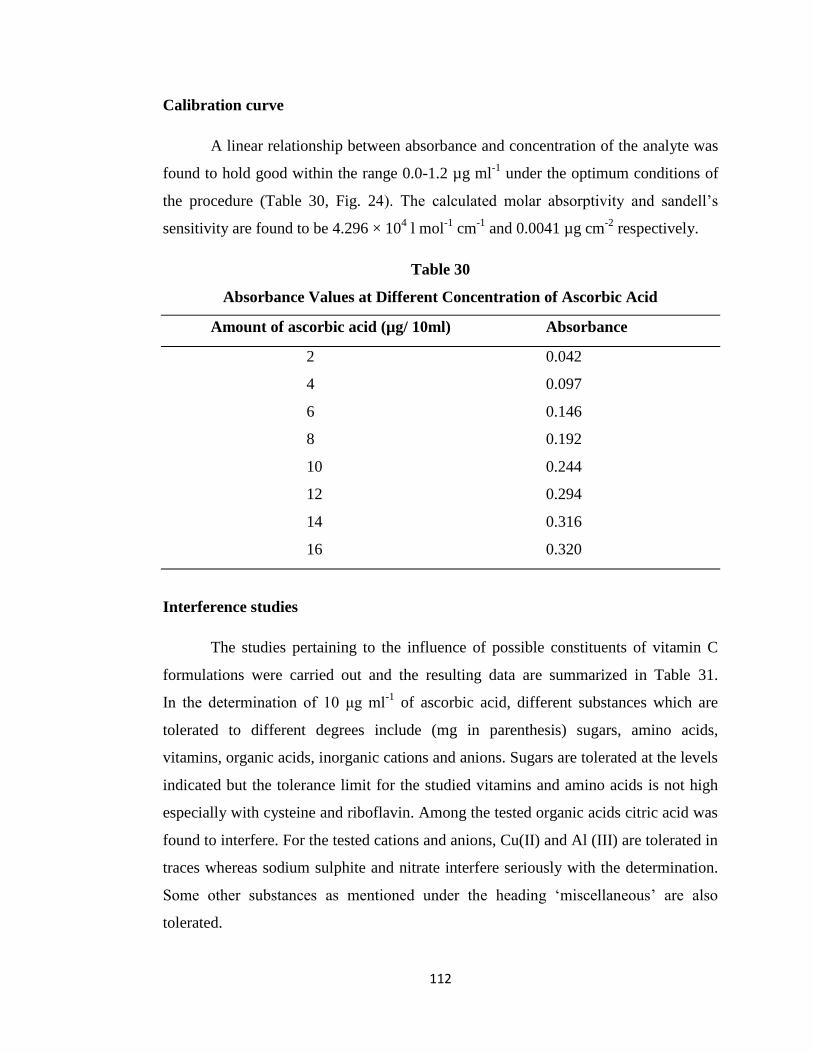
Calibration curve
A linear relationship between absorbance and concentration of the analyte was
found to hold good within the range 0.0-1.2 µg ml-1
under the optimum conditions of
the procedure (Table 30, Fig. 24). The calculated molar absorptivity and sandell‟s
sensitivity are found to be 4.296 × 10⁴ l mol
-1 cm
-1 and 0.0041 µg cm
-2 respectively.
Table 30
Absorbance Values at Different Concentration of Ascorbic Acid
Amount of ascorbic acid (µg/ 10ml) Absorbance
2 0.042
4 0.097
6 0.146
8 0.192
10 0.244
12 0.294
14 0.316
16 0.320
Interference studies
The studies pertaining to the influence of possible constituents of vitamin C
formulations were carried out and the resulting data are summarized in Table 31.
In the determination of 10 μg ml-1
of ascorbic acid, different substances which are
tolerated to different degrees include (mg in parenthesis) sugars, amino acids,
vitamins, organic acids, inorganic cations and anions. Sugars are tolerated at the levels
indicated but the tolerance limit for the studied vitamins and amino acids is not high
especially with cysteine and riboflavin. Among the tested organic acids citric acid was
found to interfere. For the tested cations and anions, Cu(II) and Al (III) are tolerated in
traces whereas sodium sulphite and nitrate interfere seriously with the determination.
Some other substances as mentioned under the heading „miscellaneous‟ are also
tolerated.

113
Fig. 24 Beer‟s law curve for ascorbic acid.
0 2 4 6 8 10 12 14 16 18
0.00
0.05
0.10
0.15
0.20
0.25
0.30
0.35
Absorb
ance
Conc. of Ascorbic acid ( g/ 10ml)
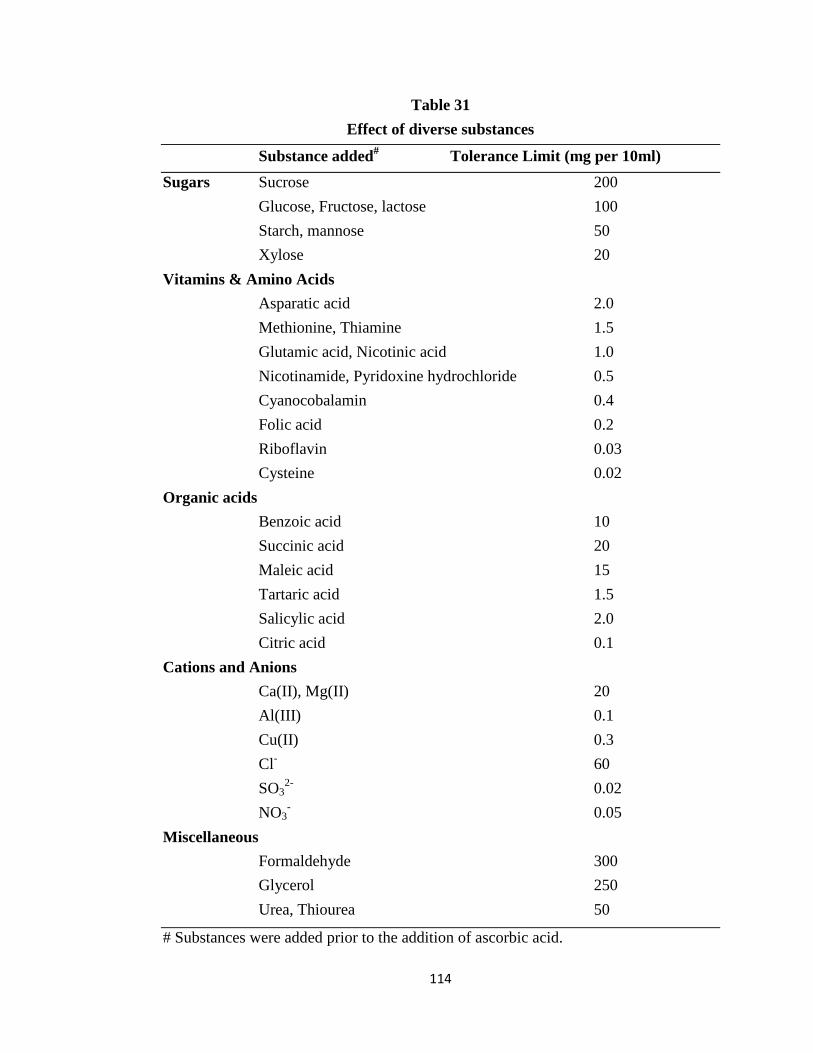
114
Table 31
Effect of diverse substances
Substance added# Tolerance Limit (mg per 10ml)
Sugars Sucrose 200
Glucose, Fructose, lactose 100
Starch, mannose 50
Xylose 20
Vitamins & Amino Acids
Asparatic acid 2.0
Methionine, Thiamine 1.5
Glutamic acid, Nicotinic acid 1.0
Nicotinamide, Pyridoxine hydrochloride 0.5
Cyanocobalamin 0.4
Folic acid 0.2
Riboflavin 0.03
Cysteine 0.02
Organic acids
Benzoic acid 10
Succinic acid 20
Maleic acid 15
Tartaric acid 1.5
Salicylic acid 2.0
Citric acid 0.1
Cations and Anions
Ca(II), Mg(II) 20
Al(III) 0.1
Cu(II) 0.3
Cl- 60
SO32-
0.02
NO3- 0.05
Miscellaneous
Formaldehyde 300
Glycerol 250
Urea, Thiourea 50
# Substances were added prior to the addition of ascorbic acid.
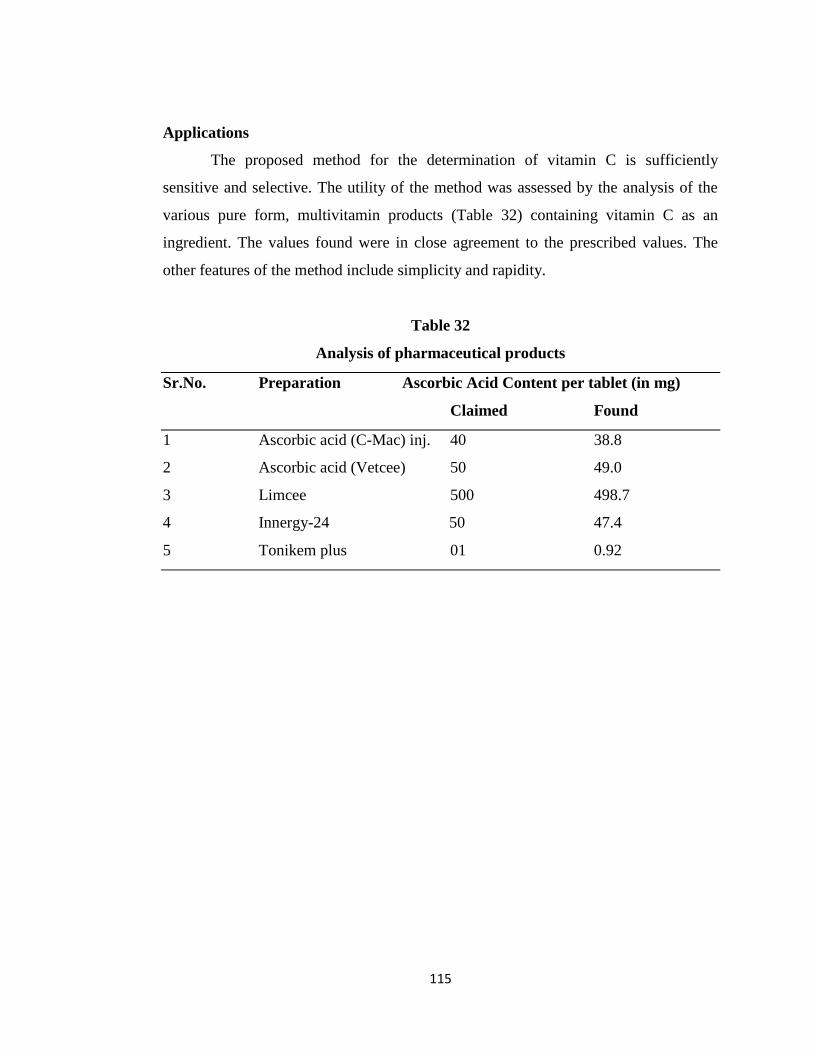
115
Applications
The proposed method for the determination of vitamin C is sufficiently
sensitive and selective. The utility of the method was assessed by the analysis of the
various pure form, multivitamin products (Table 32) containing vitamin C as an
ingredient. The values found were in close agreement to the prescribed values. The
other features of the method include simplicity and rapidity.
Table 32
Analysis of pharmaceutical products
Sr.No. Preparation Ascorbic Acid Content per tablet (in mg)
Claimed Found
1 Ascorbic acid (C-Mac) inj. 40 38.8
2 Ascorbic acid (Vetcee) 50 49.0
3 Limcee 500 498.7
4 Innergy-24 50 47.4
5 Tonikem plus 01 0.92
116
2.6.3 Abstract
A spectrophotometric method has been
developed for the determination of vitamin C in
a variety of samples. The procedure is based on
the complexation of reduced iron(II) with
Bathophenanthroline followed by its extraction
into dichloromethane. The absorbance is
measured at 485 nm. Beer’s law is obeyed up to
1.2 µg ml-1 of ascorbic acid. Interference effects of
various substances including sugars, vitamins,
amino acids, inorganic cations and anions and
some organic substances have been studied.