2. overview of the amatole – kei isp area section 2.6 2.1
TRANSCRIPT

2.1
2. OVERVIEW OF THE AMATOLE – KEI ISP AREA
This chapter provides a general water-related overview of the whole Amatole-Kei ISP area. Based on common characteristics as described in Section 2.6, the ISP area has been divided into five sub-areas in order to facilitate appropriate and more detailed situation assessments which are provided in Chapters 3 to 7.
2.1 Location
The Amatole – Kei ISP area comprises the Amatole (R) and Kei (S) primary catchments and is located in the Mzimvubu to Keiskamma Water Management Area (WMA 12) (refer Figure 2.1). These two primary catchments form the western boundary of the WMA. The ISP study area is bounded by the Great Fish River catchment in the west, the Orange River catchment in the north, and the Mbashe River catchment in the east. A second ISP study incorporating the remaining catchments (Mbashe, Mtata, Mzimvubu and Wild Coast) will complement this ISP study for WMA 12.
Figure 2.1 Locality of the Amatole - Kei ISP Area within WMA 12
The catchments encompass an area of 28 421 km2 divided between the Amatole coastal catchments (R) of 7 936 km2 and the Great Kei catchment (S) of 20 485 km2. East London is the main city in the area with Queenstown serving as the inland regional centre.

2.2
(Note : “Amatole” is the Xhosa word for heifers. Over time this was changed to “Amatola” by some sections of the population, and was used to name things such as the mountain range and the water board. Both spellings are used in this report as appropriate. There is currently a move to standardise the spelling to “Amathole” but this has not yet been approved).
22
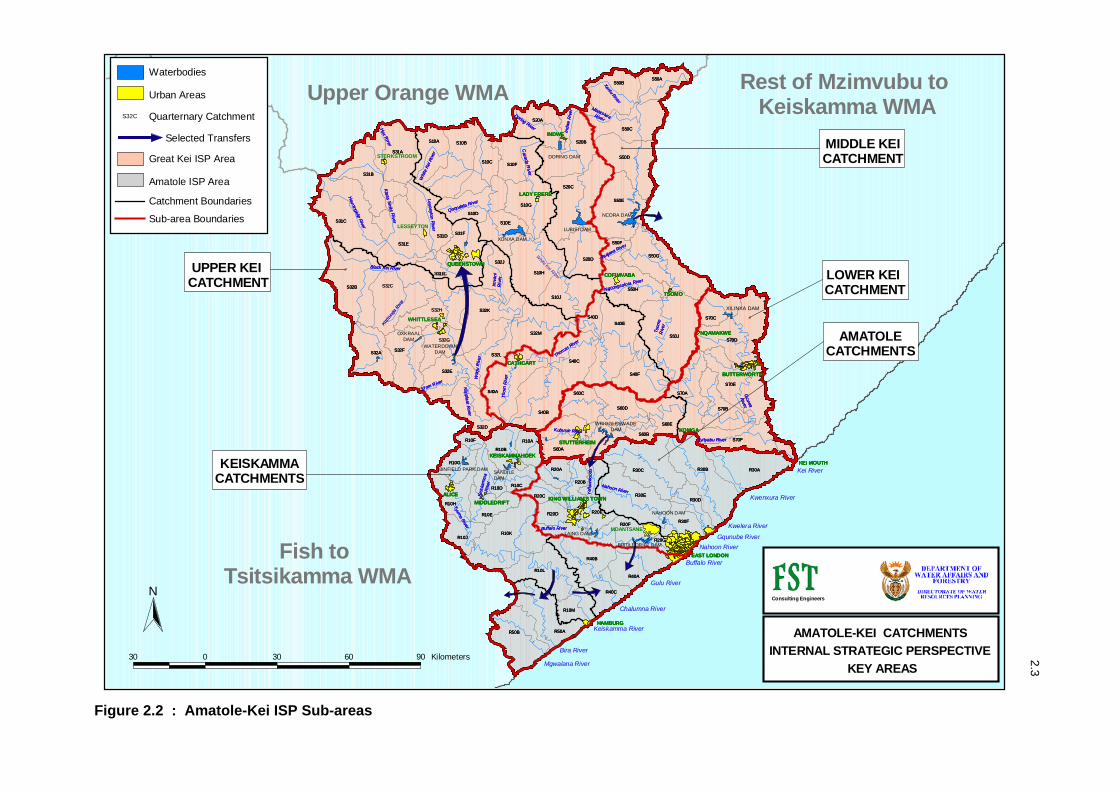
Figure 2.2 : Amatole-Kei ISP Sub-areas
2.3
N
S50J
S31C
R10K
S32B
S20C
R30B
S32C
S40E
S70D
R30C
S70E
S50G
S10H
R30E
S50E
S20B
S40A
S31E
S40B
R30A
S31A
R10L
R50B
S31B
S32K
S10B
S50D
R50A
S32M
S50C
S70F
S50H
S10G
S10J
S40F
S70A
S32H
S32F
S50B
S60A
R40A
S32A
S31D
S40C
R40B
S10D
S10F
S20D
S32L
S32D
S20A
S32E
S70B
S60B
R20F
S60D
S10A
S32J
R20D R20E
S10E
R10H
S10C
S31F
S31G
S32G
S50A
R10B
S60E
S60C
R30FR10E
S70C
R10J
R40C
R10D
R10M
R10G
R20B
R30D
R20A
R10A
R10C
S40D
R20C
R20G
S50F
R10F
EAST LONDON
ALICE
QUEENSTOWN
HAMBURG
KING WILLIAM'S TOWN
COFIMVABA
CATHCART
STUTTERHEIM
WHITTLESEA
BUTTERWORTH
KOMGA
KEI MOUTHKEISKAMMAHOEK
NQAMAKWE
TSOMO
LADY FRERE
INDWE
MIDDLEDRIFT
Tsom
o R
iver
Black Kei River
Keis
kam
ma
Riv e
r
Kubusie River
Indw
e R
i ver
Gcuwa
Riv er
Cacadu R
iv er
Kl aas Smits R
iv er
Thomas River
Whi
t e K
ei R
iver
Tyume River
Hex Ri ver
Kli pplaat Ri ver
Nahoon River
Heuningk lip River
Waq
u R
i v er
Imva
ni
Ri v
e r
Xentu River
Lesoey ton Rive r
Tsajana River
Buffalo River
Doring River
Tho r
n R
iv er
Krom River
Yel
l ow
w ood
s
Tyityabu River
Mbakotwa River
Qoqodala River
Ngcongcolora River
Kuzit
unga
Rive
r
Rest of Mzimvubu to Keiskamma WMA
Kei River
Kwenxura River
Kwelera River
Gqunube RiverNahoon River
Buffalo River
Gulu River
Chalumna River
Keiskamma River
Bira River
Mgwalana River
NCORA DAM
LUBISI DAM
XONXA DAM
DORING DAM
XILINXA DAM
WATERDOWNDAM
NAHOON DAM
BRIDLEDRIFT DAM
LAING DAM
EAST LONDON
ALICE
QUEENSTOWN
HAMBURG
KING WILLIAM'S TOWN
COFIMVABA
CATHCART
STUTTERHEIM
BUTTERWORTH
KOMGA
KEI MOUTHKEISKAMMAHOEK
NQAMAKWE
TSOMO
LADY FRERE
INDWE
MIDDLEDRIFT
STERKSTROOM
LESSEYTON
S50J
S31C
R10K
S32B
S20C
R30B
S40E
S70D
R30C
S70E
S50G
S10H
R30E
S50E
S20B
S40A
S31E
S40B
R30A
S31A
R10L
R50B
S31B
S32K
S10B
S50D
R50A
S32M
S50C
S70F
S50H
S10G
S10J
S40F
S70A
S32F
S50B
S60A
R40A
S32A
S31D
S40C
R40B
S10D
S10F
S20D
S32L
S32D
S20A
S32E
S70B
S60B
R20F
S60D
S10A
S32J
R20D R20E
S10E
R10H
S10C
S31F
S31G
S50A
R10B
S60E
S60C
R30FR10E
S70C
R10J
R40C
R10D
R10M
R10G
R20B
R30D
R20A
R10A
R10C
S40D
R20C
R20G
S50F
R10F
WRIGGLESWADE DAM
Tsom
o R
iver
Black Kei River
Keis
kam
ma
Riv e
r
Kubusie River
Indw
e R
i ver
Gcuwa
Riv er
Cacadu R
iv er
Kl aas Smits R
iv er
Thomas River
Whi
t e K
ei R
iver
Tyume River
Hex Ri ver
Kli pplaat Ri ver
Nahoon River
Heuningk lip River
Waq
u R
i v er
Imva
ni
Ri v
e r
Xentu River
Lesoey ton Rive r
Tsajana River
Buffalo River
Doring River
Tho r
n R
iv er
Krom River
Yel
l ow
w ood
s
Tyityabu River
Mbakotwa River
Qoqodala River
Ngcongcolora River
White Kei River
BINFIELD PARK DAM
OXKRAALDAM
MDANTSANE
SANDILEDAM
UPPER KEI CATCHMENT
KEISKAMMACATCHMENTS
LOWER KEI CATCHMENT
AMATOLECATCHMENTS
MIDDLE KEICATCHMENT
#
#
#
#
#
Kuzit
unga
Rive
r
Ngcongcolora River
Qoqodala River
Mbakotwa River
Tyityabu River
Yel
l ow
w ood
s
Krom River
Tho r
n R
iv er
Doring River
Buffalo River
Tsajana River
Lesoey ton Rive r
Xentu RiverIm
vani
R
i ve r
Waq
u R
i v er
Heuningk lip River
Nahoon River
Kli pplaat Ri ver
Hex Ri ver
Tyume River
Whi
t e K
ei R
iver
Thomas River
Klaas Smits R
iv er
Cacadu R
iv er
Gcuwa
Riv er
Indw
e R
i ver
Kubusie River
Keis
kam
ma
Riv e
r
Black Kei River
Tsom
o R
iver
MIDDLEDRIFT
INDWE
LADY FRERE
TSOMO
NQAMAKWE
KEISKAMMAHOEKKEI MOUTH
KOMGA
BUTTERWORTH
WHITTLESEA
STUTTERHEIM
CATHCART
COFIMVABA
KING WILLIAM'S TOWN
HAMBURG
QUEENSTOWN
ALICE
EAST LONDON
R10F
S50F
R20G
R20C
S40D
R10C
R10A
R20A
R30D
R20B
R10G
R10M
R10D
R40C
R10J
S70C
R10ER30F
S60C
S60E
R10B
S50A
S32G
S31G
S31F
S10C
R10H
S10E
R20ER20D
S32J
S10A
S60D
R20F
S60B
S70B
S32E
S20A
S32D
S32L
S20D
S10F
S10D
R40B
S40C
S31D
S32A
R40A
S60A
S50B
S32F
S32H
S70A
S40F
S10J
S10G
S50H
S70F
S50C
S32M
R50A
S50D
S10B
S32K
S31B
R50B
R10L
S31A
R30A
S40B
S31E
S40A
S20B
S50E
R30E
S10H
S50G
S70E
R30C
S70D
S40E
S32C
R30B
S20C
S32B
R10K
S31C
S50J
Upper Orange WMA
Fish to Tsitsikamma WMA
Urban Areas
Waterbodies
S32C
Selected Transfers
Great Kei ISP Area
Amatole ISP Area
Quarternary Catchment
Catchment Boundaries
Sub-area Boundaries
30 0 30 60 90 Kilometers
N
AMATOLE-KEI CATCHMENTS
Consulting Engineers
INTERNAL STRATEGIC PERSPECTIVEKEY AREAS

2.4
2.2 Physical Characteristics
2.2.1 Topography and Rivers
The topography of the ISP area is shown in Figure 2.3.
Figure 2.3 Topography of the ISP Area
The Amatole catchments have their headwaters in the southern foothills of the Amatola mountain range. This range forms the primary catchment boundary between the Amatole and Great Kei catchments for much of its length, stretching from Stutterheim in the east to Bedford in the west and reaches an altitude of approximately 1960 masl in the well-known Hogsback area. The main rivers in the Amatole area are the Keiskamma, Buffalo, Nahoon and Gqunube Rivers, all flowing in a south easterly direction from the Amatola mountains to exit into the Indian Ocean along the coastline around East London.
East London
Queenstown
StutterheimAmatolaMountainRange
Great Kei
AmatoleKWT
Butterworth
Urban Areas
Waterbodies
Elevations0 - 200200 - 400400 - 600600 - 800800 - 10001000 - 12001200 - 14001400 - 16001600 - 18001800 - 20002000 - 22002200 - 2400

2.5
The Great Kei catchment is a single fan shaped catchment draining an area bounded by the Amatola mountain range in the south, the Winterberg in the east and the Stormberg / Drakensberg range to the north of Queenstown at an altitude of 2400 masl. In the east the catchment is bounded by undulating hills running in a north-south direction to the coast separating the Kei catchment from the Mbashe catchment.
The Great Kei can be divided into three distinct areas viz. the Upper, Middle and Lower Kei catchments (refer Figure 2.2).
• Upper Kei tributaries include the Black Kei and Klipplaat Rivers with their headwaters in the northern slopes of the Amatola mountain range. These rivers drain in a northerly direction before turning east to join up with the non-perennial Heuningklip and Klaas Smits Rivers, which have their headwaters in the northeast. The remainder of the Upper Kei catchment consists of the White Kei and Indwe Rivers with their headwaters in the southern slopes of the Stormberg / Drakensberg range.
• In the Middle Kei catchment, the Great Kei River is joined by the Thomas River flowing from the Amatola mountain range in the west, and the Tsomo River in the east with its source in the southern Drakensberg foothills near the town of Elliot.
• In the Lower Kei catchment, the Great Kei River is joined by the Kubusi River flowing from the Amatola mountain range in the west, and the Gcuwa River from the east. The middle and lower Great Kei River is characterized by a deeply incised valley before exiting into the Indian Ocean at Kei Mouth.
2.2.2 Geology
The ISP area consists predominantly of the Beaufort Series of the Karoo Supergroup with the Adelaide subgroup between the coast and the Amatola mountains, the overlying Tarkastad subgroup between the Amatola mountains and the Stormberg / Drakensberg range, and the Cape Supergroup (Molteno and Elliot formations) along the northern boundary.
The Adelaide subgroup comprises mostly mudstones alternating with lithofeldspathic sandstones. The Tarkastad subgroup is characterized by a greater proportion of sandstone and red coloured mudstone. The Molteno formation contains yellow grey sandstones alternating with olive mudstones and grey shale. The Elliot formation which overlies the Molteno formation comprises an upward fining cycle of sandstone, siltstone and mudstone.
There are extensive intrusive hypabyssal dolerite sills and dykes throughout the area with characteristic ring structure formations in the Upper Kei catchment around Queenstown. The Amatola mountain range forms the southern boundary of one of these ring structures.

2.6
A characteristic of the geology and soils of the area is that once the vegetation is removed by whatever means, erosion of the topsoil is rapid due to the nature of the dispersive soils derived from the underlying geology. This in turn causes high turbidities/suspended solids in the rivers and reduced quality of the water in the rivers and dams as well as siltation of dams.
Reference should be made to Section 2.7.3 : Groundwater Resources, for insight into the relationship between geology and groundwater in the ISP area.
2.2.3 Climate and Rainfall
The climate and temperature variations of the ISP area are closely related to elevation and proximity to the coast. The area experiences a temperate climate along the coast to more extreme conditions inland. Most rainfall occurs during the summer months.
Temperature variations along the coast are less pronounced than inland where frost (and sometimes snow) is regularly experienced during the winter months while temperatures regularly exceed 400C during the summer months.
Rainfall increases from the west to the east and from inland to the coast with a local high along the Amatola mountain range. Annual rainfall along the coastline varies from approximately 500 mm in the west to approximately 1000 mm in the east, and over 1200 mm in the Amatola mountains.
Annual rainfall in the Kei catchment varies from a low of approximately 400 mm in the Upper Kei area around Sterkstroom, to 700 mm in the Middle Kei, to 1000 mm at Kei Mouth. The highest rainfall area is again in the Amatola mountains.
Figure 2.4 Rainfall in WMA 12
500 - 600 mm
400 - 500 mm
600 - 700 mm
700 - 800 mm
800 - 1000 mm
1000 - 1500 mm

2.7
2.2.4 Vegetation
The ISP area can be described in terms of indigenous (natural vegetation) and exotic (generally formal afforestation and alien invasives) vegetation.
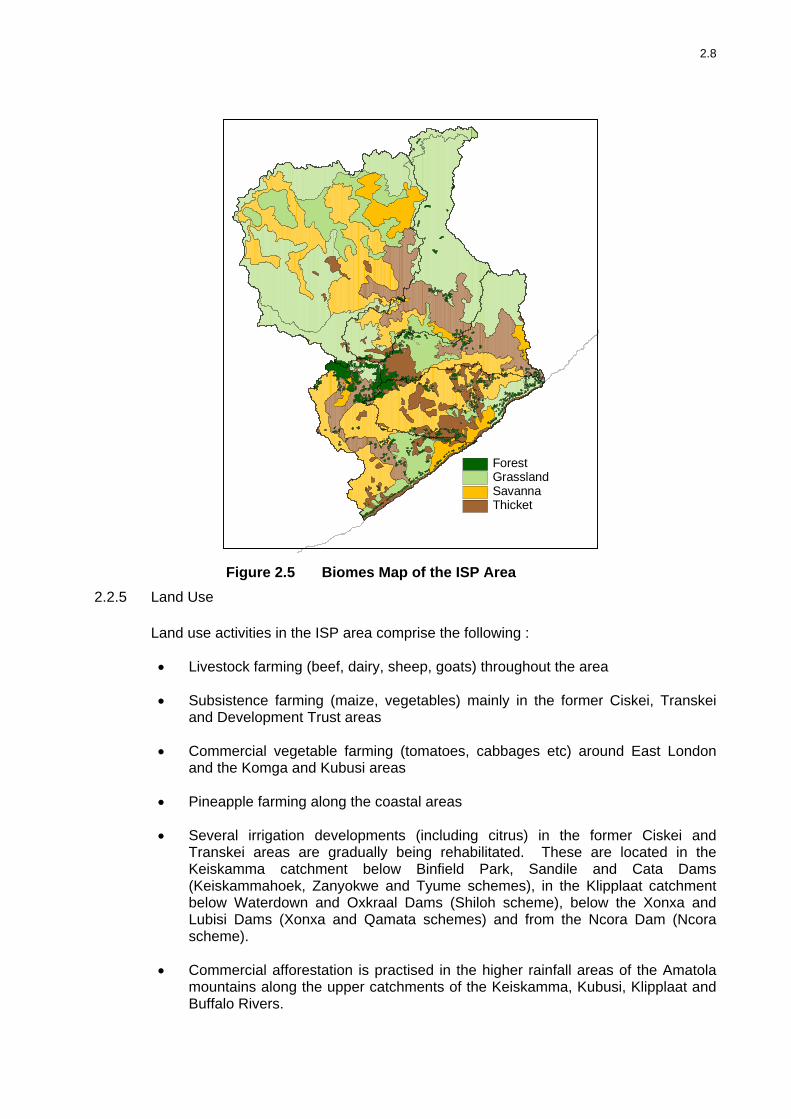
• Indigenous Vegetation. The Eastern Cape is considered to be South Africa’s most geologically diverse province, supporting all seven identified biomes and the second greatest plant species richness after the Western Cape. Within the ISP area four natural biomes occur; forest, grassland, savanna and thicket. In the Amatole catchments the dominant biomes is savanna (eastern thorn bushveld and coastal thornveld) followed by grassland (coastal grassland and Dohne sourveld). Within the Upper and Middle Kei catchments, grasslands (highveld) dominate, followed by savanna (eastern thorn bushveld) and valley thicket (valley bushveld) in the Kei River valley. This diversity is being threatened by alien invasives, overgrazing, wood gathering, veld burning and poor farming activities.
• Forestry. Most forests (commercial and indigenous) are in the high rainfall areas of the Amatola mountains and consist of approximately 380 km2 of commercial Pinus and Eucalypt species, and indigenous afromontane forests.
• Alien Plants. Alien plant species considered as invasives consist mainly of black and silver wattle and eucalypt species and can be found throughout the area. The main problem areas are in the southern foothills of the Amatola mountain range (between King William’s Town, Stutterheim and Keiskammahoek) and in the former Transkei area between Butterworth and Nqamakwe. Weed invasives (Lantana, Sesbania etc) can also be found in most riparian vegetation.
In addition to the above land based alien invasives, water weed (hyacinth, etc) and algal blooms are an increasing problem in some of the larger dams (Bridle Drift, Laing, Wriggleswade, Nahoon) in the Amatole catchments due to nutrients originating from waste water treatment works, pollution from urban run-off and resultant eutrophication.
2.8
Figure 2.5 Biomes Map of the ISP Area
ForestGrasslandSavannaThicket
2.2.5 Land Use
Land use activities in the ISP area comprise the following :
• Livestock farming (beef, dairy, sheep, goats) throughout the area
• Subsistence farming (maize, vegetables) mainly in the former Ciskei, Transkei and Development Trust areas
• Commercial vegetable farming (tomatoes, cabbages etc) around East London and the Komga and Kubusi areas
• Pineapple farming along the coastal areas
• Several irrigation developments (including citrus) in the former Ciskei and Transkei areas are gradually being rehabilitated. These are located in the Keiskamma catchment below Binfield Park, Sandile and Cata Dams (Keiskammahoek, Zanyokwe and Tyume schemes), in the Klipplaat catchment below Waterdown and Oxkraal Dams (Shiloh scheme), below the Xonxa and Lubisi Dams (Xonxa and Qamata schemes) and from the Ncora Dam (Ncora scheme).
• Commercial afforestation is practised in the higher rainfall areas of the Amatola mountains along the upper catchments of the Keiskamma, Kubusi, Klipplaat and Buffalo Rivers.

2.9
Figure 2.6 Land Use Map of the ISP Area
Cultivated: DrylandCultivated: IrrigatedDegradedForestGrasslandShrublandThicket & bushlandUrbanWaterbodies
2.3 Demography
The estimated population of the ISP area in the year 2000 was some 1,761,000 with 953,000 (54%) people residing in the Amatole catchment and 808,000 (46%) in the Kei catchment (Ref. 6 and 24). Of this total population approximately 26% live in urban or peri-urban areas and 74% live in rural areas. The population in the Amatole catchment is projected to grow to approximately 1,2 million by the year 2025, while the population within the Kei catchment is expected to decline very slightly. The main reasons for this will be due to migration of people from the rural areas to urban areas for economic reasons, and the impact of HIV/AIDS especially after 2005. The only urban area expected to experience significant growth in the future is the Buffalo City Municipal area where employment opportunities will attract people from the smaller urban centres and rural areas.
The Amatole area is characterized by a large urban and peri-urban population within the Buffalo City Municipal area (East London – Mdantsane – Bisho – King William’s Town corridor), which contains some 730,00 people (2000) or some 77% of the total population of the Amatole catchment. The remaining population reside in small rural towns and scattered rural villages. Queenstown, Stutterheim and Butterworth are the

2.10
largest formal urban centres in the Kei catchment with most people living in scattered rural villages.
The ISP area comprises large portions of the former Ciskei and Transkei. These areas are characterized by large, dense rural settlements (villages) with populations often in excess of 10,000 people.
2.4 Land Tenure
Land tenure in the area is characterised by private ownership on the one hand, and the different systems found in the former Ciskei and Transkei where there are five categories of land tenure :
• Tribal land, sometimes coupled with the quitrent system. This constitutes over 80% of the former homelands areas
• Freehold land • State land • Municipal land • Institutional land (churches etc)
Within what was the former South African component of the area, the majority of land is held under freehold title either by individuals or farming syndicates. The remaining areas are state, municipal and institutional lands.
Due to some of the difficulties associated with the tribal land tenure system such as overgrazing on communal lands etc, attempts have been made in the past to change the system but these have not met with much success.
2.5 Economic Development
East London, with its airport and harbour, is the centre of economic activity in the ISP area. This is enhanced by rail links to the interior and a national road system. The Eastern Cape Provincial Government has identified the following four sectors which will form part of its Growth and Development Strategy for the next ten years.
A number of manufacturing industries have established themselves in East London, the largest being the Daimler Chrysler motor manufacturing where vehicles are exported worldwide. Other main industries include tanneries, textiles (Da Gama), toiletries (Johnson & Johnson), pharmaceuticals (Pharmacare) and confectionery (Nestle).
With little incentive for large scale economic development elsewhere in the region, other than expansion of agricultural activities, the main opportunities for further economic growth will continue to be based on the development of industries and trade in the Buffalo City Municipal area (BCM) consisting of the East London - King William’s Town corridor. This has been recognized by government, and the East London Industrial Development Zone (ELIDZ) is presently being established as an incentivised trade zone.

2.11
Queenstown (Ezibeleni), Dimbaza and Butterworth previously had a strong core of manufacturers, but these collapsed and/or relocated once the regional industrial development programme supporting the previous government’s homeland policy was disbanded. Only a small number of industries remain in these industrial areas, serving mainly the local populace.
East London and the surrounding coastline is increasingly becoming the focus for regional tourism. Further expansion of tourism facilities will create labour enhancing opportunities in an area where the unemployment rate exceeds 50%.
Economic activity outside of the BCM area is largely based on farming and agricultural related activities. These include meat (beef and mutton), wool, dairy, pineapples, tomatoes, vegetables and a once thriving citrus industry in the Tyume - Kat River area. Some growth of local rural economic activities and poverty alleviation should take place once the irrigation schemes in the former Ciskei and Transkei homelands are rehabilitated and placed on a sound and sustainable economic footing.
The commercial forestry industry is centred in the Amatola mountains around Stutterheim. Potential exists for the manufacture and processing of products from these primary agricultural and forestry activities.
The area has no exploitable minerals other than construction aggregates (sand and stone) and some minor coal seams in the Indwe area.
2.6 Identification of Sub-areas
In order to undertake meaningful situation assessments to identify the main water resource management issues and to develop applicable management strategies, the Amatole - Kei ISP area has been divided into five sub-areas based on common features such as catchments, water supply systems and land use. It is recognized that the selection of catchments making up each sub-area is to some extent subjective and different possibilities exist. The following sub-division is considered practical and manageable. Coastal catchments were grouped based on current and future inter-dependence.
Five sub-areas have been identified as follows (refer Figure 2.2) :
• The Amatole sub-area - catchments R20/30
• The Keiskamma sub-area - catchments R10/40/50
• The Upper Kei sub-area - catchments S10/20/31/32
• The Middle Kei sub-area - catchments S40/S50
• The Lower Kei sub-area - catchments S60/70
A detailed situation assessment for each of the five sub-areas is given in Chapters 3 to 7.

2.12
2.6.1 The Amatole Sub-area
The main rivers in this sub-area are the Buffalo (R20), Nahoon, Gqunube, Kwelera and Kwenxura Rivers (R30).
The reason for this sub-area is the regional Amatole Water Supply System (AWSS) which supplies the Buffalo City Municipality. Although not part of this sub-area, the upper Kubusi catchment including the Wriggleswade and Gubu Dams forms part of the AWSS as the infrastructure exists to transfer up to 18 million m3/a of water from the Wriggleswade Dam to the Buffalo/Nahoon/Gqunube catchments for use in the Buffalo City Municipal area.
2.6.2 The Keiskamma Sub-area
The main river in this sub-area is the Keiskamma River (R10) together with the small coastal rivers of Magwalana and Bira (R50), and Chalumna and Gulu (R40). This sub-area has been selected due to the users in these two coastal catchments who generally obtain their water requirements from the Keiskamma River.
Most of this sub-area previously fell within the borders of the former Ciskei. As such, the area is characterized by rural towns and settlements with subsistence farming and communal grazing being the main land uses. A number of irrigation schemes (Keiskammahoek, Tyume, Zanyokwe) are located in the upper part while dry land pineapple schemes exist in the lower part of the area. These are at various stages of being revitalised after lying moribund for a number of years. A number of small resorts/towns are located along the coastline south of East London.
2.6.3 The Upper Kei Sub-area
The main rivers in this sub-area are the White Kei (S10), the Indwe (S20), the Heuningklip and Klaas Smits (S31), and the Black Kei and Klipplaat Rivers (S32).
The main reasons for the sub-area grouping is geographical as well as water supply to Queenstown and surrounding users. The sub-area catchments, water resources and water developments have been analysed in the past in DWAF studies (Ref. 19 and 20).
The main demographic feature of the sub-area is the urban area of Queenstown, which acts as the regional centre for the Upper Kei Catchment. The town obtains most of its raw water supply from the Waterdown Dam on the Klipplaat River. Queenstown is currently facing a water supply crisis due to a severe drought in the region and the taking up of water allocations from Waterdown Dam for irrigation. Possible future supplementary water supply for Queenstown could come from the Xonxa Dam on the White Kei River. A number of irrigation schemes (Shiloh, Xonxa, Qamata) are located in the former Ciskei and Transkei areas and these are also in various stages of being rehabilitated.

2.13
2.6.4 The Middle Kei Sub-area
The main rivers in this area are the Thorn and Thomas (S40), and the Tsomo Rivers (S50).
This sub-area epitomizes the variation within the Great Kei Catchment from a land use point of view. While the S40 catchment is characterized by large scale privately owned livestock farms, the S50 catchment reflects the rural settlements and subsistence farms of the former Transkei. The Ncora Dam scheme on the Tsomo River transfers approximately 105 million m3/a of water to a tributary of the Mbashe River in the Mzimvubu – Mbashe part of WMA 12. Of this, 85 million m3/a is allocated for hydropower at the Ncora Dam itself and at Collywobbles lower down in the Mbashe catchment, and 20 million m3/a is allocated to the Ncora Irrigation Scheme, also in the Mbashe catchment. The Ncora scheme is the only scheme transferring bulk raw water into a different ISP area, although still within the same WMA.
2.6.5 The Lower Kei Sub-area
The main rivers in this sub-area are the lower reaches of the Great Kei River to its estuary including the Gcuwa River (S70) and the Kubusi River (S60).
As for the Middle Kei sub-area, this sub-area is characterized by large scale privately owned irrigation and livestock farms in the Kubusi catchment, while the S70 catchment reflects the rural settlements and subsistence farms of the former Transkei. The main urban centres are Butterworth and Stutterheim.
2.7 Water Resources Overview
This section provides a general overview of the water resources situation in the ISP area including water quality and the state of water infrastructure. Separate sections on surface and groundwater aspects are included although the level of detail and accuracy of knowledge of the latter is not on a par with the surface water aspects. As part of this study differences have been identified between the National Water Resources Strategy (Ref. 8) and the ISP water resource yield and water requirement figures. A comparison is made between the ISP and the NWRS figures in Chapter 8.
2.7.1 Institutional Arrangements
Water resources and water supply fall under the jurisdiction of DWAF, the District Municipalities (DMs) as the Water Service Authorities (Amatole and Chris Hani DMs) and Water Service Providers, which include some of the local municipalities (BCM) and the Amatola Water Board (AW) (refer Appendix B7). Owing to historical reasons, water supply schemes are currently owned, operated and maintained to a lesser or greater degree by the above institutions, with areas of overlap. An example of this is that all dams on the Buffalo and Nahoon Rivers except for Bridle Drift Dam are owned by DWAF and operated by the AW respectively. BCM owns and operates Bridle Drift Dam. This has implications with respect to optimal operation of water resources, water supply and tariffing. Small local municipalities, which have been authorised to act as Water Service Providers have in general not been able to fulfil this function adequately

2.14
and the DMs are assuming this role where necessary. Realignment of roles according to the Water Act is ongoing but is constrained by the lack of financial and skilled manpower resources.
Representative Catchment Forums for this ISP area are scheduled to be in place by April 2004. The establishment of Water User Associations is being encouraged by DWAF, but the process is likely to take several years to complete.
2.7.2 Surface Water Resources, Water Infrastructure and Water Quality
Based on the NWRS and supporting reports (Ref. 8 and 9), catchment wide figures are presented in Tables 2.1 to 2.3 for the natural mean annual runoff (MAR) and estimated requirements for the ecological component of the Reserve, water requirements for the year 2000 and available water in the year 2000. Comparative ISP figures, compiled in Chapters 3 to 7, are compared with the following NWRS figures in Chapter 8. Where differences occur, these differences have been explained with justifications for recommending that the revised ISP figures be used.
Table 2.1 Natural Mean Annual Runoff and Ecological Reserve
Primary Catchment
Natural MAR (million m3/a)
Ecological Reserve (million m3/a)
Amatole 559 116 Kei 1 027 154
Total 1 586 270
A summary of the sectoral water requirements in each of the primary catchments in this ISP area is given in Table 2.2. All requirements are given at a 98% assurance of supply.
Table 2.2 Water Requirements in the Year 2000 (million m3/a)
Primary Catchment
Irrigation Urban(1)
Rural(1)
Mining & Bulk
Industrial(2)
Power Gener-ation
(3)
Affore- station
(4)
Total Local
Require- ments
Transfers out
Grand Total
Amatole 33 57 5 0 0 4 99 0 99
Kei 135 18 10 0 0 11 174 85 259
Total 168 75 15 0 0 15 273 85 358 (1) Includes component of Reserve for basic human needs at 25 l/c/d. (2) Mining and bulk industrial water uses which are not part of urban systems. (3) Includes water for thermal power generation only. Water for hydropower, which represents a small portion of power
generation in South Africa, is generally available for other uses as well. (4) Quantities given represent impact on yield only.
2.15
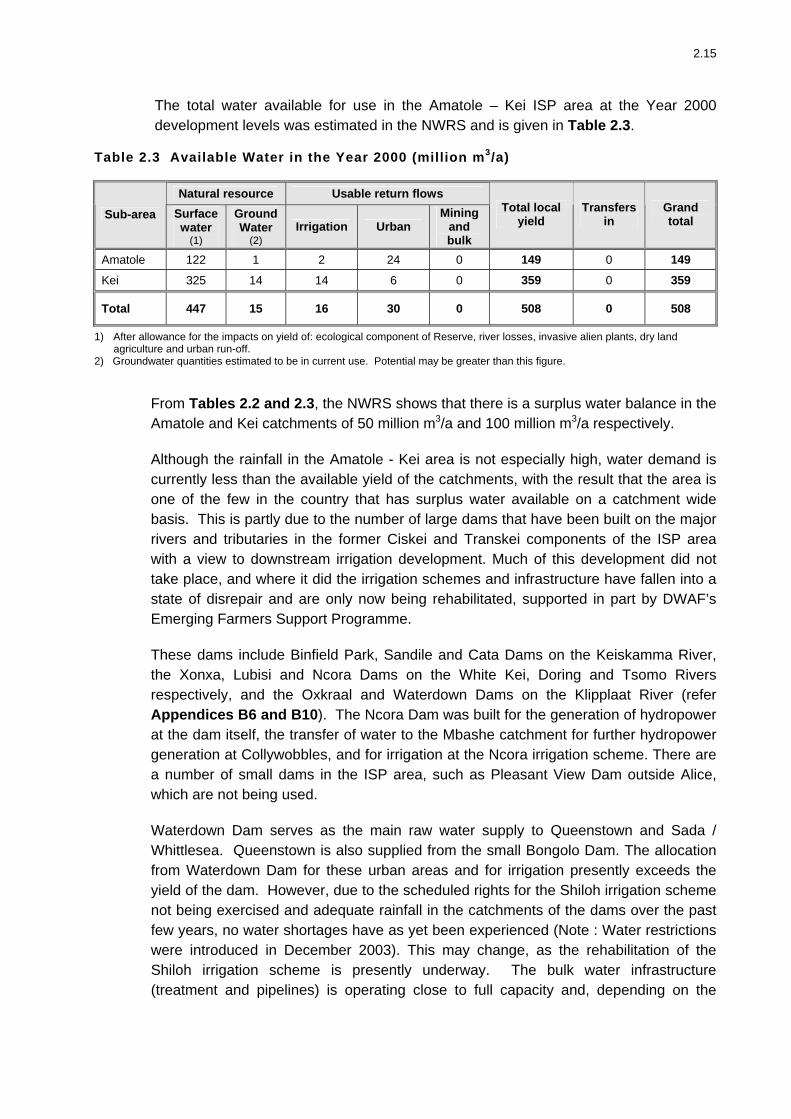
The total water available for use in the Amatole – Kei ISP area at the Year 2000 development levels was estimated in the NWRS and is given in Table 2.3.
Table 2.3 Available Water in the Year 2000 (million m3/a)
Natural resource Usable return flows
Sub-area Surface water
(1)
Ground Water
(2) Irrigation Urban
Mining and bulk
Total local yield
Transfers in
Grand total
Amatole 122 1 2 24 0 149 0 149 Kei 325 14 14 6 0 359 0 359
Total 447 15 16 30 0 508 0 508
1) After allowance for the impacts on yield of: ecological component of Reserve, river losses, invasive alien plants, dry land agriculture and urban run-off.
2) Groundwater quantities estimated to be in current use. Potential may be greater than this figure.
From Tables 2.2 and 2.3, the NWRS shows that there is a surplus water balance in the Amatole and Kei catchments of 50 million m3/a and 100 million m3/a respectively.
Although the rainfall in the Amatole - Kei area is not especially high, water demand is currently less than the available yield of the catchments, with the result that the area is one of the few in the country that has surplus water available on a catchment wide basis. This is partly due to the number of large dams that have been built on the major rivers and tributaries in the former Ciskei and Transkei components of the ISP area with a view to downstream irrigation development. Much of this development did not take place, and where it did the irrigation schemes and infrastructure have fallen into a state of disrepair and are only now being rehabilitated, supported in part by DWAF’s Emerging Farmers Support Programme.
These dams include Binfield Park, Sandile and Cata Dams on the Keiskamma River, the Xonxa, Lubisi and Ncora Dams on the White Kei, Doring and Tsomo Rivers respectively, and the Oxkraal and Waterdown Dams on the Klipplaat River (refer Appendices B6 and B10). The Ncora Dam was built for the generation of hydropower at the dam itself, the transfer of water to the Mbashe catchment for further hydropower generation at Collywobbles, and for irrigation at the Ncora irrigation scheme. There are a number of small dams in the ISP area, such as Pleasant View Dam outside Alice, which are not being used.
Waterdown Dam serves as the main raw water supply to Queenstown and Sada / Whittlesea. Queenstown is also supplied from the small Bongolo Dam. The allocation from Waterdown Dam for these urban areas and for irrigation presently exceeds the yield of the dam. However, due to the scheduled rights for the Shiloh irrigation scheme not being exercised and adequate rainfall in the catchments of the dams over the past few years, no water shortages have as yet been experienced (Note : Water restrictions were introduced in December 2003). This may change, as the rehabilitation of the Shiloh irrigation scheme is presently underway. The bulk water infrastructure (treatment and pipelines) is operating close to full capacity and, depending on the

2.16
source of additional raw water supply, this aspect will also need to be addressed in the near future.
Within the Amatole Water Supply System (AWSS) the development of dams has been such that with inter-basin transfer from the Kubusi River to the Buffalo/Nahoon Rivers, the system will be in surplus until approximately 2012. Large dams within the AWSS system include the Maden, Rooikrantz, Laing, Bridle Drift, Nahoon, Gubu and Wriggleswade Dams. However, while there is currently an overall surplus of raw water available, there is an urgent need for the implementation of additional water treatment facilities and bulk supply infrastructure to provide treated water to the growing demand in the Buffalo City municipal area.
Planning studies for the augmentation of additional water supplies to both the Buffalo City Municipal area and the Queenstown area have been ongoing for a number of years. Water Service Development Plans (WSDPs) recently completed for these two municipalities outline the strategies for future water supplies and include as a high priority the need for water conservation and demand management programmes. Water re-use has been considered in the WSDPs but this is currently viewed as being an expensive option for domestic water supply augmentation. However, consideration is being given to a treated effluent supply from the East Bank Reclamation Works in East London to the new ELIDZ for use as industrial water. A sea outfall raw effluent discharge works is presently under construction in East London at Hood Point, but further work has been delayed due to a lack of funds.
Water supply infrastructure to smaller towns is adequate with most schemes having been upgraded through funds from the Consolidated Municipal Infrastructure Programme. No serious infrastructure problems have been identified in any of the towns in the ISP area, although as mentioned the lack of skilled manpower and finances is seriously affecting the operation and maintenance of most small town water supply schemes.
There has been a major emphasis in the past decade in addressing the backlogs in water supply infrastructure in the rural areas with many rural water supply schemes having been commissioned. The main thrust for this has been through DWAF’s Community Water Supply and Sanitation programme, which has included the BoTT programme in the Eastern Cape. These schemes included both surface and groundwater supplies throughout the rural areas. Latest census figures show that approximately 63% of people in the Eastern Cape have access to treated water from a tap. Much has been achieved, but full water supply coverage will only be achieved with ongoing support from DWAF and the Local Authorities. This is expected to take at least another 10 years at the present rate of progress. Sanitation infrastructure lags behind water supply infrastructure, with only some 30% of people having access to acceptable toilet facilities. This has serious implications for health and for the water quality aspects of both the rivers and groundwater resources, especially in the rural areas where the problem is widespread and where many people still obtain their water from rivers, springs and boreholes which are exposed to contamination.
2.17
Water quality in the rivers in the Amatole sub-area catchments varies from good in some of the smaller rural coastal catchments, to medium in the larger less impacted rivers such as the Keiskamma and Gqunube Rivers, to poor in the severely impacted urban rivers i.e. the Buffalo and Nahoon Rivers and small rivers in East London. The reasons for the water quality problems include high turbidities due to soil erosion, overloaded sewage treatment works, runoff from unlicensed solid waste sites, poorly designed and maintained sewerage infrastructure, urban runoff, runoff from informal settlements without adequate sanitation and illegal industrial pollution. These same pollutants impact on the groundwater resources of the area. Within the rural areas, where adequate sanitation only serves some 30% of the population and water is often sourced from boreholes and springs without treatment, pollution of the groundwater poses a serious threat to the health of the people.
Within the Upper and Middle Kei catchments, river water quality can be described as medium, with the main impacts being from soil erosion and runoff from rural settlements where adequate sanitation does not exist. In the Lower Kei catchment and more especially the Gcuwa tributary which runs through Butterworth, serious pollution results from poorly maintained and operated sewage works and infrastructure, a large unlicensed solid waste site located on the river bank, and effluent discharges from industries such as tanneries.
Ecological Reserve determinations for all the rivers in the ISP area have been performed at desktop level during compilation of the NWRS. Intermediate ecological Reserve determinations have been conducted for the Nahoon, Kubusi, Buffalo and Upper Kei Rivers during various situation assessment studies. Some water quality objectives were also established during this exercise.
2.7.3 Groundwater Resources
Although it is estimated that significant quantities of groundwater could be abstracted in the ISP area, the actual use of groundwater is relatively small over most of the area. This is mainly attributed to the generally well-watered nature of the area and the wide occurrence of perennial surface streams, which reduces the need for groundwater abstraction.
As a result the role of groundwater resources has been primarily to supply rural villages, farmers and small coastal resorts where surface water does not exist. The quantity and quality of the groundwater varies from poor along the coastline, to medium to good within the Amatola mountains and within the Upper Kei catchment, especially when associated with dolerite structures. Water of high salinity is found along the coast and at some inland locations where the rainfall is low and the geology is unfavourable.
Many rural villages have in the past been supplied with groundwater due to its low cost in comparison with surface water supplies. These groundwater supplies have often been of low quantity (< 25 l/c/d) due to poor siting, drilling and testing techniques. In addition, the necessary management and operational skills have often been lacking with the result that groundwater supplies are generally perceived as been unreliable.
2.18
However, with the advance in groundwater knowledge and technical skills, the success of using groundwater for rural village water supplies is improving. Due to its potential as a low cost basic water supply to remote rural villages, groundwater is currently considered as a first step for almost all new rural water supply schemes in the region where it is available.
Alluvial groundwater extraction for irrigation purposes is practised, mainly along the Klaas Smits and Heuningklip Rivers in the Upper Black Kei catchment. The potential for further large scale use of groundwater for irrigation is largely unknown but is considered high especially in the low rainfall parts of the ISP area. This will depend on improved knowledge of the groundwater resources of the region and the identification of areas where high yielding boreholes can be developed.
Rural coastal villages and resorts either side of East London have historically relied on small groundwater schemes of varying quantity and generally poor water quality. Where feasible these schemes are gradually being replaced with surface water supplies sourced from a number of regional water supply schemes.
The groundwater quantity and quality throughout the area reflect the underlying geology, which is dominated by the upper Beaufort Group (Tarkastad Subgroup) and overlying formations in the uplands area, and the Witteberg, Ecca and lower Beaufort Group (Adelaide Subgroup) on the coastal plateau. Major Karoo dolerite sills and dykes are also a conspicuous feature of the geology. There are minor coastal dune areas south of East London, and areas of alluvial gravel and sand along the rivers in the Upper Kei Catchment. Based on the regional geology and tectonic history, the porosity, permeability and transmissivity of the aquifers are different and several Geohydrological Provinces can be identified according to the catchments. The Eastern Cape Lowlands and the Amatola - Stormberg Uplands Geohydrological Provinces respectively consist of three and two sub-areas.

2.19
Table 2.4 Geohydrology of the Amatole - Kei Region
Hydrogeological Province
(Subprovince)
Catchments Geology/Hydrogeology Preferred Groundwater Targets
Eastern Cape Lowlands Keiskamma R50, R10 (Karoo dolerites)
Adelaide Subgroup Ecca Group Witteberg Group (upper)
Karoo dykes in upper R10; Witteberg sandstone in R50
Buffalo R40, R20, R30 Karoo dolerites Tarkastad Subgroup (in downfaulted blocks) Adelaide Subgroup
Karoo dyke and sill structures; Katberg sandstone near fault zones
Lower Kei S60, S70 (less S70C & S70D)
Karoo dolerites Adelaide Subgroup
Karoo dyke and sill structures
Amatola-Stormberg Uplands Katberg S32, S40, (plus
S50G, S50G, S50J, S70C, S70D)
Tertiary-Quaternary alluvials Karoo dolerites Burgersdorp Formation Katberg Formation
Karoo dykes and ring (sill) structures; Fractured Katberg sandstone
Stormberg Foothills S31, S10, S20, S50A-S50E
Tertiary-Quaternary alluvials Karoo dolerites Drakensberg Formation Clarens Formation Elliot Formation Molteno Formation Burgersdorp Formation
Karoo dykes and ring (sill) structures, in conjunction with sandstone members in otherwise generally shaly units (e.g., Indwe Sandstone in Molteno Fm)
The central Amatola-Stormberg Uplands (Katberg) area receives the greatest amount of rainfall in the region, which reflects in the recharge potential. Snowfalls on the Winterberg and Stormberg probably add to this. Surface water runoff as well as the groundwater gradient drains off the Amatola mountains to the hinterland into the tributaries of the Upper Kei River as well as to the coast into the Keiskamma and the smaller tributaries of the Middle and Lower Kei River in the east.
The R20, R30 and R40 catchments comprise the Buffalo sub-area of the Eastern Cape Lowlands Hydrogeological Province. These rivers drain from Beaufort shale and is Karoo dolerite dominated. It appears that some boreholes drilled into this sub-area have targeted the dolerite structures (dyke/sills) that extend along WNW/ESE trends between King William’s Town and East London. Some springs may also be aligned along these features. These dykes and associated faults represent recent tectonic activity and are related to the separation of the Falkland Plateau during the break-up of Gondwanaland, therefore better yielding boreholes and associated springs. Boreholes drilled to the east however appear to have been more randomly sited.
It is also evident that the springs, which feed the larger perennial rivers in this ISP area are associated with the dolerite ring structures (refer Appendix B4.2). The ring structures in the area north of East London have not been adequately explored However, from a water resources perspective the ring structures have great significance and several communities are dependent on ring structures as a single or conjunctive water resource. The long time dependence of Komga (until recently) on groundwater and the fresh water springs feeding into the Kei River south of Butterworth and north and east of Komga are typical of this hydrogeological pattern. It is unknown

2.20
to what extent the groundwater investigations in the Toleni district intercepted or targeted this aquifer.
The Amatola mountains are dominated by what is called the Cathcart Ring Structure, which has at its centre the village of Cathcart. North of Queenstown is the well studied but smaller Qoqodala Ring Structure. Immediately north of Cathcart there are a series of smaller ring structures lying east-west in a band on the northern foothills of the Amatola. These structures are interspersed with a number of old land surfaces with extensive alluvial deposits from which a number of springs emerge. This land surface is present at two elevations, viz ~1100-1200 masl and ~ 900 masl.
There is limited understanding of variations in spring discharge with climate variations, snowfall and natural impacts on base flow versus anthropogenic or abstraction influence. Current understanding of the relationship of different aquifers to spring flow and base flow is undocumented and not considered in either surface water or groundwater management or regulatory decisions. This is of particular importance in evaluating the groundwater reserve for estuaries and unregulated rivers and in aquifer protection.
The groundwater quality varies significantly between the fractured rock aquifers and the groundwater found in the “intergranular (weathered) and fractured”, or more traditionally termed regolith aquifers that lie to the north and south of the Amatola mountains, and which overlie generally impermeable shale-dominated formations. While the former generally have a total dissolved solids (TDS) of less than 300 mg/l, the regolith aquifers yield groundwater with a TDS greater than 300 mg/l and as high as 2000 mg/l. The groundwater in the high lying alluvium is generally of good quality while the coastal dunes yield poorer quality water
The fractured rock aquifers are vulnerable to contamination by pollution from unregulated industry and poor construction or maintenance of Ventilated Improved Pit Latrines (VIPs). Also of concern is the threat to groundwater quality posed by poor management or maintenance of urban effluent treatment works in Komga, Butterworth, King William’s Town and East London. These towns are situated on regional dykes and ring structures along and in which pollutants will have preferred flow paths. The aquifers supplying the small coastal resorts and the towns in the north-eastern sector are also vulnerable.
The impact of the soil erosion evident throughout the area should not be underestimated and should be treated as a matter of urgency. It results in increasingly reduced recharge to the aquifers, thus exacerbating any decline in groundwater table due to natural drought, poor management or increasing demand. This initiates the desertification process that results in declining spring flows and resultant famine.
The borehole distribution documented in the NGDB (refer Appendix B4.3) illustrates the dominance of groundwater usage in the Hewu, Alice and Middledrift areas, as well as in the R50B and R50A catchments southwest of Peddie. There is a more or less even spread of boreholes throughout the rest of the area except in the north-eastern

2.21
sector between Cofimvaba, Lady Frere, and Cala. The borehole distribution pattern reflects the underlying or exposed pattern of dolerite dykes and sills, although a great number of boreholes particularly north of the border corridor indicate more random targeting. Reference should be made to Appendices B4.1 to B4.6 for additional information.
Current groundwater monitoring sites are shown in Appendix B4.3 with only seven sites monitored for the whole area. No springs are equipped with V-notches or flow gauges.