2. populism and the 2017 election—the background
TRANSCRIPT

35
2POPULISM AND THE
2017 ELECTION—THE BACKGROUND
Jack Vowles
IntroductionAs the 23 September 2017 general election approached, there was little reason to expect a significant advance of the populist right in New Zealand. New Zealand’s two mainstream parties, National and Labour, maintained their dominant roles in the party system, despite New Zealand’s mixed member proportional (MMP) system having been in place since 1996. The National Party, in power since 2008, retained a high level of political support, despite the retirement of popular prime minister John Key late in 2016. Consequently, neither party seemed in danger of capture by authoritarian populism.
Until the 2017 election, the party most identified with populism in New Zealand, New Zealand First, continued to languish in party preference polling, very rarely registering more than 10 per cent, significantly less than the numbers it had secured in its 1996 heyday, when it had briefly entered government in coalition with National. Admittedly, some political commentators were anticipating a revival of New Zealand First, given low polling for the main opposition (Labour) between the 2014 election and mid-2017. However, Labour recovered much of its lost ground a few weeks before the campaign began. Whatever momentum there might have

A PoPULIsT ExCEPTIoN?
36
been for New Zealand First during the campaign was abruptly halted. Following the publication of leaked information that New Zealand First party leader Winston Peters had been overpaid in his state pension payments for several years, the party’s polling numbers halved.
The election results gave New Zealand First 7.2 per cent of the votes (down from 8.7 per cent in 2014) and nine seats in the 120-member parliament. Nonetheless, New Zealand First was in a pivotal position and, following lengthy negotiations, elected to form a government with the Labour and Green parties. An election that was expected to be ‘more of the same’ had resulted in a party widely identified as ‘populist’ gaining a considerable measure of power. Opinion was divided regarding the consequences: on the one hand, New Zealand First had entered government before, with few adverse effects; on the other, examples of radical right populism elsewhere gave reasons for concern, particularly among observers outside New Zealand.
This book takes these differences of perspective as its starting point. Does it make more sense to interpret the 2017 election, and the public mood that shaped it, as an exception to the international authoritarian populist wave? Or, alternatively, can one identify in the 2017 New Zealand election a somewhat distinctive, but nonetheless recognisable, form of the phenomenon?
The data used here were mostly gathered from the 2017 New Zealand Election Study (NZES), comprising a random sample of 3,455 persons from the electoral rolls. In the weeks following the election, respondents answered questions that gathered information regarding their political behaviour and political attitudes at the time of the election. The dataset also contains a module of questions specifically designed to inquire into populism, crafted by the planning committee of an international collaborative research programme: the Comparative Study of Electoral Systems. This chapter provides a background analysis of the 2017 election and addresses some key implications, in the context of the evolution of the party system and the potential for populist politics in New Zealand.
As explained in Chapter 1, populism is far from a new phenomenon in New Zealand. New Zealand First is not the only New Zealand party running for office at recent elections with policies and leadership compatible with some aspects of populism. The Conservative Party, led by property

37
2 . PoPULIsM AND THE 2017 ELECTIoN—THE BACKGroUND
manager Colin Craig, gained 4 per cent of the vote in 2014. In left–right terms, the Conservative Party is significantly right; however, New Zealand First may be classified as slightly left of centre (Vowles, 2014).
Unpacking the 2017 ElectionAs New Zealanders began to anticipate the 2017 election, a year or so before the likely date most commentators were expecting that the National-led government, who had been in power since 2008, would secure a fourth parliamentary term. It was thought that the 2017 election would have a similar result to the previous election in 2014.
National continued to dominate the political polls, while Labour, the key opposition party, continued to poll between 25 and 30 per cent, which was insufficient to present itself as the potential core of an alternative government. Its main ally, the Green Party, was tracking at approximately 10 per cent. The two parties combined very rarely managed to close the gap between themselves and National, whose numbers often approached 50 per cent. The only prospect of a change of government lay with New Zealand First and its pivotal position in the left–right dimension of the party system—one expectation of the eventual outcome that was borne out.
These expectations were shaken by an unexpected event. On 16 July, to draw attention to the inadequacy of welfare benefits to provide sufficient income, Green Party co-leader Metiria Turei admitted to historic benefit fraud. This caused a temporary poll shift—the Greens moved up to almost 14 per cent, gaining left-leaning support at the expense of Labour. In the face of this Labour poll decline, from an already low level, Labour leader Andrew Little resigned, paving the way for Ardern to replace him on 1 August. Meanwhile, further scrutiny of Turei’s claims, which made the news on 3 August, raised doubts regarding her integrity and threw the Green Party into disarray: the party’s poll surge evaporated, dropping back to 8 per cent. Turei resigned on 9 August, followed by polling that put the party at less than 5 per cent, below the threshold for representation. Thereafter, Labour began its poll recovery. On 27 August, information was leaked that stated Winston Peters had been overpaid by his pension for some years. Figure 2.1 displays the polling data and the shifts in vote intentions that followed these events.

A PoPULIsT ExCEPTIoN?
38
0
10
20
30
40
50
60
10–19 Mar 2017
18–22 Mar 2017
3–16 Apr 2017
1–14 May 2017
19–24 May 2017
21–31 May 2017
29 May –
11 Jun 2017
12-Jun-2017
1–5 Jul 2017
26 Jun –9 Jul 2017
22–27 Jul 2017
20–28 Jul 2017
1–2 Aug 2017
2–8 Aug 2017
31 Jul –13 Aug 2017
12–16 Aug 2017
22–30 Aug 2017
26–30 Aug 2017
1–5 Sep 2017
2–6 Sep 2017
1–8 Aug 2017
11–16 August 2017
28 Aug –10 Sep 2017
6–11 Sep 2017
9–13 Sep 2017
13–20 Sep 2017
15-17 Sep 2017
15–19 Sep 2017
National Labour GreenNZ First 5 per. Mov. Avg. (National) 5 per. Mov. Avg. (Labour)5 per. Mov. Avg. (Green) 5 per. Mov. Avg. (NZ First)
Figure 2.1: Political polls (March–September 2017).source: Clifton (2017a, 2017b); Curia (2019a–c); New Zealand Listener (2017a–c); Mills (2018) . Includes Colmar Brunton, reid research, roy Morgan and Bauer polls throughout and the last UMr-Insight polls during the campaign .
Table 2.1 displays the results of the election, compared with those of 2014. The balance of votes shifted approximately 5 percentage points leftward; however, the combined centre-left grouping of Labour-plus-Green still lagged behind the centre-right. Opposition votes consolidated behind Labour, primarily at the expense of the New Zealand First and Green parties. Therefore, the ‘populist vote’ shrank in 2017, particularly if one includes the Conservative Party in that grouping. The Conservative collapse from 4 per cent to only 0.2 per cent of the party vote is also one of the key elements of the leftward aggregate shift in the votes.
This reading of the aggregated results is confirmed in Table 2.2, which displays an estimation of the flows of votes between the 2017 and 2014 elections, including those flows in and out of non-voting and the votes of those ineligible in 2014. Each cell represents a percentage of those eligible to vote in 2017. The ‘total 2017 row’ represents the percentages of the votes cast or not cast in 2017. Reading across the rows for each party indicates the sources of each party’s 2017 votes. The ‘total 2014’ row represents the percentages of the votes cast or not cast in 2014, including those ineligible to vote then. Reading up and down the columns indicates where the 2014 votes went in 2017. Several small parties drop out of

39
2 . PoPULIsM AND THE 2017 ELECTIoN—THE BACKGroUND
the picture, including neoliberal ACT and United Future—their party votes were too few for even marginally credible estimation of flows. The exception is The Opportunities Party (TOP), a new liberal-centre party founded by wealthy philanthropist Gareth Morgan. It appears that TOP took votes equally from the right and the left.
Table 2.1: The 2017 and 2014 elections—party votes and seats
2014 2017
% votes seats % votes seats
National Party 47 .0 *60 44 .4 56
Labour Party 25 .1 32 36 .9 46
New Zealand First (NZF) Party 8 .7 11 7 .2 9
Green Party 10 .7 14 6 .3 8
ACT 0 .7 1 0 .5 1
The opportunities Party (ToP) - - 2 .4 0
Māori Party 1 .3 2 1 .2 0
Aotearoa Legalise Cannabis Party 0 .5 0 0 .3 0
Conservative (CoNs) 4 .0 0 0 .2 0
MANA 1 .4 0 0 .1 0
Ban1080 0 .2 0 0 .1 0
New Zealand People’s Party - - 0 .1 0
United Future (UF) 0 .2 1 0 .1 0
New Zealand outdoors Party - - 0 .1 0
Democrats for social Credit 0 .1 0 0 .0 0
Internet Party** - - 0 .0 0
Total 121 120
Left (Labour, Green, MANA) 37 .2 46 43 .3 54
right (National, ACT, CoNs) 51 .7 61 45 .1 57
Centre (NZF, Maori, ToP, UF) 10 .2 14 10 .9 9
others 0 .8 0 0 .6 0
Note: * National lost the Northland electorate seat to New Zealand First at a by-election early in 2015, bringing its seats down to 59 .** with MANA in 2014 .source: Electoral Commission (2014, 2017) .

A PoPULIsT ExCEPTIoN?
40
Tabl
e 2.
2: E
stim
ated
flow
s of
vot
es (2
014–
2017
)
2014
Vot
es
2017
Vot
esN
on-v
ote
Nat
iona
lLa
bour
Gre
enN
ZFC
onse
rvat
ive
Man
aM
āori
In-e
ligib
le20
17 (%
)N
Non-
vote
13 .7
33 .
211 .
910 .
360 .
610 .
240 .
160 .
122 .
3521
.327
9
Natio
nal
2 .7
26 .2
50 .
710 .
411
1 .51
00 .
140 .
5534
.78,
906
Labo
ur3 .
593 .
2913
.89
4 .06
2 .12
0 .38
0 .36
0 .25
0 .68
28 .8
8,02
7
Gre
en0 .
760 .
350 .
812 .
310 .
090 .
030 .
240 .
050 .
214 .
92,
932
New
Zea
land
Firs
t (NZ
F)0 .
641 .
150 .
550 .
192 .
350 .
560 .
040 .
030 .
075 .
61,
770
Cons
erva
tive
0 .0
0 .01
0 .0
0 .0
0 .01
0 .12
0 .0
0 .0
0 .0
0 .1
59
Man
a0 .
010 .
00 .
010 .
00 .
00 .
00 .
050 .
010 .
00 .
822
Māo
ri0 .
030 .
170 .
10 .
060 .
060 .
040 .
110 .
320 .
020 .
926
9
The
opp
ortu
nitie
s Pa
rty0 .
360 .
530 .
250 .
360 .
120 .
070 .
050 .
040 .
041 .
91,
049
2014
(%)
22 .1
35 .2
18 .3
7 .8
6 .4
3 .0
1 .01
0 .96
3 .96
100
N65
41,
0202
.04,
634
3,88
91,
761
537
115
971,
111
2,36
98
Note
: The
se d
ata
are
sour
ced
from
the
Vote
Com
pass
dat
aset
. Tha
nks
are
due
to C
lifton
van
der
Lin
den
and
Vox
Pops
Lab
s fo
r agr
eem
ent r
egar
ding
its
use.
Whi
le no
t sele
cted
rand
omly,
the
large
sam
ple
incr
ease
s co
nfide
nce
in e
stim
atin
g be
twee
n-pa
rty s
hifts
. The
dat
a ar
e w
eight
ed b
y a
serie
s of
iter
atio
ns
on th
e tw
o m
argi
nal p
erce
ntag
e (To
tal %
) fre
quen
cies,
to re
pres
ent a
s clo
sely
as p
ossib
le th
e ac
tual
dist
ribut
ions
of v
otes
/non
-vot
es in
eac
h ele
ctio
n . T
he
unw
eight
ed s
ampl
e siz
es s
umm
ed u
p by
row
and
col
umn
appe
ar in
the
botto
m a
nd ri
ght m
argi
ns o
f the
tabl
e as
an
indi
catio
n of
the
caut
ion
to b
e fo
llow
ed
with
sm
all c
ell s
izes.
As
with
the
NZES
Pan
el, n
on-v
oter
s, p
artic
ular
ly th
ose
in 2
017,
are
sig
nific
antly
und
er-re
pres
ente
d; th
eref
ore,
the
non-
vote
cell
s an
d flo
ws
mus
t be
treat
ed m
uch
mor
e ca
utio
usly.
Fro
m th
ese
estim
ates
, app
roxim
ately
46
per c
ent o
f tho
se e
ligib
le to
vot
e vo
ted
for t
he s
ame
party
in 2
017
as
in 2
014
(com
prisi
ng 6
2 pe
r cen
t of v
oter
s) . T
here
fore
, app
roxim
ately
38
per c
ent c
hang
ed p
arty
or m
oved
in o
r out
of v
otin
g . T
o te
st th
is da
ta a
gain
st th
e NZ
Es, a
weig
hted
turn
over
tabl
e de
rived
from
the
NZEs
201
7–20
14 P
anel
(N =
1,3
61),
augm
ente
d by
vot
ers
ineli
gibl
e in
201
4, is
ver
y clo
se to
the
sam
e di
strib
utio
n ac
ross
the
diag
onal
(sta
ble
votin
g) c
ells
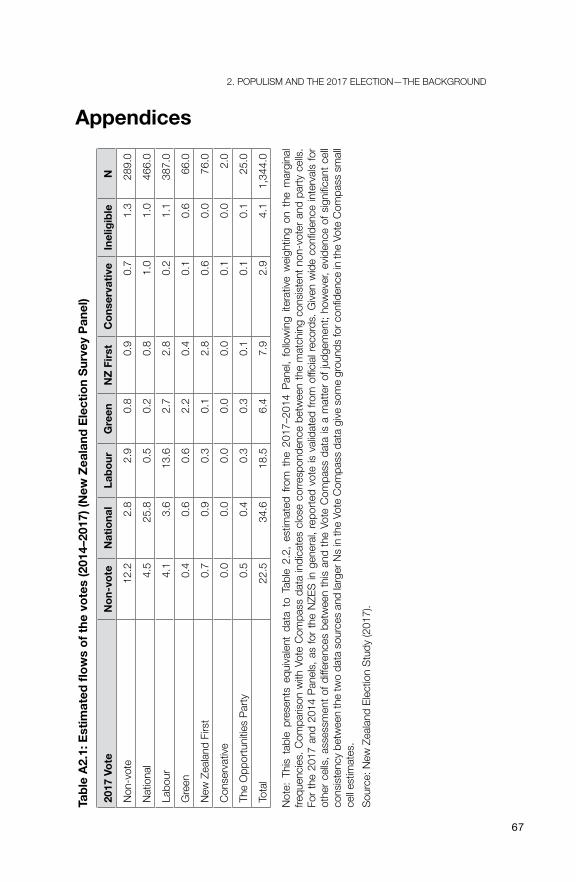
(see
Tab
le A2
.1) .
sour
ce: V
ote
Com
pass
pos
t-elec
tion
sam
ple .
41
2 . PoPULIsM AND THE 2017 ELECTIoN—THE BACKGroUND
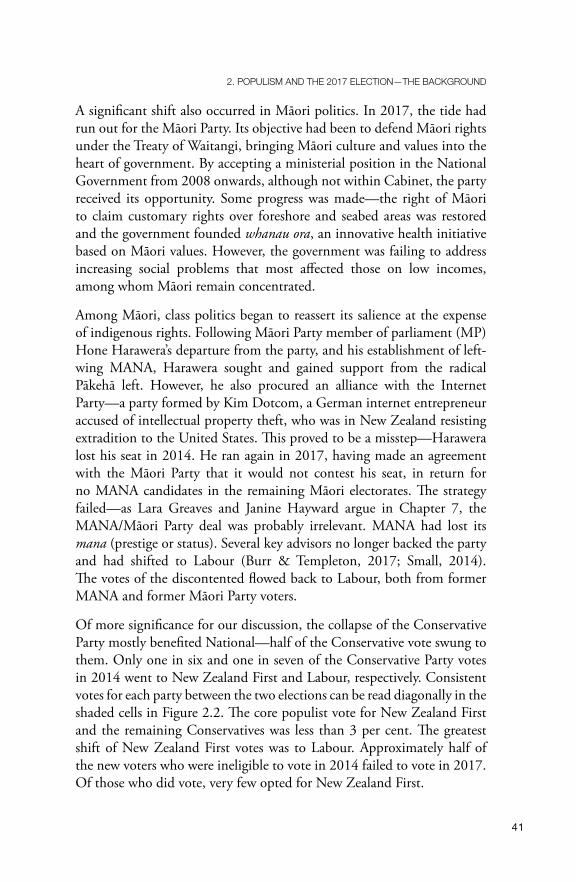
A significant shift also occurred in Māori politics. In 2017, the tide had run out for the Māori Party. Its objective had been to defend Māori rights under the Treaty of Waitangi, bringing Māori culture and values into the heart of government. By accepting a ministerial position in the National Government from 2008 onwards, although not within Cabinet, the party received its opportunity. Some progress was made—the right of Māori to claim customary rights over foreshore and seabed areas was restored and the government founded whanau ora, an innovative health initiative based on Māori values. However, the government was failing to address increasing social problems that most affected those on low incomes, among whom Māori remain concentrated.
Among Māori, class politics began to reassert its salience at the expense of indigenous rights. Following Māori Party member of parliament (MP) Hone Harawera’s departure from the party, and his establishment of left-wing MANA, Harawera sought and gained support from the radical Pākehā left. However, he also procured an alliance with the Internet Party—a party formed by Kim Dotcom, a German internet entrepreneur accused of intellectual property theft, who was in New Zealand resisting extradition to the United States. This proved to be a misstep—Harawera lost his seat in 2014. He ran again in 2017, having made an agreement with the Māori Party that it would not contest his seat, in return for no MANA candidates in the remaining Māori electorates. The strategy failed—as Lara Greaves and Janine Hayward argue in Chapter 7, the MANA/Māori Party deal was probably irrelevant. MANA had lost its mana (prestige or status). Several key advisors no longer backed the party and had shifted to Labour (Burr & Templeton, 2017; Small, 2014). The votes of the discontented flowed back to Labour, both from former MANA and former Māori Party voters.
Of more significance for our discussion, the collapse of the Conservative Party mostly benefited National—half of the Conservative vote swung to them. Only one in six and one in seven of the Conservative Party votes in 2014 went to New Zealand First and Labour, respectively. Consistent votes for each party between the two elections can be read diagonally in the shaded cells in Figure 2.2. The core populist vote for New Zealand First and the remaining Conservatives was less than 3 per cent. The greatest shift of New Zealand First votes was to Labour. Approximately half of the new voters who were ineligible to vote in 2014 failed to vote in 2017. Of those who did vote, very few opted for New Zealand First.

A PoPULIsT ExCEPTIoN?
42
Figure 2.2: Content analysis (most important issue).Note: The word cloud is based on a word-count content analysis and illustrates the 70 most popular words . words with no political content were dropped and some were consolidated: for example, ‘taxation’ into ‘tax’, healthcare into ‘health’ . The data were sourced from those freshly sampled in 2017, with oversamples resampled to bring them into the same proportions as the electoral rolls .source: New Zealand Election study (2017) .
Two possible interpretations follow—either populist voters for New Zealand First and the Conservatives in 2014 had their populism overshadowed by an increased salience of left–right issues or populists shifted to Labour because the party had taken on board some key populist concerns, particularly the restriction of immigration. The salience of policy issues in 2017 is the next port of call for analysis, taking advantage of the following open-ended NZES question: ‘what was the single most important issue for you in the 2017 election?’ The electronically captured text of the responses was analysed and used to generate the word cloud illustrated in Figure 2.2.
43
2 . PoPULIsM AND THE 2017 ELECTIoN—THE BACKGroUND
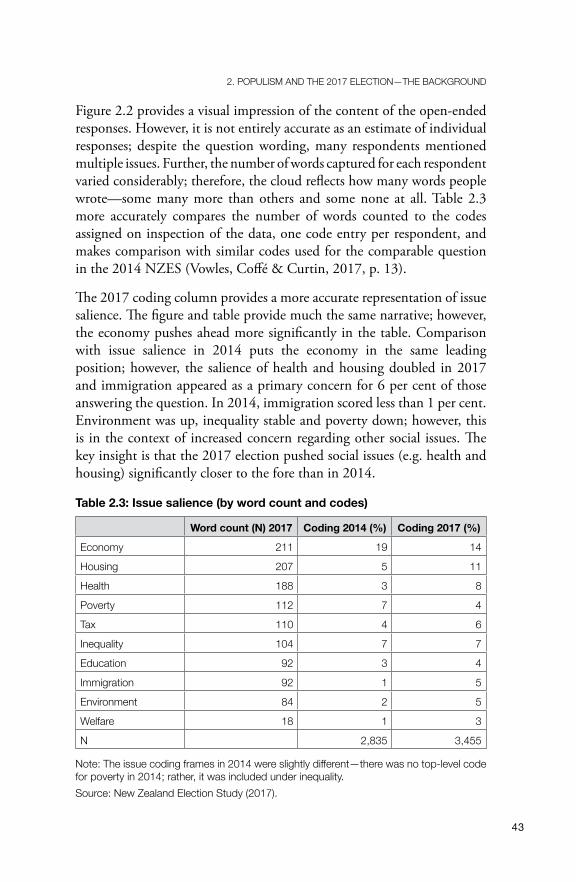
Figure 2.2 provides a visual impression of the content of the open-ended responses. However, it is not entirely accurate as an estimate of individual responses; despite the question wording, many respondents mentioned multiple issues. Further, the number of words captured for each respondent varied considerably; therefore, the cloud reflects how many words people wrote—some many more than others and some none at all. Table 2.3 more accurately compares the number of words counted to the codes assigned on inspection of the data, one code entry per respondent, and makes comparison with similar codes used for the comparable question in the 2014 NZES (Vowles, Coffé & Curtin, 2017, p. 13).
The 2017 coding column provides a more accurate representation of issue salience. The figure and table provide much the same narrative; however, the economy pushes ahead more significantly in the table. Comparison with issue salience in 2014 puts the economy in the same leading position; however, the salience of health and housing doubled in 2017 and immigration appeared as a primary concern for 6 per cent of those answering the question. In 2014, immigration scored less than 1 per cent. Environment was up, inequality stable and poverty down; however, this is in the context of increased concern regarding other social issues. The key insight is that the 2017 election pushed social issues (e.g. health and housing) significantly closer to the fore than in 2014.
Table 2.3: Issue salience (by word count and codes)
Word count (N) 2017 Coding 2014 (%) Coding 2017 (%)
Economy 211 19 14
Housing 207 5 11
Health 188 3 8
Poverty 112 7 4
Tax 110 4 6
Inequality 104 7 7
Education 92 3 4
Immigration 92 1 5
Environment 84 2 5
welfare 18 1 3
N 2,835 3,455
Note: The issue coding frames in 2014 were slightly different—there was no top-level code for poverty in 2014; rather, it was included under inequality .source: New Zealand Election study (2017) .

A PoPULIsT ExCEPTIoN?
44
Social issues and concerns regarding public services have traditionally been thought to benefit the centre-left; however, populists may also capture votes from people with such concerns. As explained in Chapter 1, two main explanations for the rise of populism have been posited. One identifies populism as a response to economic malaise, stagnation or economic crisis among those most affected. When current elites fail to address the problem, particularly if they belong to the centre-left, populists may begin to attract the votes of those who feel most vulnerable. Using strong emotional appeals, populists promise strong leadership, playing into the anti-establishment elements of populist ideology.
In 2011 and 2012, net immigration into New Zealand was effectively zero. By 2013, the New Zealand economy was exhibiting strong growth, compared to other comparator countries, and received ‘rockstar’ status from commentators (Vowles, Coffé & Curtin, 2017, p. 96). Immigration rose quickly. In 2017, New Zealand had a net gain of 70,000 immigrants, contributing approximately 1.5 per cent to population growth that year (Statistics New Zealand, 2018b). Such a high level of immigration puts pressure on infrastructure, services and housing, particularly where new arrivals are concentrated in New Zealand’s largest city—Auckland. Rising house prices have made life difficult for low- and middle-income home buyers. A shortage of housing has led to increasing homelessness and even affected the employed. Competition in the labour market from new immigrants may be responsible for little or no recent wage growth in New Zealand. Easy access to cheap labour may reduce incentives for business to increase productivity. The growth benefits of current levels of immigration tend to be unevenly distributed. The shift in issue salience between 2014 and 2017 is a consequence of the unease and outright concern of many New Zealanders regarding the direction that has been taken by their country, in the context of increasing evidence of the failure of recent economic growth to benefit most low- and middle-income earners.
On the surface, the condition of the New Zealand economy in 2017 did not provide much economic ammunition for populism. As shown in Figure 2.3, the official estimate of economic growth in New Zealand rose to a high point of 4 per cent in 2016, before dropping back to a (still apparently healthy) 3 per cent in 2017. These recent rates outstrip growth in comparator countries such as Australia, the United States, Japan and the United Kingdom. This is the ‘headline’ narrative that shaped most political and economic commentary regarding the National-led government and underpinned perceptions of the government’s

45
2 . PoPULIsM AND THE 2017 ELECTIoN—THE BACKGroUND
competence within New Zealand and favourable impressions of the state of New Zealand’s economy internationally. However, the underlying picture is less rosy; due to high levels of net immigration, in terms of growth per person, the trend flattened at approximately 2 per cent per year in 2013 and more than halved in 2017 to only 0.7 per cent.
Figure 2.3: Real GDP and real GDP per capita in New Zealand (2007–2017).source: reserve Bank of New Zealand (2018); statistics New Zealand (2018a) .
Discussion of immigration into contemporary New Zealand leads to an exploration of the second alternative explanation of the development of populism: the cultural dimension. In Europe and the United States, populism often represents white nationalism that is triggered by rising rates of immigration and, most of all, rising numbers of refugees from other cultures that threaten the dominance of established ethnic groups. People with lower levels of education are particularly likely to embrace populism on these grounds. In Australia, populism in the form of the One Nation Party also represents resistance to the recognition of Indigenous Aboriginal peoples and to efforts to improve their status. In New Zealand, by contrast, as explained in Chapter 1, populism in the form of New Zealand First is inclusive of indigenous Māori. Several New Zealand First MPs, including Winston Peters himself, are of Māori descent and identify as Māori. Despite this, New Zealand First takes a conservative position on New Zealand’s founding document, the Treaty of Waitangi between the Crown and Māori, opposing granting it any form of constitutional status.

A PoPULIsT ExCEPTIoN?
46
Like the lobby group, Hobson’s Pledge, led by former National Party and ACT leader Don Brash, New Zealand First stands for ‘One Nation’ and is opposed to what it interprets to be ‘separatism’ among Māori. Under Brash’s leadership between 2003 and 2006, the National Party adopted a strong ‘One Nation’ platform with strong populist undertones and was rewarded by a dramatic boost in polling preferences. However, following 2008, National governed with the support of the Māori Party and set aside populist appeals to ‘One Nation’. It presided over several significant Treaty settlements and, while continuing to oppose the existence of the Māori parliamentary seats in principle, refrained from implementing their abolition in practice.
Immigration into New Zealand over the previous 30 years has made it one of the most culturally diverse countries in the world. Despite occasional outbursts of racism in individual behaviour and in public discourse, new immigrants are, for the most part, accepted. New Zealand is the most recently peopled landmass of a significant size. The first Māori settlers arrived less than 1,000 years ago and other peoples arrived only in the last two centuries. Many New Zealanders are descended from relatively recent immigrants or are immigrants themselves. The Māori word for New Zealand Europeans is ‘Pākehā’.1 The population remains majority Pākehā at just over 70 per cent; however, incoming migrants have increasingly mixed origins. The recently released 2018 census puts the foreign-born population at 27 per cent. Over the period 2015–2017, the main source countries were Australia, predominantly comprising New Zealanders returning home, followed by the United Kingdom, China and India. More broadly, of those permanently entering the country, approximately a third have come from Asian countries, a quarter from Europe and a fifth from Australia (Statistics New Zealand, 2018c). Increasing diversity can produce a cultural backlash, to which the Asian population has been most vulnerable. Since inception, the New Zealand First Party has been a focus for criticism of Asian immigration (see e.g. Peters, 2005). Meanwhile, the National Party welcomes immigrants from everywhere,
1 According to the Māori dictionary (n.d.), ‘Pākehā’ means ‘New Zealander of European descent’—probably originally applied to English-speaking Europeans living in Aotearoa/New Zealand. According to Mohi Tūrei, an acknowledged expert in Ngāti Porou tribal lore, the term is a shortened form of pakepakehā, which was a Māori rendition of a word or words remembered from a chant used in a very early visit by foreign sailors for raising their anchor (TP 1/1911: 5). Others claim that pakepakehā was another name for tūrehu or patupairehe (mythical human-like beings with fair skin and hair). Despite claims made by some non-Māori speakers, the term does not normally have negative connotations.

47
2 . PoPULIsM AND THE 2017 ELECTIoN—THE BACKGroUND
particularly valuing those who bring investment into New Zealand, many of whom come from mainland China. Labour has also tended to welcome immigration, particularly from the Pacific Islands, and Pacific Island communities continue to provide Labour with strong electoral support.
Figure 2.4: Parties closest to voters’ positions on different issues.source: New Zealand Election study (2017) .
NZES respondents were asked which party was the closest to their position on the issue they identified as most important. Only 16 per cent did not, or could not, name a party that championed their issue. As expected, those who named immigration were most likely to choose New Zealand First. Figure 2.4 demonstrates that New Zealand First has
A PoPULIsT ExCEPTIoN?
48
a distinctive command of immigration, but no other issue, much as the Green Party has a commanding position on the environment. Similarly, National is dominant in approval of its conservative positions on the economy and taxes and Labour is dominant on approval of its positions on social issues—housing, health and inequality. There is no evidence of a New Zealand First breakthrough on any issue other than immigration. Instead, the strongest impression is one of Labour successfully mobilising opinion on its issues of traditional strength: support for public services, more active housing policies and the reduction of poverty. Nonetheless, Labour also identified high levels of immigration as a contributing factor to pressures on infrastructure, social services and housing, and entered the 2017 election with promises to reduce immigration by 20,000–30,000 annually (New Zealand Labour Party, 2017). New Zealand First promised even greater restrictions: to a net 10,000, annually.
Alignment and Stability of the Party SystemAnother correlate of the development of populism elsewhere has been the dealignment or realignment of party systems. Party systems have fragmented, allowing new parties to emerge. Voting choices have become more volatile from one election to the next, making governments more likely to change more frequently than in the past and potentially affecting governability. Figures 2.5 and 2.6 situate New Zealand in the international context of other members of the Organisation for Economic Development and Cooperation (OECD), comparing changes in the number of effective elective political parties and in net vote volatility between 1991 and 2007, and 2008 and 2016. Compared with most other OECD countries, relative to their number weighted by shares of votes cast, New Zealand’s party system is smaller post 2008 than it was before and vote choices between elections have become less, rather than more, volatile. The contexts of different countries matter, of course. The first period marks New Zealand’s transition to an MMP system and the second the stabilisation of vote choices that followed this (Vowles, 2014). Post-communist countries were also in transition during the 1990s and have somewhat stabilised since.

49
2 . PoPULIsM AND THE 2017 ELECTIoN—THE BACKGroUND
Figure 2.5: Change in number of effective parties in OECD countries (2016–2007/2007–1990).Note: The effective number of electoral parties is weighted by the proportional shares of votes cast, estimated as 1 divided by the squares of the fractional vote shares of all parties scoring 1 per cent or more (i .e . as fractions of 1) .source: Gallagher (2019) .
Figure 2.6: Change in electoral volatility in OECD countries (2016–2007/ 2007–1990).Note: Net electoral vote volatility is estimated by adding the absolute differences between party vote shares between the election in question and the previous one and dividing the resulting sum by 2. This figure is also based on unpublished data generously provided by scott Mainwaring (for which thanks are due) .source: Alcántara (2012); Emmanuele (2015); Mainwaring, Gervasoni and Espana-Najera (2017) .

A PoPULIsT ExCEPTIoN?
50
If we refocus analysis away from change and examine the absolute levels of recent and current estimates of effective party system size and vote volatility, New Zealand has scored comparatively low on both counts since 2008. The average number of effective elective parties across the OECD countries between 2008 and 2016 was five and the average vote volatility between elections was 18. In New Zealand, over the three elections between 2008 and 2014, the comparable figures were 3.1 and 8.8. In 2017, the effective number of elective parties slightly shrank to 2.9; net volatility had risen to 13.5, which was still well below the OECD average. In comparative contexts, electoral politics in New Zealand is stable, particularly when compared to many of the long-established democracies in western Europe.
Acknowledging this, like citizens in other OECD countries, New Zealanders are in two minds regarding political parties and the governments formed by them. As later chapters will discuss in greater depth, public trust in parties and politicians has not fully recovered from a crisis of legitimacy in the late 1980s and early 1990s, which followed rapid neoliberal economic and social reforms that led to electoral system change in 1996. Consistent cognitive or affective ties to political parties have not recovered either—levels of party identification are considerably lower than those estimated before the mid-1980s.
Nonetheless, approximately 60 per cent of the NZES sample chose a party when asked if they thought themselves ‘generally speaking’ close to a particular party; 38 per cent chose the ‘no party’ option. The phrase ‘generally speaking’ is included to elicit ties to parties that persist beyond a single election. However, in practice, this estimate still demonstrates much between-election volatility (Aimer, 1989). Those nominated as ‘very close’ comprised only 7 per cent of the whole sample; most who nominated parties as ‘close’ chose the ‘fairly close’ option (37 per cent of all respondents). National had the most who were particularly close: 28 per cent of respondents compared to Labour’s 20 per cent. The Green Party scored just over 5 per cent and New Zealand First only 3.5 per cent. The low level of core partisan commitment to New Zealand First is notable.

51
2 . PoPULIsM AND THE 2017 ELECTIoN—THE BACKGroUND
The ideological and structural alignment of the New Zealand party system up to the mid-20th century was classically defined by Chapman (1962), who characterised it as predominantly urban versus rural but also crosscut by differences between higher or lower socio-economic groups. In terms of ideology, the cleavage was both one-dimensional (between the interests of owners and wage workers) and two-dimensional (in terms of social structure). Chapman identified signs of this pattern changing in the early 1980s; others similarly identified de-alignment (Aimer, 1989; Bean, 1984; see also Vowles 1998). The process that occurred from 1984 to 1990 may be interpreted as a realignment that failed, requiring a change of electoral system to recognise that New Zealand had become a moderate multi-party system—moderate, but still ‘multi’.
The nature of the post-MMP realignment, if it can be identified as such, continues to unfold as successive elections produce various iterations of outcomes within their apparent parameters. Since 2005, the number of parties has stabilised and vote choice volatility has decreased, giving some grounds to assume that a new pattern is emerging. However, on face value, the urban–rural divide seems alive and well, particularly since 2008. Figure 2.7 plots the effects of the urban–rural characteristics of general electorates on Labour and National voting across the electorates since 1972, using census data broken down by electorate, and the percentage employed in agriculture as a proxy for the urban–rural divide.2 The Māori electorates are left out of this picture, because their numbers are few and they overlie the general electorates, which makes combined analysis problematic. The percentage of the labour force in agriculture is simply regressed against the vote percentages for the two parties, the unstandardised parameter estimates or coefficients providing the data plotted in Figure 2.7. Averaged over time, there appears to be a consistent pattern—for each 1 percentage difference across the urban–rural divide, the National Party vote is approximately half a percentage point up towards the rural electorates and Labour is approximately half a percentage point down (that is, towards the urban electorates).
2 It must be acknowledged that this proxy variable is approximate and does not fully account for both urban growth and changes in agricultural production and employment over the period. However, any error associated with these measurement issues is likely to be very minor and, therefore, unlikely to affect the broad patterns uncovered.

A PoPULIsT ExCEPTIoN?
52
Figure 2.7: The urban–rural divide and major party voting (1972–2017).source: Author’s research based on data from statistics New Zealand and the Electoral Commission .
Figure 2.7 indicates fluctuations in this general pattern. Interpretation is complicated by electoral system change and the crisis in legitimacy that preceded this. The single electorate vote prior to MMP continues after the change in the form of the electorate or candidate vote: the new party vote is an addition. However, MMP introduced a new logic—the party vote determining the overall seat count—with electorate outcomes simply incorporated within the totals. Casting an electorate vote under MMP is not the same as it was under the old system, where one could cast a personal vote without worrying regarding its consequences for the overall outcome. MMP changes the data in a further way. The number of general electorates decreased from 95 to 60 in 1996 and, since this time, has crept upward only marginally. This affects the urban–rural boundary, with more mixing between provincial urban and rural communities within electorates. In 1993, across the 95 general electorates, the average percentage in agriculture was 9.9 per cent and the standard deviation as 11.2. In 1996, with 60 general electorates, the average was 9.5 per cent and the standard deviation was 9.9. While the narrowing of the standard deviation is lower than might have been expected, caution is still required.

53
2 . PoPULIsM AND THE 2017 ELECTIoN—THE BACKGroUND
The most significant point is a reduction in the number of solidly rural electorates, making a lower proportion of cases responsible for plotting the rural end of the slopes estimated.
While one can read consistency into these data over the long term, significant variations are also apparent. From the mid-1970s until 1987, as the blue and red lines in Figure 2.7 move further apart, the urban–rural dimension became more significant in shaping vote choices for both major parties: an intensification of that alignment, rather than a weakening of it. From 1987 to 1996, the alignment weakened, and then began to strengthen again as the party system stabilised from 1999 and 2002 onwards. The urban–rural effect on National’s electorate vote in 2008 was particularly significant. Meanwhile, the other two parties’ party votes were much less affected. However, comparing the electorate votes of 1972 and 1975 with the party votes of 2017 reveals little difference. Chapman’s primary social structure dimension remains alive and continues to underpin the New Zealand party system.
Further scrutiny suggests that the story is not quite so simple. Figure 2.8 illustrates the R-squared statistic that estimates the variance explained by each model, from which estimates were derived for Figure 2.7. These drop precipitously following the transition to MMP; however, they rise again for National between 2002 and 2008. The lower R-squared value tells us that, if we plotted the regressions for each party and election (drawing the slope estimates or trend lines), more of the data points representing electorates would be further from those lines, indicating further variation that is not explained post-MMP—more electorates that are ‘out-of-line’ relative to their position, when plotted against the overall pattern. The lower number of purely rural electorates provides one explanation; however, further investigation indicates non-linearity elsewhere, when the R-squared value is low.3 A pattern consistent with the urban–rural divide remains, but intermediate electorates diverge from this. Although fewer mixed electorates fit the pattern as closely as in the past, the urban–rural divide continues as strongly as before when one compares communities that are most strongly urban or rural.
3 Thanks are due to Alistair Gray for his help in uncovering these subtleties.

A PoPULIsT ExCEPTIoN?
54
Figure 2.8: Variance explained by the urban–rural divide on the electorate vote (1972–2017).source: Author’s research based on data from statistics New Zealand and the Electoral Commission .
Regarding the second dimension of the social structure, the de-alignment process is more clearly apparent, as Figure 2.9 shows. Here, we define class voting as the difference in the Labour party vote between those households dependent primarily on manual and service occupations and those dependent primarily on wage and salary earners in non-manual occupations: managers, professionals, semi-professionals, clerical and sales workers (excluding non-voters).4 The progressive decline of this form of class voting in the old established democracies is so widely known as to become a cliché of electoral politics: the new element is its close-to-complete collapse at the 2017 election, for which there occurred a 2002 precedent. This very closely replicates findings from recent elections in the United Kingdom, Germany, France and the United States: an apparent death of class voting (Dalton, 2020, p. 163).
4 This follows Alford (1962). In multiple working-adult households, we classify occupational class of the household by the occupation of the male in the household (the respondent himself or the respondent’s partner). This reflects the reality of gender pay inequity, meaning that, in most cases, the occupation of the male is a better guide to the economic position of the household. The NZES does not ask for the gender of respondents’ partners; however, because the majority of couples comprise a male and a female, this classification is the best reflection of the economic position of a male–female household that can be estimated from our data.

55
2 . PoPULIsM AND THE 2017 ELECTIoN—THE BACKGroUND
Figure 2.9: The Alford Index of class voting in New Zealand (1963–2017).source: Levine & robinson (1975); Bean (1984); New Zealand Election studies (1987–2017) .
While the decline has been progressive since 1963 (the first data available), the 1990 height of the legitimacy crisis highlights the New Zealand story; in 1987, approximately 45 per cent of people in manual or service households voted Labour and, in 1990, only 32 per cent did so. Labour has never recovered this earlier share of the votes of its traditional supporters (Vowles, 2014, p. 40). In 2017, 30 per cent in this group continued to vote Labour. Meanwhile, in NZES samples, households mostly dependent on people in manual or service occupations have declined from approximately 40 per cent to 30 per cent of the total. To compensate for this compounded loss of votes, Labour has survived as a major party by collecting more votes from people in non-manual households.
In the 21st century, analysis of party system alignment comprises more than occupational categories, which have become more complex and less strongly associated with overall social positions and other definitions of class. More encompassing models of social structure are required to allow identification of relationships with vote choice after controlling for how each aspect of social position is mutually affected by all other relevant factors. Table 2.4 lists the variables from our baseline multinomial, multivariate model of the social and demographic correlates of voting

A PoPULIsT ExCEPTIoN?
56
choice—this is the appropriate approach, because the various party choices and non-vote are unordered categories. Vote National is the base category in the model (details of which are found in Table A2.2); the other categories are non-vote, Labour, Green, New Zealand First, Conservative and ‘Other’. We include non-vote in the model but do not report it here because it is a significant element in overall voting choice, which affects the distribution of party choices. The baseline model accounts for approximately 10 per cent of the variation in voting choices in 2017.
Table 2.4: The social and demographic structural correlates of voting choice
Baseline model
occupation household No occupation reported
Farming household
Manual/service household
(ref .: non-manual household)
sector of employment Public sector
self-employed
(ref .: private sector wage salary)
Assets High-risk assets
Low-risk assets only
(ref .: no . assets)
Income quintiles (1–5)
On benefit yes
(ref . No)
Education School qualification
Post-school qualification (excluding university)
University
(No qualification)
Gender Female
(ref .: male)
Age (18+)
Ethnicity Māori
Asian
Pasifika
(Ref. Pākehā)

57
2 . PoPULIsM AND THE 2017 ELECTIoN—THE BACKGroUND
Baseline model
Living in urban area Major urban (100,000+ inhabitants)
(ref . not major urban)
Membership union yes
(ref .: No)
Church attendance Never–at least once a week (0–1, five-point scale)
Note: Bracketed categories are reference categories in the analyses: the category to which an effect is estimated. For example, ‘female’ is estimated against the reference category ‘male’. Low-risk assets are defined by answering yes to one of three questions: do respondents own a home, house or apartment; any savings or a contributory pension plan? High-risk assets are defined by answering yes to owning one of a business; a property, farm or livestock or stocks, shares or bonds? Ethnic identity is defined as strongest where multiple identifications were reported. Income is based on breaking household income into quintiles, augmented by a five-category question on relative income. Union household is defined by anyone in the household indicating that they were a member.source: New Zealand Election study (2017) .
Table 2.4 outlines the key variables. Occupational differences are crosscut by location in the public or private sectors; public sector employees are more dependent on a strong public sector for their security and incomes. Low-risk assets, such as owning a home, having savings or a contributory pension scheme, offer people security without much risk. High-risk assets, such as owning a rental property, a business or stocks and shares, may provide higher reward but also greater risk. This assets variable is categorised into those with no assets, those with low-risk assets only and those with high-risk assets. This group contains a few who possess high-risk assets but no low-risk assets; however, this is a very small group. Household income also shapes opportunities and security, as does receiving some kind of benefit (excluding New Zealand Superannuation, the universal pension available to all at age 65). Education shapes opportunities, income and social attitudes; people who are more educated tend to adopt more liberal positions.
Compared to occupation, other categories—assets, income, age, gender and ethnicity—are even more fundamental attributes affecting opportunities and life choices. Age is relevant for generational differences between older people, who have been able to benefit from rising house prices, and younger people, for whom acquisition of such assets has become more difficult. Gender and ethnicity also have well-known implications for social position. Finally, union membership tends to mobilise people towards the left and forms a residual element of Labour tradition. Church attendance is expected to mobilise people towards more

A PoPULIsT ExCEPTIoN?
58
socially conservative positions. We report the findings from this model in Figures 2.10–2.13, plotting predicted probabilities for all significant variables, plus 95 per cent confidence intervals. The full model is given in Table A2.2.
Figure 2.10: Probabilities of party vote for the National Party.source: New Zealand Election study (2017) .

59
2 . PoPULIsM AND THE 2017 ELECTIoN—THE BACKGroUND
The vertical line in Figure 2.10 represents National’s party vote as a percentage of the entire electorate, including non-voters, making it possible to benchmark the probability estimates to the entire enrolled electorate. As expected, the National Party was more likely to receive the votes of older people and Pākehā and less likely to appeal to Māori. Despite the gender contrast between the Labour and National leaders, women were slightly more likely to vote National than men. National took votes relatively evenly across all educational categories but was more likely than average to receive the votes of those with only a high school qualification. It should be no surprise that farmers strongly support National; however, National’s appeal to manual/service voters matched its overall level of electoral support. High incomes and both kinds of assets attract people to National. As expected, people in those households dependent on public sector employment and union members are less likely to support National. This picture of the National Party vote is exactly what one would expect, indicating that the New Zealand party system is still strongly aligned in reference to differences in social locations and opportunities. NZES data appear to indicate that National did marginally better in major urban electorates than elsewhere; however, comparison with official data indicates that this is probably an artefact of a slighter lower response rate among National rural voters.
Figure 2.11 confirms that, all else equal, Labour’s new female leadership is associated with a gender gap—women are more likely to vote Labour than men. Labour’s strong support among Māori is also apparent (see Chapter 6 for more details). This confirms the absence of a manual–non-manual divide among those who vote Labour. However, income, high-risk assets and support among beneficiaries and those in union households confirm the persistence of a significant residue of Labour’s traditional support. Sector of employment has little apparent effect on voting. Regarding education, with all else being equal, it seems that Labour appeals more to those with higher rather than lower education; however, the confidence intervals overlap. Youth enthusiasm for Labour, evident during the election campaign, is not reflected in these data. Labour performed best in major urban areas, net of all other factors in the model. Further analysis indicates a linear relationship across the urban–rural divide; Labour fared worse in rural areas, better in country towns, better again in provincial towns or cities and best in urban areas, which is consistent with official data.

A PoPULIsT ExCEPTIoN?
60
Figure 2.11: Probability of Labour Party vote.source: New Zealand Election study (2017) .
Age and education are the two strongest associations with party vote for the Green Party, as shown in Figure 2.12. The Green Party does not fare so well among ethnic minorities, aside from Māori, among whom it receives votes equivalent to its overall share of the vote. Lower income and dependence on non-manual and public sector jobs also shape the Green Party vote. The Green Party is confirmed as a party of predominantly middle-class, young and relatively well-educated radicals, which is quite different to the support profile of the Labour Party, excepting a slight tendency to appeal more to members of union households and to major urban residents.

61
2 . PoPULIsM AND THE 2017 ELECTIoN—THE BACKGroUND
Figure 2.12: Probability of vote for the Green Party.source: New Zealand Election study (2017) .
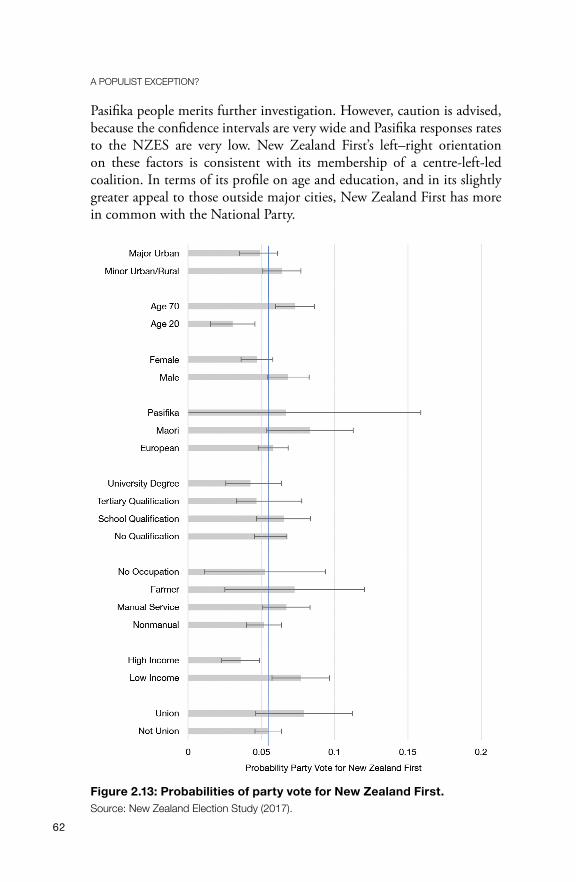
As shown in Figure 2.13, New Zealand First, in some respects, represents the other side of the coin to the Green Party. It appeals more to the older population and to men and has effectively zero support among ethnic minorities, other than Māori, who are slightly more likely to vote for the party than average. The lower the education level, the more likely a vote for New Zealand First. This is one of the indicators of a populist party; however, confidence intervals do overlap. In other respects, New Zealand First shares with Labour and the Green Party an appeal to those on low incomes and to union members. New Zealand First’s possible appeal to
A PoPULIsT ExCEPTIoN?
62
Pasifika people merits further investigation. However, caution is advised, because the confidence intervals are very wide and Pasifika responses rates to the NZES are very low. New Zealand First’s left–right orientation on these factors is consistent with its membership of a centre-left-led coalition. In terms of its profile on age and education, and in its slightly greater appeal to those outside major cities, New Zealand First has more in common with the National Party.
Figure 2.13: Probabilities of party vote for New Zealand First.source: New Zealand Election study (2017) .

63
2 . PoPULIsM AND THE 2017 ELECTIoN—THE BACKGroUND
ConclusionsComparatively speaking, New Zealand’s electoral politics are stable. Two centre-focused major political parties remain dominant; however, when in government, they are required to share power with much smaller parties that may exert some leverage over their major party coalition parties. One of these, New Zealand First, owes much of its appeal to populism, despite being a party of the centre on the left–right dimension. However, its foundation of electoral support is small and the party lost ground at the 2017 election.
To the extent that any election can signal a national shift of priorities, 2017 saw New Zealand take a step to the left—embodied by concern regarding healthcare, housing and other social issues. Increased concern for the environment helped to keep the Green Party in parliament and increased concern regarding high rates of immigration provided a foundation for New Zealand First. However, greater control of immigration was also a Labour issue, framed in terms of economic and social consequences rather than in relation to nationalism or ethnocentrism. Therefore, the coalition government announced in October had an underlying logic and coherence.
In the United States and Europe, immigration is a matter of concern because many newcomers are refugees or enter illegally—borders have proven difficult to control. Due to New Zealand’s geographical distance and separation from other landmasses, almost all illegal immigration is limited to those who overstay previously granted rights of entry. Refugees are admitted through official channels; however, the quota is low relative to those of other countries. Those refugees that are admitted are provided with significant support to adjust to New Zealand and do not present a matter of wide concern; indeed, the New Zealand First Party is on record for advocating a modest increase of the quota and agreeing to this in government. The numbers of immigrants received by New Zealand are among the highest in the world (by head of population), yet concern regarding immigration is relatively low. Opinions consistent with ethnocentric and nationalist populism can be found in New Zealand but there is little or no foundation for mobilising these widely. Although a cultural dimension that spans the differences between social conservatives and social liberals can be identified in public opinion and party policies, it remains secondary rather than dominant.

A PoPULIsT ExCEPTIoN?
64
The economic and social pressures created by high levels of legally sanctioned immigration have been more effectively mobilised across the traditional left–right dimension. Representing this ideological cleavage, despite the neoliberal revolution of the late 1980s and early 1990s, electoral system change and the global financial crisis, the party system remains relatively well-aligned across the urban–rural dimension, crosscut by differences between social groups in terms of incomes, assets and opportunities. While this socio-economic dimension is no longer based on occupational status, its foundations in differences between those who own more and those who own less, little or nothing remain strongly apparent. The focus of class politics has shifted away from status-based occupational differences towards those rooted in production, assets and property. With a government of the centre-left in office, authoritarian populists are likely to advance only if that government is perceived to fail and disappoint; however, New Zealand’s apparently populist party is part of that same government. Winston Peters (aged 74 in early 2020) is unlikely to maintain his political career for much longer. There may be a more successful future for authoritarian populism in New Zealand than in 2017, or even 2020; however, it is as yet impossible to predict what this might be.
ReferencesAimer, P. (1989). Travelling together: Party identification and voting in the New
Zealand General Election of 1987. Electoral Studies, 8(2), 131–142. doi.org/ 10.1016/0261-3794(89)90030-9
Alcántara, M. (2012). Elections in Latin America 2009–2011: A comparative analysis (Working Paper No. 386). Retrieved from kellogg.nd.edu/publications/ workingpapers/WPS/386.pdf
Alford, R. R. (1962). A suggested index of the association of social class and voting. The Public Opinion Quarterly, 26(3), 417–425.
Bean, C. (1984). A comparative study of electoral behaviour in Australia and New Zealand (Unpublished doctoral thesis). Australian National University, Canberra, ACT.
Burr, L. & Templeton, S. (2017). Willie Jackson confirms Labour Party candidacy. Newshub. Retrieved from www.newshub.co.nz/home/politics/2017/02/willie-jackson-confirms-labour-party-candidacy.html
Chapman, R. M. (1962). The general result. In R. M. Chapman, W. K. Jackson & A. Mitchell (Eds), New Zealand politics in action: The 1960 general election (pp. 235–298). London, United Kingdom: Oxford University Press.

65
2 . PoPULIsM AND THE 2017 ELECTIoN—THE BACKGroUND
Clifton, J. (2017a). New Zealand Election 2017: Undercurrents of change in new poll. Noted. Retrieved from www.noted.co.nz/currently/currently-politics/new-zealand-election-2017-undercurrents-of-change-in-new-poll
Clifton, J. (2017b). Why Labour’s last-minute leadership change may be its salvation. Noted. Retrieved from www.noted.co.nz/currently/currently-politics/ why-labours-last-minute-leadership-change-may-be-its-salvation
Curia. (2019a). Archives Colmar Brunton. Retrieved from www.curia.co.nz/company/ colmar-brunton/page/1/
Curia. (2019b). Archives Reid Research. Retrieved from www.curia.co.nz/company/ reid-research/page/1/
Curia. (2019c). Archives Roy Morgan. Retrieved from www.curia.co.nz/company/roy-morgan/
Dalton, R. J. (2020). Citizen politics: Public opinion and political parties in advanced industrial democracies (7th
ed.). Thousand Oaks, CA: CQ Press.
Electoral Commission. (2014). Summary of overall results. Retrieved from archive.electionresults.govt.nz/electionresults_2014/e9/html/e9_part1.html
Electoral Commission. (2017). 2017 general election—official result.. Retrieved from www.electionresults.org.nz/electionresults_2017/
Emanuele, V. (2015). Dataset of electoral volatility and its internal components in Western Europe (1945–2015). Rome, Italy: Italian Center for Electoral Studies. doi.org/10.7802/1112
Gallagher, Michael. (2019). Election indices dataset. Retrieved from www.tcd.ie/Political_Science/staff/michael_gallagher/ElSystems/index.php
Levine, S. & Robinson, A. (1975). New Zealand post-election survey, 1975. ADA Dataverse, V2. doi.org/10.26193/UM8HWF
Mainwaring, S., Gervasoni, C. & Espana-Najera, A. (2017). Extra- and within-system electoral volatility. Party Politics, 23(6), 623–635. doi.org/10.1177/ 1354068815625229
Mills, S. (2018). Survey findings and the 2017 election. In S. Levine (Ed.), Stardust and substance: The New Zealand general election of 2017 (pp. 365–378). Wellington, New Zealand: Victoria University Press.
New Zealand Election Study. (2017). New Zealand Election Study [dataset]. Retrieved from www.nzes.org/exec/show/data
New Zealand Labour Party. (2017). Making immigration work for New Zealand. Retrieved from www.labour.org.nz/immigration

A PoPULIsT ExCEPTIoN?
66
New Zealand Listener. (2017a). New Zealand Election 2017: Undercurrents of change in new poll. New Zealand Listener, 8 June.
New Zealand Listener. (2017b). Why Labour’s last-minute leadership change may be its salvation. New Zealand Listener, 4 August.
New Zealand Listener. (2017c). Poll: Labour, National, and the crucial 8%. New Zealand Listener. 8 September.
Pākehā. (n.d.). In Māori Dictionary. Retrieved from maoridictionary.co.nz/search? idiom=&phrase=&proverb=&loan=&keywords=pakeha
Peters, W. (2005). Securing our borders and protecting our identity. Scoop. Retrieved from www.scoop.co.nz/stories/PA0505/S00702.htm
Reserve Bank of New Zealand. (2018). Real GDP. Retrieved from www.rbnz.govt.nz/statistics/key-graphs/key-graph-real-gdp
Small, V. (2014). Matt McCarten new Labour Chief of Staff. New Zealand Herald. Retrieved from www.stuff.co.nz/national/politics/9763705/Matt-McCarten-new-Labour-chief-of-staff
Statistics New Zealand. (2018a). Gross Domestic Product: December 2017 quarter (Series SNEA.SG09RAC00B01NZD). Retrieved from www.stats.govt.nz/information-releases/gross-domestic-product-december-2017-quarter
Statistics New Zealand. (2018b). International travel and migration: March 2018. Retrieved from www.stats.govt.nz/information-releases/international-travel-and-migration-march-2018
Statistics New Zealand. (2018c). International visitor arrivals to New Zealand: December 2017. Retrieved from www.stats.govt.nz/reports/international-visitor-arrivals-to-new-zealand-december-2017
Vowles, J. (1998). Waiting for the realignment: The New Zealand party system 1972–1993. Political Science 48(2), 184–209. doi.org/10.1177/ 003231879704800203
Vowles, J. (2014). Putting the 2011 election in its place. In J. Vowles (Ed.), The new electoral politics in New Zealand: The significance of the 2011 election (pp. 27–52). Wellington, New Zealand: Institute for Governance and Policy Studies.
Vowles, J., Coffé, H. & Curtin, J. (2017). A bark but no bite: Inequality and the 2014 New Zealand general election. Canberra, Australia: ANU Press. doi.org/ 10.22459/BBNB.08.2017
67
2 . PoPULIsM AND THE 2017 ELECTIoN—THE BACKGroUND
Appendices
Tabl
e A2
.1: E
stim
ated
flow
s of
the
vote
s (2
014–
2017
) (N
ew Z
eala
nd E
lect
ion
Surv
ey P
anel
)
2017
Vot
eN
on-v
ote
Nat
iona
lLa
bour
Gre
enN
Z Fi
rst
Con
serv
ativ
eIn
elig
ible
N
Non-
vote
12 .2
2 .8
2 .9
0 .8
0 .9
0 .7
1 .3
289 .
0
Natio
nal
4 .5
25 .8
0 .5
0 .2
0 .8
1 .0
1 .0
466 .
0
Labo
ur4 .
13 .
613
.62 .
72 .
80 .
21 .
138
7 .0
Gre
en0 .
40 .
60 .
62 .
20 .
40 .
10 .
666
.0
New
Zea
land
Firs
t0 .
70 .
90 .
30 .
12 .
80 .
60 .
076
.0
Cons
erva
tive
0 .0
0 .0
0 .0
0 .0
0 .0
0 .1
0 .0
2 .0
The
opp
ortu
nitie
s Pa
rty0 .
50 .
40 .
30 .
30 .
10 .
10 .
125
.0
Tota
l22
.534
.618
.56 .
47 .
92 .
94 .
11,
344 .
0
Note
: Th
is ta
ble
pres
ents
equ
ivalen
t da
ta t
o Ta
ble
2 .2,
est
imat
ed fr
om t
he 2
017–
2014
Pan
el, fo
llow
ing
itera
tive
weig
htin
g on
the
mar
gina
l fre
quen
cies .
Com
paris
on w
ith V
ote
Com
pass
dat
a in
dica
tes
close
cor
resp
onde
nce
betw
een
the
mat
chin
g co
nsist
ent n
on-v
oter
and
par
ty c
ells .
Fo
r the
201
7 an
d 20
14 P
anels
, as
for t
he N
ZES
in g
ener
al, re
porte
d vo
te is
vali
date
d fro
m o
fficial
reco
rds.
Give
n w
ide
confi
denc
e in
terv
als fo
r ot
her c
ells,
ass
essm
ent o
f diffe
renc
es b
etw
een
this
and
the
Vote
Com
pass
dat
a is
a m
atte
r of j
udge
men
t; ho
wev
er, e
viden
ce o
f sig
nific
ant c
ell
cons
isten
cy b
etw
een
the
two
data
sou
rces
and
larg
er N
s in
the
Vote
Com
pass
dat
a gi
ve s
ome
grou
nds
for c
onfid
ence
in th
e Vo
te C
ompa
ss s
mall
ce
ll est
imat
es .
sour
ce: N
ew Z
ealan
d El
ectio
n st
udy
(201
7) .

A PoPULIsT ExCEPTIoN?
68
Tabl
e A2
.2: P
arty
vot
ing
grou
ps a
nd s
ocia
l str
uctu
re—
mul
tinom
ial l
ogit
mod
el
Ref
eren
ce N
atio
nal
Non
-vot
ers
eLa
bour
rse
Gre
enrs
eN
ZFrs
eO
ther
rse
Age
in y
ears
–0 .0
38**
0 .00
7–0
.012
**0 .
003
–0 .0
40**
0 .00
50 .
001
0 .00
6–0
.022
**0 .
005
Fem
ale–0
.457
*0 .
220
0 .16
80 .
104
–0 .1
580 .
168
–0 .6
30**
0 .17
4–0
.684
**0 .
166
(Male
)
ethn
ic
Māo
ri1 .
454
**0 .
280
1 .34
7**
0 .20
21 .
046
**0 .
289
1 .22
1**
0 .26
72 .
269
**0 .
236
Pasifi
ka–0
.741
0 .92
30 .
246
0 .40
3–1
.889
1 .02
00 .
902
0 .57
0–1
.153
0 .82
5
Asian
0 .42
10 .
388
–0 .3
120 .
232
–1 .3
87**
0 .41
4–1
5 .71
4**
0 .22
5–0
.581
0 .44
5
oth
er–1
5 .22
9**
1 .04
61 .
509
1 .03
50 .
130
1 .43
0–1
4 .87
7**
1 .02
60 .
994
1 .35
2
(Pāk
ehā)
Scho
ol q
ualifi
catio
n–0
.229
0 .33
8–0
.113
0 .17
01 .
468
**0 .
450
–0 .1
850 .
239
0 .42
10 .
317
Terti
ary
quali
ficat
ions
–0 .2
540 .
328
0 .12
20 .
168
1 .65
0**
0 .44
6–0
.180
0 .24
70 .
651
*0 .
304
Unive
rsity
deg
ree
–0 .4
900 .
392
0 .43
0*
0 .18
52 .
640
**0 .
446
–0 .3
180 .
305
1 .07
5**
0 .31
6
(No
quali
ficat
ion)
Man
ual s
ervic
e0 .
452
0 .23
20 .
099
0 .12
3–0
.015
0 .21
20 .
265
0 .18
70 .
007
0 .19
1
Farm
er–0
.405
0 .54
7–1
.585
**0 .
371
–2 .7
46**
1 .04
0–0
.266
0 .39
5–0
.624
0 .47
0
No o
ccup
atio
n1 .
001
0 .67
70 .
005
0 .29
70 .
717
0 .49
00 .
394
0 .42
8–0
.585
0 .60
1
(occ
upat
ion)
Hous
ehol
d in
com
e–0
.213
*0 .
094
–0 .2
44**
0 .04
1–0
.310
**0 .
067
–0 .3
35**
0 .06
6–0
.177
**0 .
063

69
2 . PoPULIsM AND THE 2017 ELECTIoN—THE BACKGroUNDR
efer
ence
Nat
iona
lN
on-v
ote
rse
Labo
urrs
eG
reen
rse
NZF
rse
Oth
errs
e
Low
–risk
ass
ets
–1 .0
51*
0 .46
1–0
.741
*0 .
297
0 .30
70 .
519
–0 .3
920 .
430
–0 .9
69*
0 .44
4
High
–risk
ass
ets
–0 .1
280 .
229
–0 .3
90**
0 .11
0–0
.239
0 .18
0–0
.068
0 .19
1–0
.086
0 .18
0
Unio
n ho
useh
old
–0 .3
570 .
348
0 .82
4**
0 .14
20 .
616
**0 .
210
0 .74
3**
0 .25
20 .
599
**0 .
205
Majo
r urb
an–0
.466
0 .24
00 .
163
0 .10
50 .
307
0 .17
4–0
.253
0 .18
40 .
068
0 .16
7
Publ
ic se
ctor
0 .63
9*
0 .29
60 .
443
**0 .
142
0 .67
6**
0 .21
10 .
168
0 .24
40 .
521
*0 .
210
self–
empl
oyed
0 .45
70 .
272
–0 .0
030 .
137
0 .35
40 .
237
0 .15
10 .
213
0 .15
50 .
211
On
bene
fit0 .
044
0 .29
40 .
388
*0 .
155
0 .22
30 .
242
–0 .0
650 .
254
–0 .0
080 .
244
Chur
ch A
ttend
ance
–0 .5
311 .
014
–0 .1
920 .
465
–0 .8
320 .
862
0 .31
30 .
752
0 .83
70 .
642
Cons
tant
3 .08
1**
0 .73
41 .
436
**0 .
404
–1 .5
21*
0 .76
1–0
.124
0 .68
4–0
.066
0 .62
8
r20 .
102
N3,
295
sour
ce: N
ew Z
ealan
d El
ectio
n st
udy
(201
7) .
This text is taken from A Populist Exception?: The 2017 New Zealand General Election, edited by Jack Vowles and Jennifer Curtin,
published 2020 by ANU Press, The Australian National University, Canberra, Australia.
doi.org/10.22459/PE.2020.02