2 statistical context - productivity commission statistical context ... the variability bands to be...
TRANSCRIPT

INDIGENOUS COMPENDIUM 2015 2.1
2 Statistical context
CONTENTS Aboriginal and Torres Strait Islander data in the Statistical
context chapter 2.2 Population 2.2 Population, by ethnicity and proficiency in English 2.3 Aboriginal and Torres Strait Islander population profile 2.3 Income 2.4 Educational attainment 2.5 Statistical concepts used in the Report — reliability of estimates 2.5 Statistical concepts used in the Report — age standardisation
of data 2.7 List of attachment tables 2.13 References 2.15
Attachment tables Attachment tables are identified in references throughout this Indigenous Compendium by an ‘A’ prefix (for example, in this chapter, table 2A.1). As the data are directly sourced from the 2015 Report, the Compendium also notes where the original table, figure or text in the 2015 Report can be found. For example, where the Compendium refers to ‘2015 Report, p. 2.1’ this is page 1 of chapter 2 of the 2015 Report, and ‘2015 Report, table 2A.1’ is attachment table 1 of attachment 2A of the 2015 Report. A list of attachment tables referred to in the Compendium is provided at the end of this chapter, and the full attachment tables are available from the Review website at www.pc.gov.au/research/recurring/report-on-government-services.
The Statistical context chapter (chapter 2) in the Report on Government Services 2015 (2015 Report) contains contextual information to assist the interpretation of the performance indicators presented in this Report. Data are presented for Aboriginal and Torres Strait Islander people for some items — those data are compiled and presented here. The Statistical context chapter also contains a discussion of the statistical concept of age standardisation and its application to prisoner population rates, and to death rates, for Aboriginal and Torres Strait Islander and non-Indigenous people.
Most of the service areas covered by the Report use estimated resident population (ERP) data from tables 2A.1–2 for descriptive information (such as expenditure per person in the

2.2 REPORT ON GOVERNMENT SERVICES 2015
population) and as denominators for performance indicators (such as calculating participation rates for school education).
Aboriginal and Torres Strait Islander data in the Statistical context chapter
The Statistical context chapter in the 2015 Report contains the following data for Aboriginal and Torres Strait Islander Australians:
• people by country of birth
• people by language spoken at home
• Aboriginal and Torres Strait Islander population estimates and projections, by age and sex
• language spoken at home by Aboriginal and Torres Strait Islander Australians and proficiency in spoken English, by sex
• families and people in families in occupied private dwellings by Indigenous status and family/household composition
• people aged 15 years or over by weekly individual income and Indigenous status
• highest level of schooling completed by people aged 15 years or over, by Indigenous status (excluding people still attending secondary school)
• type of educational institution attending by Indigenous status
• tertiary education attainment for people aged 18 years or over by Indigenous status and sex
• type of tertiary education institution attending for people aged 18–24 years by Indigenous status and sex.
Population
More than three-quarters of Australia’s 23.1 million people lived in the eastern mainland states as at 30 June 2013, with NSW, Victoria and Queensland accounting for 32.0 per cent, 24.8 per cent and 20.1 per cent, respectively, of the nation’s population. WA and SA accounted for a further 10.9 per cent and 7.2 per cent, respectively, while Tasmania, the ACT and the NT accounted for the remaining 2.2 per cent, 1.7 per cent and 1.0 per cent, respectively (table 2A.1). As the majority of Australia’s population lives in the eastern mainland states, data for these jurisdictions generally have a large influence on national averages.
As in most other developed economies, greater life expectancy and declining fertility have contributed to an ‘ageing’ of Australia’s population. However, the age distribution of Aboriginal and Torres Strait Islander people is markedly different to that of all Australians

INDIGENOUS COMPENDIUM 2015 2.3
(figure 2.1). At 30 June 2013, 9.8 per cent of Australia’s population was aged 70 years or over, compared with just 1.9 per cent of Australia’s Aboriginal and Torres Strait Islander population as at 30 June 2011 (tables 2A.1 and 2A.13). Across jurisdictions, the proportion of all people aged 70 years or over ranged from 11.5 per cent in SA and Tasmania to 3.4 per cent in the NT (table 2A.1).
Figure 2.1 Population distribution, Australia, by age and sex,
30 Junea, b
All people (2013) Aboriginal and Torres Strait Islander
Australians (2011)
a Includes other territories. b Estimated Resident Population (ERP) data for 2013 are preliminary, based on the 2011 Census of Population and Housing. Estimates of the Aboriginal and Torres Strait Islander populations at 30 June 2011 are final based on the 2011 Census of Population and Housing.
Source: ABS (Australian Bureau of Statistics) (2013) Australian Demographic Statistics, June 2013, Cat. no. 3101.0; ABS (2013) Estimates and Projections, Aboriginal and Torres Strait Islander Australians, 2001 to 2026, Cat. no. 3238.0; table 2A.13 and 2015 Report, 2A.1; 2015 Report, figure 2.1, p. 2.3.
Population, by ethnicity and proficiency in English
In the NT, 16.3 per cent of people spoke an Aboriginal and Torres Strait Islander language at home (table 2A.11).
Aboriginal and Torres Strait Islander population profile
There were an estimated 669 881 Aboriginal and Torres Strait Islander people (336 198 females and 333 683 males) in Australia at 30 June 2011, accounting for approximately 3.0 per cent of the total Australian population in 2011 (tables 2A.13 and 2015 Report, table 2A.13). The proportion of people who identified as Aboriginal and
Female Male
151050510150–4
15–19
30–34
45–49
60–64
75 +
Per cent
Age
(yea
rs)
151050510150–4
15–19
30–34
45–49
60–64
75 +
Per cent
Age
(yea
rs)
2.4 REPORT ON GOVERNMENT SERVICES 2015
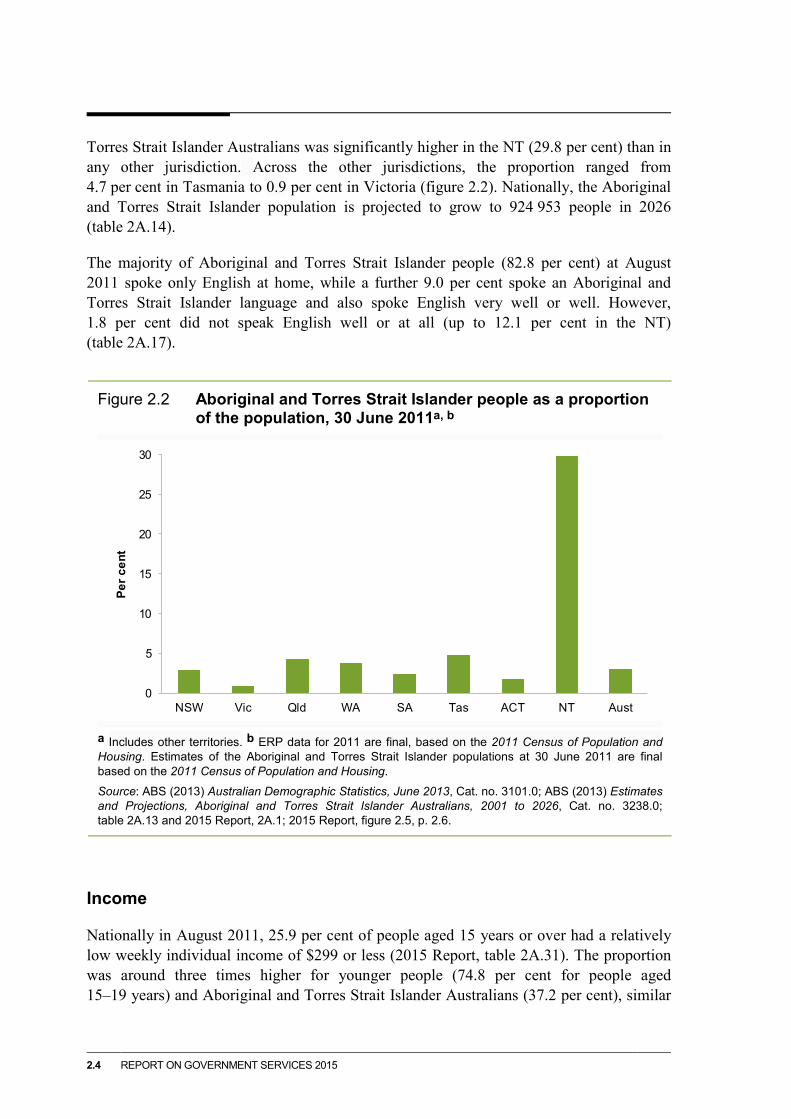
Torres Strait Islander Australians was significantly higher in the NT (29.8 per cent) than in any other jurisdiction. Across the other jurisdictions, the proportion ranged from 4.7 per cent in Tasmania to 0.9 per cent in Victoria (figure 2.2). Nationally, the Aboriginal and Torres Strait Islander population is projected to grow to 924 953 people in 2026 (table 2A.14).
The majority of Aboriginal and Torres Strait Islander people (82.8 per cent) at August 2011 spoke only English at home, while a further 9.0 per cent spoke an Aboriginal and Torres Strait Islander language and also spoke English very well or well. However, 1.8 per cent did not speak English well or at all (up to 12.1 per cent in the NT) (table 2A.17).
Figure 2.2 Aboriginal and Torres Strait Islander people as a proportion
of the population, 30 June 2011a, b
a Includes other territories. b ERP data for 2011 are final, based on the 2011 Census of Population and Housing. Estimates of the Aboriginal and Torres Strait Islander populations at 30 June 2011 are final based on the 2011 Census of Population and Housing.
Source: ABS (2013) Australian Demographic Statistics, June 2013, Cat. no. 3101.0; ABS (2013) Estimates and Projections, Aboriginal and Torres Strait Islander Australians, 2001 to 2026, Cat. no. 3238.0; table 2A.13 and 2015 Report, 2A.1; 2015 Report, figure 2.5, p. 2.6.
Income
Nationally in August 2011, 25.9 per cent of people aged 15 years or over had a relatively low weekly individual income of $299 or less (2015 Report, table 2A.31). The proportion was around three times higher for younger people (74.8 per cent for people aged 15–19 years) and Aboriginal and Torres Strait Islander Australians (37.2 per cent), similar
0
5
10
15
20
25
30
NSW Vic Qld WA SA Tas ACT NT Aust
Per c
ent

INDIGENOUS COMPENDIUM 2015 2.5
for females (30.4 per cent) and lower for older people (20.7 per cent for people aged 85 years or over) (figure 2.3).
Figure 2.3 Weekly individual income of $299 or less, by sex, Indigenous
status and age, 2011a
a ‘Australia’ includes other territories.
Source: ABS (2012) 2011 Census of Population and Housing, Australia, States and Territories, Basic Community Profile, Table B17 — Total personal income (weekly) by age by sex, Cat. no. 2001.0, Canberra; ABS (unpublished) 2011 Census of Population and Housing, Australia, Table generated on 3/10/2012 using ABS TableBulider; table 2A.34 and 2015 Report, tables 2A.31 and 2A.37; 2015 Report, figure 2.8, p. 2.10.
Educational attainment
Employment outcomes and income are closely linked to the education and skill levels of individuals. Tables 2A.39–46 and sector overview B Child care, education and training contain reporting on education and skill levels including highest level of school completed and tertiary education attendance and attainment.
Statistical concepts used in the Report — reliability of estimates
Variability bands
Variability bands accompanying mortality data should be used for the purpose of within jurisdiction analysis at a point in time and over time (box 2.1). They should not be used for comparing mortality rates at a single point in time or over time between jurisdictions as the variability bands and mortality rates do not take into account differences in
0
20
40
60
80
100
NSW Vic Qld WA SA Tas ACT NT Aust
Per c
ent
All people FemalesAboriginal and Torres Strait Islander people People aged 15–19 yearsPeople aged 85 years or over

2.6 REPORT ON GOVERNMENT SERVICES 2015
under-identification of Aboriginal and Torres Strait Islander people’s deaths between jurisdictions.
Rates derived from administrative data counts are not subject to sampling error but might be subject to natural random variation, especially for small counts.
Typically in this standard method, the observed rate is assumed to have natural variability in the numerator count (for example, deaths, hospital visits) but not in the population denominator count. Variations in Aboriginal and Torres Strait Islander people’s death rates may arise from uncertainty in the recording of Indigenous status on the death registration forms (in particular, under-identification of Aboriginal and Torres Strait Islander people’s deaths) and in the Census of Population and Housing, from which population estimates are derived. These variations are not considered in this method. Also, the rate is assumed to have been generated from a normal distribution (2015 Report, figure 2.11). Random variation in the numerator count is assumed to be centred around the true value — that is, there is no systematic bias.
INDIGENOUS COMPENDIUM 2015 2.7
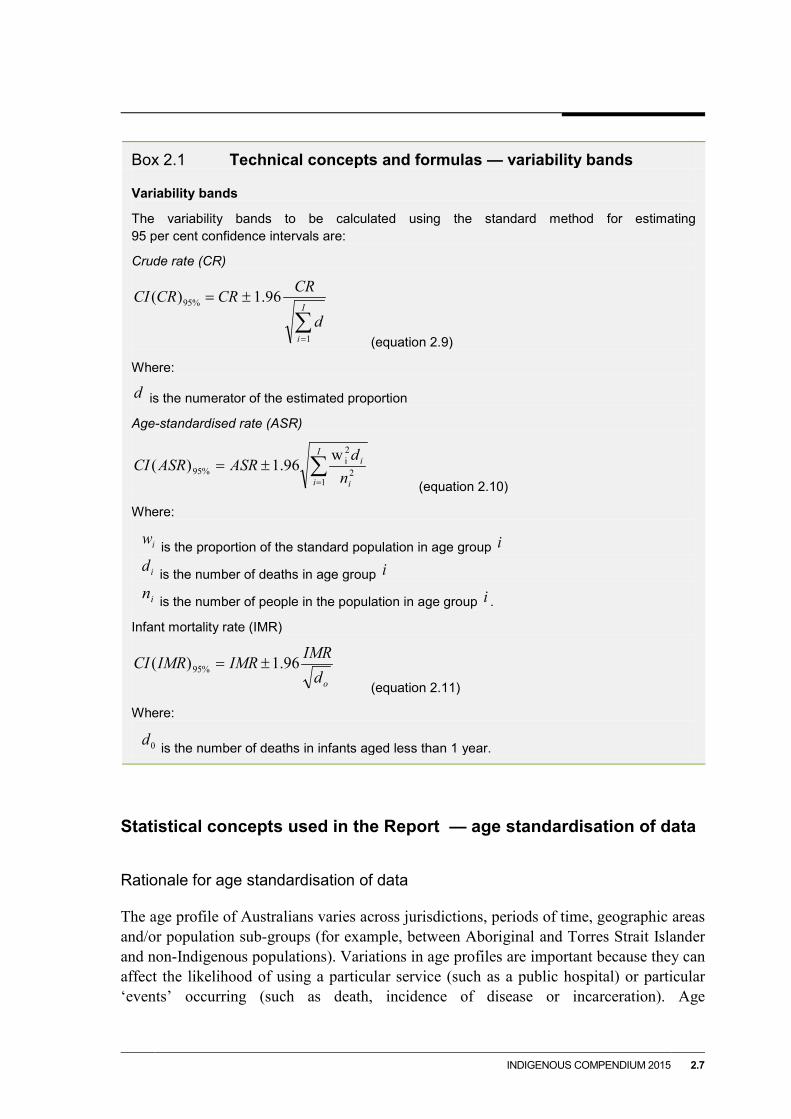
Box 2.1 Technical concepts and formulas — variability bands
Variability bands
The variability bands to be calculated using the standard method for estimating 95 per cent confidence intervals are:
Crude rate (CR)
(equation 2.9)
Where:
is the numerator of the estimated proportion
Age-standardised rate (ASR)
(equation 2.10)
Where:
is the proportion of the standard population in age group
is the number of deaths in age group
is the number of people in the population in age group .
Infant mortality rate (IMR)
(equation 2.11)
Where:
is the number of deaths in infants aged less than 1 year.
Statistical concepts used in the Report — age standardisation of data
Rationale for age standardisation of data
The age profile of Australians varies across jurisdictions, periods of time, geographic areas and/or population sub-groups (for example, between Aboriginal and Torres Strait Islander and non-Indigenous populations). Variations in age profiles are important because they can affect the likelihood of using a particular service (such as a public hospital) or particular ‘events’ occurring (such as death, incidence of disease or incarceration). Age
∑=
±=I
id
CRCRCRCI
1
%95 96.1)(
d
∑=
±=I
i i
i
nd
ASRASRCI1
2
2i
%95w
96.1)(
iw i
id i
in i
odIMRIMRIMRCI 96.1)( %95 ±=
0d

2.8 REPORT ON GOVERNMENT SERVICES 2015
standardisation adjusts for the effect of variations in age profiles when comparing service usage, or rates, of particular events across different populations.
Calculating age standardised rates
Age standardisation adjusts each of the comparison/study populations (for example, Aboriginal and Torres Strait Islander and non-Indigenous populations) against a standard population (box 2.2).
Prior to the 2011 ERP rebasing cycle, it was generally accepted that the ABS produces a new ‘standard population’ every ten years, with the last standard population being 30 June 2001 and the next population was expected to be 30 June 2011. While following this advice has been accepted practice in Australia in recent years, it is important to note that neither demographic nor epidemiological methodology require the standard population to be updated this frequently. In fact, analysis recently undertaken by a joint ABS-Australian Institute of Health and Welfare (AIHW) working group demonstrated that the frequency of the change in the standard population resulted in negligible difference in the comparison of key indicators over time. The use of age-standardisation in statistical analysis in Australia, particularly involving health and demographic data, has increased substantially. As more age-standardised data are used, and as age-standardised time series become longer, a regular revision to the standard process becomes increasingly more resource-intensive and onerous.
Therefore, ABS and AIHW are recommending that the standard population be revised every 25 years (that is, 2001, 2026, 2051 etc.) instead of every 10 years, which would reduce the frequency of revisions without reducing the effectiveness of age-standardised comparisons. This would also align the revision cycle with what demographers generally consider to be the timespan of a generation. The latest standard population used is the final 30 June ERP for the 2001 (AIHW 2013). The result is a standardised estimate for each of the comparison/study populations.
The Review generally reports age standardised rates that have been calculated using either one of two methods, as appropriate. The direct method is generally used for comparisons between study groups. The indirect method is recommended when the age-specific rates for the population being studied are not known (or are unreliable), but the total number of events is known (AIHW 2013).
The direct method has three steps:
Step 1: Calculate the age-specific rate for each age group for the study/comparison group.
Step 2: Calculate the expected number of ‘events’ in each age group by multiplying the age-specific rates by the corresponding standard population.
Step 3: Sum the expected number of cases in each age group and divide by the total of the standard population (box 2.2, equation 2.15).

INDIGENOUS COMPENDIUM 2015 2.9
The indirect method has four steps:
Step 1: Calculate the age-specific rates for each age group in the standard population.
Step 2: Apply the age-specific rates resulting from step 1 to the number in each age group of the study population and sum to derive the total ‘expected’ number of cases for the study population.
Step 3: Divide the observed number of events in the study population by the ‘expected’ number of cases for the study population derived in step 2.
Step 4: Multiply the result of step 3 by the crude rate in the standard population (box 2.2, equation 2.16).
Box 2.2 Technical concepts and formulas — direct and indirect age
standardisation The formula for deriving the age standardised rate using the direct method is:
(equation 2.15)
The formula for deriving the age standardised rate using the indirect method is:
(equation 2.16)
The formula for deriving the age standardised ratio using the indirect method is:
(equation 2.17)
Where:
is the age-standardised rate for the population being studied
is the standardised ratio for the population being studied
is the age-group specific rate for age group i in the population being studied
is the population of age group i in the standard population
is the observed number of events in the population being studied
is the expected number of events in the population being studied
is the age-group specific rate for age group i in the standard population
is the population for age group i in the population being studied is the crude rate in the standard population.
Source: AIHW (2013).
( )∑∑=
i
ii
PPr
SR
( ) RpR
CSRii
×=∑
( )∑=
iia pR
CSR
SR
aSR
ir
iPC
( )∑ ii pR
iR
ipR

2.10 REPORT ON GOVERNMENT SERVICES 2015
Tables 2A.52–53 in the attachment contain examples of the application of direct and indirect age standardisation, respectively. Standardised rates are generally multiplied by 1000 or 100 000 to avoid small decimal fractions. They are then reported as age standardised rates per 1000 or 100 000 population (AIHW 2013).
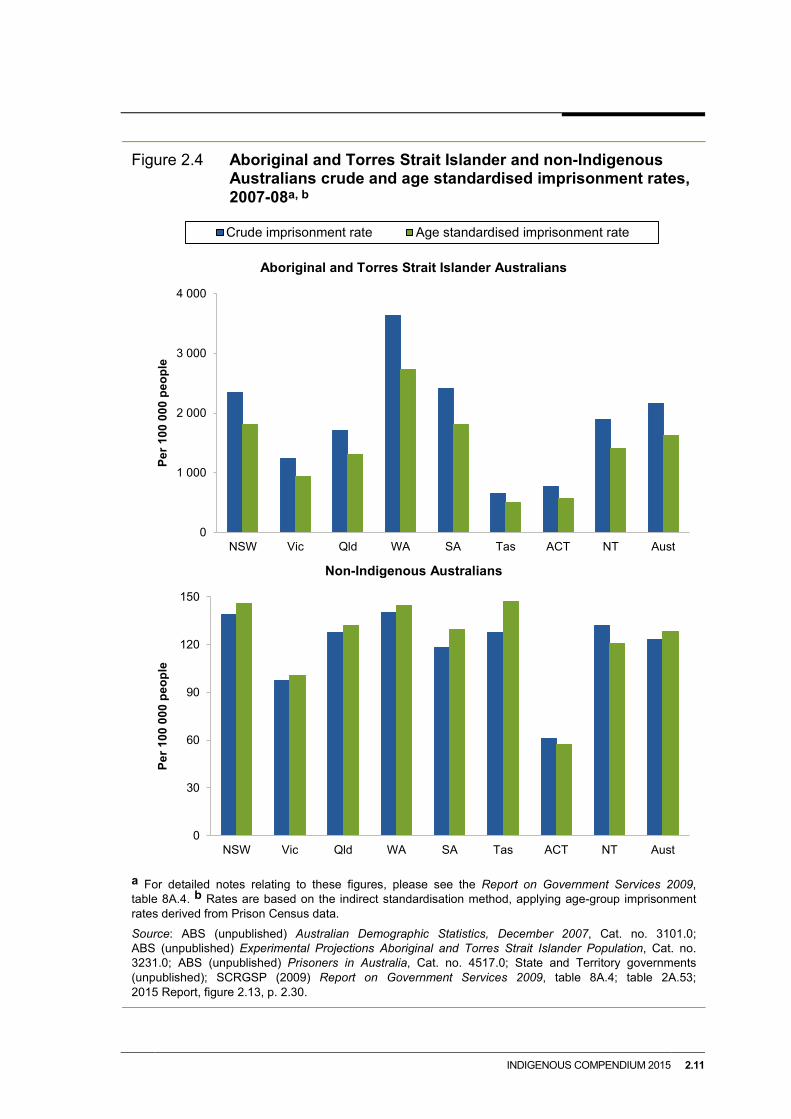
Figure 2.4 compares crude imprisonment rates and imprisonment rates standardised against the age profile of the total Australian prisoner population for Aboriginal and Torres Strait Islander and non-Indigenous Australians.
INDIGENOUS COMPENDIUM 2015 2.11
Figure 2.4 Aboriginal and Torres Strait Islander and non-Indigenous
Australians crude and age standardised imprisonment rates, 2007-08a, b
Aboriginal and Torres Strait Islander Australians
Non-Indigenous Australians
a For detailed notes relating to these figures, please see the Report on Government Services 2009, table 8A.4. b Rates are based on the indirect standardisation method, applying age-group imprisonment rates derived from Prison Census data.
Source: ABS (unpublished) Australian Demographic Statistics, December 2007, Cat. no. 3101.0; ABS (unpublished) Experimental Projections Aboriginal and Torres Strait Islander Population, Cat. no. 3231.0; ABS (unpublished) Prisoners in Australia, Cat. no. 4517.0; State and Territory governments (unpublished); SCRGSP (2009) Report on Government Services 2009, table 8A.4; table 2A.53; 2015 Report, figure 2.13, p. 2.30.
Crude imprisonment rate Age standardised imprisonment rate
0
1 000
2 000
3 000
4 000
NSW Vic Qld WA SA Tas ACT NT Aust
Per 1
00 0
00 p
eopl
e
0
30
60
90
120
150
NSW Vic Qld WA SA Tas ACT NT Aust
Per 1
00 0
00 p
eopl
e

2.12 REPORT ON GOVERNMENT SERVICES 2015
Calculating age standardised ratios
A variation of the indirect method is used to calculate age standardised ratios (2015 Report, box 2.6). These ratios express the overall experience of a study population in terms of a standard population, where the standard population is the population to which the study population is being compared.
Application of age standardised ratios
Standardised Mortality Ratios (SMRs) have been used to compare death rates between the Aboriginal and Torres Strait Islander and non-Indigenous populations (table 2.1). The SMR is the ratio between the observed number of deaths in the Aboriginal and Torres Strait Islander population and the expected number of deaths that would have occurred if the Aboriginal and Torres Strait Islander population experienced the same age-specific death rates as the non-Indigenous population. Where the number of observed deaths is higher than the number of expected deaths, the SMR is greater than 1 and the difference in deaths is the excess number of deaths of Aboriginal and Torres Strait Islander Australians (AIHW 2011a).
New developments in age standardisation techniques
The ABS and the AIHW have recently worked on improving age standardisation techniques.
Principles on the use of direct age-standardisation in administrative data collections: for measuring the gap between Aboriginal and Torres Strait Islander Australians and non-Indigenous Australians (AIHW 2011b) recommends that the direct method of age-standardisation be used for purposes of comparing health and welfare outcome measures (for example, mortality rates, life expectancy, hospital separation rates and disease incidence rates) of the Aboriginal and Torres Strait Islander population and non-Indigenous population. The principles provide consistency and guidance on when and how to use the direct age standardisation method and under what circumstances it should not be used.

INDIGENOUS COMPENDIUM 2015 2.13
Table 2.1 Aboriginal and Torres Strait Islander Australians’ deaths, main
causes and standardised mortality ratios, 2004–2008a, b, c
Male Female
Observed deaths
Expected deaths
SMR
Observed deaths
Expected deaths
SMR
Diseases of the circulatory system 321 107 3.0 260 148 1.8 Neoplasms 200 120 1.7 191 150 1.3 External causes 225 61 3.7 98 64 1.5 Endocrine, metabolic and
nutritional disorders 86 12 7.2 96 15 6.4
Diseases of the respiratory system 94 24 3.9 96 33 2.3 Diseases of the digestive system 70 11 6.4 76 14 4.2 Diseases of the nervous system 33 13 2.5 59 16 1.3 Conditions originating in the
perinatal period 31 14 2.2 21 14 1.6
Certain infectious and parasitic diseases
27 6 4.5 22 7 3.1
All causes 1 211 397 3.1 957 497 1.9
SMR = Standardised Mortality Ratio. a Data for Queensland, WA, SA and the NT combined. b Observed and expected deaths are reported as average number of annual deaths from 2004–2008. Excepted deaths are based on non-Indigenous death rates. c Standardised mortality ratio is the observed Aboriginal and Torres Strait Islander Australians deaths divided by expected Aboriginal and Torres Strait Islander Australians deaths, based on the age, sex and cause-specific rates for non-Indigenous Australians.
Source: AIHW (2011) Life expectancy and mortality of Aboriginal and Torres Strait Islander people, Cat. no. IHW 51, Canberra.
List of attachment tables
Attachment tables for data within this chapter are contained in the attachment to the Compendium. These tables are identified in references throughout this chapter by a ‘2A’ prefix (for example, table 2A.1 is table 1 in the Statistical context attachment). Attachment tables are on the Review website (www.pc.gov.au/research/recurring/report-on-government-services).
Population
Table 2A.6 People by country of birth, 2001
Table 2A.7 People by country of birth, 2006
Table 2A.8 People by country of birth, 2011
Table 2A.9 People by language spoken at home, 2001 ('000)
Table 2A.10 People by language spoken at home, 2006 ('000)
Table 2A.11 People by language spoken at home, 2011 ('000)

2.14 REPORT ON GOVERNMENT SERVICES 2015
Table 2A.13 Aboriginal and Torres Strait Islander population projections, by age and sex, 30 June
Table 2A.14 Aboriginal and Torres Strait Islander population projections, by age and sex, 30 June
Table 2A.15 Language spoken at home by Aboriginal and Torres Strait Islander Australians and proficiency in spoken English, by sex, 2001 (number)
Table 2A.16 Language spoken at home by Aboriginal and Torres Strait Islander Australians and proficiency in spoken English, by sex, 2006 (number)
Table 2A.17 Language spoken at home by Aboriginal and Torres Strait Islander Australians and proficiency in spoken English, by sex, 2011 (number)
Family and household
Table 2A.21 Families and people in families in occupied private dwellings by Indigenous status and family/household composition, 2001
Table 2A.22 Families and people in families in occupied private dwellings by Indigenous status and family/household composition, 2006
Table 2A.23 Families and people in families in occupied private dwellings by Indigenous status and family/household composition, 2011
Income and employment
Table 2A.32 People aged 15 years or over by weekly individual income and Indigenous status, 2001
Table 2A.33 People aged 15 years or over by weekly individual income and Indigenous status, 2006
Table 2A.34 People aged 15 years or over by weekly individual income and Indigenous status, 2011
Table 2A.39 Highest level of schooling completed by people aged 15 years or over, by Indigenous status, 2001 ('000)
Table 2A.40 Highest level of schooling completed by people aged 15 years or over, by Indigenous status (excluding people still attending secondary school), 2006 ('000)
Table 2A.41 Highest level of schooling completed by people aged 15 years or over, by Indigenous status (excluding people still attending secondary school), 2011 ('000)
Table 2A.42 Type of educational institution attending by Indigenous status, 2001 ('000)
Table 2A.43 Type of educational institution attending by Indigenous status, 2006 ('000)
Table 2A.44 Type of educational institution attending by Indigenous status, 2011 ('000)
Table 2A.45 Tertiary education attainment for people aged 18 or over by Indigenous status and sex, 2011 ('000)
Table 2A.46 Type of tertiary education institution attending for people aged 18-24 by Indigenous status and sex, 2011 ('000)
Statistical concepts
Table 2A.50 General Government Final Consumption Expenditure, by jurisdiction (2012-13 dollars)
INDIGENOUS COMPENDIUM 2015 2.15
Table 2A.51 General Government Final Consumption Expenditure, Chain price Index (GGFCE)
Table 2A.52 Age standardisation of data using the direct method
Table 2A.53 Age standardisation of data using the indirect method
References AIHW (Australian Institute of Health and Welfare) 2011a, Life expectancy and mortality
of Aboriginal and Torres Strait Islander people, Cat. no. IHW 51, Canberra.
—— 2011b, Principles on the use of direct age-standardisation in administrative data collections: for measuring the gap between Indigenous and non-Indigenous Australians, Cat. no. CSI 12, Canberra.
—— 2013, Age-standardised rate, METeOR, meteor.aihw.gov.au/ content/ index.phtml/ itemId/327276 (accessed 27 August 2013).

2A Statistical context — attachment
Definitions for indicators and descriptors in this attachment are in the Statistical context of the
Compendium.
Tables in this attachment are sourced from the Statistical context attachment of the 2015 Report.
Table numbers refer to the 2015 Report, for example, a reference to ‘2015 Report, table 2A.15’
refers to attachment table 15 of attachment 2A of the 2015 Report.
This file is available in Adobe PDF format on the Review web page
(www.pc.gov.au/research/recurring/report-on-government-services).
INDIGENOUS
COMPENDIUM 2015
STATISTICAL CONTEXT

CONTENTS
Attachment contents
Population
Table 2A.6 People by country of birth, 2001
Table 2A.7 People by country of birth, 2006
Table 2A.8 People by country of birth, 2011
Table 2A.9 People by language spoken at home, 2001 ('000)
Table 2A.10 People by language spoken at home, 2006 ('000)
Table 2A.11 People by language spoken at home, 2011 ('000)
Table 2A.13 Aboriginal and Torres Strait Islander population estimates, by age and sex, 30 June
Table 2A.14 Aboriginal and Torres Strait Islander population projections, by age and sex, 30 June
Table 2A.15 Language spoken at home by Aboriginal and Torres Strait Islander Australians and proficiency
in spoken English, by sex, 2001 (number)
Table 2A.16 Language spoken at home by Aboriginal and Torres Strait Islander Australians and proficiency
in spoken English, by sex, 2006 (number)
Table 2A.17 Language spoken at home by Aboriginal and Torres Strait Islander Australians and proficiency
in spoken English, by sex, 2011 (number)
Family and household
Table 2A.21 Families and people in families in occupied private dwellings by Indigenous status and
family/household composition, 2001
Table 2A.22 Families and people in families in occupied private dwellings by Indigenous status and
family/household composition, 2006
Table 2A.23 Families and people in families in occupied private dwellings by Indigenous status and
family/household composition, 2011
Income and employment
Table 2A.32 People aged 15 years or over by weekly individual income and Indigenous status, 2001
Table 2A.33 People aged 15 years or over by weekly individual income and Indigenous status, 2006
Table 2A.34 People aged 15 years or over by weekly individual income and Indigenous status, 2011
Table 2A.39 Highest level of schooling completed by people aged 15 years or over, by Indigenous status,
2001 ('000)
Table 2A.40 Highest level of schooling completed by people aged 15 years or over, by Indigenous status
(excluding people still attending secondary school), 2006 ('000)
Table 2A.41 Highest level of schooling completed by people aged 15 years or over, by Indigenous status
(excluding people still attending secondary school), 2011 ('000)
Table 2A.42 Type of educational institution attending by Indigenous status, 2001 ('000)
Table 2A.43 Type of educational institution attending by Indigenous status, 2006 ('000)
Table 2A.44 Type of educational institution attending by Indigenous status, 2011 ('000)
Table 2A.45 Tertiary education attainment for people aged 18 or over by Indigenous status and sex, 2011
('000)
Table 2A.46 Type of tertiary education institution attending for people aged 18-24 years by Indigenous
status and sex, 2011 ('000)
Statistical concepts
Table 2A.50 General Government Final Consumption Expenditure, by jurisdiction (2012-13 dollars)
Table 2A.51 General Government Final Consumption Expenditure, Chain price Index (GGFCE)
Table 2A.52 Age standardisation of data using the direct method
Table 2A.53 Age standardisation of data using the indirect method
INDIGENOUS
COMPENDIUM 2015
STATISTICAL CONTEXT
PAGE 1 of CONTENTS

CONTENTS
Attachment contents
Table 2A.53 Age standardisation of data using the indirect method
INDIGENOUS
COMPENDIUM 2015
STATISTICAL CONTEXT
PAGE 2 of CONTENTS

POPULATION
Population
INDIGENOUS
COMPENDIUM 2015
STATISTICAL CONTEXT
PAGE 1 of POPULATION

TABLE 2A.6
Table 2A.6
Unit NSW Vic Qld WA SA Tas ACT NT Aust
Born in Australia
Aboriginal and Torres Strait Islander
Aboriginal '000 112.2 22.3 87.3 56.3 22.1 13.6 3.3 49.1 366.4
Torres Strait Islander '000 4.2 1.7 16.4 0.9 0.8 1.3 0.2 0.6 26.0
Both (b) '000 3.5 1.0 9.0 1.3 0.6 0.9 0.1 1.1 17.5
Total '000 119.9 25.1 112.8 58.5 23.4 15.8 3.6 50.8 410.0
Non-Indigenous '000 4 330.9 3 252.0 2 673.6 1 183.3 1 076.2 370.3 224.8 107.2 13 219.7
Total born in Australia '000 4 450.8 3 277.1 2 786.4 1 241.8 1 099.6 386.0 228.4 158.0 13 629.7
Proportion born in Australia % 70.5 71.1 77.7 67.8 75.4 84.9 73.9 77.9 72.6
Born overseas (c)
Other main English speaking countries
Canada '000 9.2 5.3 6.1 3.5 1.6 0.5 0.8 0.3 27.3
Ireland '000 17.7 11.5 7.2 8.9 3.3 0.6 0.7 0.4 50.2
New Zealand '000 105.7 55.2 127.6 45.0 11.0 3.6 4.0 3.7 355.8
South Africa '000 28.6 15.6 14.6 15.4 3.1 0.9 0.9 0.4 79.4
United Kingdom (d) '000 275.1 205.5 183.7 201.5 124.0 21.3 17.0 7.9 1 036.2
United States '000 19.2 11.2 10.2 6.1 3.0 0.9 1.9 1.2 53.7
Total '000 455.6 304.4 349.3 280.3 145.9 27.9 25.2 13.8 1 602.7
Proportion of other main English speaking countries % 7.2 6.6 9.7 15.3 10.0 6.1 8.2 6.8 8.5
Other countries
China (e) '000 85.4 36.8 8.9 5.2 3.6 0.5 2.0 0.4 142.8
Croatia '000 18.4 18.9 3.7 5.2 3.6 0.3 1.7 0.1 51.9
Egypt '000 17.3 11.5 1.6 1.5 1.1 0.1 0.2 0.1 33.4
Fiji '000 27.1 7.1 7.6 0.6 0.8 0.3 0.6 0.2 44.3
France '000 6.4 3.9 3.3 1.7 1.1 0.2 0.4 0.2 17.3
Germany '000 31.6 28.7 19.8 10.0 12.7 1.9 2.4 1.1 108.2
Greece '000 36.9 57.6 4.1 3.2 11.7 0.6 1.3 1.1 116.4
People by country of birth, 2001
INDIGENOUS
COMPENDIUM 2015
STATISTICAL CONTEXT
PAGE 1 of TABLE 2A.6

TABLE 2A.6
Table 2A.6
Unit NSW Vic Qld WA SA Tas ACT NT Aust
People by country of birth, 2001
Hong Kong (f) '000 37.5 16.0 6.7 3.6 1.8 0.3 1.0 0.3 67.1
India '000 37.9 30.6 7.3 13.1 3.7 0.5 1.8 0.5 95.5
Indonesia '000 21.0 11.0 4.7 7.7 1.3 0.2 0.6 0.7 47.2
Italy '000 60.7 90.1 15.9 23.1 25.0 1.1 2.3 0.6 218.7
Korea, Rep. of (South) '000 27.9 3.5 4.1 1.4 0.9 0.3 0.6 0.1 38.9
Lebanon '000 53.2 14.2 1.2 0.9 1.5 – 0.4 – 71.3
Macedonia (g) '000 19.1 19.5 0.8 3.2 0.4 – 0.4 – 43.5
Malaysia '000 21.1 24.7 8.1 17.4 4.2 0.7 1.6 0.6 78.9
Malta '000 18.4 22.3 3.0 1.0 1.8 0.1 0.3 0.1 47.0
Netherlands '000 20.3 23.5 16.2 10.5 8.3 2.5 1.3 0.7 83.3
Philippines '000 52.2 22.5 15.4 5.4 4.5 0.8 1.4 1.7 103.9
Poland '000 16.9 20.0 5.7 6.4 6.9 0.9 1.2 0.2 58.1
Singapore '000 8.5 7.6 4.6 10.2 1.4 0.3 0.7 0.2 33.5
Sri Lanka '000 16.9 26.6 4.0 3.0 1.1 0.2 1.4 0.3 53.5
Turkey '000 12.1 15.2 1.0 0.7 0.6 – 0.1 – 29.8
Viet Nam '000 63.0 56.6 11.8 10.1 10.4 0.2 2.2 0.6 154.8
Yugoslavia (h) '000 19.7 19.6 5.5 4.6 4.3 0.3 1.2 0.1 55.4
Other overseas (i) '000 289.9 187.9 101.8 65.3 37.9 5.4 14.1 5.7 708.1
Total other countries '000 1 019.4 775.9 266.8 214.9 150.5 17.5 41.5 15.5 2 502.8
Proportion of other countries % 16.2 16.8 7.4 11.7 10.3 3.9 13.4 7.6 13.3
Total born overseas '000 1 475.0 1 080.3 616.2 495.2 296.5 45.4 66.7 29.4 4 105.4
Proportion born overseas % 23.4 23.4 17.2 27.0 20.3 10.0 21.6 14.5 21.9
Not stated '000 385.4 254.7 183.1 95.0 62.9 23.4 14.1 15.4 1 034.1
Total '000 6 311.2 4 612.1 3 585.6 1 832.0 1 458.9 454.8 309.2 202.7 18 769.2
(a)
(b)
(c)
Data for people by country of birth 2001, 2006 and 2011 are not comparable as they are sourced from different Census Collections.
Applicable to persons who are of both Aboriginal and Torres Strait Islander origin.
Excludes overseas visitors.
INDIGENOUS
COMPENDIUM 2015
STATISTICAL CONTEXT
PAGE 2 of TABLE 2A.6

TABLE 2A.6
Table 2A.6
Unit NSW Vic Qld WA SA Tas ACT NT Aust
People by country of birth, 2001
(d)
(e)
(f)
(g)
(h)
(i)
Source :
Federal Republic of Yugoslavia.
Includes inadequately described, at sea and not elsewhere classified.
ABS (unpublished) Census of Population and Housing, Australia , Cat. no. 2002.0.
Includes England, Scotland, Wales, Northern Ireland, Channel Islands, Isle of Man, and United Kingdom not further defined.
Excludes Hong Kong and Macau.
Includes Macau.
Former Yugoslav Republic of Macedonia.
– Nil or rounded to zero.
INDIGENOUS
COMPENDIUM 2015
STATISTICAL CONTEXT
PAGE 3 of TABLE 2A.6

TABLE 2A.7
Table 2A.7
Unit NSW Vic Qld WA SA Tas ACT NT Aust (b)
Born in Australia
Aboriginal and Torres Strait Islander
Aboriginal '000 124.4 25.6 94.6 53.9 22.9 14.3 3.5 50.8 390.2
Torres Strait Islander '000 4.0 1.8 17.5 1.0 0.9 1.2 0.2 0.6 27.1
Both Aboriginal and Torres Strait Islander '000 2.8 0.8 10.1 1.0 0.4 0.6 0.1 1.3 17.1
Total '000 131.2 28.1 122.3 55.8 24.3 16.1 3.7 52.7 434.4
Non-Indigenous '000 4 328.9 3 360.1 2 777.5 1 207.2 1 081.9 374.4 230.6 94.0 13 456.0
Indigenous status not stated '000 61.1 46.3 35.5 16.2 13.9 6.2 2.1 1.5 182.6
Total born in Australia '000 4 521.2 3 434.5 2 935.3 1 279.2 1 120.1 396.7 236.5 148.2 14 072.9
Proportion born in Australia % 69.0 69.6 75.2 65.3 74.0 83.2 73.0 76.8 70.9
Born overseas
Other main English speaking countries
Canada '000 10.2 6.2 7.4 4.1 1.9 0.6 0.9 0.3 31.6
Ireland '000 17.3 11.5 7.7 9.0 3.2 0.6 0.7 0.3 50.3
New Zealand '000 106.6 64.0 148.8 47.3 11.4 4.2 3.9 3.3 389.5
South Africa '000 32.9 19.3 22.7 22.0 4.5 1.1 1.1 0.5 104.1
United Kingdom (c) '000 265.9 204.8 193.1 208.4 121.0 22.6 16.1 6.2 1 038.2
United States of America '000 21.8 13.3 12.2 6.7 3.4 1.2 2.0 1.1 61.7
Total other main English speaking countries '000 454.6 319.2 391.8 297.6 145.4 30.2 24.7 11.6 1 675.3
Proportion of other main English speaking countries % 6.9 6.5 10.0 15.2 9.6 6.3 7.6 6.0 8.4
Other countries
China (excludes SARs and Taiwan Province) (d) '000 114.0 56.6 15.1 8.0 8.1 1.0 3.5 0.3 206.6
Croatia '000 18.5 18.2 3.9 5.2 3.5 0.3 1.5 – 51.0
Egypt '000 17.2 11.6 1.8 1.5 1.0 0.1 0.2 0.1 33.5
Fiji '000 28.6 7.9 8.9 0.7 0.9 0.3 0.7 0.2 48.1
Former Yugoslav Republic of Macedonia (FYROM) '000 17.7 18.3 0.9 3.0 0.4 – 0.4 – 40.7
France '000 7.0 4.4 3.9 1.9 1.1 0.2 0.4 0.2 19.2
People by country of birth, 2006 (a)
INDIGENOUS
COMPENDIUM 2015
STATISTICAL CONTEXT
PAGE 1 of TABLE 2A.7

TABLE 2A.7
Table 2A.7
Unit NSW Vic Qld WA SA Tas ACT NT Aust (b)
People by country of birth, 2006 (a)
Germany '000 31.1 28.1 20.1 9.9 12.0 2.1 2.4 0.9 106.5
Greece '000 35.1 54.3 4.1 3.0 10.8 0.6 1.2 0.9 110.0
Hong Kong (SAR of China) (d) '000 38.3 17.4 7.8 4.1 2.4 0.3 1.2 0.2 71.8
India '000 57.2 52.9 11.0 15.2 6.8 0.8 2.7 0.6 147.1
Indonesia '000 21.9 12.6 5.3 7.9 1.5 0.2 0.8 0.8 51.0
Italy '000 55.2 82.9 14.0 20.9 22.5 1.0 2.2 0.4 199.1
Korea, Republic of (South) '000 33.2 6.3 7.6 2.2 2.0 0.4 0.9 0.1 52.8
Lebanon '000 55.8 14.9 1.3 0.9 1.5 0.1 0.4 – 74.9
Macau (SAR of China) (d) '000 1.1 0.6 0.2 0.1 – – – – 2.0
Malaysia '000 23.4 30.5 9.6 19.7 5.3 1.0 1.8 0.6 92.3
Malta '000 17.0 20.8 2.8 1.0 1.6 0.1 0.3 0.1 43.7
Netherlands '000 18.8 22.8 15.3 10.1 7.8 2.4 1.2 0.5 78.9
Philippines '000 57.7 27.3 18.7 6.8 5.4 1.0 1.7 1.9 120.5
Poland '000 15.2 18.1 5.1 5.7 6.2 0.7 1.1 0.1 52.3
Singapore '000 9.7 10.5 4.9 11.8 1.8 0.3 0.7 0.3 40.0
Sri Lanka '000 19.1 31.5 4.8 3.3 1.5 0.2 1.6 0.3 62.3
Turkey '000 12.5 15.3 1.1 0.8 0.6 – 0.2 – 30.5
Viet Nam '000 63.8 58.9 13.1 10.5 10.5 0.1 2.4 0.6 159.9
Montenegro '000 0.2 0.4 0.1 0.1 – – – – 0.8
Serbia (e) '000 6.1 6.7 1.4 1.2 1.4 0.1 0.5 – 17.3
South Eastern Europe, nfd (f) '000 11.8 11.2 3.9 2.9 2.7 0.2 0.5 0.1 33.4
Other Overseas (g) '000 314.1 213.1 120.9 75.8 42.8 6.7 15.2 5.9 794.4
Total other countries '000 1 101.1 854.0 307.5 234.1 162.2 20.3 45.7 14.9 2 740.5
Proportion of other countries % 16.8 17.3 7.9 12.0 10.7 4.3 14.1 7.7 13.8
Total born overseas '000 1 555.8 1 173.2 699.4 531.7 307.7 50.5 70.4 26.5 4 415.8
Australian External Territories (h) '000 0.1 – 0.1 – – – – – 0.2
Proportion born overseas % 23.8 23.8 17.9 27.1 20.3 10.6 21.7 13.8 22.2
INDIGENOUS
COMPENDIUM 2015
STATISTICAL CONTEXT
PAGE 2 of TABLE 2A.7

TABLE 2A.7
Table 2A.7
Unit NSW Vic Qld WA SA Tas ACT NT Aust (b)
People by country of birth, 2006 (a)
Not stated '000 472.2 324.7 269.8 148.1 86.6 29.3 17.2 18.2 1 366.3
Total '000 6 549.2 4 932.4 3 904.5 1 959.1 1 514.3 476.5 324.0 192.9 19 855.3
nfd Not further defined; SAR Special Administrative Region.
(a)
(b)
(c)
(d)
(e)
(f)
(g)
(h)
Source :
Data for people by country of birth 2001, 2006 and 2011 are not comparable as they are sourced from different Census Collections.
ABS (unpublished) 2006 Census of Population and Housing, Cat. no. 2068.0.
SARs comprise 'Hong Kong (SAR of China)' and 'Macau (SAR of China)'.
Includes Other Territories.
United Kingdom comprises United Kingdom nfd, Channel Islands, England, Isle of Man, Northern Ireland, Scotland and Wales.
There is an issue regarding Serbian Census data which relates to changes in the official country name and regional alliances. This affects 2006 Census data and
has clouded a meaningful picture of the Serbian country of birth data (see ABS, Census Dictionary , 2006, Cat. no. 2901.0 [Reissue]).
Includes people who stated their birthplace as Yugoslavia.
Includes countries not identified individually, inadequately described, at sea and not elsewhere classified (nec).
Includes Australia (includes External Territories) nfd, Australian External Territories nec and Norfolk Island.
– Nil or rounded to zero.
INDIGENOUS
COMPENDIUM 2015
STATISTICAL CONTEXT
PAGE 3 of TABLE 2A.7

TABLE 2A.8
Table 2A.8
Unit NSW Vic Qld WA SA Tas ACT NT Aust (b)
Born in Australia
Aboriginal and Torres Strait Islander
Aboriginal '000 158.2 33.5 118.9 64.0 27.7 17.2 4.7 53.7 478.2
Torres Strait Islander '000 4.1 1.8 19.2 1.2 0.9 1.1 0.2 0.6 29.1
Both Aboriginal and Torres Strait Islander '000 3.1 0.8 12.4 1.3 0.5 0.7 0.1 1.5 20.4
Total '000 165.4 36.1 150.5 66.5 29.2 19.0 5.0 55.8 527.8
Non-Indigenous '000 4 529.8 3 594.6 3 010.1 1 330.8 1 129.5 390.3 248.3 100.7 14 335.3
Indigenous status not stated '000 52.2 40.2 31.6 14.3 12.1 4.9 1.8 1.6 158.7
Total born in Australia '000 4 747.4 3 670.9 3 192.1 1 407.8 1 170.8 414.3 255.1 158.0 15 017.8
Proportion born in Australia % 68.6 68.6 73.7 62.9 73.3 83.6 71.4 74.6 69.8
Born overseas
Other main English speaking countries
Canada '000 11.9 7.8 9.7 5.2 2.2 0.7 1.1 0.3 38.9
Ireland '000 21.9 14.6 10.9 14.3 3.5 0.7 0.8 0.6 67.3
New Zealand '000 114.2 80.2 192.0 70.7 12.9 4.9 4.4 4.0 483.4
South Africa '000 40.2 24.5 35.5 35.3 6.2 1.5 1.6 0.8 145.7
United Kingdom, Channel Islands and Isle of Man (c) '000 274.8 213.4 214.3 230.4 122.3 23.3 16.1 6.4 1 101.1
United States of America '000 26.5 16.8 15.8 8.9 4.0 1.5 2.4 1.1 77.0
Total other main English speaking countries '000 489.7 357.3 478.3 364.8 151.0 32.6 26.5 13.2 1 913.4
Proportion of other main English speaking countries % 7.1 6.7 11.0 16.3 9.5 6.6 7.4 6.2 8.9
Other countries
Bosnia and Herzegovina '000 7.7 9.2 3.3 2.8 2.2 0.1 0.4 – 25.7
Cambodia '000 11.1 11.4 1.5 1.0 2.8 – 0.3 0.1 28.3
China (excludes SARs and Taiwan Province) (d) '000 156.0 93.9 27.0 16.7 15.9 1.9 6.6 0.9 319.0
Croatia '000 17.7 17.2 3.8 5.1 3.1 0.3 1.5 0.1 48.8
Egypt '000 18.4 12.5 2.1 1.9 1.2 0.1 0.3 0.1 36.5
Fiji '000 32.3 9.7 11.4 1.0 1.2 0.3 0.8 0.3 57.0
People by country of birth, 2011 (a)
INDIGENOUS
COMPENDIUM 2015
STATISTICAL CONTEXT
PAGE 1 of TABLE 2A.8
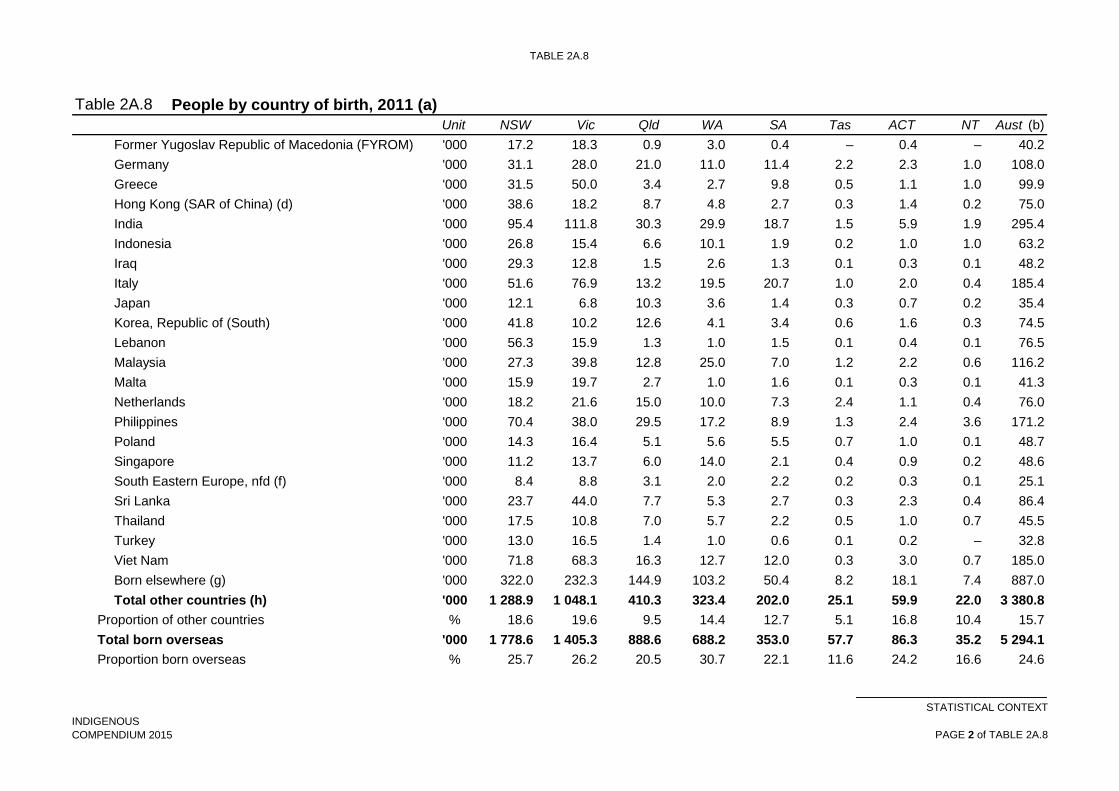
TABLE 2A.8
Table 2A.8
Unit NSW Vic Qld WA SA Tas ACT NT Aust (b)
People by country of birth, 2011 (a)
Former Yugoslav Republic of Macedonia (FYROM) '000 17.2 18.3 0.9 3.0 0.4 – 0.4 – 40.2
Germany '000 31.1 28.0 21.0 11.0 11.4 2.2 2.3 1.0 108.0
Greece '000 31.5 50.0 3.4 2.7 9.8 0.5 1.1 1.0 99.9
Hong Kong (SAR of China) (d) '000 38.6 18.2 8.7 4.8 2.7 0.3 1.4 0.2 75.0
India '000 95.4 111.8 30.3 29.9 18.7 1.5 5.9 1.9 295.4
Indonesia '000 26.8 15.4 6.6 10.1 1.9 0.2 1.0 1.0 63.2
Iraq '000 29.3 12.8 1.5 2.6 1.3 0.1 0.3 0.1 48.2
Italy '000 51.6 76.9 13.2 19.5 20.7 1.0 2.0 0.4 185.4
Japan '000 12.1 6.8 10.3 3.6 1.4 0.3 0.7 0.2 35.4
Korea, Republic of (South) '000 41.8 10.2 12.6 4.1 3.4 0.6 1.6 0.3 74.5
Lebanon '000 56.3 15.9 1.3 1.0 1.5 0.1 0.4 0.1 76.5
Malaysia '000 27.3 39.8 12.8 25.0 7.0 1.2 2.2 0.6 116.2
Malta '000 15.9 19.7 2.7 1.0 1.6 0.1 0.3 0.1 41.3
Netherlands '000 18.2 21.6 15.0 10.0 7.3 2.4 1.1 0.4 76.0
Philippines '000 70.4 38.0 29.5 17.2 8.9 1.3 2.4 3.6 171.2
Poland '000 14.3 16.4 5.1 5.6 5.5 0.7 1.0 0.1 48.7
Singapore '000 11.2 13.7 6.0 14.0 2.1 0.4 0.9 0.2 48.6
South Eastern Europe, nfd (f) '000 8.4 8.8 3.1 2.0 2.2 0.2 0.3 0.1 25.1
Sri Lanka '000 23.7 44.0 7.7 5.3 2.7 0.3 2.3 0.4 86.4
Thailand '000 17.5 10.8 7.0 5.7 2.2 0.5 1.0 0.7 45.5
Turkey '000 13.0 16.5 1.4 1.0 0.6 0.1 0.2 – 32.8
Viet Nam '000 71.8 68.3 16.3 12.7 12.0 0.3 3.0 0.7 185.0
Born elsewhere (g) '000 322.0 232.3 144.9 103.2 50.4 8.2 18.1 7.4 887.0
Total other countries (h) '000 1 288.9 1 048.1 410.3 323.4 202.0 25.1 59.9 22.0 3 380.8
Proportion of other countries % 18.6 19.6 9.5 14.4 12.7 5.1 16.8 10.4 15.7
Total born overseas '000 1 778.6 1 405.3 888.6 688.2 353.0 57.7 86.3 35.2 5 294.1
Proportion born overseas % 25.7 26.2 20.5 30.7 22.1 11.6 24.2 16.6 24.6
INDIGENOUS
COMPENDIUM 2015
STATISTICAL CONTEXT
PAGE 2 of TABLE 2A.8

TABLE 2A.8
Table 2A.8
Unit NSW Vic Qld WA SA Tas ACT NT Aust (b)
People by country of birth, 2011 (a)
Not stated '000 391.7 277.8 252.0 143.1 72.8 23.4 15.8 18.7 1 195.7
Total '000 6 917.7 5 354.0 4 332.7 2 239.2 1 596.6 495.4 357.2 211.9 21 507.7
nfd Not further defined; SAR Special Administrative Region.
(a)
(b)
(c)
(d)
(f)
(g)
(h)
Source :
Includes people who stated their birthplace as Yugoslavia.
Includes countries not identified individually, inadequately described, at sea and not elsewhere classified (nec).
Includes countries not identified individually, 'Australian External Territories', 'Inadequately described' and 'At sea'.
ABS (2012) 2011 Census of Population and Housing, Australia, States and Territories, Basic Community Profile, Table B09 — Country of birth of person by
sex , Cat. no. 2001.0, Canberra.
– Nil or rounded to zero.
Data for people by country of birth 2001, 2006 and 2011 are not comparable as they are sourced from different Census Collections.
Includes Other Territories.
United Kingdom comprises 'United Kingdom, Channel Islands, the Isle of Man, nfd', 'England', 'Isle of Man', 'Northern Ireland', 'Scotland', 'Wales', 'Guernsey' and
'Jersey'.
SARs comprise 'Hong Kong (SAR of China)' and 'Macau (SAR of China)'.
INDIGENOUS
COMPENDIUM 2015
STATISTICAL CONTEXT
PAGE 3 of TABLE 2A.8

TABLE 2A.9
Table 2A.9
NSW Vic Qld WA SA Tas ACT NT Aust
Speaks English only 4 777.5 3 474.1 3 173.4 1 539.1 1 233.1 421.0 254.8 139.7 15 014.0
Speaks other language
Arabic (including Lebanese) 145.6 47.2 4.8 5.5 4.5 0.4 1.3 0.1 209.4
Aboriginal and Torres Strait Islander languages 0.9 0.3 5.9 8.7 3.8 – 0.1 31.3 51.0
Chinese languages 201.7 113.1 35.9 29.8 11.9 1.3 4.9 2.0 401.4
Croatian 26.0 25.6 4.4 6.7 4.0 0.3 2.8 0.1 69.9
French 14.4 11.1 6.5 4.4 1.6 0.4 1.0 0.3 39.6
German 22.2 20.3 14.4 7.1 8.7 1.4 1.8 0.8 76.4
Greek 90.2 122.4 11.5 5.4 27.4 1.3 2.8 2.8 263.7
Hindi 28.2 10.7 5.6 1.1 1.0 0.2 0.9 0.1 47.8
Hungarian 8.7 8.9 3.1 1.2 1.9 0.1 0.4 0.1 24.5
Indonesian 18.1 9.1 2.6 6.7 0.9 0.1 0.5 0.7 38.7
Italian 96.8 149.2 24.7 36.5 40.2 1.5 3.7 1.0 353.6
Japanese 11.1 5.2 7.6 2.6 1.0 0.2 0.5 0.1 28.3
Khmer 8.2 8.5 1.1 0.9 2.8 – 0.2 0.1 22.0
Korean 30.1 3.2 3.8 1.2 0.5 0.2 0.6 – 39.5
Macedonian 30.7 32.6 1.1 6.2 0.8 – 0.5 – 72.0
Maltese 16.3 21.5 1.8 0.4 1.2 – 0.2 – 41.4
Netherlandic 9.7 10.6 8.4 5.6 3.6 1.2 0.7 0.3 40.2
Persian 12.3 5.9 1.6 2.9 2.0 0.1 0.4 – 25.2
Polish 17.0 19.6 5.4 6.9 7.8 0.9 1.3 0.1 59.1
Portuguese 13.1 3.9 1.5 3.6 0.7 – 0.4 0.5 23.7
Russian 13.8 13.9 2.9 1.0 2.4 0.2 0.5 – 34.8
Samoan 11.0 4.1 7.2 0.2 0.1 – 0.2 – 22.7
Serbian 20.5 16.0 3.4 3.8 4.0 0.1 1.2 0.1 49.2
Sinhalese 5.4 11.6 1.5 1.1 0.4 0.1 0.6 0.1 20.7
South Slavic nfd 4.7 4.6 2.0 1.9 1.2 0.1 0.2 – 14.6
People by language spoken at home, 2001 ('000) (a), (b)
INDIGENOUS
COMPENDIUM 2015
STATISTICAL CONTEXT
PAGE 1 of TABLE 2A.9

TABLE 2A.9
Table 2A.9
NSW Vic Qld WA SA Tas ACT NT Aust
People by language spoken at home, 2001 ('000) (a), (b)
Spanish 49.3 22.9 9.5 5.3 3.2 0.6 2.5 0.3 93.6
Tagalog (Filipino) 42.8 18.0 9.3 3.1 3.1 0.4 1.0 1.2 78.9
Tamil 12.1 8.0 1.1 1.4 0.5 0.1 0.8 0.1 24.1
Turkish 19.1 28.4 1.3 1.0 0.6 – 0.2 – 50.7
Vietnamese 67.9 63.8 14.4 12.1 12.6 0.1 2.7 0.7 174.2
Other (c) 148.6 100.6 49.4 32.5 18.4 2.6 7.4 3.0 363.1
Total 1 196.2 920.8 253.7 206.8 172.5 14.1 42.2 46.3 2 853.9
Not stated 337.5 217.2 158.6 86.1 53.3 19.7 12.2 16.8 901.4
Total 6 311.2 4 612.1 3 585.6 1 832.0 1 458.9 454.8 309.2 202.7 18 769.2
nfd Not further defined.
(a)
(b)
(c)
Source : ABS (unpublished) Census of Population and Housing, Australia , Cat. no. 2002.0.
Excludes overseas visitors.
Includes inadequately described and non-verbal so described.
Data for people by language spoken at home 2001, 2006 and 2011 are not comparable as they are sourced from different Census Collections.
– Nil or rounded to zero.
INDIGENOUS
COMPENDIUM 2015
STATISTICAL CONTEXT
PAGE 2 of TABLE 2A.9
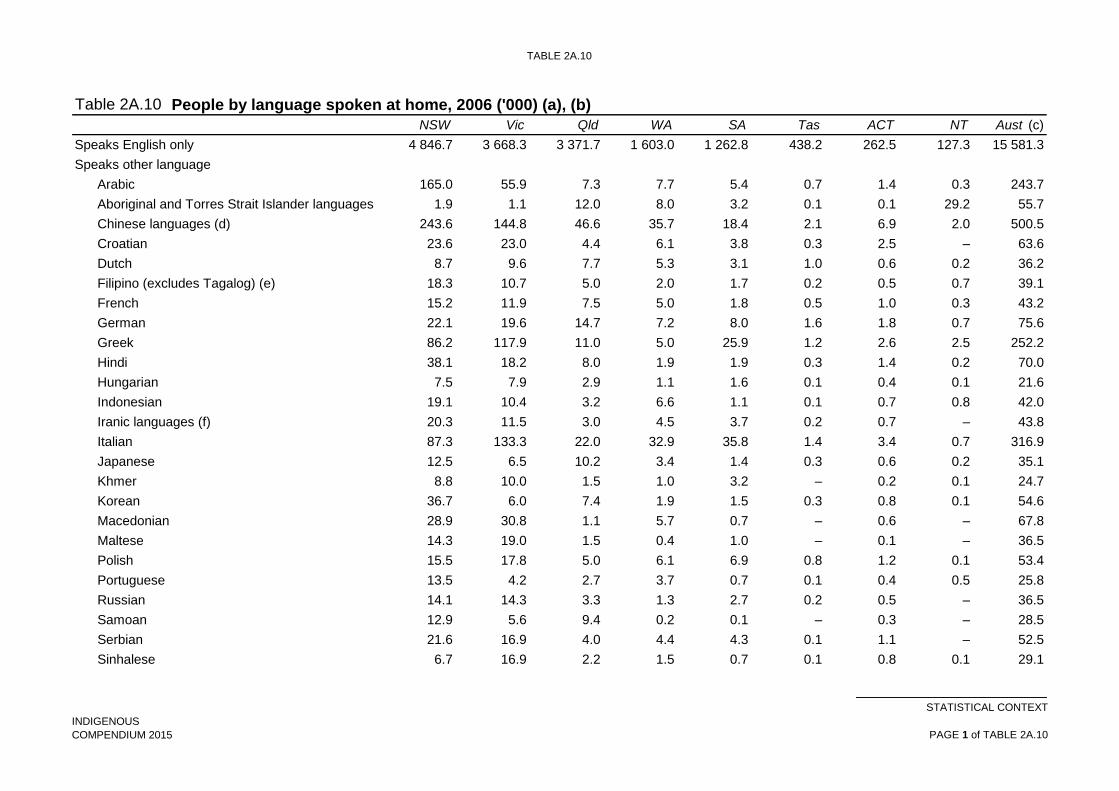
TABLE 2A.10
Table 2A.10
NSW Vic Qld WA SA Tas ACT NT Aust (c)
Speaks English only 4 846.7 3 668.3 3 371.7 1 603.0 1 262.8 438.2 262.5 127.3 15 581.3
Speaks other language
Arabic 165.0 55.9 7.3 7.7 5.4 0.7 1.4 0.3 243.7
Aboriginal and Torres Strait Islander languages 1.9 1.1 12.0 8.0 3.2 0.1 0.1 29.2 55.7
Chinese languages (d) 243.6 144.8 46.6 35.7 18.4 2.1 6.9 2.0 500.5
Croatian 23.6 23.0 4.4 6.1 3.8 0.3 2.5 – 63.6
Dutch 8.7 9.6 7.7 5.3 3.1 1.0 0.6 0.2 36.2
Filipino (excludes Tagalog) (e) 18.3 10.7 5.0 2.0 1.7 0.2 0.5 0.7 39.1
French 15.2 11.9 7.5 5.0 1.8 0.5 1.0 0.3 43.2
German 22.1 19.6 14.7 7.2 8.0 1.6 1.8 0.7 75.6
Greek 86.2 117.9 11.0 5.0 25.9 1.2 2.6 2.5 252.2
Hindi 38.1 18.2 8.0 1.9 1.9 0.3 1.4 0.2 70.0
Hungarian 7.5 7.9 2.9 1.1 1.6 0.1 0.4 0.1 21.6
Indonesian 19.1 10.4 3.2 6.6 1.1 0.1 0.7 0.8 42.0
Iranic languages (f) 20.3 11.5 3.0 4.5 3.7 0.2 0.7 – 43.8
Italian 87.3 133.3 22.0 32.9 35.8 1.4 3.4 0.7 316.9
Japanese 12.5 6.5 10.2 3.4 1.4 0.3 0.6 0.2 35.1
Khmer 8.8 10.0 1.5 1.0 3.2 – 0.2 0.1 24.7
Korean 36.7 6.0 7.4 1.9 1.5 0.3 0.8 0.1 54.6
Macedonian 28.9 30.8 1.1 5.7 0.7 – 0.6 – 67.8
Maltese 14.3 19.0 1.5 0.4 1.0 – 0.1 – 36.5
Polish 15.5 17.8 5.0 6.1 6.9 0.8 1.2 0.1 53.4
Portuguese 13.5 4.2 2.7 3.7 0.7 0.1 0.4 0.5 25.8
Russian 14.1 14.3 3.3 1.3 2.7 0.2 0.5 – 36.5
Samoan 12.9 5.6 9.4 0.2 0.1 – 0.3 – 28.5
Serbian 21.6 16.9 4.0 4.4 4.3 0.1 1.1 – 52.5
Sinhalese 6.7 16.9 2.2 1.5 0.7 0.1 0.8 0.1 29.1
People by language spoken at home, 2006 ('000) (a), (b)
INDIGENOUS
COMPENDIUM 2015
STATISTICAL CONTEXT
PAGE 1 of TABLE 2A.10
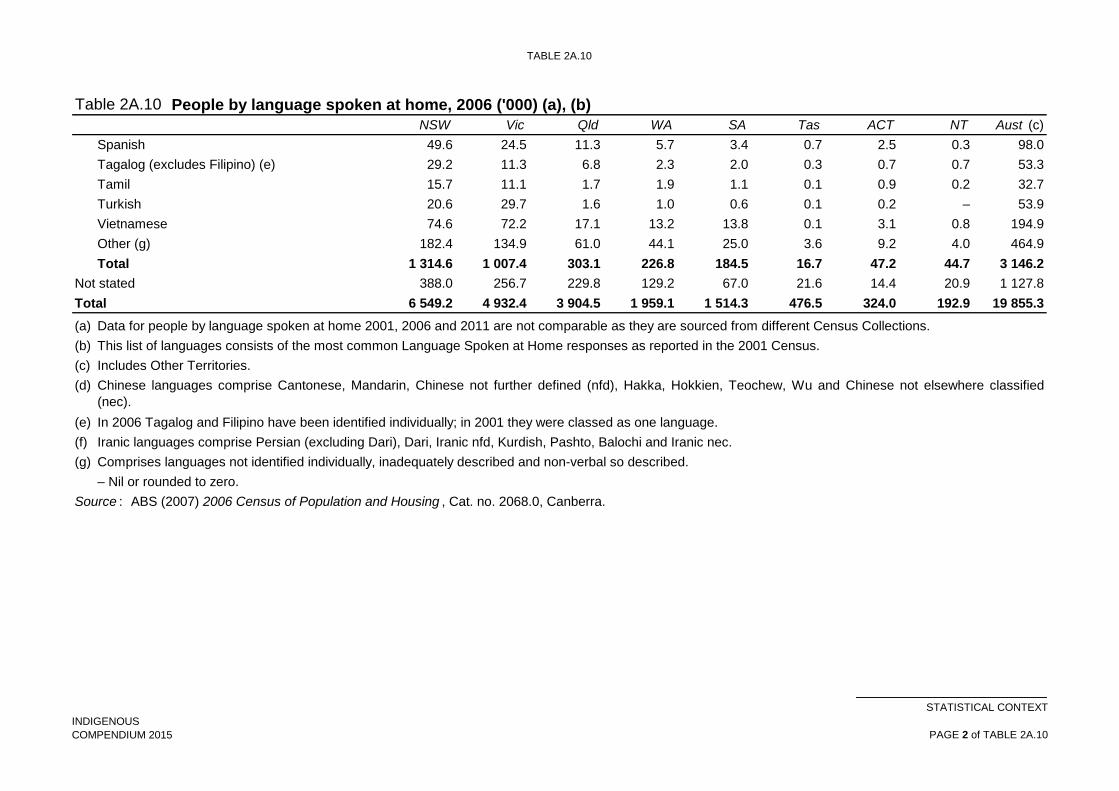
TABLE 2A.10
Table 2A.10
NSW Vic Qld WA SA Tas ACT NT Aust (c)
People by language spoken at home, 2006 ('000) (a), (b)
Spanish 49.6 24.5 11.3 5.7 3.4 0.7 2.5 0.3 98.0
Tagalog (excludes Filipino) (e) 29.2 11.3 6.8 2.3 2.0 0.3 0.7 0.7 53.3
Tamil 15.7 11.1 1.7 1.9 1.1 0.1 0.9 0.2 32.7
Turkish 20.6 29.7 1.6 1.0 0.6 0.1 0.2 – 53.9
Vietnamese 74.6 72.2 17.1 13.2 13.8 0.1 3.1 0.8 194.9
Other (g) 182.4 134.9 61.0 44.1 25.0 3.6 9.2 4.0 464.9
Total 1 314.6 1 007.4 303.1 226.8 184.5 16.7 47.2 44.7 3 146.2
Not stated 388.0 256.7 229.8 129.2 67.0 21.6 14.4 20.9 1 127.8
Total 6 549.2 4 932.4 3 904.5 1 959.1 1 514.3 476.5 324.0 192.9 19 855.3
(a)
(b)
(c)
(d)
(e)
(f)
(g)
Source :
Data for people by language spoken at home 2001, 2006 and 2011 are not comparable as they are sourced from different Census Collections.
ABS (2007) 2006 Census of Population and Housing , Cat. no. 2068.0, Canberra.
This list of languages consists of the most common Language Spoken at Home responses as reported in the 2001 Census.
Comprises languages not identified individually, inadequately described and non-verbal so described.
Chinese languages comprise Cantonese, Mandarin, Chinese not further defined (nfd), Hakka, Hokkien, Teochew, Wu and Chinese not elsewhere classified
(nec).
In 2006 Tagalog and Filipino have been identified individually; in 2001 they were classed as one language.
Iranic languages comprise Persian (excluding Dari), Dari, Iranic nfd, Kurdish, Pashto, Balochi and Iranic nec.
Includes Other Territories.
– Nil or rounded to zero.
INDIGENOUS
COMPENDIUM 2015
STATISTICAL CONTEXT
PAGE 2 of TABLE 2A.10

TABLE 2A.11
Table 2A.11
NSW Vic Qld WA SA Tas ACT NT Aust
Speaks English only 5 013.3 3 874.9 3 676.0 1 775.9 1 303.1 454.1 278.0 133.0 16 509.3
Speaks other language
Arabic 184.3 68.4 11.4 12.0 7.5 0.9 2.4 0.3 287.2
Assyrian 21.0 9.9 0.2 0.1 – – – – 31.3
Aboriginal and Torres Strait Islander languages 1.3 0.5 12.2 9.6 3.6 0.1 0.1 34.4 61.8
Chinese languages:
Cantonese 136.4 72.9 22.3 18.0 9.0 0.8 3.5 0.7 263.7
Mandarin 139.8 103.7 38.1 28.0 16.5 2.1 6.7 1.2 336.4
Other (c) 19.3 18.5 4.3 4.5 2.6 0.3 0.8 0.8 51.2
Total 295.5 195.1 64.7 50.6 28.1 3.3 11.0 2.7 651.3
Croatian 22.9 22.2 4.4 5.9 3.4 0.3 2.4 0.1 61.6
Dutch 9.3 9.5 7.8 5.6 3.1 1.1 0.6 0.2 37.2
French 19.0 16.3 9.9 7.7 2.1 0.7 1.6 0.4 57.7
German 23.4 20.1 16.4 8.7 7.5 1.7 1.9 0.8 80.4
Greek 86.6 116.8 11.4 5.3 25.3 1.2 2.8 2.9 252.2
Hungarian 7.0 7.4 3.3 1.1 1.5 0.2 0.4 0.1 20.9
Indo-Aryan languages:
Bengali 21.5 6.9 2.2 1.9 1.5 0.1 1.4 0.2 35.6
Hindi 52.8 32.7 13.2 5.0 4.4 0.5 2.3 0.4 111.4
Punjabi 21.5 31.1 7.9 4.8 4.4 0.2 1.0 0.3 71.2
Sinhalese 9.4 28.2 4.3 2.9 1.7 0.2 1.3 0.2 48.2
Urdu 17.7 11.1 2.7 2.4 1.3 0.1 1.3 0.2 36.8
Other (d) 36.4 18.3 9.1 6.9 6.4 0.8 1.2 0.6 79.6
Total 159.4 128.2 39.4 23.9 19.8 1.9 8.5 1.9 382.8
Iranic languages:
Dari 6.7 7.8 1.0 2.1 2.2 – 0.3 – 20.2
Persian (excluding Dari) 17.0 10.8 4.3 5.0 4.1 0.2 0.7 – 42.2
People by language spoken at home, 2011 ('000) (a), (b)
INDIGENOUS
COMPENDIUM 2015
STATISTICAL CONTEXT
PAGE 1 of TABLE 2A.11

TABLE 2A.11
Table 2A.11
NSW Vic Qld WA SA Tas ACT NT Aust
People by language spoken at home, 2011 ('000) (a), (b)
Other (e) 3.8 3.4 0.6 0.8 0.9 – 0.1 – 9.6
Total 27.5 21.9 5.9 8.0 7.2 0.2 1.1 0.1 71.9
Italian 83.2 124.9 21.7 31.4 33.3 1.3 3.3 0.8 299.8
Japanese 14.4 8.5 13.1 4.4 1.8 0.4 0.9 0.2 43.7
Khmer 10.3 11.8 1.9 1.3 3.7 – 0.3 0.2 29.5
Korean 47.4 10.3 12.7 3.9 3.1 0.5 1.5 0.3 79.8
Macedonian 29.5 30.9 1.2 5.9 0.7 – 0.6 – 68.8
Maltese 13.3 18.2 1.4 0.4 0.9 – 0.2 – 34.4
Polish 14.9 16.5 5.1 6.0 6.2 0.8 1.1 0.1 50.7
Portuguese 16.3 5.1 4.8 5.0 1.1 0.1 0.5 0.5 33.4
Russian 16.5 16.5 4.8 2.1 3.1 0.3 0.7 0.1 44.1
Samoan 14.9 7.6 12.8 0.6 0.1 0.1 0.4 0.1 36.6
Serbian 22.2 17.6 4.6 5.1 4.3 0.1 1.1 – 55.1
Southeast Asian Austronesian languages:
Filipino 21.1 14.5 8.7 5.7 3.0 0.3 0.8 1.3 55.4
Indonesian 24.8 13.9 4.4 9.1 1.5 0.2 1.0 1.0 55.9
Tagalog 37.1 16.5 12.4 8.3 3.8 0.5 1.0 1.8 81.5
Other (f) 4.5 6.1 3.0 6.5 1.5 0.3 0.4 0.5 23.5
Total 87.5 51.1 28.6 29.5 9.8 1.2 3.3 4.5 216.2
Spanish 55.6 29.0 15.6 8.2 4.9 0.8 2.9 0.4 117.5
Tamil 21.5 17.5 3.5 4.1 1.7 0.2 1.4 0.3 50.2
Thai 15.7 7.6 5.5 4.6 1.4 0.4 0.8 0.7 36.7
Turkish 22.3 32.9 1.9 1.5 0.7 0.1 0.2 0.1 59.6
Vietnamese 87.5 86.6 21.9 16.5 16.0 0.3 3.8 0.9 233.4
Other (g) 124.3 126.6 75.6 56.0 27.7 4.2 8.8 3.9 427.1
Total 1 554.3 1 235.4 423.8 325.1 229.6 22.1 64.7 56.7 3 912.9
Language spoken at home not stated 350.0 243.7 232.9 138.2 64.0 19.1 14.5 22.2 1 085.5
INDIGENOUS
COMPENDIUM 2015
STATISTICAL CONTEXT
PAGE 2 of TABLE 2A.11

TABLE 2A.11
Table 2A.11
NSW Vic Qld WA SA Tas ACT NT Aust
People by language spoken at home, 2011 ('000) (a), (b)
Total 6 917.7 5 354.0 4 332.7 2 239.2 1 596.6 495.4 357.2 211.9 21 507.7
(a)
(b)
(c)
(d)
(e)
(f)
(g)
Source :
Comprises 'Bikol', 'Bisaya', 'Cebuano', 'Ilokano', 'Ilonggo (Hiligaynon)', 'Pampangan', 'Malay', 'Tetum', 'Timorese', 'Acehnese', 'Balinese', 'Iban', 'Javanese',
'Southeast Asian Austronesian Languages, nec' and 'Southeast Asian Austronesian Languages, nfd'.
Comprises languages not identified individually, 'Inadequately described' and 'Non-verbal, so described'.
ABS (2012) 2011 Census of Population and Housing, Australia, States and Territories, Expanded Community Profile, Table X05 — Language spoken at
home by proficiency in spoken English/language by sex , Cat. no. 2005.0, Canberra.
Data for people by language spoken at home 2001, 2006 and 2011 are not comparable as they are sourced from different Census Collections.
This list of languages consists of the most common Language Spoken at Home responses reported in the 2006 Census.
Comprises 'Chinese, nfd', 'Hakka', 'Wu', 'Min Nan' and 'Chinese, nec'.
Comprises' Indo-Aryan, nfd', 'Gujarati', 'Konkani', 'Marathi', 'Nepali', 'Sindhi', 'Assamese', 'Dhivehi', 'Kashmiri', 'Oriya', 'Fijian Hindustani' and 'Indo-Aryan, nec'.
Comprises 'Iranic, nfd', 'Kurdish', 'Pashto', 'Balochi', 'Hazaraghi' and 'Iranic, nec'.
– Nil or rounded to zero.
INDIGENOUS
COMPENDIUM 2015
STATISTICAL CONTEXT
PAGE 3 of TABLE 2A.11

TABLE 2A.13
Table 2A.13
Unit NSW Vic Qld WA SA Tas ACT NT Aust (c)
30 June 2002
Females
0–4 years '000 12.2 2.7 10.8 5.2 2.0 1.3 0.4 3.7 38.4
5–9 years '000 12.2 2.5 10.0 4.7 1.8 1.3 0.3 3.4 36.4
10–14 years '000 9.7 2.3 8.4 4.1 1.7 1.2 0.3 3.5 31.2
15–19 years '000 8.2 1.5 6.9 3.8 1.5 1.0 0.2 3.4 26.5
20–24 years '000 6.4 1.4 6.0 2.9 1.1 0.7 0.2 2.9 21.6
25–29 years '000 6.4 1.4 5.9 2.9 1.1 0.6 0.2 2.6 21.0
30–34 years '000 7.0 1.6 6.1 3.2 1.2 0.8 0.1 2.5 22.5
35–39 years '000 6.3 1.2 4.9 2.6 1.1 0.7 0.1 2.0 19.0
40–44 years '000 5.2 1.0 4.4 2.1 1.0 0.6 0.1 1.8 16.4
45–49 years '000 4.1 0.9 3.3 1.7 0.7 0.5 0.1 1.3 12.6
50–54 years '000 3.1 0.7 2.5 1.3 0.5 0.3 – 1.0 9.5
55–59 years '000 2.2 0.5 1.7 0.8 0.4 0.2 – 0.7 6.5
60–64 years '000 1.6 0.3 1.1 0.6 0.3 0.2 – 0.5 4.6
65–69 years '000 1.1 0.3 0.8 0.4 0.3 0.2 – 0.4 3.4
70–74 years '000 0.9 0.2 0.6 0.4 0.2 np np 0.3 2.7
75–79 years '000 0.6 0.2 0.4 0.2 0.1 np np 0.2 1.7
80–84 years '000 0.2 0.1 0.2 0.1 – np np 0.1 0.7
85 or over '000 0.1 – 0.1 – – np np – 0.3
Total females '000 87.6 18.7 74.1 37.0 15.0 9.8 2.1 30.4 274.9
Proportion of the population % 50.3 50.8 50.0 50.2 50.2 49.7 47.9 49.9 50.2
Males
0–4 years '000 13.0 2.6 11.3 5.2 2.1 1.5 0.3 3.9 40.0
5–9 years '000 12.8 2.6 10.7 5.0 2.0 1.4 0.5 3.7 38.7
10–14 years '000 10.5 2.2 8.6 4.6 1.8 1.1 0.3 3.7 32.8
15–19 years '000 8.1 1.5 7.1 3.6 1.6 1.0 0.2 3.4 26.6
Aboriginal and Torres Strait Islander population estimates, by age and sex, 30 June (a), (b)
INDIGENOUS
COMPENDIUM 2015
STATISTICAL CONTEXT
PAGE 1 of TABLE 2A.13
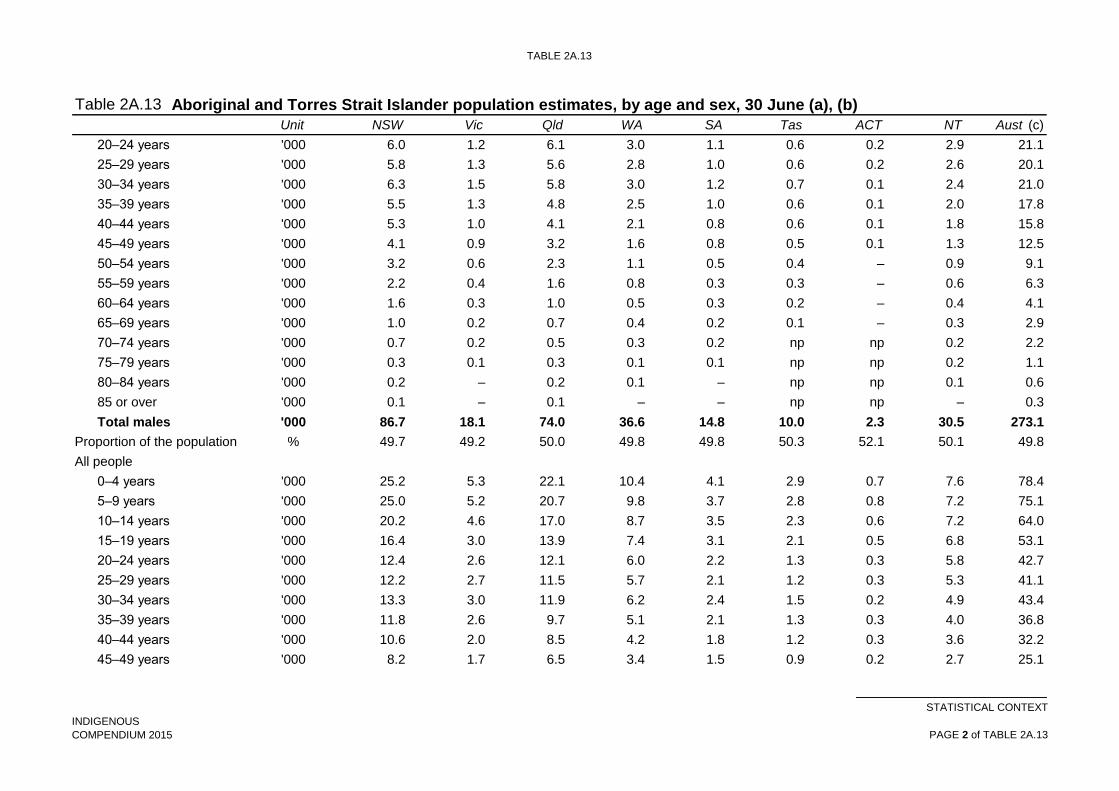
TABLE 2A.13
Table 2A.13
Unit NSW Vic Qld WA SA Tas ACT NT Aust (c)
Aboriginal and Torres Strait Islander population estimates, by age and sex, 30 June (a), (b)
20–24 years '000 6.0 1.2 6.1 3.0 1.1 0.6 0.2 2.9 21.1
25–29 years '000 5.8 1.3 5.6 2.8 1.0 0.6 0.2 2.6 20.1
30–34 years '000 6.3 1.5 5.8 3.0 1.2 0.7 0.1 2.4 21.0
35–39 years '000 5.5 1.3 4.8 2.5 1.0 0.6 0.1 2.0 17.8
40–44 years '000 5.3 1.0 4.1 2.1 0.8 0.6 0.1 1.8 15.8
45–49 years '000 4.1 0.9 3.2 1.6 0.8 0.5 0.1 1.3 12.5
50–54 years '000 3.2 0.6 2.3 1.1 0.5 0.4 – 0.9 9.1
55–59 years '000 2.2 0.4 1.6 0.8 0.3 0.3 – 0.6 6.3
60–64 years '000 1.6 0.3 1.0 0.5 0.3 0.2 – 0.4 4.1
65–69 years '000 1.0 0.2 0.7 0.4 0.2 0.1 – 0.3 2.9
70–74 years '000 0.7 0.2 0.5 0.3 0.2 np np 0.2 2.2
75–79 years '000 0.3 0.1 0.3 0.1 0.1 np np 0.2 1.1
80–84 years '000 0.2 – 0.2 0.1 – np np 0.1 0.6
85 or over '000 0.1 – 0.1 – – np np – 0.3
Total males '000 86.7 18.1 74.0 36.6 14.8 10.0 2.3 30.5 273.1
Proportion of the population % 49.7 49.2 50.0 49.8 49.8 50.3 52.1 50.1 49.8
All people
0–4 years '000 25.2 5.3 22.1 10.4 4.1 2.9 0.7 7.6 78.4
5–9 years '000 25.0 5.2 20.7 9.8 3.7 2.8 0.8 7.2 75.1
10–14 years '000 20.2 4.6 17.0 8.7 3.5 2.3 0.6 7.2 64.0
15–19 years '000 16.4 3.0 13.9 7.4 3.1 2.1 0.5 6.8 53.1
20–24 years '000 12.4 2.6 12.1 6.0 2.2 1.3 0.3 5.8 42.7
25–29 years '000 12.2 2.7 11.5 5.7 2.1 1.2 0.3 5.3 41.1
30–34 years '000 13.3 3.0 11.9 6.2 2.4 1.5 0.2 4.9 43.4
35–39 years '000 11.8 2.6 9.7 5.1 2.1 1.3 0.3 4.0 36.8
40–44 years '000 10.6 2.0 8.5 4.2 1.8 1.2 0.3 3.6 32.2
45–49 years '000 8.2 1.7 6.5 3.4 1.5 0.9 0.2 2.7 25.1
INDIGENOUS
COMPENDIUM 2015
STATISTICAL CONTEXT
PAGE 2 of TABLE 2A.13
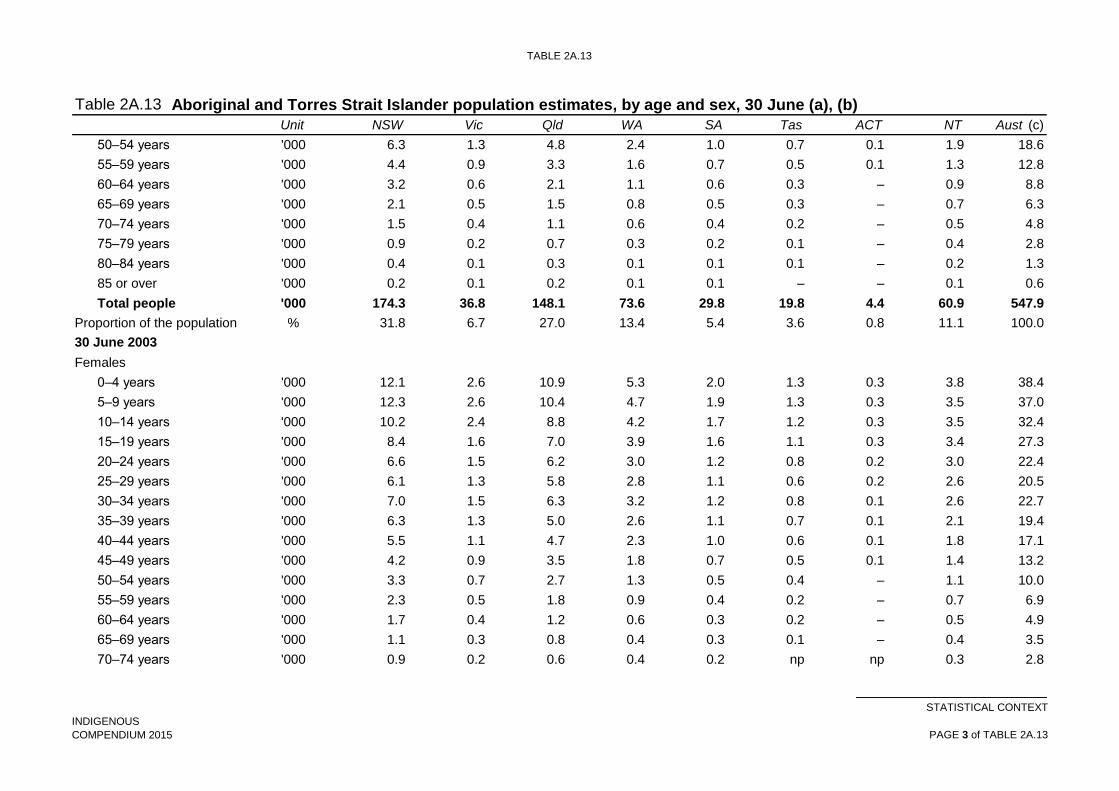
TABLE 2A.13
Table 2A.13
Unit NSW Vic Qld WA SA Tas ACT NT Aust (c)
Aboriginal and Torres Strait Islander population estimates, by age and sex, 30 June (a), (b)
50–54 years '000 6.3 1.3 4.8 2.4 1.0 0.7 0.1 1.9 18.6
55–59 years '000 4.4 0.9 3.3 1.6 0.7 0.5 0.1 1.3 12.8
60–64 years '000 3.2 0.6 2.1 1.1 0.6 0.3 – 0.9 8.8
65–69 years '000 2.1 0.5 1.5 0.8 0.5 0.3 – 0.7 6.3
70–74 years '000 1.5 0.4 1.1 0.6 0.4 0.2 – 0.5 4.8
75–79 years '000 0.9 0.2 0.7 0.3 0.2 0.1 – 0.4 2.8
80–84 years '000 0.4 0.1 0.3 0.1 0.1 0.1 – 0.2 1.3
85 or over '000 0.2 0.1 0.2 0.1 0.1 – – 0.1 0.6
Total people '000 174.3 36.8 148.1 73.6 29.8 19.8 4.4 60.9 547.9
Proportion of the population % 31.8 6.7 27.0 13.4 5.4 3.6 0.8 11.1 100.0
Females
0–4 years '000 12.1 2.6 10.9 5.3 2.0 1.3 0.3 3.8 38.4
5–9 years '000 12.3 2.6 10.4 4.7 1.9 1.3 0.3 3.5 37.0
10–14 years '000 10.2 2.4 8.8 4.2 1.7 1.2 0.3 3.5 32.4
15–19 years '000 8.4 1.6 7.0 3.9 1.6 1.1 0.3 3.4 27.3
20–24 years '000 6.6 1.5 6.2 3.0 1.2 0.8 0.2 3.0 22.4
25–29 years '000 6.1 1.3 5.8 2.8 1.1 0.6 0.2 2.6 20.5
30–34 years '000 7.0 1.5 6.3 3.2 1.2 0.8 0.1 2.6 22.7
35–39 years '000 6.3 1.3 5.0 2.6 1.1 0.7 0.1 2.1 19.4
40–44 years '000 5.5 1.1 4.7 2.3 1.0 0.6 0.1 1.8 17.1
45–49 years '000 4.2 0.9 3.5 1.8 0.7 0.5 0.1 1.4 13.2
50–54 years '000 3.3 0.7 2.7 1.3 0.5 0.4 – 1.1 10.0
55–59 years '000 2.3 0.5 1.8 0.9 0.4 0.2 – 0.7 6.9
60–64 years '000 1.7 0.4 1.2 0.6 0.3 0.2 – 0.5 4.9
65–69 years '000 1.1 0.3 0.8 0.4 0.3 0.1 – 0.4 3.5
70–74 years '000 0.9 0.2 0.6 0.4 0.2 np np 0.3 2.8
30 June 2003
INDIGENOUS
COMPENDIUM 2015
STATISTICAL CONTEXT
PAGE 3 of TABLE 2A.13

TABLE 2A.13
Table 2A.13
Unit NSW Vic Qld WA SA Tas ACT NT Aust (c)
Aboriginal and Torres Strait Islander population estimates, by age and sex, 30 June (a), (b)
75–79 years '000 0.6 0.2 0.4 0.2 0.1 np np 0.2 1.7
80–84 years '000 0.3 0.1 0.2 0.1 0.1 np np 0.1 0.8
85 or over '000 0.1 – 0.1 – – np np – 0.4
Total females '000 89.3 19.2 76.4 37.8 15.4 10.0 2.2 31.0 281.4
Proportion of the population % 50.3 50.7 50.0 50.3 50.2 49.7 48.2 49.9 50.2
Males
0–4 years '000 12.7 2.7 11.4 5.2 2.1 1.5 0.3 4.0 39.9
5–9 years '000 13.1 2.6 10.9 5.1 2.0 1.5 0.4 3.7 39.3
10–14 years '000 11.0 2.4 9.2 4.6 1.9 1.2 0.4 3.7 34.4
15–19 years '000 8.4 1.7 7.2 3.8 1.6 1.1 0.3 3.5 27.5
20–24 years '000 6.3 1.2 6.3 3.2 1.2 0.7 0.2 3.0 22.2
25–29 years '000 5.6 1.3 5.6 2.8 1.0 0.6 0.2 2.7 19.6
30–34 years '000 6.4 1.5 5.8 3.1 1.2 0.7 0.1 2.4 21.3
35–39 years '000 5.6 1.3 5.0 2.5 1.0 0.6 0.1 2.1 18.3
40–44 years '000 5.4 1.1 4.2 2.1 0.8 0.6 0.2 1.8 16.1
45–49 years '000 4.3 0.9 3.5 1.7 0.8 0.5 0.1 1.4 13.2
50–54 years '000 3.3 0.7 2.4 1.2 0.5 0.4 0.1 1.0 9.6
55–59 years '000 2.3 0.4 1.8 0.8 0.3 0.3 – 0.7 6.6
60–64 years '000 1.6 0.3 1.0 0.5 0.3 0.2 – 0.4 4.4
65–69 years '000 1.1 0.2 0.7 0.3 0.2 0.1 – 0.3 3.0
70–74 years '000 0.7 0.2 0.5 0.3 0.2 np np 0.2 2.2
75–79 years '000 0.3 0.1 0.3 0.1 0.1 np np 0.2 1.1
80–84 years '000 0.2 – 0.2 0.1 – np np 0.1 0.6
85 or over '000 0.1 – 0.1 – – np np – 0.3
Total males '000 88.4 18.6 76.2 37.4 15.2 10.2 2.4 31.1 279.6
INDIGENOUS
COMPENDIUM 2015
STATISTICAL CONTEXT
PAGE 4 of TABLE 2A.13

TABLE 2A.13
Table 2A.13
Unit NSW Vic Qld WA SA Tas ACT NT Aust (c)
Aboriginal and Torres Strait Islander population estimates, by age and sex, 30 June (a), (b)
Proportion of the population % 49.7 49.3 50.0 49.7 49.8 50.3 51.8 50.1 49.8
All people
0–4 years '000 24.9 5.3 22.3 10.5 4.1 2.8 0.7 7.8 78.3
5–9 years '000 25.4 5.2 21.3 9.9 3.9 2.8 0.7 7.2 76.4
10–14 years '000 21.2 4.8 18.0 8.8 3.6 2.4 0.7 7.2 66.7
15–19 years '000 16.8 3.3 14.2 7.7 3.2 2.1 0.5 6.9 54.8
20–24 years '000 13.0 2.7 12.5 6.2 2.4 1.5 0.3 5.9 44.6
25–29 years '000 11.7 2.6 11.4 5.6 2.1 1.2 0.4 5.3 40.2
30–34 years '000 13.4 3.1 12.1 6.3 2.4 1.5 0.3 5.0 44.0
35–39 years '000 11.9 2.6 10.0 5.2 2.1 1.4 0.3 4.2 37.6
40–44 years '000 10.9 2.1 8.9 4.4 1.9 1.2 0.3 3.6 33.2
45–49 years '000 8.5 1.7 6.9 3.5 1.5 1.0 0.2 2.9 26.3
50–54 years '000 6.7 1.4 5.1 2.5 1.1 0.8 0.1 2.0 19.7
55–59 years '000 4.6 0.9 3.6 1.7 0.7 0.5 0.1 1.4 13.5
60–64 years '000 3.3 0.7 2.2 1.1 0.6 0.4 – 0.9 9.3
65–69 years '000 2.3 0.5 1.5 0.8 0.4 0.3 – 0.7 6.4
70–74 years '000 1.6 0.4 1.2 0.6 0.4 0.2 – 0.5 5.0
75–79 years '000 0.9 0.2 0.8 0.3 0.2 0.1 – 0.4 2.9
80–84 years '000 0.4 0.1 0.4 0.1 0.1 0.1 – 0.2 1.4
85 or over '000 0.2 0.1 0.2 0.1 0.1 – – 0.1 0.7
Total people '000 177.7 37.8 152.6 75.2 30.6 20.2 4.6 62.0 561.0
Proportion of the population % 31.7 6.7 27.2 13.4 5.5 3.6 0.8 11.1 100.0
30 June 2004
Females
0–4 years '000 11.9 2.5 11.0 5.3 2.0 1.3 0.4 3.9 38.3
5–9 years '000 12.4 2.8 10.6 4.8 2.0 1.3 0.3 3.5 37.7
10–14 years '000 10.8 2.4 9.2 4.3 1.7 1.3 0.3 3.5 33.4
INDIGENOUS
COMPENDIUM 2015
STATISTICAL CONTEXT
PAGE 5 of TABLE 2A.13

TABLE 2A.13
Table 2A.13
Unit NSW Vic Qld WA SA Tas ACT NT Aust (c)
Aboriginal and Torres Strait Islander population estimates, by age and sex, 30 June (a), (b)
15–19 years '000 8.7 1.8 7.3 4.0 1.6 1.1 0.3 3.4 28.2
20–24 years '000 6.9 1.5 6.4 3.1 1.3 0.8 0.2 3.1 23.2
25–29 years '000 6.0 1.4 5.8 2.9 1.1 0.6 0.2 2.7 20.5
30–34 years '000 7.0 1.4 6.3 3.2 1.2 0.7 0.1 2.6 22.6
35–39 years '000 6.4 1.4 5.3 2.7 1.1 0.7 0.1 2.3 20.0
40–44 years '000 5.7 1.1 4.8 2.4 1.0 0.7 0.1 1.8 17.6
45–49 years '000 4.5 0.9 3.7 1.8 0.8 0.5 0.1 1.5 13.9
50–54 years '000 3.4 0.8 2.8 1.4 0.6 0.4 0.1 1.1 10.5
55–59 years '000 2.5 0.5 2.0 1.0 0.4 0.3 – 0.8 7.5
60–64 years '000 1.8 0.4 1.3 0.6 0.3 0.2 – 0.5 5.1
65–69 years '000 1.2 0.3 0.9 0.4 0.3 0.2 – 0.4 3.6
70–74 years '000 0.9 0.2 0.6 0.4 0.2 np np 0.3 2.7
75–79 years '000 0.6 0.2 0.5 0.2 0.1 np np 0.2 1.8
80–84 years '000 0.3 0.1 0.2 0.1 0.1 np np 0.1 0.9
85 or over '000 0.1 – 0.1 0.1 – np np – 0.4
Total females '000 91.0 19.6 78.6 38.7 15.8 10.3 2.3 31.6 287.9
Proportion of the population % 50.2 50.6 50.1 50.3 50.3 49.7 48.5 49.9 50.2
Males
0–4 years '000 12.6 2.7 11.6 5.1 2.1 1.4 0.3 4.1 40.0
5–9 years '000 13.3 2.6 11.0 5.1 2.1 1.5 0.4 3.7 39.7
10–14 years '000 11.4 2.5 9.7 4.8 1.9 1.2 0.4 3.7 35.6
15–19 years '000 8.6 1.9 7.5 4.0 1.7 1.1 0.3 3.5 28.5
20–24 years '000 6.8 1.3 6.6 3.3 1.3 0.8 0.2 3.1 23.3
25–29 years '000 5.5 1.3 5.6 2.8 1.0 0.6 0.2 2.6 19.6
30–34 years '000 6.3 1.5 5.9 3.1 1.2 0.7 0.2 2.5 21.3
35–39 years '000 5.6 1.3 5.1 2.6 1.0 0.7 0.1 2.1 18.5
40–44 years '000 5.4 1.1 4.5 2.1 0.9 0.6 0.2 1.8 16.5
INDIGENOUS
COMPENDIUM 2015
STATISTICAL CONTEXT
PAGE 6 of TABLE 2A.13

TABLE 2A.13
Table 2A.13
Unit NSW Vic Qld WA SA Tas ACT NT Aust (c)
Aboriginal and Torres Strait Islander population estimates, by age and sex, 30 June (a), (b)
45–49 years '000 4.5 0.9 3.6 1.8 0.8 0.6 0.1 1.5 13.8
50–54 years '000 3.5 0.7 2.5 1.3 0.6 0.5 0.1 1.0 10.2
55–59 years '000 2.4 0.5 1.9 0.8 0.3 0.3 – 0.7 7.0
60–64 years '000 1.7 0.3 1.1 0.6 0.3 0.2 – 0.5 4.6
65–69 years '000 1.2 0.2 0.8 0.3 0.2 0.1 – 0.3 3.1
70–74 years '000 0.7 0.2 0.6 0.3 0.2 np np 0.2 2.2
75–79 years '000 0.4 0.1 0.3 0.1 0.1 np np 0.2 1.2
80–84 years '000 0.2 – 0.2 – – np np 0.1 0.6
85 or over '000 0.1 – 0.1 – – np np – 0.4
Total males '000 90.1 19.1 78.4 38.2 15.6 10.4 2.5 31.6 286.1
Proportion of the population % 49.8 49.4 49.9 49.7 49.7 50.3 51.5 50.1 49.8
All people
0–4 years '000 24.5 5.2 22.7 10.4 4.1 2.7 0.7 8.0 78.3
5–9 years '000 25.7 5.4 21.7 9.9 4.0 2.8 0.7 7.2 77.4
10–14 years '000 22.2 4.8 18.8 9.1 3.6 2.5 0.7 7.2 69.0
15–19 years '000 17.3 3.7 14.8 7.9 3.3 2.2 0.6 7.0 56.6
20–24 years '000 13.7 2.7 13.0 6.4 2.6 1.6 0.4 6.1 46.5
25–29 years '000 11.5 2.7 11.4 5.6 2.1 1.2 0.4 5.3 40.1
30–34 years '000 13.3 2.9 12.1 6.2 2.4 1.4 0.3 5.0 43.8
35–39 years '000 11.9 2.7 10.3 5.3 2.1 1.4 0.3 4.4 38.5
40–44 years '000 11.1 2.3 9.2 4.5 1.9 1.3 0.3 3.6 34.2
45–49 years '000 9.0 1.8 7.3 3.6 1.6 1.1 0.2 3.0 27.7
50–54 years '000 6.9 1.5 5.4 2.7 1.1 0.8 0.1 2.1 20.7
55–59 years '000 4.9 1.0 3.9 1.8 0.7 0.6 0.1 1.5 14.5
60–64 years '000 3.5 0.7 2.4 1.2 0.6 0.4 0.1 0.9 9.8
65–69 years '000 2.4 0.5 1.6 0.7 0.4 0.3 – 0.7 6.7
70–74 years '000 1.6 0.4 1.2 0.7 0.4 0.2 – 0.5 4.9
INDIGENOUS
COMPENDIUM 2015
STATISTICAL CONTEXT
PAGE 7 of TABLE 2A.13

TABLE 2A.13
Table 2A.13
Unit NSW Vic Qld WA SA Tas ACT NT Aust (c)
Aboriginal and Torres Strait Islander population estimates, by age and sex, 30 June (a), (b)
75–79 years '000 1.0 0.3 0.8 0.3 0.2 0.1 – 0.4 3.0
80–84 years '000 0.4 0.1 0.4 0.1 0.1 0.1 – 0.2 1.4
85 or over '000 0.2 0.1 0.2 0.1 0.1 – – 0.1 0.8
Total people '000 181.1 38.7 157.0 76.8 31.4 20.7 4.8 63.2 574.0
Proportion of the population % 31.5 6.7 27.4 13.4 5.5 3.6 0.8 11.0 100.0
Females
0–4 years '000 11.9 2.5 11.3 5.2 2.0 1.2 0.3 3.9 38.5
5–9 years '000 12.3 2.8 10.8 4.9 2.1 1.3 0.3 3.5 38.1
10–14 years '000 11.2 2.4 9.5 4.4 1.8 1.3 0.3 3.5 34.3
15–19 years '000 9.0 2.0 7.7 4.0 1.7 1.1 0.3 3.4 29.3
20–24 years '000 7.2 1.5 6.6 3.3 1.4 0.9 0.2 3.1 24.2
25–29 years '000 6.0 1.4 5.8 2.9 1.1 0.6 0.2 2.7 20.7
30–34 years '000 6.8 1.4 6.2 3.1 1.2 0.7 0.1 2.6 22.1
35–39 years '000 6.4 1.4 5.6 2.8 1.1 0.7 0.2 2.4 20.7
40–44 years '000 5.9 1.2 4.8 2.4 1.0 0.7 0.2 1.8 17.9
45–49 years '000 4.7 0.9 3.9 2.0 0.9 0.5 0.1 1.6 14.6
50–54 years '000 3.5 0.8 3.0 1.5 0.6 0.4 0.1 1.1 11.1
55–59 years '000 2.7 0.6 2.1 1.1 0.4 0.3 – 0.8 8.0
60–64 years '000 1.9 0.4 1.4 0.7 0.3 0.2 – 0.5 5.4
65–69 years '000 1.3 0.3 0.9 0.5 0.3 0.1 – 0.4 3.8
70–74 years '000 0.9 0.2 0.6 0.3 0.2 0.1 – 0.3 2.7
75–79 years '000 0.6 0.2 0.5 0.2 0.1 np np 0.2 1.9
80–84 years '000 0.3 0.1 0.2 0.1 0.1 np np 0.1 0.9
85 or over '000 0.1 – 0.1 0.1 – np np 0.1 0.5
Total females '000 92.7 20.1 81.0 39.4 16.2 10.5 2.4 32.2 294.7
Proportion of the population % 50.2 50.6 50.1 50.3 50.4 49.7 48.8 50.0 50.2
30 June 2005
INDIGENOUS
COMPENDIUM 2015
STATISTICAL CONTEXT
PAGE 8 of TABLE 2A.13
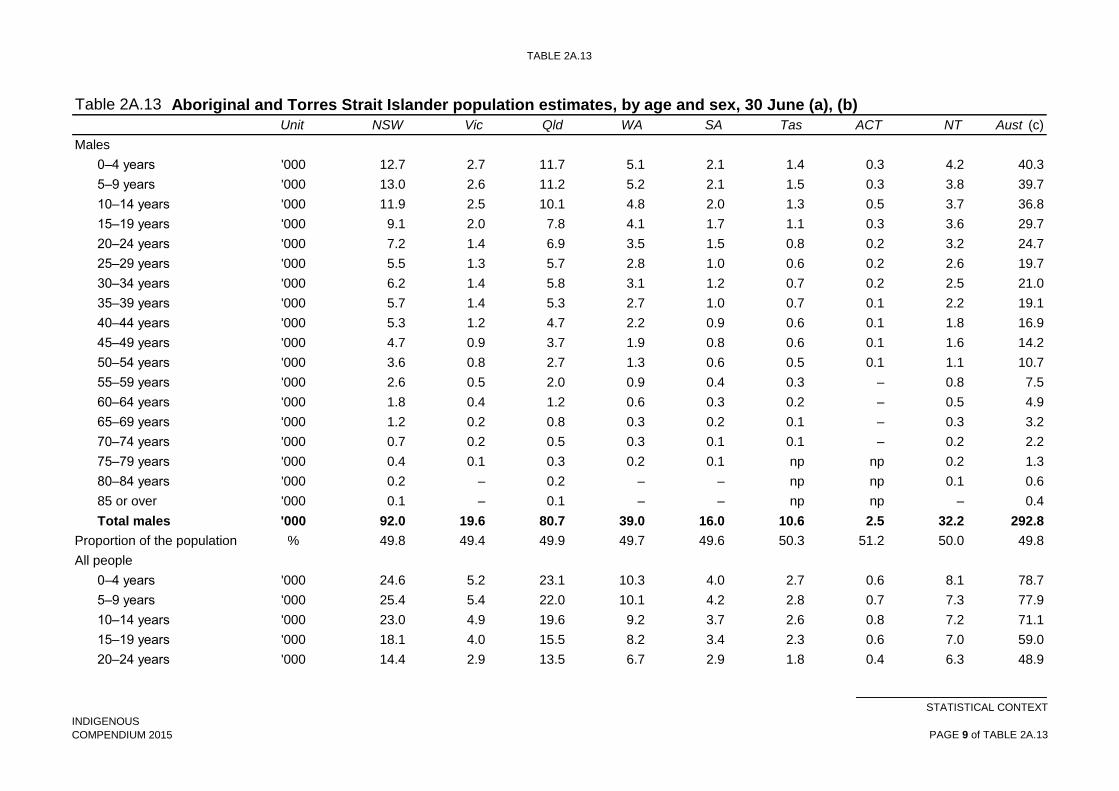
TABLE 2A.13
Table 2A.13
Unit NSW Vic Qld WA SA Tas ACT NT Aust (c)
Aboriginal and Torres Strait Islander population estimates, by age and sex, 30 June (a), (b)
Males
0–4 years '000 12.7 2.7 11.7 5.1 2.1 1.4 0.3 4.2 40.3
5–9 years '000 13.0 2.6 11.2 5.2 2.1 1.5 0.3 3.8 39.7
10–14 years '000 11.9 2.5 10.1 4.8 2.0 1.3 0.5 3.7 36.8
15–19 years '000 9.1 2.0 7.8 4.1 1.7 1.1 0.3 3.6 29.7
20–24 years '000 7.2 1.4 6.9 3.5 1.5 0.8 0.2 3.2 24.7
25–29 years '000 5.5 1.3 5.7 2.8 1.0 0.6 0.2 2.6 19.7
30–34 years '000 6.2 1.4 5.8 3.1 1.2 0.7 0.2 2.5 21.0
35–39 years '000 5.7 1.4 5.3 2.7 1.0 0.7 0.1 2.2 19.1
40–44 years '000 5.3 1.2 4.7 2.2 0.9 0.6 0.1 1.8 16.9
45–49 years '000 4.7 0.9 3.7 1.9 0.8 0.6 0.1 1.6 14.2
50–54 years '000 3.6 0.8 2.7 1.3 0.6 0.5 0.1 1.1 10.7
55–59 years '000 2.6 0.5 2.0 0.9 0.4 0.3 – 0.8 7.5
60–64 years '000 1.8 0.4 1.2 0.6 0.3 0.2 – 0.5 4.9
65–69 years '000 1.2 0.2 0.8 0.3 0.2 0.1 – 0.3 3.2
70–74 years '000 0.7 0.2 0.5 0.3 0.1 0.1 – 0.2 2.2
75–79 years '000 0.4 0.1 0.3 0.2 0.1 np np 0.2 1.3
80–84 years '000 0.2 – 0.2 – – np np 0.1 0.6
85 or over '000 0.1 – 0.1 – – np np – 0.4
Total males '000 92.0 19.6 80.7 39.0 16.0 10.6 2.5 32.2 292.8
Proportion of the population % 49.8 49.4 49.9 49.7 49.6 50.3 51.2 50.0 49.8
All people
0–4 years '000 24.6 5.2 23.1 10.3 4.0 2.7 0.6 8.1 78.7
5–9 years '000 25.4 5.4 22.0 10.1 4.2 2.8 0.7 7.3 77.9
10–14 years '000 23.0 4.9 19.6 9.2 3.7 2.6 0.8 7.2 71.1
15–19 years '000 18.1 4.0 15.5 8.2 3.4 2.3 0.6 7.0 59.0
20–24 years '000 14.4 2.9 13.5 6.7 2.9 1.8 0.4 6.3 48.9
INDIGENOUS
COMPENDIUM 2015
STATISTICAL CONTEXT
PAGE 9 of TABLE 2A.13

TABLE 2A.13
Table 2A.13
Unit NSW Vic Qld WA SA Tas ACT NT Aust (c)
Aboriginal and Torres Strait Islander population estimates, by age and sex, 30 June (a), (b)
25–29 years '000 11.5 2.6 11.5 5.7 2.1 1.2 0.3 5.3 40.4
30–34 years '000 13.0 2.8 12.0 6.1 2.4 1.4 0.3 5.1 43.1
35–39 years '000 12.1 2.8 10.9 5.5 2.2 1.4 0.3 4.6 39.8
40–44 years '000 11.2 2.4 9.5 4.6 2.0 1.3 0.3 3.6 34.8
45–49 years '000 9.4 1.8 7.6 3.8 1.6 1.1 0.2 3.2 28.8
50–54 years '000 7.2 1.6 5.8 2.8 1.2 0.9 0.2 2.2 21.9
55–59 years '000 5.3 1.1 4.1 1.9 0.8 0.6 0.1 1.6 15.5
60–64 years '000 3.6 0.8 2.5 1.2 0.6 0.4 0.1 1.0 10.3
65–69 years '000 2.5 0.5 1.7 0.8 0.4 0.3 – 0.7 7.0
70–74 years '000 1.6 0.4 1.2 0.6 0.3 0.2 – 0.5 4.9
75–79 years '000 1.0 0.3 0.8 0.4 0.2 0.1 – 0.4 3.2
80–84 years '000 0.5 0.1 0.4 0.1 0.1 0.1 – 0.2 1.5
85 or over '000 0.2 0.1 0.2 0.1 0.1 – – 0.1 0.8
Total people '000 184.7 39.7 161.7 78.4 32.3 21.1 4.9 64.4 587.5
Proportion of the population % 31.4 6.8 27.5 13.3 5.5 3.6 0.8 11.0 100.0
30 June 2006
Females
0–4 years '000 12.1 2.6 11.4 5.3 2.0 1.2 0.3 4.0 39.0
5–9 years '000 12.1 2.8 11.0 5.0 2.1 1.4 0.4 3.6 38.4
10–14 years '000 11.6 2.4 9.8 4.5 1.8 1.3 0.3 3.5 35.2
15–19 years '000 9.2 2.2 8.0 4.1 1.7 1.2 0.3 3.4 30.3
20–24 years '000 7.5 1.5 6.9 3.5 1.5 1.0 0.2 3.2 25.3
25–29 years '000 6.0 1.4 5.9 2.9 1.1 0.6 0.2 2.7 21.0
30–34 years '000 6.6 1.4 6.0 3.0 1.2 0.7 0.2 2.6 21.5
35–39 years '000 6.6 1.5 5.9 3.0 1.2 0.8 0.2 2.5 21.6
40–44 years '000 5.9 1.2 4.9 2.5 1.0 0.7 0.2 1.9 18.2
45–49 years '000 4.9 0.9 4.1 2.0 0.9 0.6 0.1 1.7 15.3
INDIGENOUS
COMPENDIUM 2015
STATISTICAL CONTEXT
PAGE 10 of TABLE 2A.13

TABLE 2A.13
Table 2A.13
Unit NSW Vic Qld WA SA Tas ACT NT Aust (c)
Aboriginal and Torres Strait Islander population estimates, by age and sex, 30 June (a), (b)
50–54 years '000 3.8 0.8 3.1 1.6 0.6 0.4 0.1 1.2 11.6
55–59 years '000 2.8 0.6 2.3 1.1 0.5 0.3 – 0.9 8.6
60–64 years '000 2.0 0.4 1.5 0.7 0.3 0.2 – 0.6 5.7
65–69 years '000 1.4 0.3 1.0 0.5 0.3 0.2 – 0.4 4.0
70–74 years '000 0.9 0.2 0.7 0.3 0.2 0.1 – 0.3 2.8
75–79 years '000 0.7 0.2 0.5 0.2 0.2 np np 0.2 2.0
80–84 years '000 0.3 0.1 0.2 0.1 0.1 np np 0.1 1.0
85 or over '000 0.1 0.1 0.1 0.1 – np np 0.1 0.5
Total females '000 94.6 20.6 83.4 40.4 16.7 10.7 2.5 32.8 301.8
Proportion of the population % 50.2 50.6 50.2 50.4 50.3 49.6 49.2 50.0 50.2
Males
0–4 years '000 13.0 2.7 11.7 5.2 2.1 1.4 0.3 4.2 40.7
5–9 years '000 12.8 2.6 11.4 5.2 2.2 1.5 0.3 3.8 39.8
10–14 years '000 12.2 2.6 10.6 4.9 2.0 1.3 0.5 3.7 37.8
15–19 years '000 9.7 2.1 8.3 4.3 1.8 1.1 0.3 3.6 31.2
20–24 years '000 7.5 1.5 7.0 3.5 1.5 0.9 0.3 3.2 25.5
25–29 years '000 5.7 1.3 5.9 2.8 1.0 0.6 0.2 2.7 20.1
30–34 years '000 6.0 1.3 5.7 3.0 1.1 0.6 0.2 2.6 20.5
35–39 years '000 5.9 1.4 5.5 2.8 1.1 0.7 0.1 2.3 19.8
40–44 years '000 5.3 1.2 4.7 2.3 1.0 0.6 0.1 1.8 17.1
45–49 years '000 4.9 0.9 3.9 2.0 0.7 0.6 0.1 1.6 14.7
50–54 years '000 3.7 0.8 2.9 1.4 0.7 0.5 0.1 1.2 11.3
55–59 years '000 2.8 0.6 2.1 1.0 0.4 0.4 0.1 0.8 8.0
60–64 years '000 1.9 0.4 1.3 0.6 0.3 0.2 – 0.5 5.3
65–69 years '000 1.2 0.3 0.8 0.4 0.2 0.1 – 0.3 3.3
70–74 years '000 0.8 0.2 0.5 0.3 0.1 0.1 – 0.2 2.2
75–79 years '000 0.4 0.1 0.3 0.2 0.1 np np 0.2 1.4
INDIGENOUS
COMPENDIUM 2015
STATISTICAL CONTEXT
PAGE 11 of TABLE 2A.13

TABLE 2A.13
Table 2A.13
Unit NSW Vic Qld WA SA Tas ACT NT Aust (c)
Aboriginal and Torres Strait Islander population estimates, by age and sex, 30 June (a), (b)
80–84 years '000 0.2 – 0.2 – – np np 0.1 0.6
85 or over '000 0.1 – 0.1 – – np np – 0.4
Total males '000 94.0 20.1 82.9 39.8 16.5 10.9 2.6 32.8 299.6
Proportion of the population % 49.8 49.4 49.8 49.6 49.7 50.4 50.8 50.0 49.8
All people
0–4 years '000 25.1 5.3 23.1 10.5 4.1 2.7 0.7 8.2 79.6
5–9 years '000 25.0 5.4 22.4 10.2 4.3 2.8 0.7 7.5 78.2
10–14 years '000 23.8 5.0 20.4 9.4 3.8 2.6 0.8 7.2 73.0
15–19 years '000 19.0 4.3 16.3 8.4 3.6 2.3 0.6 7.0 61.5
20–24 years '000 15.0 3.1 13.9 7.0 3.0 1.9 0.4 6.4 50.8
25–29 years '000 11.7 2.6 11.8 5.8 2.1 1.2 0.3 5.4 41.1
30–34 years '000 12.5 2.7 11.7 6.0 2.3 1.3 0.4 5.1 42.0
35–39 years '000 12.5 2.9 11.5 5.7 2.3 1.5 0.3 4.7 41.4
40–44 years '000 11.2 2.4 9.6 4.8 2.0 1.2 0.3 3.7 35.2
45–49 years '000 9.8 1.9 8.0 4.0 1.7 1.1 0.2 3.3 30.1
50–54 years '000 7.5 1.6 6.0 3.0 1.3 0.9 0.2 2.3 22.9
55–59 years '000 5.6 1.2 4.3 2.1 0.9 0.7 0.1 1.7 16.5
60–64 years '000 3.8 0.8 2.8 1.3 0.6 0.5 0.1 1.1 11.0
65–69 years '000 2.6 0.6 1.8 0.9 0.4 0.3 – 0.7 7.3
70–74 years '000 1.7 0.4 1.2 0.6 0.3 0.2 – 0.5 5.0
75–79 years '000 1.1 0.3 0.8 0.4 0.2 0.1 – 0.4 3.4
80–84 years '000 0.5 0.1 0.4 0.1 0.1 0.1 – 0.2 1.6
85 or over '000 0.3 0.1 0.2 0.1 0.1 – – 0.1 0.9
Total people '000 188.6 40.7 166.3 80.2 33.2 21.6 5.1 65.6 601.5
Proportion of the population % 31.4 6.8 27.7 13.3 5.5 3.6 0.8 10.9 100.0
INDIGENOUS
COMPENDIUM 2015
STATISTICAL CONTEXT
PAGE 12 of TABLE 2A.13

TABLE 2A.13
Table 2A.13
Unit NSW Vic Qld WA SA Tas ACT NT Aust (c)
Aboriginal and Torres Strait Islander population estimates, by age and sex, 30 June (a), (b)
Females
0–4 years '000 12.4 2.7 11.6 5.3 2.0 1.3 0.3 4.0 39.5
5–9 years '000 12.0 2.7 11.0 5.1 2.1 1.3 0.3 3.7 38.3
10–14 years '000 12.0 2.5 10.2 4.7 1.9 1.4 0.3 3.4 36.4
15–19 years '000 9.6 2.3 8.5 4.0 1.8 1.2 0.3 3.4 31.1
20–24 years '000 7.8 1.6 7.1 3.7 1.6 1.0 0.3 3.2 26.4
25–29 years '000 6.2 1.4 6.0 3.0 1.2 0.7 0.2 2.8 21.5
30–34 years '000 6.2 1.3 5.9 2.9 1.1 0.6 0.2 2.6 20.9
35–39 years '000 6.8 1.5 6.2 3.0 1.2 0.8 0.2 2.5 22.2
40–44 years '000 6.1 1.2 4.9 2.5 1.1 0.7 0.1 1.9 18.6
45–49 years '000 5.1 1.0 4.4 2.1 0.9 0.6 0.1 1.7 16.0
50–54 years '000 4.0 0.9 3.2 1.7 0.7 0.5 0.1 1.2 12.2
55–59 years '000 3.0 0.7 2.4 1.2 0.5 0.3 – 0.9 9.0
60–64 years '000 2.1 0.4 1.6 0.8 0.3 0.2 – 0.6 6.1
65–69 years '000 1.4 0.3 1.0 0.5 0.3 0.1 – 0.4 4.2
70–74 years '000 1.0 0.2 0.7 0.3 0.2 0.1 – 0.3 2.9
75–79 years '000 0.7 0.2 0.5 0.3 0.2 np np 0.2 2.0
80–84 years '000 0.4 0.1 0.3 0.1 0.1 np np 0.1 1.1
85 or over '000 0.2 0.1 0.1 0.1 – np np 0.1 0.6
Total females '000 96.7 21.2 85.7 41.3 17.1 11.0 2.6 33.1 308.8
Proportion of the population % 50.2 50.5 50.2 50.4 50.3 49.8 48.8 50.0 50.2
Males
0–4 years '000 13.1 2.7 11.8 5.2 2.2 1.4 0.3 4.2 41.0
5–9 years '000 12.7 2.7 11.5 5.2 2.2 1.5 0.3 3.9 39.9
10–14 years '000 12.6 2.6 11.0 4.9 2.1 1.4 0.4 3.7 38.7
15–19 years '000 10.2 2.3 8.8 4.4 1.9 1.2 0.3 3.6 32.7
30 June 2007
INDIGENOUS
COMPENDIUM 2015
STATISTICAL CONTEXT
PAGE 13 of TABLE 2A.13

TABLE 2A.13
Table 2A.13
Unit NSW Vic Qld WA SA Tas ACT NT Aust (c)
Aboriginal and Torres Strait Islander population estimates, by age and sex, 30 June (a), (b)
20–24 years '000 7.8 1.7 7.1 3.6 1.6 1.0 0.3 3.3 26.4
25–29 years '000 5.8 1.3 6.0 3.1 1.1 0.6 0.2 2.7 20.9
30–34 years '000 5.6 1.3 5.6 2.8 1.1 0.6 0.2 2.5 19.8
35–39 years '000 6.2 1.4 5.7 2.9 1.2 0.7 0.2 2.3 20.5
40–44 years '000 5.2 1.3 4.8 2.4 1.0 0.6 0.1 1.9 17.3
45–49 years '000 5.0 1.0 4.0 2.0 0.8 0.6 0.1 1.6 15.2
50–54 years '000 3.9 0.8 3.1 1.6 0.7 0.5 0.1 1.2 11.8
55–59 years '000 2.9 0.6 2.2 1.0 0.4 0.4 0.1 0.8 8.4
60–64 years '000 2.0 0.4 1.4 0.7 0.3 0.3 – 0.6 5.6
65–69 years '000 1.3 0.3 0.9 0.4 0.2 0.1 – 0.3 3.5
70–74 years '000 0.8 0.2 0.6 0.3 0.1 0.1 – 0.2 2.2
75–79 years '000 0.5 0.1 0.4 0.2 0.1 np np 0.1 1.5
80–84 years '000 0.2 – 0.2 – – np np 0.1 0.6
85 or over '000 0.1 – 0.1 – – np np – 0.4
Total males '000 96.1 20.8 85.0 40.6 16.9 11.1 2.7 33.2 306.5
Proportion of the population % 49.8 49.5 49.8 49.6 49.7 50.2 51.2 50.0 49.8
All people
0–4 years '000 25.5 5.4 23.4 10.6 4.2 2.7 0.7 8.2 80.5
5–9 years '000 24.8 5.4 22.5 10.3 4.2 2.8 0.7 7.5 78.3
10–14 years '000 24.6 5.1 21.2 9.6 3.9 2.8 0.7 7.1 75.1
15–19 years '000 19.8 4.6 17.3 8.4 3.6 2.4 0.6 7.0 63.8
20–24 years '000 15.6 3.3 14.2 7.3 3.2 2.0 0.5 6.5 52.7
25–29 years '000 12.0 2.8 12.0 6.0 2.3 1.3 0.4 5.5 42.4
30–34 years '000 11.8 2.6 11.5 5.7 2.2 1.2 0.4 5.1 40.6
35–39 years '000 12.9 3.0 11.9 5.9 2.4 1.5 0.3 4.8 42.7
40–44 years '000 11.3 2.5 9.8 4.9 2.1 1.3 0.3 3.8 35.9
45–49 years '000 10.1 2.0 8.4 4.1 1.7 1.2 0.3 3.4 31.2
INDIGENOUS
COMPENDIUM 2015
STATISTICAL CONTEXT
PAGE 14 of TABLE 2A.13

TABLE 2A.13
Table 2A.13
Unit NSW Vic Qld WA SA Tas ACT NT Aust (c)
Aboriginal and Torres Strait Islander population estimates, by age and sex, 30 June (a), (b)
50–54 years '000 7.9 1.7 6.3 3.2 1.4 0.9 0.2 2.5 24.0
55–59 years '000 5.9 1.3 4.6 2.2 0.9 0.7 0.1 1.8 17.4
60–64 years '000 4.1 0.8 3.0 1.4 0.6 0.5 0.1 1.2 11.7
65–69 years '000 2.7 0.6 1.9 0.9 0.5 0.3 – 0.7 7.7
70–74 years '000 1.8 0.4 1.3 0.6 0.3 0.2 – 0.5 5.1
75–79 years '000 1.2 0.3 0.8 0.4 0.2 0.2 – 0.4 3.5
80–84 years '000 0.5 0.1 0.4 0.2 0.1 0.1 – 0.2 1.7
85 or over '000 0.3 0.1 0.2 0.1 0.1 – – 0.1 1.0
Total people '000 192.8 42.0 170.7 81.9 33.9 22.1 5.3 66.3 615.3
Proportion of the population % 31.3 6.8 27.7 13.3 5.5 3.6 0.9 10.8 100.0
30 June 2008
Females
0–4 years '000 12.5 2.8 11.8 5.4 2.1 1.4 0.3 3.9 40.1
5–9 years '000 11.9 2.7 11.1 5.2 2.1 1.3 0.3 3.7 38.4
10–14 years '000 12.1 2.6 10.6 4.7 2.0 1.4 0.3 3.4 37.0
15–19 years '000 10.1 2.4 8.9 4.1 1.8 1.2 0.3 3.4 32.3
20–24 years '000 8.0 1.8 7.3 3.8 1.7 1.0 0.3 3.3 27.2
25–29 years '000 6.4 1.5 6.2 3.1 1.2 0.8 0.2 2.9 22.3
30–34 years '000 6.0 1.3 5.8 2.9 1.1 0.6 0.2 2.5 20.4
35–39 years '000 6.9 1.5 6.3 3.1 1.2 0.8 0.2 2.5 22.5
40–44 years '000 6.1 1.3 5.1 2.5 1.1 0.7 0.1 2.1 19.0
45–49 years '000 5.4 1.1 4.6 2.2 1.0 0.6 0.1 1.7 16.7
50–54 years '000 4.1 0.9 3.4 1.7 0.7 0.5 0.1 1.3 12.7
55–59 years '000 3.1 0.7 2.6 1.3 0.5 0.3 0.1 1.0 9.6
60–64 years '000 2.2 0.5 1.7 0.8 0.4 0.2 – 0.7 6.5
65–69 years '000 1.5 0.3 1.1 0.5 0.3 0.2 – 0.4 4.4
70–74 years '000 1.0 0.2 0.7 0.3 0.2 0.1 – 0.3 2.9
INDIGENOUS
COMPENDIUM 2015
STATISTICAL CONTEXT
PAGE 15 of TABLE 2A.13

TABLE 2A.13
Table 2A.13
Unit NSW Vic Qld WA SA Tas ACT NT Aust (c)
Aboriginal and Torres Strait Islander population estimates, by age and sex, 30 June (a), (b)
75–79 years '000 0.7 0.2 0.5 0.3 0.2 np np 0.2 2.1
80–84 years '000 0.4 0.1 0.3 0.1 0.1 np np 0.1 1.1
85 or over '000 0.2 0.1 0.2 0.1 0.1 np np 0.1 0.6
Total females '000 98.7 21.9 88.0 42.2 17.5 11.3 2.7 33.5 315.8
Proportion of the population % 50.2 50.4 50.2 50.4 50.2 49.8 48.5 50.0 50.2
Males
0–4 years '000 13.2 2.8 12.1 5.3 2.2 1.5 0.4 4.2 41.6
5–9 years '000 12.6 2.7 11.5 5.1 2.2 1.4 0.3 3.9 39.8
10–14 years '000 12.9 2.6 11.2 5.0 2.1 1.5 0.4 3.7 39.3
15–19 years '000 10.8 2.5 9.4 4.5 1.9 1.2 0.4 3.6 34.2
20–24 years '000 8.1 1.8 7.3 3.8 1.6 1.0 0.3 3.3 27.2
25–29 years '000 6.2 1.4 6.2 3.2 1.2 0.7 0.2 2.8 21.9
30–34 years '000 5.4 1.3 5.6 2.8 1.0 0.6 0.2 2.5 19.4
35–39 years '000 6.2 1.5 5.8 3.0 1.2 0.7 0.2 2.3 20.8
40–44 years '000 5.3 1.3 5.0 2.4 1.0 0.6 0.1 2.0 17.7
45–49 years '000 5.1 1.1 4.1 2.0 0.8 0.6 0.2 1.7 15.5
50–54 years '000 4.1 0.8 3.3 1.6 0.7 0.5 0.1 1.3 12.4
55–59 years '000 3.1 0.6 2.3 1.1 0.5 0.4 0.1 0.9 8.9
60–64 years '000 2.1 0.4 1.6 0.7 0.3 0.3 – 0.6 5.9
65–69 years '000 1.4 0.3 0.9 0.4 0.2 0.2 – 0.3 3.8
70–74 years '000 0.9 0.2 0.6 0.3 0.1 0.1 – 0.2 2.3
75–79 years '000 0.5 0.1 0.4 0.2 0.1 np np 0.1 1.5
80–84 years '000 0.2 – 0.2 0.1 – np np 0.1 0.6
85 or over '000 0.1 – 0.1 – – np np – 0.4
Total males '000 98.0 21.5 87.3 41.4 17.3 11.4 2.8 33.5 313.4
Proportion of the population % 49.8 49.6 49.8 49.6 49.8 50.2 51.5 50.0 49.8
INDIGENOUS
COMPENDIUM 2015
STATISTICAL CONTEXT
PAGE 16 of TABLE 2A.13

TABLE 2A.13
Table 2A.13
Unit NSW Vic Qld WA SA Tas ACT NT Aust (c)
Aboriginal and Torres Strait Islander population estimates, by age and sex, 30 June (a), (b)
All people
0–4 years '000 25.7 5.5 23.8 10.7 4.3 2.9 0.6 8.1 81.7
5–9 years '000 24.5 5.4 22.6 10.4 4.2 2.7 0.6 7.6 78.2
10–14 years '000 25.0 5.2 21.8 9.7 4.0 2.8 0.7 7.1 76.4
15–19 years '000 20.9 4.9 18.3 8.6 3.7 2.4 0.7 7.0 66.5
20–24 years '000 16.1 3.6 14.5 7.6 3.3 2.0 0.6 6.6 54.4
25–29 years '000 12.6 2.9 12.5 6.3 2.4 1.5 0.4 5.7 44.2
30–34 years '000 11.4 2.6 11.3 5.6 2.1 1.2 0.4 5.0 39.8
35–39 years '000 13.1 3.0 12.1 6.0 2.4 1.5 0.3 4.9 43.3
40–44 years '000 11.5 2.6 10.0 5.0 2.1 1.3 0.3 4.0 36.7
45–49 years '000 10.5 2.1 8.7 4.2 1.8 1.2 0.3 3.4 32.2
50–54 years '000 8.2 1.7 6.7 3.4 1.4 1.0 0.2 2.6 25.2
55–59 years '000 6.2 1.3 4.9 2.3 1.0 0.8 0.1 1.8 18.5
60–64 years '000 4.3 0.9 3.3 1.5 0.6 0.5 0.1 1.2 12.4
65–69 years '000 2.9 0.6 2.0 1.0 0.5 0.3 – 0.8 8.2
70–74 years '000 1.9 0.4 1.3 0.6 0.3 0.2 – 0.5 5.2
75–79 years '000 1.2 0.3 0.9 0.4 0.3 0.2 – 0.4 3.6
80–84 years '000 0.6 0.1 0.5 0.2 0.1 0.1 – 0.2 1.7
85 or over '000 0.3 0.1 0.3 0.1 0.1 0.1 – 0.1 1.1
Total people '000 196.7 43.3 175.3 83.6 34.8 22.7 5.5 67.0 629.2
Proportion of the population % 31.3 6.9 27.9 13.3 5.5 3.6 0.9 10.7 100.0
Females
0–4 years '000 12.8 2.8 12.0 5.4 2.1 1.5 0.3 3.8 40.7
5–9 years '000 11.8 2.6 11.2 5.2 2.1 1.3 0.3 3.8 38.3
10–14 years '000 12.2 2.7 10.8 4.8 2.0 1.4 0.3 3.5 37.7
15–19 years '000 10.6 2.4 9.2 4.2 1.8 1.3 0.3 3.4 33.4
30 June 2009
INDIGENOUS
COMPENDIUM 2015
STATISTICAL CONTEXT
PAGE 17 of TABLE 2A.13
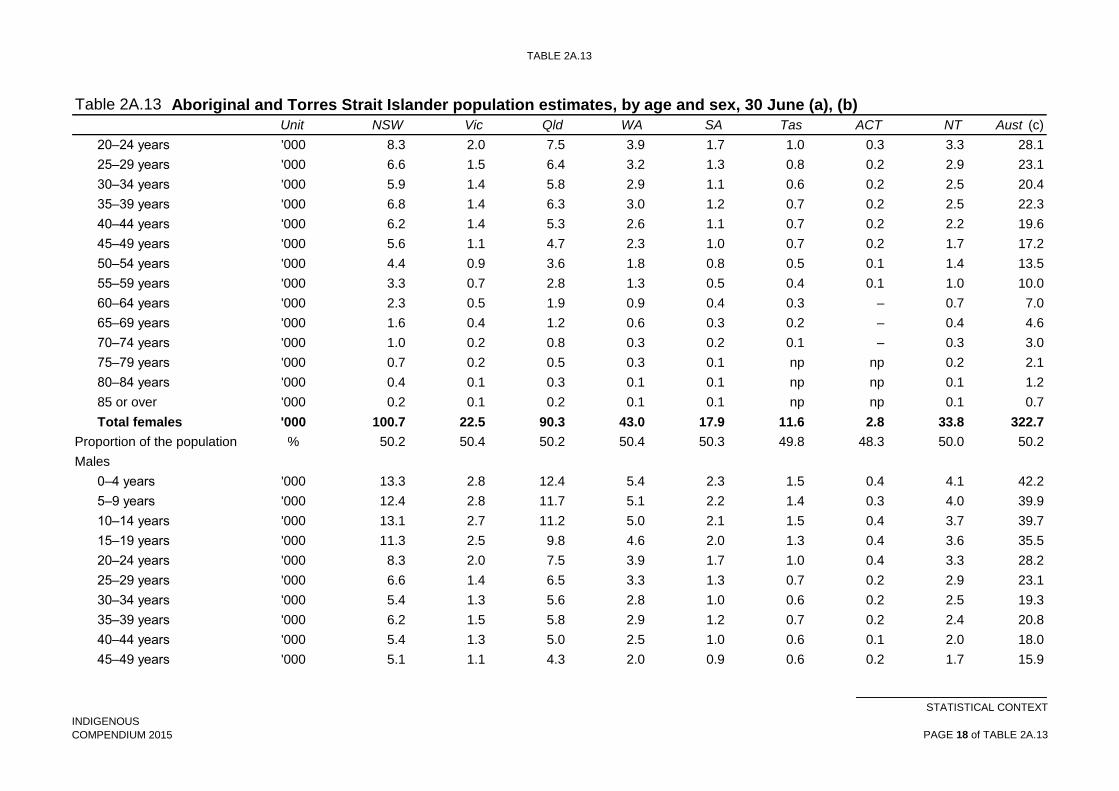
TABLE 2A.13
Table 2A.13
Unit NSW Vic Qld WA SA Tas ACT NT Aust (c)
Aboriginal and Torres Strait Islander population estimates, by age and sex, 30 June (a), (b)
20–24 years '000 8.3 2.0 7.5 3.9 1.7 1.0 0.3 3.3 28.1
25–29 years '000 6.6 1.5 6.4 3.2 1.3 0.8 0.2 2.9 23.1
30–34 years '000 5.9 1.4 5.8 2.9 1.1 0.6 0.2 2.5 20.4
35–39 years '000 6.8 1.4 6.3 3.0 1.2 0.7 0.2 2.5 22.3
40–44 years '000 6.2 1.4 5.3 2.6 1.1 0.7 0.2 2.2 19.6
45–49 years '000 5.6 1.1 4.7 2.3 1.0 0.7 0.2 1.7 17.2
50–54 years '000 4.4 0.9 3.6 1.8 0.8 0.5 0.1 1.4 13.5
55–59 years '000 3.3 0.7 2.8 1.3 0.5 0.4 0.1 1.0 10.0
60–64 years '000 2.3 0.5 1.9 0.9 0.4 0.3 – 0.7 7.0
65–69 years '000 1.6 0.4 1.2 0.6 0.3 0.2 – 0.4 4.6
70–74 years '000 1.0 0.2 0.8 0.3 0.2 0.1 – 0.3 3.0
75–79 years '000 0.7 0.2 0.5 0.3 0.1 np np 0.2 2.1
80–84 years '000 0.4 0.1 0.3 0.1 0.1 np np 0.1 1.2
85 or over '000 0.2 0.1 0.2 0.1 0.1 np np 0.1 0.7
Total females '000 100.7 22.5 90.3 43.0 17.9 11.6 2.8 33.8 322.7
Proportion of the population % 50.2 50.4 50.2 50.4 50.3 49.8 48.3 50.0 50.2
Males
0–4 years '000 13.3 2.8 12.4 5.4 2.3 1.5 0.4 4.1 42.2
5–9 years '000 12.4 2.8 11.7 5.1 2.2 1.4 0.3 4.0 39.9
10–14 years '000 13.1 2.7 11.2 5.0 2.1 1.5 0.4 3.7 39.7
15–19 years '000 11.3 2.5 9.8 4.6 2.0 1.3 0.4 3.6 35.5
20–24 years '000 8.3 2.0 7.5 3.9 1.7 1.0 0.4 3.3 28.2
25–29 years '000 6.6 1.4 6.5 3.3 1.3 0.7 0.2 2.9 23.1
30–34 years '000 5.4 1.3 5.6 2.8 1.0 0.6 0.2 2.5 19.3
35–39 years '000 6.2 1.5 5.8 2.9 1.2 0.7 0.2 2.4 20.8
40–44 years '000 5.4 1.3 5.0 2.5 1.0 0.6 0.1 2.0 18.0
45–49 years '000 5.1 1.1 4.3 2.0 0.9 0.6 0.2 1.7 15.9
INDIGENOUS
COMPENDIUM 2015
STATISTICAL CONTEXT
PAGE 18 of TABLE 2A.13

TABLE 2A.13
Table 2A.13
Unit NSW Vic Qld WA SA Tas ACT NT Aust (c)
Aboriginal and Torres Strait Islander population estimates, by age and sex, 30 June (a), (b)
50–54 years '000 4.3 0.9 3.4 1.7 0.7 0.5 0.1 1.3 13.1
55–59 years '000 3.2 0.7 2.4 1.2 0.5 0.4 0.1 0.9 9.4
60–64 years '000 2.2 0.4 1.7 0.7 0.3 0.3 – 0.6 6.3
65–69 years '000 1.4 0.3 1.0 0.5 0.2 0.2 – 0.4 4.0
70–74 years '000 0.9 0.2 0.6 0.2 0.1 0.1 – 0.2 2.4
75–79 years '000 0.5 0.1 0.4 0.2 0.1 np np 0.1 1.5
80–84 years '000 0.2 0.1 0.2 0.1 – np np 0.1 0.7
85 or over '000 0.1 – 0.1 0.1 – np np – 0.4
Total males '000 100.0 22.1 89.6 42.2 17.8 11.6 2.9 33.9 320.3
Proportion of the population % 49.8 49.6 49.8 49.6 49.7 50.2 51.7 50.0 49.8
All people
0–4 years '000 26.1 5.7 24.4 10.7 4.4 3.0 0.6 7.9 82.9
5–9 years '000 24.2 5.4 22.9 10.3 4.2 2.7 0.7 7.7 78.2
10–14 years '000 25.3 5.4 22.0 9.8 4.1 2.9 0.7 7.2 77.4
15–19 years '000 21.9 5.0 19.1 8.9 3.8 2.6 0.7 6.9 68.8
20–24 years '000 16.6 4.0 15.1 7.9 3.4 2.1 0.7 6.7 56.3
25–29 years '000 13.2 3.0 12.9 6.5 2.6 1.6 0.5 5.9 46.2
30–34 years '000 11.2 2.7 11.3 5.7 2.1 1.2 0.4 5.0 39.7
35–39 years '000 13.0 2.9 12.1 6.0 2.4 1.4 0.4 4.9 43.1
40–44 years '000 11.6 2.6 10.2 5.1 2.1 1.3 0.3 4.2 37.6
45–49 years '000 10.7 2.2 9.0 4.3 1.9 1.3 0.3 3.4 33.1
50–54 years '000 8.7 1.8 7.0 3.5 1.5 1.0 0.2 2.8 26.5
55–59 years '000 6.5 1.4 5.2 2.5 1.0 0.8 0.2 1.9 19.5
60–64 years '000 4.6 0.9 3.5 1.6 0.7 0.5 0.1 1.3 13.3
65–69 years '000 3.0 0.7 2.2 1.0 0.5 0.3 – 0.8 8.6
70–74 years '000 1.9 0.4 1.4 0.6 0.3 0.2 – 0.5 5.4
75–79 years '000 1.2 0.3 0.8 0.5 0.3 0.2 – 0.3 3.6
INDIGENOUS
COMPENDIUM 2015
STATISTICAL CONTEXT
PAGE 19 of TABLE 2A.13

TABLE 2A.13
Table 2A.13
Unit NSW Vic Qld WA SA Tas ACT NT Aust (c)
Aboriginal and Torres Strait Islander population estimates, by age and sex, 30 June (a), (b)
80–84 years '000 0.6 0.2 0.5 0.2 0.1 0.1 – 0.2 1.9
85 or over '000 0.3 0.1 0.3 0.1 0.1 0.1 – 0.1 1.1
Total people '000 200.7 44.6 180.0 85.2 35.7 23.2 5.7 67.7 643.0
Proportion of the population % 31.2 6.9 28.0 13.3 5.5 3.6 0.9 10.5 100.0
Females
0–4 years '000 12.8 2.9 12.1 5.4 2.1 1.5 0.3 3.7 40.9
5–9 years '000 11.8 2.6 11.4 5.2 2.1 1.3 0.3 3.8 38.4
10–14 years '000 12.2 2.8 10.9 4.9 2.1 1.4 0.3 3.5 38.1
15–19 years '000 11.1 2.5 9.5 4.3 1.9 1.3 0.3 3.3 34.2
20–24 years '000 8.6 2.2 7.9 4.0 1.7 1.1 0.3 3.3 29.2
25–29 years '000 6.9 1.6 6.6 3.3 1.4 0.9 0.3 3.0 24.1
30–34 years '000 5.8 1.4 5.8 3.0 1.1 0.6 0.2 2.5 20.5
35–39 years '000 6.7 1.4 6.2 2.9 1.2 0.7 0.2 2.5 21.9
40–44 years '000 6.3 1.4 5.6 2.7 1.1 0.7 0.2 2.3 20.4
45–49 years '000 5.8 1.2 4.7 2.3 1.0 0.7 0.2 1.7 17.5
50–54 years '000 4.6 0.9 3.8 1.9 0.8 0.5 0.1 1.5 14.1
55–59 years '000 3.4 0.8 3.0 1.4 0.6 0.4 0.1 1.0 10.6
60–64 years '000 2.5 0.5 2.0 0.9 0.4 0.3 – 0.8 7.5
65–69 years '000 1.6 0.4 1.3 0.6 0.3 0.2 – 0.5 4.8
70–74 years '000 1.1 0.2 0.8 0.4 0.2 0.1 – 0.3 3.2
75–79 years '000 0.7 0.2 0.5 0.2 0.1 np np 0.2 2.1
80–84 years '000 0.4 0.1 0.3 0.1 0.1 np np 0.1 1.2
85 or over '000 0.2 0.1 0.2 0.1 0.1 np np 0.1 0.8
Total females '000 102.6 23.1 92.6 43.8 18.4 11.8 2.9 34.1 329.5
Proportion of the population % 50.2 50.3 50.2 50.4 50.3 49.9 48.3 49.9 50.2
30 June 2010
INDIGENOUS
COMPENDIUM 2015
STATISTICAL CONTEXT
PAGE 20 of TABLE 2A.13

TABLE 2A.13
Table 2A.13
Unit NSW Vic Qld WA SA Tas ACT NT Aust (c)
Aboriginal and Torres Strait Islander population estimates, by age and sex, 30 June (a), (b)
Males
0–4 years '000 13.4 2.9 12.6 5.4 2.3 1.6 0.4 4.0 42.5
5–9 years '000 12.6 2.8 11.9 5.1 2.2 1.4 0.3 4.0 40.2
10–14 years '000 12.9 2.7 11.4 5.1 2.1 1.5 0.3 3.7 39.7
15–19 years '000 11.8 2.6 10.2 4.7 2.1 1.3 0.5 3.5 36.7
20–24 years '000 8.7 2.1 7.9 4.1 1.7 1.1 0.4 3.4 29.4
25–29 years '000 7.0 1.6 6.8 3.5 1.5 0.8 0.3 3.0 24.4
30–34 years '000 5.5 1.3 5.6 2.8 1.0 0.6 0.2 2.5 19.4
35–39 years '000 6.0 1.4 5.8 2.9 1.1 0.6 0.2 2.4 20.5
40–44 years '000 5.6 1.4 5.1 2.6 1.0 0.7 0.1 2.1 18.6
45–49 years '000 5.1 1.2 4.5 2.1 0.9 0.6 0.1 1.7 16.2
50–54 years '000 4.5 0.9 3.5 1.8 0.7 0.5 0.1 1.4 13.5
55–59 years '000 3.4 0.7 2.6 1.2 0.6 0.5 0.1 1.0 10.0
60–64 years '000 2.4 0.5 1.8 0.8 0.4 0.3 – 0.6 6.7
65–69 years '000 1.5 0.3 1.0 0.5 0.3 0.2 – 0.4 4.2
70–74 years '000 0.9 0.2 0.6 0.3 0.1 0.1 – 0.2 2.5
75–79 years '000 0.5 0.1 0.4 0.2 0.1 np np 0.1 1.5
80–84 years '000 0.2 0.1 0.2 0.1 – np np 0.1 0.8
85 or over '000 0.1 – 0.1 0.1 – np np – 0.4
Total males '000 102.0 22.8 91.9 43.0 18.2 11.9 3.1 34.2 327.2
Proportion of the population % 49.8 49.7 49.8 49.6 49.7 50.1 51.7 50.1 49.8
All people
0–4 years '000 26.2 5.8 24.7 10.8 4.5 3.1 0.7 7.7 83.4
5–9 years '000 24.4 5.4 23.3 10.2 4.2 2.7 0.6 7.8 78.6
10–14 years '000 25.1 5.5 22.3 10.0 4.2 2.9 0.7 7.2 77.9
15–19 years '000 22.8 5.1 19.8 9.0 3.9 2.6 0.8 6.9 70.9
20–24 years '000 17.3 4.3 15.8 8.1 3.5 2.1 0.7 6.7 58.6
INDIGENOUS
COMPENDIUM 2015
STATISTICAL CONTEXT
PAGE 21 of TABLE 2A.13

TABLE 2A.13
Table 2A.13
Unit NSW Vic Qld WA SA Tas ACT NT Aust (c)
Aboriginal and Torres Strait Islander population estimates, by age and sex, 30 June (a), (b)
25–29 years '000 13.9 3.2 13.4 6.9 2.9 1.7 0.5 6.0 48.5
30–34 years '000 11.3 2.7 11.4 5.7 2.2 1.2 0.4 5.0 39.9
35–39 years '000 12.7 2.9 12.0 5.8 2.4 1.4 0.4 4.9 42.4
40–44 years '000 11.9 2.7 10.7 5.3 2.1 1.4 0.3 4.4 38.9
45–49 years '000 10.8 2.3 9.3 4.4 1.9 1.3 0.3 3.4 33.8
50–54 years '000 9.1 1.8 7.3 3.7 1.5 1.1 0.2 2.9 27.6
55–59 years '000 6.8 1.5 5.5 2.6 1.1 0.8 0.2 2.0 20.6
60–64 years '000 4.9 1.0 3.7 1.7 0.8 0.6 0.1 1.4 14.2
65–69 years '000 3.2 0.7 2.3 1.1 0.5 0.4 0.1 0.8 9.1
70–74 years '000 2.0 0.4 1.4 0.6 0.3 0.2 – 0.5 5.7
75–79 years '000 1.2 0.3 0.9 0.4 0.2 0.2 – 0.3 3.5
80–84 years '000 0.7 0.2 0.5 0.2 0.1 0.1 – 0.2 2.0
85 or over '000 0.4 0.1 0.3 0.2 0.1 0.1 – 0.1 1.2
Total people '000 204.6 46.0 184.6 86.8 36.6 23.7 5.9 68.3 656.7
Proportion of the population % 31.2 7.0 28.1 13.2 5.6 3.6 0.9 10.4 100.0
30 June 2011
Females
0–4 years '000 12.8 3.0 12.1 5.2 2.2 1.5 0.3 3.5 40.6
5–9 years '000 12.0 2.7 11.5 5.3 2.1 1.3 0.3 3.8 38.9
10–14 years '000 12.1 2.8 11.2 5.0 2.2 1.4 0.3 3.5 38.4
15–19 years '000 11.5 2.5 9.9 4.5 1.9 1.3 0.3 3.3 35.2
20–24 years '000 8.9 2.4 8.2 4.1 1.8 1.1 0.4 3.3 30.2
25–29 years '000 7.2 1.7 6.9 3.5 1.5 0.9 0.3 3.1 25.2
30–34 years '000 5.9 1.5 5.9 3.0 1.2 0.7 0.2 2.6 20.8
35–39 years '000 6.5 1.4 6.0 2.8 1.2 0.7 0.2 2.5 21.2
40–44 years '000 6.6 1.5 5.8 2.9 1.2 0.8 0.2 2.4 21.2
45–49 years '000 5.8 1.2 4.8 2.3 1.0 0.7 0.2 1.8 17.8
INDIGENOUS
COMPENDIUM 2015
STATISTICAL CONTEXT
PAGE 22 of TABLE 2A.13

TABLE 2A.13
Table 2A.13
Unit NSW Vic Qld WA SA Tas ACT NT Aust (c)
Aboriginal and Torres Strait Islander population estimates, by age and sex, 30 June (a), (b)
50–54 years '000 4.9 1.0 4.0 1.9 0.9 0.6 0.1 1.5 14.8
55–59 years '000 3.6 0.8 3.0 1.5 0.6 0.4 0.1 1.1 11.1
60–64 years '000 2.6 0.6 2.2 1.0 0.4 0.3 – 0.8 8.0
65–69 years '000 1.7 0.4 1.4 0.6 0.3 0.2 – 0.5 5.1
70–74 years '000 1.2 0.3 0.9 0.4 0.2 0.1 – 0.3 3.3
75–79 years '000 0.7 0.2 0.5 0.2 0.1 np np 0.2 2.1
80–84 years '000 0.4 0.1 0.3 0.1 0.1 np np 0.1 1.3
85 or over '000 0.2 0.1 0.2 0.1 0.1 np np 0.1 0.9
Total females '000 104.6 23.8 94.9 44.5 18.9 12.1 3.0 34.4 336.2
Proportion of the population % 50.2 50.3 50.2 50.5 50.4 50.0 48.4 49.9 50.2
Males
0–4 years '000 13.2 3.0 12.7 5.2 2.3 1.5 0.4 3.9 42.2
5–9 years '000 12.8 2.8 11.9 5.1 2.2 1.4 0.3 4.1 40.6
10–14 years '000 12.8 2.8 11.4 5.1 2.2 1.5 0.3 3.8 39.8
15–19 years '000 12.1 2.7 10.6 4.7 2.1 1.4 0.4 3.5 37.6
20–24 years '000 9.3 2.3 8.4 4.3 1.8 1.1 0.4 3.4 31.0
25–29 years '000 7.2 1.7 6.9 3.6 1.5 0.9 0.3 3.1 25.2
30–34 years '000 5.6 1.3 5.7 2.9 1.1 0.6 0.2 2.5 19.9
35–39 years '000 5.8 1.4 5.7 2.9 1.1 0.6 0.2 2.4 20.1
40–44 years '000 5.8 1.4 5.4 2.6 1.1 0.7 0.2 2.2 19.3
45–49 years '000 5.0 1.2 4.6 2.2 1.0 0.6 0.2 1.7 16.4
50–54 years '000 4.7 0.9 3.7 1.8 0.7 0.6 0.1 1.4 14.0
55–59 years '000 3.5 0.8 2.8 1.3 0.6 0.5 0.1 1.1 10.5
60–64 years '000 2.5 0.5 1.9 0.9 0.4 0.3 – 0.7 7.2
65–69 years '000 1.6 0.3 1.2 0.5 0.3 0.2 – 0.4 4.5
70–74 years '000 1.0 0.2 0.7 0.3 0.1 0.1 – 0.2 2.6
75–79 years '000 0.6 0.1 0.4 0.2 0.1 np np 0.1 1.5
INDIGENOUS
COMPENDIUM 2015
STATISTICAL CONTEXT
PAGE 23 of TABLE 2A.13

TABLE 2A.13
Table 2A.13
Unit NSW Vic Qld WA SA Tas ACT NT Aust (c)
Aboriginal and Torres Strait Islander population estimates, by age and sex, 30 June (a), (b)
80–84 years '000 0.3 0.1 0.2 0.1 – np np 0.1 0.8
85 or over '000 0.1 – 0.1 0.1 – np np – 0.5
Total males '000 103.9 23.5 94.1 43.7 18.6 12.1 3.2 34.5 333.7
Proportion of the population % 49.8 49.7 49.8 49.5 49.6 50.0 51.6 50.1 49.8
All people
0–4 years '000 26.0 6.0 24.8 10.4 4.5 3.0 0.7 7.4 82.8
5–9 years '000 24.8 5.4 23.4 10.4 4.3 2.7 0.7 7.8 79.5
10–14 years '000 24.9 5.5 22.6 10.1 4.3 2.9 0.7 7.3 78.2
15–19 years '000 23.6 5.2 20.5 9.2 4.0 2.7 0.7 6.9 72.8
20–24 years '000 18.2 4.7 16.6 8.4 3.6 2.2 0.8 6.7 61.2
25–29 years '000 14.4 3.4 13.9 7.1 3.0 1.8 0.6 6.2 50.4
30–34 years '000 11.5 2.8 11.6 5.8 2.2 1.3 0.4 5.0 40.7
35–39 years '000 12.3 2.8 11.7 5.7 2.3 1.3 0.4 4.8 41.3
40–44 years '000 12.3 2.9 11.2 5.5 2.2 1.5 0.3 4.5 40.5
45–49 years '000 10.8 2.4 9.4 4.5 2.0 1.2 0.3 3.5 34.2
50–54 years '000 9.5 1.9 7.7 3.8 1.6 1.1 0.2 3.0 28.8
55–59 years '000 7.1 1.5 5.7 2.8 1.2 0.9 0.2 2.1 21.6
60–64 years '000 5.2 1.1 4.0 1.9 0.8 0.6 0.1 1.5 15.2
65–69 years '000 3.4 0.7 2.6 1.1 0.5 0.4 0.1 0.9 9.7
70–74 years '000 2.1 0.5 1.5 0.7 0.4 0.3 – 0.6 6.0
75–79 years '000 1.3 0.3 0.9 0.4 0.2 0.2 – 0.4 3.6
80–84 years '000 0.7 0.2 0.5 0.2 0.1 0.1 – 0.2 2.1
85 or over '000 0.4 0.1 0.3 0.2 0.1 0.1 – 0.1 1.3
Total people '000 208.5 47.3 189.0 88.3 37.4 24.2 6.2 68.9 669.9
Proportion of the population % 31.1 7.1 28.2 13.2 5.6 3.6 0.9 10.3 100.0
AAGR (d) % 2.5 3.9 3.2 2.4 3.1 2.8 5.0 1.2 2.7
(a) Totals may not add as a result of rounding.
INDIGENOUS
COMPENDIUM 2015
STATISTICAL CONTEXT
PAGE 24 of TABLE 2A.13
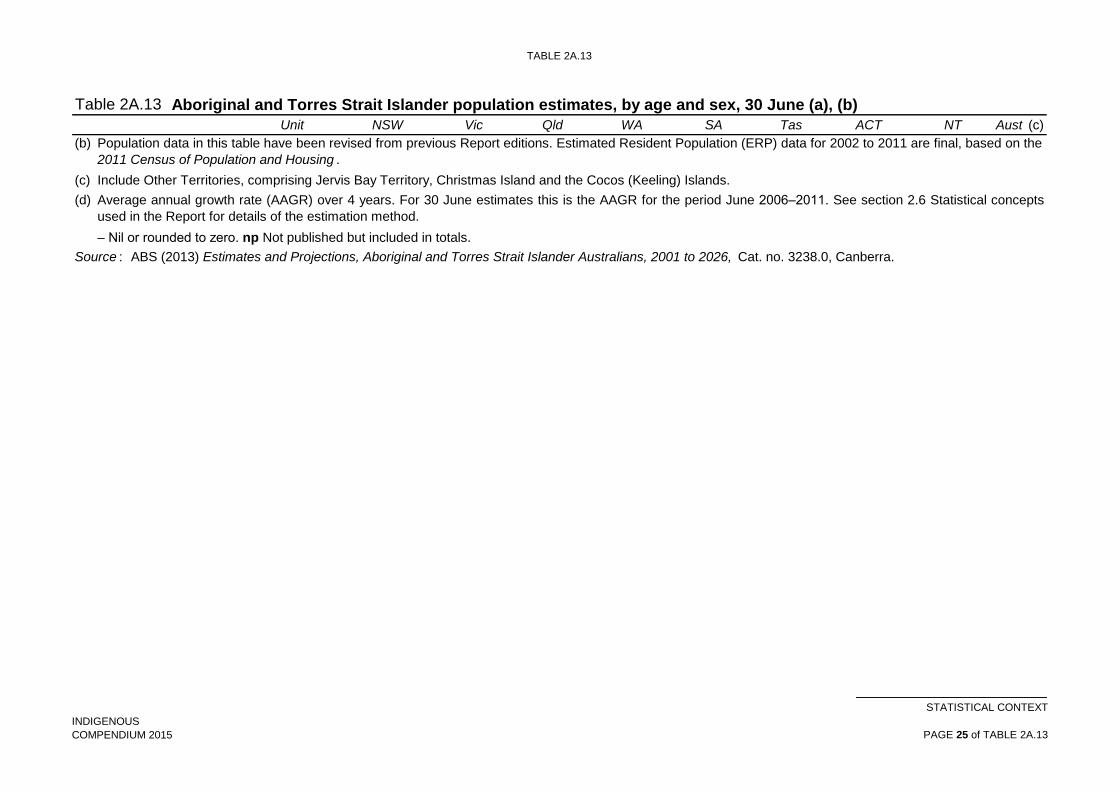
TABLE 2A.13
Table 2A.13
Unit NSW Vic Qld WA SA Tas ACT NT Aust (c)
Aboriginal and Torres Strait Islander population estimates, by age and sex, 30 June (a), (b)
(b)
(c)
(d)
Source : ABS (2013) Estimates and Projections, Aboriginal and Torres Strait Islander Australians, 2001 to 2026, Cat. no. 3238.0, Canberra.
– Nil or rounded to zero. np Not published but included in totals.
Population data in this table have been revised from previous Report editions. Estimated Resident Population (ERP) data for 2002 to 2011 are final, based on the
2011 Census of Population and Housing .
Include Other Territories, comprising Jervis Bay Territory, Christmas Island and the Cocos (Keeling) Islands.
Average annual growth rate (AAGR) over 4 years. For 30 June estimates this is the AAGR for the period June 2006–2011. See section 2.6 Statistical concepts
used in the Report for details of the estimation method.
INDIGENOUS
COMPENDIUM 2015
STATISTICAL CONTEXT
PAGE 25 of TABLE 2A.13

TABLE 2A.14
Table 2A.14
NSW Vic Qld WA SA Tas ACT NT Aust (e)
30 June 2012
Females
0–4 years 12 711 2 991 12 228 5 103 2 235 1 507 334 3 489 40 613
5–9 years 12 255 2 722 11 692 5 300 2 085 1 338 312 3 775 39 492
10–14 years 11 974 2 708 11 161 5 094 2 131 1 355 330 3 555 38 322
15–19 years 11 835 2 575 10 295 4 594 1 975 1 363 304 3 337 36 290
20–24 years 9 168 2 491 8 640 4 074 1 793 1 132 372 3 350 31 032
25–29 years 7 464 1 786 7 171 3 760 1 626 950 322 3 148 26 236
30–34 years 6 048 1 508 6 038 3 011 1 207 729 215 2 623 21 385
35–39 years 6 165 1 360 5 883 2 787 1 119 636 176 2 448 20 587
40–44 years 6 738 1 489 6 065 2 944 1 199 795 170 2 434 21 846
45–49 years 5 951 1 201 4 861 2 412 1 065 671 163 1 836 18 164
50–54 years 5 031 1 022 4 207 2 017 898 620 128 1 574 15 507
55–59 years 3 801 811 3 114 1 582 639 429 110 1 152 11 642
60–64 years 2 790 613 2 296 1 084 435 313 55 840 8 430
65–69 years 1 850 392 1 509 669 308 521 70 521 5 483
70–74 years 1 207 260 921 419 231 np np 332 3 522
75–79 years 740 175 547 239 148 np np 226 2 180
80–84 years 447 111 315 162 100 np np 129 1 323
85 or over 254 80 205 112 70 np np 92 863
Total females 106 429 24 295 97 148 45 363 19 264 12 359 3 061 34 861 342 917
30 June 2013
0–4 years 12 761 3 006 12 408 5 067 2 255 1 496 365 3 465 40 836
5–9 years 12 404 2 800 11 851 5 328 2 133 1 422 293 3 739 39 984
10–14 years 11 914 2 669 11 214 5 183 2 115 1 339 314 3 599 38 363
15–19 years 11 975 2 666 10 638 4 648 2 059 1 348 320 3 364 37 031
20–24 years 9 654 2 564 9 029 4 189 1 821 1 174 377 3 364 32 182
Aboriginal and Torres Strait Islander population projections, by age and sex, 30 June (a), (b), (c), (d)
INDIGENOUS
COMPENDIUM 2015
STATISTICAL CONTEXT
PAGE 1 of TABLE 2A.14

TABLE 2A.14
Table 2A.14
NSW Vic Qld WA SA Tas ACT NT Aust (e)
Aboriginal and Torres Strait Islander population projections, by age and sex, 30 June (a), (b), (c), (d)
25–29 years 7 674 1 887 7 332 3 894 1 665 968 347 3 193 26 970
30–34 years 6 274 1 583 6 280 3 115 1 253 794 227 2 714 22 247
35–39 years 5 908 1 354 5 720 2 735 1 113 620 181 2 425 20 066
40–44 years 6 842 1 480 6 227 2 992 1 215 778 176 2 457 22 181
45–49 years 5 982 1 265 4 959 2 432 1 081 718 162 1 950 18 554
50–54 years 5 305 1 056 4 409 2 141 946 648 126 1 595 16 234
55–59 years 3 972 810 3 281 1 648 660 452 117 1 246 12 192
60–64 years 2 971 645 2 464 1 147 482 329 67 876 8 986
65–69 years 1 948 410 1 614 721 327 549 73 571 5 827
70–74 years 1 294 276 978 446 231 np np 343 3 739
75–79 years 762 170 545 244 158 np np 230 2 215
80–84 years 470 113 338 166 103 np np 136 1 393
85 or over 245 72 212 112 67 np np 91 850
Total females 108 355 24 826 99 499 46 208 19 684 12 635 3 145 35 358 349 850
30 June 2014
0–4 years 12 883 3 059 12 553 5 077 2 288 1 494 387 3 466 41 221
5–9 years 12 654 2 873 12 140 5 350 2 138 1 496 280 3 688 40 635
10–14 years 11 721 2 596 11 270 5 181 2 130 1 312 319 3 636 38 179
15–19 years 12 080 2 794 10 844 4 738 2 128 1 346 327 3 392 37 663
20–24 years 10 130 2 587 9 395 4 326 1 862 1 224 389 3 377 33 299
25–29 years 7 922 2 047 7 602 3 998 1 696 996 362 3 236 27 867
30–34 years 6 489 1 599 6 478 3 227 1 340 828 242 2 801 23 012
35–39 years 5 822 1 400 5 718 2 774 1 107 641 181 2 425 20 077
40–44 years 6 792 1 419 6 223 2 948 1 220 754 179 2 449 22 000
45–49 years 6 065 1 318 5 147 2 511 1 084 723 170 2 079 19 104
50–54 years 5 486 1 102 4 520 2 225 972 689 130 1 607 16 736
55–59 years 4 226 816 3 480 1 719 714 485 121 1 341 12 911
INDIGENOUS
COMPENDIUM 2015
STATISTICAL CONTEXT
PAGE 2 of TABLE 2A.14
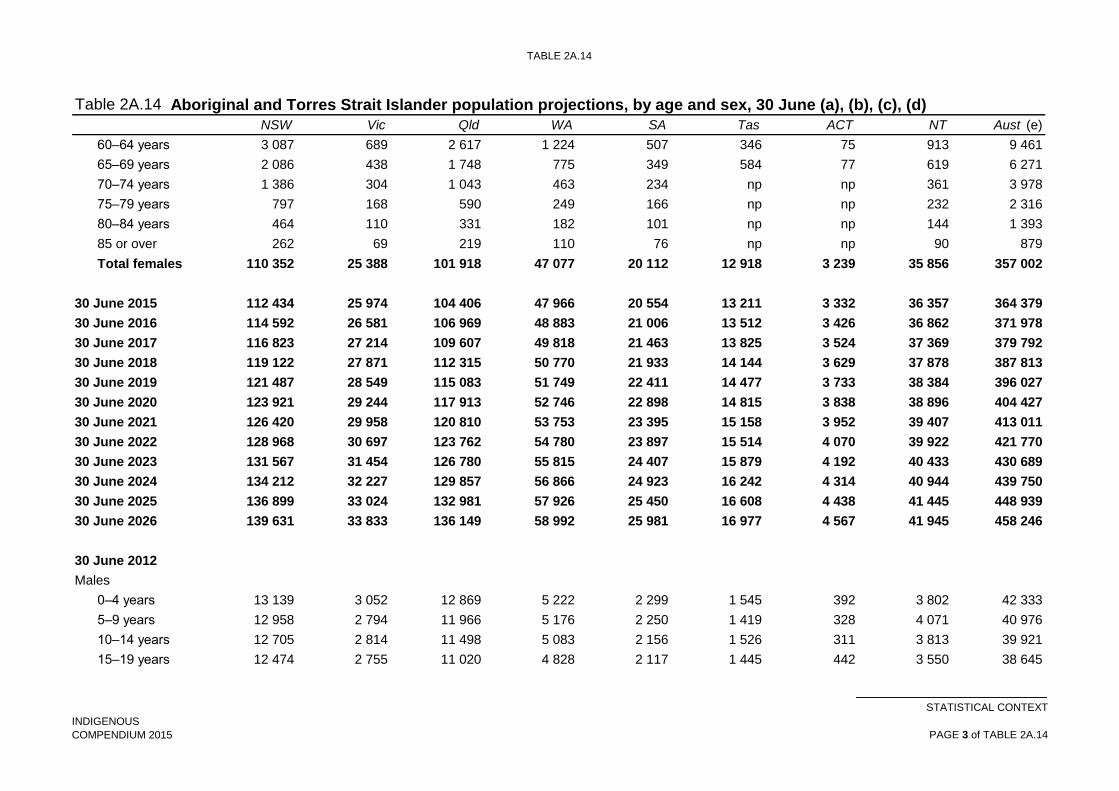
TABLE 2A.14
Table 2A.14
NSW Vic Qld WA SA Tas ACT NT Aust (e)
Aboriginal and Torres Strait Islander population projections, by age and sex, 30 June (a), (b), (c), (d)
60–64 years 3 087 689 2 617 1 224 507 346 75 913 9 461
65–69 years 2 086 438 1 748 775 349 584 77 619 6 271
70–74 years 1 386 304 1 043 463 234 np np 361 3 978
75–79 years 797 168 590 249 166 np np 232 2 316
80–84 years 464 110 331 182 101 np np 144 1 393
85 or over 262 69 219 110 76 np np 90 879
Total females 110 352 25 388 101 918 47 077 20 112 12 918 3 239 35 856 357 002
30 June 2015 112 434 25 974 104 406 47 966 20 554 13 211 3 332 36 357 364 379
30 June 2016 114 592 26 581 106 969 48 883 21 006 13 512 3 426 36 862 371 978
30 June 2017 116 823 27 214 109 607 49 818 21 463 13 825 3 524 37 369 379 792
30 June 2018 119 122 27 871 112 315 50 770 21 933 14 144 3 629 37 878 387 813
30 June 2019 121 487 28 549 115 083 51 749 22 411 14 477 3 733 38 384 396 027
30 June 2020 123 921 29 244 117 913 52 746 22 898 14 815 3 838 38 896 404 427
30 June 2021 126 420 29 958 120 810 53 753 23 395 15 158 3 952 39 407 413 011
30 June 2022 128 968 30 697 123 762 54 780 23 897 15 514 4 070 39 922 421 770
30 June 2023 131 567 31 454 126 780 55 815 24 407 15 879 4 192 40 433 430 689
30 June 2024 134 212 32 227 129 857 56 866 24 923 16 242 4 314 40 944 439 750
30 June 2025 136 899 33 024 132 981 57 926 25 450 16 608 4 438 41 445 448 939
30 June 2026 139 631 33 833 136 149 58 992 25 981 16 977 4 567 41 945 458 246
30 June 2012
Males
0–4 years 13 139 3 052 12 869 5 222 2 299 1 545 392 3 802 42 333
5–9 years 12 958 2 794 11 966 5 176 2 250 1 419 328 4 071 40 976
10–14 years 12 705 2 814 11 498 5 083 2 156 1 526 311 3 813 39 921
15–19 years 12 474 2 755 11 020 4 828 2 117 1 445 442 3 550 38 645
INDIGENOUS
COMPENDIUM 2015
STATISTICAL CONTEXT
PAGE 3 of TABLE 2A.14

TABLE 2A.14
Table 2A.14
NSW Vic Qld WA SA Tas ACT NT Aust (e)
Aboriginal and Torres Strait Islander population projections, by age and sex, 30 June (a), (b), (c), (d)
20–24 years 9 827 2 427 8 899 4 450 1 888 1 113 424 3 424 32 457
25–29 years 7 498 1 840 7 033 3 715 1 580 904 323 3 146 26 043
30–34 years 5 811 1 372 5 910 3 087 1 134 647 201 2 567 20 746
35–39 years 5 497 1 348 5 563 2 723 1 036 578 185 2 394 19 331
40–44 years 6 050 1 437 5 546 2 754 1 118 681 178 2 225 19 999
45–49 years 5 026 1 236 4 670 2 246 965 594 154 1 788 16 683
50–54 years 4 776 1 009 3 826 1 892 753 580 128 1 499 14 474
55–59 years 3 682 766 2 927 1 436 627 445 105 1 129 11 123
60–64 years 2 706 547 1 986 889 398 373 52 726 7 681
65–69 years 1 772 345 1 270 566 253 500 52 451 4 913
70–74 years 1 077 220 697 305 162 np np 255 2 859
75–79 years 610 118 376 176 92 np np 141 1 594
80–84 years 304 83 201 102 54 np np 86 884
85 or over 133 40 101 52 38 np np 48 438
Total males 106 045 24 203 96 358 44 702 18 920 12 350 3 275 35 115 341 100
30 June 2013
Males
0–4 years 13 348 3 084 13 020 5 239 2 285 1 538 394 3 769 42 691
5–9 years 13 027 2 858 12 168 5 244 2 305 1 503 331 4 050 41 499
10–14 years 12 529 2 844 11 549 5 037 2 161 1 477 307 3 869 39 789
15–19 years 12 731 2 757 11 218 4 935 2 133 1 486 416 3 572 39 263
20–24 years 10 350 2 609 9 493 4 545 1 945 1 156 471 3 472 34 046
25–29 years 7 758 1 955 7 200 3 882 1 627 934 345 3 203 26 906
30–34 years 6 125 1 430 6 144 3 246 1 250 691 216 2 669 21 790
35–39 years 5 342 1 318 5 485 2 660 1 003 570 191 2 385 18 960
40–44 years 6 128 1 493 5 624 2 863 1 134 688 185 2 289 20 414
45–49 years 5 151 1 256 4 806 2 327 961 617 147 1 870 17 140
INDIGENOUS
COMPENDIUM 2015
STATISTICAL CONTEXT
PAGE 4 of TABLE 2A.14
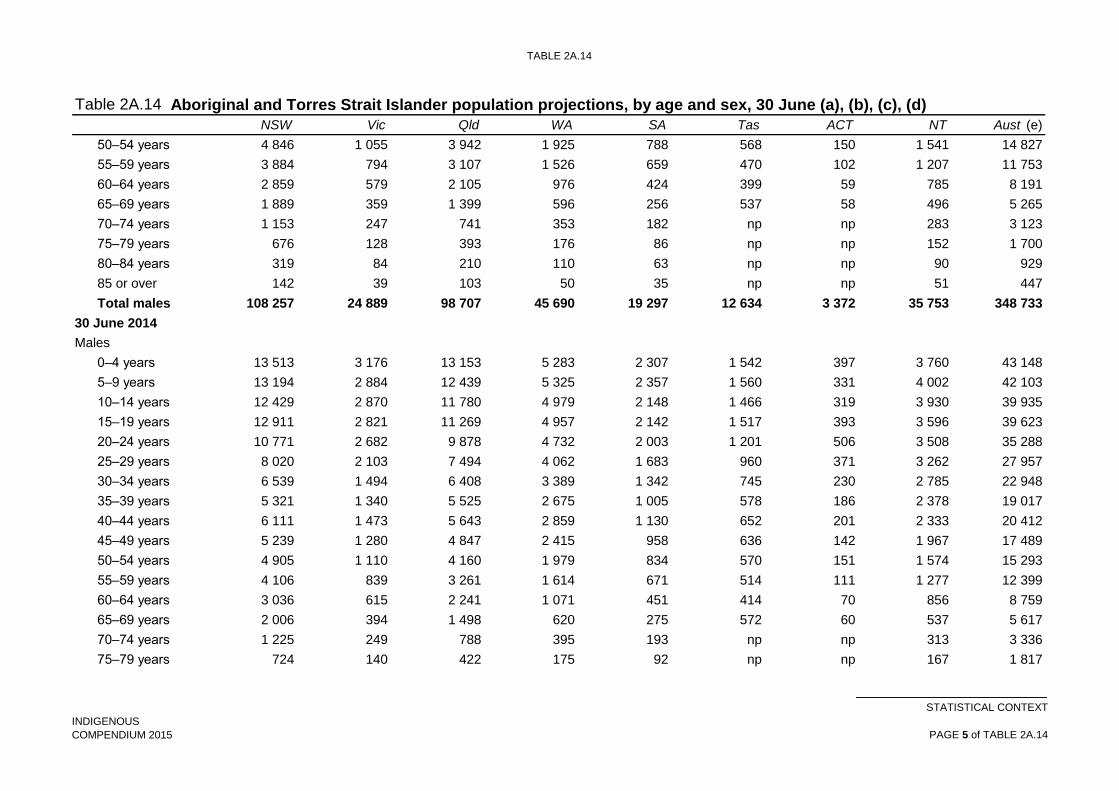
TABLE 2A.14
Table 2A.14
NSW Vic Qld WA SA Tas ACT NT Aust (e)
Aboriginal and Torres Strait Islander population projections, by age and sex, 30 June (a), (b), (c), (d)
50–54 years 4 846 1 055 3 942 1 925 788 568 150 1 541 14 827
55–59 years 3 884 794 3 107 1 526 659 470 102 1 207 11 753
60–64 years 2 859 579 2 105 976 424 399 59 785 8 191
65–69 years 1 889 359 1 399 596 256 537 58 496 5 265
70–74 years 1 153 247 741 353 182 np np 283 3 123
75–79 years 676 128 393 176 86 np np 152 1 700
80–84 years 319 84 210 110 63 np np 90 929
85 or over 142 39 103 50 35 np np 51 447
Total males 108 257 24 889 98 707 45 690 19 297 12 634 3 372 35 753 348 733
30 June 2014
Males
0–4 years 13 513 3 176 13 153 5 283 2 307 1 542 397 3 760 43 148
5–9 years 13 194 2 884 12 439 5 325 2 357 1 560 331 4 002 42 103
10–14 years 12 429 2 870 11 780 4 979 2 148 1 466 319 3 930 39 935
15–19 years 12 911 2 821 11 269 4 957 2 142 1 517 393 3 596 39 623
20–24 years 10 771 2 682 9 878 4 732 2 003 1 201 506 3 508 35 288
25–29 years 8 020 2 103 7 494 4 062 1 683 960 371 3 262 27 957
30–34 years 6 539 1 494 6 408 3 389 1 342 745 230 2 785 22 948
35–39 years 5 321 1 340 5 525 2 675 1 005 578 186 2 378 19 017
40–44 years 6 111 1 473 5 643 2 859 1 130 652 201 2 333 20 412
45–49 years 5 239 1 280 4 847 2 415 958 636 142 1 967 17 489
50–54 years 4 905 1 110 4 160 1 979 834 570 151 1 574 15 293
55–59 years 4 106 839 3 261 1 614 671 514 111 1 277 12 399
60–64 years 3 036 615 2 241 1 071 451 414 70 856 8 759
65–69 years 2 006 394 1 498 620 275 572 60 537 5 617
70–74 years 1 225 249 788 395 193 np np 313 3 336
75–79 years 724 140 422 175 92 np np 167 1 817
INDIGENOUS
COMPENDIUM 2015
STATISTICAL CONTEXT
PAGE 5 of TABLE 2A.14

TABLE 2A.14
Table 2A.14
NSW Vic Qld WA SA Tas ACT NT Aust (e)
Aboriginal and Torres Strait Islander population projections, by age and sex, 30 June (a), (b), (c), (d)
80–84 years 349 80 220 119 64 np np 94 976
85 or over 151 45 101 52 33 np np 56 470
Total males 110 550 25 595 101 127 46 701 19 688 12 927 3 468 36 395 356 587
30 June 2015 112 915 26 325 103 620 47 741 20 092 13 229 3 570 37 039 364 669
30 June 2016 115 359 27 082 106 191 48 798 20 509 13 540 3 677 37 681 372 978
30 June 2017 117 876 27 859 108 841 49 879 20 943 13 857 3 786 38 323 381 508
30 June 2018 120 465 28 657 111 568 50 983 21 384 14 184 3 896 38 967 390 251
30 June 2019 123 122 29 478 114 366 52 101 21 838 14 508 4 015 39 616 399 194
30 June 2020 125 839 30 324 117 231 53 238 22 304 14 844 4 137 40 260 408 330
30 June 2021 128 616 31 192 120 161 54 401 22 778 15 187 4 258 40 908 417 657
30 June 2022 131 459 32 075 123 165 55 580 23 262 15 535 4 379 41 553 427 167
30 June 2023 134 358 32 979 126 223 56 783 23 751 15 885 4 503 42 199 436 843
30 June 2024 137 306 33 906 129 331 57 993 24 247 16 246 4 632 42 841 446 667
30 June 2025 140 300 34 843 132 495 59 211 24 746 16 614 4 764 43 484 456 625
30 June 2026 143 331 35 804 135 711 60 439 25 252 16 988 4 896 44 115 466 707
30 June 2012
All people
0–4 years 25 850 6 043 25 097 10 325 4 534 3 052 726 7 291 82 946
5–9 years 25 213 5 516 23 658 10 476 4 335 2 757 640 7 846 80 468
10–14 years 24 679 5 522 22 659 10 177 4 287 2 881 641 7 368 78 243
15–19 years 24 309 5 330 21 315 9 422 4 092 2 808 746 6 887 74 935
20–24 years 18 995 4 918 17 539 8 524 3 681 2 245 796 6 774 63 489
25–29 years 14 962 3 626 14 204 7 475 3 206 1 854 645 6 294 52 279
30–34 years 11 859 2 880 11 948 6 098 2 341 1 376 416 5 190 42 131
35–39 years 11 662 2 708 11 446 5 510 2 155 1 214 361 4 842 39 918
INDIGENOUS
COMPENDIUM 2015
STATISTICAL CONTEXT
PAGE 6 of TABLE 2A.14
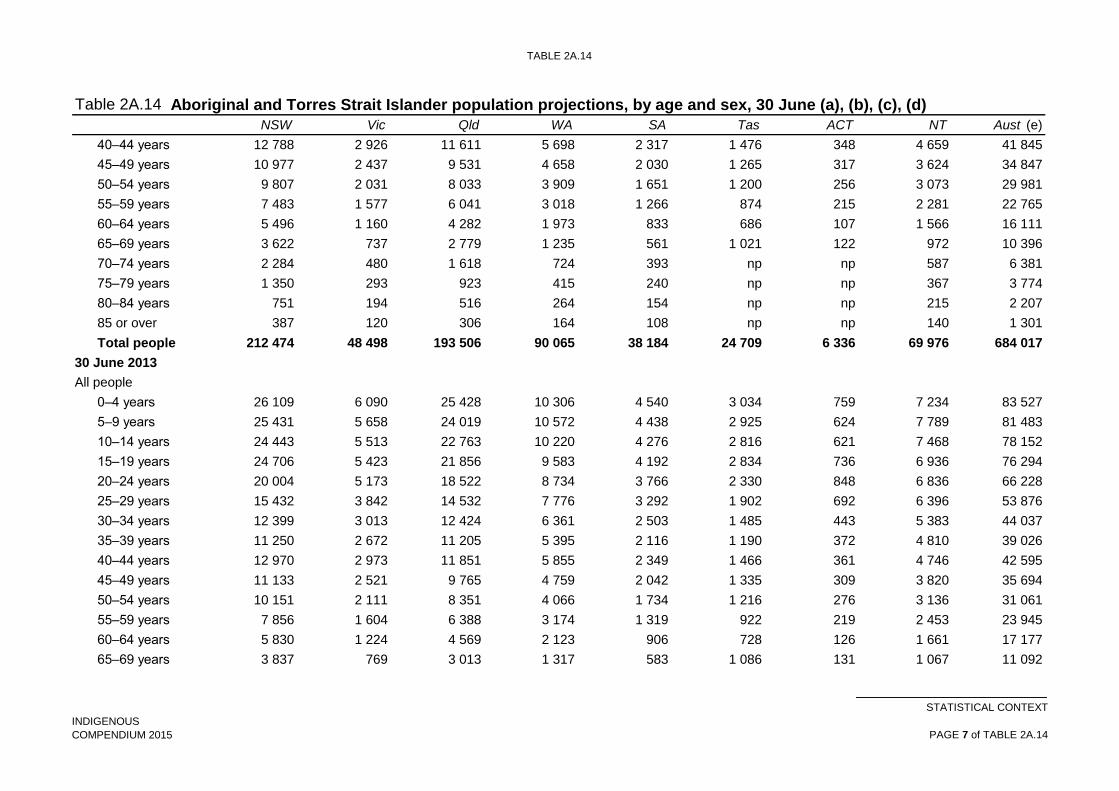
TABLE 2A.14
Table 2A.14
NSW Vic Qld WA SA Tas ACT NT Aust (e)
Aboriginal and Torres Strait Islander population projections, by age and sex, 30 June (a), (b), (c), (d)
40–44 years 12 788 2 926 11 611 5 698 2 317 1 476 348 4 659 41 845
45–49 years 10 977 2 437 9 531 4 658 2 030 1 265 317 3 624 34 847
50–54 years 9 807 2 031 8 033 3 909 1 651 1 200 256 3 073 29 981
55–59 years 7 483 1 577 6 041 3 018 1 266 874 215 2 281 22 765
60–64 years 5 496 1 160 4 282 1 973 833 686 107 1 566 16 111
65–69 years 3 622 737 2 779 1 235 561 1 021 122 972 10 396
70–74 years 2 284 480 1 618 724 393 np np 587 6 381
75–79 years 1 350 293 923 415 240 np np 367 3 774
80–84 years 751 194 516 264 154 np np 215 2 207
85 or over 387 120 306 164 108 np np 140 1 301
Total people 212 474 48 498 193 506 90 065 38 184 24 709 6 336 69 976 684 017
30 June 2013
All people
0–4 years 26 109 6 090 25 428 10 306 4 540 3 034 759 7 234 83 527
5–9 years 25 431 5 658 24 019 10 572 4 438 2 925 624 7 789 81 483
10–14 years 24 443 5 513 22 763 10 220 4 276 2 816 621 7 468 78 152
15–19 years 24 706 5 423 21 856 9 583 4 192 2 834 736 6 936 76 294
20–24 years 20 004 5 173 18 522 8 734 3 766 2 330 848 6 836 66 228
25–29 years 15 432 3 842 14 532 7 776 3 292 1 902 692 6 396 53 876
30–34 years 12 399 3 013 12 424 6 361 2 503 1 485 443 5 383 44 037
35–39 years 11 250 2 672 11 205 5 395 2 116 1 190 372 4 810 39 026
40–44 years 12 970 2 973 11 851 5 855 2 349 1 466 361 4 746 42 595
45–49 years 11 133 2 521 9 765 4 759 2 042 1 335 309 3 820 35 694
50–54 years 10 151 2 111 8 351 4 066 1 734 1 216 276 3 136 31 061
55–59 years 7 856 1 604 6 388 3 174 1 319 922 219 2 453 23 945
60–64 years 5 830 1 224 4 569 2 123 906 728 126 1 661 17 177
65–69 years 3 837 769 3 013 1 317 583 1 086 131 1 067 11 092
INDIGENOUS
COMPENDIUM 2015
STATISTICAL CONTEXT
PAGE 7 of TABLE 2A.14

TABLE 2A.14
Table 2A.14
NSW Vic Qld WA SA Tas ACT NT Aust (e)
Aboriginal and Torres Strait Islander population projections, by age and sex, 30 June (a), (b), (c), (d)
70–74 years 2 447 523 1 719 799 413 np np 626 6 862
75–79 years 1 438 298 938 420 244 np np 382 3 915
80–84 years 789 197 548 276 166 np np 226 2 322
85 or over 387 111 315 162 102 np np 142 1 297
Total people 216 612 49 715 198 206 91 898 38 981 25 269 6 517 71 111 698 583
30 June 2014
All people
0–4 years 26 396 6 235 25 706 10 360 4 595 3 036 784 7 226 84 369
5–9 years 25 848 5 757 24 579 10 675 4 495 3 056 611 7 690 82 738
10–14 years 24 150 5 466 23 050 10 160 4 278 2 778 638 7 566 78 114
15–19 years 24 991 5 615 22 113 9 695 4 270 2 863 720 6 988 77 286
20–24 years 20 901 5 269 19 273 9 058 3 865 2 425 895 6 885 68 587
25–29 years 15 942 4 150 15 096 8 060 3 379 1 956 733 6 498 55 824
30–34 years 13 028 3 093 12 886 6 616 2 682 1 573 472 5 586 45 960
35–39 years 11 143 2 740 11 243 5 449 2 112 1 219 367 4 803 39 094
40–44 years 12 903 2 892 11 866 5 807 2 350 1 406 380 4 782 42 412
45–49 years 11 304 2 598 9 994 4 926 2 042 1 359 312 4 046 36 593
50–54 years 10 391 2 212 8 680 4 204 1 806 1 259 281 3 181 32 029
55–59 years 8 332 1 655 6 741 3 333 1 385 999 232 2 618 25 310
60–64 years 6 123 1 304 4 858 2 295 958 760 145 1 769 18 220
65–69 years 4 092 832 3 246 1 395 624 1 156 137 1 156 11 888
70–74 years 2 611 553 1 831 858 427 np np 674 7 314
75–79 years 1 521 308 1 012 424 258 np np 399 4 133
80–84 years 813 190 551 301 165 np np 238 2 369
85 or over 413 114 320 162 109 np np 146 1 349
Total people 220 902 50 983 203 045 93 778 39 800 25 845 6 707 72 251 713 589
INDIGENOUS
COMPENDIUM 2015
STATISTICAL CONTEXT
PAGE 8 of TABLE 2A.14
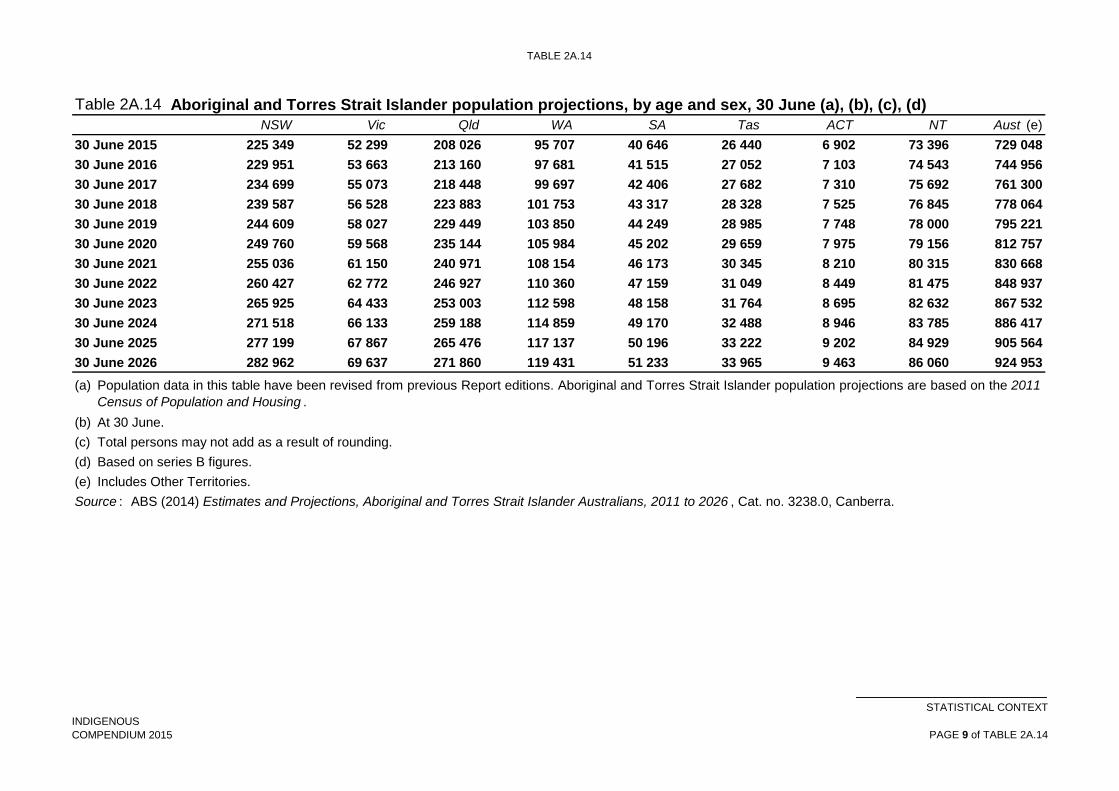
TABLE 2A.14
Table 2A.14
NSW Vic Qld WA SA Tas ACT NT Aust (e)
Aboriginal and Torres Strait Islander population projections, by age and sex, 30 June (a), (b), (c), (d)
30 June 2015 225 349 52 299 208 026 95 707 40 646 26 440 6 902 73 396 729 048
30 June 2016 229 951 53 663 213 160 97 681 41 515 27 052 7 103 74 543 744 956
30 June 2017 234 699 55 073 218 448 99 697 42 406 27 682 7 310 75 692 761 300
30 June 2018 239 587 56 528 223 883 101 753 43 317 28 328 7 525 76 845 778 064
30 June 2019 244 609 58 027 229 449 103 850 44 249 28 985 7 748 78 000 795 221
30 June 2020 249 760 59 568 235 144 105 984 45 202 29 659 7 975 79 156 812 757
30 June 2021 255 036 61 150 240 971 108 154 46 173 30 345 8 210 80 315 830 668
30 June 2022 260 427 62 772 246 927 110 360 47 159 31 049 8 449 81 475 848 937
30 June 2023 265 925 64 433 253 003 112 598 48 158 31 764 8 695 82 632 867 532
30 June 2024 271 518 66 133 259 188 114 859 49 170 32 488 8 946 83 785 886 417
30 June 2025 277 199 67 867 265 476 117 137 50 196 33 222 9 202 84 929 905 564
30 June 2026 282 962 69 637 271 860 119 431 51 233 33 965 9 463 86 060 924 953
(a)
(b)
(c)
(d)
(e)
Source : ABS (2014) Estimates and Projections, Aboriginal and Torres Strait Islander Australians, 2011 to 2026 , Cat. no. 3238.0, Canberra.
At 30 June.
Total persons may not add as a result of rounding.
Based on series B figures.
Includes Other Territories.
Population data in this table have been revised from previous Report editions. Aboriginal and Torres Strait Islander population projections are based on the 2011
Census of Population and Housing .
INDIGENOUS
COMPENDIUM 2015
STATISTICAL CONTEXT
PAGE 9 of TABLE 2A.14
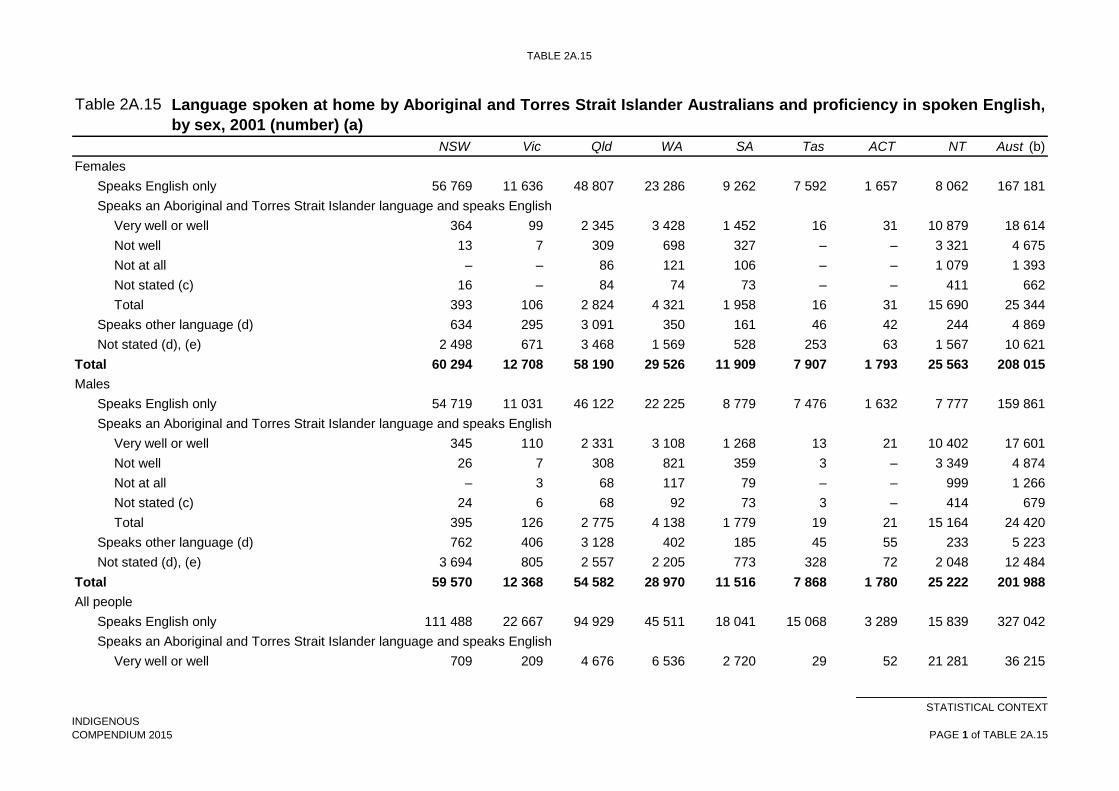
TABLE 2A.15
Table 2A.15
NSW Vic Qld WA SA Tas ACT NT Aust (b)
Females
Speaks English only 56 769 11 636 48 807 23 286 9 262 7 592 1 657 8 062 167 181
Speaks an Aboriginal and Torres Strait Islander language and speaks English
Very well or well 364 99 2 345 3 428 1 452 16 31 10 879 18 614
Not well 13 7 309 698 327 – – 3 321 4 675
Not at all – – 86 121 106 – – 1 079 1 393
Not stated (c) 16 – 84 74 73 – – 411 662
Total 393 106 2 824 4 321 1 958 16 31 15 690 25 344
Speaks other language (d) 634 295 3 091 350 161 46 42 244 4 869
Not stated (d), (e) 2 498 671 3 468 1 569 528 253 63 1 567 10 621
Total 60 294 12 708 58 190 29 526 11 909 7 907 1 793 25 563 208 015
Males
Speaks English only 54 719 11 031 46 122 22 225 8 779 7 476 1 632 7 777 159 861
Speaks an Aboriginal and Torres Strait Islander language and speaks English
Very well or well 345 110 2 331 3 108 1 268 13 21 10 402 17 601
Not well 26 7 308 821 359 3 – 3 349 4 874
Not at all – 3 68 117 79 – – 999 1 266
Not stated (c) 24 6 68 92 73 3 – 414 679
Total 395 126 2 775 4 138 1 779 19 21 15 164 24 420
Speaks other language (d) 762 406 3 128 402 185 45 55 233 5 223
Not stated (d), (e) 3 694 805 2 557 2 205 773 328 72 2 048 12 484
Total 59 570 12 368 54 582 28 970 11 516 7 868 1 780 25 222 201 988
All people
Speaks English only 111 488 22 667 94 929 45 511 18 041 15 068 3 289 15 839 327 042
Speaks an Aboriginal and Torres Strait Islander language and speaks English
Very well or well 709 209 4 676 6 536 2 720 29 52 21 281 36 215
Language spoken at home by Aboriginal and Torres Strait Islander Australians and proficiency in spoken English,
by sex, 2001 (number) (a)
INDIGENOUS
COMPENDIUM 2015
STATISTICAL CONTEXT
PAGE 1 of TABLE 2A.15

TABLE 2A.15
Table 2A.15
NSW Vic Qld WA SA Tas ACT NT Aust (b)
Language spoken at home by Aboriginal and Torres Strait Islander Australians and proficiency in spoken English,
by sex, 2001 (number) (a)
Not well 39 14 617 1 519 686 3 – 6 670 9 549
Not at all – 3 154 238 185 – – 2 078 2 659
Not stated (c) 40 6 152 166 146 3 – 825 1 341
Total 788 232 5 599 8 459 3 737 35 52 30 854 49 764
Speaks other language (d) 1 396 701 6 219 752 346 91 97 477 10 092
Not stated (d), (e) 6 192 1 476 6 025 3 774 1 301 581 135 3 615 23 105
Total people 119 864 25 076 112 772 58 496 23 425 15 775 3 573 50 785 410 003
(a)
(b)
(c)
(d)
(e)
Source :
Data for language spoken at home by Aboriginal and Torres Strait Islander Australians and proficiency in spoken English, by sex 2001, 2006 and 2011 are not
comparable as they are sourced from different Census Collections.
ABS (unpublished) Census of Population and Housing, Australia , Cat. no. 2002.0.
Includes Other Territories.
Includes cases where language spoken at home was stated but proficiency in English was not stated.
Includes non-verbal so described and inadequately described.
Includes cases where both language spoken at home and proficiency in English were not stated.
– Nil or rounded to zero.
INDIGENOUS
COMPENDIUM 2015
STATISTICAL CONTEXT
PAGE 2 of TABLE 2A.15

TABLE 2A.16
Table 2A.16
NSW Vic Qld WA SA Tas ACT NT Aust (b)
Females
Speaks English only 66 734 14 225 55 560 24 041 10 900 8 217 1 826 9 917 191 520
Speaks an Aboriginal and Torres Strait Islander language and speaks English
Very well or well 397 139 4 749 3 362 1 241 22 48 11 230 21 188
Not well 13 10 658 430 238 – – 2 547 3 896
Not at all – 3 193 81 46 – – 744 1 067
Not stated (c) 18 3 120 52 35 – 3 422 653
Total 428 155 5 720 3 925 1 560 22 51 14 943 26 804
Speaks other language (d) 668 418 1 366 294 128 62 27 467 3 437
Not stated (e) 2 200 599 2 246 1 460 521 160 39 1 967 9 195
Total females 70 030 15 397 64 892 29 720 13 109 8 461 1 943 27 294 230 956
Males
Speaks English only 63 403 13 296 52 180 22 429 10 097 8 012 1 799 9 171 180 486
Speaks an Aboriginal and Torres Strait Islander language and speaks English
Very well or well 347 116 4 543 3 139 1 118 11 29 10 357 19 660
Not well 19 8 683 417 214 – 3 2 523 3 867
Not at all – 3 200 89 26 – – 753 1 071
Not stated (c) 12 3 100 46 36 – – 397 594
Total 378 130 5 526 3 691 1 394 11 32 14 030 25 192
Speaks other language (d) 820 511 1 392 327 168 59 43 496 3 828
Not stated (e) 3 877 807 3 590 2 544 789 223 57 2 672 14 566
Total males 68 478 14 744 62 688 28 991 12 448 8 305 1 931 26 369 224 072
All people
Speaks English only 130 137 27 521 107 740 46 470 20 997 16 229 3 625 19 088 372 006
Speaks an Aboriginal and Torres Strait Islander language and speaks English
Very well or well 744 255 9 292 6 501 2 359 33 77 21 587 40 848
Language spoken at home by Aboriginal and Torres Strait Islander Australians and proficiency in spoken English,
by sex, 2006 (number) (a)
INDIGENOUS
COMPENDIUM 2015
STATISTICAL CONTEXT
PAGE 1 of TABLE 2A.16

TABLE 2A.16
Table 2A.16
NSW Vic Qld WA SA Tas ACT NT Aust (b)
Language spoken at home by Aboriginal and Torres Strait Islander Australians and proficiency in spoken English,
by sex, 2006 (number) (a)
Not well 32 18 1 341 847 452 – 3 5 070 7 763
Not at all – 6 393 170 72 – – 1 497 2 138
Not stated (c) 30 6 220 98 71 – 3 819 1 247
Total 806 285 11 246 7 616 2 954 33 83 28 973 51 996
Speaks other language (d) 1 488 929 2 758 621 296 121 70 963 7 265
Not stated (e) 6 077 1 406 5 836 4 004 1 310 383 96 4 639 23 761
Total people 138 508 30 141 127 580 58 711 25 557 16 766 3 874 53 663 455 028
(a)
(b)
(c)
(d)
(e)
Source :
Data for language spoken at home by Aboriginal and Torres Strait Islander Australians and proficiency in spoken English, by sex 2001, 2006 and 2011 are not
comparable as they are sourced from different Census Collections.
ABS (unpublished) 2006 Census of Population and Housing, Cat. no. 2068.0.
Includes Other Territories.
Language (Census code = LANP) stated, proficiency in spoken English (Census code = ENGP) not stated.
Includes inadequately described and non-verbal so described.
Not stated — both language spoken at home (Census code = LANP) and proficiency in spoken English (Census code = ENGP) or just language spoken at home
not stated.
– Nil or rounded to zero.
INDIGENOUS
COMPENDIUM 2015
STATISTICAL CONTEXT
PAGE 2 of TABLE 2A.16
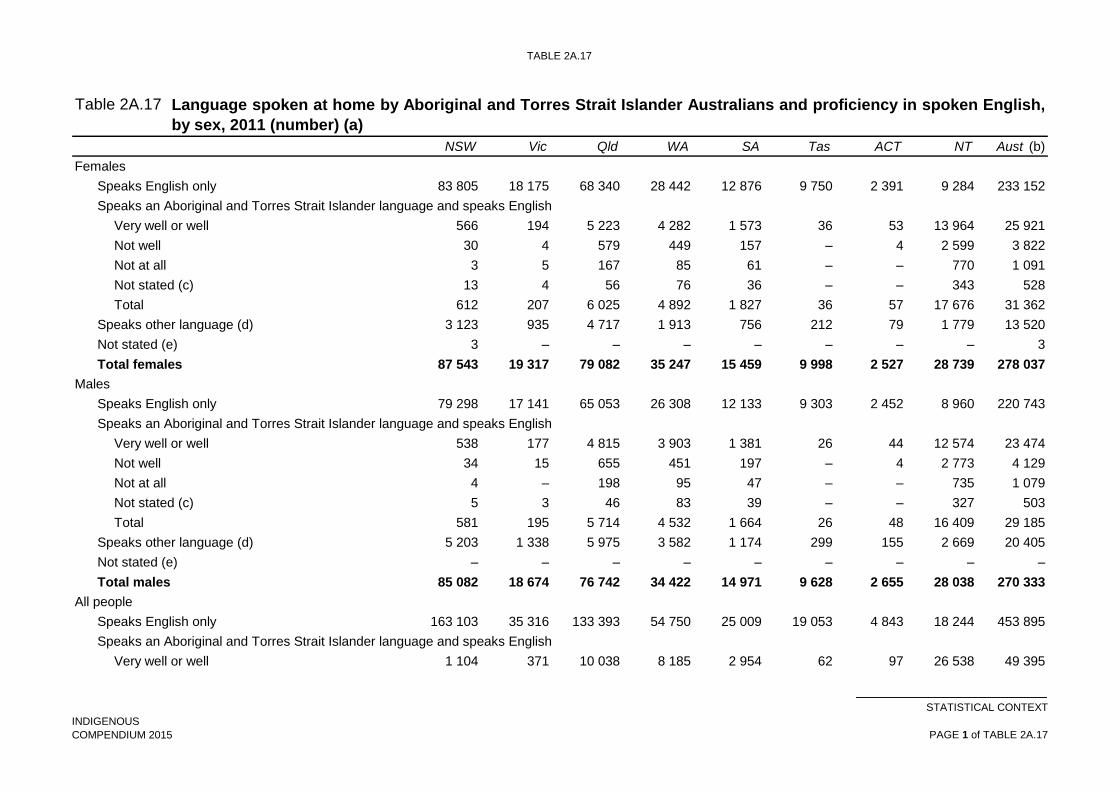
TABLE 2A.17
Table 2A.17
NSW Vic Qld WA SA Tas ACT NT Aust (b)
Females
Speaks English only 83 805 18 175 68 340 28 442 12 876 9 750 2 391 9 284 233 152
Speaks an Aboriginal and Torres Strait Islander language and speaks English
Very well or well 566 194 5 223 4 282 1 573 36 53 13 964 25 921
Not well 30 4 579 449 157 – 4 2 599 3 822
Not at all 3 5 167 85 61 – – 770 1 091
Not stated (c) 13 4 56 76 36 – – 343 528
Total 612 207 6 025 4 892 1 827 36 57 17 676 31 362
Speaks other language (d) 3 123 935 4 717 1 913 756 212 79 1 779 13 520
Not stated (e) 3 – – – – – – – 3
Total females 87 543 19 317 79 082 35 247 15 459 9 998 2 527 28 739 278 037
Males
Speaks English only 79 298 17 141 65 053 26 308 12 133 9 303 2 452 8 960 220 743
Speaks an Aboriginal and Torres Strait Islander language and speaks English
Very well or well 538 177 4 815 3 903 1 381 26 44 12 574 23 474
Not well 34 15 655 451 197 – 4 2 773 4 129
Not at all 4 – 198 95 47 – – 735 1 079
Not stated (c) 5 3 46 83 39 – – 327 503
Total 581 195 5 714 4 532 1 664 26 48 16 409 29 185
Speaks other language (d) 5 203 1 338 5 975 3 582 1 174 299 155 2 669 20 405
Not stated (e) – – – – – – – – –
Total males 85 082 18 674 76 742 34 422 14 971 9 628 2 655 28 038 270 333
All people
Speaks English only 163 103 35 316 133 393 54 750 25 009 19 053 4 843 18 244 453 895
Speaks an Aboriginal and Torres Strait Islander language and speaks English
Very well or well 1 104 371 10 038 8 185 2 954 62 97 26 538 49 395
Language spoken at home by Aboriginal and Torres Strait Islander Australians and proficiency in spoken English,
by sex, 2011 (number) (a)
INDIGENOUS
COMPENDIUM 2015
STATISTICAL CONTEXT
PAGE 1 of TABLE 2A.17

TABLE 2A.17
Table 2A.17
NSW Vic Qld WA SA Tas ACT NT Aust (b)
Language spoken at home by Aboriginal and Torres Strait Islander Australians and proficiency in spoken English,
by sex, 2011 (number) (a)
Not well 64 19 1 234 900 354 – 8 5 372 7 951
Not at all 7 5 365 180 108 – – 1 505 2 170
Not stated (c) 18 7 102 159 75 – – 670 1 031
Total 1 193 402 11 739 9 424 3 491 62 105 34 085 60 547
Speaks other language (d) 8 326 2 273 10 692 5 495 1 930 511 234 4 448 33 925
Not stated (e) 3 – – – – – – – 3
Total people 172 625 37 991 155 824 69 669 30 430 19 626 5 182 56 777 548 370
(a)
(b)
(c)
(d)
(e)
Source :
Not stated — both language spoken at home (Census code = LANP) and proficiency in spoken English (Census code = ENGP) or just language spoken at home
not stated.
– Nil or rounded to zero.
ABS (unpublished) 2011 Census of Population and Housing , Table generated on 4/10/2012 using ABS TableBuilder.
Data for language spoken at home by Aboriginal and Torres Strait Islander Australians and proficiency in spoken English, by sex 2001, 2006 and 2011 are not
comparable as they are sourced from different Census Collections.
Includes Other Territories.
Language (Census code = LANP) stated, proficiency in spoken English (Census code = ENGP) not stated.
Includes inadequately described and non-verbal so described.
INDIGENOUS
COMPENDIUM 2015
STATISTICAL CONTEXT
PAGE 2 of TABLE 2A.17

FAMILY AND HOUSEHOLD
Family and household
INDIGENOUS
COMPENDIUM 2015
STATISTICAL CONTEXT
PAGE 1 of FAMILY AND HOUSEHOLD

TABLE 2A.21
Table 2A.21
Unit NSW Vic Qld WA SA Tas ACT NT Aust
Aboriginal and Torres Strait Islander
Families
Couple with children % 45.8 44.5 47.5 46.3 44.6 53.6 50.4 50.3 47.1
Couple without children % 20.6 24.7 19.6 17.4 19.4 26.0 25.2 18.4 20.2
Sole parent with children % 31.4 28.7 30.3 33.1 33.2 19.4 22.6 28.0 30.2
Other family % 2.2 2.1 2.6 3.2 2.8 1.0 1.8 3.3 2.5
Total '000 32.2 6.9 28.0 13.4 5.7 5.0 1.0 10.8 103.1
People
Couple with children % 57.4 56.1 58.9 57.1 55.6 66.7 62.2 61.6 58.6
Couple without children % 12.2 15.1 11.2 9.7 11.4 15.9 15.4 9.7 11.6
Sole parent with children % 29.0 27.3 28.2 31.0 31.2 16.7 21.2 26.5 28.1
Other family % 1.4 1.4 1.7 2.1 1.8 0.7 1.2 2.2 1.7
Total '000 110.0 22.6 101.3 50.3 19.9 16.4 3.3 45.2 369.2
Non-Indigenous
Families
Couple with children % 47.9 48.8 44.7 46.9 44.1 43.3 48.9 48.6 47.0
Couple without children % 35.2 34.5 38.0 36.7 39.0 38.9 34.0 35.7 36.1
Sole parent with children % 15.1 14.7 15.6 14.7 15.4 16.4 15.5 14.4 15.1
Other family % 1.8 1.9 1.7 1.8 1.6 1.4 1.6 1.3 1.8
Total '000 1 622.3 1 215.8 905.9 466.5 391.8 119.1 79.3 32.4 4 833.7
People
Couple with children % 62.3 63.3 59.2 61.5 58.6 57.9 63.4 63.0 61.5
Couple without children % 23.2 22.6 25.6 24.4 26.6 26.6 22.4 23.4 23.9
Sole parent with children % 13.2 12.7 14.0 12.9 13.6 14.5 13.2 12.7 13.2
Other family % 1.3 1.4 1.2 1.2 1.1 1.0 1.1 0.9 1.3
Total '000 4 909.7 3 694.3 2 669.6 1 385.6 1 136.8 345.1 237.9 96.0 14 476.6
Families and people in families in occupied private dwellings by Indigenous status and family/household
composition, 2001 (a)
INDIGENOUS
COMPENDIUM 2015
STATISTICAL CONTEXT
PAGE 1 of TABLE 2A.21
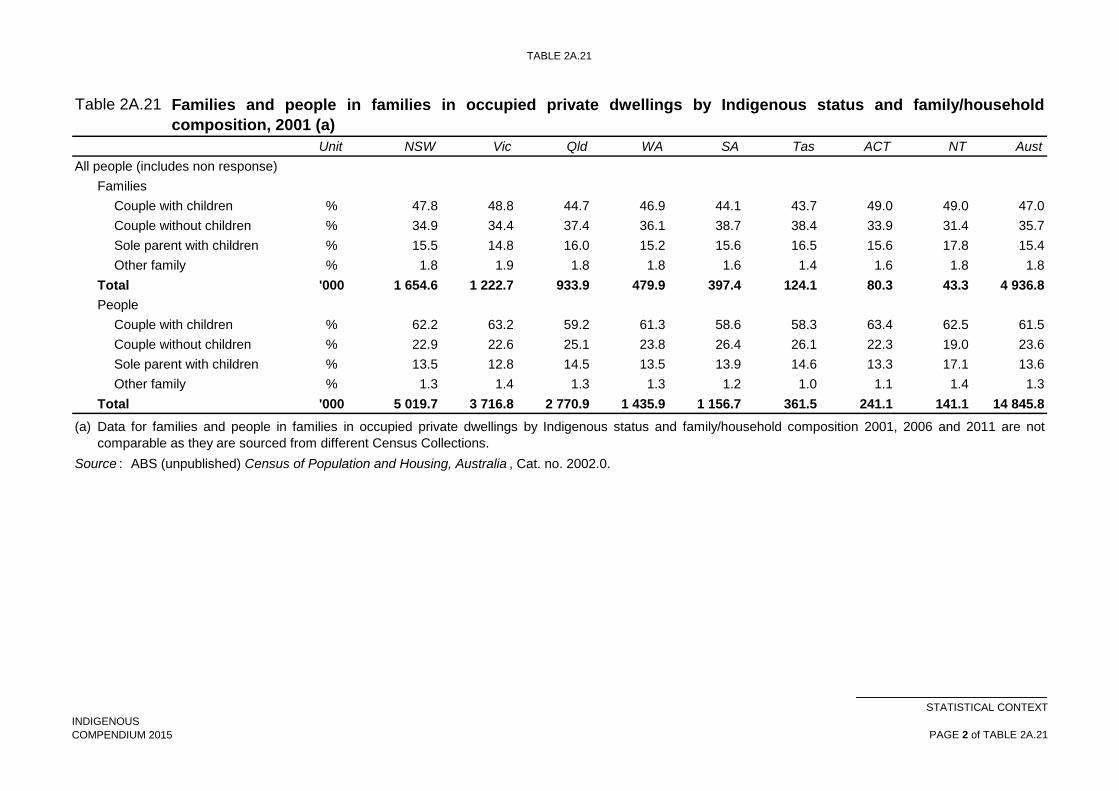
TABLE 2A.21
Table 2A.21
Unit NSW Vic Qld WA SA Tas ACT NT Aust
Families and people in families in occupied private dwellings by Indigenous status and family/household
composition, 2001 (a)
All people (includes non response)
Families
Couple with children % 47.8 48.8 44.7 46.9 44.1 43.7 49.0 49.0 47.0
Couple without children % 34.9 34.4 37.4 36.1 38.7 38.4 33.9 31.4 35.7
Sole parent with children % 15.5 14.8 16.0 15.2 15.6 16.5 15.6 17.8 15.4
Other family % 1.8 1.9 1.8 1.8 1.6 1.4 1.6 1.8 1.8
Total '000 1 654.6 1 222.7 933.9 479.9 397.4 124.1 80.3 43.3 4 936.8
People
Couple with children % 62.2 63.2 59.2 61.3 58.6 58.3 63.4 62.5 61.5
Couple without children % 22.9 22.6 25.1 23.8 26.4 26.1 22.3 19.0 23.6
Sole parent with children % 13.5 12.8 14.5 13.5 13.9 14.6 13.3 17.1 13.6
Other family % 1.3 1.4 1.3 1.3 1.2 1.0 1.1 1.4 1.3
Total '000 5 019.7 3 716.8 2 770.9 1 435.9 1 156.7 361.5 241.1 141.1 14 845.8
(a)
Source : ABS (unpublished) Census of Population and Housing, Australia , Cat. no. 2002.0.
Data for families and people in families in occupied private dwellings by Indigenous status and family/household composition 2001, 2006 and 2011 are not
comparable as they are sourced from different Census Collections.
INDIGENOUS
COMPENDIUM 2015
STATISTICAL CONTEXT
PAGE 2 of TABLE 2A.21
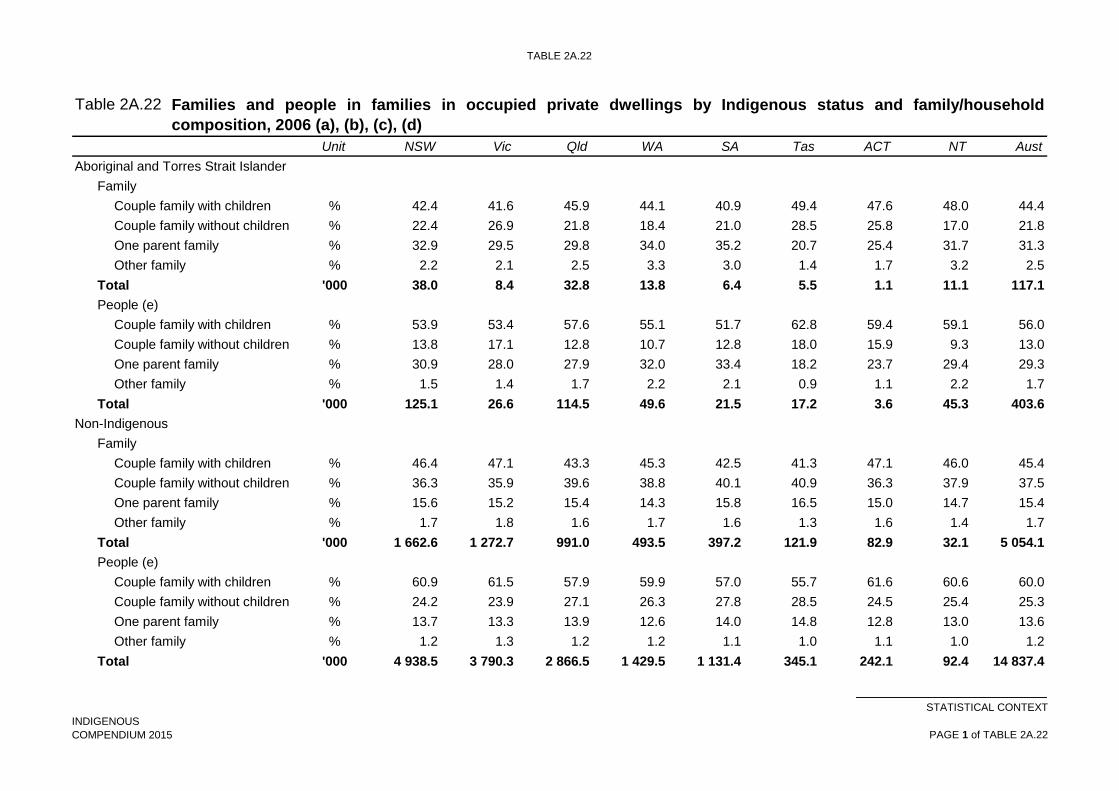
TABLE 2A.22
Table 2A.22
Unit NSW Vic Qld WA SA Tas ACT NT Aust
Aboriginal and Torres Strait Islander
Family
Couple family with children % 42.4 41.6 45.9 44.1 40.9 49.4 47.6 48.0 44.4
Couple family without children % 22.4 26.9 21.8 18.4 21.0 28.5 25.8 17.0 21.8
One parent family % 32.9 29.5 29.8 34.0 35.2 20.7 25.4 31.7 31.3
Other family % 2.2 2.1 2.5 3.3 3.0 1.4 1.7 3.2 2.5
Total '000 38.0 8.4 32.8 13.8 6.4 5.5 1.1 11.1 117.1
People (e)
Couple family with children % 53.9 53.4 57.6 55.1 51.7 62.8 59.4 59.1 56.0
Couple family without children % 13.8 17.1 12.8 10.7 12.8 18.0 15.9 9.3 13.0
One parent family % 30.9 28.0 27.9 32.0 33.4 18.2 23.7 29.4 29.3
Other family % 1.5 1.4 1.7 2.2 2.1 0.9 1.1 2.2 1.7
Total '000 125.1 26.6 114.5 49.6 21.5 17.2 3.6 45.3 403.6
Non-Indigenous
Family
Couple family with children % 46.4 47.1 43.3 45.3 42.5 41.3 47.1 46.0 45.4
Couple family without children % 36.3 35.9 39.6 38.8 40.1 40.9 36.3 37.9 37.5
One parent family % 15.6 15.2 15.4 14.3 15.8 16.5 15.0 14.7 15.4
Other family % 1.7 1.8 1.6 1.7 1.6 1.3 1.6 1.4 1.7
Total '000 1 662.6 1 272.7 991.0 493.5 397.2 121.9 82.9 32.1 5 054.1
People (e)
Couple family with children % 60.9 61.5 57.9 59.9 57.0 55.7 61.6 60.6 60.0
Couple family without children % 24.2 23.9 27.1 26.3 27.8 28.5 24.5 25.4 25.3
One parent family % 13.7 13.3 13.9 12.6 14.0 14.8 12.8 13.0 13.6
Other family % 1.2 1.3 1.2 1.2 1.1 1.0 1.1 1.0 1.2
Total '000 4 938.5 3 790.3 2 866.5 1 429.5 1 131.4 345.1 242.1 92.4 14 837.4
Families and people in families in occupied private dwellings by Indigenous status and family/household
composition, 2006 (a), (b), (c), (d)
INDIGENOUS
COMPENDIUM 2015
STATISTICAL CONTEXT
PAGE 1 of TABLE 2A.22

TABLE 2A.22
Table 2A.22
Unit NSW Vic Qld WA SA Tas ACT NT Aust
Families and people in families in occupied private dwellings by Indigenous status and family/household
composition, 2006 (a), (b), (c), (d)
Total (includes Indigenous status not stated)
Family
Couple family with children % 46.2 46.9 43.3 45.1 42.3 41.4 47.0 46.5 45.3
Couple family without children % 36.0 35.9 39.1 38.3 40.0 40.5 36.2 32.6 37.2
One parent family % 16.1 15.4 15.9 14.8 16.1 16.7 15.1 19.1 15.8
Other family % 1.7 1.9 1.7 1.7 1.6 1.4 1.6 1.9 1.7
Total '000 1 716.2 1 294.4 1 032.0 511.9 407.5 128.7 84.5 43.4 5 219.2
People
Couple family with children % 60.5 61.3 57.7 59.6 56.7 55.8 61.4 60.0 59.7
Couple family without children % 24.1 24.0 26.6 25.8 27.7 28.2 24.4 20.1 25.0
One parent family % 14.2 13.4 14.5 13.3 14.4 15.0 13.0 18.5 14.0
Other family % 1.2 1.3 1.2 1.3 1.2 1.0 1.1 1.4 1.2
Total '000 5 105.8 3 852.3 3 002.7 1 490.9 1 162.4 365.7 247.1 138.4 15 367.0
(a)
(b)
(c)
(d)
(e)
Source :
Data for families and people in families in occupied private dwellings by Indigenous status and family/household composition 2001, 2006 and 2011 are not
comparable as they are sourced from different Census Collections.
ABS (unpublished) 2006 Census of Population and Housing, Cat. no. 2068.0.
An Aboriginal and Torres Strait Islander Australian family is a family where either the reference person and/or spouse/partner is of Aboriginal and/or Torres Strait
Islander origin.
Excludes family members who were temporarily absent on Census Night.
Cells in this table have been randomly adjusted to avoid the release of confidential data.
Includes members of an 'Aboriginal and Torres Strait Islander Australians' and 'Other' family who are of Indigenous, non-Indigenous or not stated status.
INDIGENOUS
COMPENDIUM 2015
STATISTICAL CONTEXT
PAGE 2 of TABLE 2A.22

TABLE 2A.23
Table 2A.23
Unit NSW Vic Qld WA SA Tas ACT NT Aust
Aboriginal and Torres Strait Islander
Family
Couple family with children % 41.9 41.6 44.2 42.0 39.1 47.7 44.2 47.8 43.2
Couple family without children % 24.4 28.2 23.2 20.3 23.7 30.3 28.7 18.1 23.6
One parent family % 31.5 28.0 29.9 34.5 34.0 21.1 24.6 31.2 30.7
Other family % 2.2 2.2 2.7 3.2 3.1 1.0 2.5 2.9 2.5
Total '000 47.7 10.7 40.8 16.5 7.7 6.4 1.5 12.2 143.6
People (e)
Couple family with children % 53.6 54.2 56.1 52.9 50.2 60.8 56.7 59.2 55.0
Couple family without children % 15.3 18.2 13.9 11.9 14.9 19.6 18.7 10.1 14.4
One parent family % 29.6 26.1 28.1 33.0 32.6 19.0 22.9 28.7 28.9
Other family % 1.5 1.5 1.8 2.2 2.2 0.7 1.7 2.0 1.7
Total '000 154.8 33.5 138.9 57.8 25.0 19.8 4.8 48.3 483.0
Non-Indigenous (f)
Family
Couple family with children % 45.7 46.2 42.8 45.1 41.7 39.4 46.4 45.9 44.7
Couple family without children % 36.9 36.7 40.0 39.3 40.8 42.6 37.8 39.5 38.2
One parent family % 15.8 15.3 15.5 13.9 15.9 16.7 14.4 13.3 15.4
Other family % 1.7 1.8 1.6 1.7 1.6 1.3 1.5 1.4 1.7
Total '000 1 769.5 1 393.0 1 100.5 565.0 419.5 126.9 91.5 35.5 5 501.9
People (d)
Couple family with children % 60.0 60.6 57.4 59.7 56.1 53.8 60.8 60.6 59.2
Couple family without children % 24.8 24.7 27.5 26.7 28.5 30.0 25.7 26.7 25.9
One parent family % 13.9 13.4 14.0 12.3 14.2 15.2 12.4 11.7 13.7
Other family % 1.2 1.3 1.2 1.3 1.2 0.9 1.1 1.0 1.2
Total '000 5 220.8 4 112.2 3 165.8 1 624.9 1 186.4 354.0 264.9 101.9 16 032.3
Families and people in families in occupied private dwellings by Indigenous status and family/household
composition, 2011 (a), (b), (c), (d)
INDIGENOUS
COMPENDIUM 2015
STATISTICAL CONTEXT
PAGE 1 of TABLE 2A.23
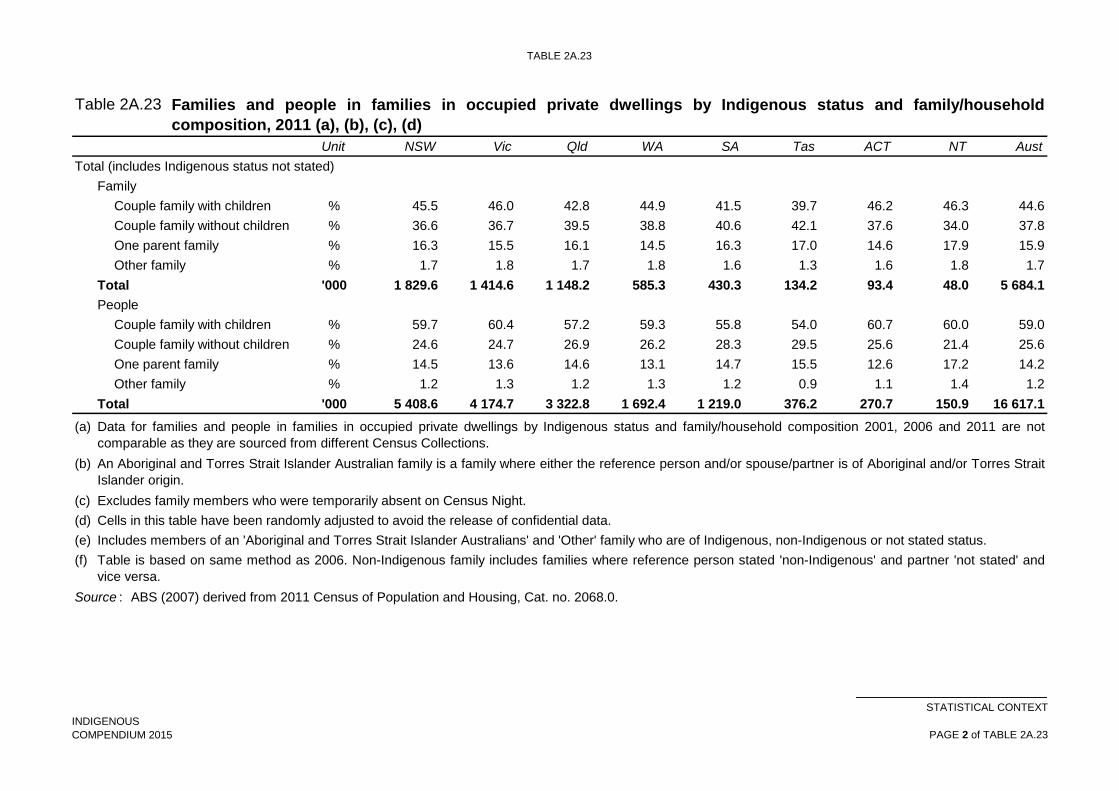
TABLE 2A.23
Table 2A.23
Unit NSW Vic Qld WA SA Tas ACT NT Aust
Families and people in families in occupied private dwellings by Indigenous status and family/household
composition, 2011 (a), (b), (c), (d)
Total (includes Indigenous status not stated)
Family
Couple family with children % 45.5 46.0 42.8 44.9 41.5 39.7 46.2 46.3 44.6
Couple family without children % 36.6 36.7 39.5 38.8 40.6 42.1 37.6 34.0 37.8
One parent family % 16.3 15.5 16.1 14.5 16.3 17.0 14.6 17.9 15.9
Other family % 1.7 1.8 1.7 1.8 1.6 1.3 1.6 1.8 1.7
Total '000 1 829.6 1 414.6 1 148.2 585.3 430.3 134.2 93.4 48.0 5 684.1
People
Couple family with children % 59.7 60.4 57.2 59.3 55.8 54.0 60.7 60.0 59.0
Couple family without children % 24.6 24.7 26.9 26.2 28.3 29.5 25.6 21.4 25.6
One parent family % 14.5 13.6 14.6 13.1 14.7 15.5 12.6 17.2 14.2
Other family % 1.2 1.3 1.2 1.3 1.2 0.9 1.1 1.4 1.2
Total '000 5 408.6 4 174.7 3 322.8 1 692.4 1 219.0 376.2 270.7 150.9 16 617.1
(a)
(b)
(c)
(d)
(e)
(f)
Source : ABS (2007) derived from 2011 Census of Population and Housing, Cat. no. 2068.0.
Data for families and people in families in occupied private dwellings by Indigenous status and family/household composition 2001, 2006 and 2011 are not
comparable as they are sourced from different Census Collections.
An Aboriginal and Torres Strait Islander Australian family is a family where either the reference person and/or spouse/partner is of Aboriginal and/or Torres Strait
Islander origin.
Excludes family members who were temporarily absent on Census Night.
Cells in this table have been randomly adjusted to avoid the release of confidential data.
Table is based on same method as 2006. Non-Indigenous family includes families where reference person stated 'non-Indigenous' and partner 'not stated' and
vice versa.
Includes members of an 'Aboriginal and Torres Strait Islander Australians' and 'Other' family who are of Indigenous, non-Indigenous or not stated status.
INDIGENOUS
COMPENDIUM 2015
STATISTICAL CONTEXT
PAGE 2 of TABLE 2A.23

INCOME AND EMPLOYMENT
Income, education
and employment
INDIGENOUS
COMPENDIUM 2015
STATISTICAL CONTEXT
PAGE 1 of INCOME AND EMPLOYMENT

TABLE 2A.32
Table 2A.32
Unit NSW Vic Qld WA SA Tas ACT NT Aust (c)
Aboriginal and Torres Strait Islander Australians
Nil income % 6.9 6.5 6.7 6.2 6.6 6.8 8.0 5.8 6.5
$1–$119 % 7.3 7.7 7.6 6.7 8.2 9.2 6.9 6.8 7.4
$120–$199 % 23.1 19.3 23.7 29.8 28.5 22.1 15.4 49.8 27.7
$200–$399 % 24.4 23.6 25.6 24.2 24.3 26.5 17.4 17.7 23.8
$400–$599 % 13.9 15.3 14.3 10.5 11.7 16.3 13.8 5.6 12.5
$600–$799 % 7.0 8.3 6.8 5.4 6.0 7.8 12.8 3.4 6.4
$800–$999 % 3.4 4.2 2.6 2.6 2.8 3.4 9.4 1.5 2.9
$1000 or more % 4.1 4.5 2.8 3.3 2.6 2.7 11.5 1.3 3.2
Not stated % 9.9 10.5 9.9 11.5 9.3 5.1 4.8 8.1 9.7
Total '000 71.8 15.3 67.6 35.6 14.4 9.5 2.2 32.5 249.1
Non-Indigenous
Nil income % 6.7 6.3 5.9 6.7 5.3 5.1 5.9 5.3 6.3
$1–$119 % 6.2 7.0 6.6 7.3 6.8 6.9 7.0 4.4 6.6
$120–$199 % 13.5 13.9 14.2 13.3 16.0 17.8 9.1 7.8 13.9
$200–$399 % 20.3 20.4 22.9 20.9 23.7 25.2 15.4 14.4 21.1
$400–$599 % 15.2 16.0 17.0 15.8 17.2 16.2 13.9 17.2 15.9
$600–$799 % 10.8 11.1 10.8 10.9 11.0 9.9 13.1 15.1 11.0
$800–$999 % 6.7 6.7 6.1 7.0 6.2 5.8 10.6 10.1 6.7
$1000 or more % 12.4 10.6 9.0 11.1 7.9 6.5 19.7 15.2 10.8
Not stated % 8.2 8.0 7.4 7.0 5.8 6.5 5.3 10.5 7.6
Total '000 4 926.0 3 596.6 2 751.3 1 367.5 1 099.9 285.5 171.8 81.8 14 785.0
Total (including Indigenous status not stated)
Nil income % 6.7 6.3 6.0 6.7 5.3 5.2 5.9 5.4 6.3
$1–$119 % 6.2 7.0 6.7 7.2 6.8 6.9 7.0 4.9 6.7
$120–$199 % 13.7 13.9 14.5 13.7 16.2 17.9 9.1 16.7 14.1
$200–$399 % 20.4 20.4 23.0 20.9 23.7 25.3 15.4 15.1 21.2
$400–$599 % 15.1 15.9 16.9 15.6 17.1 16.2 13.9 14.7 15.9
$600–$799 % 10.8 11.1 10.7 10.8 10.9 9.9 13.1 12.6 10.9
$800–$999 % 6.7 6.7 6.0 6.9 6.2 5.7 10.6 8.3 6.6
$1000 or more % 12.3 10.6 8.8 10.9 7.8 6.4 19.6 12.3 10.7
Not stated % 8.2 8.0 7.5 7.1 5.8 6.5 5.3 10.0 7.6
Total '000 4 997.8 3 668.4 2 823.1 1 439.3 1 171.7 357.3 243.6 153.6 14 856.8
(a)
(b)
(c)
Source :
Data for people aged 15 years or over, by weekly individual income and Indigenous status 2001, 2006
and 2011 are not comparable as they are sourced from different Census Collections.
Disaggregation of weekly individual income differs among the 2001, 2006 and 2011 Census.
People aged 15 years or over by weekly individual income and
Indigenous status, 2001 (a), (b)
ABS (unpublished) Census of Population and Housing, Australia , Cat. no. 2002.0.
Includes Other Territories.
INDIGENOUS
COMPENDIUM 2015
STATISTICAL CONTEXT
PAGE 1 of TABLE 2A.32

TABLE 2A.33
Table 2A.33
Unit NSW Vic Qld WA SA Tas ACT NT Aust (c)
Aboriginal and Torres Strait Islander Australians
Nil income % 8.1 8.9 8.4 7.9 7.5 7.4 7.9 8.2 8.2
$1–$149 % 9.0 9.0 7.6 7.5 9.4 9.3 8.5 8.6 8.4
$150–$249 % 22.2 17.9 21.5 26.7 25.6 21.7 14.0 41.2 24.8
$250–$399 % 15.6 15.3 15.6 14.0 15.7 17.2 11.7 13.8 15.2
$400–$599 % 13.7 14.5 15.4 11.0 12.1 16.3 9.7 6.4 12.9
$600–$799 % 7.8 9.1 8.8 6.4 7.1 9.2 9.0 3.7 7.5
$800–$999 % 4.6 5.6 5.0 3.9 4.3 5.8 11.2 2.5 4.5
$1000–$1299 % 3.8 4.2 3.8 3.4 3.3 4.1 10.6 2.0 3.6
$1300–$1599 % 1.8 1.7 1.6 1.8 1.4 1.5 6.1 0.8 1.6
$1600–$1999 % 0.9 0.9 0.9 1.2 0.5 0.6 4.1 0.4 0.8
$2000 or more % 0.9 1.4 0.8 1.1 0.8 0.6 2.0 0.3 0.9
Not stated % 11.6 11.5 10.7 15.2 12.3 6.3 5.2 12.0 11.6
Total '000 85.3 19.0 78.0 37.0 16.3 10.7 2.5 35.0 283.9
Non-Indigenous
Nil income % 8.2 7.9 6.6 7.3 6.4 5.8 6.1 5.8 7.5
$1–$149 % 7.0 7.8 7.0 7.3 7.3 7.2 6.7 4.9 7.2
$150–$249 % 14.6 14.5 13.8 12.8 16.3 18.1 8.7 7.4 14.3
$250–$399 % 13.4 13.2 13.9 13.0 15.1 16.6 9.3 8.3 13.5
$400–$599 % 13.7 14.2 15.7 13.7 15.2 15.8 11.3 13.3 14.3
$600–$799 % 10.7 11.2 12.1 11.2 11.9 11.5 10.4 14.7 11.3
$800–$999 % 8.0 8.5 8.6 8.7 8.4 7.6 10.7 12.5 8.4
$1000–$1299 % 7.9 8.0 8.4 9.1 7.7 7.2 13.3 13.6 8.2
$1300–$1599 % 4.9 4.1 4.2 5.1 3.7 3.2 8.9 7.9 4.5
$1600–$1999 % 2.9 2.4 2.4 3.3 1.8 1.4 5.9 3.9 2.7
$2000 or more % 4.3 3.5 3.1 4.5 2.3 1.7 6.2 4.1 3.7
Not stated % 4.4 4.7 4.4 4.2 4.0 4.0 2.4 3.6 4.4
Total '000 4 850.4 3 747.9 2 841.1 1 425.0 1 160.9 353.6 247.3 97.6 14 725.2
Total (including Indigenous status not stated)
Nil income % 7.8 7.6 6.4 6.9 6.2 5.7 5.9 6.0 7.2
$1–$149 % 6.7 7.5 6.6 6.9 7.0 7.0 6.5 5.4 6.9
$150–$249 % 14.1 14.0 13.4 12.5 16.0 17.7 8.5 15.0 13.9
$250–$399 % 12.8 12.7 13.3 12.3 14.7 16.1 9.0 9.0 13.0
$400–$599 % 13.0 13.6 14.9 12.9 14.7 15.3 10.9 10.6 13.6
$600–$799 % 10.1 10.6 11.4 10.5 11.3 11.0 10.0 10.9 10.6
$800–$999 % 7.5 8.1 8.0 8.1 8.0 7.2 10.3 9.1 7.9
$1000–$1299 % 7.4 7.6 7.8 8.4 7.3 6.8 12.7 9.7 7.7
$1300–$1599 % 4.6 3.9 3.9 4.7 3.5 3.0 8.5 5.5 4.2
$1600–$1999 % 2.7 2.3 2.2 3.0 1.8 1.3 5.6 2.7 2.5
$2000 or more % 4.1 3.3 2.9 4.1 2.2 1.6 5.9 2.9 3.5
Not stated % 9.1 8.8 9.1 9.6 7.4 7.3 6.2 13.2 8.9
Total '000 5 250.3 3 982.0 3 098.0 1 562.7 1 233.5 382.5 262.1 145.3 15 918.1
(a)
People aged 15 years or over by weekly individual income and Indigenous
status, 2006 (a), (b)
Data for people aged 15 years or over, by weekly individual income and Indigenous status 2001, 2006 and
2011 are not comparable as they are sourced from different Census Collections.
INDIGENOUS
COMPENDIUM 2015
STATISTICAL CONTEXT
PAGE 1 of TABLE 2A.33

TABLE 2A.33
Table 2A.33
Unit NSW Vic Qld WA SA Tas ACT NT Aust (c)
People aged 15 years or over by weekly individual income and Indigenous
status, 2006 (a), (b)
(b)
(c)
Source : ABS (unpublished) 2006 Census of Population and Housing, Cat. no. 2068.0, Canberra.
Includes Other Territories.
Disaggregation of weekly individual income differs among the 2001, 2006 and 2011 Census.
INDIGENOUS
COMPENDIUM 2015
STATISTICAL CONTEXT
PAGE 2 of TABLE 2A.33
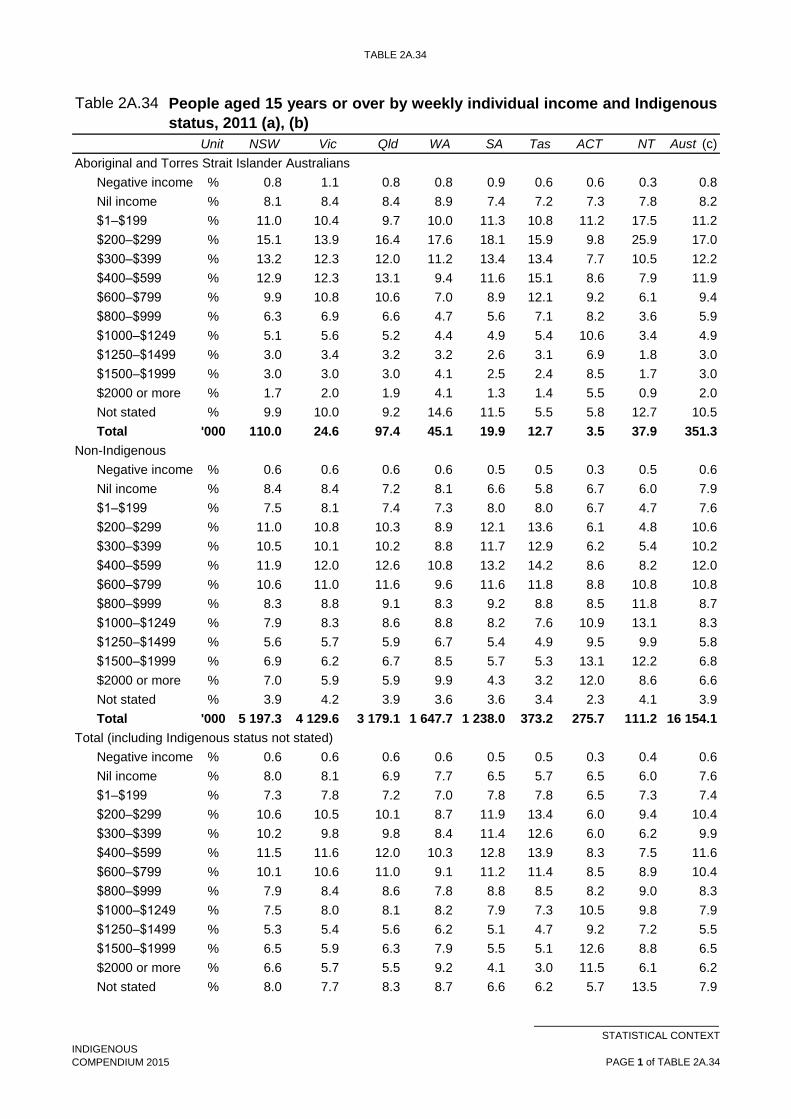
TABLE 2A.34
Table 2A.34
Unit NSW Vic Qld WA SA Tas ACT NT Aust (c)
Aboriginal and Torres Strait Islander Australians
Negative income % 0.8 1.1 0.8 0.8 0.9 0.6 0.6 0.3 0.8
Nil income % 8.1 8.4 8.4 8.9 7.4 7.2 7.3 7.8 8.2
$1–$199 % 11.0 10.4 9.7 10.0 11.3 10.8 11.2 17.5 11.2
$200–$299 % 15.1 13.9 16.4 17.6 18.1 15.9 9.8 25.9 17.0
$300–$399 % 13.2 12.3 12.0 11.2 13.4 13.4 7.7 10.5 12.2
$400–$599 % 12.9 12.3 13.1 9.4 11.6 15.1 8.6 7.9 11.9
$600–$799 % 9.9 10.8 10.6 7.0 8.9 12.1 9.2 6.1 9.4
$800–$999 % 6.3 6.9 6.6 4.7 5.6 7.1 8.2 3.6 5.9
$1000–$1249 % 5.1 5.6 5.2 4.4 4.9 5.4 10.6 3.4 4.9
$1250–$1499 % 3.0 3.4 3.2 3.2 2.6 3.1 6.9 1.8 3.0
$1500–$1999 % 3.0 3.0 3.0 4.1 2.5 2.4 8.5 1.7 3.0
$2000 or more % 1.7 2.0 1.9 4.1 1.3 1.4 5.5 0.9 2.0
Not stated % 9.9 10.0 9.2 14.6 11.5 5.5 5.8 12.7 10.5
Total '000 110.0 24.6 97.4 45.1 19.9 12.7 3.5 37.9 351.3
Non-Indigenous
Negative income % 0.6 0.6 0.6 0.6 0.5 0.5 0.3 0.5 0.6
Nil income % 8.4 8.4 7.2 8.1 6.6 5.8 6.7 6.0 7.9
$1–$199 % 7.5 8.1 7.4 7.3 8.0 8.0 6.7 4.7 7.6
$200–$299 % 11.0 10.8 10.3 8.9 12.1 13.6 6.1 4.8 10.6
$300–$399 % 10.5 10.1 10.2 8.8 11.7 12.9 6.2 5.4 10.2
$400–$599 % 11.9 12.0 12.6 10.8 13.2 14.2 8.6 8.2 12.0
$600–$799 % 10.6 11.0 11.6 9.6 11.6 11.8 8.8 10.8 10.8
$800–$999 % 8.3 8.8 9.1 8.3 9.2 8.8 8.5 11.8 8.7
$1000–$1249 % 7.9 8.3 8.6 8.8 8.2 7.6 10.9 13.1 8.3
$1250–$1499 % 5.6 5.7 5.9 6.7 5.4 4.9 9.5 9.9 5.8
$1500–$1999 % 6.9 6.2 6.7 8.5 5.7 5.3 13.1 12.2 6.8
$2000 or more % 7.0 5.9 5.9 9.9 4.3 3.2 12.0 8.6 6.6
Not stated % 3.9 4.2 3.9 3.6 3.6 3.4 2.3 4.1 3.9
Total '000 5 197.3 4 129.6 3 179.1 1 647.7 1 238.0 373.2 275.7 111.2 16 154.1
Total (including Indigenous status not stated)
Negative income % 0.6 0.6 0.6 0.6 0.5 0.5 0.3 0.4 0.6
Nil income % 8.0 8.1 6.9 7.7 6.5 5.7 6.5 6.0 7.6
$1–$199 % 7.3 7.8 7.2 7.0 7.8 7.8 6.5 7.3 7.4
$200–$299 % 10.6 10.5 10.1 8.7 11.9 13.4 6.0 9.4 10.4
$300–$399 % 10.2 9.8 9.8 8.4 11.4 12.6 6.0 6.2 9.9
$400–$599 % 11.5 11.6 12.0 10.3 12.8 13.9 8.3 7.5 11.6
$600–$799 % 10.1 10.6 11.0 9.1 11.2 11.4 8.5 8.9 10.4
$800–$999 % 7.9 8.4 8.6 7.8 8.8 8.5 8.2 9.0 8.3
$1000–$1249 % 7.5 8.0 8.1 8.2 7.9 7.3 10.5 9.8 7.9
$1250–$1499 % 5.3 5.4 5.6 6.2 5.1 4.7 9.2 7.2 5.5
$1500–$1999 % 6.5 5.9 6.3 7.9 5.5 5.1 12.6 8.8 6.5
$2000 or more % 6.6 5.7 5.5 9.2 4.1 3.0 11.5 6.1 6.2
Not stated % 8.0 7.7 8.3 8.7 6.6 6.2 5.7 13.5 7.9
People aged 15 years or over by weekly individual income and Indigenous
status, 2011 (a), (b)
INDIGENOUS
COMPENDIUM 2015
STATISTICAL CONTEXT
PAGE 1 of TABLE 2A.34
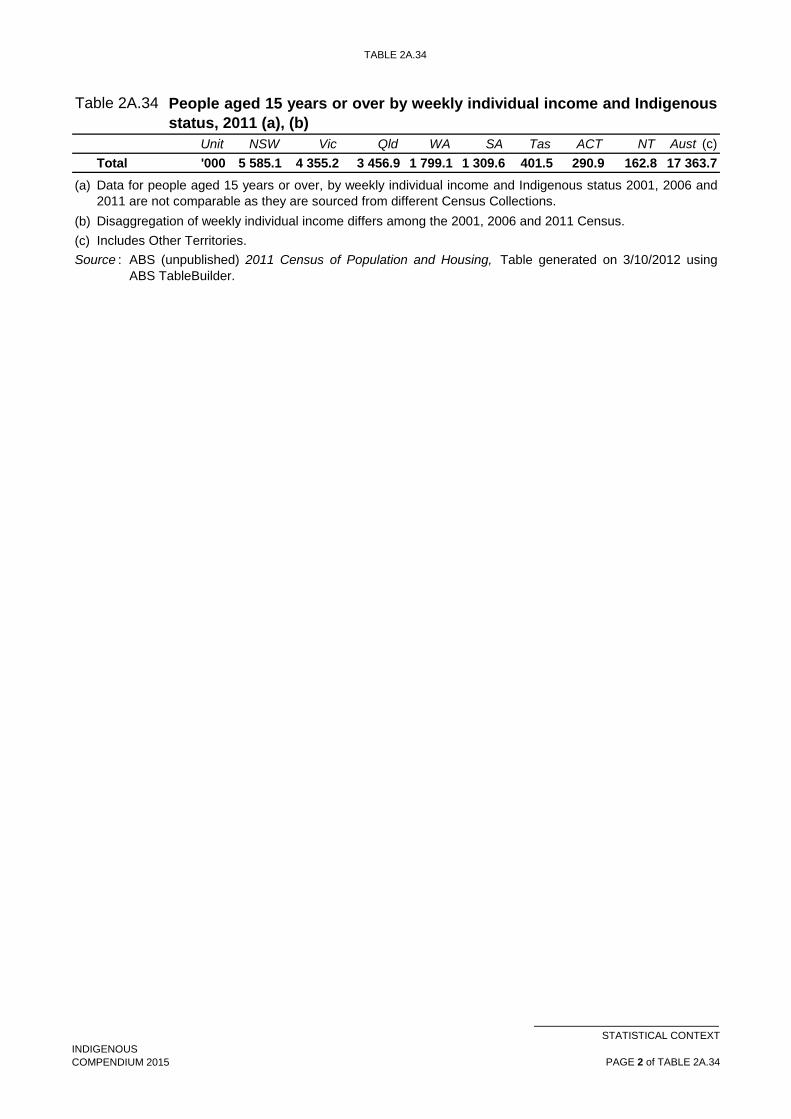
TABLE 2A.34
Table 2A.34
Unit NSW Vic Qld WA SA Tas ACT NT Aust (c)
People aged 15 years or over by weekly individual income and Indigenous
status, 2011 (a), (b)
Total '000 5 585.1 4 355.2 3 456.9 1 799.1 1 309.6 401.5 290.9 162.8 17 363.7
(a)
(b)
(c)
Source :
Data for people aged 15 years or over, by weekly individual income and Indigenous status 2001, 2006 and
2011 are not comparable as they are sourced from different Census Collections.
Disaggregation of weekly individual income differs among the 2001, 2006 and 2011 Census.
Includes Other Territories.
ABS (unpublished) 2011 Census of Population and Housing, Table generated on 3/10/2012 using
ABS TableBuilder.
INDIGENOUS
COMPENDIUM 2015
STATISTICAL CONTEXT
PAGE 2 of TABLE 2A.34
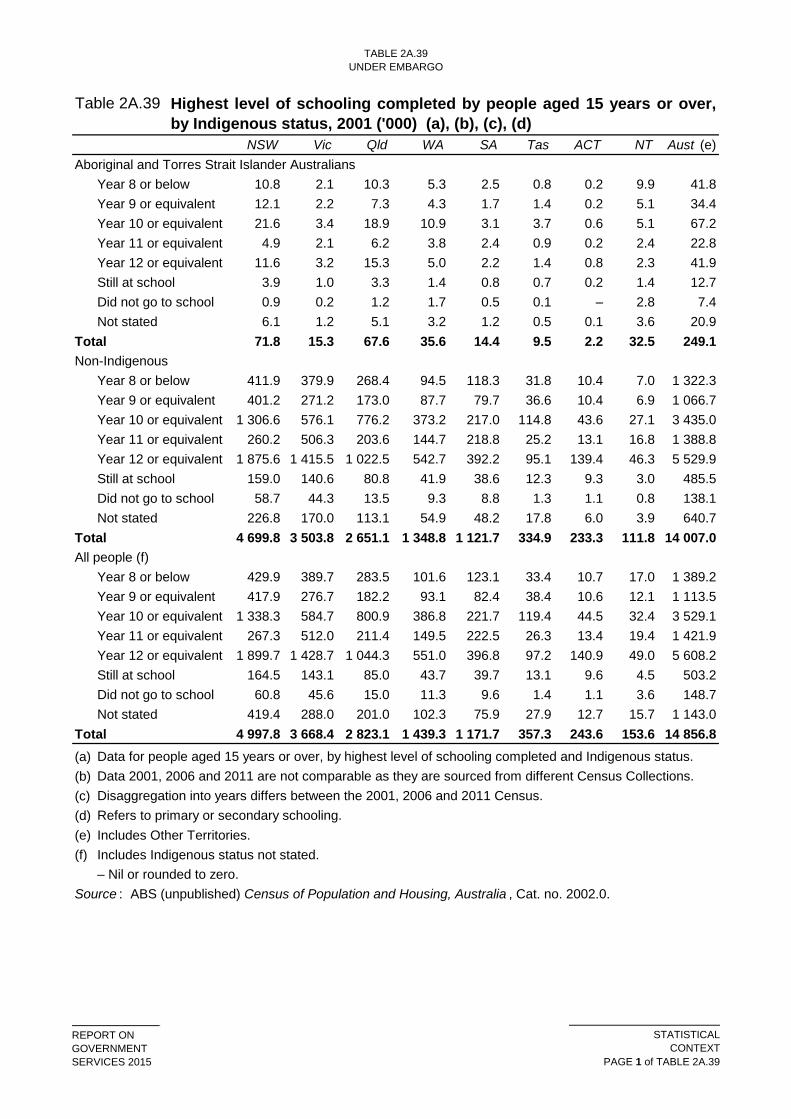
TABLE 2A.39
UNDER EMBARGO
Table 2A.39
NSW Vic Qld WA SA Tas ACT NT Aust (e)
Aboriginal and Torres Strait Islander Australians
Year 8 or below 10.8 2.1 10.3 5.3 2.5 0.8 0.2 9.9 41.8
Year 9 or equivalent 12.1 2.2 7.3 4.3 1.7 1.4 0.2 5.1 34.4
Year 10 or equivalent 21.6 3.4 18.9 10.9 3.1 3.7 0.6 5.1 67.2
Year 11 or equivalent 4.9 2.1 6.2 3.8 2.4 0.9 0.2 2.4 22.8
Year 12 or equivalent 11.6 3.2 15.3 5.0 2.2 1.4 0.8 2.3 41.9
Still at school 3.9 1.0 3.3 1.4 0.8 0.7 0.2 1.4 12.7
Did not go to school 0.9 0.2 1.2 1.7 0.5 0.1 – 2.8 7.4
Not stated 6.1 1.2 5.1 3.2 1.2 0.5 0.1 3.6 20.9
Total 71.8 15.3 67.6 35.6 14.4 9.5 2.2 32.5 249.1
Non-Indigenous
Year 8 or below 411.9 379.9 268.4 94.5 118.3 31.8 10.4 7.0 1 322.3
Year 9 or equivalent 401.2 271.2 173.0 87.7 79.7 36.6 10.4 6.9 1 066.7
Year 10 or equivalent 1 306.6 576.1 776.2 373.2 217.0 114.8 43.6 27.1 3 435.0
Year 11 or equivalent 260.2 506.3 203.6 144.7 218.8 25.2 13.1 16.8 1 388.8
Year 12 or equivalent 1 875.6 1 415.5 1 022.5 542.7 392.2 95.1 139.4 46.3 5 529.9
Still at school 159.0 140.6 80.8 41.9 38.6 12.3 9.3 3.0 485.5
Did not go to school 58.7 44.3 13.5 9.3 8.8 1.3 1.1 0.8 138.1
Not stated 226.8 170.0 113.1 54.9 48.2 17.8 6.0 3.9 640.7
Total 4 699.8 3 503.8 2 651.1 1 348.8 1 121.7 334.9 233.3 111.8 14 007.0
All people (f)
Year 8 or below 429.9 389.7 283.5 101.6 123.1 33.4 10.7 17.0 1 389.2
Year 9 or equivalent 417.9 276.7 182.2 93.1 82.4 38.4 10.6 12.1 1 113.5
Year 10 or equivalent 1 338.3 584.7 800.9 386.8 221.7 119.4 44.5 32.4 3 529.1
Year 11 or equivalent 267.3 512.0 211.4 149.5 222.5 26.3 13.4 19.4 1 421.9
Year 12 or equivalent 1 899.7 1 428.7 1 044.3 551.0 396.8 97.2 140.9 49.0 5 608.2
Still at school 164.5 143.1 85.0 43.7 39.7 13.1 9.6 4.5 503.2
Did not go to school 60.8 45.6 15.0 11.3 9.6 1.4 1.1 3.6 148.7
Not stated 419.4 288.0 201.0 102.3 75.9 27.9 12.7 15.7 1 143.0
Total 4 997.8 3 668.4 2 823.1 1 439.3 1 171.7 357.3 243.6 153.6 14 856.8
(a)
(b)
(c)
(d)
(e)
(f)
Source :
Disaggregation into years differs between the 2001, 2006 and 2011 Census.
Data for people aged 15 years or over, by highest level of schooling completed and Indigenous status.
Highest level of schooling completed by people aged 15 years or over,
by Indigenous status, 2001 ('000) (a), (b), (c), (d)
ABS (unpublished) Census of Population and Housing, Australia , Cat. no. 2002.0.
Refers to primary or secondary schooling.
Includes Other Territories.
Includes Indigenous status not stated.
Data 2001, 2006 and 2011 are not comparable as they are sourced from different Census Collections.
– Nil or rounded to zero.
REPORT ON
GOVERNMENT
SERVICES 2015
STATISTICAL
CONTEXT
PAGE 1 of TABLE 2A.39

TABLE 2A.40
Table 2A.40
NSW Vic Qld WA SA Tas ACT NT Aust (d)
Aboriginal and Torres Strait Islander Australians (e)
Year 8 or below (f) 11.2 2.5 10.3 5.3 2.5 0.9 0.2 13.3 46.3
Year 9 14.6 2.6 8.3 3.8 1.8 1.5 0.2 4.3 37.2
Year 10 26.6 4.5 22.3 11.4 3.9 4.3 0.7 5.7 79.5
Year 11 6.8 2.7 8.7 4.7 3.1 1.1 0.2 3.2 30.5
Year 12 16.0 4.3 19.9 6.1 2.8 2.1 1.0 3.0 55.1
Total (g) 85.3 19.0 78.0 37.0 16.3 10.7 2.5 35.0 283.9
Non-Indigenous
Year 8 or below (f) 386.4 367.2 229.1 79.8 105.3 27.3 10.0 5.0 1 210.5
Year 9 394.4 281.4 170.7 80.3 77.7 36.9 11.4 5.6 1 058.4
Year 10 1 314.7 619.0 803.5 374.5 221.4 121.2 43.4 22.7 3 520.5
Year 11 301.8 540.7 243.3 165.5 231.9 30.6 14.6 15.0 1 543.6
Year 12 2 189.4 1 732.1 1 250.4 651.8 465.3 116.6 160.8 45.3 6 612.3
Total (g) 4 850.4 3 747.9 2 841.1 1 425.0 1 160.9 353.6 247.3 97.6 14 725.2
Not stated
Year 8 or below (f) 7.9 8.0 4.7 1.9 2.6 0.7 0.2 0.1 26.2
Year 9 5.5 4.1 2.1 1.3 1.2 0.6 0.1 0.1 15.2
Year 10 14.3 7.5 7.6 4.1 2.5 1.4 0.4 0.3 38.1
Year 11 3.5 5.4 2.3 1.6 2.1 0.3 0.1 0.2 15.5
Year 12 19.1 15.9 9.3 5.4 3.8 1.0 0.9 0.4 55.8
Total (g) 314.6 215.2 179.0 100.6 56.4 18.2 12.3 12.6 908.9
Total
Year 8 or below (f) 405.5 377.7 244.1 87.0 110.4 29.0 10.4 18.4 1 283.0
Year 9 414.4 288.1 181.1 85.5 80.7 39.1 11.8 10.0 1 110.9
Year 10 1 355.6 631.0 833.5 389.9 227.9 126.8 44.4 28.7 3 638.0
Year 11 312.2 548.8 254.3 171.7 237.0 32.0 15.0 18.4 1 589.6
Year 12 2 224.5 1 752.3 1 279.7 663.3 471.9 119.7 162.7 48.6 6 723.2
Total (g) 5 250.3 3 982.0 3 098.0 1 562.7 1 233.5 382.5 262.1 145.3 15 918.1
(a)
(b)
(c)
(d)
(e)
(f)
(g)
Source :
Data for highest level of schooling completed by people aged 15 years or over (excluding people still
attending secondary school).
Disaggregation into years differs between the 2001, 2006 and 2011 Census.
Highest level of schooling completed by people aged 15 years or over,
by Indigenous status (excluding people still attending secondary
school), 2006 ('000) (a), (b), (c)
ABS (unpublished) 2006 Census of Population and Housing, Cat. no. 2068.0.
Includes 'Aboriginal', 'Torres Strait Islander' and 'Both Aboriginal and Torres Strait Islander'.
Includes people who have never been to school.
Includes Other Territories.
Includes people who did not state their highest year of school completed.
Data for 2001, 2006 and 2011 are not comparable as they are sourced from different Census Collections.
INDIGENOUS
COMPENDIUM 2015
STATISTICAL CONTEXT
PAGE 1 of TABLE 2A.40

TABLE 2A.41
Table 2A.41
NSW Vic Qld WA SA Tas ACT NT Aust (d)
Aboriginal and Torres Strait Islander Australians (e)
Year 8 or below (f) 11.4 2.5 10.2 7.3 2.4 0.8 0.3 9.8 42.1
Year 9 15.0 2.8 8.2 3.9 1.9 1.4 0.3 4.6 38.0
Year 10 32.6 5.3 25.6 12.7 4.2 4.8 0.8 7.6 93.5
Year 11 7.9 3.2 9.6 5.9 3.5 1.4 0.3 4.1 35.9
Year 12 23.9 6.6 28.6 9.0 4.1 2.8 1.5 5.0 81.6
Total (g) 101.0 22.8 90.5 42.7 18.3 11.8 3.3 35.8 326.3
Non-Indigenous
Year 8 or below (f) 336.9 322.1 205.2 74.8 90.3 22.5 8.4 4.5 1 064.9
Year 9 331.9 234.2 151.4 70.8 63.7 31.1 7.9 4.7 895.7
Year 10 1 233.6 577.1 783.5 371.4 202.8 120.1 38.8 22.1 3 349.5
Year 11 257.0 500.9 230.3 166.3 221.3 30.8 11.6 14.2 1 432.5
Year 12 2 589.0 2 129.5 1 556.8 838.0 552.8 137.1 189.8 57.1 8 050.8
Total (g) 4 968.3 3 938.1 3 051.4 1 586.6 1 183.0 358.9 263.4 107.0 15 459.1
Not stated
Year 8 or below (f) 5.9 6.1 3.7 1.6 1.9 0.5 0.1 0.1 20.1
Year 9 4.2 3.0 1.8 1.0 0.9 0.5 0.1 0.1 11.6
Year 10 11.9 6.0 6.7 3.4 2.0 1.2 0.3 0.2 31.6
Year 11 2.6 4.3 1.8 1.4 1.7 0.3 0.1 0.1 12.2
Year 12 18.4 16.3 9.9 5.6 3.7 1.0 0.9 0.4 56.3
Total (g) 274.8 198.4 178.9 105.5 51.0 15.4 11.6 13.6 849.3
Total
Year 8 or below (f) 354.1 330.7 219.1 81.1 94.7 23.9 8.8 14.4 1 127.1
Year 9 351.0 240.0 161.4 75.7 66.5 32.9 8.3 9.3 945.3
Year 10 1 278.0 588.3 815.7 387.4 209.0 126.0 39.9 29.9 3 474.6
Year 11 267.5 508.4 241.7 173.6 226.5 32.4 11.9 18.4 1 480.6
Year 12 2 631.3 2 152.4 1 595.3 852.6 560.6 140.9 192.2 62.5 8 188.6
Total (g) 5 344.1 4 159.3 3 320.8 1 734.8 1 252.4 386.1 278.2 156.5 16 634.7
(a)
(b)
(c)
(d)
(e)
(f)
(g)
Source :
Includes people who did not state their highest year of school completed.
ABS (2012) 2011 Census of Population and Housing, Australia, Aboriginal and Torres Strait
Islander Peoples (Indigenous) Profile, Table I06 — Highest year of school completed by Indigenous
status by sex , Cat. no. 2002.0, Canberra.
Highest level of schooling completed by people aged 15 years or over,
by Indigenous status (excluding people still attending secondary
school), 2011 ('000) (a), (b), (c)
Data for highest level of schooling completed by people aged 15 years or over (excluding people still
attending secondary school).
Disaggregation into years differs between the 2001, 2006 and 2011 Census.
Includes Other Territories.
Includes 'Aboriginal', 'Torres Strait Islander' and 'Both Aboriginal and Torres Strait Islander'.
Includes people who have never been to school.
Data for 2001, 2006 and 2011 are not comparable as they are sourced from different Census Collections.
INDIGENOUS
COMPENDIUM 2015
STATISTICAL CONTEXT
PAGE 1 of TABLE 2A.41

TABLE 2A.42
Table 2A.42
NSW Vic Qld WA SA Tas ACT NT Aust (c)
Aboriginal and Torres Strait Islander Australians
Pre-school 3.4 0.6 3.1 1.5 0.6 0.3 0.1 0.9 10.4
Infants/Primary 21.6 4.3 20.1 10.1 4.3 2.9 0.6 7.6 71.6
Secondary 11.6 2.4 9.4 4.5 1.9 1.7 0.4 2.9 34.7
TAFE (d) 4.9 1.0 2.6 1.7 1.1 0.7 0.1 0.4 12.5
University (e) 2.2 0.6 1.9 1.1 0.4 0.3 0.2 0.5 7.2
Other 0.8 0.2 0.6 0.3 0.2 0.1 – 0.3 2.4
Not attending 69.1 14.4 68.2 35.0 13.4 9.2 2.0 32.9 244.4
Not stated 6.4 1.5 6.9 4.3 1.7 0.6 0.1 5.3 26.8
Total 119.9 25.1 112.8 58.5 23.4 15.8 3.6 50.8 410.0
Non-Indigenous
Pre-school 95.1 67.1 49.2 25.2 17.5 3.9 4.2 2.0 264.3
Infants/Primary 552.2 407.2 324.3 171.0 141.6 42.6 29.4 14.0 1 682.6
Secondary 423.4 325.4 213.9 112.3 87.0 28.1 23.6 7.4 1 221.3
TAFE (d) 182.5 113.9 70.4 49.3 35.7 13.0 9.8 2.8 477.5
University (e) 227.5 189.3 134.9 69.2 48.7 13.1 21.7 6.2 710.6
Other 50.2 39.3 22.0 11.7 10.5 2.7 2.9 1.1 140.7
Not attending 4 257.8 3 167.7 2 466.3 1 234.5 1 026.3 310.6 199.4 103.6 12 767.9
Not stated 112.5 87.7 57.7 29.5 23.7 8.8 4.0 2.7 326.6
Total 5 901.3 4 397.6 3 338.7 1 702.8 1 391.0 422.9 295.0 139.8 17 591.5
All people (f)
Pre-school 99.6 68.5 52.9 27.0 18.2 4.3 4.3 2.9 277.8
Infants/Primary 579.8 415.6 347.7 182.8 147.1 46.0 30.2 21.8 1 771.4
Secondary 438.8 331.0 225.3 117.8 89.5 30.0 24.2 10.4 1 267.1
TAFE (d) 188.9 115.9 73.5 51.3 37.0 13.9 10.0 3.3 493.9
University (e) 231.2 191.3 137.5 70.7 49.3 13.4 22.0 6.8 722.1
Other 51.5 40.0 22.8 12.2 10.8 2.9 2.9 1.4 144.5
Not attending 4 388.0 3 229.8 2 567.5 1 285.2 1 052.9 324.7 203.5 138.2 13 191.6
Not stated 333.4 220.0 158.4 85.0 54.1 19.7 12.1 17.9 900.7
Total 6 311.2 4 612.1 3 585.6 1 832.0 1 458.9 454.8 309.2 202.7 18 769.2
(a)
(b)
(c)
(d)
(e)
(f)
Source :
Data for type of educational institution attending by Indigenous status for 2001, 2006 and 2011 are not
comparable as they are sourced from different Census Collections.
Disaggregation into years differs between the 2001, 2006 and 2011 Census.
Type of educational institution attending by Indigenous status, 2001
('000) (a), (b)
ABS (unpublished) Census of Population and Housing, Australia , Cat. no. 2002.0.
Includes Other Territories.
Technical and further educational institutions.
Includes other tertiary institutions.
All persons includes Indigenous status not stated.
– Nil or rounded to zero.
INDIGENOUS
COMPENDIUM 2015
STATISTICAL CONTEXT
PAGE 1 of TABLE 2A.42

TABLE 2A.43
Table 2A.43
NSW Vic Qld WA SA Tas ACT NT Aust (d)
Aboriginal and Torres Strait Islander Australians
Pre-school 4.0 0.8 3.3 1.4 0.6 0.2 0.1 0.9 11.4
Infants/Primary 22.3 4.6 20.7 9.0 4.3 2.8 0.6 7.4 71.7
Secondary 13.6 2.9 11.6 4.6 2.1 1.7 0.4 2.9 39.7
TAFE (e) 4.2 0.9 2.3 1.0 0.7 0.7 0.1 0.4 10.4
University 2.3 0.6 2.0 0.8 0.4 0.3 0.2 0.5 7.1
Other 0.7 0.3 0.8 0.3 0.2 0.1 – 0.3 2.5
Not stated 13.8 3.2 12.2 7.5 2.8 1.2 0.2 8.7 49.7
Total 60.9 13.3 52.9 24.5 11.1 7.0 1.7 21.0 192.4
Non-Indigenous
Pre-school 108.0 76.0 54.5 25.3 17.6 3.7 4.1 1.8 291.1
Infants/Primary 514.2 388.9 322.0 158.2 133.1 40.2 25.9 12.1 1 594.8
Secondary 417.6 325.3 222.0 110.2 84.1 27.8 22.3 7.0 1 216.3
TAFE (e) 154.7 100.1 65.2 39.3 31.7 11.7 8.4 1.8 412.9
University 234.9 196.8 135.0 71.8 53.0 13.8 22.4 5.3 733.0
Other 41.2 36.6 21.6 9.6 9.5 2.2 2.6 0.9 124.0
Not stated 241.2 188.5 132.7 68.2 52.2 18.7 7.5 4.0 713.3
Total 1 711.7 1 312.2 952.9 482.6 381.2 118.0 93.4 32.9 5 085.4
All people (f)
Pre-school 114.0 78.1 58.7 27.2 18.6 4.0 4.3 2.8 307.8
Infants/Primary 547.1 401.1 348.5 169.9 139.5 43.8 26.9 19.7 1 696.8
Secondary 438.2 333.6 236.7 116.4 87.3 29.9 23.0 10.0 1 275.1
TAFE (e) 160.8 102.3 68.1 40.8 32.7 12.4 8.6 2.2 428.0
University 239.0 199.0 137.8 73.1 53.7 14.2 22.7 5.8 745.5
Other 42.4 37.3 22.5 9.9 9.7 2.3 2.6 1.2 128.0
Not stated 558.3 391.6 323.5 178.2 105.8 36.0 19.7 27.0 1 640.3
Total 2 099.9 1 543.0 1 196.0 615.4 447.4 142.6 107.9 68.6 6 221.5
(a)
(b)
(c)
(d)
(e)
(f)
Source :
Type of educational institution attending by Indigenous status, 2006
('000) (a), (b), (c)
ABS (2007) 2006 Census of Population and Housing , Cat. no. 2068.0, Canberra.
Includes Other Territories.
Technical and further educational institutions.
Includes Indigenous status not stated.
Totals may not add as a result of rounding.
Data for type of educational institution attending by Indigenous status for 2001, 2006 and 2011 are not
comparable as they are sourced from different Census Collections.
Disaggregation into years differs between the 2001, 2006 and 2011 Census.
– Nil or rounded to zero.
INDIGENOUS
COMPENDIUM 2015
STATISTICAL CONTEXT
PAGE 1 of TABLE 2A.43

TABLE 2A.44
Table 2A.44
NSW Vic Qld WA SA Tas ACT NT Aust (d)
Aboriginal and Torres Strait Islander Australians
Pre-school 5.6 1.1 3.0 1.8 0.8 0.4 0.1 1.2 14.0
Infants/Primary 25.1 5.3 24.2 10.3 4.6 3.0 0.7 8.4 81.6
Secondary 18.6 3.7 14.3 5.1 2.6 1.9 0.5 4.3 51.0
TAFE (e) 5.8 1.3 2.7 1.2 0.8 0.7 0.2 0.5 13.2
University 3.5 1.1 2.9 0.9 0.6 0.4 0.3 0.5 10.1
Other 1.0 0.4 1.0 0.4 0.3 0.1 – 0.5 3.7
Not stated 14.9 3.4 12.6 8.5 3.3 1.3 0.3 6.2 50.4
Total 74.6 16.2 60.7 28.2 12.9 7.7 2.2 21.4 223.9
Non-Indigenous
Pre-school 119.3 87.6 47.0 30.2 19.5 3.8 5.0 2.1 314.6
Infants/Primary 516.3 399.7 350.7 176.0 130.1 38.5 26.8 11.3 1 649.6
Secondary 427.5 337.1 241.2 117.2 87.3 27.4 22.4 8.2 1 268.3
TAFE (e) 160.6 115.5 75.8 47.1 33.8 12.0 8.9 2.2 455.9
University 297.5 243.7 169.6 90.5 65.0 16.1 27.9 6.2 916.5
Other 49.1 49.2 27.6 13.0 10.7 2.7 2.8 1.2 156.2
Not stated 205.6 166.6 119.1 65.0 49.1 16.6 6.9 5.0 634.8
Total 1 775.8 1 399.4 1 031.1 539.1 395.5 117.0 100.6 36.1 5 395.9
All people (f)
Pre-school 126.6 89.8 50.6 32.4 20.6 4.2 5.2 3.3 332.8
Infants/Primary 549.3 411.0 379.8 188.6 136.5 42.1 27.7 19.9 1 755.2
Secondary 451.9 345.5 258.6 123.7 91.0 29.6 23.1 12.6 1 336.0
TAFE (e) 168.0 118.0 79.2 48.8 34.8 12.9 9.2 2.7 473.6
University 303.1 246.6 173.4 91.9 66.0 16.5 28.3 6.7 932.5
Other 50.6 50.3 28.8 13.5 11.1 2.9 2.8 1.6 161.7
Not stated 486.5 356.5 311.8 180.9 98.7 31.6 18.5 26.2 1 511.7
Total 2 136.1 1 617.6 1 282.3 679.8 458.7 139.8 114.9 73.1 6 503.6
(a)
(b)
(c)
(d)
(e)
(f)
Source :
Includes Indigenous status not stated.
ABS (2012) 2011 Census of Population and Housing, Australia, Aboriginal and Torres Strait
Islander Peoples (Indigenous) Profile, Table I05 — Type of educational institution attending (full/part-
time student status by age) by Indigenous status by sex , Cat. no. 2002.0, Canberra.
Type of educational institution attending by Indigenous status, 2011
('000) (a), (b), (c)
Data for type of educational institution attending by Indigenous status for 2001, 2006 and 2011 are not
comparable as they are sourced from different Census Collections.
Disaggregation into years differs between the 2001, 2006 and 2011 Census.
Totals may not add as a result of rounding.
Includes Other Territories.
Technical and Further Educational Institutions.
– Nil or rounded to zero.
INDIGENOUS
COMPENDIUM 2015
STATISTICAL CONTEXT
PAGE 1 of TABLE 2A.44

TABLE 2A.45
Table 2A.45
NSW Vic Qld WA SA Tas ACT NT Aust (b)
Aboriginal and Torres Strait Islander Australians
Females
Postgraduate Degree 461 147 266 87 65 40 52 44 1 162
Graduate Diploma and Graduate Certificate 376 141 367 107 54 40 31 75 1 191
Bachelor Degree 2 888 798 2 211 885 429 285 207 424 8 133
Advanced Diploma and Diploma 3 152 796 2 647 790 498 312 144 524 8 870
Certificate Level 9 438 2 188 8 143 2 866 1 608 1 284 270 1 910 27 724
Not stated 5 966 1 313 4 615 2 942 1 224 507 121 2 539 19 237
No tertiary education 28 684 6 096 26 967 13 222 5 454 3 496 747 12 342 97 044
Total 50 965 11 479 45 216 20 899 9 332 5 964 1 572 17 858 163 361
Males
Postgraduate Degree 335 121 193 61 41 33 51 29 864
Graduate Diploma and Graduate Certificate 208 96 150 49 42 11 27 24 607
Bachelor Degree 1 449 458 1 006 378 198 163 165 186 4 008
Advanced Diploma and Diploma 1 591 467 1 295 406 281 164 100 238 4 545
Certificate Level 10 228 2 526 9 107 3 418 1 638 1 476 336 2 228 30 970
Not stated 7 063 1 457 5 552 4 056 1 496 504 149 3 077 23 367
No tertiary education 25 866 5 528 24 151 11 256 4 858 3 043 754 10 689 86 183
Total 46 740 10 653 41 454 19 624 8 554 5 394 1 582 16 471 150 544
Total Aboriginal and Torres Strait Islander Australians
Postgraduate Degree 796 268 459 148 106 73 103 73 2 026
Graduate Diploma and Graduate Certificate 584 237 517 156 96 51 58 99 1 798
Bachelor Degree 4 337 1 256 3 217 1 263 627 448 372 610 12 141
Advanced Diploma and Diploma 4 743 1 263 3 942 1 196 779 476 244 762 13 415
Certificate Level 19 666 4 714 17 250 6 284 3 246 2 760 606 4 138 58 694
Not stated 13 029 2 770 10 167 6 998 2 720 1 011 270 5 616 42 604
No tertiary education 54 550 11 624 51 118 24 478 10 312 6 539 1 501 23 031 183 227
Tertiary education attainment for people aged 18 or over by Indigenous status and sex, 2011 ('000) (a)
INDIGENOUS
COMPENDIUM 2015
STATISTICAL CONTEXT
PAGE 1 of TABLE 2A.45
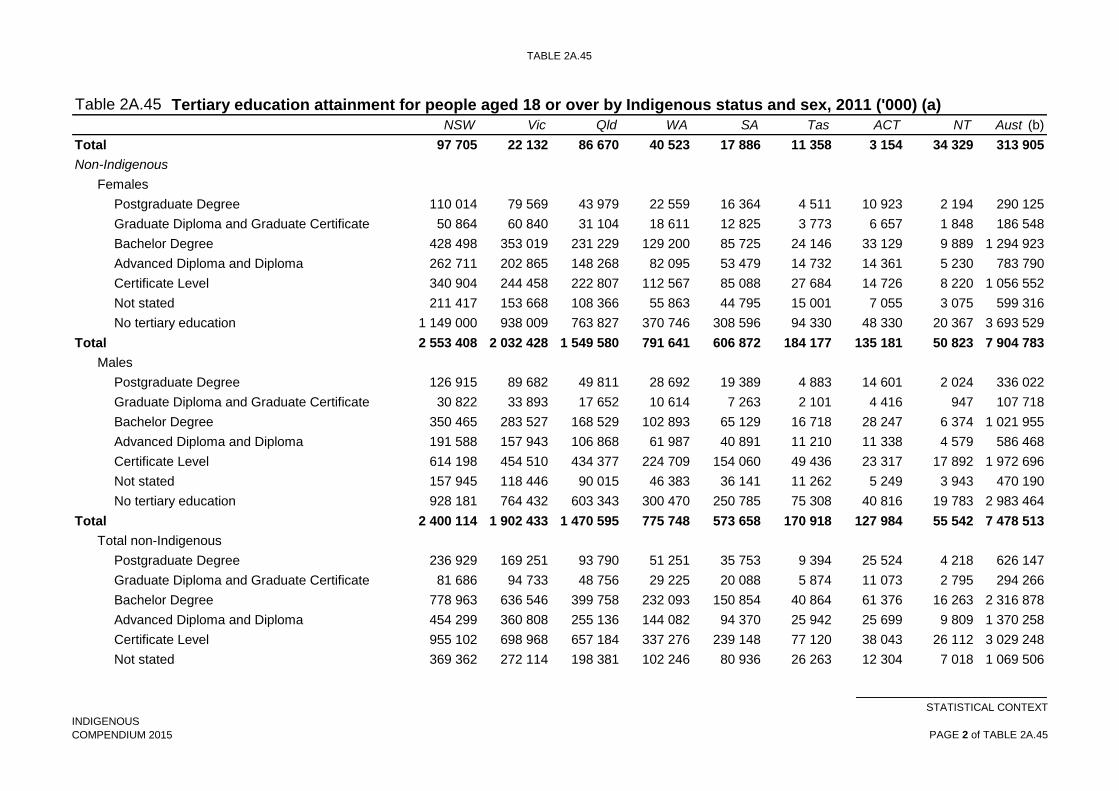
TABLE 2A.45
Table 2A.45
NSW Vic Qld WA SA Tas ACT NT Aust (b)
Tertiary education attainment for people aged 18 or over by Indigenous status and sex, 2011 ('000) (a)
Total 97 705 22 132 86 670 40 523 17 886 11 358 3 154 34 329 313 905
Non-Indigenous
Females
Postgraduate Degree 110 014 79 569 43 979 22 559 16 364 4 511 10 923 2 194 290 125
Graduate Diploma and Graduate Certificate 50 864 60 840 31 104 18 611 12 825 3 773 6 657 1 848 186 548
Bachelor Degree 428 498 353 019 231 229 129 200 85 725 24 146 33 129 9 889 1 294 923
Advanced Diploma and Diploma 262 711 202 865 148 268 82 095 53 479 14 732 14 361 5 230 783 790
Certificate Level 340 904 244 458 222 807 112 567 85 088 27 684 14 726 8 220 1 056 552
Not stated 211 417 153 668 108 366 55 863 44 795 15 001 7 055 3 075 599 316
No tertiary education 1 149 000 938 009 763 827 370 746 308 596 94 330 48 330 20 367 3 693 529
Total 2 553 408 2 032 428 1 549 580 791 641 606 872 184 177 135 181 50 823 7 904 783
Males
Postgraduate Degree 126 915 89 682 49 811 28 692 19 389 4 883 14 601 2 024 336 022
Graduate Diploma and Graduate Certificate 30 822 33 893 17 652 10 614 7 263 2 101 4 416 947 107 718
Bachelor Degree 350 465 283 527 168 529 102 893 65 129 16 718 28 247 6 374 1 021 955
Advanced Diploma and Diploma 191 588 157 943 106 868 61 987 40 891 11 210 11 338 4 579 586 468
Certificate Level 614 198 454 510 434 377 224 709 154 060 49 436 23 317 17 892 1 972 696
Not stated 157 945 118 446 90 015 46 383 36 141 11 262 5 249 3 943 470 190
No tertiary education 928 181 764 432 603 343 300 470 250 785 75 308 40 816 19 783 2 983 464
Total 2 400 114 1 902 433 1 470 595 775 748 573 658 170 918 127 984 55 542 7 478 513
Total non-Indigenous
Postgraduate Degree 236 929 169 251 93 790 51 251 35 753 9 394 25 524 4 218 626 147
Graduate Diploma and Graduate Certificate 81 686 94 733 48 756 29 225 20 088 5 874 11 073 2 795 294 266
Bachelor Degree 778 963 636 546 399 758 232 093 150 854 40 864 61 376 16 263 2 316 878
Advanced Diploma and Diploma 454 299 360 808 255 136 144 082 94 370 25 942 25 699 9 809 1 370 258
Certificate Level 955 102 698 968 657 184 337 276 239 148 77 120 38 043 26 112 3 029 248
Not stated 369 362 272 114 198 381 102 246 80 936 26 263 12 304 7 018 1 069 506
INDIGENOUS
COMPENDIUM 2015
STATISTICAL CONTEXT
PAGE 2 of TABLE 2A.45

TABLE 2A.45
Table 2A.45
NSW Vic Qld WA SA Tas ACT NT Aust (b)
Tertiary education attainment for people aged 18 or over by Indigenous status and sex, 2011 ('000) (a)
No tertiary education 2 077 181 1 702 441 1 367 170 671 216 559 381 169 638 89 146 40 150 6 676 993
Total 4 953 522 3 934 861 3 020 175 1 567 389 1 180 530 355 095 263 165 106 365 15 383 296
All people (c)
Females
Postgraduate Degree 111 006 80 110 44 432 22 738 16 489 4 587 11 030 2 245 292 649
Graduate Diploma and Graduate Certificate 51 451 61 216 31 601 18 790 12 940 3 843 6 707 1 939 188 513
Bachelor Degree 433 512 355 666 234 446 130 662 86 544 24 550 33 447 10 366 1 309 287
Advanced Diploma and Diploma 267 494 205 058 151 767 83 365 54 288 15 157 14 583 5 792 797 563
Certificate Level 352 827 248 516 232 478 116 372 87 295 29 147 15 081 10 204 1 092 038
Not stated 323 685 229 931 179 176 95 867 64 510 20 989 11 477 10 733 936 480
No tertiary education 1 190 417 954 832 798 012 387 863 317 407 98 918 49 480 32 969 3 830 269
Total 2 730 392 2 135 329 1 671 912 855 657 639 473 197 191 141 805 74 248 8 446 799
Males
Postgraduate Degree 127 820 90 257 50 209 28 888 19 506 4 949 14 700 2 065 338 419
Graduate Diploma and Graduate Certificate 31 157 34 129 17 870 10 688 7 333 2 124 4 451 980 108 742
Bachelor Degree 353 740 285 487 170 261 103 722 65 628 16 968 28 495 6 588 1 030 967
Advanced Diploma and Diploma 194 317 159 525 108 778 62 763 41 386 11 442 11 494 4 860 594 632
Certificate Level 629 717 461 141 446 788 230 172 156 930 51 369 23 823 20 275 2 020 425
Not stated 285 123 204 543 179 715 102 984 59 326 17 995 10 887 13 979 875 415
No tertiary education 964 552 778 977 633 323 314 819 258 268 79 259 41 906 30 720 3 102 214
Total 2 586 426 2 014 059 1 606 944 854 036 608 377 184 106 135 756 79 467 8 070 814
Total all people
Postgraduate Degree 238 826 170 367 94 641 51 626 35 995 9 536 25 730 4 310 631 068
Graduate Diploma and Graduate Certificate 82 608 95 345 49 471 29 478 20 273 5 967 11 158 2 919 297 255
Bachelor Degree 787 252 641 153 404 707 234 384 152 172 41 518 61 942 16 954 2 340 254
Advanced Diploma and Diploma 461 811 364 583 260 545 146 128 95 674 26 599 26 077 10 652 1 392 195
Certificate Level 982 544 709 657 679 266 346 544 244 225 80 516 38 904 30 479 3 112 463
INDIGENOUS
COMPENDIUM 2015
STATISTICAL CONTEXT
PAGE 3 of TABLE 2A.45

TABLE 2A.45
Table 2A.45
NSW Vic Qld WA SA Tas ACT NT Aust (b)
Tertiary education attainment for people aged 18 or over by Indigenous status and sex, 2011 ('000) (a)
Not stated 608 808 434 474 358 891 198 851 123 836 38 984 22 364 24 712 1 811 895
No tertiary education 2 154 969 1 733 809 1 431 335 702 682 575 675 178 177 91 386 63 689 6 932 483
Total 5 316 818 4 149 388 3 278 856 1 709 693 1 247 850 381 297 277 561 153 715 16 517 613
(a)
(d)
(c)
Source : ABS (unpublished) 2011 Census of Population and Housing, Table generated on 6/6/2013 using ABS TableBuilder.
Totals may not add as a result of rounding.
Includes Other Territories.
Includes Indigenous status not stated.
– Nil or rounded to zero.
INDIGENOUS
COMPENDIUM 2015
STATISTICAL CONTEXT
PAGE 4 of TABLE 2A.45

TABLE 2A.46
Table 2A.46
NSW Vic Qld WA SA Tas ACT NT Aust (b)
Aboriginal and Torres Strait Islander Australians
Females
Technical or Further Educational Institution (including TAFE Colleges) 1 145 260 523 203 139 121 50 64 2 505
University or other Tertiary Institution 1 108 316 804 241 145 103 73 83 2 873
Other 174 70 136 53 44 23 6 39 545
Not stated 550 152 481 312 126 59 19 279 1 978
Not in tertiary study 7 069 1 580 7 370 3 463 1 388 885 234 3 114 25 116
Total 10 046 2 378 9 314 4 272 1 842 1 191 382 3 579 33 017
Males
Technical or Further Educational Institution (including TAFE Colleges) 1 139 257 457 236 129 135 52 73 2 478
University or other Tertiary Institution 635 174 410 138 104 62 65 53 1 641
Other 89 35 81 28 23 11 4 41 312
Not stated 1 112 224 860 705 223 53 25 423 3 625
Not in tertiary study 7 315 1 659 7 590 3 399 1 422 905 284 2 988 25 568
Total 10 290 2 349 9 398 4 506 1 901 1 166 430 3 578 33 624
Total Aboriginal and Torres Strait Islander Australians
Technical or Further Educational Institution (including TAFE Colleges) 2 284 517 980 439 268 256 102 137 4 983
University or other Tertiary Institution 1 743 490 1 214 379 249 165 138 136 4 514
Other 263 105 217 81 67 34 10 80 857
Not stated 1 662 376 1 341 1 017 349 112 44 702 5 603
Not in tertiary study 14 384 3 239 14 960 6 862 2 810 1 790 518 6 102 50 684
Total 20 336 4 727 18 712 8 778 3 743 2 357 812 7 157 66 641
Non-Indigenous
Females
Technical or Further Educational Institution (including TAFE Colleges) 24 785 21 406 12 658 7 015 5 716 1 692 1 408 278 74 961
University or other Tertiary Institution 95 964 82 903 53 711 28 510 21 207 4 515 8 088 1 084 295 986
Other 6 059 5 640 3 292 1 287 1 296 276 276 116 18 242
Type of tertiary education institution attending for people aged 18-24 years by Indigenous status and sex, 2011
INDIGENOUS
COMPENDIUM 2015
STATISTICAL CONTEXT
PAGE 1 of TABLE 2A.46

TABLE 2A.46
Table 2A.46
NSW Vic Qld WA SA Tas ACT NT Aust (b)
Type of tertiary education institution attending for people aged 18-24 years by Indigenous status and sex, 2011
Not stated 6 752 6 150 3 469 1 849 1 528 419 269 135 20 574
Not in tertiary study 138 045 110 813 109 034 55 955 35 233 11 138 8 117 4 363 472 761
Total 271 605 226 912 182 164 94 616 64 980 18 040 18 158 5 976 882 524
Males
Technical or Further Educational Institution (including TAFE Colleges) 36 068 29 822 13 845 9 744 6 548 2 118 1 912 398 100 458
University or other Tertiary Institution 77 769 66 129 38 607 22 723 16 381 3 591 7 258 660 233 121
Other 4 533 4 776 2 400 1 186 1 030 165 331 69 14 494
Not stated 9 030 7 673 4 833 2 907 1 826 568 414 353 27 755
Not in tertiary study 148 849 124 335 121 730 62 362 41 378 12 031 8 792 5 564 525 106
Total 276 249 232 735 181 415 98 922 67 163 18 473 18 707 7 044 900 934
Total non-Indigenous
Technical or Further Educational Institution (including TAFE Colleges) 60 853 51 228 26 503 16 759 12 264 3 810 3 320 676 175 419
University or other Tertiary Institution 173 733 149 032 92 318 51 233 37 588 8 106 15 346 1 744 529 107
Other 10 592 10 416 5 692 2 473 2 326 441 607 185 32 736
Not stated 15 782 13 823 8 302 4 756 3 354 987 683 488 48 329
Not in tertiary study 286 894 235 148 230 764 118 317 76 611 23 169 16 909 9 927 997 867
Total 547 854 459 647 363 579 193 538 132 143 36 513 36 865 13 020 1 783 458
All people (c)
Females
Technical or Further Educational Institution (including TAFE Colleges) 26 189 21 884 13 272 7 273 5 910 1 825 1 470 345 78 171
University or other Tertiary Institution 97 695 83 820 54 792 28 910 21 464 4 646 8 194 1 174 300 699
Other 6 282 5 778 3 468 1 351 1 351 302 282 158 18 972
Not stated 20 126 15 364 12 468 7 011 3 719 1 042 1 210 1 098 62 044
Not in tertiary study 146 404 113 454 117 220 59 867 36 891 12 120 8 412 7 525 501 972
Total 296 696 240 300 201 220 104 412 69 335 19 935 19 568 10 300 961 858
Males
Technical or Further Educational Institution (including TAFE Colleges) 37 577 30 418 14 432 10 080 6 745 2 276 1 984 477 103 992
INDIGENOUS
COMPENDIUM 2015
STATISTICAL CONTEXT
PAGE 2 of TABLE 2A.46

TABLE 2A.46
Table 2A.46
NSW Vic Qld WA SA Tas ACT NT Aust (b)
Type of tertiary education institution attending for people aged 18-24 years by Indigenous status and sex, 2011
University or other Tertiary Institution 79 005 66 843 39 259 23 006 16 587 3 677 7 362 716 236 458
Other 4 684 4 901 2 504 1 232 1 062 176 339 110 15 012
Not stated 25 854 19 540 17 128 10 813 4 843 1 344 1 634 1 781 83 091
Not in tertiary study 157 869 127 441 130 483 66 300 43 181 13 056 9 148 8 611 556 166
Total 304 989 249 143 203 806 111 431 72 418 20 529 20 467 11 695 994 719
Total all people
Technical or Further Educational Institution (including TAFE Colleges) 63 766 52 302 27 704 17 353 12 655 4 101 3 454 822 182 163
University or other Tertiary Institution 176 700 150 663 94 051 51 916 38 051 8 323 15 556 1 890 537 157
Other 10 966 10 679 5 972 2 583 2 413 478 621 268 33 984
Not stated 45 980 34 904 29 596 17 824 8 562 2 386 2 844 2 879 145 135
Not in tertiary study 304 273 240 895 247 703 126 167 80 072 25 176 17 560 16 136 1 058 138
Total 601 685 489 443 405 026 215 843 141 753 40 464 40 035 21 995 1 956 577
(a)
(b)
(c)
Source : ABS (unpublished) 2011 Census of Population and Housing, Table generated on 27/6/2013 using ABS TableBuilder.
Totals may not add as a result of rounding.
Includes Other Territories.
Includes Indigenous status not stated.
– Nil or rounded to zero.
INDIGENOUS
COMPENDIUM 2015
STATISTICAL CONTEXT
PAGE 3 of TABLE 2A.46

STATISTICAL CONCEPTS
Statistical concepts
INDIGENOUS
COMPENDIUM 2015
STATISTICAL CONTEXT
PAGE 1 of STATISTICAL CONCEPTS

TABLE 2A.50
Table 2A.50
Unit NSW Vic Qld WA SA Tas ACT NT Aust
General Government Final Consumption Expenditure
2003-04 $m 82 359 62 981 50 404 27 399 19 365 6 873 26 604 6 699 283 122
2004-05 $m 80 018 61 754 49 280 26 910 19 179 6 808 27 275 6 488 278 082
2005-06 $m 78 706 61 305 48 818 26 731 18 789 6 634 26 224 6 359 273 906
2006-07 $m 76 332 59 433 49 225 26 907 18 594 6 569 28 535 6 394 272 088
2007-08 $m 75 435 59 314 49 205 26 677 18 284 6 497 28 183 6 352 270 021
2008-09 $m 75 690 58 986 49 370 27 023 18 272 6 519 28 666 6 369 270 953
2009-10 $m 74 448 59 062 49 011 27 084 18 251 6 451 28 017 6 296 268 662
2010-11 $m 72 947 57 684 48 999 26 456 17 707 6 288 27 791 6 294 264 186
2011-12 $m 74 322 58 834 50 099 27 752 18 121 6 388 28 364 6 211 270 091
2012-13 $m 74 055 57 705 49 682 27 917 18 232 6 390 28 123 6 071 268 175
Proportion of national General Government Final Consumption Expenditure
2003-04 % 29.1 22.2 17.8 9.7 6.8 2.4 9.4 2.4 100.0
2004-05 % 28.8 22.2 17.7 9.7 6.9 2.4 9.8 2.3 100.0
2005-06 % 28.7 22.4 17.8 9.8 6.9 2.4 9.6 2.3 100.0
2006-07 % 28.1 21.8 18.1 9.9 6.8 2.4 10.5 2.3 100.0
2007-08 % 27.9 22.0 18.2 9.9 6.8 2.4 10.4 2.4 100.0
2008-09 % 27.9 21.8 18.2 10.0 6.7 2.4 10.6 2.4 100.0
2009-10 % 27.7 22.0 18.2 10.1 6.8 2.4 10.4 2.3 100.0
2010-11 % 27.6 21.8 18.5 10.0 6.7 2.4 10.5 2.4 100.0
2011-12 % 27.5 21.8 18.5 10.3 6.7 2.4 10.5 2.3 100.0
2012-13 % 27.6 21.5 18.5 10.4 6.8 2.4 10.5 2.3 100.0
Growth on previous year
2003-04 % 1.1 0.3 3.0 1.7 1.1 4.2 2.9 1.0 1.5
2004-05 % - 2.8 - 1.9 - 2.2 - 1.8 - 1.0 - 1.0 2.5 - 3.1 - 1.8
2005-06 % - 1.6 - 0.7 - 0.9 - 0.7 - 2.0 - 2.6 - 3.9 - 2.0 - 1.5
2006-07 % - 3.0 - 3.1 0.8 0.7 - 1.0 - 1.0 8.8 0.5 - 0.7
General Government Final Consumption Expenditure, by jurisdiction (2012-13 dollars) (a)
INDIGENOUS
COMPENDIUM 2015
STATISTICAL CONTEXT
PAGE 1 of TABLE 2A.50

TABLE 2A.50
Table 2A.50
Unit NSW Vic Qld WA SA Tas ACT NT Aust
General Government Final Consumption Expenditure, by jurisdiction (2012-13 dollars) (a)
2007-08 % - 1.2 - 0.2 - 0.0 - 0.9 - 1.7 - 1.1 - 1.2 - 0.7 - 0.8
2008-09 % 0.3 - 0.6 0.3 1.3 - 0.1 0.3 1.7 0.3 0.3
2009-10 % - 1.6 0.1 - 0.7 0.2 - 0.1 - 1.0 - 2.3 - 1.1 - 0.8
2010-11 % - 2.0 - 2.3 – - 2.3 - 3.0 - 2.5 - 0.8 – - 1.7
2011-12 % 1.9 2.0 2.2 4.9 2.3 1.6 2.1 - 1.3 2.2
2012-13 % - 0.4 - 1.9 - 0.8 0.6 0.6 – - 0.8 - 2.3 - 0.7
General Government Final Consumption Expenditure per person
2003-04 $ 12 413.7 12 852.8 13 304.4 13 935.4 12 700.3 14 277.7 81 209.3 33 210.2 14 279.5
2004-05 $ 11 998.2 12 457.6 12 726.1 13 493.7 12 514.5 14 042.7 82 777.0 31 827.3 13 872.2
2005-06 $ 11 715.7 12 204.4 12 314.7 13 168.5 12 162.2 13 591.0 78 630.8 30 661.6 13 485.3
2006-07 $ 11 248.2 11 644.5 12 136.8 12 955.7 11 909.6 13 365.2 84 329.5 30 296.8 13 190.5
2007-08 $ 10 958.3 11 407.6 11 828.1 12 495.1 11 583.0 13 101.6 81 885.1 29 322.8 12 848.3
2008-09 $ 10 810.2 11 101.5 11 547.0 12 233.7 11 435.0 12 991.8 81 645.8 28 619.6 12 616.8
2009-10 $ 10 483.4 10 898.5 11 221.8 11 964.0 11 275.7 12 737.8 78 291.6 27 640.8 12 286.9
2010-11 $ 10 160.0 10 496.2 11 043.6 11 408.1 10 846.6 12 324.0 76 173.2 27 330.2 11 915.0
2011-12 $ 10 254.6 10 554.3 11 100.9 11 625.2 11 015.5 12 483.9 76 508.2 26 731.1 12 011.9
2012-13 $ 10 077.0 10 160.0 10 774.8 11 290.0 10 968.8 12 470.2 74 094.9 25 630.2 11 707.5
(a)
Source :
From 2014 Report, General Government Final Consumption Expenditure data are reported instead of the Gross State Product (GSP) data.
ABS (2013 and previous years) Australian National Accounts, State Accounts , various years, Cat. no. 5220.0, Canberra; Review calculations based on ABS
(2014) Australian National Accounts: National Income, Expenditure and Product, June 2013 , Cat. no. 5206.0, Canberra; table 2A.51.
INDIGENOUS
COMPENDIUM 2015
STATISTICAL CONTEXT
PAGE 2 of TABLE 2A.50

TABLE 2A.51
Table 2A.51
2009-10 dollars
(2009-10=100)
2010-11 dollars
(2010-11=100)
2011-12 dollars
(2011-12=100)
2012-13 dollars
(2012-13=100)
2013-14 dollars
(2013-14=100)
2000-01 72.0 68.6 67.5 66.4 65.9
2001-02 74.8 71.2 70.1 69.0 68.5
2002-03 76.7 73.1 71.9 70.8 70.2
2003-04 78.9 75.1 73.9 72.7 72.2
2004-05 82.8 78.9 77.6 76.4 75.8
2005-06 86.8 82.6 81.3 80.0 79.4
2006-07 90.1 85.8 84.4 83.1 82.4
2007-08 93.7 89.2 87.8 86.4 85.7
2008-09 97.3 92.7 91.2 89.8 89.1
2009-10 100.0 95.2 93.7 92.2 91.5
2010-11 105.0 100.0 98.4 96.9 96.1
2011-12 106.7 101.6 100.0 98.4 97.7
2012-13 108.4 103.3 101.6 100.0 99.2
2013-14 109.3 104.1 102.4 100.8 100.0
(a)
(b)
(c)
Source :
General Government Final Consumption Expenditure, Chain price Index
(GGFCE) (a), (b), (c)
GGFCE price deflator
To convert nominal dollars to real dollars, divide the amount in nominal dollars by the GGFCE Chain price
indexes for the applicable financial year and multiply by 100. For example: to convert 2004-05 dollars to
2013-14 dollars, divide by 75.8 and multiply by 100; to convert 2007-08 dollars to 2012-13 dollars, divide
by 86.4 and multiply by 100. For further information, see Statistical context, table 2.1, p. 2.16.
Review calculations based on ABS (2014) Australian National Accounts: National Income,
Expenditure and Product, June 2014, Cat. no. 5206.0, Canberra.
Data are sourced from table 32, Expenditure on Gross Domestic Product, Chain volume measures and
current prices, Annual (Series ID: A2304687R) (ABS 2014). See Statistical context, section 2.6 Statistical
concepts used in the Report for information on how these gross domestic product deflators were calculated
using data from that source.
Estimates used to calculate the GGFCE Chain price indexes are subject to annual re-referencing by the
Australian Bureau of Statistics (ABS) and also reflect any revisions inherent in source data which are
aggregated up to the GGFCE level. These processes can cause volatility in deflator values from year to
year. In addition to changes caused by re-referencing and source data revisions, the 2013-14 deflator in
this table will differ in future reports due to the introduction by the ABS of updated supply-use benchmarks,
which will be backcast, causing revisions throughout the time series.
Nominal dollars (year)
INDIGENOUS
COMPENDIUM 2015
STATISTICAL CONTEXT
PAGE 1 of TABLE 2A.51
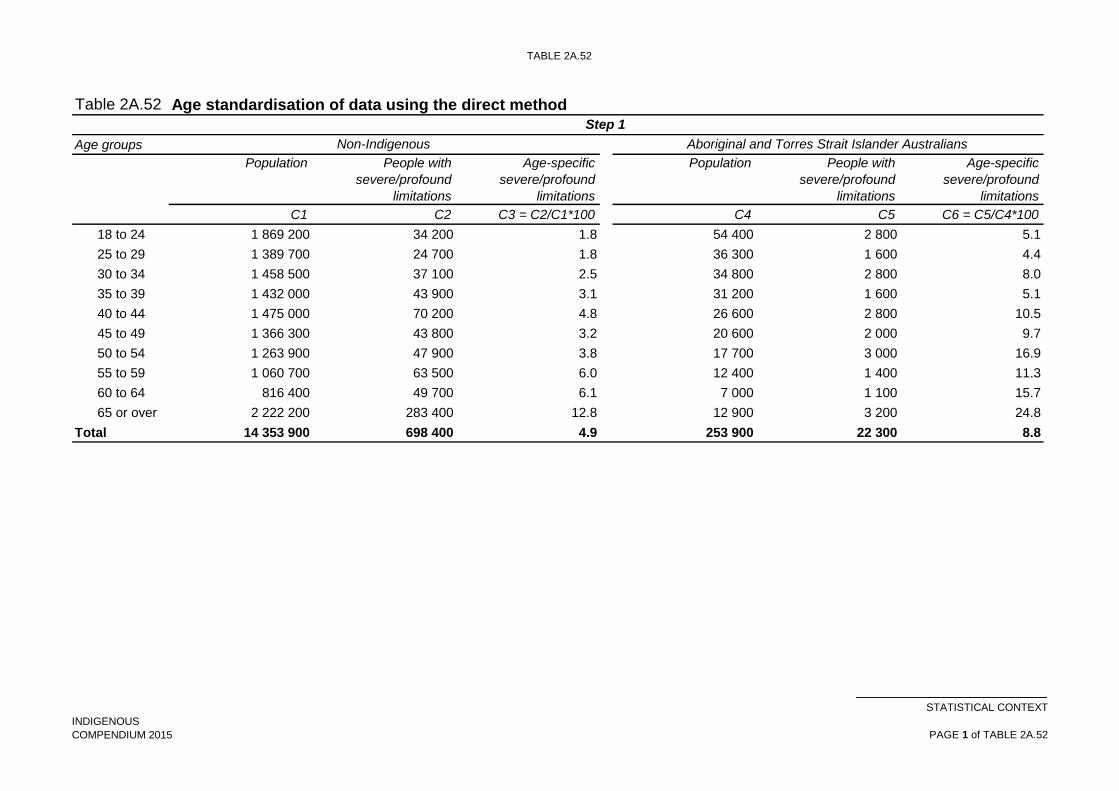
TABLE 2A.52
Table 2A.52
Age groups
Population Population
C1 C2 C3 = C2/C1*100 C4 C5 C6 = C5/C4*100
18 to 24 1 869 200 34 200 1.8 54 400 2 800 5.1
25 to 29 1 389 700 24 700 1.8 36 300 1 600 4.4
30 to 34 1 458 500 37 100 2.5 34 800 2 800 8.0
35 to 39 1 432 000 43 900 3.1 31 200 1 600 5.1
40 to 44 1 475 000 70 200 4.8 26 600 2 800 10.5
45 to 49 1 366 300 43 800 3.2 20 600 2 000 9.7
50 to 54 1 263 900 47 900 3.8 17 700 3 000 16.9
55 to 59 1 060 700 63 500 6.0 12 400 1 400 11.3
60 to 64 816 400 49 700 6.1 7 000 1 100 15.7
65 or over 2 222 200 283 400 12.8 12 900 3 200 24.8
Total 14 353 900 698 400 4.9 253 900 22 300 8.8
Step 1
People with
severe/profound
limitations
Age-specific
severe/profound
limitations
Non-Indigenous Aboriginal and Torres Strait Islander Australians
People with
severe/profound
limitations
Age-specific
severe/profound
limitations
Age standardisation of data using the direct method
INDIGENOUS
COMPENDIUM 2015
STATISTICAL CONTEXT
PAGE 1 of TABLE 2A.52

TABLE 2A.52
Table 2A.52 Age standardisation of data using the direct method
Age groups
C7 C8 = C7*C3/100 C9 = C7*C6/100 C10 = ∑C8/∑C7*100 C11 = ∑C9/∑C7*100 C12 = C11/C10
18 to 24 1 844 162 33 742 94 920
25 to 29 1 407 081 25 009 62 020
30 to 34 1 466 615 37 306 118 004
35 to 39 1 492 204 45 746 76 523
40 to 44 1 479 257 70 403 155 711
45 to 49 1 358 594 43 553 131 902
50 to 54 1 300 777 49 298 220 471
55 to 59 1 008 799 60 393 113 897
60 to 64 822 024 50 042 129 175
65 or over 2 435 534 310 607 604 163
Total 14 615 047 726 098 1 706 787 5.0 11.7 2.4
Source : AIHW (Australian Institute of Health and Welfare) 2006, ‘Potential Population’ — Updating the Indigenous Factor in Disability Services Performance
Indicator Denominators , Welfare Working Paper Series Number 50, Cat. no. DIS 45, Canberra; ABS (2008) Population by Age and Sex, Australian States
and Territories, June 2007, Cat. no. 3201.0, Canberra.
Step 3
Non-Indigenous age
standardised rate
Aboriginal and Torres
Strait Islander
Australians age
standardised rate
Rate ratio Aboriginal
and Torres Strait
Islander
Australians/non-
Indigenous
Standard population
Step 2
Non-Indigenous
expected number of
‘events’
Aboriginal and Torres
Strait Islander
Australians expected
number of ‘events’
INDIGENOUS
COMPENDIUM 2015
STATISTICAL CONTEXT
PAGE 2 of TABLE 2A.52

TABLE 2A.53
Table 2A.53
Variable NSW (c) Vic Qld WA SA Tas ACT (c) NT Aust
C — Observed number of imprisonments
Aboriginal and Torres Strait Islander Australians 2 008 236 1 451 1 588 412 70 21 720 6 505
Non-Indigenous 7 267 3 930 4 040 2 215 1 443 469 160 155 19 679
R — Standard population imprisonment rate (per 100 000)
153.2 153.2 150.7 153.2 153.2 153.2 153.2 153.2 153.2
pi — Study populations
Aboriginal and Torres Strait Islander Australians
17/18–20 years 6 541 1 460 9 773 3 246 1 241 914 196 2 581 25 952
20–24 years 14 176 3 183 13 521 7 446 2 941 1 931 452 6 193 49 843
25–29 years 10 653 2 519 10 840 5 956 2 252 1 407 358 5 525 39 510
30–34 years 9 371 2 191 10 036 5 050 2 066 1 065 350 4 948 35 077
35–39 years 10 188 2 335 10 074 5 172 2 005 1 145 340 4 771 36 030
40–44 years 8 599 1 955 8 189 4 373 1 709 1 055 293 3 750 29 923
45–54 years 13 724 2 914 12 196 6 665 2 634 1 852 404 5 366 45 755
55+ years 12 187 2 536 10 343 5 733 2 255 1 480 251 4 765 39 550
Total 85 439 19 093 84 972 43 641 17 103 10 849 2 644 37 899 301 640
Non-Indigenous
17/18–20 years 180 194 143 317 166 645 57 300 41 754 12 395 10 539 3 843 615 987
20–24 years 463 309 374 430 287 625 146 914 107 652 29 445 29 191 11 655 1 450 221
25–29 years 472 093 368 995 280 354 141 421 98 380 26 809 28 387 13 087 1 429 526
30–34 years 476 046 367 820 280 322 141 251 97 734 27 610 25 614 13 245 1 429 642
35–39 years 499 251 397 916 305 448 156 460 110 513 32 650 26 098 13 360 1 541 696
40–44 years 480 492 376 440 294 009 153 356 111 738 32 838 24 159 12 563 1 485 595
45–54 years 941 244 715 564 568 926 295 145 223 777 70 680 46 916 24 254 2 886 506
55+ years 1 713 479 1 284 272 985 918 485 295 431 531 134 947 70 226 25 677 5 131 345
Total 5 226 108 4 028 754 3 169 247 1 577 142 1 223 079 367 374 261 130 117 684 15 970 518
Age standardisation of data using the indirect method (a), (b)
INDIGENOUS
COMPENDIUM 2015
STATISTICAL CONTEXT
PAGE 1 of TABLE 2A.53

TABLE 2A.53
Table 2A.53
Variable NSW (c) Vic Qld WA SA Tas ACT (c) NT Aust
Age standardisation of data using the indirect method (a), (b)
Ri — Standard population age-specific imprisonment rates (30 June 2001)
17–20 years 124.6
18–20 years 179.4
20–24 years 359.4
25–29 years 345.2
30–34 years 271.8
35–39 years 193.6
40–44 years 131.6
45–54 years 77.3
55+ years 23.5
Aboriginal and Torres Strait Islander Australians
17/18–20 years 11.7 2.6 12.2 5.8 2.2 1.6 0.4 4.6 46.6
20–24 years 51.0 11.4 48.6 26.8 10.6 6.9 1.6 22.3 179.2
25–29 years 36.8 8.7 37.4 20.6 7.8 4.9 1.2 19.1 136.4
30–34 years 25.5 6.0 27.3 13.7 5.6 2.9 1.0 13.4 95.3
35–39 years 19.7 4.5 19.5 10.0 3.9 2.2 0.7 9.2 69.8
40–44 years 11.3 2.6 10.8 5.8 2.2 1.4 0.4 4.9 39.4
45–54 years 10.6 2.3 9.4 5.2 2.0 1.4 0.3 4.1 35.4
55+ years 2.9 0.6 2.4 1.3 0.5 0.3 0.1 1.1 9.3
Total 169 39 168 89 35 22 6 79 611
Step 1: Calculate Ri
Step 2: p i*R i
INDIGENOUS
COMPENDIUM 2015
STATISTICAL CONTEXT
PAGE 2 of TABLE 2A.53
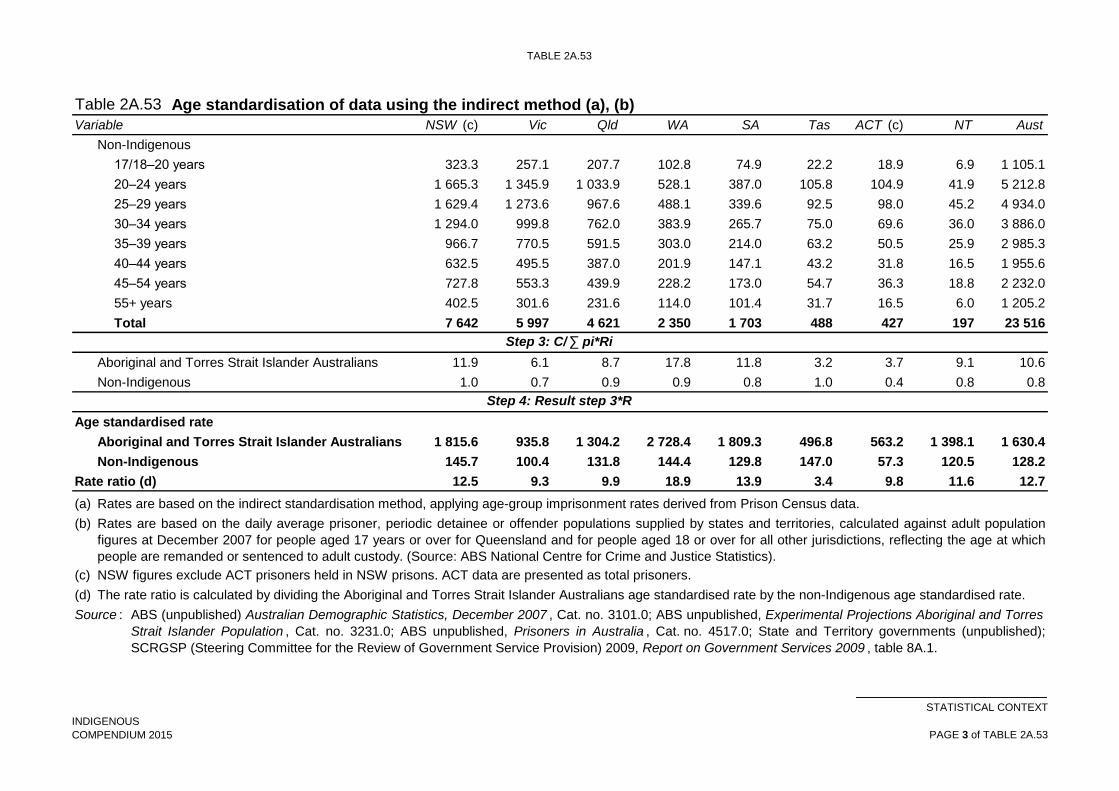
TABLE 2A.53
Table 2A.53
Variable NSW (c) Vic Qld WA SA Tas ACT (c) NT Aust
Age standardisation of data using the indirect method (a), (b)
Non-Indigenous
17/18–20 years 323.3 257.1 207.7 102.8 74.9 22.2 18.9 6.9 1 105.1
20–24 years 1 665.3 1 345.9 1 033.9 528.1 387.0 105.8 104.9 41.9 5 212.8
25–29 years 1 629.4 1 273.6 967.6 488.1 339.6 92.5 98.0 45.2 4 934.0
30–34 years 1 294.0 999.8 762.0 383.9 265.7 75.0 69.6 36.0 3 886.0
35–39 years 966.7 770.5 591.5 303.0 214.0 63.2 50.5 25.9 2 985.3
40–44 years 632.5 495.5 387.0 201.9 147.1 43.2 31.8 16.5 1 955.6
45–54 years 727.8 553.3 439.9 228.2 173.0 54.7 36.3 18.8 2 232.0
55+ years 402.5 301.6 231.6 114.0 101.4 31.7 16.5 6.0 1 205.2
Total 7 642 5 997 4 621 2 350 1 703 488 427 197 23 516
Aboriginal and Torres Strait Islander Australians 11.9 6.1 8.7 17.8 11.8 3.2 3.7 9.1 10.6
Non-Indigenous 1.0 0.7 0.9 0.9 0.8 1.0 0.4 0.8 0.8
Age standardised rate
Aboriginal and Torres Strait Islander Australians 1 815.6 935.8 1 304.2 2 728.4 1 809.3 496.8 563.2 1 398.1 1 630.4
Non-Indigenous 145.7 100.4 131.8 144.4 129.8 147.0 57.3 120.5 128.2
Rate ratio (d) 12.5 9.3 9.9 18.9 13.9 3.4 9.8 11.6 12.7
(a)
(b)
(c)
(d)
Source :
Rates are based on the daily average prisoner, periodic detainee or offender populations supplied by states and territories, calculated against adult population
figures at December 2007 for people aged 17 years or over for Queensland and for people aged 18 or over for all other jurisdictions, reflecting the age at which
people are remanded or sentenced to adult custody. (Source: ABS National Centre for Crime and Justice Statistics).
Step 4: Result step 3*R
ABS (unpublished) Australian Demographic Statistics, December 2007 , Cat. no. 3101.0; ABS unpublished, Experimental Projections Aboriginal and Torres
Strait Islander Population , Cat. no. 3231.0; ABS unpublished, Prisoners in Australia , Cat. no. 4517.0; State and Territory governments (unpublished);
SCRGSP (Steering Committee for the Review of Government Service Provision) 2009, Report on Government Services 2009 , table 8A.1.
The rate ratio is calculated by dividing the Aboriginal and Torres Strait Islander Australians age standardised rate by the non-Indigenous age standardised rate.
NSW figures exclude ACT prisoners held in NSW prisons. ACT data are presented as total prisoners.
Step 3: C/∑ pi*Ri
Rates are based on the indirect standardisation method, applying age-group imprisonment rates derived from Prison Census data.
INDIGENOUS
COMPENDIUM 2015
STATISTICAL CONTEXT
PAGE 3 of TABLE 2A.53