2. strategic performance measures in the private sector txt strategic...costing, target costing,...
TRANSCRIPT

D. STRATEGIC PERFORMANCE MEASUREMENT
2. Strategic Performance measures in the private sector
a) Demonstrate why the primary objective of financial performance should be (primarily) concerned with the benefits to
shareholders. [2]
Focus notes - What is financial performance?
- Financial performance is about managing for value i.e. shareholder value measured by the value of shares which is under pinned by the assets of the business.
- Strategic performance management begins when shareholder invest in order to achieve this end. They make a choice and trade-off risk for return in their investments in the organisation that
exceeds returns that can be obtained from similar risk investments elsewhere in the market.
- It is argued that the company does not create value and justify the investment unless it produces returns that exceed the cost of capital. This is the argument of EVA.
What is financial performance? 1. Specifically, financial performance is a measure of how well an organisation uses its assets to generate revenue from its core business model.
Examples of such measures are asset turnover (Sales/total assets), inventory turnover (cost of goods sold/average inventory).
2. Financial performance is also a measure of the financial health of an organisation over a period of time. Examples of performance measures
are ROCE, ROI, EVA, etc. These measures can be used to compare the performance of one firm with another or others in the same
industry. Each of these measures relates the returns to the investments in the organisation to obtain returns that can be compared with
benchmark returns on similar risk investments elsewhere in the market. This is essential in order to evaluate whether the returns adequately
compensate shareholders for the risks they have undertaken in investing in the organisation.
Why financial performance is primarily concerned with benefits to shareholders 3. Financial performance is about managing for shareholder value - income and capital growth, which is the primary objective of investment.
Investors make choices which involve trade-offs of risk for an acceptable return to compensate them for that risk. These returns must exceed
what can be obtained elsewhere in the market from similar risk investments. If these criteria are not met investors may not invest in the
organisation or may divest if they have already invested.
4. To be effective therefore financial performance management must focus on the drivers of value in the organisation. It is argued that the
organisation does not create wealth unless it can produce returns that exceed the cost of capital invested in it. This is the argument of EVA
(Economic value added). This argument is consistent with the assumption of rational economic behaviour which underpins the investor’s
decision to trade-off higher risks for higher returns in undertaking to invest in the organisation.
What is financial performance management? 5. Financial performance management consists of setting clear financial objectives that reflect the generic strategy, setting a financial strategy
to achieve the objectives, implementing the strategy, monitoring and controlling the implementation so as to achieve the objectives in a
changing environment that achieves sustainable competitive advantage in the long term.
6. For example, if the generic strategy is to be a cost leader, the financial objective would be to minimise costs. This could translate into an
operational planning objective to reduce costs by say 5%. The financial strategy to achieve this would consist of kaizen budgeting, kaizen
costing, target costing, lean management techniques, etc. In terms of production the strategy would be to achieve economies of scale, JIT
(procurement and production). In terms of investments the strategy would be to reduce the absolute amounts of investments, invest to
enhance productivity, achieve improved market share and reduce labour costs. In terms of financing the strategy would be to minimise
financing as far as possible by say forging strategic alliances rather than go for outright acquisition.
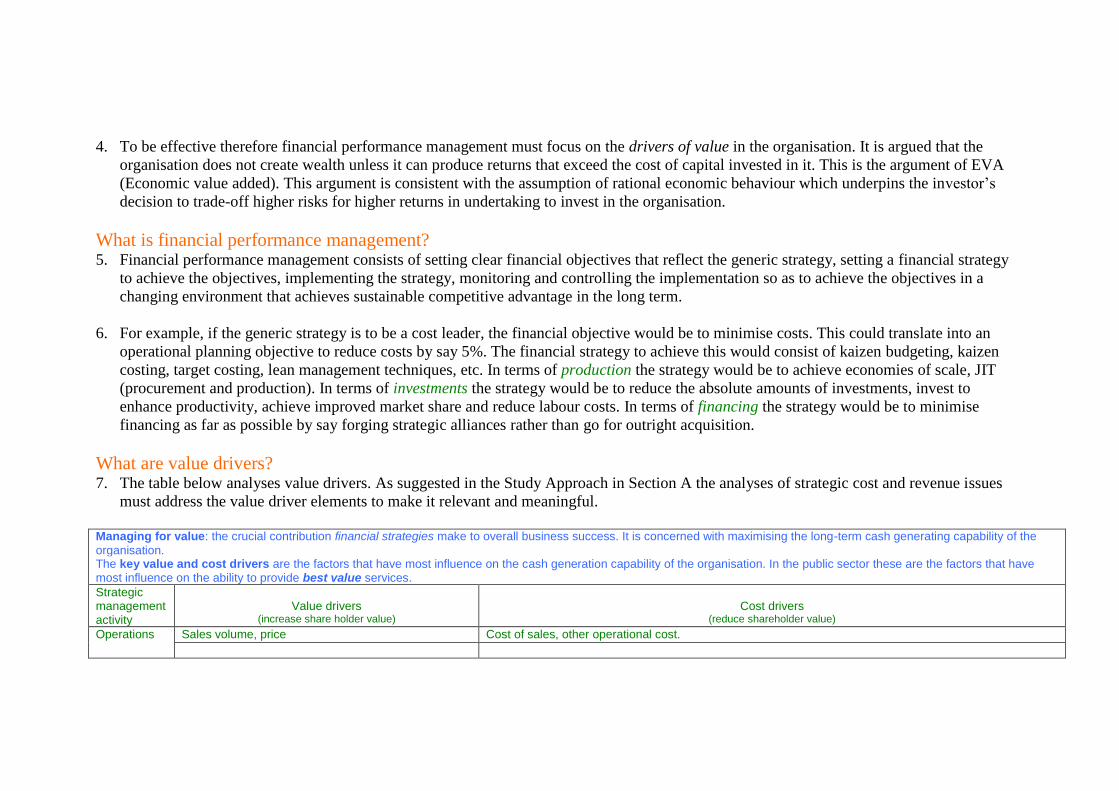
What are value drivers? 7. The table below analyses value drivers. As suggested in the Study Approach in Section A the analyses of strategic cost and revenue issues
must address the value driver elements to make it relevant and meaningful.
Managing for value: the crucial contribution financial strategies make to overall business success. It is concerned with maximising the long-term cash generating capability of the
organisation. The key value and cost drivers are the factors that have most influence on the cash generation capability of the organisation. In the public sector these are the factors that have most influence on the ability to provide best value services.
Strategic management activity
Value drivers
(increase share holder value)
Cost drivers
(reduce shareholder value)
Operations Sales volume, price Cost of sales, other operational cost.
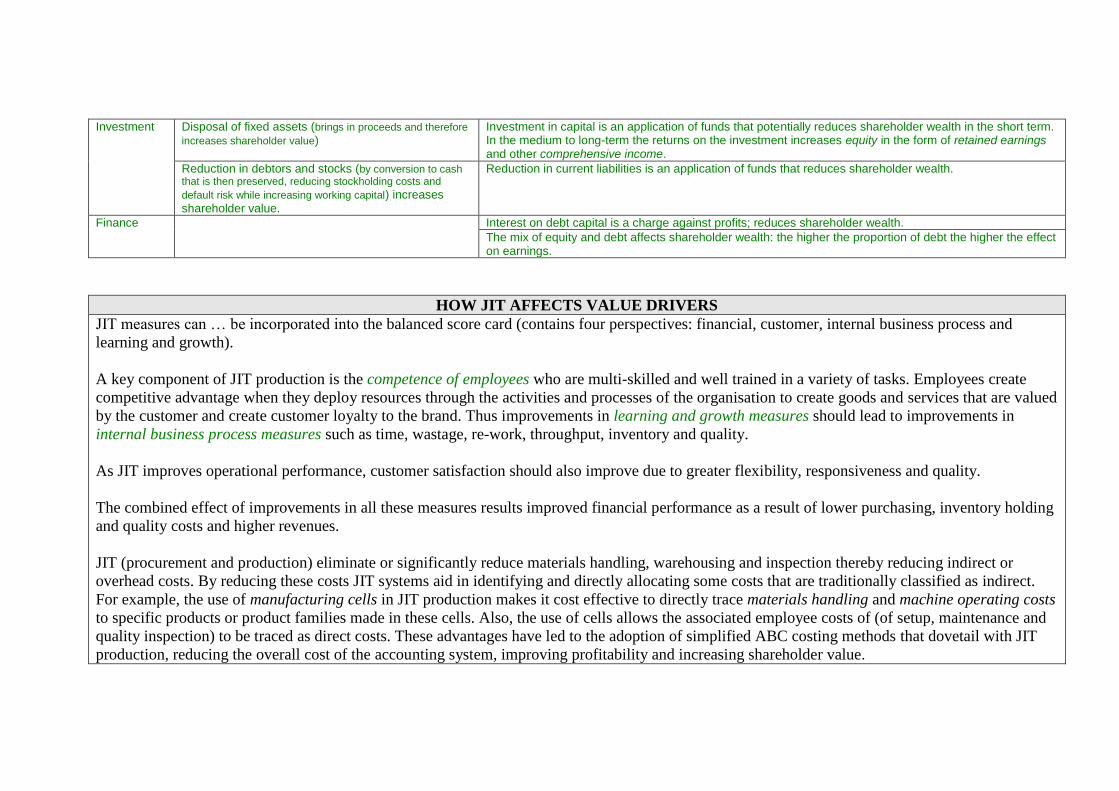
Investment Disposal of fixed assets (brings in proceeds and therefore
increases shareholder value) Investment in capital is an application of funds that potentially reduces shareholder wealth in the short term. In the medium to long-term the returns on the investment increases equity in the form of retained earnings and other comprehensive income.
Reduction in debtors and stocks (by conversion to cash that is then preserved, reducing stockholding costs and
default risk while increasing working capital) increases shareholder value.
Reduction in current liabilities is an application of funds that reduces shareholder wealth.
Finance Interest on debt capital is a charge against profits; reduces shareholder wealth.
The mix of equity and debt affects shareholder wealth: the higher the proportion of debt the higher the effect on earnings.
HOW JIT AFFECTS VALUE DRIVERS
JIT measures can … be incorporated into the balanced score card (contains four perspectives: financial, customer, internal business process and
learning and growth).
A key component of JIT production is the competence of employees who are multi-skilled and well trained in a variety of tasks. Employees create
competitive advantage when they deploy resources through the activities and processes of the organisation to create goods and services that are valued
by the customer and create customer loyalty to the brand. Thus improvements in learning and growth measures should lead to improvements in
internal business process measures such as time, wastage, re-work, throughput, inventory and quality.
As JIT improves operational performance, customer satisfaction should also improve due to greater flexibility, responsiveness and quality.
The combined effect of improvements in all these measures results improved financial performance as a result of lower purchasing, inventory holding
and quality costs and higher revenues.
JIT (procurement and production) eliminate or significantly reduce materials handling, warehousing and inspection thereby reducing indirect or
overhead costs. By reducing these costs JIT systems aid in identifying and directly allocating some costs that are traditionally classified as indirect.
For example, the use of manufacturing cells in JIT production makes it cost effective to directly trace materials handling and machine operating costs
to specific products or product families made in these cells. Also, the use of cells allows the associated employee costs of (of setup, maintenance and
quality inspection) to be traced as direct costs. These advantages have led to the adoption of simplified ABC costing methods that dovetail with JIT
production, reducing the overall cost of the accounting system, improving profitability and increasing shareholder value.
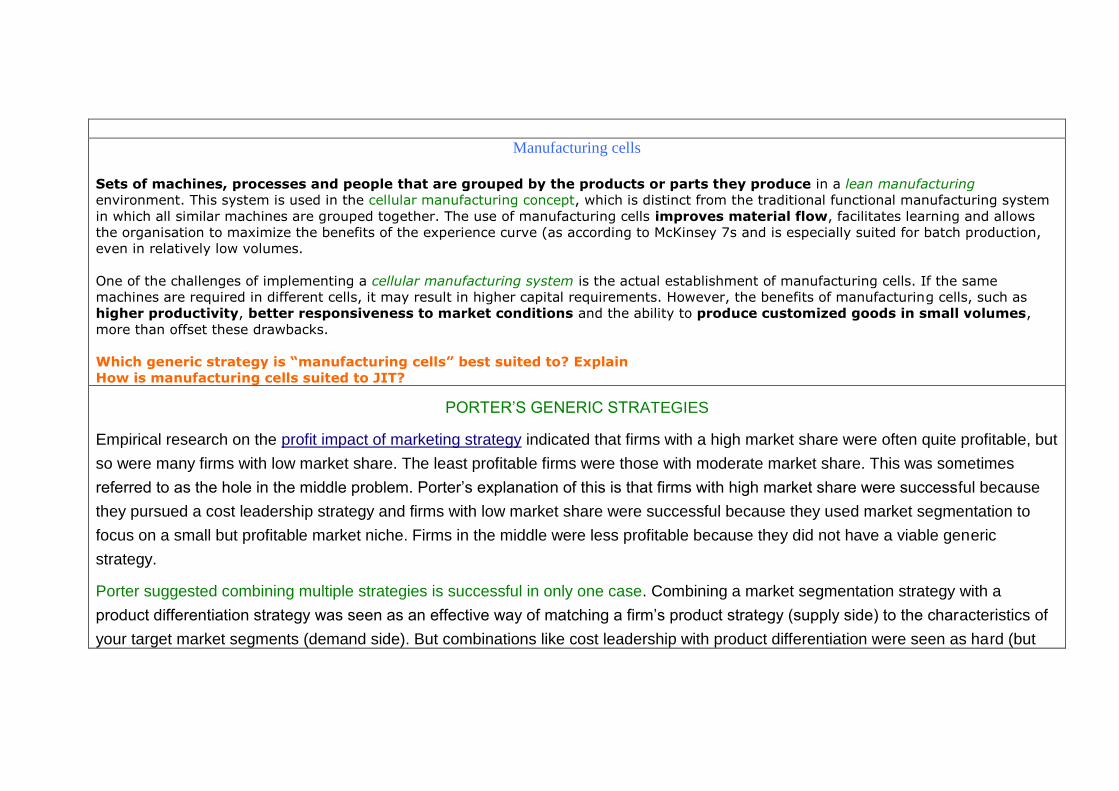
Manufacturing cells
Sets of machines, processes and people that are grouped by the products or parts they produce in a lean manufacturing
environment. This system is used in the cellular manufacturing concept, which is distinct from the traditional functional manufacturing system
in which all similar machines are grouped together. The use of manufacturing cells improves material flow, facilitates learning and allows
the organisation to maximize the benefits of the experience curve (as according to McKinsey 7s and is especially suited for batch production,
even in relatively low volumes.
One of the challenges of implementing a cellular manufacturing system is the actual establishment of manufacturing cells. If the same
machines are required in different cells, it may result in higher capital requirements. However, the benefits of manufacturing cells, such as
higher productivity, better responsiveness to market conditions and the ability to produce customized goods in small volumes,
more than offset these drawbacks.
Which generic strategy is “manufacturing cells” best suited to? Explain
How is manufacturing cells suited to JIT?
PORTER’S GENERIC STRATEGIES
Empirical research on the profit impact of marketing strategy indicated that firms with a high market share were often quite profitable, but
so were many firms with low market share. The least profitable firms were those with moderate market share. This was sometimes
referred to as the hole in the middle problem. Porter’s explanation of this is that firms with high market share were successful because
they pursued a cost leadership strategy and firms with low market share were successful because they used market segmentation to
focus on a small but profitable market niche. Firms in the middle were less profitable because they did not have a viable generic
strategy.
Porter suggested combining multiple strategies is successful in only one case. Combining a market segmentation strategy with a
product differentiation strategy was seen as an effective way of matching a firm’s product strategy (supply side) to the characteristics of
your target market segments (demand side). But combinations like cost leadership with product differentiation were seen as hard (but

not impossible) to implement due to the potential for conflict between cost minimization and the additional cost of value-added
differentiation.
Since that time, empirical research has indicated companies pursuing both differentiation and low-cost strategies may be more
successful than companies pursuing only one strategy.[1]
Some commentators have made a distinction between cost leadership, that is, low cost strategies, and best cost strategies. They claim
that a low cost strategy is rarely able to provide a sustainable competitive advantage. In most cases firms end up in price wars. Instead,
they claim a best cost strategy is preferred. This involves providing the best value for a relatively low price.
Examples of Cost Leadership & Strategy Marketing by Michael Smith, Demand Media
When it comes to marketing your business, there are three generic strategies you can use: focus, differentiation and cost leadership. While the cost
leadership strategy can be highly successful, it can be difficult to employ. It involves marketing your company as the cheapest source for a good or
service. This means that you need to minimize your costs and pass the savings on to your customers. By looking at examples of firms that have
employed this strategy successfully, you can see how it can benefit your own business.
Wal-Mart
Wal-Mart Stores Inc. has been successful using its strategy of everyday low prices to attract customers. The idea of everyday low prices is to
offer products at a cheaper rate than competitors on a consistent basis, rather than relying on sales. Wal-Mart is able to achieve this due to its large
scale and efficient supply chain. They source products from cheap domestic suppliers and from low-wage foreign markets. This allows the company
to sell their items at low prices and to profit off thin margins at a high volume.
McDonald's The restaurant industry is known for yielding low margins that can make it difficult to compete with a cost leadership marketing strategy. McDonald's
has been extremely successful with this strategy by offering basic fast-food meals at low prices. They are able to keep prices low through a division of
labour that allows it to hire and train inexperienced employees rather than trained cooks. It also relies on few managers who typically earn higher

wages. These staff savings allow the company to offer its foods for bargain prices.
Ikea The Swedish furniture retailer Ikea revolutionized the furniture industry by offering cheap but stylish furniture. Ikea is able to keep its prices low by
sourcing its products in low-wage countries and by offering a very basic level of service. Ikea does not assemble or deliver furniture; customers must
collect the furniture in the warehouse and assemble at home themselves. While this is less convenient than traditional retailers, it allows Ikea to offer
lower prices that attract customers.
Southwest Airlines The airline industry has typically been an industry where profits are hard to come by without charging high ticket prices. Southwest Airlines
challenged this concept by marketing itself as a cost leader. Southwest attempts to offer the lowest prices possible by being more efficient than
traditional airlines. They minimize the time that their planes spend on the tarmac in order to keep them flying and to keep profits up. They also offer
little in the way of additional thrills to customers, but pass the cost savings on to them.
8.
b) Justify the crucial objectives of survival and business growth. [3] Focus notes
- The reasoning that is done: explain why survival and growth are imperatives of organisations
- Analyse the implications of this in terms of performance management e.g. organisations needing to be outward and forward looking (feedforward) as well as being
backward looking (feedback).
- Discuss the use of certain performance management techniques in terms of how they contribute to survival and growth. Examples: strategic planning, strategic
management accounting, beyond budgeting, lifecycle costing, lean accounting, backflush costing,
Why survival and growth are imperative strategic objectives pursued by organisations 9. The stakeholders of an organisation, e.g. investors in a profit making enterprise, have expectations of continued growth and long-term
survival. The value investor expects her investment to grow in value. The income investor expects her income to grow over the long term. To
achieve these objectives the business needs to be competitive by continuously improving value propositions to the customer at a price the
customer is willing to pay. To secure customer loyalty these value propositions need to be superior to those of competitors. This superiority
needs to be sustained over the long term otherwise customers will switch loyalty to competitors, particularly in an industry such as grocery,
motor cars, merchandising and IT that provides commodities. Sustaining superiority requires maintenance of strategic capabilities such as
plants, staff competences and IT infrastructure. This requires that the business is adequately profitable and is generating adequate operating
cash flows to provide for renewal and working capital. This is achieved only if the business survives and grows in a controlled and managed
way so it does not overtrade and run out of cash.
The implications of the survival and growth imperatives for performance management 10. The implications of the above for performance management are that the firm needs to be forward and outward looking (feedforward) as
well as backward looking (feedback) to learn lessons from previous performance management practices. In terms of strategy the business
needs to avoid strategic drift (the incremental adjustments by bargaining and negotiation of past strategies to fit current circumstances
without taking adequate account of environmental changes. In such a situation there is “culture capture” – the taken for granted assumptions
of the organisation such as “growth will happen as a matter of course” significantly influence strategy formulation). According to Porter the
firm needs to analyse the environment rigorously and develop adequate strategies that respond to the challenges adequately (select generic
strategy by design that achieves advantage over the long term). It then needs to choose its competitive strategy to execute its generic
strategy. At the implementation stage it needs to analyse and manage its value chain effectively (value chain analysis) to ensure it achieves
sustainable competitive advantage.
11. In terms of performance management the firm needs strategic management information to allow continuous monitoring of the competitive
environment. Performance indicators are measured relative to competitors to assess the firm’s performance relative to its competitors so that
adequate control action can be taken to achieve objectives, overcome threats and take advantage of opportunities. Frameworks such as the
balanced scorecard are used to provide comprehensive information for effective strategic management. The performance pyramid is used
to ensure strategic alignment between mission, objectives, strategies and resources and the support systems contingent on the culture to
maximise organisational effectiveness.
12. Survival and growth imply an explicit focus on understanding stakeholders and their needs. The performance prism is an essential tool to
identify all the stakeholders, their needs, what the organisation expects from them and the resources and competences that would be needed
(strategic capabilities) to fulfil their expectations. In terms of value proposition to the customer in order to maintain strategic capability all
the techniques designed to achieve quality and promote efficiency are deployed appropriately, depending on the generic strategy being
pursued. Examples of techniques are lean accounting, JIT, lifecycle costing, target costing, ABC, six sigma, value engineering, obsolescence
planning, etc.
13.
c) Discuss the appropriateness of, and apply different measures of performance, including: [3]
Tesco plc 2012 http://www.tescoplc.com/files/pdf/reports/tesco_annual_report_2012.pdf
http://www.tesco.com/investorInformation/report97/review/page11.html
Comparative analysis of Tesco plc and Wal-mart http://essaybank.degree-essays.com/accounting/business-report-of-tesco-and-wal-mart.php
Investor investigates food and retailing sector to assess
investment prospects
http://www.scribd.com/doc/39455198/TESCO-Financial-Analysis
i) Return on Capital Employed (ROCE)
ii) Return on Investment (ROI)
iii) Earnings Per Share (EPS)
iv) Earnings Before Interest, Tax, Depreciation and Amortisation (EBITDA)
v) Residual Income (RI)
vi) Net Present value (NPV)
vii) Internal rate of return and modified internal Rate of Return (IRR, MIRR)
viii) Economic Value Added (EVA TM)
Focus notes:
- The key idea to bear in mind as you study the measures is that the measures need to be appropriate and used in combination because no one measure fully depicts the
performance of the organisation to its various stakeholders.
- The other thing to bear in mind is that the measures to be meaningful they need to be interpreted relative to i) a benchmark e.g. industry average, ii) the environment e.g.
constraints, iii) other conditions e.g. PESTEL factors, events, etc
- Above all the measures need to be appropriate to the strategy and its objectives.

- Each of the measures has limitations that need to be discussed and evaluated in terms of whether they matter to the interpretation of performance. If so to what extent and
how can these limitations be overcome either by using a combination of measures or by using a modified version as in MIRR.
- Therefore it is good learning practice to always ask (as with the various frameworks, concepts and tools): i) what does this measure give me that the other does not? ii)
which measure is most crucial and why? And to which of the stakeholders? iii) how can I best combined the measures to present the performance of the business?
14. The above measures are all relevant to shareholders the principal stakeholders in an organisation.
Definition Appropriateness Problems and limitations Return on
Capital
Employed
(ROCE)
Return on capital employed (ROCE) is the rate of return a
business is making on the total capital employed in the
business. Capital will include all sources of funding
(shareholders funds + debt). To be consistent with this the return
should be taken prior to interest (the return to lenders) and tax. It is
therefore:
EBIT ÷ (shareholders funds + debt)
RoE is a similar measure which looks only at the returns to
shareholders. Return on equity (RoE) is normally higher than
ROCE and is affected by the level of debt because the interest
charge is deducted to arrive at the return.
Return on operating capital employed is a variant of ROCE
that looks at the operations of the business only, ignoring
the effects of cash holdings and provisions. It is therefore a
Appropriate for evaluating the efficiency of asset
utilisation where the company’s asset base is large
and fixed e.g. manufacturing.
Not appropriate for service industries that don’t
rely on asset base to create value. The value
determinants in such industries are predominantly
people whose value is not measured and
recognised in the balance sheet. Hence ROCE
would be misleading in such circumstances.
Not appropriate for technology companies that rely
on intangibles such as intellectual property rights.
Royalties, patents and brands generate income
passively i.e. income accrues based on contracts
rather than from active use. Therefore, the
efficiency measure of ROCE is not meaningful.
The main drawback of ROCE is that
it measures return against the book
value of assets in the business. As
these are depreciated the ROCE
may increase even though cash
flow has remained the same has
reduced. Thus, older businesses
with depreciated assets will tend to
have higher ROCE than newer,
possibly better businesses. In
addition, while cash flow is affected
by inflation, the book value of
assets is not. Consequently,
Definition Appropriateness Problems and limitations
better measure of how efficiently the actual business is run
and is more comparable across companies.
Comparisons across companies using any measure of return
on capital require that numbers for both profit and capital
are comparable. This means looking closely at a range of
accounting policies and adjusting where necessary. For
example, differences in amortisation, depreciation or
revaluation policies that change the amount of capital
employed.
revenues increase with inflation
while capital employed generally
does not (as the book value of assets
is not affected by inflation being
historic cost values; but they may
be revalued in accordance with IAS
16 to bring the book value into line
with fair values).
http://moneyterms.co.uk/roce/
Return on
Investment
(ROI)
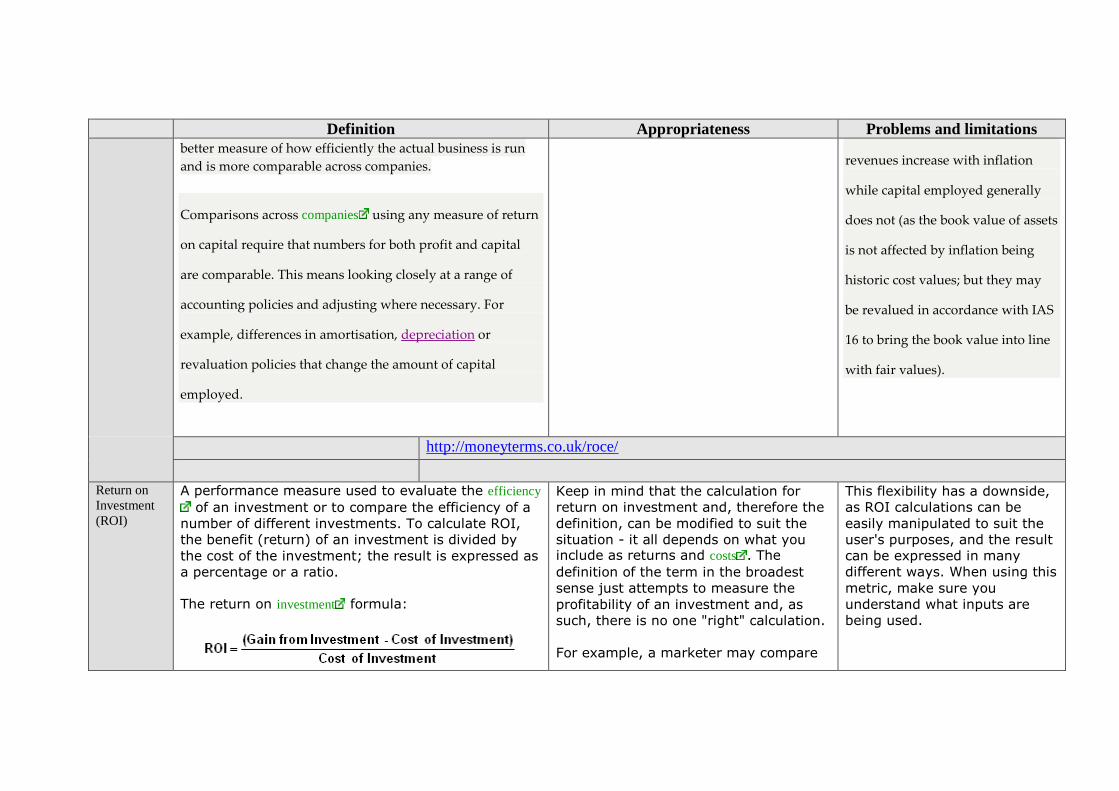
A performance measure used to evaluate the efficiency
of an investment or to compare the efficiency of a
number of different investments. To calculate ROI,
the benefit (return) of an investment is divided by
the cost of the investment; the result is expressed as
a percentage or a ratio.
The return on investment formula:
Keep in mind that the calculation for
return on investment and, therefore the
definition, can be modified to suit the
situation - it all depends on what you include as returns and costs . The
definition of the term in the broadest
sense just attempts to measure the
profitability of an investment and, as
such, there is no one "right" calculation.
For example, a marketer may compare
This flexibility has a downside,
as ROI calculations can be
easily manipulated to suit the
user's purposes, and the result
can be expressed in many
different ways. When using this
metric, make sure you
understand what inputs are
being used.

Definition Appropriateness Problems and limitations
In the above formula "gains from investment", refers
to the proceeds obtained from selling the investment
of interest. Return on investment is a very popular
metric because of its versatility and simplicity. That
is, if an investment does not have a positive ROI, or
if there are other opportunities with a higher ROI,
then the investment should not be undertaken.
Another way to calculate ROI is to divide net profit by
total assets thus:
ROI = Net Profit/Total assets
two different products by dividing
the gross profit that each product has
generated by its respective marketing
expenses. A financial analyst, however,
may compare the same two products
using an entirely different ROI
calculation, perhaps by dividing the net
income of an investment by the total value of all resources that have been
employed to make and sell the product.

Definition Appropriateness Problems and limitations Earnings Per
Share (EPS) Earnings per share (EPS) is a commonly used phrase in the financial world. Earnings per share represents a portion of a company's profit that is allocated to one share of stock. Although there are many online calculators available that will calculate an EPS sum automatically, many investors find it important to be able to do these calculations on their own.
Calculated as:
When calculating, it is more accurate to use
a weighted average number of shares outstanding
over the reporting term, because the number of
shares outstanding can change over time. However,
data sources sometimes simplify the calculation by
using the number of shares outstanding at the end of
the period.
Diluted EPS expands on basic EPS by including the
shares of convertibles or warrants outstanding in the
outstanding shares number.
Earnings per share is generally
considered to be the single
most important variable in determining
a share's price. It is also a major
component used to calculate the price-
to-earnings valuation ratio.
For example, assume that a company
has a net income of $25 million. If the
company pays out $1 million in
preferred dividends and has 10 million
shares for half of the year and 15 million
shares for the other half, the EPS would
be $1.92 (24/12.5). First, the $1 million
is deducted from the net income to get
$24 million, then a weighted average is
taken to find the number of shares
outstanding (0.5 x 10M+ 0.5 x 15M =
12.5M).
EPS can be further subdivided according to the time period involved. Profitability can be assessed by prior (trailing) earnings, recent (current) earnings, or projected future
Though earning per share is widely considered to be the most popular method of quantifying a firm's profitability, it's important to remember that earnings themselves can often be susceptible to manipulation, accounting changes, and restatements. For that reason, free cash flow is seen by some to be a more reliable indicator than EPS. Nevertheless, Earnings per share remains the industry standard in determining corporate profitability for shareholders.
Definition Appropriateness Problems and limitations
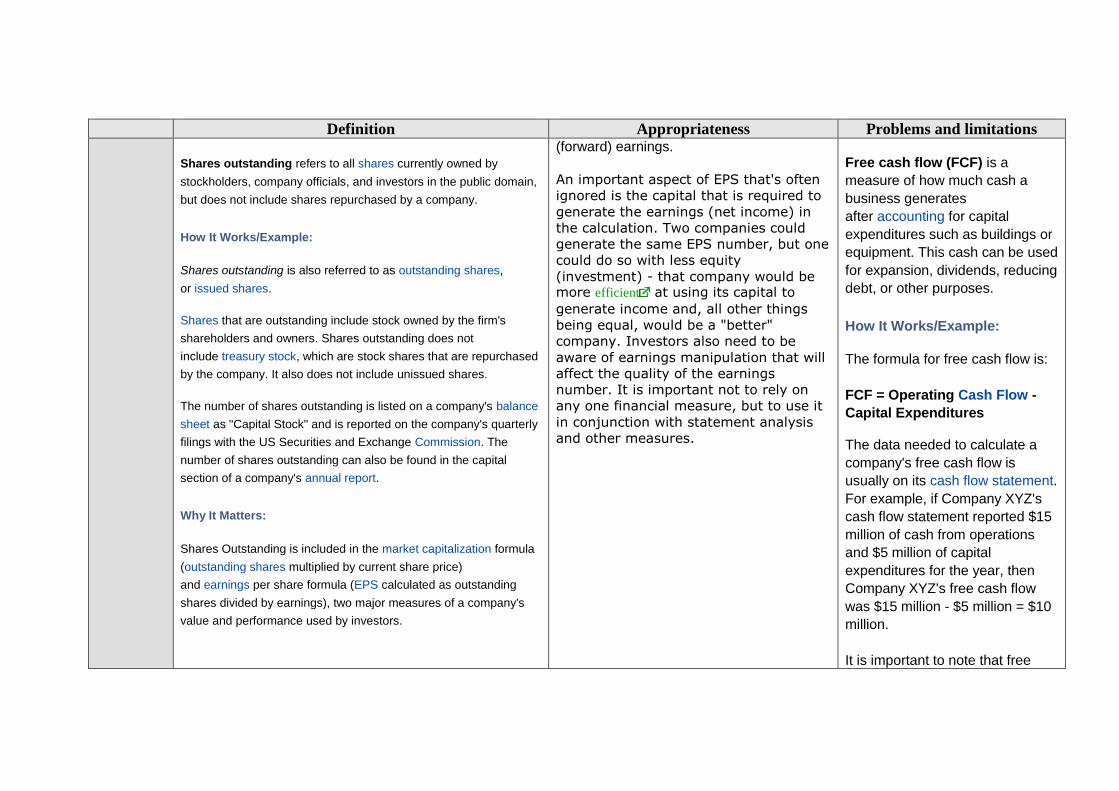
Shares outstanding refers to all shares currently owned by
stockholders, company officials, and investors in the public domain,
but does not include shares repurchased by a company.
How It Works/Example:
Shares outstanding is also referred to as outstanding shares,
or issued shares.
Shares that are outstanding include stock owned by the firm's
shareholders and owners. Shares outstanding does not
include treasury stock, which are stock shares that are repurchased
by the company. It also does not include unissued shares.
The number of shares outstanding is listed on a company's balance
sheet as "Capital Stock" and is reported on the company's quarterly
filings with the US Securities and Exchange Commission. The
number of shares outstanding can also be found in the capital
section of a company's annual report.
Why It Matters:
Shares Outstanding is included in the market capitalization formula
(outstanding shares multiplied by current share price)
and earnings per share formula (EPS calculated as outstanding
shares divided by earnings), two major measures of a company's
value and performance used by investors.
(forward) earnings.
An important aspect of EPS that's often
ignored is the capital that is required to
generate the earnings (net income) in
the calculation. Two companies could
generate the same EPS number, but one
could do so with less equity
(investment) - that company would be more efficient at using its capital to
generate income and, all other things
being equal, would be a "better"
company. Investors also need to be
aware of earnings manipulation that will
affect the quality of the earnings
number. It is important not to rely on
any one financial measure, but to use it
in conjunction with statement analysis
and other measures.
Free cash flow (FCF) is a
measure of how much cash a
business generates
after accounting for capital
expenditures such as buildings or
equipment. This cash can be used
for expansion, dividends, reducing
debt, or other purposes.
How It Works/Example:
The formula for free cash flow is:
FCF = Operating Cash Flow -
Capital Expenditures
The data needed to calculate a
company's free cash flow is
usually on its cash flow statement.
For example, if Company XYZ's
cash flow statement reported $15
million of cash from operations
and $5 million of capital
expenditures for the year, then
Company XYZ's free cash flow
was $15 million - $5 million = $10
million.
It is important to note that free

Definition Appropriateness Problems and limitations
cash flow relies heavily on the
state of a company's cash from
operations, which in turn is heavily
influenced by the company's net
income. Thus, when the company
has recorded a significant amount
of gains or expenses that are not
directly related to the company's
normal core business (a one-time
gain on the sale of an asset, for
example), the analyst or investor
should carefully exclude those
from the free cash flow calculation
to get a better picture of the
company's normal cash-
generating ability.
Investors should also be aware
that companies can influence their
free cash flow by lengthening the
time they take to pay the bills
(thus preserving their cash),
shortening the time it takes to
collect what's owed to them
(accelerating the receipt of cash),
and putting off
buying inventory (again,
preserving cash). It is also
important to note that companies

Definition Appropriateness Problems and limitations
have some leeway about what
items are or are not considered
capital expenditures, and the
investor should be aware of this
when comparing the free cash
flow of different companies.
Why It Matters:
The presence of free cash
flow indicates that a company has
cash to expand, develop new
products, buy back stock, pay
dividends, or reduce its debt. High
or rising free cash flow is often a
sign of a healthy company that is
thriving in its current environment.
Furthermore, since FCF has a
direct impact on the worth of a
company, investors often hunt for
companies that have high or
improving free cash flow but
undervalued share prices -- the
disparity often means the share
price will soon increase.
Free cash flow measures a
company's ability to generate
cash, which is a fundamental

Definition Appropriateness Problems and limitations
basis for stock pricing. This is why
some people value free cash flow
more than just about any other
financial measure out there,
including earnings per share.
How to calculate EPS http://www.wikihow.com/Calculate-Earnings-Per-Share Interpreting PE ratio http://economics.about.com/cs/finance/l/aa030503a.htm
Earnings
Before
Interest,
Tax,
Depreciation
and
Amortisation
(EBITDA)
Earnings Before Interest, Taxes, Depreciation and Amortization. A
measure of a company's ability to produce income on its
operations in a given year. (it can be an approximate measure
of a company's operating cash flow based on data from the
company's income statement).
EBITDA is calculated by looking at earnings before
Apart from the use mentioned above, EBITDA is widely
used in loan covenants, mostly in the following two
metrics:
Leverage: Debt/EBITDA. This metric measures the
amount of debt in relation to the EBITDA, i.e. how does
the debt relate to the operational profit generating ability
Why EBITDA may be risky
and inappropriate
EBITDA can be used to analyze and compare profitability between companies and industries because it eliminates the effects of financing and accounting decisions. However, this is a non-GAAP measure that allows for greater discretion in terms of what is

Definition Appropriateness Problems and limitations
the deduction of interest expenses, taxes, depreciation, and
amortization. (It is important to note that EBITDA does not
account for one-off or otherwise unusual revenues and
expenses, only recurring ones.)
This earnings measure is of particular interest in cases
where companies have large amounts of fixed assets which
are subject to heavy depreciation charges (such as manufacturing
companies) or in the case where a company has a large amount of
acquired intangible assets on its books and is thus subject to large
amortization charges (such as a company that has purchased
a brand or a company that has recently made a large acquisition).
Since the distorting accounting and financing effects on company
earnings do not factor into EBITDA, it is a good way of comparing
companies within and across industries. This measure is also of
interest to a company's creditors, since EBITDA is essentially
the income that a company has free for interest payments.
In general, EBITDA is a useful measure only for large companies
with significant assets, and/or for companies with a significant
amount of debt financing. It is rarely a useful measure for
evaluating a small company with no significant loans.
of the company. Whilst there is no absolute target and
whilst leverage ratios differ widely, it can probably be
argued that a leverage >3 is unhealthy for most
businesses.
Interest Cover (EBITDA/Interest Expense). This metric
measures the ability of a company to generate profit out of
its operations to cover the interest payments. Again there
is no absolute target for this value as the ratio that is
required obviously depends on taxes, working capital
needs, capital expenditures and the repayment needs of
the principal. However, it is clear that a ratio <1 is not
sustainable for long.
(and is not) included in the calculation. This also means that companies often change the items included in their EBITDA calculation from one reporting period to the next.
EBITDA came on the scene during the leveraged buyout boom of the 1980s, when it was used to indicate the ability of a company to service debt. As time passed, it became popular in industries with expensive assets that had to be written down over long periods. EBITDA now is quoted commonly by many companies, especially in the tech sector, even when it is not warranted. (Why do tech companies like this measure and why may it not be warranted within the tech industry?)
A common misconception is that EBITDA represents cash earnings. EBITDA is a good metric to evaluate profitability but not cash flow.
EBITDA also leaves out the cash required to fund working capital and the replacement of old equipment, which can be significant. Consequently, EBITDA often is used as an accounting gimmick to dress up a company's earnings (P2: management of earnings, the moral hazard problem). Investors
should not look at EBITDA alone but also look at other performance measures to help identify whether a company is hiding something in its

Definition Appropriateness Problems and limitations
Sometimes also called operational cash flow.
EBITDA results.
- Makes companies look cheaper than they really are
- Ignores quality of earnings
- No substitute for cash flow
- Skews interest coverage
A Clear Look At EBITDA (analysis and evaluation of benefits
and pitfalls) http://www.investopedia.com/articles/06/ebitda.asp#axzz296KaQNQr
Related terms http://financial-dictionary.thefreedictionary.com/EBITDA
Residual
Income (RI) The concept of residual income dates back to Alfred Marshall in the
late 1880s. In 1920s General Motors used the concept to evaluate
its business segments. Residual income is often called
Economic Value Added (EVA) as copyrighted by Stern Stewart &
Co, a consulting firm, in 1994.
Residual income is a company or division performance measure. It
can also be used to evaluate investment alternatives. 2. Residual come formula

Definition Appropriateness Problems and limitations
To calculate the residual income, the following formula can be used:
Residual Income = Income from Operations – Minimum Acceptable Income
Residual income is a dollar amount, which can be either positive
or negative:
When a positive residual income takes place, a company (division,
segment, investment) is creating wealth.
When a negative residual income takes place, a company (division,
segment, investment) is consuming capital.
The following residual income calculations exist:
Income from operations less minimum acceptable income (i.e.,
minimum return on operational assets)
Net income less equity charge
Net operating profits after tax (NOPAT) less capital charge
Companies can use the following income values: income from
operations (IFO) or earnings before interest and taxes (EBIT), net
operating profit after tax (NOPAT), net income, etc.
The minimum acceptable income is usually determined by
multiplying average operating assets by a minimum rate of return
(i.e., weighted average cost of capital). For example, if division A
has $200,000 of average operating assets and the top management
established 10% as the minimum acceptable rate of return (i.e.,
based on the cost of financing the business operations), then the

Definition Appropriateness Problems and limitations
minimum acceptable income for division A is $20,000 (i.e.,
$200,000 x 10%).
Instead of the minimum return on operational assets, companies
can use an equity charge or capital charge. The equity charge is
the estimated cost of equity capital. It is determined by multiplying
equity capital by the cost of equity capital. The capital charge is the
estimated total cost of capital: it includes both the debt charge and
the equity charge.
Net Present
value (NPV) The difference between the present value of the future cash
flows from an investment and the amount of investment.
Present value of the expected cash flows is computed
by discounting them at the required rate of return.
For example, an investment of $1,000 today at
10 percent will yield $1,100 at the end of the year; therefore, the
present value of $1,100 at the desired rate of return (10 percent)
is $1,000. The amount of investment ($1,000 in this example) is
deducted from this figure to arrive at net present value which here
is zero ($1,000-$1,000).
A zero net present
value means the project repays original investmen
t plus the required rate of return. A positive net
present value means a better return, and a
negative net present value means a worse return,
than the return from zero net present value. It is
one of the two discounted cash flow
techniques (the other is internal rate of return)
used in comparative appraisal of investment
proposals where the flow of income varies over
time.
Internal rate
of return and
modified
internal Rate
of Return
(IRR,
The discount rate often used in capital budgeting that
makes the net present value of all cash flows from a
particular project equal to zero. Generally speaking,
the higher a project's internal rate of return, the
more desirable it is to undertake the project. As
such, IRR can be used to rank several prospective
You can think of IRR as the rate of
growth a project is expected to
generate. While the actual rate of return
that a given project ends up generating
will often differ from its estimated IRR
rate, a project with a substantially
Internal rate of return (IRR) has never
had a good academic press.
Compared with net present value
(NPV), IRR has many drawbacks: it is
only a relative measure of value
creation, it can have multiple answers,

Definition Appropriateness Problems and limitations MIRR) projects a firm is considering. Assuming all other
factors are equal among the various projects, the
project with the highest IRR would probably be
considered the best and undertaken first.
higher IRR value than other available
options would still provide a much better
chance of strong growth.
IRRs can also be compared against
prevailing rates of return in the
securities market. If a firm can't find
any projects with IRRs greater than the
returns that can be generated in the
financial markets, it may simply choose
to invest its retained earnings into the
market.
it’s difficult to calculate, and it appears
to make a reinvestment
assumption that is unrealistic. But
financial managers like it. IRR
expresses itself as a percentage
measure of project performance; it also
provides a useful tool to measure
‘headroom’ when negotiating with
suppliers of funds.
IRR example calculations and relationship to NPV http://office.microsoft.com/en-us/excel-help/irr-HP005209146.aspx
MODIFIED IRR
While the internal rate of return (IRR) assumes the cash flows from a project are reinvested at the IRR, the modified IRR assumes that positive cash flows are reinvested at the firm's cost of capital, and the initial outlays are financed at the firm's financing cost. Therefore, MIRR more accurately reflects the cost and profitability of a project.
The formula for MIRR is:

Definition Appropriateness Problems and limitations example
For example, say a two-year project with an initial
outlay of $195 and a cost of capital of 12%, will
return $121 in the first year and $131 in the second
year. To find the IRR of the project so that the net
present value (NPV) = 0:
NPV = 0 = -195 + 121/(1+ IRR) + 131/(1 +
IRR)2 NPV = 0 when IRR = 18.66%
To calculate the MIRR of the project, we have to
assume that the positive cash flows will be reinvested
at the 12% cost of capital. So future value of the
positive cash flows is computed as:
$121(1.12) + $131 = $266.52 = Future Value of
positive cash flows at t = 2
Now you divide the future value of the cash flows by
the present value of the initial outlay, which was
$195, and find the geometric return for 2 periods.
=sqrt ($266.52/195) -1 = 16.91% MIRR
You can see here that the 16.91% MIRR is materially lower than
the IRR of 18.66%. In this case, the IRR gives a too optimistic
picture of the potential of the project, while the MIRR gives a more
realistic evaluation.
MIRR examples http://office.microsoft.com/en-gb/excel-help/mirr-HP005209180.aspx

Definition Appropriateness Problems and limitations
Modified IRR ACCA http://www.accaglobal.com/content/dam/acca/global/PDF-students/2012/sa_apr08_ryan_revised.pdf
Economic
Value
Added
(EVA TM)
Economic value added (EVA) is an internal management performance
measure that compares net operating profit to total cost of capital. Stern
Stewart & Co. is credited with devising this trademarked concept.
How It Works/Example:
Economic value added (EVA) is also referred to as economic profit.
The formula for EVA is:
EVA = Net Operating Profit After Tax - (Capital Invested x WACC)
As shown in the formula, there are three components necessary to solve
EVA: net operating profit after tax (NOPAT), invested capital, and
the weighted average cost of capital (WACC) operating profit after
taxes (NOPAT) can be calculated, but can usually be easily found on
the corporation's income statement.
The next component, capital invested, is the amount of money used to fund
a particular project. We will also need to calculate the weighted-average cost
of capital (WACC) if the information is not provided.
The idea behind multiplying WACC and capital investment is to assess a
charge for using the invested capital. This charge is the amount that
investors as a group need to make their investment worthwhile.
Let's take a look at an example.
Assume that Company XYZ has the following components to use in the EVA
Why It Matters:
Economic Value Added (EVA) is important because it is
used as an indicator of how profitable company projects
are and it therefore serves as a reflection of management
performance.
The idea behind EVA is that businesses are only truly
profitable when they create wealth for their shareholders,
and the measure of this goes beyond calculating net
income. Economic value added asserts that businesses
should create returns at a rate above their cost of capital
The economic value calculation has many advantages. It
succinctly summarizes how much and from where a
company created wealth. It includes the balance sheet in
the calculation and encourages managers to think about
assets as well as expenses in their decisions.
However, the seemingly infinite cash
adjustments associated with calculating
economic value can be time-consuming. And
accrual distortions can still affect the
measure, particularly when it comes to
depreciation and amortization differences.
Also, economic value added only applies to
the period measured; it is not predictive of
future performance, especially for companies
in the midst of reorganization and/or about to
make large capital investments.
The EVA calculation depends heavily on
invested capital, and it is therefore most
applicable to asset-intensive companies that
are generally stable. Thus, EVA is more
useful for auto manufacturers, for example,
than software companies or service
companies with a lot of intangible assets.
http://www.investinganswers.com/financial-dictionary/financial-statement-
analysis/economic-value-added-eva-2925

Definition Appropriateness Problems and limitations
formula:
NOPAT = $3,380,000
Capital Investment = $1,300,000
WACC = .056 or 5.60%
EVA = $3,380,000 - ($1,300,000 x .056) = $3,307,200
The positive number tells us that Company XYZ more than covered its cost of
capital. A negative number indicates that the project did not make enough profit to
cover the cost of doing business.
ACCA examples
15.
d) Discuss why indicators of liquidity and gearing need to be considered in conjunction with profitability. [3] Focus notes: -
Definition of liquidity
16. Cash, cash equivalents and other assets (liquid assets) that can be easily converted into cash (liquidated). In the case of a market, a stock or a commodity, the extent to which there are sufficient buyers and sellers to ensure that a few buy or sell orders would not move prices very much. Some markets are highly liquid; some are relatively illiquid.
The term also means how easy it is to perform a transaction in a particular security or instrument. A liquid security, such as a share in a large listed company or a sovereign bond, is easy to price and can be bought or sold without significant price impact. With an illiquid instrument, trying to buy or sell may change the price, if it is even possible to transact. Example Banks need to hold enough to cover expected demands from depositors, creditors and counterparties. During the global financial crisis it became clear that many assets were a lot harder to sell than banks had expected. Now the Basel Committee plans to require banks to keep enough liquid assets, such as cash and government bonds, to get through a 30-day market crisis. There will also be a second ratio that tries to match a bank's overall liquidity needs to its liabilities over a longer timeframe.
Indicators of liquidity
17. For a corporation with a published balance sheet there are various ratios used to calculate a measure of liquidity. These include the following:
the current ratio, which is the simplest measure and is calculated by dividing the total current assets by the total current liabilities. A value of over 100% is normal in a non-banking corporation. However, some current assets are more difficult to sell at full value in a hurry.
the quick ratio - calculated by deducting inventories and prepayments from current assets and then dividing by current liabilities - gives a measure of the ability to meet current liabilities from assets that can be readily sold. A better way for a trading corporation to meet liabilities is from cash flows, rather than through asset sales, so;
the operating cash flow ratio can be calculated by dividing the operating cash flow by current liabilities. This indicates the ability to service current debt from current income, rather than through asset sales.
18. For different industries and differing legal systems the use of differing ratios and results would be appropriate. For instance, in a country with a legal system that gives a slow or uncertain result a higher level of liquidity would be appropriate to cover the uncertainty related to the valuation of assets. A manufacturer with stable cash flows may find a lower quick ratio more appropriate than an Internet-based start up corporation.
Definition of gearing

19. Gearing focuses on the capital structure of the business – that means the proportion of finance that is provided by debt relative to the finance
provided by equity (or shareholders). The gearing ratio is also concerned with liquidity. However, it focuses on the long-
term financial stability of a business. Gearing (otherwise known as "leverage") measures the proportion of assets
invested in a business that are financed by long-term borrowing. In theory, the higher the level of borrowing
(gearing) the higher are the risks to a business, since the payment of interest and repayment of debts are not
"optional" in the same way as dividends. However, gearing can be a financially sound part of a business's capital
structure particularly if the business has strong, predictable cash flows.
Indicators of gearing
20. The formula for calculating gearing is:
Long-term liabilities include loans due more than one year + preference shares + mortgages
Capital employed = Share capital + retained earnings + long-term liabilities
The gearing calculation can be calculated like this:

2012
£’000
2011
£’000
Long-term liabilities 1,200 1,450
Capital employed 5,655 4,675
Gearing ratio 21.2% 31.0%
21. According to the data the gearing ratio at 31 December 2012 was 21.2%, a reduction from 31.0% a year
earlier. This was largely because the business reduced long-term borrowings by £200,000 and added over
£1million to retained earnings.
How can the gearing ratio be evaluated?
A business with a gearing ratio of more than 50% is traditionally said to be “highly geared”.
A business with gearing of less than 25% is traditionally described as having “low gearing”
Something between 25% - 50% would be considered normal for a well-established business which is happy to
finance its activities using debt.
For the above business, that would suggest that the business is relatively lowly-geared and that the capital structure of
the business is pretty safe and cautious.
It is important to remember that financing a business through long-term debt is not necessarily a bad thing! Long-
term debt is normally cheap, and it reduces the amount that shareholders have to invest in the business.
What is a sensible level of gearing? Much depends on the ability of the business to grow profits and generate positive
cash flow to service the debt. A mature business which produces strong and reliable cash flows can handle a much
higher level of gearing than a business where the cash flows are unpredictable and uncertain.
LIQUIDITY, GEARING AND PROFITABILITY
22. The profitability objective requires that the funds of the firm are used to maximize profits. Thus liquidity and profitability are very closely
related and may conflict in some of the decisions of the organisation. For example, if levels of raw material inventory are increased to hedge
against expected price increases , the profitability objective may be achieved at the cost of increased liquidity. Similarly, the firm may
relax credit policy (increasing risk) in order to boost sales, but its liquidity would decrease as a result.
23. A company may increase its profitability by having a very high debt to equity ratio e.g. where sales are increased and per unit cost of sales is
reduced at the same time as a result of increased volumes made possible by a large plant financed by a loan. However, when the company
secures a loan, it is committed to making regular payments of interest and capital, thus reducing its liquidity. Efficient financial management
means that increased profitability as a result of the loan has to exceed expected decreases in liquidity as a result of servicing the loan.
24. In all areas of financial management, the financial manager is faced with the choice of risk and profit and generally he seeks to achieve the
right balance between the two. This requires a clear financial strategy and proactive cash and profitability management e.g. forecasting
income and cash flows and modelling the effects of various scenarios to determine safe and affordable levels of debt compatible with the
anticipated levels of profitability.
25. Affordability of debt may be indicated by the interest cover - Profit/Interest, the number of times interest can be afforded by the amount of
profit.
Functions of finance http://www.managementstudyguide.com/finance-functions.htm
Aims and functions of
finance
http://www.newagepublishers.com/samplechapter/001541.pdf
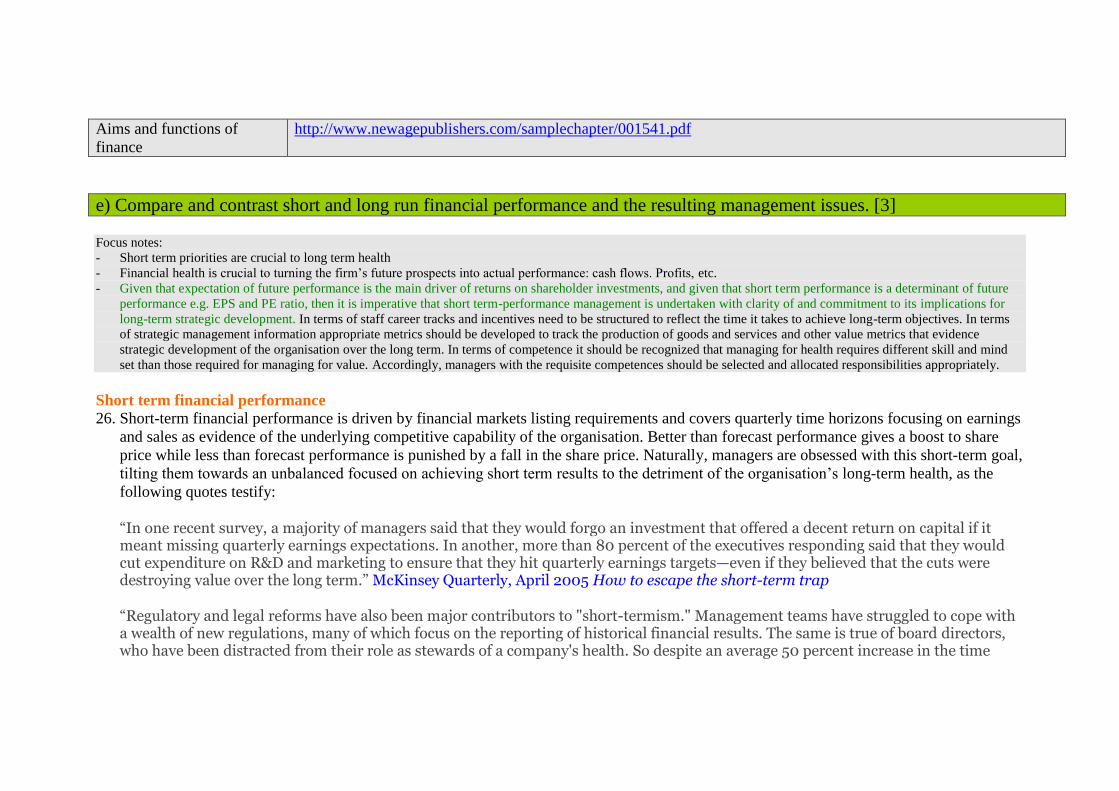
e) Compare and contrast short and long run financial performance and the resulting management issues. [3] Focus notes:
- Short term priorities are crucial to long term health
- Financial health is crucial to turning the firm’s future prospects into actual performance: cash flows. Profits, etc.
- Given that expectation of future performance is the main driver of returns on shareholder investments, and given that short term performance is a determinant of future
performance e.g. EPS and PE ratio, then it is imperative that short term-performance management is undertaken with clarity of and commitment to its implications for
long-term strategic development. In terms of staff career tracks and incentives need to be structured to reflect the time it takes to achieve long-term objectives. In terms
of strategic management information appropriate metrics should be developed to track the production of goods and services and other value metrics that evidence
strategic development of the organisation over the long term. In terms of competence it should be recognized that managing for health requires different skill and mind
set than those required for managing for value. Accordingly, managers with the requisite competences should be selected and allocated responsibilities appropriately.
Short term financial performance
26. Short-term financial performance is driven by financial markets listing requirements and covers quarterly time horizons focusing on earnings
and sales as evidence of the underlying competitive capability of the organisation. Better than forecast performance gives a boost to share
price while less than forecast performance is punished by a fall in the share price. Naturally, managers are obsessed with this short-term goal,
tilting them towards an unbalanced focused on achieving short term results to the detriment of the organisation’s long-term health, as the
following quotes testify:
“In one recent survey, a majority of managers said that they would forgo an investment that offered a decent return on capital if it meant missing quarterly earnings expectations. In another, more than 80 percent of the executives responding said that they would cut expenditure on R&D and marketing to ensure that they hit quarterly earnings targets—even if they believed that the cuts were destroying value over the long term.” McKinsey Quarterly, April 2005 How to escape the short-term trap
“Regulatory and legal reforms have also been major contributors to "short-termism." Management teams have struggled to cope with a wealth of new regulations, many of which focus on the reporting of historical financial results. The same is true of board directors, who have been distracted from their role as stewards of a company's health. So despite an average 50 percent increase in the time
commitments required of directors, many boards don't have the time to understand the kind of strategic trade-offs needed to get the appropriate balance between short-term performance and long-term health. A recent McKinsey survey of over 1,000 directors around the world found that more than half admitted to having only a "limited" understanding of where the company's long-term objectives would position it in five to ten years. The good news is that our respondents told us that they are now eager to devote more time to these issues.” McKinsey Quarterly, April 2005 How to escape the short-term trap
27. According to McKinsey short-term obligations are important, of course, and only by fulfilling them will management build confidence in longer-term strategies. But the health of a company is crucial not just to its customers, suppliers, and employees but to its investors as well. It's crucial to turning the company's growth prospects, capabilities, relationships, and assets into future cash flows. Contrary to conventional wisdom, markets recognize this.
Long term financial performance
28. Long term financial performance is about the health of the company the generic components of which are: a robust and credible strategy;
productive, well-maintained assets; innovative products, services, and processes; a fine reputation with customers, regulators, governments,
and other stakeholders; the ability to attract, retain, and develop high-performing talent; maintaining and improving competitive position and
generating sustainable returns that are acceptable to investors.
29. According to McKinsey thinking about health, as opposed to short-term performance, helps management teams understand how to look after
companies today in a way that will ensure that they remain strong in the future. It focuses the mind on what must be done today to deliver the
outcome of long-term performance. Companies are not focusing enough on managing the health of their businesses. This was evidenced by
the underlying causes of the 2008 financial crises.
30. An examination of share prices demonstrates that expectations of future performance are the main driver of shareholder returns. In almost all
industry sectors and almost all stock exchanges, up to 80 percent of a share's market value can be explained only by cash flow
expectations beyond the next three years. These longer-term expectations are in turn driven by judgments on growth and long-term
profitability, a lesson relearned after the dot-com bust. For example, cash flows in the global semiconductor industry need to grow at more
than 10 percent a year during the next ten years to justify current market valuations. In retailing and consumer packaged goods, that growth
rate is between 3 and 6 percent. In electric utilities, it is around 2 percent.
31. Future expectations clearly drive the stock price of individual companies too, thus explaining the often widely differing P/E or market-to-
book ratios of companies with similar reported earnings. In the pharmaceutical sector, for example, the market ascribes significant value to a
healthy drug pipeline even though it will not affect short-term earnings.
32. Even in the private equity sector, renowned for its focus on short-term operational improvements, health matters. Most private equity
companies look to realize their investments in a five-year time frame. But they must still have a credible proposition for future earnings and
cash flow growth to underpin a sale or IPO.
The strategic management implications of differing short-term and long-term requirements
33. Given that expectation of future performance is the main driver of returns on shareholder investments, and given that short term performance
is a determinant of future performance e.g. EPS and PE ratio, then it is imperative that short term-performance management is undertaken
with clarity of and commitment to its implications for long-term strategic development. This is hard to achieve because it requires resilience
in delivering for the short-term as well as the long-term. This requires i) suitable strategies and processes that work over the short and long-
term, ii) appropriate dialogue with powerful and influential stakeholders
Robust strategies that allow the company to adapt to changes in the environment
34. First, a company's strategy should consist of a portfolio of initiatives that consciously embraces different time horizons. Companies do, of course, have different business units with distinct strategies. But few strategies direct a company in a way that will enable it to adapt to events and capitalize on opportunities as they arise. Some initiatives in the portfolio will influence short-term performance. Others will create options for the future—the development of new products or services, entry into new markets, or the restructuring of processes or value chains. A key management challenge is to design and select those initiatives and options to ensure, on a risk-adjusted basis, that the company's underlying health remains strong. Management seeks to address this challenge by setting a generic strategy (that gives scope and direction to the organisation); this informs the business strategy that defines how the business will compete and the criteria for project selection and performance evaluation.
Adequate organizational processes (support systems) that align with short term and long-term performance (Performance Prism)
35. Second, companies need organizational processes to support a focus on both performance and health. Companies with a long-term-value
orientation are always relentless about setting short-term-performance commitments and delivering on them. But such companies also define
what they are doing to ensure their health and how they will measure their efforts to do so. Reckitt Benckiser, the leading household-

cleaning-products business, emphasizes innovation as the key to its long-term strategy and specifically measures the proportion of
sales coming from new products.
36. Different companies will identify the health and performance metrics—product development, customer satisfaction, or the retention of
talent—appropriate to their industry or situation. But executives should insist on a balance of metrics that cover all areas of the business
while grabbing every opportunity to talk about these metrics, both internally and to analysts and investors.
37. Career tracks and incentives—money, recognition, promotion—should reflect the time required to deliver on longer-term goals; the current
trend of rotating people in roles every two or three years isn't necessarily good for corporate health. Moreover, companies ought to be
mindful of the different leadership qualities needed to manage for performance and health. Corporate health typically requires new skills, not
necessarily the reinforcement of the capabilities and leadership traits that worked in the past. (Performance Prism – Stakeholder
Expectations, Stakeholder Satisfaction)
Communicate the company’s vision, strategy and goals with stakeholders (shared values as in McKinsey 7s)
38. Third, companies need to change the nature of their dialogue with key stakeholders, particularly the capital markets and employees. That
means first identifying investors who will support a company's strategy and then attracting them. There is no point, for example, talking
about the company's health to court arbitrageurs or hedge fund managers looking for the next bid.
39. A management team should then quality time with analysts, explaining its views on the outlook for the industry and on how the company's
strategic stance will create a source of sustainable advantage. Management will also need to highlight the metrics it has developed to track
the company's performance and health. Just talking vaguely about shareholder value without a time frame or without addressing the specifics
of the business is not meaningful.
40. Companies might also be wise to separate discussions about quarterly results from those that focus on strategic development, as BP has done
recently. And they should ensure that analysts spend time with operational managers. When it comes to forming judgments about sustained
performance, the calibre of these managers is often the crucial factor.
41. Communicating with employees is just as important. The complaint that "we don't know what is going on" often reflects an emphasis on
communicating results rather than long-term intent. It is no coincidence that a hallmark of great, enduring companies is that they make their
future leadership generations feel involved in their long-term development.
Conclusion
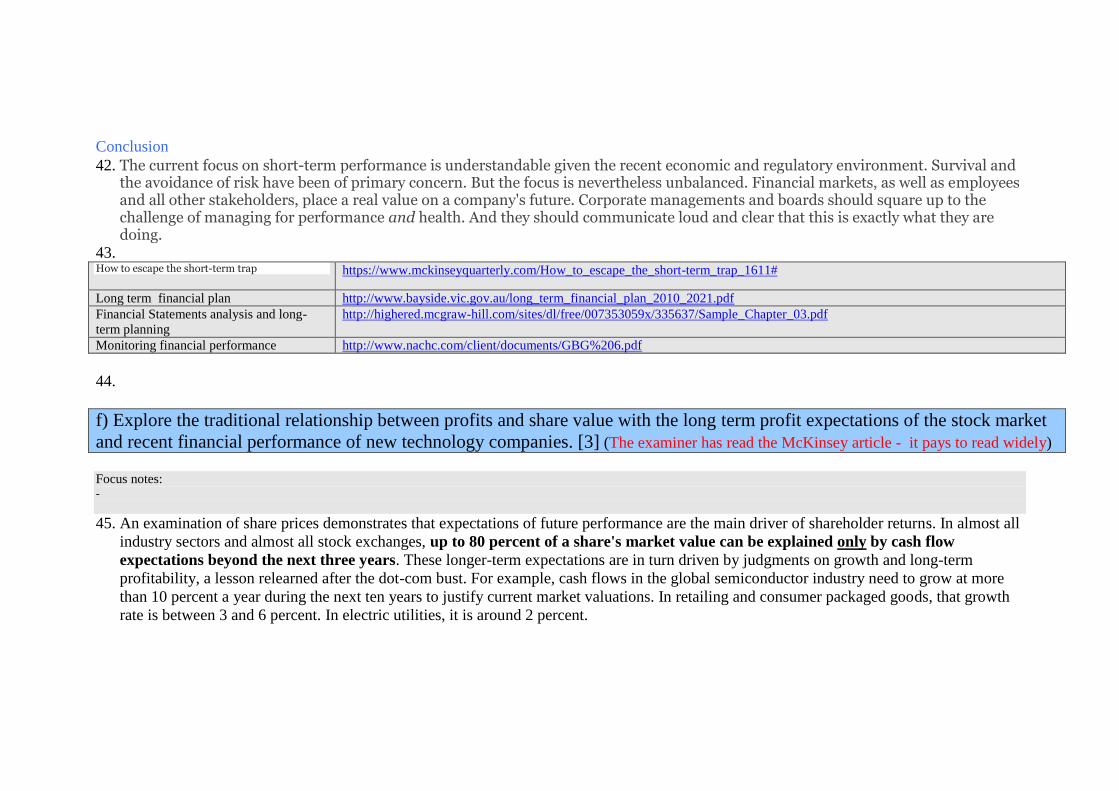
42. The current focus on short-term performance is understandable given the recent economic and regulatory environment. Survival and the avoidance of risk have been of primary concern. But the focus is nevertheless unbalanced. Financial markets, as well as employees and all other stakeholders, place a real value on a company's future. Corporate managements and boards should square up to the challenge of managing for performance and health. And they should communicate loud and clear that this is exactly what they are doing.
43. How to escape the short-term trap
https://www.mckinseyquarterly.com/How_to_escape_the_short-term_trap_1611#
Long term financial plan http://www.bayside.vic.gov.au/long_term_financial_plan_2010_2021.pdf
Financial Statements analysis and long-
term planning
http://highered.mcgraw-hill.com/sites/dl/free/007353059x/335637/Sample_Chapter_03.pdf
Monitoring financial performance http://www.nachc.com/client/documents/GBG%206.pdf
44.
f) Explore the traditional relationship between profits and share value with the long term profit expectations of the stock market
and recent financial performance of new technology companies. [3] (The examiner has read the McKinsey article - it pays to read widely) Focus notes: -
45. An examination of share prices demonstrates that expectations of future performance are the main driver of shareholder returns. In almost all
industry sectors and almost all stock exchanges, up to 80 percent of a share's market value can be explained only by cash flow
expectations beyond the next three years. These longer-term expectations are in turn driven by judgments on growth and long-term
profitability, a lesson relearned after the dot-com bust. For example, cash flows in the global semiconductor industry need to grow at more
than 10 percent a year during the next ten years to justify current market valuations. In retailing and consumer packaged goods, that growth
rate is between 3 and 6 percent. In electric utilities, it is around 2 percent.

46. Future expectations clearly drive the stock price of individual companies too, thus explaining the often widely differing P/E or market-to-
book ratios of companies with similar reported earnings. In the pharmaceutical sector, for example, the market ascribes significant value to a
healthy drug pipeline even though it will not affect short-term earnings.
47. Even in the private equity sector, renowned for its focus on short-term operational improvements, health matters. Most private equity
companies look to realize their investments in a five-year time frame. But they must still have a credible proposition for future earnings and
cash flow growth to underpin a sale or IPO.
48. The P/E ratio is an important indicator of the value of a company’s stock because it measures how much the market is willing to pay for 1
dollar of earnings of the company. This interpretation reflects the way the ratio is calculated: P is the current price of the share, say $30 (per
share). E is the earnings per share (12 months earnings after tax/number of shares outstanding, say $3 per share). Therefore, P/E ratio is 10.
This is also known as the “earnings” multiple, representing the number of times the share price pays for a dollar of earnings. (Earnings could
be trailing, current or forward).
49. As with all ratios the P/E ratio is only meaningful if it is compared with other ratios. For example, the earnings multiple can be compared
with the organisation’s own earnings multiple for the previous or succeeding periods to asses how its market capitalization is changing.
i) If earnings and price move in sympathy, the P/E ratio stays the same
ii) If earnings increase but price stays the same, then P/E ratio declines
iii) If earnings decline but share price increases then the P/E ratio increases
50. At the time of the dot.com bubble the average P/E ratio of listed companies was around 20 whereas the P/E ratio of dot.com was above 60
reflecting a huge profit hike in future. There was clearly an over valuation of the dot.com shares which eventually crashed. But this disparity
in valuation reflects the expected earnings basis of valuation of shares as described above (para 30). Because the share price already factors
in the expected long term earnings, when earnings increased subsequently, this did not result in an immediate change in the share price thus
the P/E ration declined sharply.
g) Assess the relative financial performance of the organisation compared to appropriate benchmarks. [3]
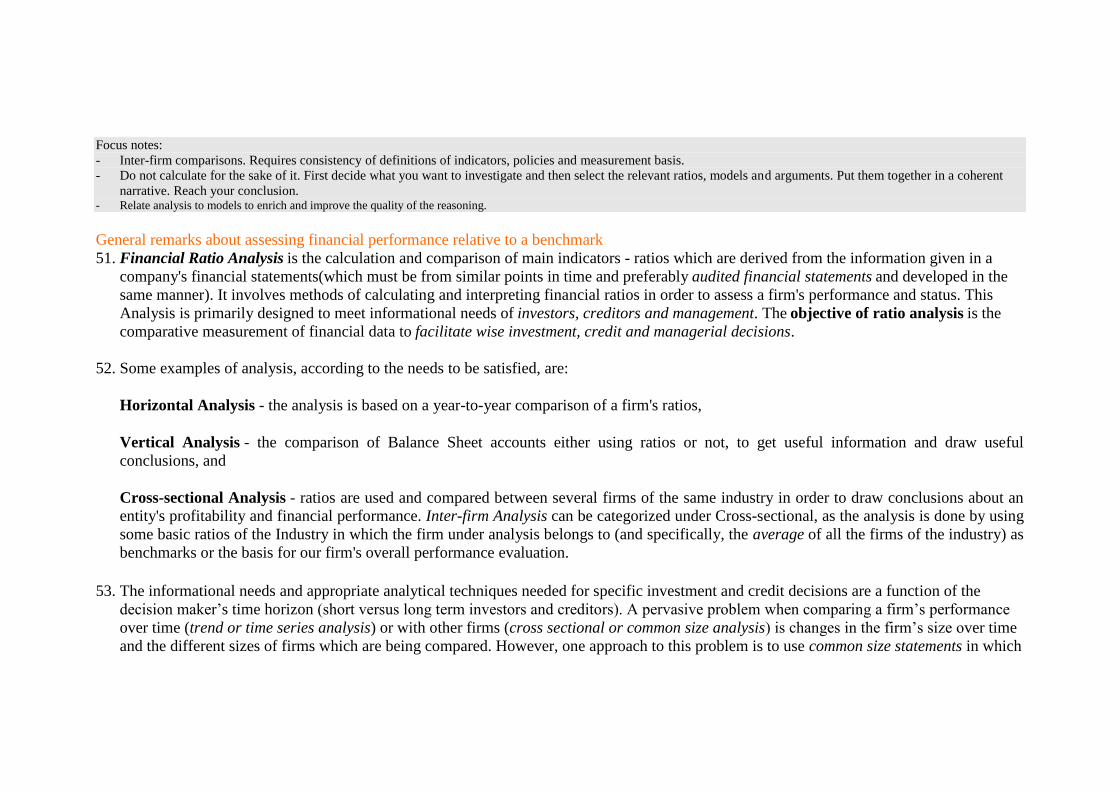
Focus notes:
- Inter-firm comparisons. Requires consistency of definitions of indicators, policies and measurement basis.
- Do not calculate for the sake of it. First decide what you want to investigate and then select the relevant ratios, models and arguments. Put them together in a coherent
narrative. Reach your conclusion. - Relate analysis to models to enrich and improve the quality of the reasoning.
General remarks about assessing financial performance relative to a benchmark
51. Financial Ratio Analysis is the calculation and comparison of main indicators - ratios which are derived from the information given in a
company's financial statements(which must be from similar points in time and preferably audited financial statements and developed in the
same manner). It involves methods of calculating and interpreting financial ratios in order to assess a firm's performance and status. This
Analysis is primarily designed to meet informational needs of investors, creditors and management. The objective of ratio analysis is the
comparative measurement of financial data to facilitate wise investment, credit and managerial decisions.
52. Some examples of analysis, according to the needs to be satisfied, are:
Horizontal Analysis - the analysis is based on a year-to-year comparison of a firm's ratios,
Vertical Analysis - the comparison of Balance Sheet accounts either using ratios or not, to get useful information and draw useful
conclusions, and
Cross-sectional Analysis - ratios are used and compared between several firms of the same industry in order to draw conclusions about an
entity's profitability and financial performance. Inter-firm Analysis can be categorized under Cross-sectional, as the analysis is done by using
some basic ratios of the Industry in which the firm under analysis belongs to (and specifically, the average of all the firms of the industry) as
benchmarks or the basis for our firm's overall performance evaluation.
53. The informational needs and appropriate analytical techniques needed for specific investment and credit decisions are a function of the
decision maker’s time horizon (short versus long term investors and creditors). A pervasive problem when comparing a firm’s performance
over time (trend or time series analysis) or with other firms (cross sectional or common size analysis) is changes in the firm’s size over time
and the different sizes of firms which are being compared. However, one approach to this problem is to use common size statements in which
the various components of the financial statements are standardized by expressing them as a percentage of some base (base in the income
statement is sales and base in the balance sheet is total assets). See sample file below for further understanding.
54. In general, a process of standardization is being achieved by the use of ratios. They can be used to standardize financial statements allowing
for comparisons over time, industry, sector and cross-sectionally between firms and further facilitate the evaluation of the efficiency of
operations and/or the risk of the firm’s operations regarding the scope and purpose of evaluation. Ratios measure a firm’s crucial
relationships by relating inputs(costs) with output(benefits) and facilitate comparisons of these relationships over time and across firms.
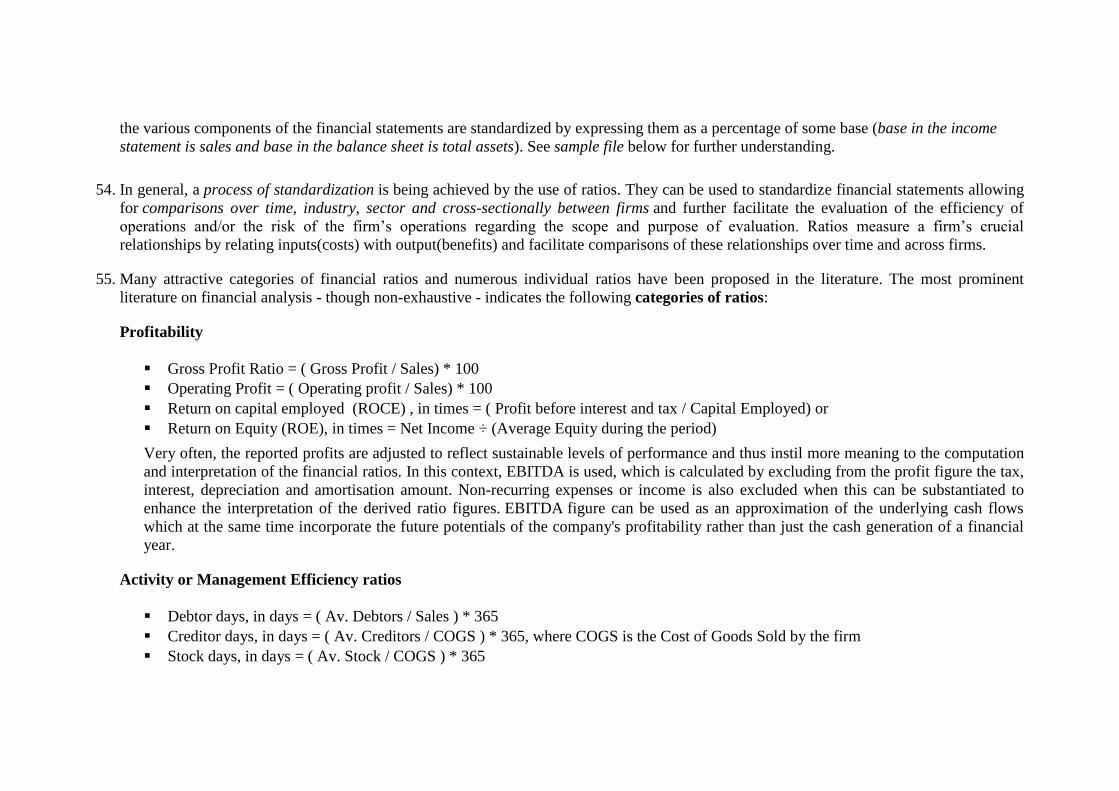
55. Many attractive categories of financial ratios and numerous individual ratios have been proposed in the literature. The most prominent
literature on financial analysis - though non-exhaustive - indicates the following categories of ratios:
Profitability
Gross Profit Ratio = ( Gross Profit / Sales) * 100
Operating Profit = ( Operating profit / Sales) * 100
Return on capital employed (ROCE) , in times = ( Profit before interest and tax / Capital Employed) or
Return on Equity (ROE), in times = Net Income ÷ (Average Equity during the period)
Very often, the reported profits are adjusted to reflect sustainable levels of performance and thus instil more meaning to the computation
and interpretation of the financial ratios. In this context, EBITDA is used, which is calculated by excluding from the profit figure the tax,
interest, depreciation and amortisation amount. Non-recurring expenses or income is also excluded when this can be substantiated to
enhance the interpretation of the derived ratio figures. EBITDA figure can be used as an approximation of the underlying cash flows
which at the same time incorporate the future potentials of the company's profitability rather than just the cash generation of a financial
year.
Activity or Management Efficiency ratios
Debtor days, in days = ( Av. Debtors / Sales ) * 365
Creditor days, in days = ( Av. Creditors / COGS ) * 365, where COGS is the Cost of Goods Sold by the firm
Stock days, in days = ( Av. Stock / COGS ) * 365

Where "Av.", is the Average amount of the opening and closing balance of the corresponding account of the financial year the analysis is
being undertaken.
Market or Investment ratios
Dividend cover, in times = ( Profit after tax / dividends )
Dividend yield = ( Dividend / Share price )
P/E = ( Share price / Earnings per share )
EPS = ((Profit after tax - pref. dividends) / Total number of ordinary shares outstanding)
56. Each category can be further utilized and an in-depth analysis can be adopted to reflect the corresponding needs of each user, i.e. a bank
considering whether to lend a specific company would focus more on financial and liquidity - as the risk of lending to a company that does
not have the resources to repay the loan is of great concern for a bank - and profitability ratios, to see whether the company's earnings are
adequate to cover the interest on the loan. An analysis from an investor's point of view on the other hand would focus more on profitability
and investment ratios, to evaluate the prospects of his potential returns.
Note that there is no absolute guidance or specific definition of ratios and therefore special consideration should be undertaken when ratios
are used to make comparison either in a cross-sectional analysis or Inter-firm (as described above).
Limitations of ratios and potential impact in the financial analysis
57. The following are the commonly acknowledged limitations of ratios:
Ratios are not predictive, as they are usually based on historical information notwithstanding ratios can be used as a tool to assist
financial analysis.
They help to focus attention systematically on important areas and summarise information in an understandable form and assist in
identifying trends and relationships (see methods for facilitating the financial analysis above).
However they do not reflect the future perspectives of a company, as they ignore future action by management.
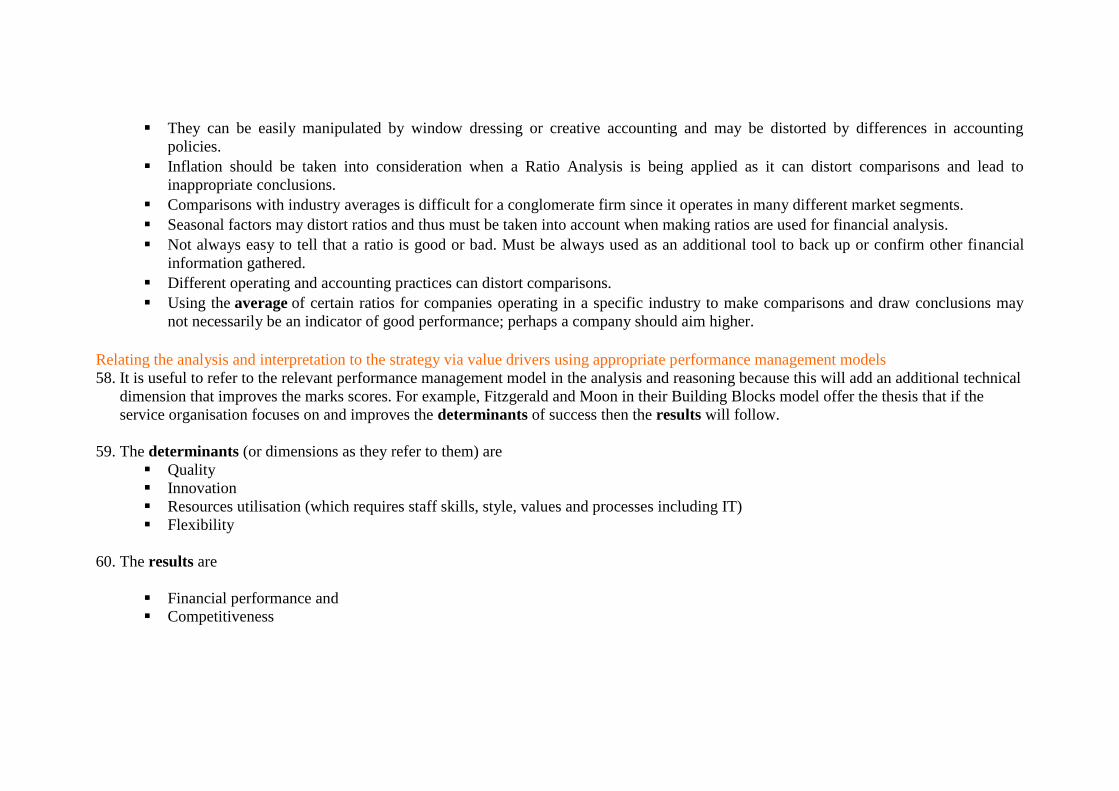
They can be easily manipulated by window dressing or creative accounting and may be distorted by differences in accounting
policies.
Inflation should be taken into consideration when a Ratio Analysis is being applied as it can distort comparisons and lead to
inappropriate conclusions.
Comparisons with industry averages is difficult for a conglomerate firm since it operates in many different market segments.
Seasonal factors may distort ratios and thus must be taken into account when making ratios are used for financial analysis.
Not always easy to tell that a ratio is good or bad. Must be always used as an additional tool to back up or confirm other financial
information gathered.
Different operating and accounting practices can distort comparisons.
Using the average of certain ratios for companies operating in a specific industry to make comparisons and draw conclusions may
not necessarily be an indicator of good performance; perhaps a company should aim higher.
Relating the analysis and interpretation to the strategy via value drivers using appropriate performance management models
58. It is useful to refer to the relevant performance management model in the analysis and reasoning because this will add an additional technical
dimension that improves the marks scores. For example, Fitzgerald and Moon in their Building Blocks model offer the thesis that if the
service organisation focuses on and improves the determinants of success then the results will follow.
59. The determinants (or dimensions as they refer to them) are
Quality
Innovation
Resources utilisation (which requires staff skills, style, values and processes including IT)
Flexibility
60. The results are
Financial performance and
Competitiveness

61. Lynn and Cross in their thesis about the crucial role of strategic alignment use the prism as a metaphor for the performance management of
the organisation. Their proposition is that where the organisation aligns its strategic objectives with its vision, strategy, resources and support
systems then great results will follow. This can be used to focus the analysis and reach convincing conclusion about the results.
62. For example,
i) Is the level of gearing aligned with the financial sustainability objective?
ii) Is the company’s operating cash flow aligned with the capital expenditure plans? Can planned expenditure be financed from internal
resources?
iii) Is short term financing appropriate use of resources?
iv) Do the efficiency ratios indicate efficient use of resources in accordance with building Blocks model
Comparative analysis of Tesco plc and Wal-mart http://essaybank.degree-essays.com/accounting/business-report-of-tesco-and-wal-mart.php
Investor investigates food and retailing sector to
assess investment prospects
http://www.scribd.com/doc/39455198/TESCO-Financial-Analysis
Ratio analysis http://www.wikinvest.com/wiki/Ratio_Analysis
Centre for inter firm comparison http://220.227.161.86/19078comp_sugans_pe2_costacc_cp15.pdf
Centre for inter firm comparison http://www.cifc.co.uk/
http://www.cifc.co.uk/case.html
Financial statement analysis http://www.slideshare.net/MohdAadil/analysis-of-financial-statements-12201127
63. 41
64.
