2. trends in greenhouse gas emissions
TRANSCRIPT
2 Trends in Greenhouse Gas Emissions
21 Recent Trends in US Greenhouse Gas Emissions and Sinks In 2008 total US greenhouse gas emissions were 69568 teragrams of carbon dioxide equivalents (Tg CO2 Eq) net emissions were 60164 Tg CO2 Eq reflecting the influence of sinks (net CO2 flux from Land Use Land Use Change and Forestry)38 Overall total US emissions have risen by almost 14 percent from 1990 to 2008 Emissions decreased from 2007 to 2008 by 29 percent (2113 Tg CO2 Eq) The following factors were primary contributors to this decrease (1) a decrease in electricity demand and a resulting decrease in energy consumption (2) higher energy prices leading to a decrease in energy consumption and (3) cooler summer conditions in 2008 compared to 2007 reducing energy demand and offsetting the increased energy demand for heating in the colder winter In addition the high price of gasoline combined with the economic downturn led to a significant decline in petroleum consumption by the transportation sector in 2008
Figure 2-1 US Greenhouse Gas Emissions by Gas
Figure 2-2 Annual Percent Change in US Greenhouse Gas Emissions
Figure 2-3 Cumulative Change in Annual US Greenhouse Gas Emissions Relative to 1990
As the largest source of US greenhouse gas emissions carbon dioxide (CO2) from fossil fuel combustion has accounted for approximately 79 percent of global warming potential (GWP) weighted emissions since 1990 growing slowly from 77 percent of total GWP-weighted emissions in 1990 to 80 percent in 2008 Emissions from this source category grew by 177 percent (8371 Tg CO2 Eq) from 1990 to 2008 and were responsible for most of the increase in national emissions during this period From 2007 to 2008 these emissions decreased by 32 percent (1842 Tg CO2 Eq) Historically changes in emissions from fossil fuel combustion have been the dominant factor affecting US emission trends
Changes in CO2 emissions from fossil fuel combustion are influenced by many long-term and short-term factors including population and economic growth energy price fluctuations technological changes and seasonal temperatures On an annual basis the overall consumption of fossil fuels in the United States generally fluctuates in response to changes in general economic conditions energy prices weather and the availability of non-fossil alternatives For example in a year with increased consumption of goods and services low fuel prices severe summer and winter weather conditions nuclear plant closures and lower precipitation feeding hydroelectric dams there would likely be proportionally greater fossil fuel consumption than in a year with poor economic performance high fuel prices mild temperatures and increased output from nuclear and hydroelectric plants
In the longer-term energy consumption patterns respond to changes that affect the scale of consumption (eg population number of cars and size of houses) the efficiency with which energy is used in equipment (eg cars power plants steel mills and light bulbs) and consumer behavior (eg walking bicycling or telecommuting to work instead of driving)
Energy-related CO2 emissions also depend on the type of fuel or energy consumed and its carbon (C) intensity Producing a unit of heat or electricity using natural gas instead of coal for example can reduce the CO2 emissions because of the lower C content of natural gas
A brief discussion of the year to year variability in fuel combustion emissions is provided below beginning with 2004
38 Estimates are presented in units of teragrams of carbon dioxide equivalent (Tg CO2 Eq) which weight each gas by its global warming potential or GWP value (See section on global warming potentials Executive Summary)
Trends in Greenhouse Gas Emissions 2-1
Emissions from fuel combustion increased from 2004 to 2005 at a rate slightly lower than the average annual growth rate since 1990 A number of factors played a role in this slight increase This small increase is primarily a result of the restraint on fuel consumption primarily in the transportation sector caused by rising fuel prices Although electricity prices increased slightly there was a significant increase in electricity consumption in the residential and commercial sectors due to warmer summer weather conditions This led to an increase in emissions in these sectors with the increased use of air-conditioners As the amount of fuels used to generate electricity increased among all end-use sectors electricity emissions increased as well Despite a slight decrease in industrial energy-related emissions industrial production and manufacturing output actually increased The price of natural gas escalated dramatically causing a decrease in consumption of natural gas in the industrial sector Use of renewable fuels decreased slightly due to decreased use of biofuels and decreased electricity output by hydroelectric power plants
From 2005 to 2006 emissions from fuel combustion decreased for the first time since 2000 to 2001 This decrease occurred across all sectors with the exception of the industrial sector due to a number of factors The decrease in emissions from electricity generation is a result of a smaller share of electricity generated by coal and a greater share generated by natural gas Coal and natural gas consumption for electricity generation decreased by 13 percent and increased by 60 percent in 2006 respectively and nuclear power increased by less than 1 percent The transportation decrease is primarily a result of the restraint on fuel consumption caused by rising fuel prices which directly resulted in a decrease of petroleum consumption within this sector of about 13 percent in 2006 The decrease in emissions from the residential sector is primarily a result of decreased electricity consumption due to increases in the price of electricity and warmer winter weather conditions A moderate increase in industrial sector emissions is a result of growth in industrial output and growth in the US economy Renewable fuels used to generate electricity increased in 2006 with the greatest growth occurring in generation from wind
After experiencing a decrease from 2005 to 2006 emissions from fuel combustion grew from 2006 to 2007 at a rate somewhat higher than the average growth rate since 1990 There were a number of factors contributing to this increase Unfavorable weather conditions in both the winter and summer resulted in an increase in consumption of heating fuels as well as an increase in the demand for electricity This demand for electricity was met with an increase in coal consumption of 17 percent and with an increase in natural gas consumption of 99 percent This increase in fossil fuel consumption combined with a 147 percent decrease in hydropower generation from 2006 to 2007 resulted in an increase in emissions in 2007 The increase in emissions from the residential and commercial sectors is a result of increased electricity consumption due to warmer summer conditions and cooler winter conditions compared to 2006 In addition to these unfavorable weather conditions electricity prices remained relatively stable compared to 2006 and natural gas prices decreased slightly Emissions from the industrial sector increased slightly compared to 2006 as a result of a 15 percent increase in industrial production and the increase in fossil fuels used for electricity generation Despite an overall decrease in electricity generation from renewable energy in 2007 driven by decreases in hydropower generation wind and solar generation increased significantly
Emissions from fossil fuel combustion decreased from 2007 to 2008 Several factors contributed to this decrease in emissions An increase in energy prices coupled with the economic downturn led to a decrease in energy demand and a resulting decrease in emissions from 2007 to 2008 In 2008 the price of coal natural gas and petroleum used to generate electricity as well as the price of fuels used for transportation increased significantly As a result of this price increase coal natural gas and petroleum consumption used for electricity generation decreased by 13 percent 26 percent and 295 percent respectively The increase in the cost of fuels to generate electricity translated into an increase in the price of electricity leading to a decrease in electricity consumption across all sectors except the commercial sector The increase in transportation fuel prices led to a decrease in vehicle miles traveled (VMT) and a decrease of 57 percent in transportation fossil fuel combustion emissions from 2007 to 2008 Cooler weather conditions in the summer led to a decrease in cooling degree days by 87 percent and a decrease in electricity demand compared to 2007 whereas cooler winter conditions led to a 56 percent increase in heating degree days compared to 2007 and a resulting increase in demand for heating fuels The increased emissions from winter heating energy demand was offset by a decrease in emissions from summer cooling related electricity demand Lastly renewable energy39 consumption for electricity generation increased by 71 percent from 2007 to 2008 driven by a significant increase in solar and wind energy consumption (of 12 percent and 51 percent respectively) This increase in renewable energy generation contributed to a decrease in the carbon intensity of electricity generation
39 Renewable energy includes the following energy sources hydroelectric power geothermal energy biofuels solar energy and wind energy
2-2 Inventory of US Greenhouse Gas Emissions and Sinks 1990ndash2008
Overall from 1990 to 2008 total emissions of CO2 increased by 8204 Tg CO2 Eq (161 percent) while CH4 and N2O emissions decreased by 458 Tg CO2 Eq (75 percent) and 41 Tg CO2 Eq (about 13 percent) respectively During the same period aggregate weighted emissions of HFCs PFCs and SF6 rose by 594 Tg CO2 Eq (659 percent) Despite being emitted in smaller quantities relative to the other principal greenhouse gases emissions of HFCs PFCs and SF6 are significant because many of them have extremely high GWPs and in the cases of PFCs and SF6 long atmospheric lifetimes Conversely US greenhouse gas emissions were partly offset by C sequestration in managed forests trees in urban areas agricultural soils and landfilled yard trimmings which was estimated to be 135 percent of total emissions in 2008
Table 2-1 summarizes emissions and sinks from all US anthropogenic sources in weighted units of Tg CO2 Eq while unweighted gas emissions and sinks in gigagrams (Gg) are provided in Table 2-2
Table 2-1 Recent Trends in US Greenhouse Gas Emissions and Sinks (Tg CO2 Eq) GasSource 1990 1995 2000 2005 2006 2007 2008 CO2 51008 54273 59772 61084 60172 61202 59212
Fossil Fuel Combustion 47357 50295 55934 57533 56528 57570 55728 Electricity Generation 18208 19479 22969 24021 23464 24128 23635 Transportation 14858 16080 18095 18953 18767 18937 17853 Industrial 8454 8626 8522 8256 8507 8422 8193 Residential 3391 3533 3712 3584 3221 3417 3427 Commercial 2167 2232 2277 2213 2060 2174 2195 US Territories 279 345 359 506 509 491 425
Non-Energy Use of Fuels 1196 1429 1461 1365 1414 1353 1342 Iron and Steel Production amp
Metallurgical Coke Production 1026 957 881 677 705 728 690 Cement Production 333 368 412 459 466 452 411 Natural Gas Systems 373 422 294 295 295 308 300 Lime Production 115 133 141 144 151 146 143 Incineration of Waste 80 115 113 126 127 133 131 Ammonia Production and Urea
Consumption 168 178 164 128 123 140 118 Cropland Remaining Cropland 71 70 75 79 79 83 76 Limestone and Dolomite Use 51 67 51 68 80 77 66 Aluminum Production 68 57 61 41 38 43 45 Soda Ash Production and
Consumption 41 43 42 42 42 41 41 Petrochemical Production 33 41 45 42 38 39 34 Titanium Dioxide Production 12 15 18 18 18 19 18 Carbon Dioxide Consumption 14 14 14 13 17 19 18 Ferroalloy Production 22 20 19 14 15 16 16 Phosphoric Acid Production 15 15 14 14 12 12 12 Wetlands Remaining Wetlands 10 10 12 11 09 10 09 Petroleum Systems 06 05 05 05 05 05 05 Zinc Production 09 10 11 05 05 04 04 Lead Production 03 03 03 03 03 03 03 Silicon Carbide Production and
Consumption 04 03 02 02 02 02 02 Land Use Land-Use Change and
Forestry (Sink)a (9094) (8429) (6642) (9504) (9592) (9554) (9403) BiomassmdashWood 2152 2291 2181 2069 2079 2074 1984 International Bunker Fuelsb 1118 998 985 1105 1291 1271 1352 BiomassmdashEthanolb 42 77 92 226 305 383 533
CH4 6134 6132 5860 5532 5682 5692 5676 Enteric Fermentation 1324 1437 1368 1367 1390 1412 1408 Landfills 1493 1441 1207 1256 1271 1265 1263 Natural Gas Systems 1295 1326 1307 1036 1031 995 964 Coal Mining 841 671 604 569 583 581 676
Trends in Greenhouse Gas Emissions 2-3
Manure Management 293 339 386 422 423 459 450 Petroleum Systems 339 320 302 282 282 288 291 Wastewater Treatment 235 248 252 243 245 244 243 Forest Land Remaining Forest Land 32 43 143 98 216 200 119 Rice Cultivation 71 76 75 68 59 62 72 Stationary Combustion 74 71 66 66 62 65 67 Abandoned Underground Coal Mines 60 82 74 56 55 57 59 Mobile Combustion 47 43 34 25 23 22 20 Composting 03 07 13 16 16 17 17 Field Burning of Agricultural
Residues 08 07 09 09 09 10 10 Petrochemical Production 09 11 12 11 10 10 09 Iron and Steel Production amp
Metallurgical Coke Production 10 10 09 07 07 07 06 Ferroalloy Production + + + + + + + Silicon Carbide Production and
Consumption + + + + + + + Incineration of Waste + + + + + + + International Bunker Fuelsb 02 01 01 01 02 02 02
N2O 3223 3425 3455 3283 3295 3277 3182 Agricultural Soil Management 2035 2059 2101 2158 2112 2110 2159 Mobile Combustion 439 540 532 369 336 303 261 Nitric Acid Production 189 210 207 176 172 205 190 Manure Management 144 155 167 166 173 173 171 Stationary Combustion 128 133 145 147 145 146 142 Forest Land Remaining Forest Land 27 37 121 84 180 167 101 Wastewater Treatment 37 40 45 47 48 49 49 N2O from Product Uses 44 46 49 44 44 44 44 Adipic Acid Production 158 176 55 50 43 37 20 Composting 04 08 14 17 18 18 18 Settlements Remaining Settlements 10 12 11 15 15 16 16 Field Burning of Agricultural
Residues 04 04 05 05 05 05 05 Incineration of Waste 05 05 04 04 04 04 04 Wetlands Remaining Wetlands + + + + + + + International Bunker Fuelsb 11 10 09 10 12 12 12
HFCs 369 622 1032 1193 1218 1274 1269 Substitution of Ozone Depleting
Substancesc 03 290 743 1032 1077 1101 1130 HCFC-22 Production 364 330 286 158 138 170 136 Semiconductor Manufacture 02 03 03 02 03 03 03
PFCs 208 156 135 62 60 75 67 Semiconductor Manufacture 22 38 49 32 35 36 40 Aluminum Production 185 118 86 30 25 38 27
SF6 326 279 191 178 170 161 161 Electrical Transmission and
Distribution 266 214 150 140 132 127 131 Magnesium Production and
Processing 54 56 30 29 29 26 20 Semiconductor Manufacture 05 09 11 10 10 08 11
Total 61268 64888 70445 71332 70599 71681 69568 Net Emissions (Sources and Sinks) 52173 56460 63802 61828 61007 62127 60164 + Does not exceed 005 Tg CO2 Eq a The net CO2 flux total includes both emissions and sequestration and constitutes a sink in the United States Sinks are only included in net emissions total Parentheses indicate negative values or sequestration b Emissions from International Bunker Fuels and Wood Biomass and Ethanol Consumption are not included in totals
2-4 Inventory of US Greenhouse Gas Emissions and Sinks 1990ndash2008
c Small amounts of PFC emissions also result from this source Note Totals may not sum due to independent rounding
Table 2-2 Recent Trends in US Greenhouse Gas Emissions and Sinks (Gg) GasSource 1990 1995 2000 2005 2006 2007 2008 CO2 5100840 5427306 5977201 6108424 6017221 6120220 5921204
Fossil Fuel Combustion 4735701 5029498 5593381 5753342 5652845 5756999 5572760 Electricity Generation 1820818 1947925 2296894 2402142 2346406 2412825 2363497 Transportation 1485773 1607972 1809537 1895323 1876678 1893749 1785252 Industrial 845429 862575 852212 825590 850742 842242 819297 Residential 339142 353308 371212 358399 322053 341737 342719 Commercial 216656 223204 227674 221261 206024 217355 219467 US Territories 27882 34513 35853 50626 50941 49090 42528
Non-Energy Use of Fuels 119602 Iron and Steel Production amp
Metallurgical Coke
142922 146141 136539 141382 135306 134200
Production 102564 95748 88110 67731 70539 72802 69010 Cement Production 33278 36847 41190 45910 46562 45229 41147 Natural Gas Systems 37317 42249 29394 29472 29526 30816 29973 Lime Production 11533 13325 14088 14379 15100 14595 14330 Incineration of Waste 8049 Ammonia Production and Urea
11461 11270 12616 12684 13289 13128
Consumption 16831 17796 16402 12849 12300 13968 11755 Cropland Remaining Cropland 7084 7049 7541 7854 7875 8319 7638 Limestone and Dolomite Use 5127 6683 5056 6768 8035 7702 6617 Aluminum Production 6831 Soda Ash Production and
5659 6086 4142 3801 4251 4477
Consumption 4141 4304 4181 4228 4162 4140 4111 Petrochemical Production 3311 4101 4479 4181 3837 3931 3449 Titanium Dioxide Production 1195 1526 1752 1755 1836 1930 1809 Carbon Dioxide Consumption 1416 1422 1421 1321 1709 1867 1780 Ferroalloy Production 2152 2036 1893 1392 1505 1552 1599 Phosphoric Acid Production 1529 1513 1382 1386 1167 1166 1187 Wetlands Remaining Wetlands 1033 1018 1227 1079 879 1012 941 Petroleum Systems 555 528 534 490 488 474 453 Zinc Production 929 993 1115 506 513 411 402 Lead Production 285 Silicon Carbide Production
298 311 266 270 267 264
and Consumption 375 Land Use Land-Use Change
329 248 219 207 196 175
and Forestry (Sink)a (909422) Wood Biomass and Ethanol
(842852) (664247) (950396) (959158) (955410) (940349)
Consumptionb 219341 236775 227276 229419 238323 245706 251763 International Bunker Fuelsb 111828 99817 98482 110505 129104 127054 135226
CH4 29209 29202 27903 26341 27058 27105 27030 Enteric Fermentation 6303 6844 6513 6509 6619 6723 6707 Landfills 7111 6860 5747 5980 6050 6023 6016 Natural Gas Systems 6169 6313 6223 4935 4907 4738 4591 Coal Mining 4003 3193 2877 2710 2776 2765 3221 Manure Management 1395 1612 1837 2011 2015 2183 2144 Petroleum Systems 1613 1524 1439 1344 1344 1372 1384 Wastewater Treatment 1120 Forest Land Remaining Forest
1183 1199 1158 1166 1162 1158
Land 152 203 681 467 1027 953 568 Rice Cultivation 339 363 357 326 282 295 343 Stationary Combustion 353 340 315 312 294 309 319
Trends in Greenhouse Gas Emissions 2-5
Abandoned Underground Coal Mines
Mobile Combustion CompostingField Burning of Agricultural
ResiduesPetrochemical Production Iron and Steel Production amp
Metallurgical Coke Production
Ferroalloy Production Silicon Carbide Production
and Consumption Incineration of Waste International Bunker Fuelsb
N2OAgricultural Soil Management Mobile Combustion Nitric Acid Production Manure Management Stationary Combustion Forest Land Remaining Forest
Land Wastewater Treatment N2O from Product Uses Adipic Acid Production CompostingSettlements Remaining
SettlementsField Burning of Agricultural
ResiduesIncineration of Waste Wetlands Remaining Wetlands International Bunker Fuelsb
HFCsSubstitution of Ozone
Depleting Substancesc
HCFC-22 Production Semiconductor Manufacture
PFCsAluminum Production Semiconductor Manufacture
SF6Electrical Transmission and
Distribution Magnesium Production and
Processing Semiconductor Manufacture
288 223
15
36 41
46 1
1 + 8
1040 656 142
61 47 41
9 12 14 51 1
3
1 2 + 3
M
M 3 +
M M M 1
1
+ +
392 204
35
35 52
47 1
1 + 6
1105 664 174
68 50 43
12 13 15 57 3
4
1 1 + 3
M
M 3 +
M M M 1
1
+ +
350 160
60
42 59
44 1
1 + 6
1115 678 172
67 54 47
39 14 16 18 4
4
2 1 + 3
M
M 2 +
M M M 1
1
+ +
266 119
75
4451
34+
+ + 7
1059 696 119
575447
271514166
5
2 1 + 3
M
M 1 +
M M M 1
1
+ +
264 269 281 112 105 97
75 79 80
43 46 46 48 48 43
35 33 31 + + +
+ + + + + + 8 7 8
1063 1057 1026 681 681 696 108 98 84
56 66 61 56 56 55 47 47 46
58 54 33 15 16 16 14 14 14 14 12 7 6 6 6
5 5 5
2 2 2 1 1 1 + + + 4 4 4
M M M
M M M 1 1 1 + + +
M M M M M M M M M 1 1 1
1 1 1
+ + + + + +
+ Does not exceed 05 Gg M Mixture of multiple gases a The net CO2 flux total includes both emissions and sequestration and constitutes a sink in the United States Sinks are only included in net emissions total Parentheses indicate negative values or sequestration b Emissions from International Bunker Fuels and Wood Biomass and Ethanol Consumption are not included in totals c Small amounts of PFC emissions also result from this source Note Totals may not sum due to independent rounding
2-6 Inventory of US Greenhouse Gas Emissions and Sinks 1990ndash2008
Emissions of all gases can be summed from each source category from Intergovernmental Panel on Climate Change (IPCC) guidance Over the nineteen-year period of 1990 to 2008 total emissions in the Energy Industrial Processes and Agriculture sectors grew by 7750 Tg CO2 Eq (15 percent) 162 Tg CO2 Eq (5 percent) and 397 Tg CO2 Eq (10 percent) respectively Emissions decreased in the Waste and Solvent and Other Product Use sectors by 181 Tg CO2 Eq (10 percent) and less than 01 Tg CO2 Eq (less than 04 percent) respectively Over the same period estimates of net C sequestration in the Land Use Land-Use Change and Forestry sector increased by 309 Tg CO2 Eq (34 percent)
Figure 2-4 US Greenhouse Gas Emissions and Sinks by ChapterIPCC Sector
71332 70599 71681 69568 70445
The net CO2 flux total includes both emissions and sequestration and constitutes a sink in the United States Sinks are only included in net emissions total Please refer to Table 2-9 for a breakout by source Note Totals may not sum due to independent rounding Note Parentheses indicate negative values or sequestration
64888
Table 2-3 Recent Trends in US Greenhouse Gas Emissions and Sinks by ChapterIPCC Sector (Tg CO2 Eq) ChapterIPCC Sector 1990 1995 2000 2005 2006 2007 2008 Energy 52241 55458 60875 61879 60891 61829 59990 Industrial Processes 3183 3391 3519 3347 3397 3509 3345 Solvent and Other Product Use 44 46 49 44 44 44 44 Agriculture 3878 4077 4109 4197 4172 4230 4275 Land Use Land-Use Change and Forestry (Emissions) 150 172 363 286 498 476 322
Waste 1772 1745 1530 1580 1597 1593 1591 Total Emissions 6268 Net CO2 Flux from Land Use Land-Use Change and Forestry (Sinks) (9094) (8429) (6642) (9504) (9592) (9554) (9403)
Net Emissions (Sources and Sinks) 52173 56460 63802 61828 61007 62127 60164
Energy Energy-related activities primarily fossil fuel combustion accounted for the vast majority of US CO2 emissions for the period of 1990 through 2008 In 2008 approximately 84 percent of the energy consumed in the United States (on a Btu basis) was produced through the combustion of fossil fuels The remaining 16 percent came from other energy sources such as hydropower biomass nuclear wind and solar energy (see Figure 2-5 and Figure 2-6) A discussion of specific trends related to CO2 as well as other greenhouse gas emissions from energy consumption is presented in the Energy chapter Energy-related activities are also responsible for CH4 and N2O emissions (37 percent and 13 percent of total US emissions of each gas respectively) Table 2-4 presents greenhouse gas emissions from the Energy chapter by source and gas
Figure 2-5 2008 Energy Chapter Greenhouse Gas Sources
Figure 2-6 2008 US Fossil Carbon Flows (Tg CO2 Eq)
2005 2006 2007 2008 CO2 49012
2000 Table 2-4 Emissions from Energy (Tg CO2 Eq) GasSource 1990 1995
52267 57807 59325 58369 59369 57505 Fossil Fuel Combustion 47357 50295 55934 57533 56528 57570 55728 Electricity Generation 18208 19479 22969 24021 23464 24128 23635
Trends in Greenhouse Gas Emissions 2-7
Transportation 14858 18953 18767 18937 17853 Industrial 8455
18095 16080 8626 8522 8256 8507 8422 8193
Residential 3391 3533 3712 3584 3221 3417 3427 Commercial 2167 2232 2277 2213 2060 2174 2195
US Territories 279 345 359 506 509 491 425 Non-Energy Use of Fuels 1196 1429 1461 1365 1414 1353 1342 Natural Gas Systems 373 422 294 295 295 308 300 Incineration of Waste 80 115 113 126 127 133 131 Petroleum Systems 06 05 05 05 05 05 05 Wood Biomass and Ethanol Consumption 2193 2368 2273 2294 2383 2457 2518 International Bunker Fuels 1118 998 985 1105 1291 1271 1352
CH4 2656 2513 2387 2034 2036 2007 2078 Natural Gas Systems 1295 1326 1307 1036 1031 995 964 Coal Mining 841 671 604 569 583 581 676 Petroleum Systems 339 320 302 282 282 288 291 Stationary Combustion 74 71 66 66 62 65 67 Abandoned Underground Coal
Mines 60 82 74 56 55 57 59 Mobile Combustion 47 43 34 25 23 22 20 Incineration of Waste + + + + + + + International Bunker Fuels 02 01 01 01 02 02 02
N2O 572 678 681 520 485 453 408 Mobile Combustion 439 540 532 369 336 303 261 Stationary Combustion 128 133 145 147 145 146 142 Incineration of Waste 05 05 04 04 04 04 04 International Bunker Fuels 11 09 09 10 12 12 12
Total 52241 55458 60875 61879 60891 61829 59990 + Does not exceed 005 Tg CO2 Eq These values are presented for informational purposes only and are not included in totals or are already accounted for in other source categories Note Totals may not sum due to independent rounding
CO2 emissions from fossil fuel combustion are presented in Table 2-5 based on the underlying US energy consumer data collected by EIA Estimates of CO2 emissions from fossil fuel combustion are calculated from these EIA ldquoend-use sectorsrdquo based on total consumption and appropriate fuel properties (any additional analysis and refinement of the EIA data is further explained in the Energy chapter of this report) EIArsquos fuel consumption data for the electric power sector comprises electricity-only and combined-heat-and-power (CHP) plants within the NAICS 22 category whose primary business is to sell electricity or electricity and heat to the public (nonutility power producers can be included in this sector as long as they meet they electric power sector definition) EIA statistics for the industrial sector include fossil fuel consumption that occurs in the fields of manufacturing agriculture mining and construction EIArsquos fuel consumption data for the transportation sector consists of all vehicles whose primary purpose is transporting people andor goods from one physical location to another EIArsquos fuel consumption data for the industrial sector consists of all facilities and equipment used for producing processing or assembling goods (EIA includes generators that produce electricity andor useful thermal output primarily to support on-site industrial activities in this sector) EIArsquos fuel consumption data for the residential sector consists of living quarters for private households EIArsquos fuel consumption data for the commercial sector consists of service-providing facilities and equipment from private and public organizations and businesses (EIA includes generators that produce electricity andor useful thermal output primarily to support the activities at commercial establishments in this sector) Table 2-5 Figure 2-7 and Figure 2-8 summarize CO2 emissions from fossil fuel combustion by end-use sector
Table 2-5 CO2 Emissions from Fossil Fuel Combustion by End-Use Sector (Tg CO2 Eq) End-Use Sector 1990 1995 2000 2005 2006 2007 2008 Transportation 14888 16110 18130 19001 18812 18988 17899
Combustion 14858 16080 18095 18953 18767 18937 17853
2-8 Inventory of US Greenhouse Gas Emissions and Sinks 1990ndash2008
Electricity 30 31 34 47 45 50 47 15788 16420 15625 15628 15722 15109 Industrial 15322
Combustion 8454 8626 8522 8256 8507 8422 8193 Electricity 6868 7162 7898 7370 7120 7300 6916
Residential 9322 9951 11336 12151 11529 11979 11845 Combustion 3391 3533 3712 3584 3221 3417 3427 Electricity 5930 6418 7624 8567 8308 8561 8418
8100 9689 10250 10050 10391 10449 Commercial 7546 Combustion 2167 2232 2277 2213 2060 2174 2195 Electricity 5380 5868 7413 8037 7990 8217 8254
US Territoriesa 279 345 359 506 509 491 425 Total 47357 50295 55934 57533 56528 57570 55728 Electricity Generation 18208 19479 22969 24021 23464 24128 23635
Note Totals may not sum due to independent rounding Combustion-related emissions from electricity generation are allocated based on aggregate national electricity consumption by each end-use sector
Figure 2-7 2008 CO2 Emissions from Fossil Fuel Combustion by Sector and Fuel Type
Figure 2-8 2008 End-Use Sector Emissions from Fossil Fuel Combustion
The main driver of emissions in the energy sector is CO2 from fossil fuel combustion The transportation end-use sector accounted for 17899 Tg CO2 Eq in 2008 or approximately 32 percent of total CO2 emissions from fossil fuel combustion the largest share of any end-use sector40 The industrial end-use sector accounted for 27 percent of CO2 emissions from fossil fuel combustion The residential and commercial end-use sectors accounted for an average 21 and 19 percent respectively of CO2 emissions from fossil fuel combustion Both end-use sectors were heavily reliant on electricity for meeting energy needs with electricity consumption for lighting heating air conditioning and operating appliances contributing to about 71 and 79 percent of emissions from the residential and commercial end-use sectors respectively Significant trends in emissions from energy source categories over the nineteen-year period from 1990 through 2008 included the following
bull Total CO2 emissions from fossil fuel combustion increased from 47357 Tg CO2 Eq to 55728 Tg CO2 Eqmdashan 18 percent total increase over the nineteen-year period From 2007 to 2008 these emissions decreased by 1842 Tg CO2 Eq (32 percent)
bull CO2 emissions from non-energy use of fossil fuels have increased 146 Tg CO2 Eq (122 percent) from 1990 through 2008 Emissions from non-energy uses of fossil fuels were 1342 Tg CO2 Eq in 2008 which constituted 23 percent of total national CO2 emissions
bull CH4 emissions from natural gas systems were 964 Tg CO2 Eq in 2008 emissions have declined by 331 Tg CO2 Eq (256 percent) since 1990 This decline has been due to improvements in technology and management practices as well as replacement of old equipment
bull CH4 emissions from coal mining were 676 Tg CO2 Eq In 2008 a decline in emissions of 164 Tg CO2 Eq (195 percent) from 1990 is a result of the mining of less gassy coal from underground mines and the increased use of CH4 collected from degasification systems
bull In 2008 N2O emissions from mobile combustion were 261 Tg CO2 Eq (approximately 82 percent of US N2O emissions) From 1990 to 2008 N2O emissions from mobile combustion decreased by 405 percent However from 1990 to 1998 emissions increased by 26 percent due to control technologies that reduced NOx emissions while increasing N2O emissions Since 1998 newer control technologies have led to a steady decline in N2O from this source
40 Note that electricity generation is the largest emitter of CO2 when electricity is not distributed among end-use sectors
Trends in Greenhouse Gas Emissions 2-9
bull CO2 emissions from incineration of waste (131 Tg CO2 Eq in 2008) increased by 51 Tg CO2 Eq (63 percent) from 1990 through 2008 as the volume of plastics and other fossil carbon-containing materials in municipal solid waste grew
Industrial Processes Greenhouse gas emissions are produced as the by-products of many non-energy-related industrial activities For example industrial processes can chemically transform raw materials which often release waste gases such as CO2 CH4 and N2O These processes include iron and steel production and metallurgical coke production cement production ammonia production and urea consumption lime production limestone and dolomite use (eg flux stone flue gas desulfurization and glass manufacturing) soda ash production and consumption titanium dioxide production phosphoric acid production ferroalloy production CO2 consumption silicon carbide production and consumption aluminum production petrochemical production nitric acid production adipic acid production lead production and zinc production (see Figure 2-9) Industrial processes also release HFCs PFCs and SF6 In addition to their use as ODS substitutes HFCs PFCs SF6 and other fluorinated compounds are employed and emitted by a number of other industrial sources in the United States These industries include aluminum production HCFC-22 production semiconductor manufacture electric power transmission and distribution and magnesium metal production and processing Table 2-6 presents greenhouse gas emissions from industrial processes by source category
Figure 2-9 2008 Industrial Processes Chapter Greenhouse Gas Sources
2005 2006 2007 2008 CO2 1915
2000 Table 2-6 Emissions from Industrial Processes (Tg CO2 Eq) GasSource 1990 1995
1926 1877 1670 1715 1740 1621 Iron and Steel Production and
Metallurgical Coke Production 1026 957 881 677 705 728 690 Iron and Steel Production 971 907 837 639 669 690 637 Metallurgical Coke Production 55 50 44 38 37 38 53
Cement Production 333 368 412 459 466 452 411 Lime Production 115 133 141 144 151 146 143 Ammonia Production amp Urea
Consumption 168 178 164 128 123 140 118 Limestone and Dolomite Use 51 67 51 68 80 77 66 Aluminum Production 68 57 61 41 38 43 45 Soda Ash Production and Consumption 41 43 42 42 42 41 41 Petrochemical Production 33 41 45 42 38 39 34 Titanium Dioxide Production 12 15 18 18 18 19 18 Carbon Dioxide Consumption 14 14 14 13 17 19 18 Ferroalloy Production 22 20 19 14 15 16 16 Phosphoric Acid Production 15 15 14 14 12 12 12 Zinc Production 09 10 11 05 05 04 04 Lead Production 03 03 03 03 03 03 03 Silicon Carbide Production and
Consumption 04 03 02 02 02 02 02 CH4 19 21 22 18 17 17 16
Petrochemical Production 09 11 12 11 10 10 09 Iron and Steel Production and
Metallurgical Coke Production 10 10 09 07 07 07 06 Iron and Steel Production 10 10 09 07 07 07 06 Metallurgical Coke Production + + + + + + + Ferroalloy Production + + + + + + + Silicon Carbide Production and
Consumption + + + + + + +
2-10 Inventory of US Greenhouse Gas Emissions and Sinks 1990ndash2008
N2O 347 386 263 226 215 242 211 Nitric Acid Production 189 210 207 176 172 205 190 Adipic Acid Production 158 176 55 50 43 37 20
HFCs 369 622 1032 1193 1218 1274 1269 Substitution of Ozone Depleting
Substancesa 03 290 743 1032 1077 1101 1130 HCFC-22 Manufacture 364 330 286 158 138 170 136 Semiconductor Manufacturing HFCs 02 03 03 02 03 03 03
PFCs 208 156 135 62 60 75 67 Semiconductor Manufacturing PFCs 22 38 49 32 35 36 40 Aluminum Production 185 118 86 30 25 38 27
SF6 326 279 191 178 170 161 161 Electrical Transmission and Distribution 266 214 150 140 132 127 131 Magnesium Production and Processing 54 56 30 29 29 26 20 Semiconductor Manufacturing SF6 05 09 11 10 10 08 11
Total 3183 3391 3519 3347 3397 3509 3345 + Does not exceed 005 Tg CO2 Eq a Small amounts of PFC emissions also result from this source Note Totals may not sum due to independent rounding
Overall emissions from industrial processes increased by 51 percent from 1990 to 2008 despite decreases in emissions from several industrial processes such as iron and steel production and metallurgical coke production aluminum production HCFC-22 production and electrical transmission and distribution The increase in overall emissions was driven by a rise in the emissions originating from cement manufacture and primarily the emissions from the use of substitutes for ozone depleting substances Significant trends in emissions from industrial processes source categories over the nineteen-year period from 1990 through 2008 included the following
bull HFC emissions from ODS substitutes have been increasing from small amounts in 1990 to 1130 Tg CO2 Eq in 2008 This increase results from efforts to phase out CFCs and other ODSs in the United States In the short term this trend is expected to continue and will likely accelerate over the next decade as HCFCsmdashwhich are interim substitutes in many applicationsmdashare phased out under the provisions of the Copenhagen Amendments to the Montreal Protocol
bull CO2 and CH4 emissions from iron and steel production and metallurgical coke production decreased by 52 percent to 697 Tg CO2 Eq in 2008 and have declined overall by 339 Tg CO2 Eq (327 percent) from 1990 through 2008 due to restructuring of the industry technological improvements and increased scrap utilization
bull PFC emissions from aluminum production decreased by about 85 percent (158 Tg CO2 Eq) from 1990 to 2008 due to both industry emission reduction efforts and lower domestic aluminum production
bull N2O emissions from adipic acid production were 20 Tg CO2 Eq in 2008 and have decreased significantly in recent years from the widespread installation of pollution control measures These emissions from adipic acid production have decreased nearly 87 percent since 1990 and except for slight increases in 2002 and 2003 these declined by 62 percent from 1998 to 2008
bull CO2 emissions from ammonia production and urea application (118 Tg CO2 Eq in 2008) have decreased by 51 Tg CO2 Eq (30 percent) since 1990 due to a decrease in domestic ammonia production This decrease in ammonia production can be attributed to market fluctuations and high natural gas prices
Solvent and Other Product Use Greenhouse gas emissions are produced as a by-product of various solvent and other product uses In the United States N2O Emissions from Product Uses the only source of greenhouse gas emissions from this sector accounted for 44 Tg CO2 Eq or less than 01 percent of total US emissions in 2008 (see Table 2-7)
Table 2-7 N2O Emissions from Solvent and Other Product Use (Tg CO2 Eq) GasSource 1990 1995 2000 2005 2006 2007 2008
Trends in Greenhouse Gas Emissions 2-11
N2O 44 46 49 44 44 44 44 N2O from Product Uses 44 46 49 44 44 44 44
Total 44 46 49 44 44 44 44
In 2008 N2O emissions from product uses constituted slightly more than 1 percent of US N2O emissions From 1990 to 2008 emissions from this source category decreased by less than 05 percent though slight increases occurred in intermediate years
Agriculture Agricultural activities contribute directly to emissions of greenhouse gases through a variety of processes including the following source categories enteric fermentation in domestic livestock livestock manure management rice cultivation agricultural soil management and field burning of agricultural residues
In 2008 agricultural activities were responsible for emissions of 4275 Tg CO2 Eq or 61 percent of total US greenhouse gas emissions CH4 and N2O were the primary greenhouse gases emitted by agricultural activities CH4 emissions from enteric fermentation and manure management represented about 25 percent and 8 percent of total CH4 emissions from anthropogenic activities respectively in 2008 Agricultural soil management activities such as fertilizer application and other cropping practices were the largest source of US N2O emissions in 2008 accounting for almost 68 percent
Figure 2-10 2008 Agriculture Chapter Greenhouse Gas Sources
2005 2006 2007 2008 CH4 1696
2000 Table 2-8 Emissions from Agriculture (Tg CO2 Eq) GasSource 1990 1995
1859 1837 1867 1881 1942 1940 Enteric Fermentation 1324 1437 1368 1367 1390 1412 1408 Manure Management 293 339 386 422 423 459 450 Rice Cultivation 71 76 75 68 59 62 72 Field Burning of
Agricultural Residues 08 07 09 09 09 10 10 N2O 2183 2218 2272 2330 2291 2288 2335
Agricultural Soil Management 2035 2059 2101 2158 2112 2110 2159
Manure Management 144 155 167 166 173 173 171 Field Burning of
Agricultural Residues 04 04 05 05 05 05 05 Total 3878 4077 4109 4197 4172 4230 4275 Note Totals may not sum due to independent rounding
Some significant trends in US emissions from Agriculture include the following
bull Agricultural soils produced approximately 68 percent of N2O emissions in the United States in 2008 Estimated emissions from this source in 2008 were 2159 Tg CO2 Eq Annual N2O emissions from agricultural soils fluctuated between 1990 and 2008 although overall emissions were 61 percent higher in 2008 than in 1990 N2O emissions from this source have not shown any significant long-term trend as their estimation is highly sensitive to the amount of N applied to soils which has not changed significantly over the time-period and to weather patterns and crop type
bull Enteric fermentation was the largest source of CH4 emissions in 2008 at 1408 Tg CO2 Eq Although emissions from enteric fermentation have increased by 64 percent between 1990 and 2008 emissions increased about 9 percent between 1990 and 1995 and decreased about 6 percent from 1995 to 2004 mainly due to decreasing populations of both beef and dairy cattle and improved feed quality for feedlot cattle Emissions increased by 5 percent from 2004 through 2007 as both dairy and beef populations
2-12 Inventory of US Greenhouse Gas Emissions and Sinks 1990ndash2008
increased and the literature for dairy cow diets indicated a trend toward a decrease in feed digestibility Emissions decreased again in 2008 as beef cattle populations decreased again During this timeframe populations of sheep have decreased 48 percent since 1990 while horse populations have increased by almost 87 percent mostly over the last seven years Goat and swine populations have increased 1 percent and 25 percent respectively during this timeframe
bull Overall emissions from manure management increased 42 percent between 1990 and 2008 This encompassed an increase of 54 percent for CH4 from 293 Tg CO2 Eq in 1990 to 450 Tg CO2 Eq in 2008 and an increase of almost 19 percent for N2O from 144 Tg CO2 Eq in 1990 to 171 Tg CO2 Eq in 2008 The majority of this increase was from swine and dairy cow manure since the general trend in manure management is one of increasing use of liquid systems which tends to produce greater CH4 emissions
Land Use Land-Use Change and Forestry When humans alter the terrestrial biosphere through land use changes in land use and land management practices they also alter the background carbon fluxes between biomass soils and the atmosphere Forest management practices tree planting in urban areas the management of agricultural soils and the landfilling of yard trimmings and food scraps have resulted in an uptake (sequestration) of carbon in the United States which offset about 14 percent of total US greenhouse gas emissions in 2008 Forests (including vegetation soils and harvested wood) accounted for approximately 84 percent of total 2008 net CO2 flux urban trees accounted for 10 percent mineral and organic soil carbon stock changes accounted for 5 percent and landfilled yard trimmings and food scraps accounted for 1 percent of the total net flux in 2008 The net forest sequestration is a result of net forest growth increasing forest area and a net accumulation of carbon stocks in harvested wood pools The net sequestration in urban forests is a result of net tree growth and increased urban forest size In agricultural soils mineral and organic soils sequester approximately 59 times as much C as is emitted from these soils through liming and urea fertilization The mineral soil C sequestration is largely due to the conversion of cropland to hay production fields the limited use of bare-summer fallow areas in semi-arid areas and an increase in the adoption of conservation tillage practices The landfilled yard trimmings and food scraps net sequestration is due to the long-term accumulation of yard trimming carbon and food scraps in landfills
Land use land-use change and forestry activities in 2008 resulted in a net C sequestration of 9403 Tg CO2 Eq (2565 Tg C) (Table 2-9) This represents an offset of approximately 16 percent of total US CO2 emissions or 14 percent of total greenhouse gas emissions in 2008 Between 1990 and 2008 total land use land-use change and forestry net C flux resulted in a 34 percent increase in CO2 sequestration
Table 2-9 Net CO2 Flux from Land Use Land-Use Change and Forestry (Tg CO2 Eq) Sink Category 1990 2005 2006 2007 2008 2000 1995 Forest Land Remaining Forest
Land (7298) (6926) (4677) (8066) (8125) (8069) (7919) Cropland Remaining Cropland (294) (229) (302) (183) (191) (197) (181) Land Converted to Cropland 22 29 24 59 59 59 59 Grassland Remaining
Grassland (520) (267) (526) (90) (89) (88) (87) Land Converted to Grassland (198) (223) (273) (246) (245) (243) (242) Settlements Remaining
Settlements (571) (673) (775) (878) (898) (919) (939) Other (Landfilled Yard
Trimmings and Food Scraps) (235) (139) (113) (101) (103) (98) (95) Total (9094) (8429) (6642) (9504) (9592) (9554) (9403) Note Totals may not sum due to independent rounding Parentheses indicate net sequestration
Land use land-use change and forestry source categories also resulted in emissions of CO2 CH4 and N2O that are not included in the net CO2 flux estimates presented in Table 2-10 The application of crushed limestone and dolomite to managed land (ie soil liming) and urea fertilization resulted in CO2 emissions of 76 Tg CO2 Eq in 2008 an increase of about 8 percent relative to 1990 Lands undergoing peat extraction resulted in CO2 emissions of 09 Tg CO2 Eq (941 Gg) and N2O emissions of less than 001 Tg CO2 Eq N2O emissions from the application of synthetic fertilizers to forest soils have increased from 1990 to 04 Tg CO2 Eq in 2008 Settlement soils in 2008
Trends in Greenhouse Gas Emissions 2-13
resulted in direct N2O emissions of 16 Tg CO2 Eq a 61 percent increase relative to 1990 Non-CO2 emissions from forest fires in 2008 resulted in CH4 emissions of 119 Tg CO2 Eq and in N2O emissions of 97 Tg CO2 Eq (Table 2-10)
Table 2-10 Emissions from Land Use Land-Use Change and Forestry (Tg CO2 Eq) Source Category 1990 1995 2000 2005 2006 2007 2008 CO2 81 81 88 89 88 93 86 Cropland Remaining Cropland
Liming of Agricultural Soils 47 44 43 43 42 45 38 Cropland Remaining Cropland
Urea Fertilization 24 27 32 35 37 38 38 Wetlands Remaining Wetlands
Peatlands Remaining Peatlands 10 10 12 11 09 10 09 CH4 32 43 143 98 216 200 119 Forest Land Remaining Forest Land
Forest Fires 32 43 143 98 216 200 119 N2O 37 49 132 98 195 183 117 Forest Land Remaining Forest Land
Forest Fires 26 35 117 80 176 163 97 Forest Land Remaining Forest Land
Forest Soils 01 02 04 04 04 04 04 Settlements Remaining Settlements Settlement Soils 10 12 11 15 15 16 16
Wetlands Remaining Wetlands Peatlands Remaining Peatlands + + + + + + + Total 150 172 363 286 498 476 322 + Less than 005 Tg CO2 Eq Note Totals may not sum due to independent rounding
Other significant trends from 1990 to 2008 in land use land-use change and forestry emissions include
bull Net C sequestration by forest land has increased by almost 9 percent This is primarily due to increased forest management and the effects of previous reforestation The increase in intensive forest management resulted in higher growth rates and higher biomass density The tree planting and conservation efforts of the 1970s and 1980s continue to have a significant impact on sequestration rates Finally the forested area in the United States increased over the past 19 years although only at an average rate of 023 percent per year
bull Net sequestration of C by urban trees has increased by 65 percent over the period from 1990 to 2008 This is primarily due to an increase in urbanized land area in the United States
bull Annual C sequestration in landfilled yard trimmings and food scraps has decreased by 59 percent since 1990 This is due in part to a decrease in the amount of yard trimmings and food scraps generated In addition the proportion of yard trimmings and food scraps landfilled has decreased as there has been a significant rise in the number of municipal composting facilities in the United States
Waste Waste management and treatment activities are sources of greenhouse gas emissions (see Figure 2-11) In 2008 landfills were the second largest source of anthropogenic CH4 emissions accounting for 22 percent of total US CH4 emissions41 Additionally wastewater treatment accounts for 4 percent of US CH4 emissions and 2 percent of N2O emissions Emissions of CH4 and N2O from composting grew from 1990 to 2008 and resulted in emissions of 35 Tg CO2 Eq in 2008 A summary of greenhouse gas emissions from the Waste chapter is presented in Table
41 Landfills also store carbon due to incomplete degradation of organic materials such as wood products and yard trimmings as described in the Land Use Land-Use Change and Forestry chapter
2-14 Inventory of US Greenhouse Gas Emissions and Sinks 1990ndash2008
2-11
Figure 2-11 2008 Waste Chapter Greenhouse Gas Sources
Overall in 2008 waste activities generated emissions of 1591 Tg CO2 Eq or 23 percent of total US greenhouse gas emissions
Table 2-11 Emissions from Waste (Tg CO2 Eq) 2005 2006 2007 2008
CH4 1732 2000 1995 GasSource 1990
1696 1471 1515 1531 1525 1523 Landfills 1493 1441 1207 1256 1271 1265 1263 Wastewater Treatment 235 248 252 243 245 244 243 Composting 03 07 13 16 16 17 17
N2O 40 48 58 65 66 67 68 Wastewater Treatment 37 40 45 47 48 49 49 Composting 04 08 14 17 18 18 18
Total 1772 1745 1530 1580 1597 1593 1591 Note Totals may not sum due to independent rounding
Some significant trends in US emissions from Waste include the following
bull From 1990 to 2008 net CH4 emissions from landfills decreased by 230 Tg CO2 Eq (15 percent) with small increases occurring in interim years This downward trend in overall emissions is the result of increases in the amount of landfill gas collected and combusted42 which has more than offset the additional CH4 emissions resulting from an increase in the amount of municipal solid waste landfilled
bull From 1990 to 2008 CH4 and N2O emissions from wastewater treatment increased by 08 Tg CO2 Eq (35 percent) and 13 Tg CO2 Eq (34 percent) respectively
bull CH4 and N2O emissions from composting each increased by less than 01 Tg CO2 Eq (1 percent) from 2007 to 2008 Emissions from composting have been continually increasing since 1990 from 07 Tg CO2 Eq to 35 Tg CO2 Eq in 2008 an over four-fold increase over the time series
22 Emissions by Economic Sector Throughout this report emission estimates are grouped into six sectors (ie chapters) defined by the IPCC and detailed above Energy Industrial Processes Solvent and Other Product Use Agriculture Land Use Land-Use Change and Forestry and Waste While it is important to use this characterization for consistency with UNFCCC reporting guidelines it is also useful to allocate emissions into more commonly used sectoral categories This section reports emissions by the following US economic sectors residential commercial industry transportation electricity generation and agriculture as well as US territories
Using this categorization emissions from electricity generation accounted for the largest portion (35 percent) of US greenhouse gas emissions in 2008 Transportation activities in aggregate accounted for the second largest portion (27 percent) Emissions from industry accounted for about 19 percent of US greenhouse gas emissions in 2008 In contrast to electricity generation and transportation emissions from industry have in general declined over the past decade The long-term decline in these emissions has been due to structural changes in the US economy (ie shifts from a manufacturing-based to a service-based economy) fuel switching and efficiency improvements The remaining 19 percent of US greenhouse gas emissions were contributed by the residential agriculture and commercial sectors plus emissions from US territories The residential sector accounted for 5 percent and primarily consisted of CO2 emissions from fossil fuel combustion Activities related to agriculture accounted for roughly 7 percent of US emissions unlike other economic sectors agricultural sector emissions were dominated by
42 The CO2 produced from combusted landfill CH4 at landfills is not counted in national inventories as it is considered part of the natural C cycle of decomposition
Trends in Greenhouse Gas Emissions 2-15
N2O emissions from agricultural soil management and CH4 emissions from enteric fermentation rather than CO2 from fossil fuel combustion The commercial sector accounted for roughly 6 percent of emissions while US territories accounted for about 1 percent
CO2 was also emitted and sequestered by a variety of activities related to forest management practices tree planting in urban areas the management of agricultural soils and landfilling of yard trimmings
Table 2-12 presents a detailed breakdown of emissions from each of these economic sectors by source category as they are defined in this report Figure 2-12 shows the trend in emissions by sector from 1990 to 2008
Figure 2-12 Emissions Allocated to Economic Sectors
Table 2-12 US Greenhouse Gas Emissions Allocated to Economic Sectors (Tg CO2 Eq and Percent of Total in 2008)
SectorSource 1990 1995 2000 2005 2006 2007 2008 Percenta
18672 19937 23368 24435 23875 24540 24042 346
18208 19479 22969 24021 23464 24128 23635 340 85 119 117 130 131 137 135 02
266 214 150 140 132 127 131 02 86 91 106 110 108 110 108 02 26 33 25 34 40 39 33 00
15450 16952 19323 20161 19930 20035 18861 271
14858 16080 18095 18953 18767 18937 17853 257
+ 190 557 729 722 688 649 09 474 569 551 376 341 307 264 04 118 113 121 102 99 102 95 01
15066 15313 14691 13509 13802 13742 13424 193
8144 8260 8134 7788 8017 7938 7739 111 1669 1748 1601 1331 1326 1303 1264 18 1020 1256 1231 1183 1226 1166 1175 17
1035 967 890 684 713 735 697 10 841 671 604 569 583 581 676 10 333 368 412 459 466 452 411 06 344 325 307 287 287 293 295 04 189 210 207 176 172 205 190 03 115 133 141 144 151 146 143 02 364 330 286 158 138 170 136 02
168 178 164 128 123 140 118 02 254 175 147 71 63 81 72 01
+ 12 31 52 57 61 66 01
60 82 74 56 55 57 59 01 29 49 62 44 47 47 54 01
Electric Power Industry CO2 from Fossil Fuel
CombustionIncineration of Waste Electrical Transmission and
Distribution Stationary Combustion Limestone and Dolomite Use
TransportationCO2 from Fossil Fuel
CombustionSubstitution of Ozone
Depleting Substances Mobile Combustion Non-Energy Use of Fuels
Industry CO2 from Fossil Fuel
CombustionNatural Gas Systems Non-Energy Use of Fuels Iron and Steel Production amp
Metallurgical Coke Production
Coal Mining Cement Production Petroleum Systems Nitric Acid Production HCFC-22 Production Lime Production Ammonia Production and Urea
ConsumptionAluminum Production Substitution of Ozone
Depleting Substances Abandoned Underground Coal
Mines Semiconductor Manufacture
2-16 Inventory of US Greenhouse Gas Emissions and Sinks 1990ndash2008
N2O from Product Uses Petrochemical Production Soda Ash Production and
ConsumptionStationary Combustion Limestone and Dolomite Use Magnesium Production and
Processing Adipic Acid Production Titanium Dioxide Production Carbon Dioxide Consumption Ferroalloy Production Mobile Combustion Phosphoric Acid Production Zinc Production Lead Production Silicon Carbide Production and
ConsumptionAgriculture
N2O from Agricultural Soil Management
Enteric Fermentation Manure Management CO2 from Fossil Fuel
CombustionCH4 and N2O from Forest
FiresRice Cultivation Liming of Agricultural Soils Urea Fertilization Field Burning of Agricultural
ResiduesCO2 and N2O from Managed
PeatlandsMobile Combustion N2O from Forest Soils Stationary Combustion
CommercialCO2 from Fossil Fuel
CombustionLandfills Substitution of Ozone
Depleting Substances Wastewater Treatment Human Sewage CompostingStationary Combustion
ResidentialCO2 from Fossil Fuel
CombustionSubstitution of Ozone
Depleting Substances
44 42
41 47 26
158 54 12 14 22 09150903
04 4332
2035 1324
437
3104
58 714724
12
10 0301
+ 3951
2167 1493
+ 235 37
07 12
3459
3391
03
46 52
43 49 33
176 56 15 14 20 10 15 10 03
03 4608
2059 1437 493
3660
77 76 44 27
11
10 04 02
+ 3996
2232 1441
07 248 40 15 13 3676
3533
81
49 57
42 48 25
55 30 18 14 19 11 14 11 03
03 4853
2101 1368 552
3879
260 75 43 32
14
12 04 04
+ 3873
2277 1207
55 252 45 26 12 3867
3712
101
44 53
42 44 34
50 29 18 13 14 13 14 05 03
02 4941
2158 1367 589
4681
178 68 43 35
15
11 05 04
+ 3990
2213 1256
185 243 47 33 12 3707
3584
65
44 48
42 46 40
43 29 18 17 15 13 12 05 03
02 5151
2112 1390
596
4904
39259 42 37
14
09 05 04
+ 3892
2060 1271
224 245
48 33 11
3349
3221
75
44 44 01 49 44 01
41 41 01 45 41 01 39 33 00
37 20 00 26 20 00 19 18 00 19 18 00 16 16 00 13 13 00 12 12 00 04 04 00 03 03 00
02 02 00 5180 5041 72
2110 2159 31 1412 1408 20
632 621 09
4844 4544 07
363 217 03 62 72 01 45 38 01 38 38 01
15 15 00
10 09 00 05 05 00 04 04 00
+ + 00 4044 4109 59
2174 2195 32 1265 1263 18
266 311 04 244 243 03
49 49 01 35 35 01 12 12 00
3562 3593 52
3417 3427 49
86 103 01
Trends in Greenhouse Gas Emissions 2-17
Stationary Combustion 55 50 43 43 39 42 46 01 Settlement Soil Fertilization 10 12 11 15 15 16 16 00
US Territories 337 407 469 589 600 578 499 07 CO2 from Fossil Fuel
Combustion 279 345 359 506 509 491 425 06 Non-Energy Use of Fuels 57 60 109 81 89 85 72 01 Stationary Combustion 01 01 01 02 02 02 02 00
Total Emissions 61268 64888 70445 71332 70599 71681 69568 1000 Sinks (9094) (8429) (6642) (9504) (9592) (9554) (9403) -135 CO2 Flux from Forests (7298) (6926) (4677) (8066) (8125) (8069) (7919) -114 Urban Trees (571) (673) (775) (878) (898) (919) (939) -13 CO2 Flux from Agricultural Soil Carbon Stocks (991) (690) (1077) (459) (465) (469) (450) -06 Landfilled Yard Trimmings and Food Scraps (235) (139) (113) (101) (103) (98) (95) -01 Net Emissions 52173 56460 63802 61828 61007 62127 60164 865
Note Includes all emissions of CO2 CH4 N2O HFCs PFCs and SF6 Parentheses indicate negative values or sequestration Totals may not sum due to independent rounding ODS (Ozone Depleting Substances) + Does not exceed 005 Tg CO2 Eq or 005 percent a Percent of total emissions for year 2008
Emissions with Electricity Distributed to Economic Sectors It can also be useful to view greenhouse gas emissions from economic sectors with emissions related to electricity generation distributed into end-use categories (ie emissions from electricity generation are allocated to the economic sectors in which the electricity is consumed) The generation transmission and distribution of electricity which is the largest economic sector in the United States accounted for 35 percent of total US greenhouse gas emissions in 2008 Emissions increased by 30 percent since 1990 as electricity demand grew and fossil fuels remained the dominant energy source for generation Electricity generation-related emissions decreased from 2007 to 2008 by 2 percent primarily due to decreased CO2 emissions from fossil fuel combustion The electricity generation sector in the United States is composed of traditional electric utilities as well as other entities such as power marketers and non-utility power producers The majority of electricity generated by these entities was through the combustion of coal in boilers to produce high-pressure steam that is passed through a turbine Table 2-13 provides a detailed summary of emissions from electricity generation-related activities
Table 2-13 Electricity Generation-Related Greenhouse Gas Emissions (Tg CO2 Eq) GasFuel Type or Source 1990 1995 2000 2005 2006 2007 2008 CO2 18314 19627 23107 24181 23631 24300 23799 CO2 from Fossil Fuel Combustion 18208 19479 22969 24021 23464 24128 23635 Coal 15476 16607 19274 19838 19537 19873 19626 Natural Gas 1753 2281 2808 3188 3380 3713 3616 Petroleum 975 587 884 992 544 539 389 Geothermal 04 03 04 04 04 04 04
Incineration of Waste 80 115 113 126 127 133 131 Limestone and Dolomite Use 26 33 25 34 40 39 33
CH4 06 06 07 07 07 07 07 Stationary Combustion 06 06 07 07 07 07 07 Incineration of Waste + + + + + + + N2O 85 90 104 107 105 106 105 Stationary Combustion 81 86 100 103 101 102 101 Incineration of Waste 05 05 04 04 04 04 04 SF6 266 214 150 140 132 127 131
2-18 Inventory of US Greenhouse Gas Emissions and Sinks 1990ndash2008
Electrical Transmission and Distribution 266 214 150 140 132 127 131
Total 18672 19937 23368 24435 23875 24540 24042 Note Totals may not sum due to independent rounding Includes only stationary combustion emissions related to the generation of electricity + Does not exceed 005 Tg CO2 Eq or 005 percent
To distribute electricity emissions among economic end-use sectors emissions from the source categories assigned to the electricity generation sector were allocated to the residential commercial industry transportation and agriculture economic sectors according to retail sales of electricity (EIA 2009a and Duffield 2006) These three source categories include CO2 from Fossil Fuel Combustion CH4 and N2O from Stationary Combustion and SF6
from Electrical Transmission and Distribution Systems43
When emissions from electricity are distributed among these sectors industry accounts for the largest share of US greenhouse gas emissions (29 percent) followed closely by emissions from transportation activities which account for 27 percent of total emissions Emissions from the residential and commercial sectors also increase substantially when emissions from electricity are included due to their relatively large share of electricity consumption In all sectors except agriculture CO2 accounts for more than 80 percent of greenhouse gas emissions primarily from the combustion of fossil fuels
Table 2-14 presents a detailed breakdown of emissions from each of these economic sectors with emissions from electricity generation distributed to them Figure 2-13 shows the trend in these emissions by sector from 1990 to 2008
Figure 2-13 Emissions with Electricity Distributed to Economic Sectors
Table 2-14 US Greenhouse Gas Emissions by Economic Sector and Gas with Electricity-Related Emissions Distributed (Tg CO2 Eq) and Percent of Total in 2008 SectorGas 1990 2005 2006 2007 2008 Percenta
Industry 21798 2000 1995
22280 22392 20711 20773 20842 20184 290 Direct Emissions 15066 15313 14691 13509 13802 13742 13424 193
CO2 11303 11605 11363 10622 10906 10830 10495 151 CH4 2948 2865 2625 2277 2285 2266 2325 33 N2O 327 354 328 290 288 317 293 04 HFCs PFCs and SF6 488 489 375 319 323 329 311 04
Electricity-Related 6733 6967 7701 7202 6971 7100 6760 97 CO2 6604 6859 7615 7128 6900 7030 6692 96 CH4 02 02 02 02 02 02 02 00 N2O 31 32 34 32 31 31 29 00 SF6 96 75 50 41 39 37 37 01
Transportation 15482 16983 19358 20209 19976 20086 18908 272 Direct Emissions 15450 16952 19323 20161 19930 20035 18861 271
CO2 14976 16193 18216 19055 18866 19040 17948 258 CH4 45 40 31 22 20 19 17 00 N2O 4295 5287 5195 3546 3212 2878 2465 04 HFCsb + 190 557 729 722 688 649 09
Electricity-Related 31 31 35 48 46 51 48 01 CO2 31 31 35 48 46 51 47 01 CH4 + + + + + + + 00 N2O + + + + + + + 00
43 Emissions were not distributed to US territories since the electricity generation sector only includes emissions related to the generation of electricity in the 50 states and the District of Columbia
Trends in Greenhouse Gas Emissions 2-19
SF6 + + + + + 00++ Commercial 9468 10002 11415 12165 12022 12401 12506 180 Direct Emissions 3951 3996 3873 3990 3892 4044 4109 59
CO2 2167 2232 2277 2213 2060 2174 2195 32 CH4 1740 1705 1480 1524 1540 1534 1532 22 N2O 44 52 62 68 69 70 71 01 HFCs + 07 55 185 224 266 311 04
Electricity-Related 5517 6006 7541 8176 8130 8358 8396 121 CO2 5411 5913 7457 8091 8047 8276 8312 119 CH4 02 02 02 02 02 02 02 00 N2O 25 27 33 36 36 36 37 01 SF6 79 64 48 47 45 43 46 01
10245 11624 12422 11803 12269 12156 175 Residential 9540 Direct Emissions 3459 3676 3867 3707 3349 3562 3593 52
CO2 3391 3533 3712 3584 3221 3417 3427 49 CH4 44 40 34 34 31 34 37 01 N2O 21 22 21 24 23 25 25 00 HFCs 03 81 101 65 75 86 103 01
Electricity-Related 6081 6569 7757 8715 8454 8707 8563 123 CO2 5965 6467 7670 8625 8368 8622 8477 122 CH4 02 02 02 03 03 03 03 00 N2O 28 30 34 38 37 38 37 01 SF6 87 71 50 50 47 45 47 01
Agriculture 4642 4971 5187 5235 5425 5505 5316 76 Direct Emissions 4332 4608 4853 4941 5151 5180 5041 72
CO2 392 447 476 557 578 578 540 08 CH4 1729 1903 1982 1967 2099 2143 2061 30 N2O 2212 2258 2396 2417 2474 2459 2440 35
Electricity-Related 310 364 333 294 274 325 275 04 CO2 304 358 330 291 271 322 272 04 CH4 + + + + + + + 00 N2O 01 02 01 01 01 01 01 00 SF6 04 04 02 02 02 02 01 00
US Territories 337 407 469 589 600 578 499 07 Total 61268 64888 70445 71332 70599 71681 69568 1000 Note Emissions from electricity generation are allocated based on aggregate electricity consumption in each end-use sector Totals may not sum due to independent rounding + Does not exceed 005 Tg CO2 Eq or 005 percent a Percent of total emissions for year 2008 b Includes primarily HFC-134a
Industry The industrial end-use sector includes CO2 emissions from fossil fuel combustion from all manufacturing facilities in aggregate This sector also includes emissions that are produced as a by-product of the non-energy-related industrial process activities The variety of activities producing these non-energy-related emissions to name a few includes fugitive CH4 emissions from coal mining by-product CO2 emissions from cement manufacture and HFC PFC and SF6 by-product emissions from semiconductor manufacture Overall direct industry sector emissions have declined since 1990 while electricity-related emissions have risen In theory emissions from the industrial end-use sector should be highly correlated with economic growth and industrial output but heating of industrial buildings and agricultural energy consumption are also affected by weather conditions In addition structural changes within the US economy that lead to shifts in industrial output away from energy-intensive manufacturing products to less energy-intensive products (eg from steel to computer equipment) also have a significant affect on industrial emissions
2-20 Inventory of US Greenhouse Gas Emissions and Sinks 1990ndash2008
Transportation When electricity-related emissions are distributed to economic end-use sectors transportation activities accounted for 27 percent of US greenhouse gas emissions in 2008 The largest sources of transportation GHGs in 2008 were passenger cars (33 percent) light duty trucks which include sport utility vehicles pickup trucks and minivans (29 percent) freight trucks (21 percent) and commercial aircraft (7 percent) These figures include direct emissions from fossil fuel combustion as well as HFC emissions from mobile air conditioners and refrigerated transport allocated to these vehicle types Table 2-15 provides a detailed summary of greenhouse gas emissions from transportation-related activities with electricity-related emissions included in the totals
From 1990 to 2008 transportation emissions rose by 22 percent due in large part to increased demand for travel and the stagnation of fuel efficiency across the US vehicle fleet The number of vehicle miles traveled by light-duty motor vehicles (passenger cars and light-duty trucks) increased 37 percent from 1990 to 2008 as a result of a confluence of factors including population growth economic growth urban sprawl and low fuel prices over much of this period A similar set of social and economic trends has led to a significant increase in air travel and freight transportation by both air and road modes during the time series
Although average fuel economy over this period increased slightly due primarily to the retirement of older vehicles average fuel economy among new vehicles sold annually gradually declined from 1990 to 2004 The decline in new vehicle fuel economy between 1990 and 2004 reflected the increasing market share of light duty trucks which grew from about one-fifth of new vehicle sales in the 1970s to slightly over half of the market by 2004 Increasing fuel prices have since decreased the momentum of light duty truck sales and average new vehicle fuel economy has improved since 2005 as the market share of passenger cars increased VMT growth among all passenger vehicles has also been impacted remaining stagnant from 2004 to 2007 compared to an average annual growth rate of 25 percent over the period 1990 to 2004 The recession supplemented the effect of increasing fuel prices in 2008 and VMT declined by 21 percent the first decrease in annual passenger vehicle VMT since 1990
Almost all of the energy consumed for transportation was supplied by petroleum-based products with more than half being related to gasoline consumption in automobiles and other highway vehicles Other fuel uses especially diesel fuel for freight trucks and jet fuel for aircraft accounted for the remainder The primary driver of transportation-related emissions was CO2 from fossil fuel combustion which increased by 20 percent from 1990 to 2008 This rise in CO2 emissions combined with an increase in HFCs from virtually no emissions in 1990 to 649 Tg CO2 Eq in 2008 led to an increase in overall emissions from transportation activities of 22 percent
Table 2-15 Transportation-Related Greenhouse Gas Emissions (Tg CO2 Eq) GasVehicle Type 1990 2005 2006 2007 2008 Passenger Cars 6573
2000 1995 6459 6952 7093 6826 6716 6321
CO2 6292 6067 6441 6620 6388 6324 5975 CH4 26 21 16 11 10 09 08 N2O 254 269 252 178 157 138 117 HFCs + 101 243 284 271 246 221
Light-Duty Trucks 3365 4365 5120 5510 5636 5699 5524 CO2 3210 4064 4669 5056 5192 5280 5137 CH4 14 14 11 07 07 06 06 N2O 141 221 224 137 126 112 95 HFCs + 65 217 310 312 301 286
Medium- and Heavy-Duty Trucks 2311 2777 3545 4083 4186 4252 4012 CO2 2301 2748 3458 3960 4060 4125 3886 CH4 02 02 01 01 01 01 01 N2O 08 10 12 11 11 11 10 HFCs + 17 74 111 114 115 116
Buses 84 92 112 120 123 125 121 CO2 84 92 111 118 120 121 117 CH4 + + + + + + + N2O + + + + + + + HFCs + + 01 02 03 03 04
Motorcycles 18 18 19 17 19 21 22
Trends in Greenhouse Gas Emissions 2-21
CO2 17 16 19 21 21 CH4 + +
18 18 + + + + +
N2O + + + + + + + Commercial Aircrafta 1368 1431 1709 1628 1385 1395 1234
CO2 1354 1416 1692 1612 1371 1381 1222 CH4 01 01 01 01 01 01 01 N2O 13 14 16 15 13 13 12
323 335 351 343 337 337 Other Aircraftb 444CO2 439 320 331 347 340 334 333 CH4 01 01 01 01 01 01 01 N2O 04 03 03 03 03 03 03
Ships and Boatsc 451 586 613 452 484 552 387 CO2 445 577 602 445 477 544 381 CH4 + + + + + + + N2O 06 08 09 06 07 08 05 HFCs + + 01 + + + +
Rail 390 437 480 530 551 543 506 CO2 385 427 456 503 524 516 479 CH4 01 01 01 01 01 01 01 N2O 03 03 03 04 04 04 04 HFCs + 05 20 22 22 22 23 Other Emissions from
Electricity Generationd 01 01 + 01 01 01 01 Pipelinese 360 382 352 323 323 343 349
CO2 360 382 352 323 323 343 349 113 121 102 99 102 95 Lubricants 118
CO2 118 113 121 102 99 102 95 Total Transportation 15482 20209 19976 20086 18908 19358 16983 International Bunker Fuelsf 1130 1009 995 1117 1305 1284 1366
Note Totals may not sum due to independent rounding Passenger cars and light-duty trucks include vehicles typically used for personal travel and less than 8500 lbs medium- and heavy-duty trucks include vehicles larger than 8500 lbs HFC emissions primarily reflect HFC-134a + Does not exceed 005 Tg CO2 Eq a Consists of emissions from jet fuel consumed by domestic operations of commercial aircraft (no bunkers) b Consists of emissions from jet fuel and aviation gasoline consumption by general aviation and military aircraft c Fluctuations in emission estimates are associated with fluctuations in reported fuel consumption and may reflect data collection problemsd Other emissions from electricity generation are a result of waste incineration (as the majority of municipal solid waste is combusted in ldquotrash-to-steamrdquo electricity generation plants) electrical transmission and distribution and a portion of limestone and dolomite use (from pollution control equipment installed in electricity generation plants) e CO2 estimates reflect natural gas used to power pipelines but not electricity While the operation of pipelines produces CH4 and N2O these emissions are not directly attributed to pipelines in the US Inventory f Emissions from International Bunker Fuels include emissions from both civilian and military activities these emissions are not included in the transportation totals
Commercial The commercial sector is heavily reliant on electricity for meeting energy needs with electricity consumption for lighting heating air conditioning and operating appliances The remaining emissions were largely due to the direct consumption of natural gas and petroleum products primarily for heating and cooking needs Energy-related emissions from the residential and commercial sectors have generally been increasing since 1990 and are often correlated with short-term fluctuations in energy consumption caused by weather conditions rather than prevailing economic conditions Landfills and wastewater treatment are included in this sector with landfill emissions decreasing since 1990 while wastewater treatment emissions have increased slightly
2-22 Inventory of US Greenhouse Gas Emissions and Sinks 1990ndash2008
Residential The residential sector is heavily reliant on electricity for meeting energy needs with electricity consumption for lighting heating air conditioning and operating appliances The remaining emissions were largely due to the direct consumption of natural gas and petroleum products primarily for heating and cooking needs Emissions from the residential sectors have generally been increasing since 1990 and are often correlated with short-term fluctuations in energy consumption caused by weather conditions rather than prevailing economic conditions In the long-term this sector is also affected by population growth regional migration trends and changes in housing and building attributes (eg size and insulation)
Agriculture The agricultural sector includes a variety of processes including enteric fermentation in domestic livestock livestock manure management and agricultural soil management In 2008 enteric fermentation was the largest source of CH4 emissions in the United States and agricultural soil management was the largest source of N2O emissions in the United States This sector also includes small amounts of CO2 emissions from fossil fuel combustion by motorized farm equipment like tractors
Electricity Generation The process of generating electricity for consumption in the above sectors is the single largest source of greenhouse gas emissions in the United States representing 35 percent of total US emissions Electricity generation also accounted for the largest share of CO2 emissions from fossil fuel combustion approximately 42 percent in 2008 Electricity was consumed primarily in the residential commercial and industrial end-use sectors for lighting heating electric motors appliances electronics and air conditioning
[BEGIN BOX]
Box 2-1 Methodology for Aggregating Emissions by Economic Sector
In presenting the Economic Sectors in the annual Inventory of US Greenhouse Gas Emissions and Sinks the Inventory expands upon the standard IPCC sectors common for UNFCCC reporting Discussing greenhouse gas emissions relevant to US-specific sectors improves communication of the reportrsquos findings
In the Electricity Generation economic sector CO2 emissions from the combustion of fossil fuels included in the EIA electric utility fuel consuming sector are apportioned to this economic sector Stationary combustion emissions of CH4 and N2O are also based on the EIA electric utility sector Additional sources include CO2 CH4 and N2O from waste incineration as the majority of municipal solid waste is combusted in ldquotrash-to-steamrdquo electricity generation plants The Electricity Generation economic sector also includes SF6 from Electrical Transmission and Distribution and a portion of CO2 from Limestone and Dolomite Use (from pollution control equipment installed in electricity generation plants)
In the Transportation economic sector the CO2 emissions from the combustion of fossil fuels included in the EIA transportation fuel consuming sector are apportioned to this economic sector (additional analyses and refinement of the EIA data is further explained in the Energy chapter of this report) Additional emissions are apportioned from the CH4 and N2O from Mobile Combustion based on the EIA transportation sector Substitutes of Ozone Depleting Substitutes are apportioned based on their specific end-uses within the source category with emissions from transportation refrigerationair-conditioning systems to this economic sector Finally CO2 emissions from Non-Energy Uses of Fossil Fuels identified as lubricants for transportation vehicles are included in the Transportation economic sector
For the Industry economic sector the CO2 emissions from the combustion of fossil fuels included in the EIA industrial fuel consuming sector minus the agricultural use of fuel explained below are apportioned to this economic sector Stationary and mobile combustion emissions of CH4 and N2O are also based on the EIA industrial sector minus emissions apportioned to the Agriculture economic sector described below Substitutes of Ozone
Trends in Greenhouse Gas Emissions 2-23
Depleting Substitutes are apportioned based on their specific end-uses within the source category with most emissions falling within the Industry economic sector (minus emissions from the other economic sectors) Additionally all process-related emissions from sources with methods considered within the IPCC Industrial Process guidance have been apportioned to this economic sector This includes the process-related emissions (ie emissions from the actual process to make the material not from fuels to power the plant) from such activities as cement production iron and steel production and metallurgical coke production and Ammonia Production Additionally fugitive emissions from energy production sources such as Natural Gas Systems Coal Mining and Petroleum Systems are included in the Industry economic sector A portion of CO2 from Limestone and Dolomite Use (from pollution control equipment installed in large industrial facilities) are also included in the Industry economic sector Finally all remaining CO2 emissions from Non-Energy Uses of Fossil Fuels are assumed to be industrial in nature (besides the lubricants for transportation vehicles specified above) and are attributed to the Industry economic sector
As agriculture equipment is included in EIArsquos industrial fuel consuming sector surveys additional data is used to extract the fuel used by agricultural equipment to allow for accurate reporting in the Agriculture economic sector from all sources of emissions such as motorized farming equipment Energy consumption estimates are obtained from Department of Agriculture survey data in combination with separate EIA fuel sales reports This supplementary data is used to apportion CO2 emissions from fossil fuel combustion and CH4 and N2O emissions from stationary and mobile combustion (all data is removed from the Industrial economic sector to avoid double-counting) The other emission sources included in this economic sector are intuitive for the agriculture sectors such as N2O emissions from Agricultural Soils CH4 from Enteric Fermentation (ie exhalation from the digestive tracts of domesticated animals) CH4 and N2O from Manure Management CH4 from Rice Cultivation CO2 emissions from liming of agricultural soils and urea application and CH4 and N2O from Forest Fires N2O emissions from the application of fertilizers to tree plantations (termed ldquoforest landrdquo by the IPCC) are also included in the Agriculture economic sector
The Residential economic sector includes the CO2 emissions from the combustion of fossil fuels reported for the EIA residential sector Stationary combustion emissions of CH4 and N2O are also based on the EIA residential fuel consuming sector Substitutes of Ozone Depleting Substitutes are apportioned based on their specific end-uses within the source category with emissions from residential air-conditioning systems to this economic sector N2O emissions from the application of fertilizers to developed land (termed ldquosettlementsrdquo by the IPCC) are also included in the Residential economic sector
The Commercial economic sector includes the CO2 emissions from the combustion of fossil fuels reported in the EIA commercial fuel consuming sector data Stationary combustion emissions of CH4 and N2O are also based on the EIA commercial sector Substitutes of Ozone Depleting Substitutes are apportioned based on their specific end-uses within the source category with emissions from commercial refrigerationair-conditioning systems to this economic sector Public works sources including direct CH4 from Landfills and CH4 and N2O from Wastewater Treatment and Composting are included in this economic sector
[END BOX]
[BEGIN BOX]
Box 2-2 Recent Trends in Various US Greenhouse Gas Emissions-Related Data
Total emissions can be compared to other economic and social indices to highlight changes over time These comparisons include (1) emissions per unit of aggregate energy consumption because energy-related activities are the largest sources of emissions (2) emissions per unit of fossil fuel consumption because almost all energy-related emissions involve the combustion of fossil fuels (3) emissions per unit of electricity consumption because the electric power industrymdashutilities and non-utilities combinedmdashwas the largest source of US greenhouse gas emissions in 2008 (4) emissions per unit of total gross domestic product as a measure of national economic activity or (5) emissions per capita
2-24 Inventory of US Greenhouse Gas Emissions and Sinks 1990ndash2008
Table 2-16 provides data on various statistics related to US greenhouse gas emissions normalized to 1990 as a baseline year Greenhouse gas emissions in the United States have grown at an average annual rate of 07 percent since 1990 This rate is slightly slower than that for total energy consumption and growth in national population since 1990 and much slower than that for either electricity consumption or overall gross domestic product Total US greenhouse gas emissions are growing at a rate similar to that of fossil fuel consumption since 1990 (see Table 2-16)
Table 2-16 Recent Trends in Various US Data (Index 1990 = 100)
2000 Growth
Variable 1990 1995 2005 2006 2007 2008 Ratea
GDPb 100 113 140 157 162 165 166 29 Electricity Consumptionc 100 112 127 134 135 138 136 18 Fossil Fuel Consumptionc 100 107 117 119 117 119 115 08 Energy Consumptionc 100 107 116 119 118 120 118 09 Populationd 100 107 113 118 119 120 121 11 Greenhouse Gas Emissionse 100 106 115 116 115 117 114 07 a Average annual growth rate b Gross Domestic Product in chained 2000 dollars (BEA 2009) c Energy-content-weighted values (EIA 2008) d US Census Bureau (2008) e GWP-weighted values
Figure 2-14 US Greenhouse Gas Emissions Per Capita and Per Dollar of Gross Domestic Product Source BEA (2008) US Census Bureau (2008) and emission estimates in this report
[END BOX]
23 Indirect Greenhouse Gas Emissions (CO NOx NMVOCs and SO2) The reporting requirements of the UNFCCC44 request that information be provided on indirect greenhouse gases which include CO NOx NMVOCs and SO2 These gases do not have a direct global warming effect but indirectly affect terrestrial radiation absorption by influencing the formation and destruction of tropospheric and stratospheric ozone or in the case of SO2 by affecting the absorptive characteristics of the atmosphere Additionally some of these gases may react with other chemical compounds in the atmosphere to form compounds that are greenhouse gases Carbon monoxide is produced when carbon-containing fuels are combusted incompletely Nitrogen oxides (ie NO and NO2) are created by lightning fires fossil fuel combustion and in the stratosphere from N2O NonshyCH4 volatile organic compoundsmdashwhich include hundreds of organic compounds that participate in atmospheric chemical reactions (ie propane butane xylene toluene ethane and many others)mdashare emitted primarily from transportation industrial processes and non-industrial consumption of organic solvents In the United States SO2 is primarily emitted from coal combustion for electric power generation and the metals industry Sulfur-containing compounds emitted into the atmosphere tend to exert a negative radiative forcing (ie cooling) and therefore are discussed separately
One important indirect climate change effect of NMVOCs and NOx is their role as precursors for tropospheric ozone formation They can also alter the atmospheric lifetimes of other greenhouse gases Another example of indirect greenhouse gas formation into greenhouse gases is COrsquos interaction with the hydroxyl radicalmdashthe major atmospheric sink for CH4 emissionsmdashto form CO2 Therefore increased atmospheric concentrations of CO limit the number of hydroxyl molecules (OH) available to destroy CH4
Since 1970 the United States has published estimates of annual emissions of CO NOx NMVOCs and SO2 (EPA
44 See lthttpunfcccintresourcedocscop808pdfgt
Trends in Greenhouse Gas Emissions 2-25
2009)45 which are regulated under the Clean Air Act Table 2-17 shows that fuel combustion accounts for the majority of emissions of these indirect greenhouse gases Industrial processesmdashsuch as the manufacture of chemical and allied products metals processing and industrial uses of solventsmdashare also significant sources of CO NOx and NMVOCs
2005 2006 2007 2008 NOx 21728
Table 2-17 Emissions of NOx CO NMVOCs and SO2 (Gg) GasActivity 1990 1995 2000
21227 19145 15933 15071 14410 13578 Mobile Fossil Fuel Combustion 10862 10536 10199 9012 8488 7965 7441 Stationary Fossil Fuel Combustion 10023 9862 8053 5858 5545 5432 5148 Industrial Processes 591 607 626 569 553 537 520 Oil and Gas Activities 139 100 111 321 319 318 318 Incineration of Waste 82 88 114 129 121 114 106 Agricultural Burning 30 30 37 40 40 38 40 Solvent Use 1 3 3 3 4 4 4 Waste 0 1 2 2 2 2 2 CO 130536 109114 92872 71555 67909 64348 60739 Mobile Fossil Fuel Combustion 119360 97630 83559 62692 58972 55253 51533 Stationary Fossil Fuel Combustion 5000 5383 4340 4649 4695 4744 4792 Industrial Processes 4125 3959 2216 1555 1597 1640 1682 Incineration of Waste 978 1073 1670 1403 1412 1421 1430 Agricultural Burning 766 745 888 930 905 960 970 Oil and Gas Activities 302 316 146 318 319 320 322 Waste 1 2 8 7 7 7 7 Solvent Use 5 5 45 2 2 2 2 NMVOCs 20930 19520 15227 13761 13594 13423 13254 Mobile Fossil Fuel Combustion 10932 8745 7229 6330 6037 5742 5447 Solvent Use 5216 5609 4384 3851 3846 3839 3834 Industrial Processes 2422 2642 1773 1997 1933 1869 1804 Stationary Fossil Fuel Combustion 912 973 1077 716 918 1120 1321 Oil and Gas Activities 554 582 388 510 510 509 509 Incineration of Waste 222 731 257 241 238 234 230 Waste 673 119 114 113 111 109 Agricultural Burning NA NA NA NA NA NA NA SO2 20935 16891 14830 13466 12388 11799 10368 Stationary Fossil Fuel Combustion 18407 14724 12849 11541 10612 10172 8891 Industrial Processes 1307 1117 1031 831 818 807 795 Mobile Fossil Fuel Combustion 793 672 632 889 750 611 472 Oil and Gas Activities 390 335 287 181 182 184 187 Incineration of Waste 38 42 29 24 24 24 23 Waste 0 1 1 1 1 1 1 Solvent Use 0 1 1 0 0 0 0 Agricultural Burning NA NA NA NA NA NA NA Source (EPA 2009) except for estimates from field burning of agricultural residues NA (Not Available) Note Totals may not sum due to independent rounding
[BEGIN BOX]
Box 2-3 Sources and Effects of Sulfur Dioxide
45 NOx and CO emission estimates from field burning of agricultural residues were estimated separately and therefore not taken from EPA (2009)
2-26 Inventory of US Greenhouse Gas Emissions and Sinks 1990ndash2008
Sulfur dioxide (SO2) emitted into the atmosphere through natural and anthropogenic processes affects the earths radiative budget through its photochemical transformation into sulfate aerosols that can (1) scatter radiation from the sun back to space thereby reducing the radiation reaching the earths surface (2) affect cloud formation and (3) affect atmospheric chemical composition (eg by providing surfaces for heterogeneous chemical reactions) The indirect effect of sulfur-derived aerosols on radiative forcing can be considered in two parts The first indirect effect is the aerosolsrsquo tendency to decrease water droplet size and increase water droplet concentration in the atmosphere The second indirect effect is the tendency of the reduction in cloud droplet size to affect precipitation by increasing cloud lifetime and thickness Although still highly uncertain the radiative forcing estimates from both the first and the second indirect effect are believed to be negative as is the combined radiative forcing of the two (IPCC 2001) However because SO2 is short-lived and unevenly distributed in the atmosphere its radiative forcing impacts are highly uncertain
Sulfur dioxide is also a major contributor to the formation of regional haze which can cause significant increases in acute and chronic respiratory diseases Once SO2 is emitted it is chemically transformed in the atmosphere and returns to the earth as the primary source of acid rain Because of these harmful effects the United States has regulated SO2 emissions in the Clean Air Act
Electricity generation is the largest anthropogenic source of SO2 emissions in the United States accounting for 86 percent in 2008 Coal combustion contributes nearly all of those emissions (approximately 92 percent) Sulfur dioxide emissions have decreased in recent years primarily as a result of electric power generators switching from high-sulfur to low-sulfur coal and installing flue gas desulfurization equipment
[END BOX]
Trends in Greenhouse Gas Emissions 2-27
17 1916
12
33
07 06 09
28
06 04
15
05
15
0
1
2
3
4
6127 6089 6192 6312 6413 6489 6704 6753 6795 6856 7044 6924 6967 6994 7095 7133 7060 7168 6957
0
1000
2000
3000
4000
5000
6000
7000
8000
1990 1991 1992 1993 1994 1995 1996 1997 1998 1999 2000 2001 2002 2003 2004 2005 2006 2007 2008
Tg C
O2
Eq
HFCs PFCs amp SF Nitrous Oxide
Methane Carbon Dioxide
6
Tg C
O2
Eq
HFCs PFCs amp SF Nitrous Oxide 6
Methane Carbon Dioxide
8000
6795 6856 7044 6924 6967 6994 7095 7133 7060 7168 6957 6489 6704 6753
64137000 6127 6089 6192 6312
6000
5000
4000
3000
2000
1000
0
1990 1991 1992 1993 1994 1995 1996 1997 1998 1999 2000 2001 2002 2003 2004 2005 2006 2007 2008
Figure 2-1 US Greenhouse Gas Emissions by Gas
4 33 28
3 17 19
16 15 152 12 07 06 09
05
0
-1
06 041
-06 -10
-2 -17
-3 -29
-4
1991 1992 1993 1994 1995 1996 1997 1998 1999 2000 2001 2002 2003 2004 2005 2006 2007 2008
Figure 2-2 Annual Percent Change in US Greenhouse Gas Emissions
10411100 1006969 9339181000 867840 830900 797 729800 669626700 577
Tg C
O2 Eq
600 500 362400 286 300 185 200 65100
0 -100 -38
1991 1992 1993 1994 1995 1996 1997 1998 1999 2000 2001 2002 2003 2004 2005 2006 2007 2008
Figure 2-3 Cumulative Change in Annual US Greenhouse Gas Emissions Relative to 1990
gure 2-4 US Greenhouse Gas Emissions and Sinks by ChapterIPCC Sector
5573
Natur l G S t
Non-Energy Use of Fuels
Fossil Fuel Combustion
(1000)(500)
0 500
1000 1500 2000 2500 3000 3500 4000 4500 5000 5500 6000 6500 7000 7500
1990
1991
1992
1993
1994
1995
1996
1997
1998
1999
2000
2001
2002
2003
2004
2005
2006
2007
2008
Tg C
O2
Eq
Energy
Land Use Land Use Change and Forestry (sinks)
Agriculture
WasteIndustrial ProcessesLULUCF (sources)
Note Relatively smaller amounts of GWP weighted emissions are also emitted from the Solvent and Other Product Use sector
21
-
(1000) (500)
0 500
1000 1500 2000 2500 3000 3500 4000 4500 5000 5500 6000 6500 7000 7500
Tg C
O2
Eq
Energy
Land Use Land-Use Change and Forestry (sinks)
Agriculture
WasteIndustrial Processes LULUCF (sources)
1990
1991
1992
1993
1994
1995
1996
1997
1998
1999
2000
2001
2002
2003
2004
2005
2006
2007
2008
Note Relatively smaller amounts of GWP--weighted emissions are also emitted from the Solvent and Other Product Use sector
Fi
a as ys ems
5573
Natural Gas Systems
Non-Energy Use of Fuels
Fossil Fuel Combustion
Coal Mining
Petroleum Systems
Mobile Combustion
Stationary Combustion
Incineration of Waste
Abandoned Underground Coal Mines
Energy as a Portion of all Emissions
862
0 25 50 75 100 125 150 Tg CO2 Eq
Figure 2-5 2008 Energy Sector Greenhouse Gas Sources
NEU Emissions 5
International
Natural Gas Emissions
NEU Emissions 51
Petroleum Emissions 2320
Balancing Item 3
Coal 90 Territories and unknowns in the reported data sets combined here 47 43
Other 275 NEU = Non-Energy Use NG = Natural Gas
Apparent Consumption
6079
Atmospheric Emissions
5872
Coal 2237
Petroleum 762
Petroleum 1748
NG 215
Natural Gas Liquids Liquefied Refinery Gas amp Other Liquids 151
Natural Gas 1103
Combustion Emissions
2077
Bunkers 135
Non-Energy Use Exports 103
Fossil Fuel Energy Exports 457
Industrial Processes
Coal Emissions
Domestic Fossil Fuel Production
4253
2328
100
Non-Energy Use Carbon Sequestered 210
2082
Fossil Fuel Energy Imports
Non-Energy Consumption Use US Use Imports US Territories The ldquoBalancing Itemrdquo above accounts for the statistical imbalances
Fossil Fuel Non-Energy Note Totals may not sum due to independent rounding
8
NEU Emissions 8
Combustion Emissions
2269
1235
Combustion Emissions 1227
Stock Changes 40
Figure 2-6 2008 US Fossil Carbon Flows (Tg CO2 Eq)
10501193
1518
1818
500
1000
1500
2000
Tg C
O2 Eq
From Direct Fossil Fuel Combustion
From Electricity Consumption
43219
343
819
1785
2363
0
500
1000
1500
2000
2500
US
Ter
ritor
ies
Com
mer
cial
Resi
dent
ial
Indu
stria
l
Tran
spor
tatio
n
Elec
tric
ity
Gen
erat
ion
Tg C
O2 Eq
Petroleum
Coal
Natural Gas
Relative Contribution by Fuel Type
Figure 2-7 2008 CO2 Emissions from Fossil Fuel Combustion by Sector and Fuel Type Note Electricity generation also includes emissions of less than 05 Tg CO 2 Eq from geothermal-based electricity generation
2000 1818 From Direct Fossil Fuel Combustion
1518 1500 From Electricity Consumption
Tg C
O2 Eq
Tg
CO
2 Eq
Terr
itorie
sU
S
1050
Terr
itorie
sU
S Co
mm
erci
alCo
mm
erci
al
Resi
dent
ial
Resi
dent
ial
Indu
stria
l
Indu
stria
l
Tran
spor
tatio
n
Elec
tric
ity
Gen
erat
ion
Tran
spor
tatio
n
23632500 Relative Contribution
by Fuel Type Petroleum 17852000 Coal
1500 Natural Gas
8191000
343500 219
43 0
1193
1000
500
43
0
Figure 2-8 2008 End-Use Sector Emissions from Fossil Fuel Combustion
0 25 50 75 100 125
Silicon Carbide Production and Consumption
Lead Production
Zinc Production
Phosphoric Acid Production
Ferroalloy Production
Carbon Dioxide Consumption
Titanium Dioxide Production
Magnesium Production and Processing
Adipic Acid Production
Soda Ash Production and Consumption
Petrochemical Production
Semiconductor Manufacture
Limestone and Dolomite Use
Aluminum Production
Ammonia Production and Urea Application
Electrical Transmission and Distribution
HCFC-22 Production
Lime Production
Nitric Acid Production
Cement Production
Iron and Steel Production amp Metallurgical Coke Production
Substitution of Ozone Depleting Substances
lt 05
lt 05
Industrial Processes as a Portion of all Emissions
48
lt 05
Substitution of Ozone Depleting Substances
Iron and Steel Production amp Metallurgical Coke Production
Cement Production
Nitric Acid Production
Lime Production
HCFC-22 Production
Electrical Transmission and Distribution
Ammonia Production and Urea Application
Aluminum Production
Limestone and Dolomite Use
Semiconductor Manufacture
Petrochemical Production
Soda Ash Production and Consumption
Adipic Acid Production
Magnesium Production and Processing
Titanium Dioxide Production
Carbon Dioxide Consumption
Ferroalloy Production
Phosphoric Acid Production
Zinc Production lt 05
Lead Production lt 05
Silicon Carbide Production and Consumption lt 05
Industrial Processes as a Portion of all Emissions
48
0 25 50 75 100 125
Tg CO2 Eq
Figure 2-9 2008 Industrial Processes Chapter Greenhouse Gas Sources
216Agricultural Soil Management
Enteric Fermentation
Agriculture as a Portion of all Manure Management Emissions
61 Rice Cultivation
Field Burning of Agricultural Residues
0 50 100 150 Tg CO2 Eq
Figure 2-10 2008 Agriculture Chapter Greenhouse Gas Sources
0 20 40 60 80 100 120 140
Composting
Wastewater Treatment
Landfills
Tg CO2 Eq
23
Waste as a Portion of all Emissions
1000
1500
2000
2500
Tg C
O2
Eq
Transportation
Electric Power Industry
Industry
Agriculture
Composting
Wastewater Treatment
Landfills
23
Waste as a Portion of all Emissions
0 20 40 60 80 100 120 140 Tg CO2 Eq
Figure 2-11 2008 Waste Chapter Greenhouse Gas Sources
Electric Power
0
500
1000
1500
2000
2500
Tg C
O2
Eq
Transportation
Industry
Industry
Residential
Agriculture Commercial
1990
1991
1992
1993
1994
1995
1996
1997
1998
1999
2000
2001
2002
2003
2004
2005
2006
2007
2008
Figure 2-12 Emissions Allocated to Economic Sectors Note Does not include US Territories
0
500
1000
1500
2000
250019
90
1991
1992
1993
1994
1995
1996
1997
1998
1999
2000
2001
2002
2003
2004
2005
2006
2007
2008
Tg C
O2
Eq
Transportation
Industry
Residential (black)
Agriculture
Commercial (gray)
Emissions
Population
Real GDP
90
100
110
120
130
140
150
160
170
dex
(199
0 1
00)
nInde
x (1
990
== 1
00)
Tg C
O2
Eq
1990
1990
1991
1991
1992
1992
1993
1993
1994
1994
1995
1995
1996
1996
Figure 2-13 Emissions with Electricity Distributed to Economic Sectors
Emissions per $GDP
Emissions per capita
Population
Real GDP
60
70
80
90
100
110
120
130
140
150
160
170
1997
1997
1998
0
500
1000
1500
2000
2500
Transportation
Industry
Residential (black)
Agriculture
Commercial (gray)
Figure 2-14 US Greenhouse Gas Emissions Per Capita and Per Dollar of Gross Domestic Product
1998
1999
1999
2000
2000
2001
2001
2002
2003
2004
2005
2006
2007
2008
2002
2003
2004
2005
2006
2007
2008
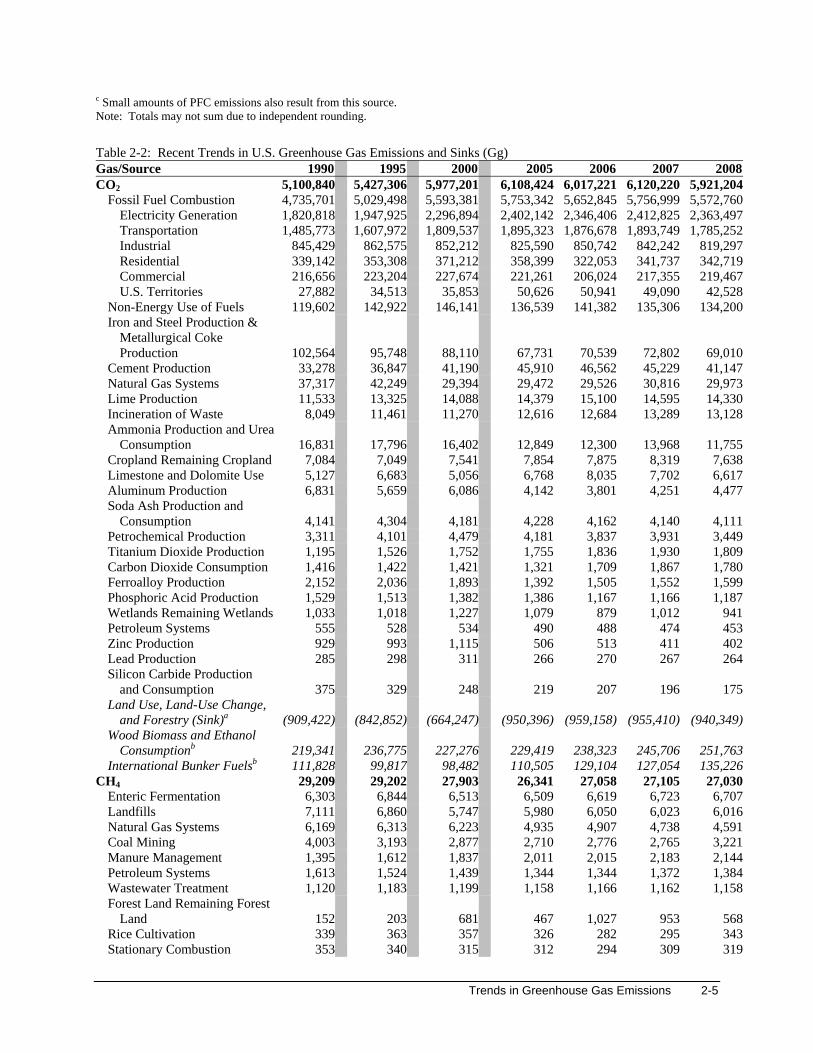

Abandoned Underground Coal Mines
Mobile Combustion CompostingField Burning of Agricultural
ResiduesPetrochemical Production Iron and Steel Production amp
Metallurgical Coke Production
Ferroalloy Production Silicon Carbide Production
and Consumption Incineration of Waste International Bunker Fuelsb
N2OAgricultural Soil Management Mobile Combustion Nitric Acid Production Manure Management Stationary Combustion Forest Land Remaining Forest
Land Wastewater Treatment N2O from Product Uses Adipic Acid Production CompostingSettlements Remaining
SettlementsField Burning of Agricultural
ResiduesIncineration of Waste Wetlands Remaining Wetlands International Bunker Fuelsb
HFCsSubstitution of Ozone
Depleting Substancesc
HCFC-22 Production Semiconductor Manufacture
PFCsAluminum Production Semiconductor Manufacture
SF6Electrical Transmission and
Distribution Magnesium Production and
Processing Semiconductor Manufacture
288 223
15
36 41
46 1
1 + 8
1040 656 142
61 47 41
9 12 14 51 1
3
1 2 + 3
M
M 3 +
M M M 1
1
+ +
392 204
35
35 52
47 1
1 + 6
1105 664 174
68 50 43
12 13 15 57 3
4
1 1 + 3
M
M 3 +
M M M 1
1
+ +
350 160
60
42 59
44 1
1 + 6
1115 678 172
67 54 47
39 14 16 18 4
4
2 1 + 3
M
M 2 +
M M M 1
1
+ +
266 119
75
4451
34+
+ + 7
1059 696 119
575447
271514166
5
2 1 + 3
M
M 1 +
M M M 1
1
+ +
264 269 281 112 105 97
75 79 80
43 46 46 48 48 43
35 33 31 + + +
+ + + + + + 8 7 8
1063 1057 1026 681 681 696 108 98 84
56 66 61 56 56 55 47 47 46
58 54 33 15 16 16 14 14 14 14 12 7 6 6 6
5 5 5
2 2 2 1 1 1 + + + 4 4 4
M M M
M M M 1 1 1 + + +
M M M M M M M M M 1 1 1
1 1 1
+ + + + + +
+ Does not exceed 05 Gg M Mixture of multiple gases a The net CO2 flux total includes both emissions and sequestration and constitutes a sink in the United States Sinks are only included in net emissions total Parentheses indicate negative values or sequestration b Emissions from International Bunker Fuels and Wood Biomass and Ethanol Consumption are not included in totals c Small amounts of PFC emissions also result from this source Note Totals may not sum due to independent rounding
2-6 Inventory of US Greenhouse Gas Emissions and Sinks 1990ndash2008
Emissions of all gases can be summed from each source category from Intergovernmental Panel on Climate Change (IPCC) guidance Over the nineteen-year period of 1990 to 2008 total emissions in the Energy Industrial Processes and Agriculture sectors grew by 7750 Tg CO2 Eq (15 percent) 162 Tg CO2 Eq (5 percent) and 397 Tg CO2 Eq (10 percent) respectively Emissions decreased in the Waste and Solvent and Other Product Use sectors by 181 Tg CO2 Eq (10 percent) and less than 01 Tg CO2 Eq (less than 04 percent) respectively Over the same period estimates of net C sequestration in the Land Use Land-Use Change and Forestry sector increased by 309 Tg CO2 Eq (34 percent)
Figure 2-4 US Greenhouse Gas Emissions and Sinks by ChapterIPCC Sector
71332 70599 71681 69568 70445
The net CO2 flux total includes both emissions and sequestration and constitutes a sink in the United States Sinks are only included in net emissions total Please refer to Table 2-9 for a breakout by source Note Totals may not sum due to independent rounding Note Parentheses indicate negative values or sequestration
64888
Table 2-3 Recent Trends in US Greenhouse Gas Emissions and Sinks by ChapterIPCC Sector (Tg CO2 Eq) ChapterIPCC Sector 1990 1995 2000 2005 2006 2007 2008 Energy 52241 55458 60875 61879 60891 61829 59990 Industrial Processes 3183 3391 3519 3347 3397 3509 3345 Solvent and Other Product Use 44 46 49 44 44 44 44 Agriculture 3878 4077 4109 4197 4172 4230 4275 Land Use Land-Use Change and Forestry (Emissions) 150 172 363 286 498 476 322
Waste 1772 1745 1530 1580 1597 1593 1591 Total Emissions 6268 Net CO2 Flux from Land Use Land-Use Change and Forestry (Sinks) (9094) (8429) (6642) (9504) (9592) (9554) (9403)
Net Emissions (Sources and Sinks) 52173 56460 63802 61828 61007 62127 60164
Energy Energy-related activities primarily fossil fuel combustion accounted for the vast majority of US CO2 emissions for the period of 1990 through 2008 In 2008 approximately 84 percent of the energy consumed in the United States (on a Btu basis) was produced through the combustion of fossil fuels The remaining 16 percent came from other energy sources such as hydropower biomass nuclear wind and solar energy (see Figure 2-5 and Figure 2-6) A discussion of specific trends related to CO2 as well as other greenhouse gas emissions from energy consumption is presented in the Energy chapter Energy-related activities are also responsible for CH4 and N2O emissions (37 percent and 13 percent of total US emissions of each gas respectively) Table 2-4 presents greenhouse gas emissions from the Energy chapter by source and gas
Figure 2-5 2008 Energy Chapter Greenhouse Gas Sources
Figure 2-6 2008 US Fossil Carbon Flows (Tg CO2 Eq)
2005 2006 2007 2008 CO2 49012
2000 Table 2-4 Emissions from Energy (Tg CO2 Eq) GasSource 1990 1995
52267 57807 59325 58369 59369 57505 Fossil Fuel Combustion 47357 50295 55934 57533 56528 57570 55728 Electricity Generation 18208 19479 22969 24021 23464 24128 23635
Trends in Greenhouse Gas Emissions 2-7
Transportation 14858 18953 18767 18937 17853 Industrial 8455
18095 16080 8626 8522 8256 8507 8422 8193
Residential 3391 3533 3712 3584 3221 3417 3427 Commercial 2167 2232 2277 2213 2060 2174 2195
US Territories 279 345 359 506 509 491 425 Non-Energy Use of Fuels 1196 1429 1461 1365 1414 1353 1342 Natural Gas Systems 373 422 294 295 295 308 300 Incineration of Waste 80 115 113 126 127 133 131 Petroleum Systems 06 05 05 05 05 05 05 Wood Biomass and Ethanol Consumption 2193 2368 2273 2294 2383 2457 2518 International Bunker Fuels 1118 998 985 1105 1291 1271 1352
CH4 2656 2513 2387 2034 2036 2007 2078 Natural Gas Systems 1295 1326 1307 1036 1031 995 964 Coal Mining 841 671 604 569 583 581 676 Petroleum Systems 339 320 302 282 282 288 291 Stationary Combustion 74 71 66 66 62 65 67 Abandoned Underground Coal
Mines 60 82 74 56 55 57 59 Mobile Combustion 47 43 34 25 23 22 20 Incineration of Waste + + + + + + + International Bunker Fuels 02 01 01 01 02 02 02
N2O 572 678 681 520 485 453 408 Mobile Combustion 439 540 532 369 336 303 261 Stationary Combustion 128 133 145 147 145 146 142 Incineration of Waste 05 05 04 04 04 04 04 International Bunker Fuels 11 09 09 10 12 12 12
Total 52241 55458 60875 61879 60891 61829 59990 + Does not exceed 005 Tg CO2 Eq These values are presented for informational purposes only and are not included in totals or are already accounted for in other source categories Note Totals may not sum due to independent rounding
CO2 emissions from fossil fuel combustion are presented in Table 2-5 based on the underlying US energy consumer data collected by EIA Estimates of CO2 emissions from fossil fuel combustion are calculated from these EIA ldquoend-use sectorsrdquo based on total consumption and appropriate fuel properties (any additional analysis and refinement of the EIA data is further explained in the Energy chapter of this report) EIArsquos fuel consumption data for the electric power sector comprises electricity-only and combined-heat-and-power (CHP) plants within the NAICS 22 category whose primary business is to sell electricity or electricity and heat to the public (nonutility power producers can be included in this sector as long as they meet they electric power sector definition) EIA statistics for the industrial sector include fossil fuel consumption that occurs in the fields of manufacturing agriculture mining and construction EIArsquos fuel consumption data for the transportation sector consists of all vehicles whose primary purpose is transporting people andor goods from one physical location to another EIArsquos fuel consumption data for the industrial sector consists of all facilities and equipment used for producing processing or assembling goods (EIA includes generators that produce electricity andor useful thermal output primarily to support on-site industrial activities in this sector) EIArsquos fuel consumption data for the residential sector consists of living quarters for private households EIArsquos fuel consumption data for the commercial sector consists of service-providing facilities and equipment from private and public organizations and businesses (EIA includes generators that produce electricity andor useful thermal output primarily to support the activities at commercial establishments in this sector) Table 2-5 Figure 2-7 and Figure 2-8 summarize CO2 emissions from fossil fuel combustion by end-use sector
Table 2-5 CO2 Emissions from Fossil Fuel Combustion by End-Use Sector (Tg CO2 Eq) End-Use Sector 1990 1995 2000 2005 2006 2007 2008 Transportation 14888 16110 18130 19001 18812 18988 17899
Combustion 14858 16080 18095 18953 18767 18937 17853
2-8 Inventory of US Greenhouse Gas Emissions and Sinks 1990ndash2008
Electricity 30 31 34 47 45 50 47 15788 16420 15625 15628 15722 15109 Industrial 15322
Combustion 8454 8626 8522 8256 8507 8422 8193 Electricity 6868 7162 7898 7370 7120 7300 6916
Residential 9322 9951 11336 12151 11529 11979 11845 Combustion 3391 3533 3712 3584 3221 3417 3427 Electricity 5930 6418 7624 8567 8308 8561 8418
8100 9689 10250 10050 10391 10449 Commercial 7546 Combustion 2167 2232 2277 2213 2060 2174 2195 Electricity 5380 5868 7413 8037 7990 8217 8254
US Territoriesa 279 345 359 506 509 491 425 Total 47357 50295 55934 57533 56528 57570 55728 Electricity Generation 18208 19479 22969 24021 23464 24128 23635
Note Totals may not sum due to independent rounding Combustion-related emissions from electricity generation are allocated based on aggregate national electricity consumption by each end-use sector
Figure 2-7 2008 CO2 Emissions from Fossil Fuel Combustion by Sector and Fuel Type
Figure 2-8 2008 End-Use Sector Emissions from Fossil Fuel Combustion
The main driver of emissions in the energy sector is CO2 from fossil fuel combustion The transportation end-use sector accounted for 17899 Tg CO2 Eq in 2008 or approximately 32 percent of total CO2 emissions from fossil fuel combustion the largest share of any end-use sector40 The industrial end-use sector accounted for 27 percent of CO2 emissions from fossil fuel combustion The residential and commercial end-use sectors accounted for an average 21 and 19 percent respectively of CO2 emissions from fossil fuel combustion Both end-use sectors were heavily reliant on electricity for meeting energy needs with electricity consumption for lighting heating air conditioning and operating appliances contributing to about 71 and 79 percent of emissions from the residential and commercial end-use sectors respectively Significant trends in emissions from energy source categories over the nineteen-year period from 1990 through 2008 included the following
bull Total CO2 emissions from fossil fuel combustion increased from 47357 Tg CO2 Eq to 55728 Tg CO2 Eqmdashan 18 percent total increase over the nineteen-year period From 2007 to 2008 these emissions decreased by 1842 Tg CO2 Eq (32 percent)
bull CO2 emissions from non-energy use of fossil fuels have increased 146 Tg CO2 Eq (122 percent) from 1990 through 2008 Emissions from non-energy uses of fossil fuels were 1342 Tg CO2 Eq in 2008 which constituted 23 percent of total national CO2 emissions
bull CH4 emissions from natural gas systems were 964 Tg CO2 Eq in 2008 emissions have declined by 331 Tg CO2 Eq (256 percent) since 1990 This decline has been due to improvements in technology and management practices as well as replacement of old equipment
bull CH4 emissions from coal mining were 676 Tg CO2 Eq In 2008 a decline in emissions of 164 Tg CO2 Eq (195 percent) from 1990 is a result of the mining of less gassy coal from underground mines and the increased use of CH4 collected from degasification systems
bull In 2008 N2O emissions from mobile combustion were 261 Tg CO2 Eq (approximately 82 percent of US N2O emissions) From 1990 to 2008 N2O emissions from mobile combustion decreased by 405 percent However from 1990 to 1998 emissions increased by 26 percent due to control technologies that reduced NOx emissions while increasing N2O emissions Since 1998 newer control technologies have led to a steady decline in N2O from this source
40 Note that electricity generation is the largest emitter of CO2 when electricity is not distributed among end-use sectors
Trends in Greenhouse Gas Emissions 2-9
bull CO2 emissions from incineration of waste (131 Tg CO2 Eq in 2008) increased by 51 Tg CO2 Eq (63 percent) from 1990 through 2008 as the volume of plastics and other fossil carbon-containing materials in municipal solid waste grew
Industrial Processes Greenhouse gas emissions are produced as the by-products of many non-energy-related industrial activities For example industrial processes can chemically transform raw materials which often release waste gases such as CO2 CH4 and N2O These processes include iron and steel production and metallurgical coke production cement production ammonia production and urea consumption lime production limestone and dolomite use (eg flux stone flue gas desulfurization and glass manufacturing) soda ash production and consumption titanium dioxide production phosphoric acid production ferroalloy production CO2 consumption silicon carbide production and consumption aluminum production petrochemical production nitric acid production adipic acid production lead production and zinc production (see Figure 2-9) Industrial processes also release HFCs PFCs and SF6 In addition to their use as ODS substitutes HFCs PFCs SF6 and other fluorinated compounds are employed and emitted by a number of other industrial sources in the United States These industries include aluminum production HCFC-22 production semiconductor manufacture electric power transmission and distribution and magnesium metal production and processing Table 2-6 presents greenhouse gas emissions from industrial processes by source category
Figure 2-9 2008 Industrial Processes Chapter Greenhouse Gas Sources
2005 2006 2007 2008 CO2 1915
2000 Table 2-6 Emissions from Industrial Processes (Tg CO2 Eq) GasSource 1990 1995
1926 1877 1670 1715 1740 1621 Iron and Steel Production and
Metallurgical Coke Production 1026 957 881 677 705 728 690 Iron and Steel Production 971 907 837 639 669 690 637 Metallurgical Coke Production 55 50 44 38 37 38 53
Cement Production 333 368 412 459 466 452 411 Lime Production 115 133 141 144 151 146 143 Ammonia Production amp Urea
Consumption 168 178 164 128 123 140 118 Limestone and Dolomite Use 51 67 51 68 80 77 66 Aluminum Production 68 57 61 41 38 43 45 Soda Ash Production and Consumption 41 43 42 42 42 41 41 Petrochemical Production 33 41 45 42 38 39 34 Titanium Dioxide Production 12 15 18 18 18 19 18 Carbon Dioxide Consumption 14 14 14 13 17 19 18 Ferroalloy Production 22 20 19 14 15 16 16 Phosphoric Acid Production 15 15 14 14 12 12 12 Zinc Production 09 10 11 05 05 04 04 Lead Production 03 03 03 03 03 03 03 Silicon Carbide Production and
Consumption 04 03 02 02 02 02 02 CH4 19 21 22 18 17 17 16
Petrochemical Production 09 11 12 11 10 10 09 Iron and Steel Production and
Metallurgical Coke Production 10 10 09 07 07 07 06 Iron and Steel Production 10 10 09 07 07 07 06 Metallurgical Coke Production + + + + + + + Ferroalloy Production + + + + + + + Silicon Carbide Production and
Consumption + + + + + + +
2-10 Inventory of US Greenhouse Gas Emissions and Sinks 1990ndash2008
N2O 347 386 263 226 215 242 211 Nitric Acid Production 189 210 207 176 172 205 190 Adipic Acid Production 158 176 55 50 43 37 20
HFCs 369 622 1032 1193 1218 1274 1269 Substitution of Ozone Depleting
Substancesa 03 290 743 1032 1077 1101 1130 HCFC-22 Manufacture 364 330 286 158 138 170 136 Semiconductor Manufacturing HFCs 02 03 03 02 03 03 03
PFCs 208 156 135 62 60 75 67 Semiconductor Manufacturing PFCs 22 38 49 32 35 36 40 Aluminum Production 185 118 86 30 25 38 27
SF6 326 279 191 178 170 161 161 Electrical Transmission and Distribution 266 214 150 140 132 127 131 Magnesium Production and Processing 54 56 30 29 29 26 20 Semiconductor Manufacturing SF6 05 09 11 10 10 08 11
Total 3183 3391 3519 3347 3397 3509 3345 + Does not exceed 005 Tg CO2 Eq a Small amounts of PFC emissions also result from this source Note Totals may not sum due to independent rounding
Overall emissions from industrial processes increased by 51 percent from 1990 to 2008 despite decreases in emissions from several industrial processes such as iron and steel production and metallurgical coke production aluminum production HCFC-22 production and electrical transmission and distribution The increase in overall emissions was driven by a rise in the emissions originating from cement manufacture and primarily the emissions from the use of substitutes for ozone depleting substances Significant trends in emissions from industrial processes source categories over the nineteen-year period from 1990 through 2008 included the following
bull HFC emissions from ODS substitutes have been increasing from small amounts in 1990 to 1130 Tg CO2 Eq in 2008 This increase results from efforts to phase out CFCs and other ODSs in the United States In the short term this trend is expected to continue and will likely accelerate over the next decade as HCFCsmdashwhich are interim substitutes in many applicationsmdashare phased out under the provisions of the Copenhagen Amendments to the Montreal Protocol
bull CO2 and CH4 emissions from iron and steel production and metallurgical coke production decreased by 52 percent to 697 Tg CO2 Eq in 2008 and have declined overall by 339 Tg CO2 Eq (327 percent) from 1990 through 2008 due to restructuring of the industry technological improvements and increased scrap utilization
bull PFC emissions from aluminum production decreased by about 85 percent (158 Tg CO2 Eq) from 1990 to 2008 due to both industry emission reduction efforts and lower domestic aluminum production
bull N2O emissions from adipic acid production were 20 Tg CO2 Eq in 2008 and have decreased significantly in recent years from the widespread installation of pollution control measures These emissions from adipic acid production have decreased nearly 87 percent since 1990 and except for slight increases in 2002 and 2003 these declined by 62 percent from 1998 to 2008
bull CO2 emissions from ammonia production and urea application (118 Tg CO2 Eq in 2008) have decreased by 51 Tg CO2 Eq (30 percent) since 1990 due to a decrease in domestic ammonia production This decrease in ammonia production can be attributed to market fluctuations and high natural gas prices
Solvent and Other Product Use Greenhouse gas emissions are produced as a by-product of various solvent and other product uses In the United States N2O Emissions from Product Uses the only source of greenhouse gas emissions from this sector accounted for 44 Tg CO2 Eq or less than 01 percent of total US emissions in 2008 (see Table 2-7)
Table 2-7 N2O Emissions from Solvent and Other Product Use (Tg CO2 Eq) GasSource 1990 1995 2000 2005 2006 2007 2008
Trends in Greenhouse Gas Emissions 2-11
N2O 44 46 49 44 44 44 44 N2O from Product Uses 44 46 49 44 44 44 44
Total 44 46 49 44 44 44 44
In 2008 N2O emissions from product uses constituted slightly more than 1 percent of US N2O emissions From 1990 to 2008 emissions from this source category decreased by less than 05 percent though slight increases occurred in intermediate years
Agriculture Agricultural activities contribute directly to emissions of greenhouse gases through a variety of processes including the following source categories enteric fermentation in domestic livestock livestock manure management rice cultivation agricultural soil management and field burning of agricultural residues
In 2008 agricultural activities were responsible for emissions of 4275 Tg CO2 Eq or 61 percent of total US greenhouse gas emissions CH4 and N2O were the primary greenhouse gases emitted by agricultural activities CH4 emissions from enteric fermentation and manure management represented about 25 percent and 8 percent of total CH4 emissions from anthropogenic activities respectively in 2008 Agricultural soil management activities such as fertilizer application and other cropping practices were the largest source of US N2O emissions in 2008 accounting for almost 68 percent
Figure 2-10 2008 Agriculture Chapter Greenhouse Gas Sources
2005 2006 2007 2008 CH4 1696
2000 Table 2-8 Emissions from Agriculture (Tg CO2 Eq) GasSource 1990 1995
1859 1837 1867 1881 1942 1940 Enteric Fermentation 1324 1437 1368 1367 1390 1412 1408 Manure Management 293 339 386 422 423 459 450 Rice Cultivation 71 76 75 68 59 62 72 Field Burning of
Agricultural Residues 08 07 09 09 09 10 10 N2O 2183 2218 2272 2330 2291 2288 2335
Agricultural Soil Management 2035 2059 2101 2158 2112 2110 2159
Manure Management 144 155 167 166 173 173 171 Field Burning of
Agricultural Residues 04 04 05 05 05 05 05 Total 3878 4077 4109 4197 4172 4230 4275 Note Totals may not sum due to independent rounding
Some significant trends in US emissions from Agriculture include the following
bull Agricultural soils produced approximately 68 percent of N2O emissions in the United States in 2008 Estimated emissions from this source in 2008 were 2159 Tg CO2 Eq Annual N2O emissions from agricultural soils fluctuated between 1990 and 2008 although overall emissions were 61 percent higher in 2008 than in 1990 N2O emissions from this source have not shown any significant long-term trend as their estimation is highly sensitive to the amount of N applied to soils which has not changed significantly over the time-period and to weather patterns and crop type
bull Enteric fermentation was the largest source of CH4 emissions in 2008 at 1408 Tg CO2 Eq Although emissions from enteric fermentation have increased by 64 percent between 1990 and 2008 emissions increased about 9 percent between 1990 and 1995 and decreased about 6 percent from 1995 to 2004 mainly due to decreasing populations of both beef and dairy cattle and improved feed quality for feedlot cattle Emissions increased by 5 percent from 2004 through 2007 as both dairy and beef populations
2-12 Inventory of US Greenhouse Gas Emissions and Sinks 1990ndash2008
increased and the literature for dairy cow diets indicated a trend toward a decrease in feed digestibility Emissions decreased again in 2008 as beef cattle populations decreased again During this timeframe populations of sheep have decreased 48 percent since 1990 while horse populations have increased by almost 87 percent mostly over the last seven years Goat and swine populations have increased 1 percent and 25 percent respectively during this timeframe
bull Overall emissions from manure management increased 42 percent between 1990 and 2008 This encompassed an increase of 54 percent for CH4 from 293 Tg CO2 Eq in 1990 to 450 Tg CO2 Eq in 2008 and an increase of almost 19 percent for N2O from 144 Tg CO2 Eq in 1990 to 171 Tg CO2 Eq in 2008 The majority of this increase was from swine and dairy cow manure since the general trend in manure management is one of increasing use of liquid systems which tends to produce greater CH4 emissions
Land Use Land-Use Change and Forestry When humans alter the terrestrial biosphere through land use changes in land use and land management practices they also alter the background carbon fluxes between biomass soils and the atmosphere Forest management practices tree planting in urban areas the management of agricultural soils and the landfilling of yard trimmings and food scraps have resulted in an uptake (sequestration) of carbon in the United States which offset about 14 percent of total US greenhouse gas emissions in 2008 Forests (including vegetation soils and harvested wood) accounted for approximately 84 percent of total 2008 net CO2 flux urban trees accounted for 10 percent mineral and organic soil carbon stock changes accounted for 5 percent and landfilled yard trimmings and food scraps accounted for 1 percent of the total net flux in 2008 The net forest sequestration is a result of net forest growth increasing forest area and a net accumulation of carbon stocks in harvested wood pools The net sequestration in urban forests is a result of net tree growth and increased urban forest size In agricultural soils mineral and organic soils sequester approximately 59 times as much C as is emitted from these soils through liming and urea fertilization The mineral soil C sequestration is largely due to the conversion of cropland to hay production fields the limited use of bare-summer fallow areas in semi-arid areas and an increase in the adoption of conservation tillage practices The landfilled yard trimmings and food scraps net sequestration is due to the long-term accumulation of yard trimming carbon and food scraps in landfills
Land use land-use change and forestry activities in 2008 resulted in a net C sequestration of 9403 Tg CO2 Eq (2565 Tg C) (Table 2-9) This represents an offset of approximately 16 percent of total US CO2 emissions or 14 percent of total greenhouse gas emissions in 2008 Between 1990 and 2008 total land use land-use change and forestry net C flux resulted in a 34 percent increase in CO2 sequestration
Table 2-9 Net CO2 Flux from Land Use Land-Use Change and Forestry (Tg CO2 Eq) Sink Category 1990 2005 2006 2007 2008 2000 1995 Forest Land Remaining Forest
Land (7298) (6926) (4677) (8066) (8125) (8069) (7919) Cropland Remaining Cropland (294) (229) (302) (183) (191) (197) (181) Land Converted to Cropland 22 29 24 59 59 59 59 Grassland Remaining
Grassland (520) (267) (526) (90) (89) (88) (87) Land Converted to Grassland (198) (223) (273) (246) (245) (243) (242) Settlements Remaining
Settlements (571) (673) (775) (878) (898) (919) (939) Other (Landfilled Yard
Trimmings and Food Scraps) (235) (139) (113) (101) (103) (98) (95) Total (9094) (8429) (6642) (9504) (9592) (9554) (9403) Note Totals may not sum due to independent rounding Parentheses indicate net sequestration
Land use land-use change and forestry source categories also resulted in emissions of CO2 CH4 and N2O that are not included in the net CO2 flux estimates presented in Table 2-10 The application of crushed limestone and dolomite to managed land (ie soil liming) and urea fertilization resulted in CO2 emissions of 76 Tg CO2 Eq in 2008 an increase of about 8 percent relative to 1990 Lands undergoing peat extraction resulted in CO2 emissions of 09 Tg CO2 Eq (941 Gg) and N2O emissions of less than 001 Tg CO2 Eq N2O emissions from the application of synthetic fertilizers to forest soils have increased from 1990 to 04 Tg CO2 Eq in 2008 Settlement soils in 2008
Trends in Greenhouse Gas Emissions 2-13
resulted in direct N2O emissions of 16 Tg CO2 Eq a 61 percent increase relative to 1990 Non-CO2 emissions from forest fires in 2008 resulted in CH4 emissions of 119 Tg CO2 Eq and in N2O emissions of 97 Tg CO2 Eq (Table 2-10)
Table 2-10 Emissions from Land Use Land-Use Change and Forestry (Tg CO2 Eq) Source Category 1990 1995 2000 2005 2006 2007 2008 CO2 81 81 88 89 88 93 86 Cropland Remaining Cropland
Liming of Agricultural Soils 47 44 43 43 42 45 38 Cropland Remaining Cropland
Urea Fertilization 24 27 32 35 37 38 38 Wetlands Remaining Wetlands
Peatlands Remaining Peatlands 10 10 12 11 09 10 09 CH4 32 43 143 98 216 200 119 Forest Land Remaining Forest Land
Forest Fires 32 43 143 98 216 200 119 N2O 37 49 132 98 195 183 117 Forest Land Remaining Forest Land
Forest Fires 26 35 117 80 176 163 97 Forest Land Remaining Forest Land
Forest Soils 01 02 04 04 04 04 04 Settlements Remaining Settlements Settlement Soils 10 12 11 15 15 16 16
Wetlands Remaining Wetlands Peatlands Remaining Peatlands + + + + + + + Total 150 172 363 286 498 476 322 + Less than 005 Tg CO2 Eq Note Totals may not sum due to independent rounding
Other significant trends from 1990 to 2008 in land use land-use change and forestry emissions include
bull Net C sequestration by forest land has increased by almost 9 percent This is primarily due to increased forest management and the effects of previous reforestation The increase in intensive forest management resulted in higher growth rates and higher biomass density The tree planting and conservation efforts of the 1970s and 1980s continue to have a significant impact on sequestration rates Finally the forested area in the United States increased over the past 19 years although only at an average rate of 023 percent per year
bull Net sequestration of C by urban trees has increased by 65 percent over the period from 1990 to 2008 This is primarily due to an increase in urbanized land area in the United States
bull Annual C sequestration in landfilled yard trimmings and food scraps has decreased by 59 percent since 1990 This is due in part to a decrease in the amount of yard trimmings and food scraps generated In addition the proportion of yard trimmings and food scraps landfilled has decreased as there has been a significant rise in the number of municipal composting facilities in the United States
Waste Waste management and treatment activities are sources of greenhouse gas emissions (see Figure 2-11) In 2008 landfills were the second largest source of anthropogenic CH4 emissions accounting for 22 percent of total US CH4 emissions41 Additionally wastewater treatment accounts for 4 percent of US CH4 emissions and 2 percent of N2O emissions Emissions of CH4 and N2O from composting grew from 1990 to 2008 and resulted in emissions of 35 Tg CO2 Eq in 2008 A summary of greenhouse gas emissions from the Waste chapter is presented in Table
41 Landfills also store carbon due to incomplete degradation of organic materials such as wood products and yard trimmings as described in the Land Use Land-Use Change and Forestry chapter
2-14 Inventory of US Greenhouse Gas Emissions and Sinks 1990ndash2008
2-11
Figure 2-11 2008 Waste Chapter Greenhouse Gas Sources
Overall in 2008 waste activities generated emissions of 1591 Tg CO2 Eq or 23 percent of total US greenhouse gas emissions
Table 2-11 Emissions from Waste (Tg CO2 Eq) 2005 2006 2007 2008
CH4 1732 2000 1995 GasSource 1990
1696 1471 1515 1531 1525 1523 Landfills 1493 1441 1207 1256 1271 1265 1263 Wastewater Treatment 235 248 252 243 245 244 243 Composting 03 07 13 16 16 17 17
N2O 40 48 58 65 66 67 68 Wastewater Treatment 37 40 45 47 48 49 49 Composting 04 08 14 17 18 18 18
Total 1772 1745 1530 1580 1597 1593 1591 Note Totals may not sum due to independent rounding
Some significant trends in US emissions from Waste include the following
bull From 1990 to 2008 net CH4 emissions from landfills decreased by 230 Tg CO2 Eq (15 percent) with small increases occurring in interim years This downward trend in overall emissions is the result of increases in the amount of landfill gas collected and combusted42 which has more than offset the additional CH4 emissions resulting from an increase in the amount of municipal solid waste landfilled
bull From 1990 to 2008 CH4 and N2O emissions from wastewater treatment increased by 08 Tg CO2 Eq (35 percent) and 13 Tg CO2 Eq (34 percent) respectively
bull CH4 and N2O emissions from composting each increased by less than 01 Tg CO2 Eq (1 percent) from 2007 to 2008 Emissions from composting have been continually increasing since 1990 from 07 Tg CO2 Eq to 35 Tg CO2 Eq in 2008 an over four-fold increase over the time series
22 Emissions by Economic Sector Throughout this report emission estimates are grouped into six sectors (ie chapters) defined by the IPCC and detailed above Energy Industrial Processes Solvent and Other Product Use Agriculture Land Use Land-Use Change and Forestry and Waste While it is important to use this characterization for consistency with UNFCCC reporting guidelines it is also useful to allocate emissions into more commonly used sectoral categories This section reports emissions by the following US economic sectors residential commercial industry transportation electricity generation and agriculture as well as US territories
Using this categorization emissions from electricity generation accounted for the largest portion (35 percent) of US greenhouse gas emissions in 2008 Transportation activities in aggregate accounted for the second largest portion (27 percent) Emissions from industry accounted for about 19 percent of US greenhouse gas emissions in 2008 In contrast to electricity generation and transportation emissions from industry have in general declined over the past decade The long-term decline in these emissions has been due to structural changes in the US economy (ie shifts from a manufacturing-based to a service-based economy) fuel switching and efficiency improvements The remaining 19 percent of US greenhouse gas emissions were contributed by the residential agriculture and commercial sectors plus emissions from US territories The residential sector accounted for 5 percent and primarily consisted of CO2 emissions from fossil fuel combustion Activities related to agriculture accounted for roughly 7 percent of US emissions unlike other economic sectors agricultural sector emissions were dominated by
42 The CO2 produced from combusted landfill CH4 at landfills is not counted in national inventories as it is considered part of the natural C cycle of decomposition
Trends in Greenhouse Gas Emissions 2-15
N2O emissions from agricultural soil management and CH4 emissions from enteric fermentation rather than CO2 from fossil fuel combustion The commercial sector accounted for roughly 6 percent of emissions while US territories accounted for about 1 percent
CO2 was also emitted and sequestered by a variety of activities related to forest management practices tree planting in urban areas the management of agricultural soils and landfilling of yard trimmings
Table 2-12 presents a detailed breakdown of emissions from each of these economic sectors by source category as they are defined in this report Figure 2-12 shows the trend in emissions by sector from 1990 to 2008
Figure 2-12 Emissions Allocated to Economic Sectors
Table 2-12 US Greenhouse Gas Emissions Allocated to Economic Sectors (Tg CO2 Eq and Percent of Total in 2008)
SectorSource 1990 1995 2000 2005 2006 2007 2008 Percenta
18672 19937 23368 24435 23875 24540 24042 346
18208 19479 22969 24021 23464 24128 23635 340 85 119 117 130 131 137 135 02
266 214 150 140 132 127 131 02 86 91 106 110 108 110 108 02 26 33 25 34 40 39 33 00
15450 16952 19323 20161 19930 20035 18861 271
14858 16080 18095 18953 18767 18937 17853 257
+ 190 557 729 722 688 649 09 474 569 551 376 341 307 264 04 118 113 121 102 99 102 95 01
15066 15313 14691 13509 13802 13742 13424 193
8144 8260 8134 7788 8017 7938 7739 111 1669 1748 1601 1331 1326 1303 1264 18 1020 1256 1231 1183 1226 1166 1175 17
1035 967 890 684 713 735 697 10 841 671 604 569 583 581 676 10 333 368 412 459 466 452 411 06 344 325 307 287 287 293 295 04 189 210 207 176 172 205 190 03 115 133 141 144 151 146 143 02 364 330 286 158 138 170 136 02
168 178 164 128 123 140 118 02 254 175 147 71 63 81 72 01
+ 12 31 52 57 61 66 01
60 82 74 56 55 57 59 01 29 49 62 44 47 47 54 01
Electric Power Industry CO2 from Fossil Fuel
CombustionIncineration of Waste Electrical Transmission and
Distribution Stationary Combustion Limestone and Dolomite Use
TransportationCO2 from Fossil Fuel
CombustionSubstitution of Ozone
Depleting Substances Mobile Combustion Non-Energy Use of Fuels
Industry CO2 from Fossil Fuel
CombustionNatural Gas Systems Non-Energy Use of Fuels Iron and Steel Production amp
Metallurgical Coke Production
Coal Mining Cement Production Petroleum Systems Nitric Acid Production HCFC-22 Production Lime Production Ammonia Production and Urea
ConsumptionAluminum Production Substitution of Ozone
Depleting Substances Abandoned Underground Coal
Mines Semiconductor Manufacture
2-16 Inventory of US Greenhouse Gas Emissions and Sinks 1990ndash2008
N2O from Product Uses Petrochemical Production Soda Ash Production and
ConsumptionStationary Combustion Limestone and Dolomite Use Magnesium Production and
Processing Adipic Acid Production Titanium Dioxide Production Carbon Dioxide Consumption Ferroalloy Production Mobile Combustion Phosphoric Acid Production Zinc Production Lead Production Silicon Carbide Production and
ConsumptionAgriculture
N2O from Agricultural Soil Management
Enteric Fermentation Manure Management CO2 from Fossil Fuel
CombustionCH4 and N2O from Forest
FiresRice Cultivation Liming of Agricultural Soils Urea Fertilization Field Burning of Agricultural
ResiduesCO2 and N2O from Managed
PeatlandsMobile Combustion N2O from Forest Soils Stationary Combustion
CommercialCO2 from Fossil Fuel
CombustionLandfills Substitution of Ozone
Depleting Substances Wastewater Treatment Human Sewage CompostingStationary Combustion
ResidentialCO2 from Fossil Fuel
CombustionSubstitution of Ozone
Depleting Substances
44 42
41 47 26
158 54 12 14 22 09150903
04 4332
2035 1324
437
3104
58 714724
12
10 0301
+ 3951
2167 1493
+ 235 37
07 12
3459
3391
03
46 52
43 49 33
176 56 15 14 20 10 15 10 03
03 4608
2059 1437 493
3660
77 76 44 27
11
10 04 02
+ 3996
2232 1441
07 248 40 15 13 3676
3533
81
49 57
42 48 25
55 30 18 14 19 11 14 11 03
03 4853
2101 1368 552
3879
260 75 43 32
14
12 04 04
+ 3873
2277 1207
55 252 45 26 12 3867
3712
101
44 53
42 44 34
50 29 18 13 14 13 14 05 03
02 4941
2158 1367 589
4681
178 68 43 35
15
11 05 04
+ 3990
2213 1256
185 243 47 33 12 3707
3584
65
44 48
42 46 40
43 29 18 17 15 13 12 05 03
02 5151
2112 1390
596
4904
39259 42 37
14
09 05 04
+ 3892
2060 1271
224 245
48 33 11
3349
3221
75
44 44 01 49 44 01
41 41 01 45 41 01 39 33 00
37 20 00 26 20 00 19 18 00 19 18 00 16 16 00 13 13 00 12 12 00 04 04 00 03 03 00
02 02 00 5180 5041 72
2110 2159 31 1412 1408 20
632 621 09
4844 4544 07
363 217 03 62 72 01 45 38 01 38 38 01
15 15 00
10 09 00 05 05 00 04 04 00
+ + 00 4044 4109 59
2174 2195 32 1265 1263 18
266 311 04 244 243 03
49 49 01 35 35 01 12 12 00
3562 3593 52
3417 3427 49
86 103 01
Trends in Greenhouse Gas Emissions 2-17
Stationary Combustion 55 50 43 43 39 42 46 01 Settlement Soil Fertilization 10 12 11 15 15 16 16 00
US Territories 337 407 469 589 600 578 499 07 CO2 from Fossil Fuel
Combustion 279 345 359 506 509 491 425 06 Non-Energy Use of Fuels 57 60 109 81 89 85 72 01 Stationary Combustion 01 01 01 02 02 02 02 00
Total Emissions 61268 64888 70445 71332 70599 71681 69568 1000 Sinks (9094) (8429) (6642) (9504) (9592) (9554) (9403) -135 CO2 Flux from Forests (7298) (6926) (4677) (8066) (8125) (8069) (7919) -114 Urban Trees (571) (673) (775) (878) (898) (919) (939) -13 CO2 Flux from Agricultural Soil Carbon Stocks (991) (690) (1077) (459) (465) (469) (450) -06 Landfilled Yard Trimmings and Food Scraps (235) (139) (113) (101) (103) (98) (95) -01 Net Emissions 52173 56460 63802 61828 61007 62127 60164 865
Note Includes all emissions of CO2 CH4 N2O HFCs PFCs and SF6 Parentheses indicate negative values or sequestration Totals may not sum due to independent rounding ODS (Ozone Depleting Substances) + Does not exceed 005 Tg CO2 Eq or 005 percent a Percent of total emissions for year 2008
Emissions with Electricity Distributed to Economic Sectors It can also be useful to view greenhouse gas emissions from economic sectors with emissions related to electricity generation distributed into end-use categories (ie emissions from electricity generation are allocated to the economic sectors in which the electricity is consumed) The generation transmission and distribution of electricity which is the largest economic sector in the United States accounted for 35 percent of total US greenhouse gas emissions in 2008 Emissions increased by 30 percent since 1990 as electricity demand grew and fossil fuels remained the dominant energy source for generation Electricity generation-related emissions decreased from 2007 to 2008 by 2 percent primarily due to decreased CO2 emissions from fossil fuel combustion The electricity generation sector in the United States is composed of traditional electric utilities as well as other entities such as power marketers and non-utility power producers The majority of electricity generated by these entities was through the combustion of coal in boilers to produce high-pressure steam that is passed through a turbine Table 2-13 provides a detailed summary of emissions from electricity generation-related activities
Table 2-13 Electricity Generation-Related Greenhouse Gas Emissions (Tg CO2 Eq) GasFuel Type or Source 1990 1995 2000 2005 2006 2007 2008 CO2 18314 19627 23107 24181 23631 24300 23799 CO2 from Fossil Fuel Combustion 18208 19479 22969 24021 23464 24128 23635 Coal 15476 16607 19274 19838 19537 19873 19626 Natural Gas 1753 2281 2808 3188 3380 3713 3616 Petroleum 975 587 884 992 544 539 389 Geothermal 04 03 04 04 04 04 04
Incineration of Waste 80 115 113 126 127 133 131 Limestone and Dolomite Use 26 33 25 34 40 39 33
CH4 06 06 07 07 07 07 07 Stationary Combustion 06 06 07 07 07 07 07 Incineration of Waste + + + + + + + N2O 85 90 104 107 105 106 105 Stationary Combustion 81 86 100 103 101 102 101 Incineration of Waste 05 05 04 04 04 04 04 SF6 266 214 150 140 132 127 131
2-18 Inventory of US Greenhouse Gas Emissions and Sinks 1990ndash2008
Electrical Transmission and Distribution 266 214 150 140 132 127 131
Total 18672 19937 23368 24435 23875 24540 24042 Note Totals may not sum due to independent rounding Includes only stationary combustion emissions related to the generation of electricity + Does not exceed 005 Tg CO2 Eq or 005 percent
To distribute electricity emissions among economic end-use sectors emissions from the source categories assigned to the electricity generation sector were allocated to the residential commercial industry transportation and agriculture economic sectors according to retail sales of electricity (EIA 2009a and Duffield 2006) These three source categories include CO2 from Fossil Fuel Combustion CH4 and N2O from Stationary Combustion and SF6
from Electrical Transmission and Distribution Systems43
When emissions from electricity are distributed among these sectors industry accounts for the largest share of US greenhouse gas emissions (29 percent) followed closely by emissions from transportation activities which account for 27 percent of total emissions Emissions from the residential and commercial sectors also increase substantially when emissions from electricity are included due to their relatively large share of electricity consumption In all sectors except agriculture CO2 accounts for more than 80 percent of greenhouse gas emissions primarily from the combustion of fossil fuels
Table 2-14 presents a detailed breakdown of emissions from each of these economic sectors with emissions from electricity generation distributed to them Figure 2-13 shows the trend in these emissions by sector from 1990 to 2008
Figure 2-13 Emissions with Electricity Distributed to Economic Sectors
Table 2-14 US Greenhouse Gas Emissions by Economic Sector and Gas with Electricity-Related Emissions Distributed (Tg CO2 Eq) and Percent of Total in 2008 SectorGas 1990 2005 2006 2007 2008 Percenta
Industry 21798 2000 1995
22280 22392 20711 20773 20842 20184 290 Direct Emissions 15066 15313 14691 13509 13802 13742 13424 193
CO2 11303 11605 11363 10622 10906 10830 10495 151 CH4 2948 2865 2625 2277 2285 2266 2325 33 N2O 327 354 328 290 288 317 293 04 HFCs PFCs and SF6 488 489 375 319 323 329 311 04
Electricity-Related 6733 6967 7701 7202 6971 7100 6760 97 CO2 6604 6859 7615 7128 6900 7030 6692 96 CH4 02 02 02 02 02 02 02 00 N2O 31 32 34 32 31 31 29 00 SF6 96 75 50 41 39 37 37 01
Transportation 15482 16983 19358 20209 19976 20086 18908 272 Direct Emissions 15450 16952 19323 20161 19930 20035 18861 271
CO2 14976 16193 18216 19055 18866 19040 17948 258 CH4 45 40 31 22 20 19 17 00 N2O 4295 5287 5195 3546 3212 2878 2465 04 HFCsb + 190 557 729 722 688 649 09
Electricity-Related 31 31 35 48 46 51 48 01 CO2 31 31 35 48 46 51 47 01 CH4 + + + + + + + 00 N2O + + + + + + + 00
43 Emissions were not distributed to US territories since the electricity generation sector only includes emissions related to the generation of electricity in the 50 states and the District of Columbia
Trends in Greenhouse Gas Emissions 2-19
SF6 + + + + + 00++ Commercial 9468 10002 11415 12165 12022 12401 12506 180 Direct Emissions 3951 3996 3873 3990 3892 4044 4109 59
CO2 2167 2232 2277 2213 2060 2174 2195 32 CH4 1740 1705 1480 1524 1540 1534 1532 22 N2O 44 52 62 68 69 70 71 01 HFCs + 07 55 185 224 266 311 04
Electricity-Related 5517 6006 7541 8176 8130 8358 8396 121 CO2 5411 5913 7457 8091 8047 8276 8312 119 CH4 02 02 02 02 02 02 02 00 N2O 25 27 33 36 36 36 37 01 SF6 79 64 48 47 45 43 46 01
10245 11624 12422 11803 12269 12156 175 Residential 9540 Direct Emissions 3459 3676 3867 3707 3349 3562 3593 52
CO2 3391 3533 3712 3584 3221 3417 3427 49 CH4 44 40 34 34 31 34 37 01 N2O 21 22 21 24 23 25 25 00 HFCs 03 81 101 65 75 86 103 01
Electricity-Related 6081 6569 7757 8715 8454 8707 8563 123 CO2 5965 6467 7670 8625 8368 8622 8477 122 CH4 02 02 02 03 03 03 03 00 N2O 28 30 34 38 37 38 37 01 SF6 87 71 50 50 47 45 47 01
Agriculture 4642 4971 5187 5235 5425 5505 5316 76 Direct Emissions 4332 4608 4853 4941 5151 5180 5041 72
CO2 392 447 476 557 578 578 540 08 CH4 1729 1903 1982 1967 2099 2143 2061 30 N2O 2212 2258 2396 2417 2474 2459 2440 35
Electricity-Related 310 364 333 294 274 325 275 04 CO2 304 358 330 291 271 322 272 04 CH4 + + + + + + + 00 N2O 01 02 01 01 01 01 01 00 SF6 04 04 02 02 02 02 01 00
US Territories 337 407 469 589 600 578 499 07 Total 61268 64888 70445 71332 70599 71681 69568 1000 Note Emissions from electricity generation are allocated based on aggregate electricity consumption in each end-use sector Totals may not sum due to independent rounding + Does not exceed 005 Tg CO2 Eq or 005 percent a Percent of total emissions for year 2008 b Includes primarily HFC-134a
Industry The industrial end-use sector includes CO2 emissions from fossil fuel combustion from all manufacturing facilities in aggregate This sector also includes emissions that are produced as a by-product of the non-energy-related industrial process activities The variety of activities producing these non-energy-related emissions to name a few includes fugitive CH4 emissions from coal mining by-product CO2 emissions from cement manufacture and HFC PFC and SF6 by-product emissions from semiconductor manufacture Overall direct industry sector emissions have declined since 1990 while electricity-related emissions have risen In theory emissions from the industrial end-use sector should be highly correlated with economic growth and industrial output but heating of industrial buildings and agricultural energy consumption are also affected by weather conditions In addition structural changes within the US economy that lead to shifts in industrial output away from energy-intensive manufacturing products to less energy-intensive products (eg from steel to computer equipment) also have a significant affect on industrial emissions
2-20 Inventory of US Greenhouse Gas Emissions and Sinks 1990ndash2008
Transportation When electricity-related emissions are distributed to economic end-use sectors transportation activities accounted for 27 percent of US greenhouse gas emissions in 2008 The largest sources of transportation GHGs in 2008 were passenger cars (33 percent) light duty trucks which include sport utility vehicles pickup trucks and minivans (29 percent) freight trucks (21 percent) and commercial aircraft (7 percent) These figures include direct emissions from fossil fuel combustion as well as HFC emissions from mobile air conditioners and refrigerated transport allocated to these vehicle types Table 2-15 provides a detailed summary of greenhouse gas emissions from transportation-related activities with electricity-related emissions included in the totals
From 1990 to 2008 transportation emissions rose by 22 percent due in large part to increased demand for travel and the stagnation of fuel efficiency across the US vehicle fleet The number of vehicle miles traveled by light-duty motor vehicles (passenger cars and light-duty trucks) increased 37 percent from 1990 to 2008 as a result of a confluence of factors including population growth economic growth urban sprawl and low fuel prices over much of this period A similar set of social and economic trends has led to a significant increase in air travel and freight transportation by both air and road modes during the time series
Although average fuel economy over this period increased slightly due primarily to the retirement of older vehicles average fuel economy among new vehicles sold annually gradually declined from 1990 to 2004 The decline in new vehicle fuel economy between 1990 and 2004 reflected the increasing market share of light duty trucks which grew from about one-fifth of new vehicle sales in the 1970s to slightly over half of the market by 2004 Increasing fuel prices have since decreased the momentum of light duty truck sales and average new vehicle fuel economy has improved since 2005 as the market share of passenger cars increased VMT growth among all passenger vehicles has also been impacted remaining stagnant from 2004 to 2007 compared to an average annual growth rate of 25 percent over the period 1990 to 2004 The recession supplemented the effect of increasing fuel prices in 2008 and VMT declined by 21 percent the first decrease in annual passenger vehicle VMT since 1990
Almost all of the energy consumed for transportation was supplied by petroleum-based products with more than half being related to gasoline consumption in automobiles and other highway vehicles Other fuel uses especially diesel fuel for freight trucks and jet fuel for aircraft accounted for the remainder The primary driver of transportation-related emissions was CO2 from fossil fuel combustion which increased by 20 percent from 1990 to 2008 This rise in CO2 emissions combined with an increase in HFCs from virtually no emissions in 1990 to 649 Tg CO2 Eq in 2008 led to an increase in overall emissions from transportation activities of 22 percent
Table 2-15 Transportation-Related Greenhouse Gas Emissions (Tg CO2 Eq) GasVehicle Type 1990 2005 2006 2007 2008 Passenger Cars 6573
2000 1995 6459 6952 7093 6826 6716 6321
CO2 6292 6067 6441 6620 6388 6324 5975 CH4 26 21 16 11 10 09 08 N2O 254 269 252 178 157 138 117 HFCs + 101 243 284 271 246 221
Light-Duty Trucks 3365 4365 5120 5510 5636 5699 5524 CO2 3210 4064 4669 5056 5192 5280 5137 CH4 14 14 11 07 07 06 06 N2O 141 221 224 137 126 112 95 HFCs + 65 217 310 312 301 286
Medium- and Heavy-Duty Trucks 2311 2777 3545 4083 4186 4252 4012 CO2 2301 2748 3458 3960 4060 4125 3886 CH4 02 02 01 01 01 01 01 N2O 08 10 12 11 11 11 10 HFCs + 17 74 111 114 115 116
Buses 84 92 112 120 123 125 121 CO2 84 92 111 118 120 121 117 CH4 + + + + + + + N2O + + + + + + + HFCs + + 01 02 03 03 04
Motorcycles 18 18 19 17 19 21 22
Trends in Greenhouse Gas Emissions 2-21
CO2 17 16 19 21 21 CH4 + +
18 18 + + + + +
N2O + + + + + + + Commercial Aircrafta 1368 1431 1709 1628 1385 1395 1234
CO2 1354 1416 1692 1612 1371 1381 1222 CH4 01 01 01 01 01 01 01 N2O 13 14 16 15 13 13 12
323 335 351 343 337 337 Other Aircraftb 444CO2 439 320 331 347 340 334 333 CH4 01 01 01 01 01 01 01 N2O 04 03 03 03 03 03 03
Ships and Boatsc 451 586 613 452 484 552 387 CO2 445 577 602 445 477 544 381 CH4 + + + + + + + N2O 06 08 09 06 07 08 05 HFCs + + 01 + + + +
Rail 390 437 480 530 551 543 506 CO2 385 427 456 503 524 516 479 CH4 01 01 01 01 01 01 01 N2O 03 03 03 04 04 04 04 HFCs + 05 20 22 22 22 23 Other Emissions from
Electricity Generationd 01 01 + 01 01 01 01 Pipelinese 360 382 352 323 323 343 349
CO2 360 382 352 323 323 343 349 113 121 102 99 102 95 Lubricants 118
CO2 118 113 121 102 99 102 95 Total Transportation 15482 20209 19976 20086 18908 19358 16983 International Bunker Fuelsf 1130 1009 995 1117 1305 1284 1366
Note Totals may not sum due to independent rounding Passenger cars and light-duty trucks include vehicles typically used for personal travel and less than 8500 lbs medium- and heavy-duty trucks include vehicles larger than 8500 lbs HFC emissions primarily reflect HFC-134a + Does not exceed 005 Tg CO2 Eq a Consists of emissions from jet fuel consumed by domestic operations of commercial aircraft (no bunkers) b Consists of emissions from jet fuel and aviation gasoline consumption by general aviation and military aircraft c Fluctuations in emission estimates are associated with fluctuations in reported fuel consumption and may reflect data collection problemsd Other emissions from electricity generation are a result of waste incineration (as the majority of municipal solid waste is combusted in ldquotrash-to-steamrdquo electricity generation plants) electrical transmission and distribution and a portion of limestone and dolomite use (from pollution control equipment installed in electricity generation plants) e CO2 estimates reflect natural gas used to power pipelines but not electricity While the operation of pipelines produces CH4 and N2O these emissions are not directly attributed to pipelines in the US Inventory f Emissions from International Bunker Fuels include emissions from both civilian and military activities these emissions are not included in the transportation totals
Commercial The commercial sector is heavily reliant on electricity for meeting energy needs with electricity consumption for lighting heating air conditioning and operating appliances The remaining emissions were largely due to the direct consumption of natural gas and petroleum products primarily for heating and cooking needs Energy-related emissions from the residential and commercial sectors have generally been increasing since 1990 and are often correlated with short-term fluctuations in energy consumption caused by weather conditions rather than prevailing economic conditions Landfills and wastewater treatment are included in this sector with landfill emissions decreasing since 1990 while wastewater treatment emissions have increased slightly
2-22 Inventory of US Greenhouse Gas Emissions and Sinks 1990ndash2008
Residential The residential sector is heavily reliant on electricity for meeting energy needs with electricity consumption for lighting heating air conditioning and operating appliances The remaining emissions were largely due to the direct consumption of natural gas and petroleum products primarily for heating and cooking needs Emissions from the residential sectors have generally been increasing since 1990 and are often correlated with short-term fluctuations in energy consumption caused by weather conditions rather than prevailing economic conditions In the long-term this sector is also affected by population growth regional migration trends and changes in housing and building attributes (eg size and insulation)
Agriculture The agricultural sector includes a variety of processes including enteric fermentation in domestic livestock livestock manure management and agricultural soil management In 2008 enteric fermentation was the largest source of CH4 emissions in the United States and agricultural soil management was the largest source of N2O emissions in the United States This sector also includes small amounts of CO2 emissions from fossil fuel combustion by motorized farm equipment like tractors
Electricity Generation The process of generating electricity for consumption in the above sectors is the single largest source of greenhouse gas emissions in the United States representing 35 percent of total US emissions Electricity generation also accounted for the largest share of CO2 emissions from fossil fuel combustion approximately 42 percent in 2008 Electricity was consumed primarily in the residential commercial and industrial end-use sectors for lighting heating electric motors appliances electronics and air conditioning
[BEGIN BOX]
Box 2-1 Methodology for Aggregating Emissions by Economic Sector
In presenting the Economic Sectors in the annual Inventory of US Greenhouse Gas Emissions and Sinks the Inventory expands upon the standard IPCC sectors common for UNFCCC reporting Discussing greenhouse gas emissions relevant to US-specific sectors improves communication of the reportrsquos findings
In the Electricity Generation economic sector CO2 emissions from the combustion of fossil fuels included in the EIA electric utility fuel consuming sector are apportioned to this economic sector Stationary combustion emissions of CH4 and N2O are also based on the EIA electric utility sector Additional sources include CO2 CH4 and N2O from waste incineration as the majority of municipal solid waste is combusted in ldquotrash-to-steamrdquo electricity generation plants The Electricity Generation economic sector also includes SF6 from Electrical Transmission and Distribution and a portion of CO2 from Limestone and Dolomite Use (from pollution control equipment installed in electricity generation plants)
In the Transportation economic sector the CO2 emissions from the combustion of fossil fuels included in the EIA transportation fuel consuming sector are apportioned to this economic sector (additional analyses and refinement of the EIA data is further explained in the Energy chapter of this report) Additional emissions are apportioned from the CH4 and N2O from Mobile Combustion based on the EIA transportation sector Substitutes of Ozone Depleting Substitutes are apportioned based on their specific end-uses within the source category with emissions from transportation refrigerationair-conditioning systems to this economic sector Finally CO2 emissions from Non-Energy Uses of Fossil Fuels identified as lubricants for transportation vehicles are included in the Transportation economic sector
For the Industry economic sector the CO2 emissions from the combustion of fossil fuels included in the EIA industrial fuel consuming sector minus the agricultural use of fuel explained below are apportioned to this economic sector Stationary and mobile combustion emissions of CH4 and N2O are also based on the EIA industrial sector minus emissions apportioned to the Agriculture economic sector described below Substitutes of Ozone
Trends in Greenhouse Gas Emissions 2-23
Depleting Substitutes are apportioned based on their specific end-uses within the source category with most emissions falling within the Industry economic sector (minus emissions from the other economic sectors) Additionally all process-related emissions from sources with methods considered within the IPCC Industrial Process guidance have been apportioned to this economic sector This includes the process-related emissions (ie emissions from the actual process to make the material not from fuels to power the plant) from such activities as cement production iron and steel production and metallurgical coke production and Ammonia Production Additionally fugitive emissions from energy production sources such as Natural Gas Systems Coal Mining and Petroleum Systems are included in the Industry economic sector A portion of CO2 from Limestone and Dolomite Use (from pollution control equipment installed in large industrial facilities) are also included in the Industry economic sector Finally all remaining CO2 emissions from Non-Energy Uses of Fossil Fuels are assumed to be industrial in nature (besides the lubricants for transportation vehicles specified above) and are attributed to the Industry economic sector
As agriculture equipment is included in EIArsquos industrial fuel consuming sector surveys additional data is used to extract the fuel used by agricultural equipment to allow for accurate reporting in the Agriculture economic sector from all sources of emissions such as motorized farming equipment Energy consumption estimates are obtained from Department of Agriculture survey data in combination with separate EIA fuel sales reports This supplementary data is used to apportion CO2 emissions from fossil fuel combustion and CH4 and N2O emissions from stationary and mobile combustion (all data is removed from the Industrial economic sector to avoid double-counting) The other emission sources included in this economic sector are intuitive for the agriculture sectors such as N2O emissions from Agricultural Soils CH4 from Enteric Fermentation (ie exhalation from the digestive tracts of domesticated animals) CH4 and N2O from Manure Management CH4 from Rice Cultivation CO2 emissions from liming of agricultural soils and urea application and CH4 and N2O from Forest Fires N2O emissions from the application of fertilizers to tree plantations (termed ldquoforest landrdquo by the IPCC) are also included in the Agriculture economic sector
The Residential economic sector includes the CO2 emissions from the combustion of fossil fuels reported for the EIA residential sector Stationary combustion emissions of CH4 and N2O are also based on the EIA residential fuel consuming sector Substitutes of Ozone Depleting Substitutes are apportioned based on their specific end-uses within the source category with emissions from residential air-conditioning systems to this economic sector N2O emissions from the application of fertilizers to developed land (termed ldquosettlementsrdquo by the IPCC) are also included in the Residential economic sector
The Commercial economic sector includes the CO2 emissions from the combustion of fossil fuels reported in the EIA commercial fuel consuming sector data Stationary combustion emissions of CH4 and N2O are also based on the EIA commercial sector Substitutes of Ozone Depleting Substitutes are apportioned based on their specific end-uses within the source category with emissions from commercial refrigerationair-conditioning systems to this economic sector Public works sources including direct CH4 from Landfills and CH4 and N2O from Wastewater Treatment and Composting are included in this economic sector
[END BOX]
[BEGIN BOX]
Box 2-2 Recent Trends in Various US Greenhouse Gas Emissions-Related Data
Total emissions can be compared to other economic and social indices to highlight changes over time These comparisons include (1) emissions per unit of aggregate energy consumption because energy-related activities are the largest sources of emissions (2) emissions per unit of fossil fuel consumption because almost all energy-related emissions involve the combustion of fossil fuels (3) emissions per unit of electricity consumption because the electric power industrymdashutilities and non-utilities combinedmdashwas the largest source of US greenhouse gas emissions in 2008 (4) emissions per unit of total gross domestic product as a measure of national economic activity or (5) emissions per capita
2-24 Inventory of US Greenhouse Gas Emissions and Sinks 1990ndash2008
Table 2-16 provides data on various statistics related to US greenhouse gas emissions normalized to 1990 as a baseline year Greenhouse gas emissions in the United States have grown at an average annual rate of 07 percent since 1990 This rate is slightly slower than that for total energy consumption and growth in national population since 1990 and much slower than that for either electricity consumption or overall gross domestic product Total US greenhouse gas emissions are growing at a rate similar to that of fossil fuel consumption since 1990 (see Table 2-16)
Table 2-16 Recent Trends in Various US Data (Index 1990 = 100)
2000 Growth
Variable 1990 1995 2005 2006 2007 2008 Ratea
GDPb 100 113 140 157 162 165 166 29 Electricity Consumptionc 100 112 127 134 135 138 136 18 Fossil Fuel Consumptionc 100 107 117 119 117 119 115 08 Energy Consumptionc 100 107 116 119 118 120 118 09 Populationd 100 107 113 118 119 120 121 11 Greenhouse Gas Emissionse 100 106 115 116 115 117 114 07 a Average annual growth rate b Gross Domestic Product in chained 2000 dollars (BEA 2009) c Energy-content-weighted values (EIA 2008) d US Census Bureau (2008) e GWP-weighted values
Figure 2-14 US Greenhouse Gas Emissions Per Capita and Per Dollar of Gross Domestic Product Source BEA (2008) US Census Bureau (2008) and emission estimates in this report
[END BOX]
23 Indirect Greenhouse Gas Emissions (CO NOx NMVOCs and SO2) The reporting requirements of the UNFCCC44 request that information be provided on indirect greenhouse gases which include CO NOx NMVOCs and SO2 These gases do not have a direct global warming effect but indirectly affect terrestrial radiation absorption by influencing the formation and destruction of tropospheric and stratospheric ozone or in the case of SO2 by affecting the absorptive characteristics of the atmosphere Additionally some of these gases may react with other chemical compounds in the atmosphere to form compounds that are greenhouse gases Carbon monoxide is produced when carbon-containing fuels are combusted incompletely Nitrogen oxides (ie NO and NO2) are created by lightning fires fossil fuel combustion and in the stratosphere from N2O NonshyCH4 volatile organic compoundsmdashwhich include hundreds of organic compounds that participate in atmospheric chemical reactions (ie propane butane xylene toluene ethane and many others)mdashare emitted primarily from transportation industrial processes and non-industrial consumption of organic solvents In the United States SO2 is primarily emitted from coal combustion for electric power generation and the metals industry Sulfur-containing compounds emitted into the atmosphere tend to exert a negative radiative forcing (ie cooling) and therefore are discussed separately
One important indirect climate change effect of NMVOCs and NOx is their role as precursors for tropospheric ozone formation They can also alter the atmospheric lifetimes of other greenhouse gases Another example of indirect greenhouse gas formation into greenhouse gases is COrsquos interaction with the hydroxyl radicalmdashthe major atmospheric sink for CH4 emissionsmdashto form CO2 Therefore increased atmospheric concentrations of CO limit the number of hydroxyl molecules (OH) available to destroy CH4
Since 1970 the United States has published estimates of annual emissions of CO NOx NMVOCs and SO2 (EPA
44 See lthttpunfcccintresourcedocscop808pdfgt
Trends in Greenhouse Gas Emissions 2-25
2009)45 which are regulated under the Clean Air Act Table 2-17 shows that fuel combustion accounts for the majority of emissions of these indirect greenhouse gases Industrial processesmdashsuch as the manufacture of chemical and allied products metals processing and industrial uses of solventsmdashare also significant sources of CO NOx and NMVOCs
2005 2006 2007 2008 NOx 21728
Table 2-17 Emissions of NOx CO NMVOCs and SO2 (Gg) GasActivity 1990 1995 2000
21227 19145 15933 15071 14410 13578 Mobile Fossil Fuel Combustion 10862 10536 10199 9012 8488 7965 7441 Stationary Fossil Fuel Combustion 10023 9862 8053 5858 5545 5432 5148 Industrial Processes 591 607 626 569 553 537 520 Oil and Gas Activities 139 100 111 321 319 318 318 Incineration of Waste 82 88 114 129 121 114 106 Agricultural Burning 30 30 37 40 40 38 40 Solvent Use 1 3 3 3 4 4 4 Waste 0 1 2 2 2 2 2 CO 130536 109114 92872 71555 67909 64348 60739 Mobile Fossil Fuel Combustion 119360 97630 83559 62692 58972 55253 51533 Stationary Fossil Fuel Combustion 5000 5383 4340 4649 4695 4744 4792 Industrial Processes 4125 3959 2216 1555 1597 1640 1682 Incineration of Waste 978 1073 1670 1403 1412 1421 1430 Agricultural Burning 766 745 888 930 905 960 970 Oil and Gas Activities 302 316 146 318 319 320 322 Waste 1 2 8 7 7 7 7 Solvent Use 5 5 45 2 2 2 2 NMVOCs 20930 19520 15227 13761 13594 13423 13254 Mobile Fossil Fuel Combustion 10932 8745 7229 6330 6037 5742 5447 Solvent Use 5216 5609 4384 3851 3846 3839 3834 Industrial Processes 2422 2642 1773 1997 1933 1869 1804 Stationary Fossil Fuel Combustion 912 973 1077 716 918 1120 1321 Oil and Gas Activities 554 582 388 510 510 509 509 Incineration of Waste 222 731 257 241 238 234 230 Waste 673 119 114 113 111 109 Agricultural Burning NA NA NA NA NA NA NA SO2 20935 16891 14830 13466 12388 11799 10368 Stationary Fossil Fuel Combustion 18407 14724 12849 11541 10612 10172 8891 Industrial Processes 1307 1117 1031 831 818 807 795 Mobile Fossil Fuel Combustion 793 672 632 889 750 611 472 Oil and Gas Activities 390 335 287 181 182 184 187 Incineration of Waste 38 42 29 24 24 24 23 Waste 0 1 1 1 1 1 1 Solvent Use 0 1 1 0 0 0 0 Agricultural Burning NA NA NA NA NA NA NA Source (EPA 2009) except for estimates from field burning of agricultural residues NA (Not Available) Note Totals may not sum due to independent rounding
[BEGIN BOX]
Box 2-3 Sources and Effects of Sulfur Dioxide
45 NOx and CO emission estimates from field burning of agricultural residues were estimated separately and therefore not taken from EPA (2009)
2-26 Inventory of US Greenhouse Gas Emissions and Sinks 1990ndash2008
Sulfur dioxide (SO2) emitted into the atmosphere through natural and anthropogenic processes affects the earths radiative budget through its photochemical transformation into sulfate aerosols that can (1) scatter radiation from the sun back to space thereby reducing the radiation reaching the earths surface (2) affect cloud formation and (3) affect atmospheric chemical composition (eg by providing surfaces for heterogeneous chemical reactions) The indirect effect of sulfur-derived aerosols on radiative forcing can be considered in two parts The first indirect effect is the aerosolsrsquo tendency to decrease water droplet size and increase water droplet concentration in the atmosphere The second indirect effect is the tendency of the reduction in cloud droplet size to affect precipitation by increasing cloud lifetime and thickness Although still highly uncertain the radiative forcing estimates from both the first and the second indirect effect are believed to be negative as is the combined radiative forcing of the two (IPCC 2001) However because SO2 is short-lived and unevenly distributed in the atmosphere its radiative forcing impacts are highly uncertain
Sulfur dioxide is also a major contributor to the formation of regional haze which can cause significant increases in acute and chronic respiratory diseases Once SO2 is emitted it is chemically transformed in the atmosphere and returns to the earth as the primary source of acid rain Because of these harmful effects the United States has regulated SO2 emissions in the Clean Air Act
Electricity generation is the largest anthropogenic source of SO2 emissions in the United States accounting for 86 percent in 2008 Coal combustion contributes nearly all of those emissions (approximately 92 percent) Sulfur dioxide emissions have decreased in recent years primarily as a result of electric power generators switching from high-sulfur to low-sulfur coal and installing flue gas desulfurization equipment
[END BOX]
Trends in Greenhouse Gas Emissions 2-27
17 1916
12
33
07 06 09
28
06 04
15
05
15
0
1
2
3
4
6127 6089 6192 6312 6413 6489 6704 6753 6795 6856 7044 6924 6967 6994 7095 7133 7060 7168 6957
0
1000
2000
3000
4000
5000
6000
7000
8000
1990 1991 1992 1993 1994 1995 1996 1997 1998 1999 2000 2001 2002 2003 2004 2005 2006 2007 2008
Tg C
O2
Eq
HFCs PFCs amp SF Nitrous Oxide
Methane Carbon Dioxide
6
Tg C
O2
Eq
HFCs PFCs amp SF Nitrous Oxide 6
Methane Carbon Dioxide
8000
6795 6856 7044 6924 6967 6994 7095 7133 7060 7168 6957 6489 6704 6753
64137000 6127 6089 6192 6312
6000
5000
4000
3000
2000
1000
0
1990 1991 1992 1993 1994 1995 1996 1997 1998 1999 2000 2001 2002 2003 2004 2005 2006 2007 2008
Figure 2-1 US Greenhouse Gas Emissions by Gas
4 33 28
3 17 19
16 15 152 12 07 06 09
05
0
-1
06 041
-06 -10
-2 -17
-3 -29
-4
1991 1992 1993 1994 1995 1996 1997 1998 1999 2000 2001 2002 2003 2004 2005 2006 2007 2008
Figure 2-2 Annual Percent Change in US Greenhouse Gas Emissions
10411100 1006969 9339181000 867840 830900 797 729800 669626700 577
Tg C
O2 Eq
600 500 362400 286 300 185 200 65100
0 -100 -38
1991 1992 1993 1994 1995 1996 1997 1998 1999 2000 2001 2002 2003 2004 2005 2006 2007 2008
Figure 2-3 Cumulative Change in Annual US Greenhouse Gas Emissions Relative to 1990
gure 2-4 US Greenhouse Gas Emissions and Sinks by ChapterIPCC Sector
5573
Natur l G S t
Non-Energy Use of Fuels
Fossil Fuel Combustion
(1000)(500)
0 500
1000 1500 2000 2500 3000 3500 4000 4500 5000 5500 6000 6500 7000 7500
1990
1991
1992
1993
1994
1995
1996
1997
1998
1999
2000
2001
2002
2003
2004
2005
2006
2007
2008
Tg C
O2
Eq
Energy
Land Use Land Use Change and Forestry (sinks)
Agriculture
WasteIndustrial ProcessesLULUCF (sources)
Note Relatively smaller amounts of GWP weighted emissions are also emitted from the Solvent and Other Product Use sector
21
-
(1000) (500)
0 500
1000 1500 2000 2500 3000 3500 4000 4500 5000 5500 6000 6500 7000 7500
Tg C
O2
Eq
Energy
Land Use Land-Use Change and Forestry (sinks)
Agriculture
WasteIndustrial Processes LULUCF (sources)
1990
1991
1992
1993
1994
1995
1996
1997
1998
1999
2000
2001
2002
2003
2004
2005
2006
2007
2008
Note Relatively smaller amounts of GWP--weighted emissions are also emitted from the Solvent and Other Product Use sector
Fi
a as ys ems
5573
Natural Gas Systems
Non-Energy Use of Fuels
Fossil Fuel Combustion
Coal Mining
Petroleum Systems
Mobile Combustion
Stationary Combustion
Incineration of Waste
Abandoned Underground Coal Mines
Energy as a Portion of all Emissions
862
0 25 50 75 100 125 150 Tg CO2 Eq
Figure 2-5 2008 Energy Sector Greenhouse Gas Sources
NEU Emissions 5
International
Natural Gas Emissions
NEU Emissions 51
Petroleum Emissions 2320
Balancing Item 3
Coal 90 Territories and unknowns in the reported data sets combined here 47 43
Other 275 NEU = Non-Energy Use NG = Natural Gas
Apparent Consumption
6079
Atmospheric Emissions
5872
Coal 2237
Petroleum 762
Petroleum 1748
NG 215
Natural Gas Liquids Liquefied Refinery Gas amp Other Liquids 151
Natural Gas 1103
Combustion Emissions
2077
Bunkers 135
Non-Energy Use Exports 103
Fossil Fuel Energy Exports 457
Industrial Processes
Coal Emissions
Domestic Fossil Fuel Production
4253
2328
100
Non-Energy Use Carbon Sequestered 210
2082
Fossil Fuel Energy Imports
Non-Energy Consumption Use US Use Imports US Territories The ldquoBalancing Itemrdquo above accounts for the statistical imbalances
Fossil Fuel Non-Energy Note Totals may not sum due to independent rounding
8
NEU Emissions 8
Combustion Emissions
2269
1235
Combustion Emissions 1227
Stock Changes 40
Figure 2-6 2008 US Fossil Carbon Flows (Tg CO2 Eq)
10501193
1518
1818
500
1000
1500
2000
Tg C
O2 Eq
From Direct Fossil Fuel Combustion
From Electricity Consumption
43219
343
819
1785
2363
0
500
1000
1500
2000
2500
US
Ter
ritor
ies
Com
mer
cial
Resi
dent
ial
Indu
stria
l
Tran
spor
tatio
n
Elec
tric
ity
Gen
erat
ion
Tg C
O2 Eq
Petroleum
Coal
Natural Gas
Relative Contribution by Fuel Type
Figure 2-7 2008 CO2 Emissions from Fossil Fuel Combustion by Sector and Fuel Type Note Electricity generation also includes emissions of less than 05 Tg CO 2 Eq from geothermal-based electricity generation
2000 1818 From Direct Fossil Fuel Combustion
1518 1500 From Electricity Consumption
Tg C
O2 Eq
Tg
CO
2 Eq
Terr
itorie
sU
S
1050
Terr
itorie
sU
S Co
mm
erci
alCo
mm
erci
al
Resi
dent
ial
Resi
dent
ial
Indu
stria
l
Indu
stria
l
Tran
spor
tatio
n
Elec
tric
ity
Gen
erat
ion
Tran
spor
tatio
n
23632500 Relative Contribution
by Fuel Type Petroleum 17852000 Coal
1500 Natural Gas
8191000
343500 219
43 0
1193
1000
500
43
0
Figure 2-8 2008 End-Use Sector Emissions from Fossil Fuel Combustion
0 25 50 75 100 125
Silicon Carbide Production and Consumption
Lead Production
Zinc Production
Phosphoric Acid Production
Ferroalloy Production
Carbon Dioxide Consumption
Titanium Dioxide Production
Magnesium Production and Processing
Adipic Acid Production
Soda Ash Production and Consumption
Petrochemical Production
Semiconductor Manufacture
Limestone and Dolomite Use
Aluminum Production
Ammonia Production and Urea Application
Electrical Transmission and Distribution
HCFC-22 Production
Lime Production
Nitric Acid Production
Cement Production
Iron and Steel Production amp Metallurgical Coke Production
Substitution of Ozone Depleting Substances
lt 05
lt 05
Industrial Processes as a Portion of all Emissions
48
lt 05
Substitution of Ozone Depleting Substances
Iron and Steel Production amp Metallurgical Coke Production
Cement Production
Nitric Acid Production
Lime Production
HCFC-22 Production
Electrical Transmission and Distribution
Ammonia Production and Urea Application
Aluminum Production
Limestone and Dolomite Use
Semiconductor Manufacture
Petrochemical Production
Soda Ash Production and Consumption
Adipic Acid Production
Magnesium Production and Processing
Titanium Dioxide Production
Carbon Dioxide Consumption
Ferroalloy Production
Phosphoric Acid Production
Zinc Production lt 05
Lead Production lt 05
Silicon Carbide Production and Consumption lt 05
Industrial Processes as a Portion of all Emissions
48
0 25 50 75 100 125
Tg CO2 Eq
Figure 2-9 2008 Industrial Processes Chapter Greenhouse Gas Sources
216Agricultural Soil Management
Enteric Fermentation
Agriculture as a Portion of all Manure Management Emissions
61 Rice Cultivation
Field Burning of Agricultural Residues
0 50 100 150 Tg CO2 Eq
Figure 2-10 2008 Agriculture Chapter Greenhouse Gas Sources
0 20 40 60 80 100 120 140
Composting
Wastewater Treatment
Landfills
Tg CO2 Eq
23
Waste as a Portion of all Emissions
1000
1500
2000
2500
Tg C
O2
Eq
Transportation
Electric Power Industry
Industry
Agriculture
Composting
Wastewater Treatment
Landfills
23
Waste as a Portion of all Emissions
0 20 40 60 80 100 120 140 Tg CO2 Eq
Figure 2-11 2008 Waste Chapter Greenhouse Gas Sources
Electric Power
0
500
1000
1500
2000
2500
Tg C
O2
Eq
Transportation
Industry
Industry
Residential
Agriculture Commercial
1990
1991
1992
1993
1994
1995
1996
1997
1998
1999
2000
2001
2002
2003
2004
2005
2006
2007
2008
Figure 2-12 Emissions Allocated to Economic Sectors Note Does not include US Territories
0
500
1000
1500
2000
250019
90
1991
1992
1993
1994
1995
1996
1997
1998
1999
2000
2001
2002
2003
2004
2005
2006
2007
2008
Tg C
O2
Eq
Transportation
Industry
Residential (black)
Agriculture
Commercial (gray)
Emissions
Population
Real GDP
90
100
110
120
130
140
150
160
170
dex
(199
0 1
00)
nInde
x (1
990
== 1
00)
Tg C
O2
Eq
1990
1990
1991
1991
1992
1992
1993
1993
1994
1994
1995
1995
1996
1996
Figure 2-13 Emissions with Electricity Distributed to Economic Sectors
Emissions per $GDP
Emissions per capita
Population
Real GDP
60
70
80
90
100
110
120
130
140
150
160
170
1997
1997
1998
0
500
1000
1500
2000
2500
Transportation
Industry
Residential (black)
Agriculture
Commercial (gray)
Figure 2-14 US Greenhouse Gas Emissions Per Capita and Per Dollar of Gross Domestic Product
1998
1999
1999
2000
2000
2001
2001
2002
2003
2004
2005
2006
2007
2008
2002
2003
2004
2005
2006
2007
2008
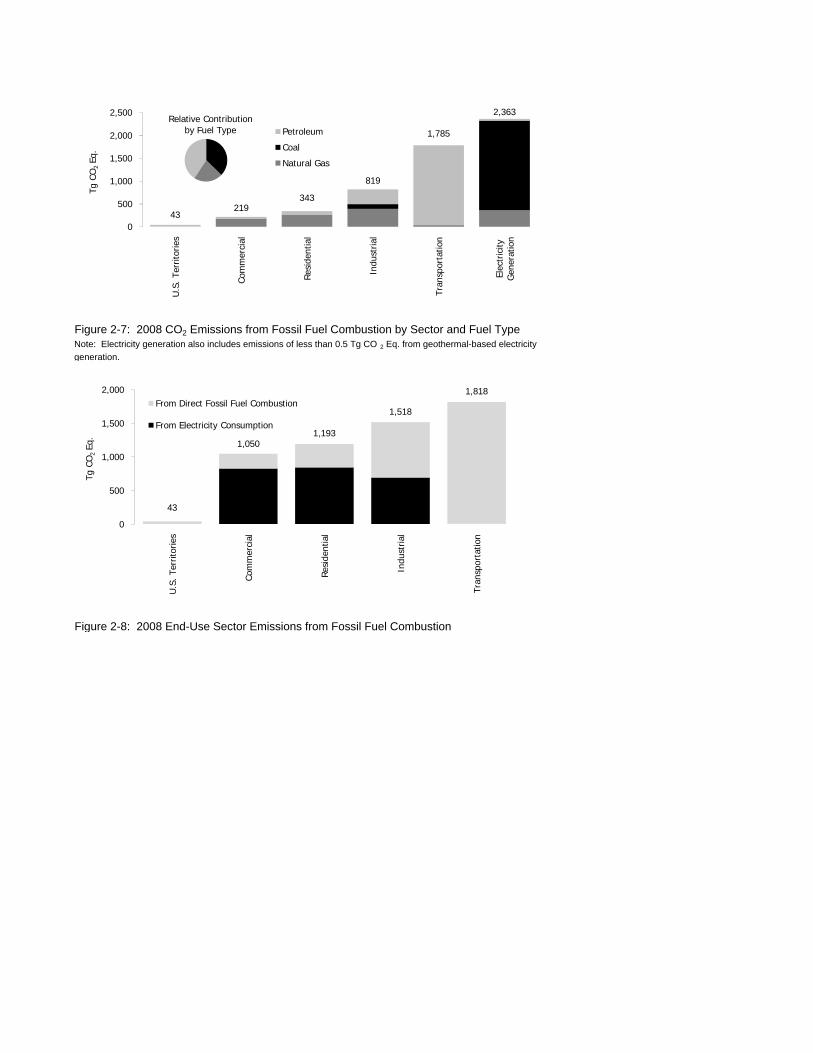
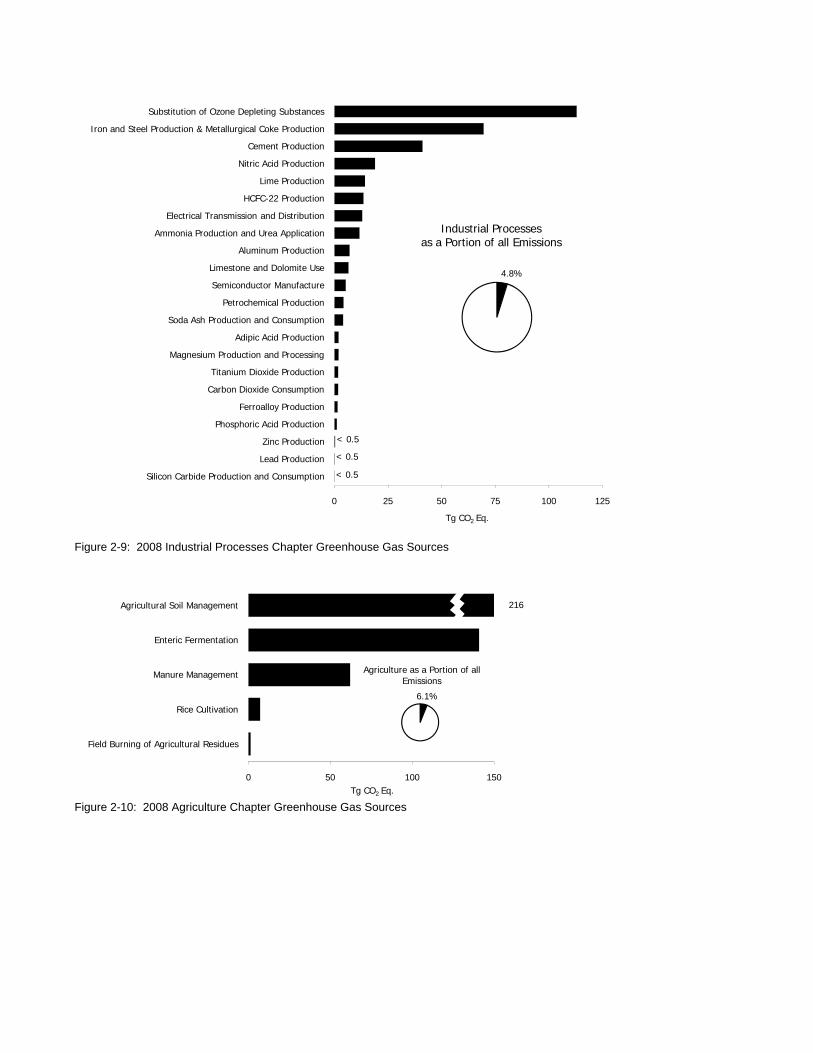
0 25 50 75 100 125
Silicon Carbide Production and Consumption
Lead Production
Zinc Production
Phosphoric Acid Production
Ferroalloy Production
Carbon Dioxide Consumption
Titanium Dioxide Production
Magnesium Production and Processing
Adipic Acid Production
Soda Ash Production and Consumption
Petrochemical Production
Semiconductor Manufacture
Limestone and Dolomite Use
Aluminum Production
Ammonia Production and Urea Application
Electrical Transmission and Distribution
HCFC-22 Production
Lime Production
Nitric Acid Production
Cement Production
Iron and Steel Production amp Metallurgical Coke Production
Substitution of Ozone Depleting Substances
lt 05
lt 05
Industrial Processes as a Portion of all Emissions
48
lt 05
Substitution of Ozone Depleting Substances
Iron and Steel Production amp Metallurgical Coke Production
Cement Production
Nitric Acid Production
Lime Production
HCFC-22 Production
Electrical Transmission and Distribution
Ammonia Production and Urea Application
Aluminum Production
Limestone and Dolomite Use
Semiconductor Manufacture
Petrochemical Production
Soda Ash Production and Consumption
Adipic Acid Production
Magnesium Production and Processing
Titanium Dioxide Production
Carbon Dioxide Consumption
Ferroalloy Production
Phosphoric Acid Production
Zinc Production lt 05
Lead Production lt 05
Silicon Carbide Production and Consumption lt 05
Industrial Processes as a Portion of all Emissions
48
0 25 50 75 100 125
Tg CO2 Eq
Figure 2-9 2008 Industrial Processes Chapter Greenhouse Gas Sources
216Agricultural Soil Management
Enteric Fermentation
Agriculture as a Portion of all Manure Management Emissions
61 Rice Cultivation
Field Burning of Agricultural Residues
0 50 100 150 Tg CO2 Eq
Figure 2-10 2008 Agriculture Chapter Greenhouse Gas Sources
0 20 40 60 80 100 120 140
Composting
Wastewater Treatment
Landfills
Tg CO2 Eq
23
Waste as a Portion of all Emissions
1000
1500
2000
2500
Tg C
O2
Eq
Transportation
Electric Power Industry
Industry
Agriculture
Composting
Wastewater Treatment
Landfills
23
Waste as a Portion of all Emissions
0 20 40 60 80 100 120 140 Tg CO2 Eq
Figure 2-11 2008 Waste Chapter Greenhouse Gas Sources
Electric Power
0
500
1000
1500
2000
2500
Tg C
O2
Eq
Transportation
Industry
Industry
Residential
Agriculture Commercial
1990
1991
1992
1993
1994
1995
1996
1997
1998
1999
2000
2001
2002
2003
2004
2005
2006
2007
2008
Figure 2-12 Emissions Allocated to Economic Sectors Note Does not include US Territories
0
500
1000
1500
2000
250019
90
1991
1992
1993
1994
1995
1996
1997
1998
1999
2000
2001
2002
2003
2004
2005
2006
2007
2008
Tg C
O2
Eq
Transportation
Industry
Residential (black)
Agriculture
Commercial (gray)
Emissions
Population
Real GDP
90
100
110
120
130
140
150
160
170
dex
(199
0 1
00)
nInde
x (1
990
== 1
00)
Tg C
O2
Eq
1990
1990
1991
1991
1992
1992
1993
1993
1994
1994
1995
1995
1996
1996
Figure 2-13 Emissions with Electricity Distributed to Economic Sectors
Emissions per $GDP
Emissions per capita
Population
Real GDP
60
70
80
90
100
110
120
130
140
150
160
170
1997
1997
1998
0
500
1000
1500
2000
2500
Transportation
Industry
Residential (black)
Agriculture
Commercial (gray)
Figure 2-14 US Greenhouse Gas Emissions Per Capita and Per Dollar of Gross Domestic Product
1998
1999
1999
2000
2000
2001
2001
2002
2003
2004
2005
2006
2007
2008
2002
2003
2004
2005
2006
2007
2008
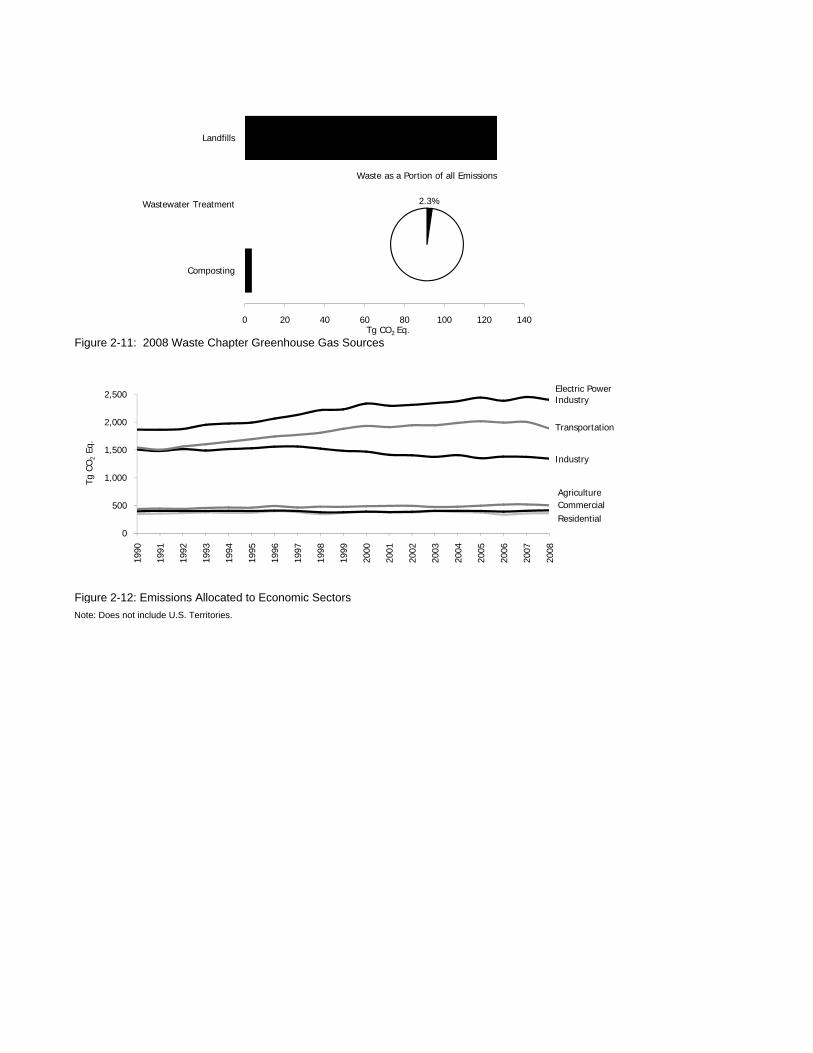

0
500
1000
1500
2000
250019
90
1991
1992
1993
1994
1995
1996
1997
1998
1999
2000
2001
2002
2003
2004
2005
2006
2007
2008
Tg C
O2
Eq
Transportation
Industry
Residential (black)
Agriculture
Commercial (gray)
Emissions
Population
Real GDP
90
100
110
120
130
140
150
160
170
dex
(199
0 1
00)
nInde
x (1
990
== 1
00)
Tg C
O2
Eq
1990
1990
1991
1991
1992
1992
1993
1993
1994
1994
1995
1995
1996
1996
Figure 2-13 Emissions with Electricity Distributed to Economic Sectors
Emissions per $GDP
Emissions per capita
Population
Real GDP
60
70
80
90
100
110
120
130
140
150
160
170
1997
1997
1998
0
500
1000
1500
2000
2500
Transportation
Industry
Residential (black)
Agriculture
Commercial (gray)
Figure 2-14 US Greenhouse Gas Emissions Per Capita and Per Dollar of Gross Domestic Product
1998
1999
1999
2000
2000
2001
2001
2002
2003
2004
2005
2006
2007
2008
2002
2003
2004
2005
2006
2007
2008