$2 trillion danger zone
TRANSCRIPT

CO2
CO2
CO2
CO2
The $2 trillion stranded assets danger zone: How fossil fuel firms risk destroying investor returns
Initiative
arbon Tracker

About Carbon TrackerCarbon Tracker is a team of financial, energy and legal experts with a ground breaking approach to limiting future greenhouse gas emissions. We have the technical knowledge, connections and reach to get inside the mind-set of the global financial community and effect change on a global scale. We are a non-profit, independent think-tank, free from the commercial constraints of mainstream analysts and able to set our own research agenda.
Carbon Tracker produces its research working a number of former financial analysts and advisors, and by subscribing to industry databases giving the latest project economics for oil gas and coal.
Contact
James Leaton Research Director [email protected] twitter: @carbonbubble
Acknowledgements
This paper is a summary which draws on research conducted in partnership with Energy Transition Advisors, ETA. The detailed research papers covering supply, demand and methodology are available on our website. ETA is led by Mark Fulton, who worked with Paul Spedding on the analysis. Andrew Grant, James Leaton, Reid Capalino, Luke Sussams and Margherita Gagliardi contributed from Carbon Tracker.
The underlying analysis in this report prepared by Carbon Tracker & ETA is based on:
Coal supply cost data licensed from the Global Economic Model & India Outlook of Wood Mackenzie Limited. Wood Mackenzie is a global leader in commercial intelligence for the energy metals and mining industries. The analysis represented and the opinions expressed in this report are solely those of Carbon Tracker & ETA. Oil & Gas supply cost data licensed from the U-Cube database of Rystad Energy.
Carbon Tracker would like to acknowledge the input of those who reviewed drat papers: Anthony Hobley, Mark Campanale, Jeremy Leggett, and Nick Robins.
Designed and typeset by Soapbox, www.soapbox.co.uk
© Carbon Tracker Initiative September 2014
Disclaimer
Carbon Tracker is a non-profit company set-up to produce new thinking on climate risk. The organisation is funded by a range of European and American foundations. Carbon Tracker is not an investment adviser, and makes no representation regarding the advisability of investing in any particular company or investment fund or other vehicle. A decision to invest in any such investment fund or other entity should not be made in reliance on any of the statements set forth in this publication. While the organisations have obtained information believed to be reliable, they shall not be liable for any claims or losses of any nature in connection with information contained in this document, including but not limited to, lost profits or punitive or consequential damages. The information used to compile this report has been collected from a number of sources in the public domain and from Carbon Tracker licensors. Some of its content may be proprietary and belong to Carbon Tracker or its licensors. The information contained in this research report does not constitute an offer to sell securities or the solicitation of an offer to buy, or recommendation for investment in, any securities within any jurisdiction. The information is not intended as financial advice. This research report provides general information only. The information and opinions constitute a judgment as at the date indicated and are subject to change without notice. The information may therefore not be accurate or current. The information and opinions contained in this report have been compiled or arrived at from sources believed to be reliable in good faith, but no representation or warranty, express or implied, is made by Carbon Tracker as to their accuracy, completeness or correctness and Carbon Tracker does also not warrant that the information is up to date.

1 | The $2 trillion stranded assets danger zone: How fossil fuel firms risk destroying investor returns
Executive summaryThe low carbon express is coming
The data is clear – the energy transition is underway, and the direction of travel is away from fossil fuels. But not everyone will admit that the train has left the station, let alone that it is travelling faster than people expected and may skip some stations along the way.
Don’t get trapped in the danger zone
There is a clear danger zone above a 2°C scenario where excess capex and CO² emissions need to be avoided. All energy players have the chance to navigate round this by staying within the carbon budget. This will give the world an opportunity to reach the ultimate destination – a world that has prevented dangerous levels of climate change. Our analysis here focuses on the marginal production between the IEA 450 scenario and business as usual for the coal, gas and oil sectors to 2035.
Carbon vs $capex
The table below summarises the overhang of unneeded capex (through 2025) and avoided CO² (through 2035) across the 3 fossil fuels in a 450 Scenario, compared to business as usual indicated in the industry databases. This makes the difference in financial and carbon significance clear. The greater scrutiny required for new projects is also obvious, accounting for 89% of capex and 67% of CO². Over $2trillion of capex needs to be cut in order to avoid around 156GtCO² of emissions – the equivalent of cutting supply and the subsequent emissions by around a quarter in the markets covered in this analysis.
New Existing
Capex ($bn)
Emissions GtCO²
Capex ($bn)
Emissions GtCO²
Oil 1,303 25 124 3
Gas 459 9 73 2
Thermal coal
177 70 42 47
Total 1,939 104 239 52
It is clear that oil represents around two-thirds of the financial risk but a fifth of the carbon risk, whilst coal carries around half of the carbon risk, but only a tenth of the financial risk. Gas is low in terms of the carbon risk, but still carries around a quarter of the financial risk.
No new coal mines needed
Perhaps the most stark conclusion is that just perpetuating the production from some of the existing coal mines is sufficient to meet the volume of coal required under the 450 scenario. It is the end of the road for expansion of the coal sector. Chinese domestic production dominates, and with the data suggesting thermal coal use has already peaked, this will send waves throughout the Pacific market, with potential exporters in Australia and Indonesia now hanging their hopes on India. Our demand analysis explores why this may not be a sure thing, in the context of the structural decline the market consensus sees for seaborne coal. US domestic coal also faces significant headwinds with cheap gas, expanding renewables, and extensive EPA emissions controls.
LNG forming an orderly queue
Gas does not have such a big impact here in terms of determining the climate outcome. Growth is curtailed slightly – especially of capital intensive LNG. This means that the strategies of some companies, especially those operating in the US, Australia, Indonesia, Canada and Malaysia may never come to pass if demand and LNG contracts do not materialise.
Oil facing a culture shock – going ex-growth
The new oil market volatility and uncertainty with OPEC members calling the bluff of the private sector to see who has the marginal production has changed the game. This is seen as an attempt for NOCs to retain market share. This leaves the higher cost US shale oil, Canadian oil sands, Russian conventional oil and Arctic options as traps waiting in the danger zone. It is not Middle East production that is flagged in out 2⁰ stress test, as they have very little exposure to these types of oil production.
Private sector vs state companies
In our window of analysis – looking at production options to 2035 and capex to 2025, the private sector has as much exposure as the state-owned players. More macro numbers considering all reserves and resources without a time limit of potential production will be skewed towards government interests. This simply reflects the fact that all mineral resources are initially held by the state – until they license them to an entity to develop them. The further one looks out, the less of this transfer will have taken place. However it is clear that NOCs and INOCs continue to partner with the private sector to provide technology and capital, and to share the financial risk. It is clear that many of the exposed areas in the danger zone – US shale gas, Canadian oil sands, US coal for example, have very limited state company involvement.
Capital markets exposure
If NOCs and INOCs are simply considered purely state actors then this belies the growing links to capital markets. Coal India has issued equity and even its partial listing makes it a globally significant stock held by global institutional investors. Petrobras issued a 100 year ‘century bonds’ in the debt markets in June 2015, which are already down 15% with the company downgraded to junk status, burning the fingers of western asset managers who participated.

Executive summary | 2
Government mandates
The identification of which countries are likely to have to leave some fossil fuels in the ground under a 2°C scenario raises the question of what strategy governments need to employ. Production will not stop overnight, but planning for the transition is required. The largest economies – China and the US – have made bilateral statements about their efforts to prevent climate change. If either or both of these parties delivers at scale, this will blow the alternatives out of the water. Even resource rich states cannot afford to continue being so dependent on products whose days are numbered, subsidising consumption. Perhaps the new government in Canada offers an alternative with Ministers being given mandates to explicitly pursue clean energy, green infrastructure and prevent climate change. This gives them a chance of forming a decent plan to transition rapidly beyond being a petrostate with stranded assets that the world doesn’t need.
Recommendations:
Do the 2°stress-test
Institutional Investors Derisk you portfolio by
identifying companies which are alignedwith a 2°C demand scenario
Analysts & Advisors Provide sensitivty analysis
of which stocks are more resilientto a 2°C demand scenario
GovernmentsStress test
national resources,infrastructure
and energyplans against
a 2°C demand scenario
Companies Provide information
on the decisionstaken to align
corporate strategywith a 2°C
demand scenario

Introduction | 3
Introduction
Changing times for the global energy sector
In the five years since we started looking at fossil fuel resources in relation to carbon budgets, the world is a very different place:
• Chinese thermal coal demand peaked in 2014;
• The seaborne thermal coal market appears to be in terminal decline;
• US shale gas, renewables and air pollution measures have displaced coal;
• The oil price halved in 6 months in 2014;
• Falling commodity prices have seen operators seeking to cut costs;
• Resource exporting nations have lost receipts and suffered weakened currencies;
• US shale oil has changed the oil market dynamics, with OPEC pursuing market share, rather than holding up prices;
• The KXL pipeline – first proposed in 2008 was rejected by US President Obama in November 2015;
• Utility scale solar PV installations have reduced in cost by 29–65% depending on the region since 2010 according to IRENA;
• The UNFCCC COP is alive and well in the run up to Paris 2015 with INDCs bring the world closer to a 2°C pathway;
• The Bank of England has recognised that not all fossil fuels can be burnt if we are to prevent climate change;
• Citi’s Energy Darwinism II report concluded that action on climate change would be slightly cheaper than a no action scenario;
• Wood Mackenzie identified $200bn of oil and gas capex cancelled in 2015.
CO² vs $capex
With all that in mind we are taking the opportunity to bring together the individual coal, oil and gas cost curves again in the context of a carbon budget. Companies have started responding to the desire for information about how their businesses would fare in a world limited to 2°C of warming. Carbon and financial expenditure are the common currencies across the fossil fuels. Comparing them serves to highlight how the different fuels are exposed to differing degrees in terms of potential carbon emissions and the levels of capital required.
Carbon budget disappearing
A range of organisations have recognised that the total quantum of coal, oil and gas in the world far exceeds any reasonable carbon budget to limit global warming. Coal clearly dominates this data due to its volume and greater unmitigated carbon intensity. Each year we use up some more of that budget, as the level of CO² accumulated in the atmosphere increases. There remains a range of carbon budgets which relate to different probabilities of the climate outcome, and adjustments to the scope and assumptions. However it is clear that the less we emit over the next few decades, the greater the chance the world has of avoiding catastrophic climate change and the related economic impacts.
Direction of travel is clear
Amongst these myriad factors at work, there is a clear direction of travel – the energy transition is underway. The question is how far and how fast will it go. The cost curves for these fossil fuels capture the relationship between supply and demand. It is clear that if the industry misreads future demand by underestimating technology and policy advances, this can lead to an excess of supply, and create stranded assets. This is where shareholders should be concerned – if companies are committing to future production which may never generate the returns expected.

4 | The $2 trillion stranded assets danger zone: How fossil fuel firms risk destroying investor returns
Carbon budgets
Our analysis has always used a carbon budget as a reference point for understanding future demand for fossil fuels. We have completed further demand analysis this year to better understand the range of potential demand levels, (see demand paper and Lost in Transition).
Two degrees or not two degrees
We are taking this opportunity to recap the carbon budget context, and identify the marginal area between a 2°C scenario and business as usual that we focus on here. In the run up to the Paris UNFCCC COP we focus on 2°C as the internationally agreed objective. The INDC’s are indicated to represent bringing emissions down to around a 2.7°C level; meanwhile others push for a 1.5°C target. It is clear that every 0.1°C of warming that can be avoided will count, and that the carbon budget is tight on any of those pathways. As our recent ‘Lost in Transition’ analysis shows, there is only a downside for fossil fuel demand from business as usual.
Reserves and Resources
One conclusion that we see a consensus on is that there is more oil, gas and especially coal in the ground than can be burnt unmitigated if we are to limit anthropogenic global warming to less than 2°C. This has been acknowledged by oil majors, the IEA, and various world leaders. If unconventional resources that are currently not viable are included, then the carbon overhang only increases. Booked reserves are typically based on being economically viable at the previous year’s average price, (as in the methodology for oil reserves for SEC filings). Any adjustments to reserves from a lower oil price will likely only be seen for those assets needing over $50 to break even, when reports are filed in 2016.
Timeframe
One area that is critical is the timeframe being considered. Some carbon budgets run to the end of the century, others only extend to 2040 or 2050, (but may have assumptions about the second half of the century). Similarly there may be enough coal resources to keep producing for the next 100 years, but most companies and analysts are not looking that far ahead, and any future financial value would be discounted out.
Probability of the outcome
Climate models are probabilistic, meaning that they turn a level of cumulative CO² emissions into a likelihood of a specified outcome in terms of global average atmospheric temperature change. For example the higher the amount of carbon emitted, the lower the probability of a particular outcome. Applying a carbon budget which only has a 50% chance of limiting climate change to 2°C does not give much certainty, or room for error.
Climate sensitivity
Climate science has been improving all the time over the last few decades, and like any area of science there continue to be advancements and debates. The IPCC provide an international reference point which many use. However this can be viewed as a conservative consensus of the science. There are many recognised experts whose work suggests that the climatic response to a certain level of emissions is likely to be higher or that the physical impact of a given level of warming is likely to be greater. Hence there are precautionary calls for a carbon budget that is tighter than a 50% chance of limiting warming to 2°C.
Non-CO² gases and other contributions
As the primary greenhouse gas which generally indicates the overall trend, focusing on CO² is a valid approach, and some budgets refer solely to CO². Alternatively budgets may include the basket of greenhouse gases represented as CO²-equivalent. Managing methane emissions is a priority for the production of unconventional hydrocarbons due to its higher greenhouse effect potency. In fact it should be addressed across the board, as many conventional resources could also be major contributors. If methane emissions are not addressed, it will only put further pressure on the CO² side of the budget. Some budgets focus exclusively on the production of energy and industrial emissions. Others are higher level budgets which cover the contributions of land use cover change and forestry. The key point is to make sure you are comparing apples with apples.
Focusing on the danger zone above 450
The 450 Scenario from the International Energy Agency (IEA) 2014 World Energy Outlook depicts an energy pathway “consistent with a 50% chance of meeting

Carbon budgets | 5
the goal of limiting the increase in average global temperature to 2°C compared with pre-industrial levels.” From 2015–2035, this scenario suggests a carbon budget for energy-based emissions from all fossil fuels of as a reference point to allocate the 593 CO². Using this total as our initial reference point, we then adjust for the coverage of our supply datasets to exclude some domestic coal and gas markets not covered, and take out the allowance for metallurgical coal, leaving 446GtCO².
For the purposes of analysing the carbon supply cost curves, we are focusing on the coal, oil and gas that are surplus to requirements over the next 20 years compared to a BAU scenario.
• Firstly this recognises that there is still a significant volume of fuels that will be used over the next couple of decades – consumption is not going to stop overnight. But in the IEA 450 scenario demand does decline for coal and oil.
• Secondly this captures a period of supply which relates to the next 10 years of capital investment. In corporate strategy terms it is difficult to get visibility much beyond this, and indeed the data that is available reflects this.
Finally this means that we are focused on the marginal supply that sits above the demand levels indicated in the IEA’s 450 Scenario. It is by no means an exhaustive list of all the reserves and resources that exist in the world. There is even more potential supply into the future not covered here.
Drilling down to this level gives an industry perspective that should be a focus for investors in the context of the bigger carbon budget/fossil fuel resources. Picture. This is an analysis of the danger zone for the next couple of decades – the gap between business as usual and a low carbon low demand future.
Figure 1: The danger zone above the IEA 450 carbon budget 2015–35
Source: IPCC AR5, IEA WEO 2014, Carbon Tracker
Glob
al an
nual
ener
gy em
ission
s (Gt
CO²)
1870
2015
2050
2100
2035
+2,002 +593 +227 +178Total3,000
0
10
20
30
40
2015
2016
2017
2018
2019
2020
2021
2022
2023
2024
2025
2026
2027
2028
2029
2030
2031
2032
2033
2034
2035
450 NPS CPSCoal Oil Gas
Danger zone

6 | The $2 trillion stranded assets danger zone: How fossil fuel firms risk destroying investor returns
Carbon capture & storage (CCS)
Carbon Tracker did consider CCS previously in our 2013 Unburnable Carbon analysis with the Grantham Institute at LSE. This research indicated that by 2050, the carbon budget would be increased by around 125GtCO² or 14% if the IEA’s idealised scenario of 3,800 CCS projects resulted. This surprised those involved, who expected it to make more difference. At the end of 2014, there were a reported 13 large-scale CCS projects operating that capture a total of 26 MtCO² per year. In the 450 Scenario, annual CO² capture must rise to over 4 Gt by 2035 – a level 150 times greater than today.
Timing
Given where the technology and deployment currently is, it is difficult to see CCS coming in at scale, at a reasonable cost before 2030. This means that in the timescale considered in our analysis to 2035, it makes a small contribution to increasing fossil fuel consumption within the carbon budget. The IEA’s 450 scenario indicates around 21 GtCO² being captured by CCS by 2035, which we have allowed for in our demand projections. This is equivalent to extending the complete IEA 450 scenario carbon budget by 4% to 2035. CCS may yet have a significant contribution to make – but not until post-2050.
Who will pay?
Some of the barriers to CCS relate to questions over permitting, liabilities and subsidising the cost. Certainty is needed over who is responsible for ensuring that the carbon remains stored in the ground, and what the penalty would be if it did not. The industry has called for subsidies to promote investment in CCS facilities, yet as an industry they have had decades of tax-breaks and consumption subsidies around the world, along with the resulting profits, with which to develop CCS.
Technology & Costs
As a solution, CCS is presented as combining a number of existing technologies. This may partly explain why there has been limited progress in the last decade in reducing the cost of CCS to a competitive level. Existing technologies are further
up the s-curve of development and therefore have less potential for rapid cost reduction than newer options such as battery storage or renewables. This questions whether subsidising CCS projects to try and improve costs through deployment at scale would deliver significant improvements. Furthermore the CCS process is always an addition to the existing cost base of fossil fuels – an extra process. It may also be more expensive to try and retrofit the technology to existing emissions sources. So in this sense it is always going to be making fossil fuel power generation more expensive, whilst the alternatives are getting cheaper.
Geography of CCS
CCS would be deployed at major point sources of CO² emissions such as power plants or industrial facilities. This would then need a suitable geological formation nearby where the CO² to could be piped to. Ironically most of the pilot CCS plants are Enhanced Oil Recovery projects, which improve the proportion of oil reserves that can be extracted from a field. Not all major emissions sources will be conveniently located near suitable geology to sequester the CO². For example Japan has limited hydrocarbon fields in its vicinity, along with the potential for major seismic events. Deployment of CCS in the IEA 450 scenario is concentrated in China and the United States, with India and the Middle East also seeing notable activity.
Impact on fossil fuel demand
Delays in CCS deployment can significantly steepen the required reductions in coal consumption by 2035 in a 2°C scenario. For example, in the 450 Scenario thermal coal consumption declines from a 2012 level of 4,443 million tonnes of coal equivalent (mtce) to a 2035 level of 3,085 mtce; should the introduction of large-scale CCS be delayed from 2020 to 2030, 2035 thermal coal consumption would have to be reduced by another 800 mtce (i.e. by 25%) in order to maintain an even chance of a 2°C trajectory. The IEA estimates risks to 2035 oil consumption of 1.3 mbpd, and risks to revenues from fossil-fuel producing countries of $1.35 trillion, (as a result of large-scale CCS deployment being delayed from 2020 to 2030).

Methodology | 7
Methodology
Having completed separate cost curves for each fossil fuel, this work aims to bring them back under the single carbon budget. In conducting this work we aimed to come up with something that was as complete and comparable as possible, subject to the data restrictions.
Supply data coverage:
• Thermal coal: Wood Mackenzie Ltd. Global Economic Model 2015, as well as Wood Mackenzie Coal Markets Service “2015 HI India Coal Long Term Outlook” = c.84% of global supply. Broken down by domestic and export markets. Metallurgical coal not analysed.
• Oil: Rystad Energy U-Cube Upstream database base case = global coverage of supply to meet business-as-usual (BAU) demand. Broken down by type of oil.
• Gas: Rystad Energy U-Cube base case = global coverage of supply to meet BAU demand. Broken down by domestic, regional and Liquefied Natural Gas (LNG) markets and by type of gas.
Demand scenarios
This report replicates the IEA 450 Scenario provided in the 2014 World Energy Outlook as a benchmark, using the regional breakdowns and allocation of the carbon budget across coal, oil and gas out to 2035 indicated. The 450 Scenario corresponds with an energy pathway “consistent with a 50% chance of meeting the goal of limiting the increase in average global temperature to 2°C compared with pre-industrial levels.” Carbon Tracker & ETA also produced a Low-Demand Scenario which represents an indication of where we are already headed based on policy and technology developments. This is slightly lower than the IEA New Policies Scenario (NPS), which takes into account “the policies and implementing measures affecting energy markets that had been adopted as of mid-2014, together with relevant policy proposals, even if specific measures needed to put them into effect have yet to be fully developed.” The IEA’s Current Policies Scenario (CPS) assumes “only the implementation of government policies and measures that had been enacted by mid-2014.”
Financial analysis
All prices are presented in real terms. The 10% and 15% Internal Rates of Return (IRRs) used are stated in nominal terms; long-term inflation of 2% per year has been assumed in this study across the fossil fuels (i.e. IRRs equivalent to 7.8% and 12.7% IRR in real terms). Capex figures are presented in real 2015 US dollars.
In this paper we have reviewed the oil, gas and coal prices required to give a net present value (NPV) of zero using a given discount rate or IRR. This is prepared on two bases:
1. Breakeven price (10% IRR) – illustrative of the price at which a project is economic, the 10% discount rate intended to represent a company’s weighted-average cost of capital; and
2. Sanction price (15% IRR) – illustrative of the minimum price that a project would require to generate a 15% IRR, the minimum we see as being satisfactory for shareholders given risks such as cost overruns etc.
The 15% IRR sanction price has been used in determining production as either needed or not needed in a particular scenario.
Timeframes considered:
Carbon budget: 2015–2035 Supply & Demand: 2015–2035 Capex: 2015–2025
New vs existing projects
The analysis differentiates between “new” projects – those that have not yet started being developed, and “existing” projects – those that are already under development or producing.

8 | The $2 trillion stranded assets danger zone: How fossil fuel firms risk destroying investor returns
Thermal coal
No new mines needed
A 2°C pathway does not see demand to 2035 for coal exceeding the amount that could be produced from further investment over the next decade only in mines that are already producing or under development. There are slight domestic shortfalls in India and South Africa, which could be met by further investment in the second decade post-2025 in existing mines, or imports. Given that many new mines would require further investment in new infrastructure on top of the production costs indicated here, we assume existing mines would take precedence. The IEA WEO 2015 appears to draw a similar conclusion subject to the caveat that the real world may not follow the cost curve:
“This might be understood to imply that no capital investment is required in new mines, although this is not a necessary consequence as new mines might still be developed for economic and social reasons, if costs or distance to market are favourable.”
This is a valid caveat, but this should not detract from the headline that no new thermal coal mines are necessary under the IEA 450 scenario, as confirmed by our analysis.
Existing mines continue
The adjacent chart indicates the potential capex in each country, ranked in order of the highest amount not needed in the 450 scenario. This demonstrates the difference to oil & gas, in that mines can keep producing at consistent rates and be expanded in phases, whereas petroleum fields have decline rates meaning they need to be replaced to maintain production.
Domestic production
China dominates the picture, followed by the US, Australia, India and Indonesia in having significant amounts of capex and carbon in new projects that are not needed in the 450 scenario. These 5 countries alone account for over 90% of unneeded capex. Data for China and India is not as detailed as the other markets, with regional figures only available for China, and Indian figures based off Coal India data, which dominates the market.
Figure 2: Supply country of thermal coal capex not needed under 450 scenario 2015–25
Source: Carbon Tracker & ETA analysis of WoodMac GEM
0 20 40 60 80 100
47% China
62% Indonesia
39% United States
54% Australia
39% Russia
95% Mozambique
27% Colombia
88% Botswana
33% Vietnam
36% Canada
100% Venezuela
43% Chile
2% Mongolia
100% New Zealand
Potential 2015–2025 capex ($bn)
25% South Africa
27% India
% not needed New needed Existing needed
New not needed Existing not needed

Thermal coal | 9
Export market
The seaborne coal curve consists only of existing assets, as further investment in these is more than sufficient to meet IEA 450 scenario export demand. Because most of the capital has already been sunk in these projects, the 15% IRR cost curve is not significantly different to the 10% IRR curve, so is not shown here. The cost curve for export coal is already very flat, meaning that even if demand turns out to be higher, it is unlikely to drive marginal prices higher. Since our last analysis, operators have continued to try and cut costs, and foreign exchange rates have also disadvantaged a number of exporters, resulting in some movement within the cost curve. Australia and Indonesia are the most exposed to export markets, with nearly all their unneeded production earmarked for export.
Export markets in structural decline
The Newcastle FOB benchmark price fell to an eight year low in October 2015 dipping under $55/tonne. This demonstrates the level of oversupply in the seaborne market, which equated to around 1,000mtpa in 2014, with signs of lower demand in the first three quarters of 2015. The 450 scenario equates to an average annual seaborne coal market of 771Mtpa to 2035. The chart shows there is ample potential supply just from existing mines to go far beyond this. Many analysts have called this as a terminal decline for export coal, not seeing any recovery to the prices and volumes of a few years ago. Traded coal is where many listed companies have their exposure, although a number of the diversified mining companies have been reducing their thermal coal interests over the last year.
Demand dominoes
As documented in our demand analysis, the markets lined up to drive future growth are falling over. In particular Chinese efforts to peak coal demand, reduce carbon intensity, and improve air quality, alongside shifts away from industrial sectors and the slowing of the economy. India is the next great hope. However the desire to become more self-sufficient in energy and diversify away from coal signals that expensive coal imports are not sustainable.
Figure 3: Supply country of thermal coal CO² avoided under 450 scenario 2015–35
Source: Carbon Tracker & ETA analysis of WoodMac GEM
47%
64%
39%
28%
53%
39%
28%
95%
27%
88%
33%
36%
0 10 20 30 40 50 60 70 80
China
Indonesia
United States
India
Australia
Russia
South Africa
Mozambique
Colombia
Botswana
Vietnam
Canada
Potential 2015–2035 CO² (GtCO²)
Seaborne export Domestic % not needed

10 | The $2 trillion stranded assets danger zone: How fossil fuel firms risk destroying investor returns
Figure 4: Carbon supply cost curve for seaborne coal market – potential production from existing projects only 2015–2035
Source: Carbon Tracker & ETA analysis of WoodMac GEM
0
25
50
75
100
125
150
0 200 400 600 800 1,000 1,200 1,400
Expo
rt co
st ($/
t)
Average annual production 2015–2035 (Mtpa)
10% IRR
450: 771 Mtpa = $61.8/t (10% IRR)
0 10 20 30 40

Gas | 11
Gas
Lower growth
The IEA 450 scenario still sees growth for gas, but at a lower level than expected under a business as usual scenario. Where domestic gas is readily available we see this going ahead. It is therefore the more capital intensive LNG market that is likely to be on hold.
Regional markets
The supply is divided into three main regional markets – the export LNG market, EU and US. Beyond this it is assumed smaller domestic production for consumption in country all goes ahead. LNG is then the swing production that meets demand. This means that the predominantly Asian market for LNG is increasingly linked to European prices, as the overspill competes with European marginal production.
Concentrated exposure
The largest amounts of unneeded gas capex are located in the US, Australia, Indonesia, Canada and Malaysia, which together account for around three-quarters of the total unneeded capex. Indonesia is the most exposed in terms of the proportion of the total potential gas investment that is surplus to requirements in the 450 scenario at just over half.
Figure 5: Unneeded gas capex to 2025 under 450 scenario
Source: Carbon Tracker & ETA analysis of Rystad U-Cube
30%
24%
54%
25%
32%
47%
23%
16%
14%
26%
55%
46%
20%
19%
15%
0 100 200 300 400 500 600
United States
Australia
Indonesia
Canada
Malaysia
Israel
Mozambique
Norway
Iran
Turkmenistan
Italy
Poland
Tanzania
Venezuela
Azerbaijan
2015–2025 potential capex ($bn)
New needed Existing needed
New not needed Existing not needed % not needed

12 | The $2 trillion stranded assets danger zone: How fossil fuel firms risk destroying investor returns
Conventional gas
Potential gas production that is categorised as conventional in Rystad’s database makes up a relatively small proportion of the options available, representing 15% of the needed capex in the 450 scenario.
Unconventional & Arctic
Coal bed methane and Arctic projects have the highest proportion of capex and production not needed, although the overall volumes are not that large.
LNG
The significant investment that has already taken place into LNG capacity in recent years is unlikely to continue at that pace in the 450 scenario. Given that most LNG is usually contracted in advance giving greater financial security for the capital investment, the potential for losses are smaller. The issue here is more whether the size of the market will be as large as some companies expect, and therefore whether they will be able to grow further. In the 450 scenario only around half of the potential capex goes ahead in the next decade.
North American LNG based on shale gas production is a new entrant to the market. In the 450 scenario there is very little new LNG capacity needed in the US and Canada. This kind of unconventional gas production also needs to deliver on reducing fugitive methane emissions through the industry initiatives that have been established.
The marginal LNG production breaks even at around $10/mmBtu, but would require higher average prices over the period to give a 15% IRR.
Table 1: Breakdown of 450 scenario 2015–25 capex and 2015–35 CO² avoided by gas type
Capex ($bn) Carbon (GtCO²)
Category Needed Not needed
% not needed
In budget Avoided %
avoided
Arctic 9 20 68% 0.2 0.4 64%
Coalbed methane 2 5 69% 0.0 0.1 66%
Conventional (land/shelf)
100 78 44% 3.4 1.1 24%
Deep water 56 18 24% 1.1 0.2 17%
Tight/shale liquids 222 71 24% 15.0 2.6 15%
Ultra deep water 21 12 37% 0.7 0.3 27%
LNG 247 254 51% 6.6 4.6 41%
Total 657 459 41% 27.1 9.3 25%
Source: Carbon Tracker & ETA analysis of Rystad U-Cube

Gas | 13
Figure 6: Carbon supply cost curve for LNG market – potential production to 2035 from new and existing projects
Source: Carbon Tracker & ETA analysis of Rystad U-Cube
0
5
10
15
20
25
30
35
40
45
Brea
keve
n pric
e ($/
mm
Btu)
2015–2035 average annual production (bcm p.a.) 0 100 200 300 400 500 600
0 10 20
10% IRR 15% IRR
450: 487 bcm p.a. = $9.54/mmBtu (10% IRR), $13.54/mmBtu (15% IRR)

14 | The $2 trillion stranded assets danger zone: How fossil fuel firms risk destroying investor returns
Oil
Peak demand
In the 450 scenario, oil demand peaks around 2020. This means that the oil sector does not need to continue to grow, which is inconsistent with the narrative of many companies.
Oil decline rates
Oil wells see the rate of production decline over time, meaning that they do not provide the same flat level of production and revenue that would be expected from say a coal mine. This means that even to maintain a level of production, further investment is required to bring new wells onstream. As a result nearly all existing production and further new projects are still needed in the 450 scenario to 2035. This reflects that the oil majors only have proven reserves of around 12 years, so just to keep reserves replacement close to 100% for the next 20 years requires investment to develop resources. The industry has been spending more and more in recent years just to treadwater, as it only has access to increasingly expensive options.
Exposed countries
The countries with the largest amounts of capex not needed over the next decade are the US, Canada, Russia, Mexico and Kazakhstan, which together represent half of the global unneeded capex. Some countries have a higher level of exposure, eg Malaysia at 52% of total capex due to its higher cost profile.
Figure 7: Unneeded oil capex to 2025 under 450 scenario
Source: Carbon Tracker & ETA analysis of Rystad U-Cube
0 200 400 600 800 1,000 1,200 1,400 1,600
16% United States
35% Canada
31% Russia
37% Mexico
43% Kazakhstan
20% China
31% Venezuela
22% Nigeria
22% Iraq
15% Norway
52% Malaysia
18% Iran
2015–2025 unneeded capex ($bn) New needed Existing needed
New not needed Existing not needed % not needed

Oil | 15
Types of oil
It can be seen that each country has different categories of oil that bring exposure to unneeded capex. The US exposure is primarily shale oil, Canada’s oil sands weigh heavily, and Russia is primarily conventional. All three of those countries are also in the Arctic and share that exposure with Norway. Deepwater features in US, Mexico and. Venezuela’s heavy oil is flagged as in the danger zone too. The limited Middle Eastern exposure is in Kazakhstan, Iraq and Iran. However OPEC’s representation in this category is notable for its minimal presence. North America and Russia are much more exposed.
Leaving oil in the ground
Whilst the difference in volumes of oil demand to 2035 may not be huge between scenarios, we consider the related capex to be significant. It is the price volatility rather than the volume erosion that is likely to have a bigger impact on the oil sector. In particular with the lag time of most projects between approval and first oil, it is necessary to take a view on the likely oil market from 5–10 years when production would take place. The more rapid ramp up time and flexibility of US shale offers a buffer to this for these operators.
Figure 8: Avoided oil emissions by supply country and type under 450 Scenario 2015–35
Oil shale (kerogen)
Arctic
Coalbed methane
Deep water
Oil sands
Extra heavy oil
Tight/shale liquids
Conventional (land/shelf)
0 0.5 1 1.5 2 2.5 3 3.5 4 4.5
United States
Canada
Russia
Mexico
Iraq
Nigeria
Venezuela
China
Malaysia
Kazakhstan
Indonesia
Norway
2015–2035 avoided CO² (GtCO²)
Ultra deep water

16 | The $2 trillion stranded assets danger zone: How fossil fuel firms risk destroying investor returns
Capital intensity
Overall around 24% of capex is surplus to requirements in the 450 scenario. This relates to only 11% of potential production due to its high cost nature. Arctic, oil shale and oil sands have higher than average proportions of unneeded production. The majority are new projects, and more detail on these is available in the detailed supply paper.
Updated cost curve
Since we produced our oil carbon cost curve in early 2014, the price has come down significantly. This has resulted in significant attempts to both cut costs and review capex plans. As a result there has been significant movement along the cost curve.
15% IRR
We have had a number of debates around the IRR oil companies should be aiming for. We believe 15% is the minimum that the market expects to see. The oil cost curve has developed more of an elbow since the introduction of US shale which has flattened the middle section. Once you get beyond this up the curve then breakeven prices start to rise very quickly.
The cost curve shows the difference in average oil price needed to deliver a 15% return for the last marginal barrel compared to the prevailing price level required to breakeven. This shows how sensitive producers at the top end of the cost curve are to price volatility. Larger companies with a diversified portfolio can carry expensive projects, but smaller players with concentrated activities in the danger zone at the high end of the cost curve are challenged in a low demand, low price environment.
Table 2: Breakdown of 450 Scenario needed 2015–25 capex and 2015–35 production by oil type
Capex ($bn) CO² (GtCO²)
CategoryNeeded
(450 scenario)
Not needed
(450 scenario)
% not needed
Needed (450
scenario)
Not needed
(450 scenario)
% not needed
Arctic 63 69 52% 1.5 1.2 46%
Coalbed methane
0 0 0% 0.1 0.0 0%
Conventional (land/shelf)
2,299 686 23% 143.5 13.1 8%
Deep water 530 152 22% 15.9 3.5 18%
Extra heavy oil
148 55 27% 7.1 0.9 11%
Oil sands 169 157 48% 10.5 3.3 24%
Oil shale 4 14 76% 0.2 0.2 45%
Tight/shale liquids
979 193 16% 30.4 3.4 10%
Ultra/deep water
409 102 20% 12.1 1.9 14%
Total 4,602 1,427 24% 221.3 27.6 11%
Source: Carbon Tracker & ETA analysis of Rystad U-Cube

Oil | 17
Figure 9: Carbon supply cost curve for oil production to 2035 – potential production to 2035 from new and existing projects
Source: Carbon Tracker & ETA analysis of Rystad U-Cube
0
50
100
150
200
250
300
350
Brea
keve
n pric
e ($/
bbl)
0 20 40 60 80 100
0 50 100 150 200 250
10% IRR 15% IRR
450: 85 mbpd = $82.40/bbl (10% IRR), $110.10/bbl (15% IRR)
2015–2035 average daily production (mbpd)

18 | The $2 trillion stranded assets danger zone: How fossil fuel firms risk destroying investor returns
Who owns the carbon?
Of interest to shareholders is how the decarbonisation of the energy system will affect the listed companies they own, given that state owned entities also play a major role. To answer this question we believe it is more relevant to look at two main aspects:
1. Who is involved in fossil fuel production over the next couple of decades
2. Where that production sits on the cost curve
Production vs Reserves & Resources
In looking at long-term big picture data on who owns fossil fuel reserves, there will always be a bias to state-owned entities. At some point sovereign states own all the rights to minerals; the government then leases them to companies who have the capital and technology to develop them. The private sector has always been well placed to provide both these elements, hence its major role in extraction. State-owned companies may still play some role in developing projects or sharing the revenues, and in some jurisdictions it is a requirement.
Huge coal overhang
There is far more coal than can be burnt in the next 20 years sitting in the ground. And the geology of coal gives much greater certainty than there is over most oil and gas resources. Given that many of the coal resources in existence have not even been licensed or developed yet, it is difficult to say who will ultimately develop them, but in the meantime, governments have control over them.
Coal ownership
Wood Mackenzie estimated that in 2015, 43% of thermal coal production came from key state owned enterprises (KSOE), with this figure falling by 2035. In addition to this there is a layer of provincial/local ownership that is not reported, which would increase this proportion. The Indian market is dominated by Coal India, of which 20% is traded as a listed equity.
The US production is mainly licensed to domestic companies, who have concentrated risk in the US market, especially as the attempts by some to diversify geographically or export coal have come at a time when the seaborne market is in structural decline. This global seaborne market is primarily the reserve of listed companies.
The big diversified miners have interests around the world, but Rio Tinto, BHP Billiton and Anglo American have been focusing on other commodities given the poor performance and prospects of thermal coal. Assets have been sold or restructured. Glencore is the exception as it has continued to invest in coal assets over the last year.
Some companies are also investing in overseas assets as potential supplies for to import to their domicile. For example Japanese and Indian companies have bought licenses in Australia for potential export mines. In the case of Bumi Resources, the Indonesian company listed in London as part of a deal to bring in investment.
Chinese and Indian production account for around half of current volume but even this has some exposure to capital markets. Beyond that most production involved the private sector in some way as few other coal producers are completely isolated in an increasingly global network of an industry.

Who owns the carbon? | 19
Oil ownership
Reviewing the exposure in terms of new projects not needed under the IEA 450 scenario indicates there is very little difference across the different types of oil companies. Overall 43% of capex to 2025 and 33% of new potential supply to 2035 is not needed. This demonstrates that the private sector has any many difficult decisions to make about its current capex plans as those companies with a government interest.
Figure 10: Ownership of oil capex to 2025 and production to 2035 for new projects
Source: Carbon Tracker & ETA analysis of Rystad U-Cube
NOC INOC Major E&P Company Integrated
% capex unneeded
Pro
duc
tion
(mm
bo
pd
)
Cap
ex($
bn)
Pro
duc
tion
(mm
bo
pd
)
Cap
ex($
bn)
Pro
duc
tion
(mm
bo
pd
)
Cap
ex($
bn)
Pro
duc
tion
(mm
bo
pd
)
Cap
ex($
bn)
Pro
duc
tion
(mm
bo
pd
)
Cap
ex($
bn)
8%
9% 11% 12%
8%
22%
17% 20%
21%
20%
0
200
400
600
800
1,000
1,200
1,400
1,600
0
5
10
15
20
25
30
35
40
2015
–202
5 cap
ex ($
bn)
2015
–203
5 pro
duct
ion (m
mbo
pd)
Unneeded production
Needed production Needed capex
Unneeded capex
20 | The $2 trillion stranded assets danger zone: How fossil fuel firms risk destroying investor returns
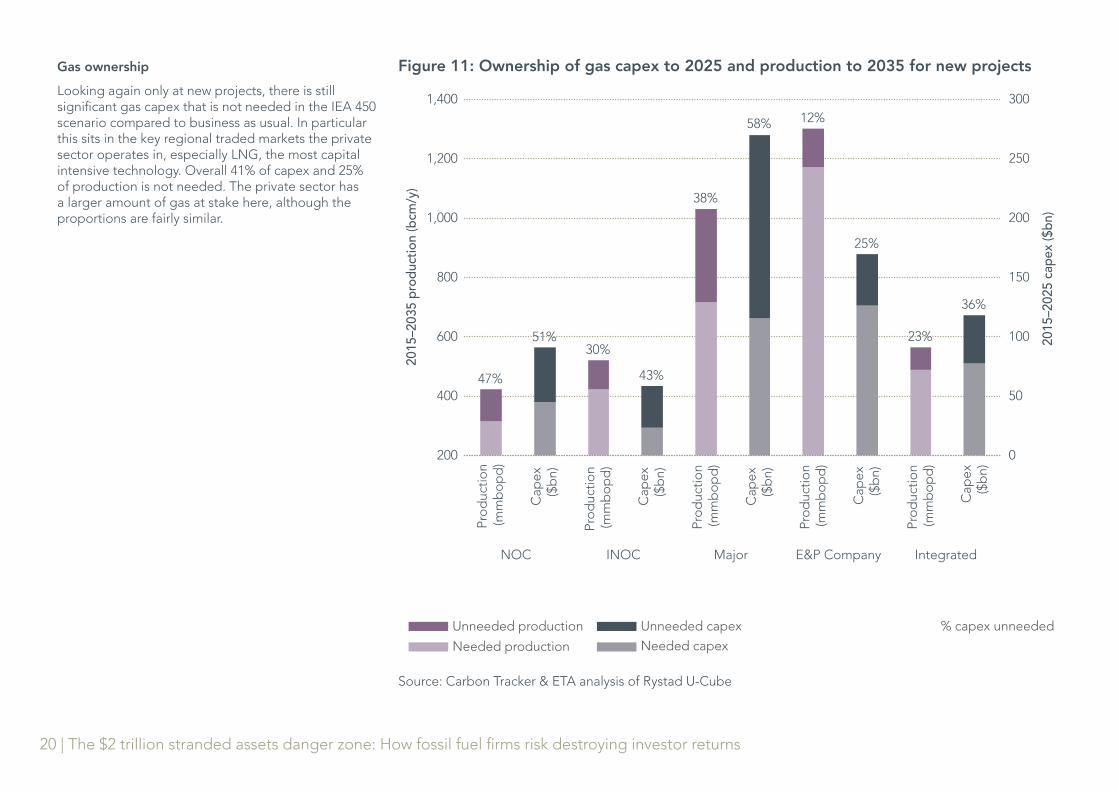
Gas ownership
Looking again only at new projects, there is still significant gas capex that is not needed in the IEA 450 scenario compared to business as usual. In particular this sits in the key regional traded markets the private sector operates in, especially LNG, the most capital intensive technology. Overall 41% of capex and 25% of production is not needed. The private sector has a larger amount of gas at stake here, although the proportions are fairly similar.
Figure 11: Ownership of gas capex to 2025 and production to 2035 for new projects
Source: Carbon Tracker & ETA analysis of Rystad U-Cube
Pro
duc
tion
(mm
bo
pd
)
Cap
ex($
bn)
Pro
duc
tion
(mm
bo
pd
)
Cap
ex($
bn)
Pro
duc
tion
(mm
bo
pd
)
Cap
ex($
bn)
Pro
duc
tion
(mm
bo
pd
)
Cap
ex($
bn)
Pro
duc
tion
(mm
bo
pd
)
Cap
ex($
bn)
NOC INOC Major E&P Company Integrated
2015
–202
5 cap
ex ($
bn)
2015
–203
5 pro
duct
ion (b
cm/y
)
% capex unneeded Unneeded production
Needed production Needed capex
Unneeded capex
0
50
100
150
200
250
300
200
400
600
800
1,000
1,200
1,400
47%
51% 30%
43%
38%
58% 12%
25%
23%
36%

Who owns the carbon? | 21
Middle East low cost production
Oil states tend to be the base oil production for the next couple of decades, and they are well positioned on the cost curve to have a big role in any demand scenario. In looking at the danger zone above the IEA 450 scenario we find that private companies have a significant role.
High risk cost exposure
In particular higher cost options like oil sands or ultra-deepwater or Arctic exploration and production and LNG tend to require the latest technical expertise. This is why the private sector are involved, as countries new to the sector do not have the domestic capabilities and want to share the development risk.
North America = low NOC exposure
Canada’s oil sands are a hotspot for unneeded high cost capex with good visibility over the volume in the ground due to the nature of the resources for example, but NOCs have very limited exposure there. US shale gas is also a significant volume of the marginal production not needed under the 450 scenario. Again this is not a type of production the NOCs have got into, so they will not be impacted here. This relates to the wider strategic play being made by OPEC members at present to retain market share. One of the likely objectives is to ensure they get their production out first before demand cools off.
Century bond not ageing well
In June 2015, Petrobras issues 100 year bonds in its company. By September they were trading at 70c in the $ and the company then had its credit rating cut to junk status. This is another route through which the capital markets have exposure to fossil fuels held under government entities.
Focus on the danger zone
This cost curve analysis is looking at the danger zone where the mid-term carbon budget and fossil fuel production overlap. We have focused on the gap between the IEA 450 scenario and BAU for the suppliers of coal, oil and gas.
Reinvestment strategy?
The oil majors have noted that they see little impact on their proven reserves, of around 12 years’ production. This is why we have highlighted that how the revenues from this production are invested is important. There is an opportunity to ensure that is aligned with a 2°C trajectory. But if the oil sector does not recognise it is going ex-growth, then its investment strategy will misread demand and likely include some excess, expensive production. The charts below focus on new undeveloped projects to understand the need for reinvestment beyond the current
proven oil and gas reserves. NOCs are 100% state-owned and tend to be active only in their domestic markets, whilst INOCs also operate overseas, eg Statoil, Petrobras, and Rosneft, and many have partial listings or issue debt on the capital markets.
Company capex exposure
The table indicates the companies which have the highest absolute amount of capex. This includes the largest companies as you might expect, with a mix of the oil majors and INOCs heading the list. Due to the relatively low capital intensity of coal, only the oil and gas companies make it into this top 20 list.
The oil majors appear at the top of the list due to their size, with unneeded capex ranging from $21.5bn for ConocoPhillips to $76.9billion for Shell over the next decade. This represents around 20–25% of total potential capex across oil and gas to 2025 for these companies.
Forgoing these options is the wake-up call that these companies may have to go ex-growth. In fact looking at performance in recent years, the companies have been spending more just to stay still in terms of production and have not seen growth in volumes. It is therefore unsurprising that with prices more volatile, and capex cut, the companies will struggle to maintain volumes. This is presumably the intended outcome for OPEC producers seeking to secure market share.
The majors can survive this shift, and if they embrace it could even improve the value created for shareholders. However smaller more specialised companies face a more fundamental challenges to their business model. The presence of some of the Canadian operators – CNRL, Suncor – indicates how challenged the oil sands may be going forward. Cutting $2–3bn per year of their capex plans represents a cut of around 40% of the total, and an even higher proportion of new projects cut.

22 | The $2 trillion stranded assets danger zone: How fossil fuel firms risk destroying investor returns
Table 3: Ranking of companies by unneeded capex under 450 Scenario 2015–25 ($bn)
Total capex unneeded (450 Scenario)
Rank Company Total Oil Gas Coal
1 Pemex 77.0 77.0 0.0 0.0
2 Shell 76.9 46.7 30.3 0.0
3 ExxonMobil 72.9 38.0 34.9 0.0
4 Rosneft 53.3 52.4 0.9 0.0
5 BP 45.5 26.2 19.3 0.0
6 Chevron 44.8 27.3 17.4 0.0
7 NIOC (Iran) 44.2 27.6 16.7 0.0
8 PetroChina 42.8 36.0 6.8 0.0
9 Gazprom 38.8 35.3 3.4 0.0
10 Petronas 38.3 13.6 24.8 0.0
11 Eni 37.4 20.5 16.8 0.0
12 Total 30.1 27.7 2.4 0.0
13 CNRL 25.6 25.6 0.0 0.0
14 Suncor Energy 23.0 19.7 3.3 0.0
15 PDVSA (Venezuela) 22.4 15.4 7.0 0.0
16 Inpex 21.8 8.2 13.6 0.0
17 ConocoPhillips 21.5 8.7 12.8 0.0
18 Pertamina 20.0 4.9 15.2 0.0
19 Devon Energy 18.2 14.6 3.6 0.0
20 Statoil 17.8 11.0 6.7 0.0
Source: Carbon Tracker & ETA analysis of Rystad U-Cube & Wood Mackenzie GEM
Company exposure by CO²In contrast to the capex data, coal dominates the CO² rankings. The oil majors still have a contribution to make in terms of avoiding excess CO².
The list excludes the Chinese regional data which is not attributed to companies, and forms a substantial proportion of the avoided carbon. NOCs and INOCs are included in the dataset. The Russian, Malaysian and Mexican state oil companies make the list. Middle East NOCs are noticeable by their absence as the majority of their production is low cost, meaning they don’t feature high up the list considering their size.
Asian coal companies top the list. Coal India dominates Indian production, and has partially listed, making it component of many global portfolios. The London listed companies, Bumi Resources, (focused on Indonesia), and Glencore – the diversified mining company most exposed.
There are also a couple of Japanese conglomerates – Itochu and Mitsubishi that make the list, although coal is one of many interests that they have.
Peabody, Murray and Foresight represent the struggling US coal sector, and they will need to reign in potential capex by around 50% to match the 450 scenario. Adani also makes the list – an Indian coal company seeking to exploit greenfield coalfields in the Galilee basin.
The amount of CO² that could be avoided by these pure coal companies aligning with the IEA 450 scenario is very significant for companies with a relatively small market capitalisation compared to the oil majors.

Who owns the carbon? | 23
Table 4: Ranking of companies by avoided CO² under 450 scenario
Total CO² avoided (450)
Rank Company Total Oil Gas Coal
1 Coal India 5.6 0.0 0.0 5.6
2 BEP Coal 2.0 0.0 0.0 2.0
3 Asia Resource Minerals 1.7 0.0 0.0 1.7
4 ExxonMobil 1.6 0.7 0.9 0.0
5 Rosneft 1.5 1.5 0.1 0.0
6 Glencore 1.5 0.0 0.0 1.5
7 Pemex 1.4 1.4 0.0 0.0
8 Murray 1.4 0.0 0.0 1.4
9 Tata 1.4 0.0 0.0 1.4
10 Peabody 1.4 0.0 0.0 1.4
11 Shell 1.3 0.9 0.5 0.0
12 Chevron 1.1 0.6 0.5 0.0
13 China Investment Corporation 1.1 0.0 0.0 1.1
14 Adani 1.1 0.0 0.0 1.1
15 BP 1.1 0.6 0.4 0.0
16 Itochu 1.0 0.0 0.0 1.0
17 Gazprom 0.9 0.6 0.3 0.0
18 Petronas 0.9 0.4 0.5 0.0
19 Foresight Energy 0.9 0.0 0.0 0.9
20 Mitsubishi 0.9 0.0 0.1 0.8
Source: Carbon Tracker & ETA analysis of Rystad U-Cube & Wood Mackenzie GEM

24 | The $2 trillion stranded assets danger zone: How fossil fuel firms risk destroying investor returns
Global summary: Combining the fossil fuels
If we bring together an overview of the unneeded capex (2015–25) and avoided CO² (2015–35) across the 3 fossil fuels in a 450 Scenario, the difference in financial and carbon significance is clear:
New Existing
Capex ($bn) GtCO²
Capex
($bn)GtCO²
Oil 1,303 25 124 3
Gas 459 9 73 2
Thermal coal 177 70 42 47
Total 1,939 104 239 52
It is clear that oil represents around two-thirds of the financial risk but a fifth of the carbon risk, whilst coal carries around half of the carbon risk, but only a tenth of the financial risk. Gas is low in terms of the carbon risk, but still carries around a quarter of the financial risk.
Danger zone
In terms of the total amounts of capex unneeded above the IEA 450 scenario, we see around $2.2trillion of capex over the next decade – $1.9trillion of that associated with new projects. It is these new projects that see much higher levels of cut needed – especially for coal, where all new projects need reviewing. Looking at production to 2035, the databases we analyse indicating business as usual industry supply suggest at least 156GtCO² that needs to be avoided over the next 20 years, in the supply data we analysed.
This means that 24% of the potential capex over the next decade needs to not be spent which would result in energy emissions being around 30% lower over the next twenty years. The geographical distribution across the highest 25 countries is displayed on the following map.
Figure 12: Breakdown of potential capex 2015–25 and avoided emissions 2015–35 by fossil fuel and new/existing projects
Source: Carbon Tracker & ETA analysis of Rystad U-Cube & Wood Mackenzie GEM
Coal NewOil New Gas New
Coal ExistingOil Existing Gas Existing
60%
6%
21%
3%
8% 2%
17%
31%
43%
1%
6%
2%
Capex
CO²

Global summary: Combining the fossil fuels | 25
Australia
IndonesiaMalaysia
Turkmenistan
Kazakhstan
South Africa
14.81.1
CO² avoided (GtCO²)
Unneeded capex ($bn)
1.8
UK
Argentina
India
MozambiqueBotswana
Nigeria
Qatar
Iran
1.8 8.6
0.7 1.4
0.8 16.4Vietnam
1.6 22.1
1.0 42.5
0.6 13.09.4 37.8
1.3 60.0 13.8 91.9
8.4 102.6
71.8 179.1China
0.7 44.419.40.60.9 38.4Iraq
147.06.1Russia
63.40.80.7 54.5Norway
0.4 29.7
0.4 20.4
0.4 19.8
53.11.1
93.9
17.5 411.6
5.1 220.2
Colombia Venezuela
USA
Mexico
Canada
Brazil
Figure 12: Map of unneeded capex to 2025 and related CO² to 2035 in the danger zone under the 450 scenario

26 | The $2 trillion stranded assets danger zone: How fossil fuel firms risk destroying investor returns
Recommendations
This analysis shows the countries and companies that have exposure to the danger zone above the 450 scenario where emissions need to be avoided and capex cancelled. Leaders have already started to acknowledge the need to explore and explain the exposure of their entities to the transition to a 2°C world. But this needs to become the default approach.
The Environment Agency Pension Fund launched its new climate change policy which has the objective to “ensure that our Fund’s investment portfolio and processes are compatible with keeping the global average temperature increase to remain below 2°C relative to pre-industrial levels, in-line with international government agreements.”
Citi’s Energy Darwinism II research shows that it is cheaper for the world to address climate change than bear its economic consequences. Mercer have shown how sectors with fossil fuel exposure are particularly vulnerable to even a gradual transition.
Statoil has published an energy outlook with a high renewables penetration scenario. BHP Billiton has given an indication of the proportion of its business that is incompatible with a 2°C scenario.
Climate change is increasingly recognised as relevant across all government ministries from defence and foreign policy to health and infrastructure. The bilateral moves by the largest economies – China and the US – reflect that energy systems cannot continue business as usual. The recent changes in leadership in Canada and Australia offer an opportunity to think about alternative directions for their economies. The new Canadian Prime Minister Trudeau has included specific instructions in the mandates of new Ministers to bring forward clean energy and prevent climate change and invest in green infrastructure.
Do the 2°stress-test
Institutional Investors Derisk you portfolio by
identifying companies which are alignedwith a 2°C demand scenario
Analysts & Advisors Provide sensitivty analysis
of which stocks are more resilientto a 2°C demand scenario
GovernmentsStress test
national resources,infrastructure
and energyplans against
a 2°C demand scenario
Companies Provide information
on the decisionstaken to align
corporate strategywith a 2°C
demand scenario

D | The $2 trillion stranded assets danger zone: How fossil fuel firms risk destroying investor returns