2. why is biodiversity loss a concern? - wri
TRANSCRIPT

Ecosystems and Human Well-being: B i o d i v e r s i t y S y n t h e s i s30
■ Biodiversity is essential for ecosystem services and hence for human well-being. Biodiversity goes beyond the provisioning for material welfare and livelihoods to include security, resil-iency, social relations, health, and freedoms and choices. Some people have benefited over the last century from the conversion of natural ecosystems to human-dominated ecosystems and from the exploitation of biodiversity. At the same time, however, these losses in biodiversity and associated changes in ecosys-tem services have caused other people to experience declining well-being, with some social groups being pushed into poverty.
Main Links among Biodiversity, Ecosystem Services, and Various Constituents of Human Well-being The MA identifies biodiversity and the many ecosystem services that it provides as a key instrumental and constitutive factor determining human well-being. The MA findings support, with high certainty, that biodiversity loss and deteriorating ecosystem services contribute—directly or indirectly—to worsening health, higher food insecurity, increasing vulnerability, lower material wealth, worsening social relations, and less freedom for choice and action.
Food SecurityBiological diversity is used by many rural communities
directly as an insurance and coping mechanism to increase flex-ibility and spread or reduce risk in the face of increasing uncer-tainty, shocks, and surprises. The availability of this biological “safety net” has increased the security and resilience of some local communities to external economic and ecological perturbations, shocks, or surprises (C6.2.2, C8.2). In a world where fluctuating commodity prices are more the norm than the exception, eco-nomic entitlements of the poor are increasingly becoming precar-ious. The availability of an ecosystem-based food security net during times when economic entitlements are insufficient to pur-chase adequate nourishment in the market provides an important insurance program (C8.1, C6.7).
Coping mechanisms based on indigenous plants are particu-larly important for the most vulnerable people, who have little access to formal employment, land, or market opportunities (C6). For example, investigations of two dryland sites in Kenya and Tanzania report local communities using wild indigenous plants to provide alternative sources of food when harvests failed or when sudden expenses had to be met (such as a hospital bill). (See Table 2.1.)
Another pathway through which biodiversity can improve food security is the adoption of farming practices that maintain and make use of agricultural biodiversity. Biodiversity is impor-tant to maintaining agricultural production. Wild relatives of domestic crops provide genetic variability that can be crucial for overcoming outbreaks of pests and pathogens and new environ-mental stresses. Many agricultural communities consider increased local diversity a critical factor for the long-term pro-ductivity and viability of their agricultural systems. For example, interweaving multiple varieties of rice in the same paddy has been shown to increase productivity by lowering the loss from pests and pathogens.
VulnerabilityThe world is experiencing an increase in human suffering
and economic losses from natural disasters over the past sev-eral decades. Mangrove forests and coral reefs—a rich source of biodiversity—are excellent natural buffers against floods and storms. Their loss or reduction in coverage has increased the severity of flooding on coastal communities. Floods affect more people (140 million per year on average) than all other natural or technological disasters put together. Over the past four decades, the number of “great” disasters has increased by a factor of four, while economic losses have increased by a factor of ten. During the 1990s, countries low on the Human Development Index experienced about 20% of the hazard events and reported over 50% of the deaths and just 5% of economic losses. Those with high rankings on the index accounted for over 50% of the total economic losses and less
than 2% of the deaths (C6, R11, C16).A common finding from the various sub-
global assessments was that many people living in rural areas cherish and promote ecosystem variability and diversity as a risk management strategy against shocks and surprises (SG11). They maintain a diversity of ecosystem services and are skeptical about solutions that reduce their options. The sub-global assessments found that diversity of species, food, and landscapes serve as “savings banks” that rural communities use to cope with change and ensure sustainable livelihoods (see Peruvian, Portuguese, Costa Rican, and India sub-global assessments).
2. Why is biodiversity loss a concern?
Table 2.1. Percentage of Households Dependent on Indigenous Plant–based Coping Mechanisms at Kenyan and Tanzanian Site (C6 Table 6.4)
Activities that Involve Use Share of Households, Share of Households, of Indigenous Plants Kenya site Tanzania site
(percent) (percent)
All use 94 94
Food use 69 54
Non-food use 40 42

Ecosystems and Human Well-being: B i o d i v e r s i t y S y n t h e s i s 31
HealthAn important component of health is a balanced diet. About
7,000 species of plants and several hundred species of animals have been used for human food consumption at one time or another. Some indigenous and traditional communities currently consume 200 or more species. Wild sources of food remain par-ticularly important for the poor and landless to provide a some-what balanced diet (C6, C8.2.2). Overexploitation of marine fisheries worldwide, and of bushmeat in many areas of the trop-ics, has lead to a reduction in the availability of wild-caught ani-mal protein, with serious consequences in many countries for human health (C4.3.4).
Human health, particularly risk of exposure to many infec-tious diseases, may depend on the maintenance of biodiversity in natural ecosystems. On the one hand, a greater diversity of wildlife species might be expected to sustain a greater diversity of pathogens that can infect humans. However, evidence is accumu-lating that greater wildlife diversity may decrease the spread of many wildlife pathogens to humans. The spread of Lyme disease, the best-studied case, seems to be decreased by the maintenance of the biotic integrity of natural ecosystems (C11, C14).
Energy SecurityWood fuel provides more than half the energy used in
developing countries. Even in industrial countries such as Swe-den and the United States, wood supplies 17% and 3% of total energy consumption respectively. In some African countries, such as Tanzania, Uganda, and Rwanda, wood fuel accounts for 80% of total energy consumption (SG-SAfMA). In rural areas, 95% is consumed in the form of firewood, while in urban areas 85% is in the form of charcoal. Shortage of wood fuel occurs in areas with high population density without access to alternative and affordable energy sources. In some provinces of Zambia where population densities exceed the national average of 13.7 persons per square kilometer, the demand for wood has already surpassed local supply. In such areas, people are vulnerable to illness and malnutrition because of the lack of resources to heat homes, cook food, and boil water. Women and children in rural poor communities are the ones most affected by wood fuel scarcity. They must walk long distances searching for fire-wood and therefore have less time for tending crops and school (C9.4).
Provision of Clean WaterThe continued loss of cloud forests and the destruction of
watersheds reduce the quality and availability of water supplied to household use and agriculture. The availability of clean drinking water is a concern in dozens of the world’s largest cities (C27). In one of the best documented cases, New York City took steps to protect the integrity of watersheds in the Catskills to ensure continued provision of clean drinking water to 9 million people. Protecting the ecosystem was shown to be far more cost-
effective than building and operating a water filtration plant. New York City avoided $6–8 billion in expenses by protecting its watersheds (C7, R17).
Social RelationsMany cultures attach spiritual and religious values to ecosys-
tems or their components such as a tree, hill, river, or grove (C17). Thus loss or damage to these components can harm social relations—for example, by impeding religious and social ceremo-nies that normally bind people. (See Box 2.1.) Damage to ecosys-tems, highly valued for their aesthetic, recreational, or spiritual values can damage social relations, both by reducing the bonding value of shared experience as well as by causing resentment toward groups that profit from their damage (S11, SG10).
Box 2.1. Social Consequences of Biodiversity Degradation (SG-SAfMA)
The basic needs of the AmaXhosa people in South Africa are met by ecosystem services, including fuelwood, medicinal plants, build-ing materials, cultural species, food supplements, and species of economic value. When asked by researchers about their relation-ship with the natural environment, a local responded “I am entirely dependent on the environment. Everything that I need comes from this environment” and “[the environment] will be important for-ever because if you have something from the environment it does encourage you to love the environment.”
Respondents often described positive emotional and physical symptoms when the environment is healthy: “When the environment is healthy, my body and spirit is also happy.” And when describ-ing people’s feelings toward a healthy environment, a respondent stated that “people love such an environment. They really adore it. Such an environment makes them feel free.” In addition, respon-dents described the feelings of peace when walking in the bush and how they would go into the natural environment to pray.
The beliefs and traditions of the AmaXhosa play an important role in guiding resource use and management and encouraging values to be place-centered. The ancestors are central to this cosmology, where the very identity of a Xhosa person is based on performing traditions and rituals for ancestors. The majority of respondents stated that practicing traditions and thus communi-cating with ancestors is what is of value to a Xhosa person.
A number of sites and species are fundamental to the perfor-mance of rituals and maintaining a relationship with the ances-tors. When respondents were asked what would happen if these sites were to be destroyed, they replied “It means that the ances-tors would be homeless.” “That can’t happen here at this village because our health depends entirely on these sites,” and “it means that our culture is dead.”

Ecosystems and Human Well-being: B i o d i v e r s i t y S y n t h e s i s32
Freedom of Choice and ActionFreedom of choice and action within the MA context refers
to individuals having control over what happens and being able to achieve what they value (CF3). Loss of biodiversity often means a loss of choices. Local fishers depend on man-groves as breeding grounds for local fish populations. Loss of mangroves translates to a loss in control over the local fish stock and a livelihood they have been pursuing for many generations and that they value. Another example is high-diversity agricul-tural systems. These systems normally produce less cash than monoculture cash crops, but farmers have some control over their entitlements because of spreading risk through diversity. High diversity of genotypes, populations, species, functional types, and spatial patches decreases the negative effects of pests and pathogens on crops and keeps open possibilities for agrarian communities to develop crops suited to future environmental challenges and to increase their resilience to climate variability and market fluctuations (C11).
Another dimension of choices relates to the future. The loss of biodiversity in some instances is irreversible, and the value indi-viduals place on keeping biodiversity for future generations— the option value—can be significant (CF6, C2). The notion of having choices available irrespective of whether any of them will be actually picked is an essential constituent of the freedom aspect of well-being. However, putting a monetary figure on option values is notoriously difficult. We can only postulate on the needs and desires of future generations, some of which can be very different from today’s aspirations.
Basic Materials for a Good Life and Sustainable Livelihoods
Biodiversity offers directly the various goods—often plants, animals, and fungi—that individuals need in order to earn an income and secure sustainable livelihoods. In addition, it also contributes to livelihoods through the support it provides for ecosystem services: the agricultural labor force currently contains approximately 22% of the world’s population and accounts for 46% of its total labor force (C26.5.1). For example, apples are a major cash crop in the Himalayan region in India, accounting for 60–80% of total household income (SG3). The region is also rich in honeybee diversity, which played a signifi-cant role in pollinating field crops and wild plants, thereby increasing productivity and sustaining ecosystem functions. In the early 1980s, market demand for particular types of apples led farmers to uproot pollinated varieties and plant new, sterile cultivars. The pollinator populations were also negatively affected by excessive use of pesticides. The result was a reduc-tion in overall apple productivity and the extinction of many natural pollinator species (SG3).
Nature-based tourism (“ecotourism”)—one of the fastest-growing segments of tourism worldwide—is a particularly important economic sector in a number of countries and a potential income source for many rural communities (C17.2.6). The aggregate revenue generated by nature-based tourism in Southern Africa was estimated to be $3.6 billion in 2000, roughly 50% of total tourism revenue (SG-SAfMA). Botswana, Kenya, Namibia, South Africa, Tanzania, Uganda, and Zimba-bwe each generated over $100 million in revenue annually from nature-based tourism in 2000. In Tanzania, tourism contributed 30% of the total GDP of the country.
Biodiversity also contributes to a range of other industries, including pharmaceuticals, cosmetics, and horticulture. Market trends vary widely according to the industry and country involved but many bioprospecting activities and revenues are expected to increase over the next decades (C10). The current economic climate suggests that pharmaceutical bioprospecting will increase, especially as new methods use evolutionary and ecological knowledge.
Losses of biodiversity can impose substantial costs at local and national scales. For example, the collapse of the Newfound-land cod fishery in the early 1990s cost tens of thousands of jobs, as well as at least $2 billion in income support and retraining. Recent evidence suggests that the preservation of the integrity of local biological communities, both in terms of the identity and the number of species, is important for the maintenance of plant and animal productivity, soil fertility, and their stability in the face of a changing environment (C11). Recent estimates from the MA Portugal sub-global assessment indicate that environ-mental expenses in that country are increasing at a rate of 3% a year and are presently 0.7% of GDP (SG-Portugal).
Trade-offs among Biodiversity, Ecosystem Services, and Human Well-beingWhen society has multiple goals, many of which depend on biodiversity, ecosystem services, and the many constituents of well-being, difficult decisions involving trade-offs among com-peting goals have to be made. The value of ecosystem services lost to human society, in the long term, may greatly exceed the short-term economic benefits that are gained from transforma-tive activities. In Sri Lanka, for example, the clearing of tropical forest for agriculture initially reduced the habitat for forest-adapted anopheline mosquito vectors of malaria. But in due course, other vector species occupied the changed habitat, con-tributing to the resurgence of malaria (SG3).
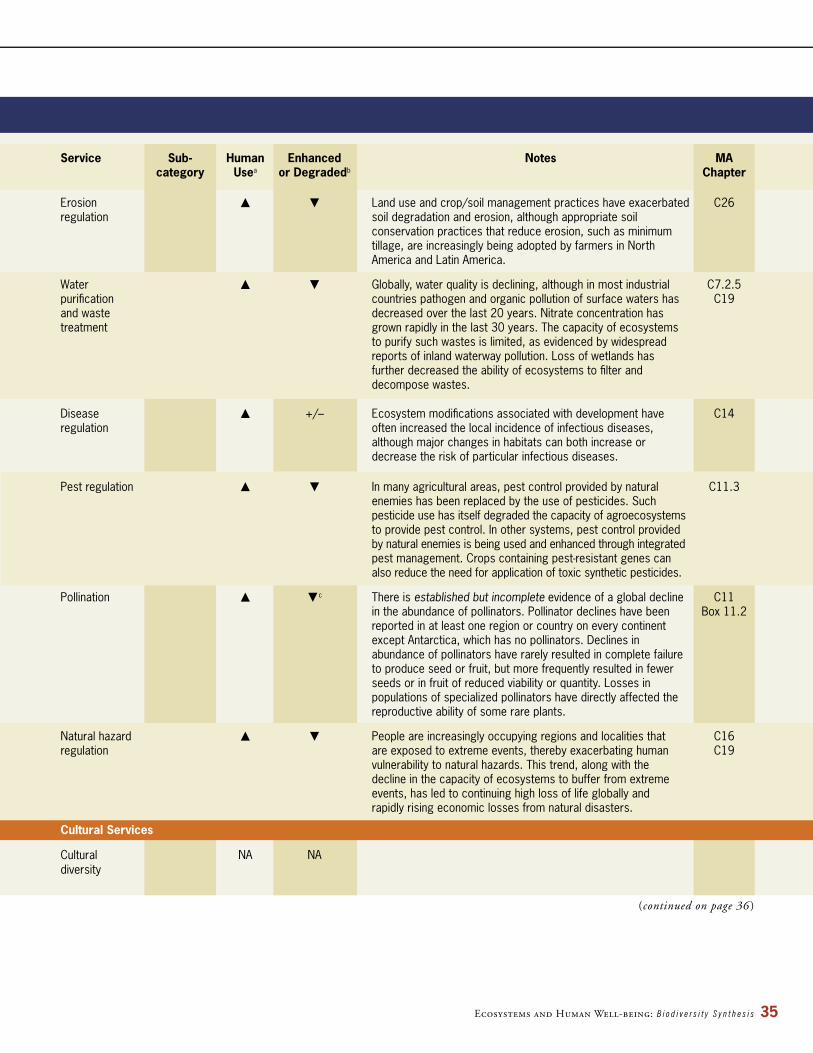
Many of the changes in biodiversity and ecosystems have been made to enhance the production of specific ecosys-tem services such as food production. But only 4 of the 24 ecosystem services examined in this assessment have been enhanced: crops, livestock, aquaculture, and (in recent decades) carbon sequestration, while 15 services have been degraded. (See Table 2.2.) The degraded services include cap-ture fisheries, timber production, water supply, waste treatment
(continued on page 37)

Ecosystems and Human Well-being: B i o d i v e r s i t y S y n t h e s i s 33
(continued on page 34 )
Table 2.2. Trends in the Human Use of Ecosystem Services and Enhancement or Degradation of the Service around the Year 2000 (See page 37 for legend.)
Service Sub- Human Enhanced Notes MA category Usea or Degradedb Chapter
Provisioning Services
Food Crops Food provision has grown faster than overall population growth. C8.2 Primary source of growth from increase in production per unit area but also significant expansion in cropland. Still persistent areas of low productivity and more rapid area expansion, e.g., sub-Saharan Africa and parts of Latin America.
Livestock Significant increase in area devoted to livestock in some regions, C7 but major source of growth has been more intensive, confined production of chicken, pigs, and cattle.
Capture Marine fish harvest increased until the late 1980s and has C18 fisheries been declining since then. Currently, one quarter of marine fish C8.2.2 stocks are overexploited or significantly depleted. Freshwater C19 capture fisheries have also declined. Human use of capture fisheries as declined because of the reduced supply, not because of reduced demand.
Aquaculture Aquaculture has become a globally significant source of food in C8 the last 50 years and, in 2000, contributed 27% of total fish Table 8.4 production. Use of fish feed for carnivorous aquaculture species places an additional burden on capture fisheries.
Wild plant NA Provision of these food sources is generally declining as 8.3.1 and animal natural habitats worldwide are under increasing pressure products and as wild populations are exploited for food, particularly by the poor, at unsustainable levels.
Fiber Timber +/– Global timber production has increased by 60% in the last four C9.ES decades. Plantations provide an increasing volume of harvested C21.1 roundwood, amounting to 35% of the global harvest in 2000. Roughly 40% of forest area has been lost during the industrial era, and forests continue to be lost in many regions (thus the service is degraded in those regions), although forest is now recovering in some temperate countries and thus this service has been enhanced (from this lower baseline) in these regions in recent decades.
Cotton, +/– +/– Cotton and silk production have doubled and tripled C9.ES hemp, silk respectively in the last four decades. Production of other agricultural fibers has declined.
Wood fuel +/– Global consumption of fuelwood appears to have peaked in the C9.ES 1990s and is now believed to be slowly declining but remains the dominant source of domestic fuel in some regions.
Genetic Traditional crop breeding has relied on a relatively narrow range C26.2.1 resources of germplasm for the major crop species, although molecular genetics and biotechnology provide new tools to quantify and expand genetic diversity in these crops. Use of genetic resources also is growing in connection with new industries based on biotechnology. Genetic resources have been lost through the loss of traditional cultivars of crop species (due in part to the adoption of modern farming practices and varieties) and through species extinctions.

Ecosystems and Human Well-being: B i o d i v e r s i t y S y n t h e s i s34
Service Sub- Human Enhanced Notes MA category Usea or Degradedb Chapter
Biochemicals, Demand for biochemicals and new pharmaceuticals is growing, C10 natural but new synthetic technologies compete with natural products to medicines, and meet the demand. For many other natural products (cosmetics, pharmaceuticals personal care, bioremediation, biomonitoring, ecological restoration), use is growing. Species extinction and overharvesting of medicinal plants is diminishing the availability of these resources.
Ornamental NA NA resources
Fresh water Human modification of ecosystems (e.g., reservoir creation) has C7 stabilized a substantial fraction of continental river flow, making more fresh water available to people but in dry regions reducing river flows through open water evaporation and support to irrigation that also loses substantial quantities of water. Watershed management and vegetation changes have also had an impact on seasonal river flows. From 5% to possibly 25% of global freshwater use exceeds long-term accessible supplies and requires supplies either through engineered water transfers or overdraft of groundwater supplies. Between 15% and 35% of irrigation withdrawals exceed supply rates. Fresh water flowing in rivers also provides a service in the form of energy that is exploited through hydropower. The construction of dams has not changed the amount of energy, but it has made the energy more available to people. The installed hydroelectric capacity doubled between 1960 and 2000. Pollution and biodiversity loss are defining features of modern inland water systems in many populated parts of the world.
Regulating Services
Air quality The ability of the atmosphere to cleanse itself of pollutants has C13.ES regulation declined slightly since preindustrial times but likely not by more than 10%. The net contribution of ecosystems to this change is not known. Ecosystems are also a sink for tropospheric ozone, ammonia, NOX, SO2, particulates, and CH4, but changes in these sinks were not assessed.
Climate Global Terrestrial ecosystems were on average a net source of CO2 C13.ES regulation during the nineteenth and early twentieth century and became a net sink sometime around the middle of the last century. The biophysical effect of historical land cover changes (1750 to present) is net cooling on a global scale due to increased albedo, partially offsetting the warming effect of associated carbon emissions from land cover change over much of that period.
Regional Changes in land cover have affected regional and local climates C13.3 and local both positively and negatively, but there is a preponderance of C11.3 negative impacts. For example, tropical deforestation and desertification have tended to reduce local rainfall.
Water regulation +/– The effect of ecosystem change on the timing and magnitude of C7.4.4 runoff, flooding, and aquifer recharge depends on the ecosystem involved and on the specific modifications made to the ecosystem.
Table 2.2. Trends in the Human Use of Ecosystem Services and Enhancement or Degradation of the Service around the Year 2000 (See page 37 for legend.) (continued)
Ecosystems and Human Well-being: B i o d i v e r s i t y S y n t h e s i s 35
(continued on page 36 )
Service Sub- Human Enhanced Notes MA category Usea or Degradedb Chapter
Erosion Land use and crop/soil management practices have exacerbated C26 regulation soil degradation and erosion, although appropriate soil conservation practices that reduce erosion, such as minimum tillage, are increasingly being adopted by farmers in North America and Latin America.
Water Globally, water quality is declining, although in most industrial C7.2.5 purification countries pathogen and organic pollution of surface waters has C19 and waste decreased over the last 20 years. Nitrate concentration has treatment grown rapidly in the last 30 years. The capacity of ecosystems to purify such wastes is limited, as evidenced by widespread reports of inland waterway pollution. Loss of wetlands has further decreased the ability of ecosystems to filter and decompose wastes.
Disease +/– Ecosystem modifications associated with development have C14 regulation often increased the local incidence of infectious diseases, although major changes in habitats can both increase or decrease the risk of particular infectious diseases.
Pest regulation In many agricultural areas, pest control provided by natural C11.3 enemies has been replaced by the use of pesticides. Such pesticide use has itself degraded the capacity of agroecosystems to provide pest control. In other systems, pest control provided by natural enemies is being used and enhanced through integrated pest management. Crops containing pest-resistant genes can also reduce the need for application of toxic synthetic pesticides.
Pollination c There is established but incomplete evidence of a global decline C11 in the abundance of pollinators. Pollinator declines have been Box 11.2 reported in at least one region or country on every continent except Antarctica, which has no pollinators. Declines in abundance of pollinators have rarely resulted in complete failure to produce seed or fruit, but more frequently resulted in fewer seeds or in fruit of reduced viability or quantity. Losses in populations of specialized pollinators have directly affected the reproductive ability of some rare plants.
Natural hazard People are increasingly occupying regions and localities that C16 regulation are exposed to extreme events, thereby exacerbating human C19 vulnerability to natural hazards. This trend, along with the decline in the capacity of ecosystems to buffer from extreme events, has led to continuing high loss of life globally and rapidly rising economic losses from natural disasters.
Cultural Services
Cultural NA NA diversity
Ecosystems and Human Well-being: B i o d i v e r s i t y S y n t h e s i s36
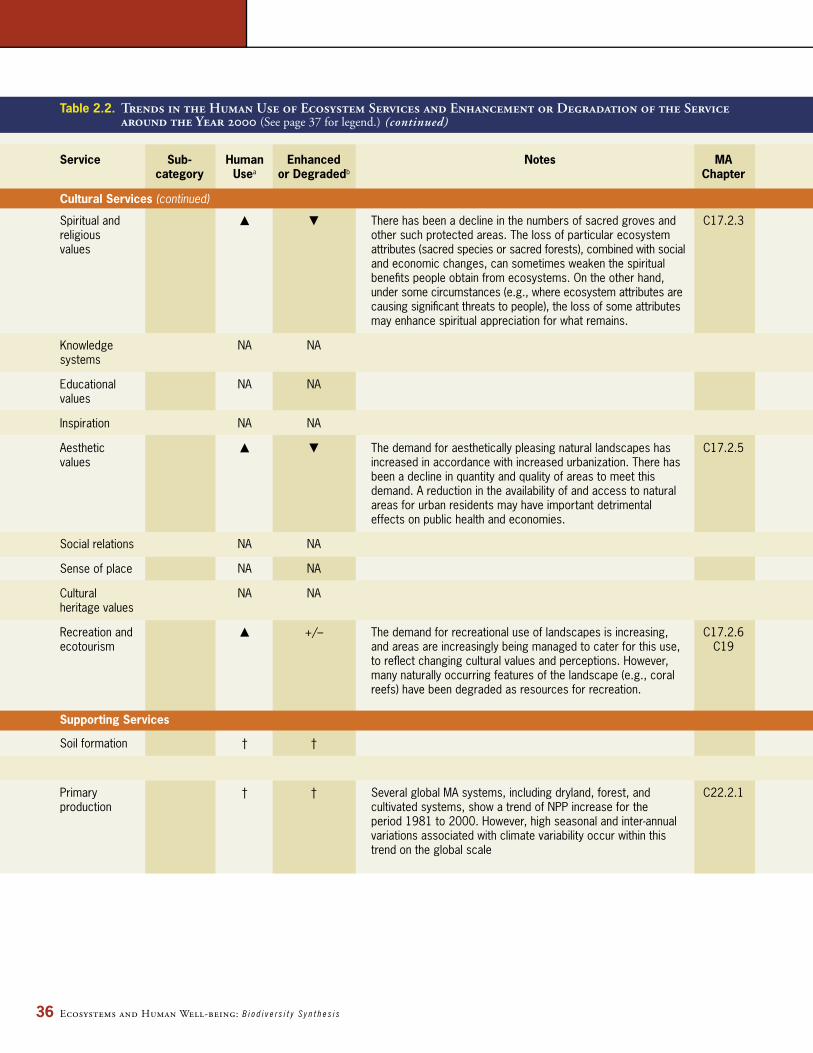
Table 2.2. Trends in the Human Use of Ecosystem Services and Enhancement or Degradation of the Service around the Year 2000 (See page 37 for legend.) (continued)
Service Sub- Human Enhanced Notes MA category Usea or Degradedb Chapter
Cultural Services (continued)
Spiritual and There has been a decline in the numbers of sacred groves and C17.2.3 religious other such protected areas. The loss of particular ecosystem values attributes (sacred species or sacred forests), combined with social and economic changes, can sometimes weaken the spiritual benefits people obtain from ecosystems. On the other hand, under some circumstances (e.g., where ecosystem attributes are causing significant threats to people), the loss of some attributes may enhance spiritual appreciation for what remains.
Knowledge NA NA systems
Educational NA NA values
Inspiration NA NA
Aesthetic The demand for aesthetically pleasing natural landscapes has C17.2.5 values increased in accordance with increased urbanization. There has been a decline in quantity and quality of areas to meet this demand. A reduction in the availability of and access to natural areas for urban residents may have important detrimental effects on public health and economies.
Social relations NA NA
Sense of place NA NA
Cultural NA NA heritage values
Recreation and +/– The demand for recreational use of landscapes is increasing, C17.2.6 ecotourism and areas are increasingly being managed to cater for this use, C19 to reflect changing cultural values and perceptions. However, many naturally occurring features of the landscape (e.g., coral reefs) have been degraded as resources for recreation.
Supporting Services
Soil formation † †
Photosynthesis † †
Primary † † Several global MA systems, including dryland, forest, and C22.2.1 production cultivated systems, show a trend of NPP increase for the period 1981 to 2000. However, high seasonal and inter-annual variations associated with climate variability occur within this trend on the global scale
Ecosystems and Human Well-being: B i o d i v e r s i t y S y n t h e s i s 37
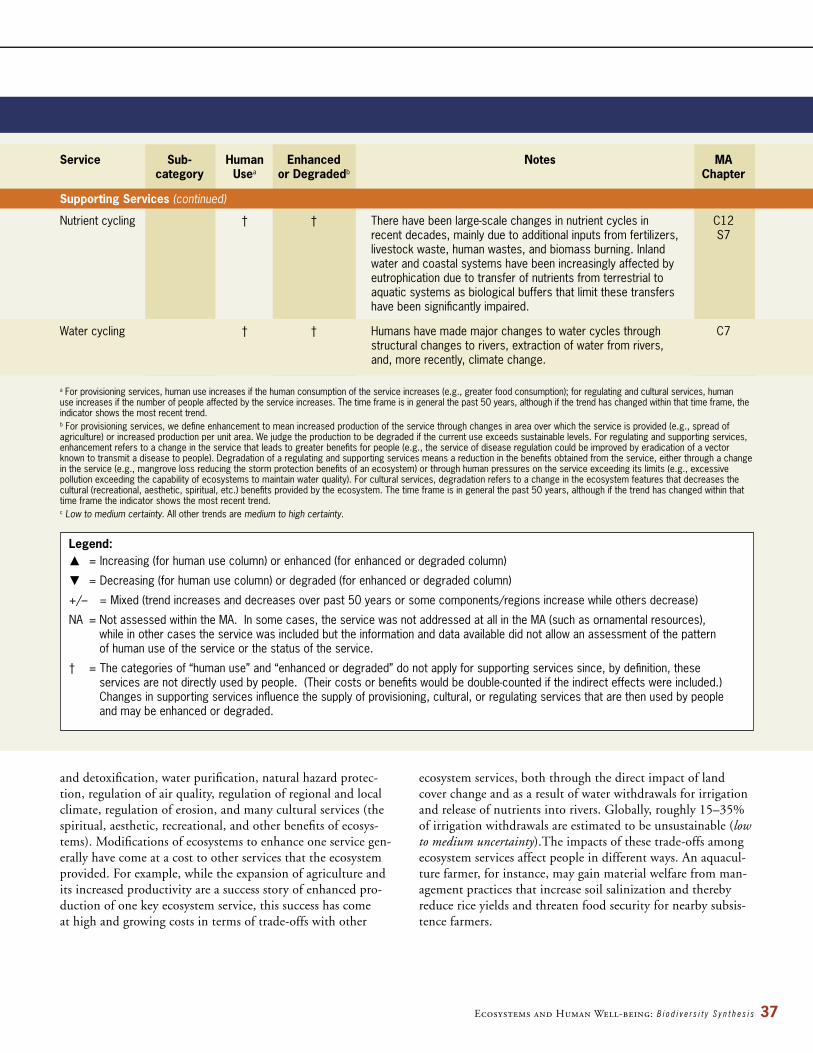
and detoxification, water purification, natural hazard protec-tion, regulation of air quality, regulation of regional and local climate, regulation of erosion, and many cultural services (the spiritual, aesthetic, recreational, and other benefits of ecosys-tems). Modifications of ecosystems to enhance one service gen-erally have come at a cost to other services that the ecosystem provided. For example, while the expansion of agriculture and its increased productivity are a success story of enhanced pro-duction of one key ecosystem service, this success has come at high and growing costs in terms of trade-offs with other
ecosystem services, both through the direct impact of land cover change and as a result of water withdrawals for irrigation and release of nutrients into rivers. Globally, roughly 15–35% of irrigation withdrawals are estimated to be unsustainable (low to medium uncertainty).The impacts of these trade-offs among ecosystem services affect people in different ways. An aquacul-ture farmer, for instance, may gain material welfare from man-agement practices that increase soil salinization and thereby reduce rice yields and threaten food security for nearby subsis-tence farmers.
Service Sub- Human Enhanced Notes MA category Usea or Degradedb Chapter
Supporting Services (continued)
Nutrient cycling † † There have been large-scale changes in nutrient cycles in C12 recent decades, mainly due to additional inputs from fertilizers, S7 livestock waste, human wastes, and biomass burning. Inland water and coastal systems have been increasingly affected by eutrophication due to transfer of nutrients from terrestrial to aquatic systems as biological buffers that limit these transfers have been significantly impaired.
Water cycling † † Humans have made major changes to water cycles through C7 structural changes to rivers, extraction of water from rivers, and, more recently, climate change.
a For provisioning services, human use increases if the human consumption of the service increases (e.g., greater food consumption); for regulating and cultural services, human use increases if the number of people affected by the service increases. The time frame is in general the past 50 years, although if the trend has changed within that time frame, the indicator shows the most recent trend.b For provisioning services, we define enhancement to mean increased production of the service through changes in area over which the service is provided (e.g., spread of agriculture) or increased production per unit area. We judge the production to be degraded if the current use exceeds sustainable levels. For regulating and supporting services, enhancement refers to a change in the service that leads to greater benefits for people (e.g., the service of disease regulation could be improved by eradication of a vector known to transmit a disease to people). Degradation of a regulating and supporting services means a reduction in the benefits obtained from the service, either through a change in the service (e.g., mangrove loss reducing the storm protection benefits of an ecosystem) or through human pressures on the service exceeding its limits (e.g., excessive pollution exceeding the capability of ecosystems to maintain water quality). For cultural services, degradation refers to a change in the ecosystem features that decreases the cultural (recreational, aesthetic, spiritual, etc.) benefits provided by the ecosystem. The time frame is in general the past 50 years, although if the trend has changed within that time frame the indicator shows the most recent trend.c Low to medium certainty. All other trends are medium to high certainty.
Legend: = Increasing (for human use column) or enhanced (for enhanced or degraded column)
= Decreasing (for human use column) or degraded (for enhanced or degraded column)
+/– = Mixed (trend increases and decreases over past 50 years or some components/regions increase while others decrease)
NA = Not assessed within the MA. In some cases, the service was not addressed at all in the MA (such as ornamental resources), while in other cases the service was included but the information and data available did not allow an assessment of the pattern of human use of the service or the status of the service.
† = The categories of “human use” and “enhanced or degraded” do not apply for supporting services since, by definition, these services are not directly used by people. (Their costs or benefits would be double-counted if the indirect effects were included.) Changes in supporting services influence the supply of provisioning, cultural, or regulating services that are then used by people and may be enhanced or degraded.

Ecosystems and Human Well-being: B i o d i v e r s i t y S y n t h e s i s38
Trade-off analysis aided by qualitative and quantitative values for biodiversity and ecosystem services can help decision-makers make intelligent decisions among competing goals (R17). (See Figure 2.1.) Such analysis can identify management strategies that generate efficient outcomes in which it is not possible to increase one objective without decreasing another. Second, it can show the extent to which current decisions are inefficient and help identify opportunities for improving the status quo. Third, it illustrates the nature of the trade-offs between goals once the effi-ciency frontier has been reached.
Values of Biodiversity and Ecosystem Services for Human Well-beingThe importance of biodiversity and natural processes in pro-ducing ecosystem services that people depend on is not cap-tured in financial markets. Unlike goods bought and sold in markets, many ecosystem services do not have markets or readily observable prices. However, lack of a price does not mean lack of value. A substantial body of research on nonmarket valuation is now available for some ecosystem services, including clean drink-ing water, recreation, or commercially harvested species. Exis-
tence value of species and other “non-use” values pose a greater challenge to those who would try to measure the complete value of conserving biodiversity and natural processes. The fact that ecosystems are dynamic and complex, as well as the fact that human preferences change through time, also present difficulties for attempts to value natural systems. Combinations of irrevers-ible actions, such as species extinction, and uncertainty give rise to option value (such as the value of maintaining flexibility, keep-ing options open, until uncertainty is resolved). Though clear in theory, getting reasonable estimates of option value is difficult in practice (C2.3). Better quantification of the benefits derived from ecosystems would provide greater impetus for biodiversity protection and create a more transparent picture of the equitabil-ity of the distribution of benefits.
Private and social values of conserving biodiversity and natu-ral systems often differ widely. The private use value of biodiver-sity and ecosystem services by individuals will typically ignore the “external” benefits of conservation that accrue to society in general. For example, a farmer may benefit from intensive use of the land but generally does not bear all the consequences caused by leaching of excess nutrients and pesticides into ground or surface water, or the consequences of loss of habitat for native species. If private decision-makers are not given the incentives to value the larger social benefits of conservation, their decisions will often result in inadequate conservation (C5.4).
The indirect values of biodiversity conservation can be highly significant in comparison with the direct economic values derived from a particular area. (See Box 2.2.) In existing eco-nomic studies of changes to biodiversity in specific locations (such as the conversion of mangrove forests, degradation of coral reefs, and clear-felling of forests), the costs of ecosystem conver-sion are often found to be significant and sometimes exceed the benefits of the habitat conversion. Despite this, in a number of these cases conversion was promoted because the value of the lost ecosystem services—the indirect value of biodiversity conserva-tion—was not internalized. In other instances, subsidies dis-torted the relative costs and benefits and provided the incentives to destroy biodiversity (C5).
The depletion and degradation of many ecosystem services represents the loss of a capital asset that is poorly reflected in conventional indicators of economic growth or growth in human well-being (C2.3.5). A country could cut its forests and deplete its fisheries, and this would show only as a positive gain to GDP, despite the loss of the capital asset. (GDP measures the flow of economic benefits from the use of these resources, but the depletion of the capital asset is not reflected.) Moreover, many ecosystem services are available freely to those who use them (fresh water in aquifers, for instance, and the use of the atmo-sphere as a sink for pollutants) and so again their degradation is
Figure 2.1. Efficiency Frontier Analysis of Species Persistence and Economic Returns
The production possibility shows feasible combinations of species persistence and economic returns for a sample landscape based on the Willamette Basin in Oregon in the United States. The Figure shows results for 97 terrestrial vertebrates found in the basin and economic returns from agriculture and forestry production. Each land parcel can be put into a biological reserve, agriculture, or forestry. The land use pattern determines the value of economic returns from agriculture and forestry production and the pattern of habitat. For each species, persistence depends on the extent and pattern of suitable habitat (R17).

Ecosystems and Human Well-being: B i o d i v e r s i t y S y n t h e s i s 39
Box 2.2. Economic Costs and Benefits of Ecosystem Conversion (C5 Box 5.2)
Relatively few studies have compared the total economic value of ecosystems under alternate management regimes. The results of several that attempted to do so are shown in the Figure. In each case where the total economic value of sustainable management practices was compared with management regimes involving conversion of the ecosystem or unsustainable prac-tices, the benefit of managing the ecosys-tem more sustainably exceeded that of the converted ecosystem even though the pri-vate benefits—that is, the actual monetary benefits captured from the services enter-ing the market—would favor conversion or unsustainable management. These stud-ies are consistent with the understanding that market failures associated with eco-system services lead to greater conversion of ecosystems than is economically justi-fied. However, this finding would not hold at all locations. For example, the value of con-version of an ecosystem in areas of prime agricultural land or in urban regions often exceeds the total economic value of the intact ecosystem (although even in dense urban areas, the TEV of maintaining some “green space” can be greater than develop-ment of these sites) (C5).
■ Conversion of tropical forest to small-scale agriculture or plantations (Mount Cam-eroon, Cameroon). Maintenance of the forest with low-impact logging provided social bene-fits (NWFPs, sedimentation control, and flood prevention) and global benefits (carbon stor-age plus option, bequest, and existence val-ues) across the five study sites totaling some $3,400 per hectare. Conversion to small-scale agriculture yielded the greatest private benefits (food production), of about $2,000 per hectare. Across four of the sites, con-version to oil palm and rubber plantations resulted in average net costs (negative ben-efits) of $1,000 per hectare. Private bene-fits from cash crops were only realized in this case because of market distortions.
■ Conversion of a mangrove system to aquaculture (Thailand). Although conver-sion for aquaculture made sense in terms of short-term private benefits, it did not once external costs were factored in. The global benefits of carbon sequestration were con-
sidered to be similar in intact and degraded systems. However, the substantial social ben-efits associated with the original mangrove cover—from timber, charcoal, NWFPs, off-shore fisheries, and storm protection—fell to almost zero following conversion. Summing all measured goods and services, the TEV of intact mangroves was a minimum of $1,000 and possibly as high as $36,000 per hect-are, compared with the TEV of shrimp farm-ing, which was about $200 per hectare.
■ Draining freshwater marshes for agricul-ture (Canada). Draining freshwater marshes in one of Canada’s most productive agri-cultural areas yielded net private benefits in large part because of substantial drain-age subsidies. However, the social benefits of retaining wetlands arising from sustain-able hunting, angling, and trapping greatly exceeded agricultural gains. Consequently, for all three marsh types considered, TEV was on average $5,800 per hectare, com-
pared with $2,400 per hectare for con-verted wetlands.
■ Use of forests for commercial timber extraction (Cambodia). Use of forest areas for swidden agriculture and extraction of non-wood forest products (including fuel-wood, rattan and bamboo, wildlife, malva nuts, and medicine) as well as ecological and environmental functions such as water-shed, biodiversity, and carbon storage pro-vided a TEV ranging of $1,300–4,500 per hectare (environmental services accounted for $590 of that while NWFPs provided $700–3,900 per hectare). However, the pri-vate benefits associated with unsustainable timber harvest practices exceeded private benefits of NWFP collection. Private bene-fits for timber harvest ranged from $400 to $1,700 per hectare, but after accounting for lost services the total benefits were from $150 to $1,100 per hectare, significantly less than the TEV of more sustainable uses.
Economic Benefits under Alternate Management Practices
Ecosystems and Human Well-being: B i o d i v e r s i t y S y n t h e s i s40
not reflected in standard economic measures. When changes to these natural capital assets are factored into measures of the inclusive wealth of nations, they significantly change the balance sheet for countries with economies largely dependent on natural resources. Some countries that appeared to have positive growth in the 1970s and 1980s, for example, actually experienced a net loss of capital assets, effectively undermining the sustainability of any gains they may have achieved.
The Distributional Impacts of Biodiversity Loss and Ecosystem Change
Biodiversity use, change, and loss have improved well-being for many social groups and individuals. But people with low resilience to ecosystem changes—mainly the disadvantaged—have been the biggest losers and witnessed the biggest increase in not only monetary poverty but also relative, temporary poverty and the depth of poverty (C5, C6, R17). See Box 2.3 for a description of various types of poverty.
Many communities depend on a range of biological prod-ucts for their material welfare. In addition, the transfer of ownership or use rights to ecosystem services like timber, fish-ing, and mining to privileged groups by governments have also excluded local communities from the use of these ecosystem services (R8). Provisions for ensuring the equitable distribu-tion of monetary benefits from the use of biological products are an issue of major concern. Even in cases where equitable provisioning has been made, implementation is being impaired by weak and ineffective institutions (C10).
Poor people have historically disproportionately lost access to biological products and ecosystem services as demand for those services has grown. Coastal habitats are often converted to other uses, frequently for aquaculture ponds or cage cultur-ing of highly valued species such as shrimp and salmon. Despite the fact that the area is still used for food production, local residents are often displaced from their fishing grounds, and the fish produced are usually not for local consumption but for export. Coastal residents often no longer have access to cheap protein or sources of income (C18). The development of shrimp aquaculture has displaced local fishers who are not able to enter the capital- and technology-intensive shrimp fisheries (SG3). Food security and overall well-being is much better in situations where local communities—with particular focus on the poor and the disadvantaged—were involved and made partners in the access, use, and management of biodiversity.
Changes in the equity structure of societies can have impacts on ecosystem services. Differential access to resources may also help to explain why some people living in environmental resource-rich areas nevertheless rank low in measures of human well-being. For example, economic lib-eralization in Viet Nam resulted in the development of a class of entrepreneurs with markedly greater access to capital. The poorer fishers were unable to enter the capital and technology-intensive shrimp fishery that developed. Furthermore, the ecological changes precipitated by the expansion of shrimp aquaculture reduced the capacity of the ecosystem to support the traditional fish stocks, further exacerbating the inequity (SG3.7).
The increase in international trade of biological products has improved the well-being for many social groups and indi-viduals, especially in countries with well-developed markets and trade rules and among people in developing countries who have access to the biological products. However, many groups have not benefited from such trade. Some people who live near and are dependent on biodiversity-rich areas have experienced a drop in their well-being rather than an increase. Examples include the many indigenous groups and local com-munities who have relied on these products and the ecosystem services they support for many of the constituents of well-
Box 2.3. Concepts and Measures of Poverty
Relative poverty is the state of deprivation defined by social stan-dards. It is fixed by a contrast with others in the society who are not considered poor. Poverty is then seen as lack of equal opportuni-ties. It is based on subjective measures of poverty.
Depth of poverty is a measure of the average income gap of the poor in relation to a certain threshold. It defines how poor the poor are. It gives the amount of resources needed to bring all poor peo-ple to the poverty-line level.
Temporary poverty is characterized by a short-term deprivation, usually seasonal, of water or food.
Monetary poverty is an insufficiency of income or monetary resources. Most indicators like the U.S. dollar a day indicator or national poverty lines are defined in those terms.
Multidimensional poverty is conceived as a group of irreducible deprivations that cannot be adequately expressed as income insuf-ficiency. It combines basic constituents of well-being in a composite measure, such as the Human Poverty Index.
Other characteristics of poverty commonly used in the literature include rural and urban poverty, extreme poverty (or destitution), female poverty (to indicate gender discrimination), and food-ratio poverty lines (with calorie-income elasticities). Other indices such as the FGT (Foster, Greer, and Thorbecke) or the Sen Index, which combine both dimensions of incidence and depth of poverty, are also widely used. The type of poverty experienced by individuals will therefore differ for different rates and levels of biodiversity and ecosystem services loss and if the loss is transitory or permanent.

Ecosystems and Human Well-being: B i o d i v e r s i t y S y n t h e s i s 41
being. Weak and inefficient institutional structures that over-see the equitable distribution of benefits are key reasons for the inequitable distribution of benefits at the national and local levels. In addition, structural adjustment programs played a key role in pushing the poor further into destitution and forc-ing many to have no choice but to further stress ecosystem ser-vices (R17).
Conflicts between competing social groups or individuals over access to and use of biological products and ecosystem services have contributed to declines in well-being for some groups and improvements for others. Sometimes different social groups have a conflict over how a given bundle of eco-system services or biological products ought to be used and shared. Although many such conflicts have been managed cooperatively, it is also common for one group to impose its preferred outcome on the others, leading to an improvement in well-being for one group at the expense of others. For example, if mountain communities convert forests into agri-cultural lands, they may reduce downstream water quality. When ecosystem change is linked to well-being change through this highly complex structure of interdependencies, there are both winners and losers. Some groups improve and other groups decline (C6). Box 2.4 describes some con-flicts that emerged in Chile over the mining industry and local communities.
One of the main reasons some countries, social groups, or individuals—especially the disadvantaged—are more severely affected by biodiversity and ecosystem changes is limited access to substitutes or alternatives. When the qual-ity of water deteriorates, the rich have the resources to buy personal water filters or imported bottled water that the poor can ill afford. Similarly, urban populations in developing countries have easier access to clean energy sources because of easy access to the electrical grid, while rural communities have fewer choices. Poor farmers often do not have the option of substituting modern methods for services provided by biodi-versity because they cannot afford the alternatives. And, sub-stitution of some services may not be sustainable, and may have negative environmental and human health effects. For example, the reliance on toxic and persistent pesticides to control certain pests can have negative effects on the provision of services by the cultivated system and other ecosystems con-nected to the cultivated system (C.26.2). Many industrial countries maintain seed banks in response to the rapid rate of loss of crop genetic diversity and to make existing genetic diversity more readily available to plant breeders. Apart from
the network of seed banks maintained in developing countries by the Consultative Group on International Agricultural Research, for many developing countries creating such banks could pose a problem when electricity supplies are unreliable, fuel is costly, and there is a lack of human capacity (R17).
Place-based or micro-level data and not macro-level or aggregated data provide more useful information to identify disadvantaged communities being affected by biodiversity and ecosystem changes. Most poverty statistics are only available at an aggregate level. These tend to hide pockets of poverty existing sometimes within traditionally defined “wealthy” regions or provinces. Therefore, using aggregate data to understand and establish links between biodiversity loss, ecosystem changes, and well-being can be quite mislead-ing (C5).
Box 2.4. Conflicts Between the Mining Sector and Local Communities in Chile
The Salar de Atacama, Chile, is a salty wetland within the driest desert in the world. Surface water is limited. The present major concern is over groundwater usage and the extent to which the exploitation is sustainable. The economic activities in this region include mining, agriculture, and tourism, all of which depend on the quantity and quality of available water. The Salar de Atacama holds over 40% of world lithium reserves; mining provides 12% of local employment and two thirds of the regional GDP. It also consumes 65% of the water used in the region. Tourism is the second larg-est source of employment and income, and tourist facilities need fresh water. Local communities rely on water for subsistence agri-culture and livestock raising. Most subsistence farmers do not have enough resources to buy water rights when bidding against the mining companies. Hence the shortage of water is generating major conflicts over access and ownership rights among compet-ing users (SG.SDM).