20-f asml 2016 · as of january 1, 2016, asml early adopted the amendment to asc 740 “income...
TRANSCRIPT

Financial Statements

Index to Financial Statements
F-2 Consolidated Statements of Operations
F-3 Consolidated Statements of Comprehensive Income
F-4 Consolidated Balance Sheets
F-5 Consolidated Statements of Shareholders’ Equity
F-7 Consolidated Statements of Cash Flows
F-9 Notes to the Consolidated Financial Statements
????? Report of Independent Registered Public Accounting Firm
ASML ANNUAL REPORT 2016 F-1

Consolidated Statements of Operations
Year ended December 31 2014 2015 2016
Notes (in thousands, except per share data) EUR EUR EUR
20 Net system sales 4,242,790 4,237,183 4,571,118
Net service and field option sales 1,613,487 2,050,192 2,223,634
20 Total net sales 5,856,277 6,287,375 6,794,752
Cost of system sales (2,335,512) (2,212,965) (2,389,160)
Cost of service and field option sales (924,391) (1,178,666) (1,361,112)
21 Total cost of sales (3,259,903) (3,391,631) (3,750,272)
Gross profit 2,596,374 2,895,744 3,044,480
27 Other income 81,006 83,200 93,777
21, 22 Research and development costs (1,074,035) (1,068,077) (1,105,763)
21 Selling, general and administrative costs (321,110) (345,732) (374,760)
Income from operations 1,282,235 1,565,135 1,657,734
23 Interest and other, net (8,600) (16,515) 33,644
Income before income taxes 1,273,635 1,548,620 1,691,378
19 Provision for income taxes (76,995) (161,446) (219,484)
Net income 1,196,640 1,387,174 1,471,894
1 Basic net income per ordinary share 2.74 3.22 3.46
1 Diluted net income per ordinary share 1 2.72 3.21 3.44
Number of ordinary shares used in computing per share amounts
1 Basic 437,142 430,639 425,598
1 Diluted 1 439,693 432,644 427,684
1. The calculation of diluted net income per ordinary share assumes the exercise of options issued under our stock option plans and the issuance of shares under ourshare plans for periods in which exercises or issuances would have a dilutive effect. The calculation of diluted net income per ordinary share does not assumeexercise of such options or issuance of shares when such exercises or issuance would be anti-dilutive.
ASML ANNUAL REPORT 2016 F-2

Consolidated Statements of Comprehensive Income
Year ended December 31 2014 2015 2016
Notes (in thousands) EUR EUR EUR
Net income 1,196,640 1,387,174 1,471,894
Other comprehensive income:
Foreign currency translation, net of taxes:
Gain (loss) on foreign currency translation and effective portion of hedgeson net investments 230,388 272,427 120,452
Financial instruments, net of taxes:
4 Gain (loss) on derivative financial instruments 17,375 9,872 5,990
4 Transfers to net income 6,691 (21,995) 2,410
Other comprehensive income, net of taxes 254,454 260,304 128,852
Total comprehensive income, net of taxes 1,451,094 1,647,478 1,600,746
Attributable to equity holders 1,451,094 1,647,478 1,600,746
ASML ANNUAL REPORT 2016 F-3

Consolidated Balance Sheets
As of December 31 2015 2016
Notes (in thousands, except share and per share data) EUR EUR
Assets5 Cash and cash equivalents 2,458,717 2,906,8685 Short-term investments 950,000 1,150,0006 Accounts receivable, net 803,696 700,2067 Finance receivables, net 280,523 447,38419 Current tax assets 19,080 11,6228 Inventories, net 2,573,730 2,780,87819 Deferred tax assets 1 133,131 —9 Other assets 488,824 560,471
Total current assets 7,707,701 8,557,429
7 Finance receivables, net 124,036 117,23219 Deferred tax assets 1 29,012 34,9409 Other assets 450,882 612,30510 Goodwill 2,624,552 4,873,89411 Other intangible assets, net 738,170 1,322,92412 Property, plant and equipment, net 1,620,678 1,687,237
Total non-current assets 5,587,330 8,648,532
Total assets 13,295,031 17,205,961
Liabilities and shareholders’ equityAccounts payable 527,894 593,197
13 Accrued and other liabilities 2,566,593 2,236,01219 Current tax liabilities 3,654 201,93014 Current portion of long-term debt 4,211 247,672
Provisions 2,441 1,78519 Deferred tax liabilities 1 2,379 —
Total current liabilities 3,107,172 3,280,596
14 Long-term debt 1,125,474 3,071,79319 Deferred and other tax liabilities 1 256,740 396,837
Provisions 2,445 20,52413 Accrued and other liabilities 414,369 615,730
Total non-current liabilities 1,799,028 4,104,884
Total liabilities 4,906,200 7,385,480
16, 18 Commitments and contingencies — —
Cumulative Preference Shares; EUR 0.09 nominal value;700,000,000 shares authorized at December 31, 2016 and 2015;none issued and outstanding per December 31, 2016 and 2015 — —
Ordinary Shares B; EUR 0.01 nominal value;9,000 shares authorized at December 31, 2016 and 2015
none issued and outstanding per December 31, 2016 and 2015 — —
Ordinary shares; EUR 0.09 nominal value;699,999,000 shares authorized at December 31, 2016;
429,941,232 issued and outstanding at December 31, 2016;699,999,000 shares authorized at December 31, 2015;
427,986,682 issued and outstanding at December 31, 2015;Issued and outstanding shares 38,786 39,391
Share premium 3,070,332 3,693,587Treasury shares at cost (476,922) (796,173)
Retained earnings 5,284,315 6,282,504Accumulated other comprehensive income 472,320 601,172
25 Total shareholders’ equity 8,388,831 9,820,481
Total liabilities and shareholders’ equity 13,295,031 17,205,961
1. As of January 1, 2016, ASML early adopted the amendment to ASC 740 “Income taxes (Topic 740): Balance Sheet Classification of Deferred Taxes”, which requiresthat deferred tax liabilities and assets are classified as non-current in the consolidated balance sheets. The comparative figures have not been adjusted to reflect thischange in accounting policy.
ASML ANNUAL REPORT 2016 F-4
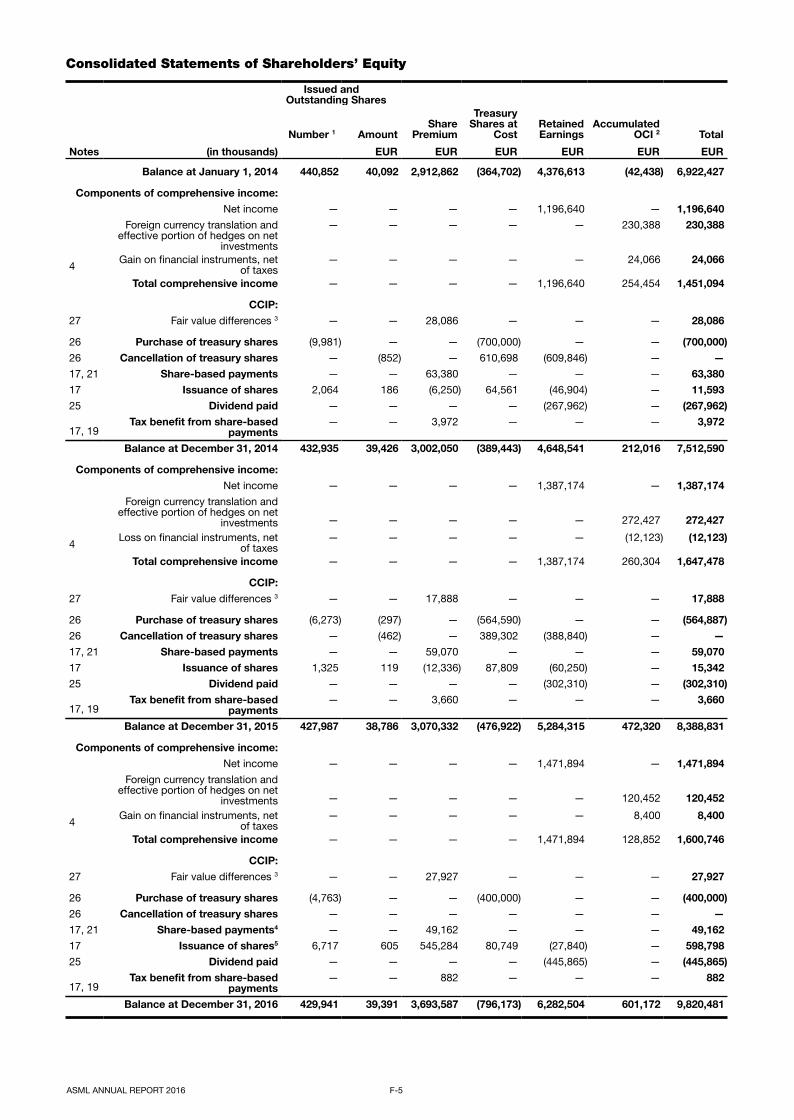
Consolidated Statements of Shareholders’ Equity
Issued andOutstanding Shares
Number 1 AmountShare
Premium
TreasuryShares at
CostRetainedEarnings
AccumulatedOCI 2 Total
Notes (in thousands) EUR EUR EUR EUR EUR EUR
Balance at January 1, 2014 440,852 40,092 2,912,862 (364,702) 4,376,613 (42,438) 6,922,427
Components of comprehensive income:Net income — — — — 1,196,640 — 1,196,640
Foreign currency translation andeffective portion of hedges on net
investments
— — — — — 230,388 230,388
4Gain on financial instruments, net
of taxes— — — — — 24,066 24,066
Total comprehensive income — — — — 1,196,640 254,454 1,451,094
CCIP:27 Fair value differences 3 — — 28,086 — — — 28,086
26 Purchase of treasury shares (9,981) — — (700,000) — — (700,000)26 Cancellation of treasury shares — (852) — 610,698 (609,846) — —17, 21 Share-based payments — — 63,380 — — — 63,38017 Issuance of shares 2,064 186 (6,250) 64,561 (46,904) — 11,59325 Dividend paid — — — — (267,962) — (267,962)
17, 19Tax benefit from share-based
payments— — 3,972 — — — 3,972
Balance at December 31, 2014 432,935 39,426 3,002,050 (389,443) 4,648,541 212,016 7,512,590
Components of comprehensive income:Net income — — — — 1,387,174 — 1,387,174
Foreign currency translation andeffective portion of hedges on net
investments — — — — — 272,427 272,427
4Loss on financial instruments, net
of taxes— — — — — (12,123) (12,123)
Total comprehensive income — — — — 1,387,174 260,304 1,647,478
CCIP:27 Fair value differences 3 — — 17,888 — — — 17,888
26 Purchase of treasury shares (6,273) (297) — (564,590) — — (564,887)26 Cancellation of treasury shares — (462) — 389,302 (388,840) — —17, 21 Share-based payments — — 59,070 — — — 59,07017 Issuance of shares 1,325 119 (12,336) 87,809 (60,250) — 15,34225 Dividend paid — — — — (302,310) — (302,310)
17, 19Tax benefit from share-based
payments— — 3,660 — — — 3,660
Balance at December 31, 2015 427,987 38,786 3,070,332 (476,922) 5,284,315 472,320 8,388,831
Components of comprehensive income:Net income — — — — 1,471,894 — 1,471,894
Foreign currency translation andeffective portion of hedges on net
investments — — — — — 120,452 120,452
4Gain on financial instruments, net
of taxes— — — — — 8,400 8,400
Total comprehensive income — — — — 1,471,894 128,852 1,600,746
CCIP:27 Fair value differences 3 — — 27,927 — — — 27,927
26 Purchase of treasury shares (4,763) — — (400,000) — — (400,000)26 Cancellation of treasury shares — — — — — — —17, 21 Share-based payments4 — — 49,162 — — — 49,16217 Issuance of shares5 6,717 605 545,284 80,749 (27,840) — 598,79825 Dividend paid — — — — (445,865) — (445,865)
17, 19Tax benefit from share-based
payments— — 882 — — — 882
Balance at December 31, 2016 429,941 39,391 3,693,587 (796,173) 6,282,504 601,172 9,820,481
ASML ANNUAL REPORT 2016 F-5

1. As of December 31, 2016, the number of issued shares was 439,199,514. This includes the number of issued and outstanding shares of 429,941,232 and the numberof treasury shares of 9,258,282. As of December 31, 2015, the number of issued shares was 433,332,573. This includes the number of issued and outstanding sharesof 427,986,682 and the number of treasury shares of 5,345,891. As of December 31, 2014, the number of issued shares was 438,073,643. This includes the numberof issued and outstanding shares of 432,935,288 and the number of treasury shares of 5,138,355.
2. As of December 31, 2016, accumulated OCI, net of taxes, consists of EUR 593.1 million relating to foreign currency translation gain (2015: EUR 472.6 million gain;2014: EUR 200.1 million gain) and EUR 8.1 million relating to unrealized gains on financial instruments (2015: EUR 0.3 million losses; 2014: EUR 11.9 million gains).
3. In 2016, EUR 27.9 million (2015: EUR 17.9 million; 2014: EUR 28.1 million) is recognized to increase equity to the fair value of the shares issued to the ParticipatingCustomers in the CCIP. The portion of the NRE funding allocable to the shares is recognized over the NRE Funding Agreements period (2013-2017).
4. Share-based payments include an amount of EUR 1.5 million in relation to the fair value compensation of unvested equity awards exchanged as part of theacquisition of HMI.
5. Issuance of shares includes 5,866,001 ordinary shares issued in relation to the acquisition of HMI for a total fair value of EUR 580.6 million.
ASML ANNUAL REPORT 2016 F-6

Consolidated Statements of Cash Flows
Year ended December 31 2014 2015 2016
Notes (in thousands) EUR EUR EUR
Cash Flows from Operating Activities
Net income 1,196,640 1,387,174 1,471,894
Adjustments to reconcile net income to net cash flows from operating activities:
9, 11, 12, 14 Depreciation and amortization 1 254,644 296,884 356,928
10, 11, 12 Impairment 10,528 2,287 3,466
12 Loss on disposal of property, plant and equipment 2 3,502 1,630 5,233
17, 21 Share-based payments 63,380 59,070 47,701
6 Allowance for doubtful receivables 133 3,870 3,161
8 Allowance for obsolete inventory 162,821 211,801 73,035
19 Deferred income taxes (59,050) 45,349 (580)
Changes in assets and liabilities:
6 Accounts receivable (164,850) 243,097 187,427
7 Finance receivables 51,132 (145,278) (156,140)
8 Inventories 2,3 (293,404) (87,777) (43,662)
9 Other assets (112,424) (146,272) (152,905)
13 Accrued and other liabilities 36,524 235,446 (273,930)
Accounts payable (136,192) (77,090) 50,917
19 Current income taxes 11,822 (4,611) 93,361
Net cash provided by operating activities 1,025,206 2,025,580 1,665,906
Cash Flows from Investing Activities
12 Purchase of property, plant and equipment 3 (358,280) (371,770) (316,338)
11 Purchase of intangible assets (2,952) (1,108) (8,384)
5 Purchase of short-term investments (504,756) (950,000) (2,520,000)
5 Maturity of short-term investments 849,776 334,864 2,320,000
Cash from (used for) derivative financial instruments — (171,899) (15,034)
Loans issued and other investments — — (7,427)
2 Acquisition of subsidiaries (net of cash acquired) — — (2,641,295)
Net cash used in investing activities (16,212) (1,159,913) (3,188,478)
Cash Flows from Financing Activities
25 Dividend paid (267,962) (302,310) (445,865)
25, 26 Purchase of treasury shares (700,000) (564,887) (400,000)
2 Net proceeds from issuance of shares 39,679 33,230 582,742 4
14 Net proceeds from issuance of notes — — 2,230,619 5
14 Repayment of debt (4,128) (3,639) (4,739)
17, 19 Tax benefit (deficit) from share-based payments 3,972 3,660 882
Net cash from (used in) financing activities (928,439) (833,946) 1,963,639
Net cash flows 80,555 31,721 441,067
Effect of changes in exchange rates on cash 8,238 7,509 7,084
Net increase in cash and cash equivalents 88,793 39,230 448,151
5 Cash and cash equivalents at beginning of the year 2,330,694 2,419,487 2,458,717
5 Cash and cash equivalents at end of the year 2,419,487 2,458,717 2,906,868
Supplemental Disclosures of Cash Flow Information:
Interest and other paid (42,439) (43,710) (55,688)
Income taxes paid (124,325) (126,908) (115,856)
ASML ANNUAL REPORT 2016 F-7

1. In 2016, depreciation and amortization includes EUR 290.8 million of depreciation of property, plant and equipment (2015: EUR 243.0 million, 2014: EUR 209.5million), EUR 63.5 million of amortization of intangible assets (2015: EUR 51.2 million, 2014: EUR 43.9 million) and EUR 2.6 million of amortization of underwritingcommissions and discount related to the bonds and credit facility (2015: EUR 2.7 million, 2014: EUR 1.2 million).
2. In 2016, an amount of EUR 22.8 million (2015: EUR 72.7 million, 2014: EUR 30.7 million) of the disposal of property, plant and equipment relates to non-cashtransfers to inventory. Since the transfers between inventory and property, plant and equipment are non-cash events, these are not reflected in these ConsolidatedStatements of Cash Flows. For further details see Note 12.
3. In 2016, an amount of EUR 21.6 million (2015: EUR 91.0 million, 2014: EUR 95.5 million) of the additions in property, plant and equipment relates to non-cashtransfers from inventory. Since the transfers between inventory and property, plant and equipment are non-cash events, these are not reflected in these ConsolidatedStatements of Cash Flows. For further details see Note 12.
4. Net proceeds from issuance of shares includes an amount of EUR 536.6 million which is included in the consideration transfered for the acquisition of HMI. Forfurther details see Note 2.
5. Net proceeds from issuance of notes relate to the total cash proceeds of EUR 2,230.6 million (net of incurred transaction costs) from the issuance of our EUR 500million 0.625 percent senior notes due 2022, our EUR 1,000 million 1.375 percent senior notes due 2026 and our EUR 750 million 1.625 percent senior notes due2027.
ASML ANNUAL REPORT 2016 F-8

Notes to the Consolidated Financial Statements
ASML ANNUAL REPORT 2016 F-9
1. General Information / Summary of Significant Accounting PoliciesASML, with its corporate headquarters in Veldhoven, the Netherlands, is engaged in the development, production, marketing,selling and servicing of advanced semiconductor equipment systems, exclusively consisting of lithography systems. ASML’sprincipal operations are in the Netherlands, the US and Asia.
Our shares are listed for trading in the form of registered shares on NASDAQ and on Euronext Amsterdam. The principal tradingmarket of our ordinary shares is Euronext Amsterdam.
Basis of Preparation The accompanying Consolidated Financial Statements are stated in thousands of EUR unless indicated otherwise.
The accompanying Consolidated Financial Statements have been prepared in conformity with US GAAP. We have reclassifiedcertain prior period amounts to conform to current period presentation.
Use of Estimates The preparation of our Consolidated Financial Statements in conformity with US GAAP requires management to make estimatesand assumptions that affect the reported amounts of assets and liabilities and the disclosure of contingent assets and liabilities onthe balance sheet dates, and the reported amounts of net sales and costs during the reported periods. Actual results could differfrom those estimates. We evaluate our estimates continuously and we base our estimates on historical experience and on variousother assumptions that we believe to be reasonable under the circumstances. Actual results may differ from these estimates if theassumptions prove incorrect. To the extent there are material differences between actual results and these estimates, our futureresults could be materially and adversely affected. We believe that the accounting policies described below require us to makesignificant judgments and estimates in the preparation of our Financial Statements. Our most critical accounting estimates include:
• Revenue Recognition; • Business Combinations; • Inventories; • Income Taxes;• Contingencies and Litigation; and• Evaluation of Long-lived Assets for Impairment.
Principles of Consolidation The Consolidated Financial Statements include the Financial Statements of ASML Holding N.V. and all of its subsidiaries and theVIE of which ASML is the primary beneficiary. All intercompany profits, balances and transactions have been eliminated in theconsolidation.
Subsidiaries Subsidiaries are all entities over which ASML has the control to govern financial and operating policies generally accompanying ashareholding of more than 50 percent of the outstanding voting rights. As from the date that these criteria are met, the financialdata of the relevant subsidiaries are included in the consolidation.
Business Combinations Acquisitions of subsidiaries are included on the basis of the acquisition method. The cost of acquisition is measured based on theconsideration transferred at fair value, the fair value of identifiable assets distributed and the fair value of liabilities incurred orassumed at the acquisition date (i.e., the date which we obtain control). The excess of the costs of an acquired subsidiary over thenet of the amounts assigned to identifiable assets acquired and liabilities incurred or assumed, is capitalized as goodwill.Acquisition-related costs are expensed when incurred in the period they arise or the service is received.
Variable Interest Entities We assess whether we have a controlling financial interest in any VIE and, thus whether we are the VIE’s primary beneficiary. Weconsolidate a VIE when we have a variable interest that provides us with a controlling financial interest. We are deemed to have acontrolling financial interest in a VIE if both of the following characteristics are met: a) the power to direct the activities of a VIE thatmost significantly impact the VIE‘s economic performance and b) the obligation to absorb losses of the VIE that could potentiallybe significant to the VIE or the right to receive benefits from the VIE that could potentially be significant to the VIE.
Foreign Currency TranslationThe financial information for subsidiaries outside the euro-zone is generally measured using local currencies as the functionalcurrency. The Financial Statements of those foreign subsidiaries are translated into euros in the preparation of ASML’sConsolidated Financial Statements. Assets and liabilities are translated into euros at the exchange rate on the respective balancesheet dates. Income and costs are translated into euros based on the average exchange rate for the corresponding period. Theresulting translation adjustments are recorded directly in shareholders’ equity.
Derivative Financial Instruments We use derivative financial instruments for the management of foreign currency risks and interest rate risks. We measure allderivative financial instruments based on fair values derived from market prices of the instruments. We adopt hedge accounting forhedges that are highly effective in offsetting the identified hedged risks taking into account required effectiveness criteria.
Derivatives are initially recognized at fair value on the date a derivative contract is entered into and are subsequently remeasured.The method of recognizing the resulting gain or loss depends on whether the derivative is designated as a hedging instrument, andif so, the nature of the item being hedged. We designate certain derivatives as either: • A hedge of the exposure to changes in the fair value of a recognized asset or liability, that is attributable to a particular risk (fair
value hedge); • A hedge of the exposure to variability in the cash flows of a recognized asset or liability, or of a forecasted transaction, that is
attributable to a particular risk (cash flow hedge); or • A hedge of the foreign currency exposure of a net investment in a foreign operation (net investment hedge).
We document at the inception of the transaction the relationship between hedging instruments and hedged items, as well as ourrisk management objectives and strategy for undertaking various hedging transactions. We also document our assessment, both athedge inception and on an ongoing basis, of whether derivatives that are used in hedging transactions are highly effective inoffsetting changes in fair values or cash flows of hedged items.
Fair Value Hedge Changes in the fair value of a derivative financial instrument, that is designated and qualified as a fair value hedge, along with thegain or loss on the hedged asset or liability that is attributable to the hedged risk, are recorded in the Consolidated Statements ofOperations.
Hedge accounting is discontinued when we revoke the hedging relationship, the hedging instrument expires or is sold, terminatedor exercised, or no longer qualifies for hedge accounting. The adjustment to the carrying amount of the hedged item arising fromthe hedged risk is amortized to the Consolidated Statements of Operations from that date.
Interest rate swaps that are being used to hedge the fair value of fixed loan coupons payable are designated as fair value hedges.The change in fair value is intended to offset the change in the fair value of the underlying fixed loan coupons, which is recordedaccordingly. The gain or loss relating to the ineffective portion of interest rate swaps hedging fixed loan coupons payable isrecognized in the Consolidated Statements of Operations as interest and other, net.
Cash Flow Hedge Changes in the fair value of a derivative that is designated and qualified as a cash flow hedge are recorded in OCI, net of taxes,until the underlying hedged transaction is recognized in the Consolidated Statements of Operations. In the event that the underlyinghedge transaction will not occur within the specified time period, the gain or loss on the related cash flow hedge is released fromOCI and included in the Consolidated Statements of Operations, unless extenuating circumstances exist that are related to thenature of the forecasted transaction and are outside our control or influence and which cause the forecasted transaction to beprobable of occurring on a date that is beyond the specified time period.
Foreign currency hedging instruments that are being used to hedge cash flows related to forecasted sales or purchase transactionsin non-functional currencies are designated as cash flow hedges. The gain or loss relating to the ineffective portion of the foreigncurrency hedging instruments is recognized in the Consolidated Statements of Operations in net sales or cost of sales.
Interest rate swaps that are being used to hedge changes in the variability of future interest cash flows to certain of our operatinglease obligations are designated as cash flow hedges. The changes in fair value of the derivatives are intended to offset changes infuture interest cash flows of such operating lease obligations. The gain or loss relating to the ineffective portion of interest rateswaps hedging the variability of future interest cash flows is recognized in the Consolidated Statements of Operations as interestand other, net.
Net Investment Hedge Foreign currency hedging instruments that are being used to hedge changes in the value of a net investment are designated as netinvestment hedges. Changes in the fair value of a derivative that is designated and qualifies as a net investment hedge arerecorded in other comprehensive income. The gain or loss relating to the ineffective portion is recognized in the ConsolidatedStatements of Operations as interest and other, net. Gains and losses accumulated in other comprehensive income are recognizedin the Consolidated Statements of Operations when the foreign operation is (partially) disposed or sold.
Cash and Cash Equivalents Cash and cash equivalents consist primarily of highly liquid investments, such as bank deposits, money market funds and interest-bearing bank accounts with insignificant interest rate risk and remaining maturities of 3 months or less at the date of acquisition.
ASML ANNUAL REPORT 2016 F-10

Short-term Investments Investments with remaining maturities longer than 3 months and less than 1 year at the date of acquisition are presented as short-term investments. Gains and losses other than impairments, interest income and foreign exchange results, are recognized in OCIuntil the short-term investments are derecognized. Upon derecognition, the cumulative gain or loss recognized in OCI, isrecognized in the Consolidated Statements of Operations.
Accounts Receivable Accounts receivable are measured at fair value and are subsequently measured at amortized cost using the effective interest ratemethod, less allowance for doubtful debts.
Inventories Inventories are stated at the lower of cost (applying the first-in, first-out method) or market value. Cost includes net prices paid formaterials purchased, charges for freight and customs duties, production labor cost and factory overhead. Allowances are made forslow-moving, obsolete or unsellable inventory.
Allowances for inventory are determined based on the expected demand which is derived from sales forecasts, technicalobsolescence as well as the expected market value of the inventory.
Intangible Assets Goodwill Goodwill represents the excess of the costs of an acquisition over the fair value of the amounts assigned to assets acquired andliabilities incurred or assumed of the acquired subsidiary at the date of acquisition. Goodwill on acquisition of subsidiaries isallocated to RUs for the purpose of impairment testing. The allocation is made to those RUs that are expected to benefit from thebusiness combination in which the goodwill arose. Goodwill is tested for impairment annually at the start of the fourth quarter andwhenever events or changes in circumstances indicate that the carrying amount of the goodwill may not be recoverable. Goodwillis stated at cost less accumulated impairment losses.
Other Intangible Assets Other intangible assets include brands, intellectual property, developed technology, customer relationships, and other intangibleassets. Other intangible assets are stated at cost, less accumulated amortization and accumulated impairment losses (for theamount exceeding goodwill). Amortization is calculated using the straight-line method based on the estimated useful lives of theassets. The following table presents the estimated useful lives of our finite-lived other intangible assets:
Category Estimated useful life
Brands 20 years
Intellectual property 3 - 10 years
Developed technology 6 - 15 years
Customer relationships 8 - 18 years
Other 2 - 6 years
Property, Plant and Equipment Property, plant and equipment are stated at cost, less accumulated depreciation and accumulated impairment losses. Costs ofassets manufactured by ASML include direct manufacturing costs, production overhead and interest costs incurred for qualifyingassets during the construction period. Depreciation is calculated using the straight-line method based on the estimated useful livesof the related assets. In the case of leasehold improvements, the estimated useful lives of the related assets do not exceed theremaining term of the corresponding lease.
The following table presents the estimated useful lives of our property, plant and equipment:
Category Estimated useful life
Buildings and constructions 5 - 45 years
Machinery and equipment 2 - 5 years
Leasehold improvements 5 - 10 years
Furniture, fixtures and other equipment 3 - 5 years
Land is not depreciated.
ASML ANNUAL REPORT 2016 F-11
Evaluation of Long-lived Assets for Impairment Long-lived assets include goodwill, other intangible assets and property, plant and equipment.
Goodwill is tested for impairment annually at the start of the fourth quarter and whenever events or changes in circumstancesindicate that the carrying amount of the goodwill may not be recoverable. These events or circumstances could include asignificant change in the business climate, legal factors, operating performance indicators, competition, or sale or disposition of asignificant portion of a RU. This test is based on a two-step approach for each RU (being an operating segment or one level belowan operating segment) in which goodwill has been recorded. To determine whether it is necessary to perform this two-stepapproach we may first assess qualitative factors. If we determine that it is more likely than not (a likelihood of more than 50 percent)that the fair value of a RU is less than its carrying amount (including goodwill), the two-step impairment test is performed. In thefirst step, the recoverability of goodwill is tested by comparing the carrying amount of the RU including goodwill with the fair valueof the RU. If the carrying amount of the RU is higher than the fair value of the RU, the second step should be performed. Goodwillimpairment is measured as the excess of the carrying amount of the goodwill over its implied fair value. The implied fair value ofgoodwill is determined by calculating the fair value of the various assets and liabilities included in the RU in the same manner asgoodwill is determined in a business combination. Any excess of the carrying amount over the implied fair value is recognized as animpairment loss.
Indefinite-lived other intangible assets are tested for impairment annually at the start of the fourth quarter and whenever events orchanges in circumstances indicate that the carrying amount of the indefinite-lived other intangible assets may not be recoverable.To determine whether it is necessary to perform a quantitative test, we may first assess qualitative factors. If we determine that it ismore likely than not (a likelihood of more than 50 percent) that the fair value of the asset is less than its carrying amount, thequantitative test is performed. We have an unconditional option to bypass the qualitative assessment for any indefinite-livedintangible asset in any period and proceed directly to performing the quantitative impairment test. The quantitative impairment testfor indefinite-lived other intangible assets consists of a comparison of the fair value of these assets with their carrying amounts.Any excess of the carrying amount over the fair value is recognized as an impairment loss.
Finite-lived other intangible assets and property, plant and equipment are reviewed for impairment whenever events or changes incircumstances indicate that the carrying amount of those assets may not be recoverable. An impairment loss is recognized only ifthe carrying amount of finite-lived other intangible assets and property, plant and equipment is not recoverable and exceeds its fairvalue. The carrying amount is not recoverable if it exceeds the sum of the (un)discounted forecasted cash flows to result from theuse and eventual disposition of such asset. An impairment loss is measured as the amount by which the carrying amount exceedsits fair value.
In determining the fair value of long-lived assets, we make estimates about future cash flows. These estimates are based on ourstrategic plan updated with the latest available projections of the semiconductor industry and our income and cost expectations,which are consistent with the plans and estimates that we use to manage our business. We also make estimates and assumptionsconcerning our WACC. It is possible that actual results may differ from our plans, estimates and assumptions. Future adversechanges in market conditions may also require impairment of certain long-lived assets, which could have a material adverse effecton our financial condition and results of operations.
Revenue Recognition ASML recognizes revenue when all four revenue recognition criteria are met: persuasive evidence of an arrangement exists; deliveryhas occurred or services have been rendered; seller‘s price to buyer is fixed or determinable; and collectability is reasonablyassured. At ASML this policy generally results in revenue recognition from the sale of a system upon shipment. The revenue fromthe installation of a system is generally recognized upon completion of that installation at the customer site. Prior to shipment,systems undergo a FAT in our cleanroom facilities, effectively replicating the operating conditions that will be present on thecustomer’s site, in order to verify whether the system will meet its standard specifications and any additional technical andperformance criteria agreed with the customer. A system is shipped, and revenue is recognized, only after all contractualspecifications are met or discrepancies from agreed-upon specifications are waived and customer sign-off is received foracceptance. In case not all specifications are met and the remaining performance obligation is not essential to the functionality ofthe system but is substantive rather than inconsequential or perfunctory, a portion of the sales price is deferred. When theremaining obligation is essential to the functionality of the delivered system, all revenue is deferred. Although each system’sperformance is re-tested upon installation at the customer’s site, we have never failed to successfully complete installation of asystem at a customer’s premises.
In connection with the introduction of new technology, we initially defer revenue recognition until acceptance of the new technologybased system or field option and completion of installation at the customer’s premises. As our systems are based largely on twoproduct platforms that permit incremental, modular upgrades, the introduction of genuinely "new" technology occurs infrequently,and in the past 16 years, has occurred on only two occasions: 2000 (TWINSCAN) and 2010 (EUV).
ASML ANNUAL REPORT 2016 F-12

We have no significant repurchase commitments in our general sales terms and conditions. From time to time we repurchasesystems that we have manufactured and sold and, following refurbishment, we resell those systems to other customers. Thisrepurchase decision is mainly driven by market demand expressed by other customers and less frequently by explicit or implicitcontractual arrangements relating to the initial sale. We consider reasonable offers from any vendor, including customers, torepurchase used systems so that we can refurbish, resell, and install these systems as part of our normal business operations.Once repurchased, the repurchase price of the used system is recorded in work-in-process inventory during the period it is beingrefurbished, following which the refurbished system is reflected in finished products inventory until it is sold to the customer. As ofDecember 31, 2016 and 2015, ASML had no repurchase commitments.
We offer customers discounts in the normal course of sales negotiations. These discounts are directly deducted from the grosssales price at the moment of revenue recognition. From time to time, we offer free or discounted products or services (awardcredits) to our customers as part of a volume purchase agreement. In some instances these volume discounts can be used topurchase field options (system enhancements) and services. The related amount is recorded as a reduction in net sales at time ofsystem shipment. The sales transaction that gives rise to these award credits is accounted for as a multiple element salestransaction as the agreements involve the delivery of multiple products. The consideration received from the sales transaction isallocated between the award credits and the other elements of the sales transaction. The consideration allocated to the awardcredits is recognized as deferred revenue until award credits are delivered to the customer and earned. The amount allocable to adelivered item is limited to the amount that is not contingent upon the delivery of additional items or meeting other specifiedperformance conditions (the non-contingent amount).
Net sales are recognized excluding the taxes levied on sales (net basis).
For certain contracts and constructive obligations on which a loss is evident, we recognize the anticipated loss to the extent thecosts of completing these contracts and constructive obligations exceed the amount of the contract price. When we satisfy theseobligations, we utilize the related liability.
Multiple-Element Arrangements The main portion of our net sales is derived from contractual arrangements with our customers that have multiple deliverables(elements), which mainly include the sale of our systems, installation and training services and extended and enhanced (optic)warranty contracts. The requirements for establishing separate units of accounting in a multiple element arrangement require thatthe allocation of arrangement consideration to each deliverable is based on the relative selling price of the deliverable.
Each element in the arrangement is accounted for as a separate unit of accounting provided the following criteria are met: i) thedelivered products or services have value to the customer on a standalone basis; and ii) for an arrangement that includes a generalright of return relative to the delivered products or services, delivery or performance of the undelivered product or service isconsidered probable and is substantially controlled by us. We consider a deliverable to have stand-alone value if the product orservice is sold separately by us or another vendor or could be resold by the customer. Further, our sales arrangements do notinclude a general right of return relative to the delivered products. Where the aforementioned criteria for a separate unit ofaccounting are not met, the deliverable is combined with the undelivered element(s) and treated as a single unit of accounting forthe purposes of allocation of the arrangement consideration and revenue recognition.
The hierarchy of evidence to determine a selling price in ASC 605-25 is as follows: • VSOE – The price at which we sell the element in a separate stand-alone transaction; • TPE – Evidence from us or other companies of the value of a largely interchangeable element in a transaction; • BESP – Our best estimate of the selling price of an element in the transaction.
To determine the selling price in multiple element arrangements, we establish VSOE of the selling price for installation, trainingservices and extended and enhanced (optic) warranty contracts. VSOE for installation is determined based on the costs we have toincur for the installation increased by the average margin that we realize on billable labor and materials consumed in comparableservices (such as relocating a system to another customer site). VSOE for extended and enhanced (optic) warranty contracts isdetermined on the basis of equivalent products we sell on a standalone basis, such as full service contracts and billable lensswaps, and which are subject to normal price negotiations. Revenue from installation and training services is recognized when theservices are completed. Revenue from extended and enhanced (optic) warranty contracts is recognized over the term of thecontract. When we are unable to establish the selling price using VSOE or TPE, we use BESP. The objective of using bestestimated selling price-based methodology is to determine the price at which we would transact a sale if the product or servicewere sold on a stand-alone basis. Accordingly, we determine BESP considering several internal and external factors including, butnot limited to, pricing practices, gross margin objectives, market conditions, competitive environment, internal costs andgeographies.
For our NXE:3300B and NXE:3350B systems, we are unable to determine VSOE for installation, extended and enhanced (optic)warranty contracts. We determined for NXE:3300B and NXE:3350B systems that BESP is the appropriate reference in the fair valuehierarchy for installation, extended and enhanced (optic) warranty contracts. We review selling prices periodically and maintaininternal controls over the establishment and updates of these elements.
ASML ANNUAL REPORT 2016 F-13

Lease ArrangementsA lease is classified as a sales-type lease if any of the following lease classification criteria is met at its inception:
1. The lease transfers ownership of the property to the lessee by the end of the lease term; 2. The lease contains a bargain purchase option; 3. The lease term is equal to 75 percent or more of the estimated economic life of the leased property; or 4. The present value at the beginning of the lease term of the minimum lease payments, excluding that portion of the
payments representing executory costs such as insurance, maintenance, and taxes to be paid by the lessor, including anyprofit thereon, equals or exceeds 90 percent of the excess of the fair value of the leased property to the lessee at leaseinception over any related investment tax credit retained by the lessor and expected to be realized by the lessor.
Revenue is recognized at commencement of the lease term of a sales-type lease if the collectability of the minimum leasepayments is reasonably predictable an there are no uncertainties surrounding unreimbursable costs. The present value of the leasepayments is recognized as a finance receivable. The difference between the gross receivable and the present value of thereceivable is recognized as unearned interest in the Consolidated Statements of Operations.
A lease is classified as an operating lease if the lease classification criteria (as described above) are not met. If ASML has offered itscustomers an operating lease arrangement, the contract consideration is recognized in the Consolidated Statements of Operationson a straight-line basis over the period of the lease.
Warranty We provide standard warranty coverage on our systems for 12 months and on certain optic parts for 60 months, providing laborand parts necessary to repair systems during the warranty period. The estimated warranty costs are accounted for by accruingthese costs for each system upon recognition of the system sale. The estimated warranty costs are based on historical productperformance and service records. We calculate the charge of average service hours and parts per system to determine theestimated warranty costs. On a semi-annual basis, we assess, and update if necessary, our accounting estimates used to calculatethe standard warranty.
The extended and enhanced (optic) warranty on our systems is accounted for as a separate element of multiple element revenuerecognition transactions.
Customer Co-Investment Program In connection with the CCIP, we entered into investment agreements, shareholders agreements, NRE Funding Agreements and acommercial agreement with Participating Customers.
The investment agreements, shareholder agreements, NRE Funding Agreements and commercial agreement are accounted for as amultiple-element arrangement with each of the Participating Customers. Based upon ASC 605-25 Multiple-Element Arrangementsguidance, the following two separate elements are identified: (1) the share issuance (governed by the investment agreements andthe shareholder agreements) and (2) the NRE funding and commercial discounts and credits (governed by the NRE FundingAgreements and the commercial agreement with Intel).
The shares issued to the Participating Customers are recorded at fair value based on quoted share prices (EUR 3,977.4 million) withthe remaining aggregate arrangement consideration allocated to the NRE funding and commercial discounts and credits. Thedifference between the fair value of the shares and the subscription price of the shares (EUR 39.91) was recorded as a deductionfrom shareholders’ equity upon issuance of the shares (EUR 123.4 million). Shareholders’ equity is increased to the fair value of theshares as the portion of the NRE funding allocable to the shares is received over the NRE funding period (2013-2017). The amountsare deemed receivables from the Participating Customers in their capacity as shareholders of ASML.
A significant related party relationship exists between ASML and Intel as a result of the equity investment made by Intel as part ofthe CCIP. Based on the commercial discounts and credits (governed by the commercial agreement with Intel) and the significantrelated party relationship, all NRE funding from Intel will be deferred and recognized in the Consolidated Statement of Operationsonly when the commercial discounts and credits are earned.
In addition, see Other Income for further explanation on the accounting policies with respect to CCIP.
Accounting for Shipping and Handling Fees and Costs ASML bills the customer for, and recognizes as net sales, any charges for shipping and handling costs. The related costs arerecognized as cost of sales.
Cost of SalesCost of system sales and field option sales comprise direct product costs such as materials, labor, cost of warranty, depreciation,amortization, shipping and handling costs and related overhead costs.
Costs of service sales comprise direct service costs such as materials, labor, depreciation and overhead costs.
ASML ANNUAL REPORT 2016 F-14

Other Income The portion of the NRE funding from TSMC and Samsung not allocable to the shares issued to those Participating Customersunder the CCIP is recognized in other income when the R&D costs relating to lithography projects are recognized over the NREfunding period (2013-2017).
R&D Costs and CreditsCosts relating to R&D are charged to operating expenses as incurred. ASML receives subsidies and other grants from severalDutch and international (inter-)governmental institutes (‘government grants’). These government grants that cover R&D costsrelating to approved projects are recorded as R&D credits in the R&D costs in the Consolidated Statements of Operations.
Government grants are not recognized until there is reasonable assurance that ASML will comply with the conditions and that thegrants will be received.
Government grants that are received as compensation for expenses or losses already incurred, or for the purpose of givingimmediate financial support to ASML with no future related costs are recognized in the Consolidated Statements of Operations inthe period in which they become receivable.
Borrowing Costs Borrowing costs directly attributable to the acquisition, construction or production of qualifying assets, which are assets thatnecessarily take a substantial period of time to get ready for their intended use or sale, are added to the cost of those assets, untilsuch time that the assets are substantially ready for their intended use or sale.
Share-based Payments Compensation expenses in relation to share-based payments are recognized based upon the grant-date fair value of stock optionsand shares. The grant-date fair value of stock options is estimated using a Black-Scholes option valuation model. This Black-Scholes model requires the use of assumptions, including expected share price volatility, the estimated life of each award and theestimated dividend yield. The risk-free interest rate used in the model is determined, based on an index populated with euro-denominated European government agency bond with high credit ratings and with a life equal to the expected life of the equity-settled share-based payments. The grant-date fair value of shares is determined based on the closing price of our shares listed atEuronext Amsterdam on the grant-date.
The grant-date fair value of the equity-settled share-based payments is, based on the terms and conditions, expensed over thevesting period, based on our estimate of equity instruments that will eventually vest. At each balance sheet date, we revise ourestimate of the number of equity instruments expected to vest. The impact of the revision of the original estimates, if any, isrecognized in the Consolidated Statements of Operations in the period in which the revision is determined, with a correspondingadjustment to shareholders’ equity.
Income Taxes The asset and liability method is used in accounting for income taxes. Under this method, deferred tax assets and liabilities arerecognized for the tax effect of incurred net operating losses and for tax consequences attributable to differences between thebalance sheet carrying amounts of existing assets and liabilities and their respective tax bases. If it is more likely than not that thecarrying amounts of deferred tax assets will not be realized, a valuation allowance is recorded for the differences. Tax expenseincludes current taxes on profit as well as actual or potential withholding taxes on current and expected income from groupcompanies.
Deferred tax assets and liabilities are measured using enacted tax rates expected to apply to taxable income in the years in whichtemporary differences are expected to be recovered or settled. The effect on deferred tax assets and liabilities of a change in taxrates is recognized in the Consolidated Statements of Operations in the period that includes the enactment date.
We recognize liabilities for uncertain tax positions based on a two-step process. The first step is to evaluate the tax position forrecognition by determining if the weight of available evidence indicates that it is more likely than not that the position will besustained on audit, including resolution of related appeals or litigation processes, if any. The second step is to measure the taxbenefit as the largest amount that is more than 50 percent likely of being realized upon settlement. While we believe we haveappropriate support for the positions taken on our tax returns, we regularly assess the potential outcomes of examinations by taxauthorities in determining the adequacy of our provision for income taxes, and adjust the income tax provision, income taxespayable and deferred taxes in the period in which the facts that give rise to a revision become known.
ASML ANNUAL REPORT 2016 F-15

Contingencies and Litigation In connection with proceedings and claims, our management evaluates, based on the relevant facts and legal principles, thelikelihood of an unfavorable outcome and whether the amount of the loss can be reasonably estimated. In most cases,management determined that either a loss was not probable or was not reasonably estimable. Significant subjective judgmentswere required in these evaluations, including judgments regarding the validity of asserted claims and the likely outcome of legal andadministrative proceedings. The outcome of these proceedings, however, is subject to a number of factors beyond our control,most notably the uncertainty associated with predicting decisions by courts and administrative agencies. In addition, estimates ofthe potential costs associated with legal and administrative proceedings frequently cannot be subjected to any sensitivity analysis,as damage estimates or settlement offers by claimants may bear little or no relation to the eventual outcome. Finally, in anyparticular proceeding, we may agree to settle or to terminate a claim or proceeding in which we believe that it would ultimatelyprevail where we believe that doing so, when taken together with other relevant commercial considerations, is more cost-effectivethan engaging in an expensive and protracted litigation, the outcome of which is uncertain.
We accrue for legal costs related to litigation in our Consolidated Statements of Operations at the time when the related legalservices are actually provided.
Net Income per Ordinary ShareBasic net income per ordinary share is calculated by dividing net income by the weighted average number of ordinary sharesoutstanding for that period. The dilutive effect is calculated using the treasury stock method. Excluded from the diluted weightedaverage number of shares outstanding calculation are cumulative preference shares contingently issuable to the preference sharefoundation, since they represent a different class of stock than the ordinary shares.
The basic and diluted net income per ordinary share has been calculated as follows:
Year ended December 31 2014 2015 2016
(in thousands, except per share data) EUR EUR EUR
Net income 1,196,640 1,387,174 1,471,894
Weighted average number of shares outstanding 437,142 430,639 425,598
Basic net income per ordinary share 2.74 3.22 3.46
Weighted average number of shares outstanding 437,142 430,639 425,598
Plus shares applicable to
Options and conditional shares 2,551 2,005 2,086
Dilutive potential ordinary shares 2,551 2,005 2,086
Diluted weighted average number of shares 439,693 432,644 427,684
Diluted net income per ordinary share1
2.72 3.21 3.44
1. The calculation of diluted net income per ordinary share assumes the exercise of options issued under our stock option plans and the issuance of shares under ourshare plans for periods in which exercises or issuances would have a dilutive effect. The calculation of diluted net income per ordinary share does not assumeexercise of such options or issuance of shares when such exercises or issuance would be anti-dilutive.
Comprehensive Income Comprehensive income consists of net income and OCI.
OCI refers to gains and losses that are not included in net income (loss), but recorded directly in shareholders’ equity. For the yearsended December 31, 2016, 2015 and 2014 comprehensive income consists of net income, unrealized gains and losses on financialinstruments, being derivative financial instruments designated for cash flow hedge accounting, net of taxes, and unrealized gainsand losses on foreign currency translation and effective portion of hedges on net investments, net of taxes.
New US GAAP Accounting PronouncementsFor the below mentioned ASUs, issued in 2016 and up to the date of this report, the impact on our Financial Statements needs tobe assessed:
In March 2014, FASB issued ASU No. 2014-9 "Revenue From Contracts With Customers". In August 2015, the FASB amendedASU No. 2014-9 to defer the effective date by one year to annual reporting periods beginning after December 15, 2017 (ASU2015-14 "Revenue From Contracts With Customers (Topic 606): Deferral of the Effective Date" ). In March 2016, the FASBreleased ASU No. 2016-08 "Revenue from Contracts with Customers (Topic 606): Principal versus Agent Considerations (ReportingRevenue Gross versus Net)" which clarifies the implementation guidance on principal versus agent considerations. In April 2016,the FASB issued ASU No. 2016-10 "Revenue from Contracts with Customers (Topic 606)" which clarifies guidance related toidentifying performance obligations and licensing implementation guidance contained in the new revenue recognition standard. In
ASML ANNUAL REPORT 2016 F-16

May 2016 ASU No. 2016-12 "Revenue from Contracts with Customers (Topic 606) - Narrow-Scope Improvements and PracticalExpedients" was issued by the FASB which affects entities with transactions included within the scope of Topic 606. The scope ofthat Topic includes entities that enter into contracts with customers to transfer goods or services (that are an output of the entity’sordinary activities) in exchange for consideration.
The standard is a joint project of the FASB and the IASB, to clarify the principles for recognizing revenue and to develop a commonrevenue standard for US GAAP and IFRS that would:• Remove inconsistencies and weaknesses in previous revenue requirements;• Provide a more robust framework for addressing revenue issues;• Improve comparability of revenue recognition practices across entities, industries, jurisdictions and capital markets;• Provide more useful information to users of financial statements through improved disclosure requirements; and• Simplify the preparation of financial statements by reducing the number of requirements to which an entity must refer.
The new standard is effective for interim and annual periods beginning after December 15, 2017 and allows for either fullretrospective adoption or modified retrospective adoption. We have selected full retrospective adoption and will therefore restate allyears presented in our Consolidated Financial Statements upon adoption.
We are currently assessing the impact of adopting ASC 606 on our Consolidated Financial Statements, by assessing all contractsthat have an impact on net system sales and net service and field option sales over 2016. As our assessment of all contracts is notyet finalized we cannot quantify or identify all: • The impact on our net system sales and net service and field option sales over 2016; • Deviations from our current revenue recognition accounting policies; and• The potential impact of other significant matters.
In February 2016, FASB issued ASU No. 2016-2 " Leases (Topic 842)". The objective of this topic is to increase transparency andcomparability among organizations by recognizing lease assets and lease liabilities on the balance sheet and disclosing keyinformation about leasing arrangements by lessees. The new Standard is effective for fiscal years beginning after December 15,2018, including interim periods within those fiscal years and supersede the leases requirements in Topic 840, Leases. Earlyapplication is permitted for all entities as of the beginning of an interim or annual reporting period. We are currently in the processof determining the impact of implementing this Standard on our Consolidated Financial Statements.
ASU No. 2016-13 "Financial Instruments - Credit Losses (Topic 326)" was issued by the FASB in June 2016 and will providefinancial statement users with more decision-useful information about the expected credit losses on financial instruments and othercommitments to extend credit held by a reporting entity at each reporting date. The Update is effective for fiscal years beginningafter December 15, 2020, including interim periods within those fiscal years. We are currently in the process of determining theimpact of implementing this Standard on our Consolidated Financial Statements.
In October 2016, ASU No. 2016-16 "Income Taxes (Topic 740) Intra-Entity Transfers of Assets Other Than Inventory" was issued bythe FASB. The purpose of this Update is to improve the accounting for the income tax consequences of intra-entity transfers ofassets other than inventory. The Update is effective for fiscal years beginning after December 15, 2017, including interim periodswithin those fiscal years. This change in accounting will be adjusted based on a modified retrospective basis with a cumulativeeffect adjustment to retained earnings as of the beginning of the period of adoption. The material impact of implementing thisstandard on our Consolidated Financial Statements mainly relates to a so-called bi-lateral advanced pricing agreement between theUS and Dutch tax authorities on a inter group transfer of intellectual property rights.
ASML ANNUAL REPORT 2016 F-17
2. Business CombinationsOn November 22, 2016, we concluded the acquisition of HMI and obtained control through acquiring 100 percent of the issuedshare capital of HMI, for a total consideration of EUR 3.0 billion. There were no contingent consideration arrangements. The totalconsideration was allocated to other intangible assets of EUR 606.6 million, other net assets of EUR 259.2 million and goodwill ofEUR 2,115.1 million.
Prior to the acquisition, HMI was the world’s leading provider of e-beam inspection tools and solutions for defect control and yieldmanagement in the advanced semiconductor manufacturing process for R&D and high volume production. HMI is headquartered inHsinchu, Taiwan, where the business operations are primarily carried out, next to R&D and technical support. Other sites whereHMI is located are in Tainan, Taiwan (R&D and manufacturing), Beijing, China (R&D and manufacturing), San Jose, US (R&D andtechnical support), Kyungki-do, South-Korea (sales and technical support) and Tokyo, Japan (sales and technical support).
With the acquisition of HMI, we will enter into two new markets, being wafer inspection as well as mask inspection for EUVlithography. In addition, we will expand our efforts in the process control market. The combination of ASML and HMI will allow us tofurther enhance our product offering at an accelerated pace. The metrology technologies are complementary (in short, HMIprovides hardware and ASML’s computational lithography division ASML Brion provides software) and when combined, they willoffer the chance to significantly improve process control, and hence yields, for customers. As such, the acquisition further enablesus to provide Holistic Lithography and process control.

The following table summarizes the major classes of consideration transferred, and the recognized amounts of the fair value of theidentifiable assets distributed and the fair value of the liabilities incurred or assumed at the acquisition date. The amounts recordedfor the acquisition as disclosed below are provisional. The measurement period remains open as we may further revise ourpreliminary purchase price allocation during the remainder of the measurement period when we obtain additional information,which might impact the fair value of assets and liabilities. Under ASC 805, adjustments to provisional fair values and goodwill maybe made in the period subsequent to the business combination. The period during which such an adjustment is permitted is limitedto 12 months from the date of acquisition.
November 22, 2016
(in thousands) EUR1
Cash and cash equivalents 294,216
Accounts receivable, net 57,899
Current tax assets 146
Inventories, net 111,650
Deferred tax assets 2,000
Other assets, current and non-current 3,209
Other intangible assets, net 606,635
Property, plant and equipment, net 52,068
Assets acquired 1,127,823
Accounts payable 3,741
Current tax liabilities 1,713
Accrued and other liabilities, current and non-current 54,154
Deferred and other tax liabilities 202,390
Liabilities assumed 261,998
Total net identifiable assets 865,825
Consideration for the transaction on November 22, 20162 2,935,511
Fair value of shares3 43,983
Fair value of unvested equity awards to be exchanged 1,461
Total consideration transferred 2,980,955
Goodwill on acquisition 2,115,130
1. Amounts were converted into euro at the rate of TWD/EUR 33.965.2. The consideration for the transaction includes an amount of EUR 536.6 million which has been reinvested in ASML through ASML ordinary shares bought by HEC
and certain HMI officers (certain HMI shareholders) leaving a net consideration paid in cash of EUR 2,398.9 million.3. As part of the consideration transferred, certain HMI shareholders agreed to purchase 5,866,001 ASML ordinary shares for a price of TWD 3,106 (EUR 91.48) per
share. These shares were valued at EUR 98.98 being the opening price on Euronext at November 22, 2016. The difference (EUR 44.0 million) between EUR 536.6million and the fair value of the shares (EUR 580.6 million) at November 22, 2016 is included as purchase consideration.
The majority of the goodwill arising on the acquisition of HMI is attributable to buyer specific synergies, net sales and profitsassigned to future multi-beam technology, net sales and profits assigned to next generation single-beam technology and HMIworkforce. Synergies relate to the unique combination of HMI's inspection tools and our defect prediction/PFC software.
All goodwill has been allocated to the RU ASML. None of the goodwill recognized is expected to be deductible for income taxpurposes.
In the period between the date of acquisition and December 31, 2016 HMI contributed EUR 25.7 million to net sales and a loss ofEUR 5.4 million to net income (including a charge of EUR 13.7 million related to the purchase price allocation adjustments).
In 2016, we incurred EUR 18.7 million transaction costs relating to the acquisition of HMI. These costs are included in SG&A.
The following unaudited pro forma summary presents estimated consolidated information of ASML as if the HMI acquisition hasoccurred on January 1, 2015. These amounts have been calculated after applying our accounting policies and adjusting the resultsof HMI to reflect the charges and benefits assuming the fair value adjustments had been applied from January 1, 2015 with theconsequential tax effects.
ASML ANNUAL REPORT 2016 F-18

Unaudited Unaudited
Pro Forma Year ended December 31 2015 2016
(in millions) EUR EUR
Total net sales 6,478 6,919
Net income 1,351 1 1,504 2
1. Pro forma net income was adjusted to include EUR 47 million of non-recurring costs related to the fair value adjustments to acquisition date inventory and includesEUR 29 million of acquisition related costs incurred in 2016.
2. Pro forma net income was adjusted to exclude EUR 9 million of non-recurring costs related to the fair value adjustments to acquisition date inventory and excludesEUR 29 million of acquisition related costs incurred in 2016.
ASML ANNUAL REPORT 2016 F-19
3. Fair Value MeasurementsFair value is the price that would be received to sell an asset or paid to transfer a liability in an orderly transaction between marketparticipants at the measurement date. The fair value measurement hierarchy prioritizes the inputs to valuation techniques used tomeasure fair value as follows:
• Level 1: Valuations based on inputs such as quoted prices for identical assets or liabilities in active markets that the entity hasthe ability to access.
• Level 2: Valuations based on inputs other than level 1 inputs such as quoted prices for similar assets or liabilities, quotedprices in markets that are not active, or other inputs that are observable or can be corroborated by observable data forsubstantially the full term of the assets or liabilities.
• Level 3: Valuations based on inputs that are supported by little or no market activity and that are significant to the fair value ofthe assets or liabilities.
The fair value hierarchy gives the highest priority to quoted prices (unadjusted) in active markets for identical assets or liabilities(Level 1) and the lowest priority to unobservable inputs (Level 3). A financial instrument‘s fair value classification is based on thelowest level of any input that is significant in the fair value measurement hierarchy.
Financial Assets and Financial Liabilities Measured at Fair Value on a Recurring Basis Investments in money market funds (as part of our cash and cash equivalents) have fair value measurements which are all basedon quoted prices for identical assets or liabilities.
Our short-term investments consist of deposits with an original maturity beyond three months with financial institutions that havegood credit ratings. The fair value of the deposits is determined with reference to quoted market prices in an active market forsimilar assets or discounted cash flow analysis.
The principal market in which we execute our derivative contracts is the institutional market in an over-the-counter environmentwith a high level of price transparency. The market participants usually are large commercial banks. The valuation inputs for ourderivative contracts are based on quoted prices and quoting pricing intervals from public data sources; they do not involvemanagement judgment.
The valuation technique used to determine the fair value of forward foreign exchange contracts (used for hedging purposes)approximates the NPV technique which is the estimated amount that a bank would receive or pay to terminate the forward foreignexchange contracts at the reporting date, taking into account current interest rates and current exchange rates.
The valuation technique used to determine the fair value of interest rate swaps (used for hedging purposes) is the NPV technique,which is the estimated amount that a bank would receive or pay to terminate the swap agreements at the reporting date, taking intoaccount current interest rates.
Our Eurobonds serve as hedged items in fair value hedge relationships in which we hedge the variability of changes in the fair valueof our Eurobonds due to changes in market interest rates with interest rate swaps. The fair value changes of these interest rateswaps are recorded on the Consolidated Balance Sheets under derivative financial instruments (within other current assets andother non-current assets) and the carrying amounts of the Eurobonds are adjusted for the effective portion of these fair valuechanges only. For the actual aggregate carrying amount and the fair value of our Eurobonds, see Note 14.

The following table presents our financial assets and financial liabilities that are measured at fair value on a recurring basis:
As of December 31, 2016 Level 1 Level 2 Level 3 Total
(in thousands) EUR EUR EUR EUR
Assets measured at fair value
Derivative financial instruments 1 — 134,059 — 134,059
Money market funds 2 2,151,969 — — 2,151,969
Short-term investments 3 — 1,150,000 — 1,150,000
Total 2,151,969 1,284,059 — 3,436,028
Liabilities measured at fair value
Derivative financial instruments 1 — 113,900 — 113,900
Assets and Liabilities for which fair values are disclosed
Long-term debt 4
3,386,213 — — 3,386,213
1. Derivative financial instruments consist of forward foreign exchange contracts and interest rate swaps. See Note 4.2. Money market funds are part of our cash and cash equivalents. See Note 5.3. Short-term investments consist of deposits with an original maturity longer than three months. See note 5. 4. Long-term debt relates to Eurobonds. See Note 14.
As of December 31, 2015 Level 1 Level 2 Level 3 Total
(in thousands) EUR EUR EUR EUR
Assets measured at fair value
Derivative financial instruments 1 — 133,803 — 133,803
Money market funds 2 659,295 — — 659,295
Short-term investments 3 — 950,000 — 950,000
Total 659,295 1,083,803 — 1,743,098
Liabilities measured at fair value
Derivative financial instruments 1 — 20,860 — 20,860
Assets and Liabilities for which fair values are disclosed
Long-term debt 4 1,100,849 — — 1,100,849
1. Derivative financial instruments consist of forward foreign exchange contracts and interest rate swaps. See Note 4.2. Money market funds are part of our cash and cash equivalents. See Note 5. 3. Short-term investments consist of deposits with an original maturity longer than three months. See note 5.4. Long-term debt relates to Eurobonds. See Note 14.
There were no transfers between levels during the years ended December 31, 2016 and December 31, 2015.
Assets and Liabilities Measured at Fair Value on a Non-recurring Basis In 2016, we had no significant fair value measurements on a non-recurring basis. We did not recognize any impairment charges forgoodwill and other intangible assets during 2016. See Notes 10 and 11 for more information. For fair value measurements inrelation to the acquisition of HMI, we refer to Note 2.
ASML ANNUAL REPORT 2016 F-20
4. Financial Risk ManagementWe are exposed to certain financial risks such as market risk (including foreign currency risk and interest rate risk), credit risk,liquidity risk and capital risk. Our overall risk management program focuses on the unpredictability of financial markets and seeksto minimize potentially adverse effects on our financial performance. We use derivative financial instruments to hedge certain riskexposures. None of our transactions are entered into for trading or speculative purposes. We believe that market information is themost reliable and transparent measure for our derivative financial instruments that are measured at fair value.
Foreign Currency Risk Management Our sales are predominately denominated in euros. Exceptions may occur on a customer by customer basis. Our cost of sales andother costs are mainly denominated in euros, to a certain extent in US dollars, Taiwanese dollars and Japanese yen and to a limitedextent in other currencies. Therefore, we are exposed to foreign currency exchange risk.
It is our policy to hedge material transaction exposures, such as forecasted sales and purchase transactions, and material netremeasurement exposures, such as accounts receivable and payable. We hedge these exposures through the use of foreignexchange contracts.
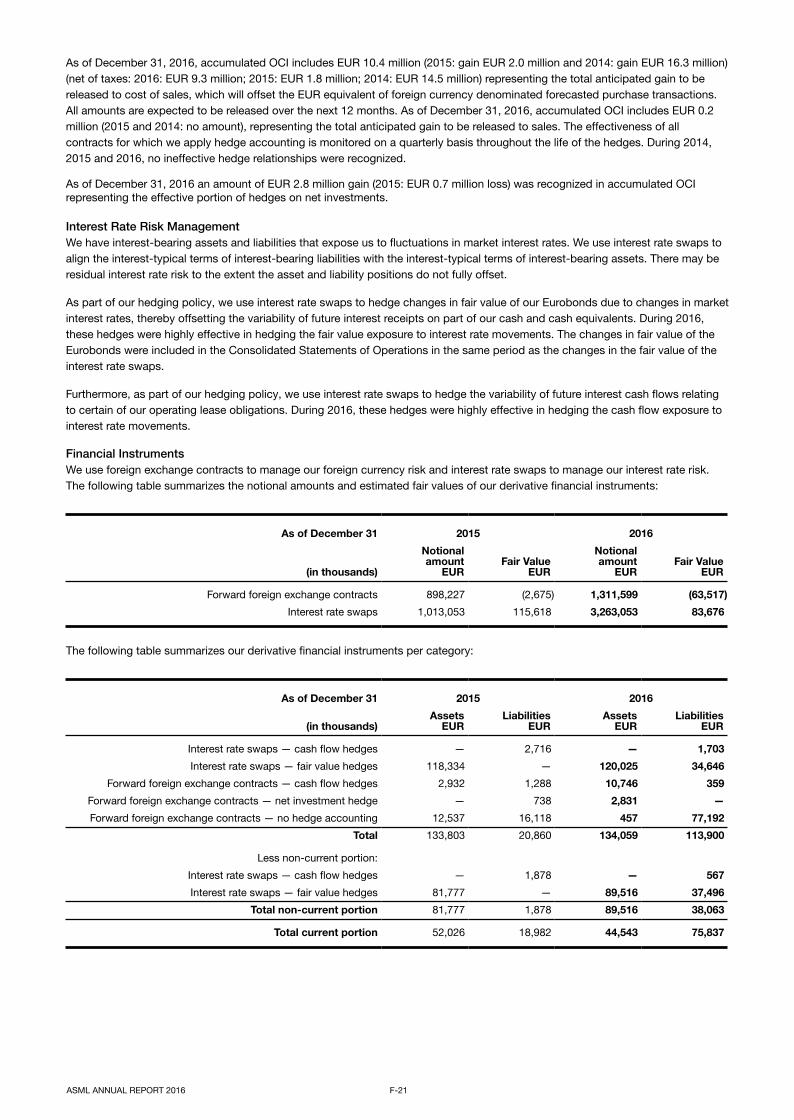
As of December 31, 2016, accumulated OCI includes EUR 10.4 million (2015: gain EUR 2.0 million and 2014: gain EUR 16.3 million)(net of taxes: 2016: EUR 9.3 million; 2015: EUR 1.8 million; 2014: EUR 14.5 million) representing the total anticipated gain to bereleased to cost of sales, which will offset the EUR equivalent of foreign currency denominated forecasted purchase transactions.All amounts are expected to be released over the next 12 months. As of December 31, 2016, accumulated OCI includes EUR 0.2million (2015 and 2014: no amount), representing the total anticipated gain to be released to sales. The effectiveness of allcontracts for which we apply hedge accounting is monitored on a quarterly basis throughout the life of the hedges. During 2014,2015 and 2016, no ineffective hedge relationships were recognized.
As of December 31, 2016 an amount of EUR 2.8 million gain (2015: EUR 0.7 million loss) was recognized in accumulated OCIrepresenting the effective portion of hedges on net investments.
Interest Rate Risk Management We have interest-bearing assets and liabilities that expose us to fluctuations in market interest rates. We use interest rate swaps toalign the interest-typical terms of interest-bearing liabilities with the interest-typical terms of interest-bearing assets. There may beresidual interest rate risk to the extent the asset and liability positions do not fully offset.
As part of our hedging policy, we use interest rate swaps to hedge changes in fair value of our Eurobonds due to changes in marketinterest rates, thereby offsetting the variability of future interest receipts on part of our cash and cash equivalents. During 2016,these hedges were highly effective in hedging the fair value exposure to interest rate movements. The changes in fair value of theEurobonds were included in the Consolidated Statements of Operations in the same period as the changes in the fair value of theinterest rate swaps.
Furthermore, as part of our hedging policy, we use interest rate swaps to hedge the variability of future interest cash flows relatingto certain of our operating lease obligations. During 2016, these hedges were highly effective in hedging the cash flow exposure tointerest rate movements.
Financial Instruments We use foreign exchange contracts to manage our foreign currency risk and interest rate swaps to manage our interest rate risk.The following table summarizes the notional amounts and estimated fair values of our derivative financial instruments:
As of December 31 2015 2016
(in thousands)
Notionalamount
EURFair Value
EUR
Notionalamount
EURFair Value
EUR
Forward foreign exchange contracts 898,227 (2,675) 1,311,599 (63,517)
Interest rate swaps 1,013,053 115,618 3,263,053 83,676
The following table summarizes our derivative financial instruments per category:
As of December 31 2015 2016
(in thousands)Assets
EURLiabilities
EURAssets
EURLiabilities
EUR
Interest rate swaps — cash flow hedges — 2,716 — 1,703
Interest rate swaps — fair value hedges 118,334 — 120,025 34,646
Forward foreign exchange contracts — cash flow hedges 2,932 1,288 10,746 359
Forward foreign exchange contracts — net investment hedge — 738 2,831 —
Forward foreign exchange contracts — no hedge accounting 12,537 16,118 457 77,192
Total 133,803 20,860 134,059 113,900
Less non-current portion:
Interest rate swaps — cash flow hedges — 1,878 — 567
Interest rate swaps — fair value hedges 81,777 — 89,516 37,496
Total non-current portion 81,777 1,878 89,516 38,063
Total current portion 52,026 18,982 44,543 75,837
ASML ANNUAL REPORT 2016 F-21
The fair value part of a hedging derivative financial instrument that has a remaining term of 12 months or less after balance sheetdate is classified as current asset or liability. When the fair value part of a hedging derivative has a term of more than 12 monthsafter balance sheet date, it is classified as non-current asset or liability. The current portion of derivative financial instruments isincluded in other current assets and current accrued and other liabilities in the Consolidated Balance Sheets. The non-currentportion of derivative financial instruments is included in other non-current assets and non-current accrued and other liabilities in theConsolidated Balance Sheets.
For further information regarding our derivative financial instruments, see Note 3.
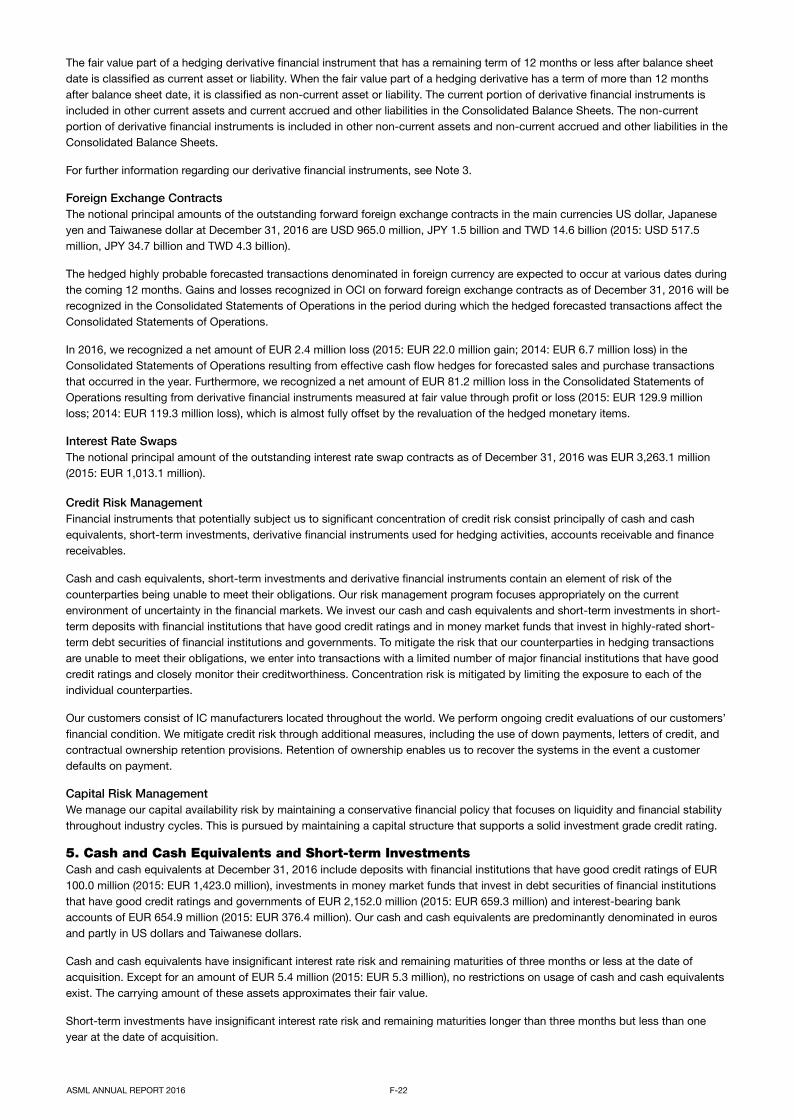
Foreign Exchange Contracts The notional principal amounts of the outstanding forward foreign exchange contracts in the main currencies US dollar, Japaneseyen and Taiwanese dollar at December 31, 2016 are USD 965.0 million, JPY 1.5 billion and TWD 14.6 billion (2015: USD 517.5million, JPY 34.7 billion and TWD 4.3 billion).
The hedged highly probable forecasted transactions denominated in foreign currency are expected to occur at various dates duringthe coming 12 months. Gains and losses recognized in OCI on forward foreign exchange contracts as of December 31, 2016 will berecognized in the Consolidated Statements of Operations in the period during which the hedged forecasted transactions affect theConsolidated Statements of Operations.
In 2016, we recognized a net amount of EUR 2.4 million loss (2015: EUR 22.0 million gain; 2014: EUR 6.7 million loss) in theConsolidated Statements of Operations resulting from effective cash flow hedges for forecasted sales and purchase transactionsthat occurred in the year. Furthermore, we recognized a net amount of EUR 81.2 million loss in the Consolidated Statements ofOperations resulting from derivative financial instruments measured at fair value through profit or loss (2015: EUR 129.9 millionloss; 2014: EUR 119.3 million loss), which is almost fully offset by the revaluation of the hedged monetary items.
Interest Rate Swaps The notional principal amount of the outstanding interest rate swap contracts as of December 31, 2016 was EUR 3,263.1 million(2015: EUR 1,013.1 million).
Credit Risk Management Financial instruments that potentially subject us to significant concentration of credit risk consist principally of cash and cashequivalents, short-term investments, derivative financial instruments used for hedging activities, accounts receivable and financereceivables.
Cash and cash equivalents, short-term investments and derivative financial instruments contain an element of risk of thecounterparties being unable to meet their obligations. Our risk management program focuses appropriately on the currentenvironment of uncertainty in the financial markets. We invest our cash and cash equivalents and short-term investments in short-term deposits with financial institutions that have good credit ratings and in money market funds that invest in highly-rated short-term debt securities of financial institutions and governments. To mitigate the risk that our counterparties in hedging transactionsare unable to meet their obligations, we enter into transactions with a limited number of major financial institutions that have goodcredit ratings and closely monitor their creditworthiness. Concentration risk is mitigated by limiting the exposure to each of theindividual counterparties.
Our customers consist of IC manufacturers located throughout the world. We perform ongoing credit evaluations of our customers’financial condition. We mitigate credit risk through additional measures, including the use of down payments, letters of credit, andcontractual ownership retention provisions. Retention of ownership enables us to recover the systems in the event a customerdefaults on payment.
Capital Risk Management We manage our capital availability risk by maintaining a conservative financial policy that focuses on liquidity and financial stabilitythroughout industry cycles. This is pursued by maintaining a capital structure that supports a solid investment grade credit rating.
ASML ANNUAL REPORT 2016 F-22
5. Cash and Cash Equivalents and Short-term InvestmentsCash and cash equivalents at December 31, 2016 include deposits with financial institutions that have good credit ratings of EUR100.0 million (2015: EUR 1,423.0 million), investments in money market funds that invest in debt securities of financial institutionsthat have good credit ratings and governments of EUR 2,152.0 million (2015: EUR 659.3 million) and interest-bearing bankaccounts of EUR 654.9 million (2015: EUR 376.4 million). Our cash and cash equivalents are predominantly denominated in eurosand partly in US dollars and Taiwanese dollars.
Cash and cash equivalents have insignificant interest rate risk and remaining maturities of three months or less at the date ofacquisition. Except for an amount of EUR 5.4 million (2015: EUR 5.3 million), no restrictions on usage of cash and cash equivalentsexist. The carrying amount of these assets approximates their fair value.
Short-term investments have insignificant interest rate risk and remaining maturities longer than three months but less than oneyear at the date of acquisition.

Short-term investments consist of the following:
As of December 31, 2016
(in thousands) Cost basis
UnrealizedGains
UnrealizedLosses
RecordedBasis
Deposits 1,150,000 — — 1,150,000
Total
1,150,000 — — 1,150,000
As of December 31, 2015
(in thousands) Cost basis
UnrealizedGains
UnrealizedLosses
RecordedBasis
Deposits 950,000 — — 950,000
Total
950,000 — — 950,000
ASML ANNUAL REPORT 2016 F-23
6. Accounts ReceivableAccounts receivable consist of the following:
As of December 31 2015 2016
(in thousands) EUR EUR
Accounts receivable, gross 809,299 702,368
Allowance for doubtful receivables (5,603) (2,162)
Accounts receivable, net
803,696 700,206
The decrease in accounts receivable as of December 31, 2016 compared to December 31, 2015 was mainly caused by relativelyhigh payments received from customers prior to year-end 2016.
The carrying amount of the accounts receivable approximates the fair value. We perform ongoing credit evaluations on ourcustomers’ financial condition. We periodically review whether an allowance for credit losses is needed by considering factors suchas historical payment experience, credit quality, aging of the accounts receivable balances, and current economic conditions thatmay affect a customer’s ability to pay.
Movements of the allowance for doubtful receivables are as follows:
Year ended December 31 2015 2016
(in thousands) EUR EUR
Balance at beginning of year (2,070) (5,603)
Addition for the year 1 (3,870) (3,161)
Effect of changes in exchange rates (131) (3)
Utilization of the provision 468 6,605
Balance at end of year
(5,603) (2,162)
1. The addition for the year is recorded in cost of sales.
7. Finance ReceivablesFinance receivables consist of receivables in relation to sales-type leases and non-current accounts receivable. The following tablelists the components of the finance receivables as of December 31, 2016 and 2015:
As of December 31 2015 2016
(in thousands) EUR EUR
Finance receivables, gross 411,654 569,723
Unearned interest (7,095) (5,107)
Finance receivables, net 404,559 564,616
Current portion of finance receivables, gross 285,966 450,688
Current portion of unearned interest (5,443) (3,304)
Non-current portion of finance receivables, net
124,036 117,232
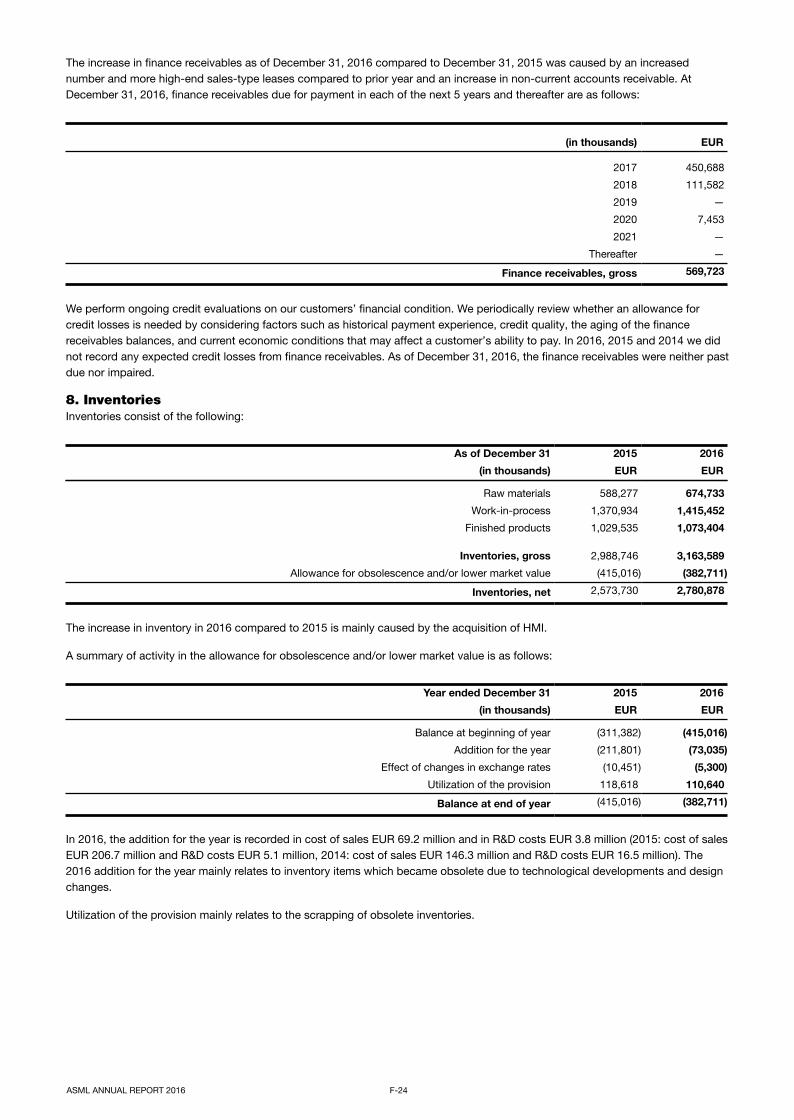
The increase in finance receivables as of December 31, 2016 compared to December 31, 2015 was caused by an increasednumber and more high-end sales-type leases compared to prior year and an increase in non-current accounts receivable. AtDecember 31, 2016, finance receivables due for payment in each of the next 5 years and thereafter are as follows:
(in thousands) EUR
2017 450,688
2018 111,582
2019 —
2020 7,453
2021 —
Thereafter —
Finance receivables, gross
569,723
We perform ongoing credit evaluations on our customers’ financial condition. We periodically review whether an allowance forcredit losses is needed by considering factors such as historical payment experience, credit quality, the aging of the financereceivables balances, and current economic conditions that may affect a customer’s ability to pay. In 2016, 2015 and 2014 we didnot record any expected credit losses from finance receivables. As of December 31, 2016, the finance receivables were neither pastdue nor impaired.
ASML ANNUAL REPORT 2016 F-24
8. InventoriesInventories consist of the following:
As of December 31 2015 2016
(in thousands) EUR EUR
Raw materials 588,277 674,733
Work-in-process 1,370,934 1,415,452
Finished products 1,029,535 1,073,404
Inventories, gross 2,988,746 3,163,589
Allowance for obsolescence and/or lower market value (415,016) (382,711)
Inventories, net
2,573,730 2,780,878
The increase in inventory in 2016 compared to 2015 is mainly caused by the acquisition of HMI.
A summary of activity in the allowance for obsolescence and/or lower market value is as follows:
Year ended December 31 2015 2016
(in thousands) EUR EUR
Balance at beginning of year (311,382) (415,016)
Addition for the year (211,801) (73,035)
Effect of changes in exchange rates (10,451) (5,300)
Utilization of the provision 118,618 110,640
Balance at end of year
(415,016) (382,711)
In 2016, the addition for the year is recorded in cost of sales EUR 69.2 million and in R&D costs EUR 3.8 million (2015: cost of salesEUR 206.7 million and R&D costs EUR 5.1 million, 2014: cost of sales EUR 146.3 million and R&D costs EUR 16.5 million). The2016 addition for the year mainly relates to inventory items which became obsolete due to technological developments and designchanges.
Utilization of the provision mainly relates to the scrapping of obsolete inventories.

9. Other AssetsOther current assets consist of the following:
As of December 31 2015 2016
(in thousands) EUR EUR
Advance payments to Carl Zeiss SMT 75,059 71,908Prepaid expenses 186,709 192,024
Operations to be invoiced 79,803 101,292Derivative financial instruments 52,026 44,543
VAT 61,332 61,565Other assets 33,895 89,139
Other current assets
488,824 560,471
Carl Zeiss SMT is our single supplier of main optical systems (lenses, mirrors, illuminators, collectors and other critical opticalcomponents) and, from time to time, receives non-interest bearing advance payments from us that support Carl Zeiss SMT's work-in-process, thereby securing lens and optical module deliveries to us. Amounts owed under these advance payments are settledthrough future lens or EUV optical component deliveries.
Prepaid expenses mainly include prepaid income taxes on intercompany profit not realized by the ASML group of EUR 74.3 millionas of December 31, 2016 (2015: EUR 61.3 million).
Derivative financial instruments consist of forward foreign exchange contracts and the current part of the aggregate fair value ofinterest rate swaps, which decreased in value as a result of reduced time-to-maturity, see Note 4.
Other assets mainly increased as a result of an increase in the subsidies receivable from EUR 7.3 million as of December 31, 2015to EUR 34.4 million as of December 31, 2016.
Other non-current assets consist of the following:
As of December 31 2015 2016
(in thousands) EUR EUR
Advance payments to Carl Zeiss SMT 305,642 305,714
Derivative financial instruments 81,777 89,516
Compensation plan assets 1 31,393 38,031
Prepaid expenses 6,876 151,397
Subordinated loan granted to lessor in respect of Veldhoven headquarters 2 5,445 5,445
Other assets 19,749 22,202
Other non-current assets
450,882 612,305
1. For further details on compensation plan assets see Note 17.2. For further details on the loan granted to lessor in respect of Veldhoven headquarters see Note 12.
Derivative financial instruments consist of the non-current part of the fair value of interest rate swaps, which increased in value as aresult of a decrease in market interest rates, see Note 4.
Prepaid expenses mainly include prepaid income taxes on intercompany profit not realized by the ASML group of EUR 144.1 millionas of December 31, 2016 (2015: EUR 0.0 million). The increase in prepaid income taxes in 2016 is mainly explained by a so-calledbi-lateral advance pricing agreement between the US and Dutch tax authorities on an inter group transfer of intellectual propertyrights.
ASML ANNUAL REPORT 2016 F-25
10. GoodwillChanges in goodwill are summarized as follows:
Year ended December 31 2015 2016
(in thousands) EUR EUR
Cost
Balance at beginning of year 2,357,536 2,624,552
Acquisition through business combinations — 2,115,130
Effect of changes in exchange rates 267,016 134,212
Balance at end of year
2,624,552 4,873,894
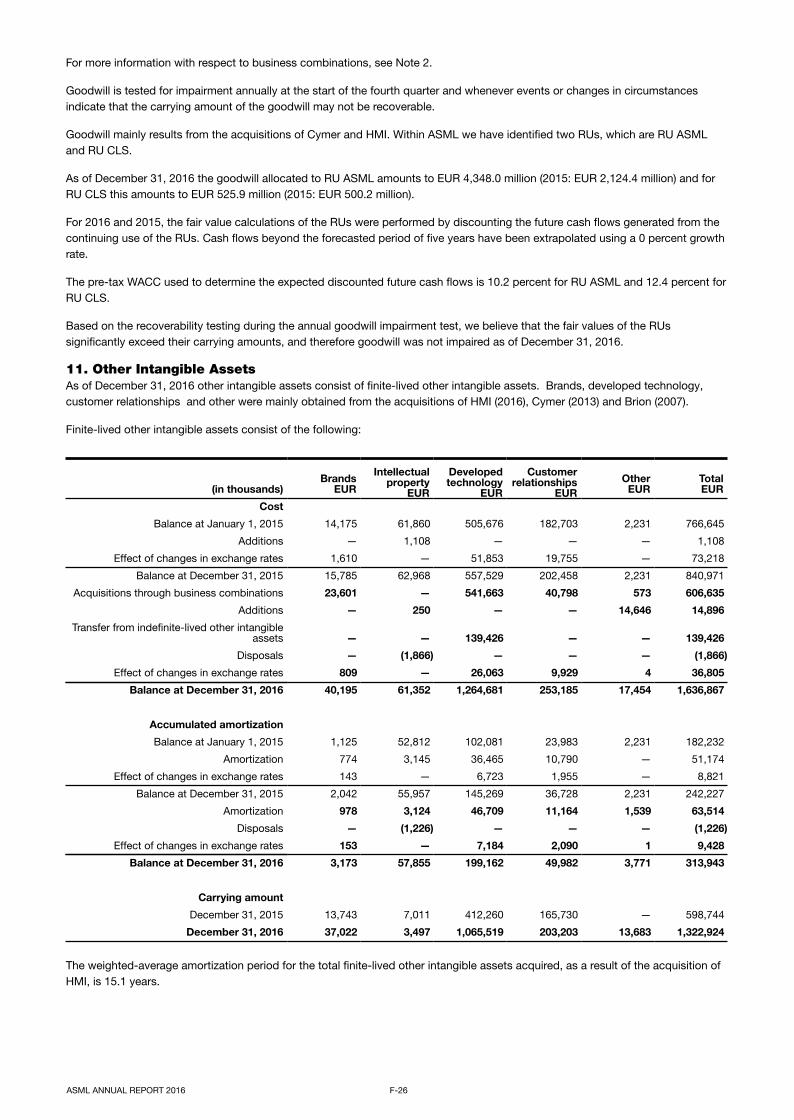
For more information with respect to business combinations, see Note 2.
Goodwill is tested for impairment annually at the start of the fourth quarter and whenever events or changes in circumstancesindicate that the carrying amount of the goodwill may not be recoverable.
Goodwill mainly results from the acquisitions of Cymer and HMI. Within ASML we have identified two RUs, which are RU ASMLand RU CLS.
As of December 31, 2016 the goodwill allocated to RU ASML amounts to EUR 4,348.0 million (2015: EUR 2,124.4 million) and forRU CLS this amounts to EUR 525.9 million (2015: EUR 500.2 million).
For 2016 and 2015, the fair value calculations of the RUs were performed by discounting the future cash flows generated from thecontinuing use of the RUs. Cash flows beyond the forecasted period of five years have been extrapolated using a 0 percent growthrate.
The pre-tax WACC used to determine the expected discounted future cash flows is 10.2 percent for RU ASML and 12.4 percent forRU CLS.
Based on the recoverability testing during the annual goodwill impairment test, we believe that the fair values of the RUssignificantly exceed their carrying amounts, and therefore goodwill was not impaired as of December 31, 2016.
ASML ANNUAL REPORT 2016 F-26
11. Other Intangible AssetsAs of December 31, 2016 other intangible assets consist of finite-lived other intangible assets. Brands, developed technology,customer relationships and other were mainly obtained from the acquisitions of HMI (2016), Cymer (2013) and Brion (2007).
Finite-lived other intangible assets consist of the following:
(in thousands)Brands
EUR
Intellectualproperty
EUR
Developedtechnology
EUR
Customerrelationships
EUROther
EURTotalEUR
Cost
Balance at January 1, 2015 14,175 61,860 505,676 182,703 2,231 766,645
Additions — 1,108 — — — 1,108
Effect of changes in exchange rates 1,610 — 51,853 19,755 — 73,218
Balance at December 31, 2015 15,785 62,968 557,529 202,458 2,231 840,971
Acquisitions through business combinations 23,601 — 541,663 40,798 573 606,635
Additions — 250 — — 14,646 14,896
Transfer from indefinite-lived other intangibleassets — — 139,426 — — 139,426
Disposals — (1,866) — — — (1,866)
Effect of changes in exchange rates 809 — 26,063 9,929 4 36,805
Balance at December 31, 2016 40,195 61,352 1,264,681 253,185 17,454 1,636,867
Accumulated amortization
Balance at January 1, 2015 1,125 52,812 102,081 23,983 2,231 182,232
Amortization 774 3,145 36,465 10,790 — 51,174
Effect of changes in exchange rates 143 — 6,723 1,955 — 8,821
Balance at December 31, 2015 2,042 55,957 145,269 36,728 2,231 242,227
Amortization 978 3,124 46,709 11,164 1,539 63,514
Disposals — (1,226) — — — (1,226)
Effect of changes in exchange rates 153 — 7,184 2,090 1 9,428
Balance at December 31, 2016 3,173 57,855 199,162 49,982 3,771 313,943
Carrying amount
December 31, 2015 13,743 7,011 412,260 165,730 — 598,744
December 31, 2016 37,022 3,497 1,065,519 203,203 13,683 1,322,924
The weighted-average amortization period for the total finite-lived other intangible assets acquired, as a result of the acquisition ofHMI, is 15.1 years.
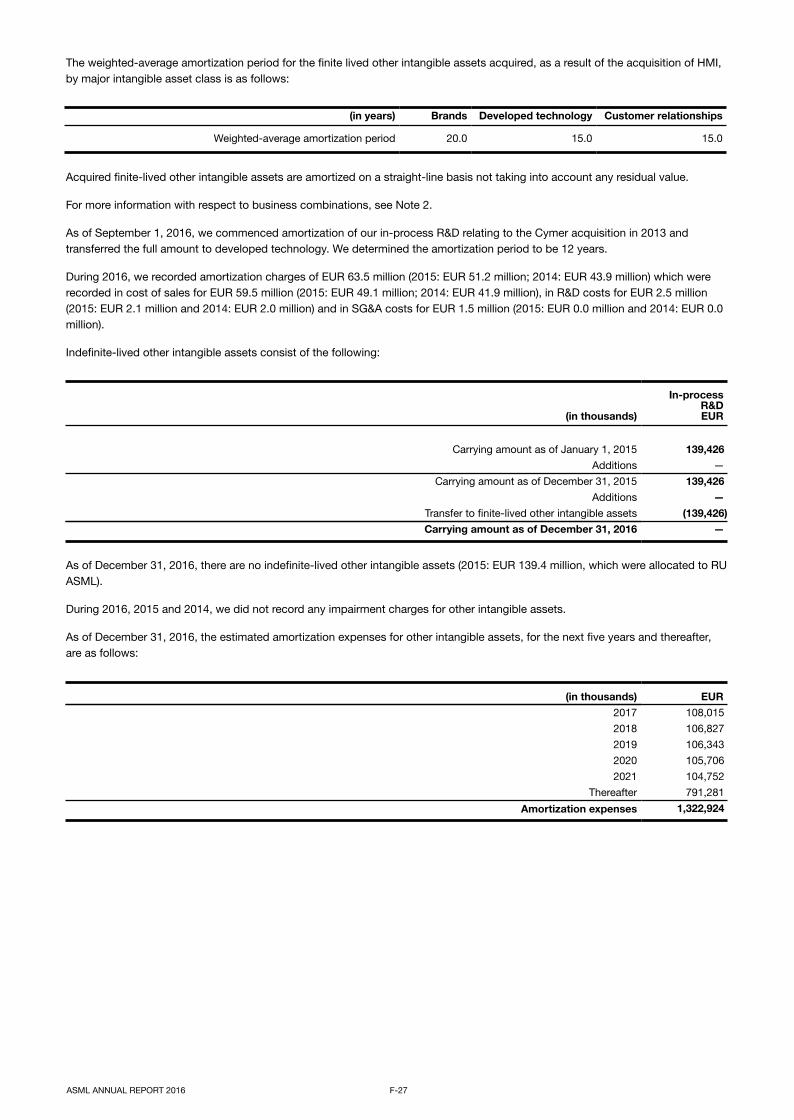
The weighted-average amortization period for the finite lived other intangible assets acquired, as a result of the acquisition of HMI,by major intangible asset class is as follows:
(in years) Brands Developed technology Customer relationships
Weighted-average amortization period 20.0 15.0 15.0
Acquired finite-lived other intangible assets are amortized on a straight-line basis not taking into account any residual value.
For more information with respect to business combinations, see Note 2.
As of September 1, 2016, we commenced amortization of our in-process R&D relating to the Cymer acquisition in 2013 andtransferred the full amount to developed technology. We determined the amortization period to be 12 years.
During 2016, we recorded amortization charges of EUR 63.5 million (2015: EUR 51.2 million; 2014: EUR 43.9 million) which wererecorded in cost of sales for EUR 59.5 million (2015: EUR 49.1 million; 2014: EUR 41.9 million), in R&D costs for EUR 2.5 million(2015: EUR 2.1 million and 2014: EUR 2.0 million) and in SG&A costs for EUR 1.5 million (2015: EUR 0.0 million and 2014: EUR 0.0million).
Indefinite-lived other intangible assets consist of the following:
(in thousands)
In-processR&DEUR
Carrying amount as of January 1, 2015 139,426Additions —
Carrying amount as of December 31, 2015 139,426Additions —
Transfer to finite-lived other intangible assets (139,426)Carrying amount as of December 31, 2016 —
As of December 31, 2016, there are no indefinite-lived other intangible assets (2015: EUR 139.4 million, which were allocated to RUASML).
During 2016, 2015 and 2014, we did not record any impairment charges for other intangible assets.
As of December 31, 2016, the estimated amortization expenses for other intangible assets, for the next five years and thereafter,are as follows:
(in thousands) EUR2017 108,0152018 106,8272019 106,3432020 105,7062021 104,752
Thereafter 791,281
Amortization expenses
1,322,924
ASML ANNUAL REPORT 2016 F-27

12. Property, Plant and EquipmentProperty, plant and equipment consist of the following:
(in thousands)
Land andbuildings
EUR
Machineryand
equipmentEUR
Leasehold improvements
EUR
Furniture,fixtures and
otherequipment
EURTotalEUR
Cost
Balance at January 1, 2015 1,269,488 799,709 231,810 303,090 2,604,097
Additions 154,505 246,332 12,438 46,352 459,627
Disposals (1,346) (117,250) (451) (3,920) (122,967)
Effect of changes in exchange rates 27,438 35,153 1,748 2,962 67,301
Balance at December 31, 2015 1,450,085 963,944 245,545 348,484 3,008,058
Acquisitions through business combinations 23,851 26,041 1,263 913 52,068
Additions 75,283 203,801 6,745 30,356 316,185
Disposals (3,226) (82,268) (906) (26,551) (112,951)
Effect of changes in exchange rates 10,537 21,617 1,556 5,808 39,518
Balance at December 31, 2016 1,556,530 1,133,135 254,203 359,010 3,302,878
Accumulated depreciation and impairment
Balance at January 1, 2015 296,099 426,832 192,243 241,400 1,156,574
Depreciation 75,918 123,269 16,078 27,784 243,049
Impairment charges — 2,287 — — 2,287
Disposals (115) (44,189) (439) (3,902) (48,645)
Effect of changes in exchange rates 10,459 21,202 605 1,849 34,115
Balance at December 31, 2015 382,361 529,401 208,487 267,131 1,387,380
Depreciation 88,427 155,660 15,685 31,041 290,813
Impairment charges 1,712 655 169 930 3,466
Disposals (2,482) (55,630) (307) (26,492) (84,911)
Effect of changes in exchange rates 4,547 12,783 738 825 18,893
Balance at December 31, 2016 474,565 642,869 224,772 273,435 1,615,641
Carrying amount
December 31, 2015 1,067,724 434,543 37,058 81,353 1,620,678
December 31, 2016 1,081,965 490,266 29,431 85,575 1,687,237
Property, plant and equipment include amounts recorded as a result of the acquisition of HMI. For more information with respect tobusiness combinations, see Note 2.
As of December 31, 2016, the carrying amount includes assets under construction for land and buildings of EUR 32.7 million (2015:EUR 64.7 million), machinery and equipment of EUR 30.0 million (2015: EUR 47.3 million), leasehold improvements of EUR 1.7million (2015: EUR 7.8 million) and furniture, fixtures and other equipment of EUR 6.2 million (2015: EUR 14.9 million).
As of December 31, 2016, the carrying amount of land amounts to EUR 96.3 million (2015: EUR 88.0 million).
As of December 31, 2016, the carrying amount of machinery and equipment includes an amount of EUR 17.0 million with respectto evaluation and operating lease systems (2015: EUR 23.5 million).
The majority of the additions in 2016 in property, plant and equipment relates to operating leases to customers, prototypes,evaluation and training systems and the expansion and upgrades of facilities.
The majority of additions in 2016 in machinery and equipment relates to operating leases to customers, prototypes, evaluation andtraining systems which are similar to those that ASML sells in its ordinary course of business. These systems are capitalized underproperty, plant and equipment because these are held for own use, for operating lease and for evaluation purposes. These arerecorded at cost and depreciated over their expected useful life taking into consideration their residual value. From the time thatthese assets are no longer held for own use but intended for sale in the ordinary course of business, they are reclassified fromproperty, plant and equipment to inventory at their carrying value.
An amount of EUR 21.6 million (2015: EUR 91.0 million) of the additions in property, plant and equipment relates to non-cashtransfers from inventory. Since the transfers between inventory and property, plant and equipment are non-cash events, these arenot reflected in the Consolidated Statements of Cash Flows.
ASML ANNUAL REPORT 2016 F-28

An amount of EUR 22.8 million (2015: EUR 72.7 million) of the disposal of property, plant and equipment relates to non-cashtransfers to inventory. When sold, the proceeds and cost of these systems are recorded as net sales and cost of sales, respectively,identical to the treatment of other sales transactions. The cost of sales for these systems includes the inventory value and theadditional costs of refurbishing (materials and labor). Since the transfers between inventory and property, plant and equipment arenon-cash events, these are not reflected in the Consolidated Statements of Cash Flows.
During 2016, we recorded depreciation charges of EUR 290.8 million (2015: EUR 243.0 million; 2014: EUR 209.5 million) of whichwe recorded EUR 187.9 million (2015: EUR 191.7 million; 2014: EUR 153.9 million) in cost of sales, EUR 76.8 million (2015: EUR19.7 million; 2014: EUR 36.3 million) in R&D costs and EUR 26.1 million (2015: EUR 31.6 million; 2014: EUR 19.3 million) in SG&Acosts.
Variable Interest Entity The carrying amount of land and buildings includes an amount of EUR 26.6 million (2015: EUR 28.1 million) relating to ourheadquarters in Veldhoven, the Netherlands, which is ultimately owned by Koppelenweg I B.V., a "VIE".
As of 2003, we are leasing the Veldhoven headquarters for a period of 15 years from an entity ("lessor") that was incorporated bythe VIE Shareholders. The lessor’s shareholders’ equity amounts to EUR 1.9 million and has not changed since 2003.
The VIE Shareholders each granted a loan of EUR 11.6 million and a fourth bank granted a loan of EUR 12.3 million (EUR 47.1million in total) to the parent of the lessor. ASML provided the parent of the lessor with a subordinated loan of EUR 5.4 million andhas a purchase option that is exercisable either at the end of the lease in 2018, at a price of EUR 24.5 million, or during the lease ata price equal to the book value of the assets. The total assets of the lessor entity amounted to EUR 54.5 million at inception of thelease. The entity is determined to be a VIE because the equity investors do not have sufficient equity at risk for the legal entity tofinance its activities without sufficient additional subordinated support.
The primary purpose for which the VIE was created was to provide ASML with use of the building for 15 years, where ASML doesnot retain substantially all the risks and rewards from changes in value of the building. The main activities of the entity are to rent,re-market and ultimately sell the building that is owned by the VIE. The economic performance of the VIE is most significantlyimpacted by the ability of the lessee (ASML) to exercise the purchase option at any time during the lease term, and thus we couldpotentially benefit from increases in the fair value of the building.
While the debt holders have an interest, and may absorb losses, and the equity holders have an interest and may receive benefits,they do not have the power to direct activities that most significantly impact the entity’s economic performance and therefore,cannot be the primary beneficiary. Through the pre-determined price of the call option ASML has the power over the VIE, thereforeonly ASML meets both the power and losses/benefit criterion and consolidates the VIE.
ASML ANNUAL REPORT 2016 F-29
13. Accrued and Other LiabilitiesAccrued and other liabilities consist of the following:
As of December 31 2015 2016
(in thousands) EUR EUR
Deferred revenue 1,737,391 1,703,049
Costs to be paid 224,597 197,549
Down payments from customers 606,804 363,237
Personnel related items 341,554 401,790
Derivative financial instruments 20,860 113,900
Standard warranty reserve 18,803 36,463
Other 30,953 35,754
Accrued and other liabilities 2,980,962 2,851,742
Less: non-current portion of accrued and other liabilities 1,2 414,369 615,730
Current portion of accrued and other liabilities 2,566,593 2,236,012
1. As of December 31, 2015 the main part of the non-current portion of accrued and other liabilities relates to down payments received from customers regarding futureshipments of EUV systems and deferred revenue with respect to services.
2. As of December 31, 2016 the main part of the non-current portion of accrued and other liabilities relates to down payments received from customers regarding futureshipments of EUV systems and deferred revenue for pending services and EUV systems and upgrades.
The decrease in accrued and other liabilities mainly relates to a decrease in down payments from customers which is partly offsetby an increase in derivative financial instruments.
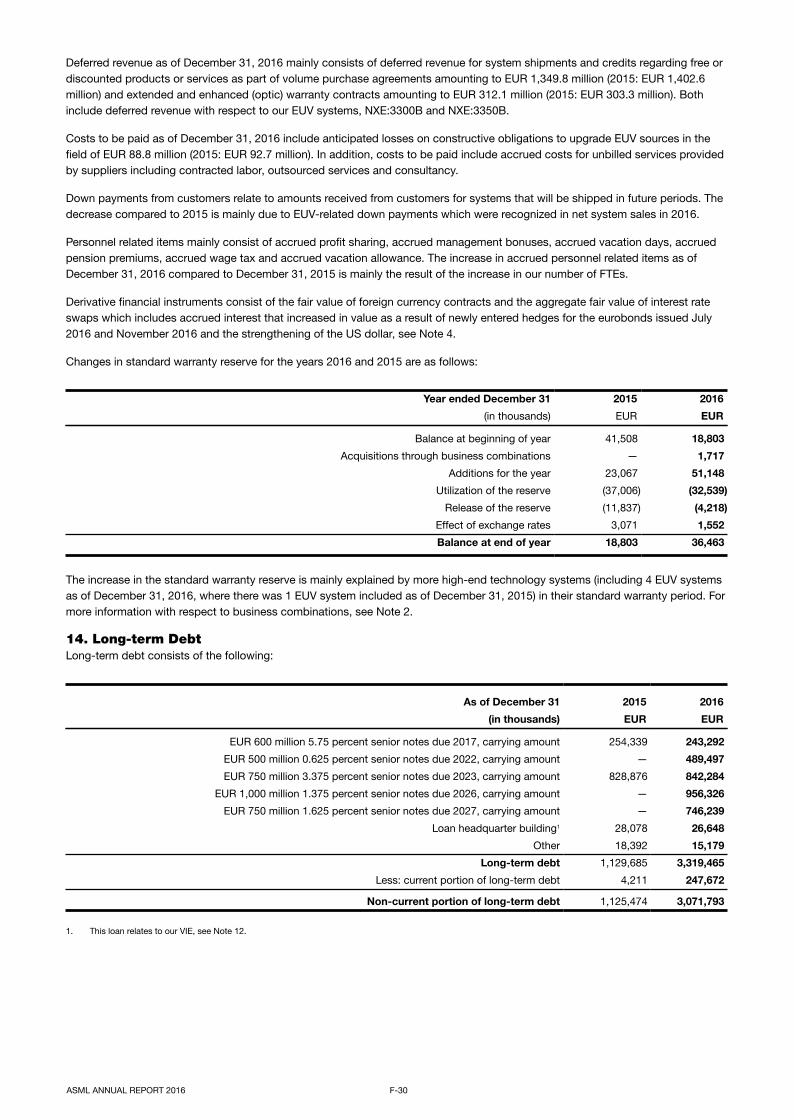
Deferred revenue as of December 31, 2016 mainly consists of deferred revenue for system shipments and credits regarding free ordiscounted products or services as part of volume purchase agreements amounting to EUR 1,349.8 million (2015: EUR 1,402.6million) and extended and enhanced (optic) warranty contracts amounting to EUR 312.1 million (2015: EUR 303.3 million). Bothinclude deferred revenue with respect to our EUV systems, NXE:3300B and NXE:3350B.
Costs to be paid as of December 31, 2016 include anticipated losses on constructive obligations to upgrade EUV sources in thefield of EUR 88.8 million (2015: EUR 92.7 million). In addition, costs to be paid include accrued costs for unbilled services providedby suppliers including contracted labor, outsourced services and consultancy.
Down payments from customers relate to amounts received from customers for systems that will be shipped in future periods. Thedecrease compared to 2015 is mainly due to EUV-related down payments which were recognized in net system sales in 2016.
Personnel related items mainly consist of accrued profit sharing, accrued management bonuses, accrued vacation days, accruedpension premiums, accrued wage tax and accrued vacation allowance. The increase in accrued personnel related items as ofDecember 31, 2016 compared to December 31, 2015 is mainly the result of the increase in our number of FTEs.
Derivative financial instruments consist of the fair value of foreign currency contracts and the aggregate fair value of interest rateswaps which includes accrued interest that increased in value as a result of newly entered hedges for the eurobonds issued July2016 and November 2016 and the strengthening of the US dollar, see Note 4.
Changes in standard warranty reserve for the years 2016 and 2015 are as follows:
Year ended December 31 2015 2016
(in thousands) EUR EUR
Balance at beginning of year 41,508 18,803
Acquisitions through business combinations — 1,717
Additions for the year 23,067 51,148
Utilization of the reserve (37,006) (32,539)
Release of the reserve (11,837) (4,218)
Effect of exchange rates 3,071 1,552
Balance at end of year 18,803 36,463
The increase in the standard warranty reserve is mainly explained by more high-end technology systems (including 4 EUV systemsas of December 31, 2016, where there was 1 EUV system included as of December 31, 2015) in their standard warranty period. Formore information with respect to business combinations, see Note 2.
ASML ANNUAL REPORT 2016 F-30
14. Long-term DebtLong-term debt consists of the following:
As of December 31 2015 2016
(in thousands) EUR EUR
EUR 600 million 5.75 percent senior notes due 2017, carrying amount 254,339 243,292
EUR 500 million 0.625 percent senior notes due 2022, carrying amount — 489,497
EUR 750 million 3.375 percent senior notes due 2023, carrying amount 828,876 842,284
EUR 1,000 million 1.375 percent senior notes due 2026, carrying amount — 956,326
EUR 750 million 1.625 percent senior notes due 2027, carrying amount — 746,239
Loan headquarter building1 28,078 26,648
Other 18,392 15,179
Long-term debt 1,129,685 3,319,465
Less: current portion of long-term debt 4,211 247,672
Non-current portion of long-term debt 1,125,474 3,071,793
1. This loan relates to our VIE, see Note 12.
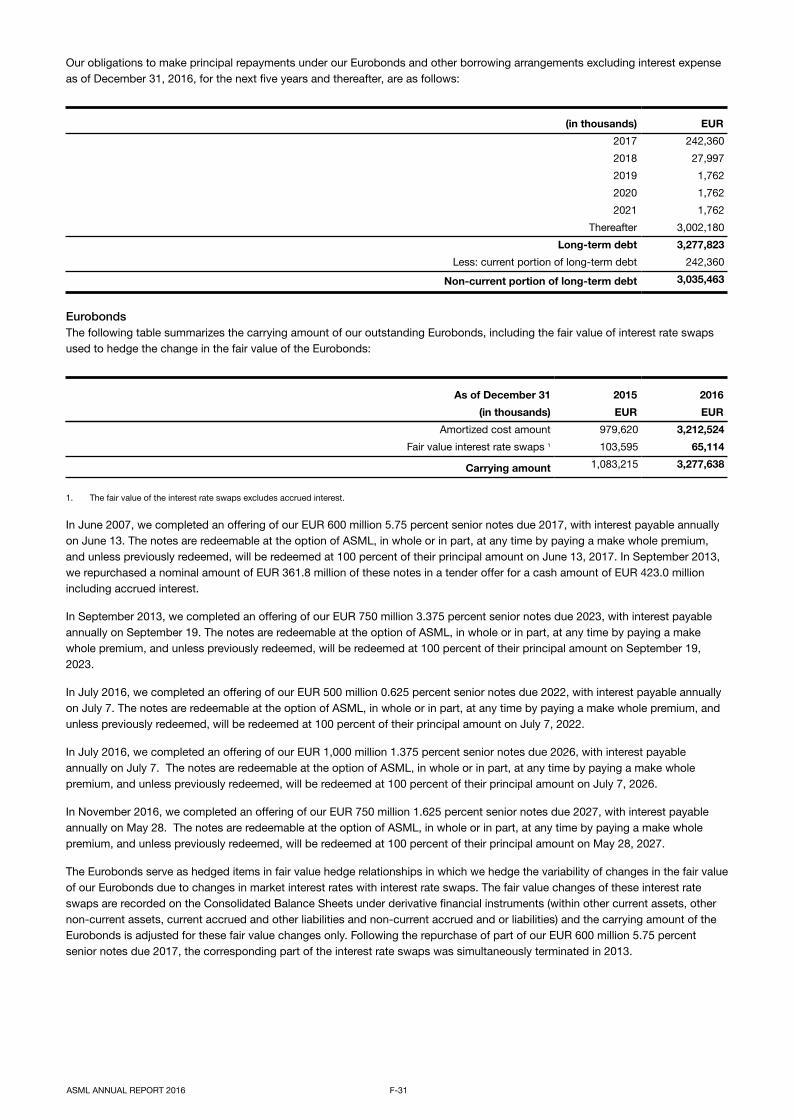
Our obligations to make principal repayments under our Eurobonds and other borrowing arrangements excluding interest expenseas of December 31, 2016, for the next five years and thereafter, are as follows:
(in thousands) EUR
2017 242,360
2018 27,997
2019 1,762
2020 1,762
2021 1,762
Thereafter 3,002,180
Long-term debt 3,277,823
Less: current portion of long-term debt 242,360
Non-current portion of long-term debt
3,035,463
Eurobonds The following table summarizes the carrying amount of our outstanding Eurobonds, including the fair value of interest rate swapsused to hedge the change in the fair value of the Eurobonds:
As of December 31 2015 2016
(in thousands) EUR EUR
Amortized cost amount 979,620 3,212,524
Fair value interest rate swaps 1 103,595 65,114
Carrying amount 1,083,215 3,277,638
1. The fair value of the interest rate swaps excludes accrued interest.
In June 2007, we completed an offering of our EUR 600 million 5.75 percent senior notes due 2017, with interest payable annuallyon June 13. The notes are redeemable at the option of ASML, in whole or in part, at any time by paying a make whole premium,and unless previously redeemed, will be redeemed at 100 percent of their principal amount on June 13, 2017. In September 2013,we repurchased a nominal amount of EUR 361.8 million of these notes in a tender offer for a cash amount of EUR 423.0 millionincluding accrued interest.
In September 2013, we completed an offering of our EUR 750 million 3.375 percent senior notes due 2023, with interest payableannually on September 19. The notes are redeemable at the option of ASML, in whole or in part, at any time by paying a makewhole premium, and unless previously redeemed, will be redeemed at 100 percent of their principal amount on September 19,2023.
In July 2016, we completed an offering of our EUR 500 million 0.625 percent senior notes due 2022, with interest payable annuallyon July 7. The notes are redeemable at the option of ASML, in whole or in part, at any time by paying a make whole premium, andunless previously redeemed, will be redeemed at 100 percent of their principal amount on July 7, 2022.
In July 2016, we completed an offering of our EUR 1,000 million 1.375 percent senior notes due 2026, with interest payableannually on July 7. The notes are redeemable at the option of ASML, in whole or in part, at any time by paying a make wholepremium, and unless previously redeemed, will be redeemed at 100 percent of their principal amount on July 7, 2026.
In November 2016, we completed an offering of our EUR 750 million 1.625 percent senior notes due 2027, with interest payableannually on May 28. The notes are redeemable at the option of ASML, in whole or in part, at any time by paying a make wholepremium, and unless previously redeemed, will be redeemed at 100 percent of their principal amount on May 28, 2027.
The Eurobonds serve as hedged items in fair value hedge relationships in which we hedge the variability of changes in the fair valueof our Eurobonds due to changes in market interest rates with interest rate swaps. The fair value changes of these interest rateswaps are recorded on the Consolidated Balance Sheets under derivative financial instruments (within other current assets, othernon-current assets, current accrued and other liabilities and non-current accrued and or liabilities) and the carrying amount of theEurobonds is adjusted for these fair value changes only. Following the repurchase of part of our EUR 600 million 5.75 percentsenior notes due 2017, the corresponding part of the interest rate swaps was simultaneously terminated in 2013.
ASML ANNUAL REPORT 2016 F-31

The following table summarizes the estimated fair value of our Eurobonds:
As of December 31 2015 2016
(in thousands) EUR EUR
Principal amount 988,153 3,238,153
Carrying amount 1,083,215 3,277,638
Fair value 1 1,100,849 3,386,213
1. Source: Bloomberg Finance LP.
The fair value of our Eurobonds is estimated based on quoted market prices as of December 31, 2016. Due to changes in marketinterest rates and credit spreads since the issue of our Eurobonds which carry a fixed coupon interest rate, the fair value deviatesfrom the principal amount.
ASML ANNUAL REPORT 2016 F-32
15. Lines of CreditOur available credit facilities amount to EUR 700.0 million as of December 31, 2016 and as of December 31, 2015. No amountswere outstanding under these credit facilities at the end of 2016 and 2015. The amounts available at December 31, 2016 and 2015consisted of one EUR 700.0 million committed revolving credit facility with a group of banks. In 2015, the terms and conditions ofthe facility were amended by, among other things, removing the financial covenant and by extending the maturity until 2020. In2016, we exercised our extension option, extending the maturity date to 2021. Outstanding amounts under this credit facility willbear interest at EURIBOR or LIBOR plus a margin that depends on our credit rating.
16. Commitments, Contingencies and GuaranteesWe have various contractual obligations, some of which are required to be recorded as liabilities in our Financial Statements,including long- and short-term debt. Other contractual obligations, namely operating lease commitments, purchase obligations andguarantees, are generally not required to be recognized as liabilities on our Consolidated Balance Sheets but are required to bedisclosed.
Our contractual obligations as of December 31, 2016 can be summarized as follows:
Payments due by period Total 1 year 2 year 3 year 4 year 5 yearAfter
5 years
(in thousands) EUR EUR EUR EUR EUR EUR EUR
Long-Term Debt Obligations, including interestexpense 1
3,757,498 306,215 83,752 56,718 56,762 56,246 3,197,805
Operating Lease Obligations 103,568 35,486 23,613 18,616 13,577 7,050 5,226
Purchase Obligations 2,202,595 1,923,647 233,021 9,481 7,901 7,417 21,128
Zeiss High-NA Funding Commitment 748,000 129,000 219,500 179,500 113,000 69,000 38,000
Total Contractual Obligations 2
6,811,661 2,394,348 559,886 264,315 191,240 139,713 3,262,159
1. See Note 14 to our Financial Statements for the amounts excluding interest expense. 2. We have excluded unrecognized tax benefits for an amount of EUR 136.4 million as the amounts that will be settled in cash are not known and the timing of any
payments is uncertain.
Long-term debt obligations mainly relate to interest payments and principal amounts of our Eurobonds. See Note 14.
Operating lease obligations include leases of equipment and facilities. Lease payments recognized as an expense were EUR 45.2million, EUR 45.1 million and EUR 43.9 million for the years ended December 31, 2016, 2015 and 2014, respectively.
Several operating leases for our buildings contain purchase options, exercisable at the end of the lease, and in some cases, duringthe term of the lease. During 2015 we have exercised these options which are effectuated in 2016, therefore no purchase optionsexist as per year end December 31, 2016.
Purchase obligations exist of purchase commitments towards suppliers in the ordinary course of business. ASML expects that itwill honor these purchase obligations to fulfill future sales, in line with the timing of those future sales. The general terms andconditions of the agreements relating to the major part of our purchase commitments as of December 31, 2016 contain clausesthat enable us to delay or cancel delivery of ordered goods and services up to the dates specified in the corresponding purchasecontracts. These terms and conditions that we typically agree with our supply chain partners give us additional flexibility to adaptour purchase obligations to our requirements in light of the cyclicality and technological developments inherent in the industry inwhich we operate. We establish a provision for cancellation costs when the liability has been incurred and the amount ofcancellation fees is reasonably estimable.

On November 3, 2016 ASML and Zeiss announced that they agreed to strengthen their long-standing and successful partnership inthe semiconductor lithography business. ASML has agreed with Zeiss to support Carl Zeiss SMT's R&D costs, capital expendituresand other supply chain investments, in respect of High NA, for an amount of EUR 760.0 million over 6 years. At the end of 2016 anamount of EUR 12.0 million was paid, resulting in a remaining commitment as of December 31, 2016 of EUR 748.0 million.
We have a non-committed guarantee facility of EUR 15.0 million under which guarantees in the ordinary course of business can beprovided to third parties.
ASML ANNUAL REPORT 2016 F-33
17. Employee BenefitsWe have a performance related bonus plan for our senior management. Under this plan, the bonus amounts depend on actualperformance against corporate and personal targets. Within ASML (excluding Cymer), the bonus for members of seniormanagement can range between 0.0 percent and 75.0 percent of their annual salaries. Within Cymer, bonuses can range between0.0 percent and 150.0 percent of their annual salary. The performance targets are set for a whole year. The bonuses over 2016 areaccrued for in the Consolidated Balance Sheets as of December 31, 2016 and are expected to be paid in the first quarter of 2017.
Our bonus expenses for the BoM, former BoM and senior management were as follows:
Year ended December 31 2014 2015 2016
(in thousands) EUR EUR EUR
Board of Management 1 3,495 3,405 3,545
Other senior management 45,462 44,562 48,473
Bonus expenses 48,957 47,967 52,018
1. Bonus expenses in relation to the STI cash bonus for our BoM and former BoM. Former BoM is only applicable in 2014.
Profit-sharing Plan We have a profit-sharing plan covering all European and US non-sales employees who are not members of the BoM or seniormanagement. Under the plan, eligible employees receive an annual profit-sharing, based on a percentage of net income relative tototal net sales ranging from 0.0 to 20.0 percent of their annual salary. The profit sharing for the years 2016, 2015 and 2014 was 16.0percent or EUR 93.3 million, 18.0 percent or EUR 95.1 million and 16.0 percent or EUR 71.3 million, respectively. Our profit is alsoone of the criteria for the variable pay programs for employees in Asia. Expenses in relation to these plans amount to EUR 33.8million for 2016, EUR 32.0 million for 2015 and EUR 25.9 million for 2014.
Share-based Compensation In the past we have adopted various share and option plans for our employees. Starting January 1, 2014 the Employee UmbrellaShare Plan has become effective, covering all grants made as of that date for our employees. The AGM approves each year themaximum number of shares that can be used by ASML to execute share-based incentives. Within this limit, the SB determines themaximum number of shares that is granted to the BoM in line with the Remuneration Policy and the BoM determines the totalmaximum of shares that can be granted in that year for eligible employees in line with existing policies. Our current share-basedcompensation plans do not provide for cash settlement of options and shares.
The total gross amount of recognized compensation expenses associated with share-based payments (including share-basedpayments to the BoM) was EUR 47.7 million in 2016, EUR 59.1 million in 2015 and EUR 63.4 million in 2014. The tax benefitrecognized related to the recognized share-based compensation costs amounted to EUR 10.0 million in 2016, EUR 13.8 million in2015 and EUR 14.9 million in 2014.
Total compensation costs to be recognized in future periods amount to EUR 83.2 million as of December 31, 2016 (2015: EUR 65.4million; 2014: EUR 69.8 million). The weighted average period over which these costs are expected to be recognized is calculatedat 1.9 years (2015: 1.7 years; 2014: 1.6 years).
Employee Umbrella Share Plan The Employee Umbrella Share Plan, effective as of January 1, 2014 covers all employees. Within this plan, we distinguish betweenperformance and incentive shares. Within the incentive category, prior to October 3, 2016 employees could choose, at inception, toconvert the shares into options. As of October 3, 2016 this option no longer exists. All grants under the Employee Umbrella SharePlan typically have a three-year vesting period.
Share Plans Our current share plans typically include a three-year service period and some plans have vesting conditions which are based onperformance. The fair value of shares is determined on the closing trading price of our shares listed at Euronext Amsterdam on thegrant date.

Details with respect to shares granted and vested during the year are set out in the following table:
EUR-denominated USD-denominated
Year ended December 31 2014 2015 2016 2014 2015 2016
Total fair value at vesting date of shares vested during the year (in thousands) 56,214 52,002 25,517 76,605 47,722 31,317
Weighted average fair value of shares granted 65.71 88.83 87.21 84.62 102.42 96.00
A summary of the status of conditionally outstanding shares as of December 31, 2016, and changes during the year endedDecember 31, 2016, is presented below:
EUR-denominated USD-denominated
Numberof shares
Weightedaverage
fair value atgrant date
(EUR)Number
of shares
Weightedaverage
fair value atgrant date
(USD)Conditional shares outstanding at January 1, 2016 804,508 71.05 803,046 92.46Granted 396,237 87.21 563,806 96.00Vested (294,110) 68.09 (329,345) 88.72Forfeited (22,431) 69.21 (82,899) 92.74Conditional shares outstanding at December 31, 2016 884,204 79.33 954,608 95.81
Option Plans Our current option plans typically vest over a three year service period with any unexercised stock options expiring ten years afterthe grant date. Options granted have fixed exercise prices equal to the closing price of our shares listed at Euronext Amsterdam ongrant date. The fair value of stock options is determined using a Black-Scholes option valuation model.
The Black-Scholes option valuation of our stock options granted during the year is based on the following assumptions:
Year ended December 31 2014 2015 2016
Weighted average share price (in EUR) 65.0 88.1 88.3
Volatility (in percentage) 23.5 28.7 27.2
Expected life (in years) 5.6 5.6 5.7
Risk free interest rate 0.5 — —
Expected dividend yield (in EUR) 2.25 2.52 2.94
Forfeiture rate 1 — — —
1. For the years ending December 31, 2016, 2015 and 2014, forfeitures are estimated to be nil.
When establishing the expected life assumption we annually take into account the contractual terms of the stock options as well ashistorical employee exercise behavior.
Details with respect to stock options are set out in the following table:
EUR-denominated USD-denominated
Year ended December 31 2014 2015 2016 2014 2015 2016
Weighted average fair value of stock options granted 13.94 21.69 20.34 18.57 23.56 22.69
Weighted average share price at the exercise date of stock options 71.69 91.30 98.08 93.19 103.88 100.68
Aggregate intrinsic value of stock options exercised (in thousands) 12,098 12,880 11,540 9,497 6,202 4,134
Weighted average remaining contractual term of currently exercisable options 2.94 3.24 3.69 3.79 4.74 4.71
Aggregate intrinsic value of exercisable stock options (in thousands) 39,020 24,336 22,340 17,942 8,518 8,879
Aggregate intrinsic value of outstanding stock options (in thousands) 40,428 24,611 22,680 19,171 8,709 8,945
ASML ANNUAL REPORT 2016 F-34

The number and weighted average exercise prices of stock options as of December 31, 2016, and changes during the year thenended are presented below:
EUR-denominated USD-denominated
Numberof options
Weighted averageexercise price
per ordinaryshare (EUR)
Numberof options
Weighted averageexercise price
per ordinaryshare (USD)
Outstanding, January 1, 2016 455,680 28.97 237,005 53.21
Granted 20,561 92.13 14,859 93.80
Exercised (149,801) 21.04 (79,767) 48.85
Forfeited (2,639) 33.21 (6,500) 72.76
Expired — — — —
Outstanding, December 31, 2016 323,801 36.61 165,597 58.18
Exercisable, December 31, 2016 313,226 35.33 162,417 57.53
Details with respect to the stock options outstanding are set out in the following table:
EUR-denominated USD-denominated
Range ofexercise
prices (EUR)
Number ofoutstanding options
at December 31,2016
Weightedaverage
remainingcontractual life of
outstandingoptions (years)
Range ofexercise
prices (USD)
Number ofoutstanding options
at December 31,2016
Weightedaverage
remainingcontractual lifeof outstandingoptions (years)
0 - 10 — — 0 - 10 — —10 - 15 105,826 1.69 10 - 15 — —15 - 20 44,040 1.30 15 - 20 3,911 1.8020 - 25 50,093 1.70 20 - 25 39,685 1.7525 - 40 11,543 4.76 25 - 40 40,461 2.0440 - 50 16,250 5.80 40 - 50 959 4.6250 - 60 10,670 6.92 50 - 60 5,173 5.6960 - 70 23,545 6.92 60 - 70 801 6.0670 - 80 20,579 8.33 70 - 80 1,787 6.3080 - 90 20,765 8.86 80 - 90 20,229 7.75
90 - 100 13,109 8.27 90 - 100 41,955 8.02100 - 110 7,381 9.56 100 - 110 10,636 8.32
Total 323,801 3.84 Total 165,597 4.77
Employee Purchase Plan Every quarter, we offer our worldwide payroll employees the opportunity to buy our shares or our stock options (up to and includingOctober 2, 2016; thereafter employees can only purchase shares) against fair value using their net salary. The BoM is excludedfrom participation in this plan. The fair value for shares is based on the closing price of our shares listed at Euronext Amsterdam ongrant date. The fair value of the stock options is determined using a Black-Scholes option valuation model. For the assumptions onwhich the Black-Scholes option valuation model is used, see the disclosure above under the caption "Option Plans". The maximumnet amount for which employees can participate in the plan amounts to 10.0 percent of their annual gross base salary. Whenemployees retain the shares and/or stock options for a minimum of 12 months, we will pay out a 20.0 percent cash bonus on theinitial participation amount.
Deferred Compensation Plans In July 2002, we adopted a non-qualified deferred compensation plan for our US employees that allows a select group ofmanagement or highly compensated employees to defer a portion of their salary, bonus, and commissions. The plan allows us tocredit additional amounts to the participants’ account balances. The participants divide their funds among the investmentsavailable in the plan. Participants elect to receive their funds in future periods after the earlier of their employment termination ortheir withdrawal election, at least three years after deferral. There were minor expenses relating to this plan in 2016, 2015 and 2014.Cymer has a similar non-qualified deferred compensation plan for a selected group of management level employees in the US inwhich the employee may elect to defer receipt of current compensation in order to provide retirement and other benefits on behalfof such employee backed by Cymer owned life insurance policies.
As of December 31, 2016, our liability under deferred compensation plans was EUR 40.6 million (2015: EUR 33.1 million).
ASML ANNUAL REPORT 2016 F-35
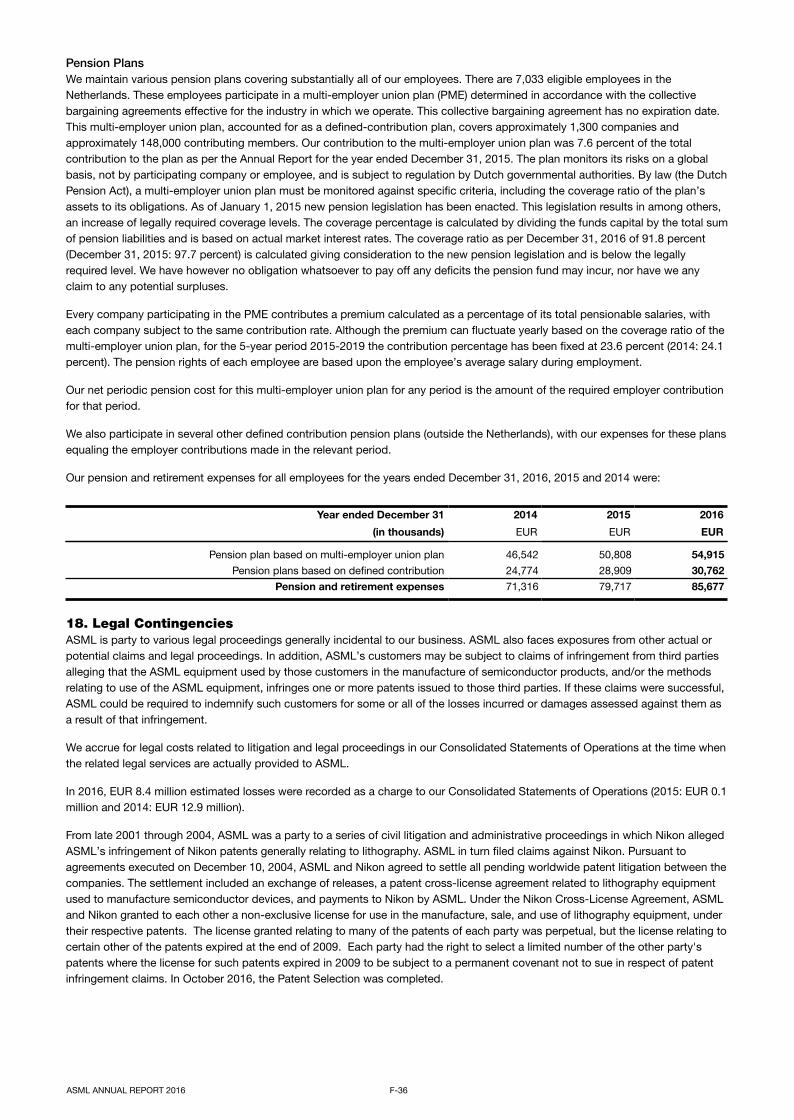
Pension Plans We maintain various pension plans covering substantially all of our employees. There are 7,033 eligible employees in theNetherlands. These employees participate in a multi-employer union plan (PME) determined in accordance with the collectivebargaining agreements effective for the industry in which we operate. This collective bargaining agreement has no expiration date.This multi-employer union plan, accounted for as a defined-contribution plan, covers approximately 1,300 companies andapproximately 148,000 contributing members. Our contribution to the multi-employer union plan was 7.6 percent of the totalcontribution to the plan as per the Annual Report for the year ended December 31, 2015. The plan monitors its risks on a globalbasis, not by participating company or employee, and is subject to regulation by Dutch governmental authorities. By law (the DutchPension Act), a multi-employer union plan must be monitored against specific criteria, including the coverage ratio of the plan’sassets to its obligations. As of January 1, 2015 new pension legislation has been enacted. This legislation results in among others,an increase of legally required coverage levels. The coverage percentage is calculated by dividing the funds capital by the total sumof pension liabilities and is based on actual market interest rates. The coverage ratio as per December 31, 2016 of 91.8 percent(December 31, 2015: 97.7 percent) is calculated giving consideration to the new pension legislation and is below the legallyrequired level. We have however no obligation whatsoever to pay off any deficits the pension fund may incur, nor have we anyclaim to any potential surpluses.
Every company participating in the PME contributes a premium calculated as a percentage of its total pensionable salaries, witheach company subject to the same contribution rate. Although the premium can fluctuate yearly based on the coverage ratio of themulti-employer union plan, for the 5-year period 2015-2019 the contribution percentage has been fixed at 23.6 percent (2014: 24.1percent). The pension rights of each employee are based upon the employee’s average salary during employment.
Our net periodic pension cost for this multi-employer union plan for any period is the amount of the required employer contributionfor that period.
We also participate in several other defined contribution pension plans (outside the Netherlands), with our expenses for these plansequaling the employer contributions made in the relevant period.
Our pension and retirement expenses for all employees for the years ended December 31, 2016, 2015 and 2014 were:
Year ended December 31 2014 2015 2016
(in thousands) EUR EUR EUR
Pension plan based on multi-employer union plan 46,542 50,808 54,915Pension plans based on defined contribution 24,774 28,909 30,762
Pension and retirement expenses 71,316 79,717 85,677
ASML ANNUAL REPORT 2016 F-36
18. Legal ContingenciesASML is party to various legal proceedings generally incidental to our business. ASML also faces exposures from other actual orpotential claims and legal proceedings. In addition, ASML’s customers may be subject to claims of infringement from third partiesalleging that the ASML equipment used by those customers in the manufacture of semiconductor products, and/or the methodsrelating to use of the ASML equipment, infringes one or more patents issued to those third parties. If these claims were successful,ASML could be required to indemnify such customers for some or all of the losses incurred or damages assessed against them asa result of that infringement.
We accrue for legal costs related to litigation and legal proceedings in our Consolidated Statements of Operations at the time whenthe related legal services are actually provided to ASML.
In 2016, EUR 8.4 million estimated losses were recorded as a charge to our Consolidated Statements of Operations (2015: EUR 0.1million and 2014: EUR 12.9 million).
From late 2001 through 2004, ASML was a party to a series of civil litigation and administrative proceedings in which Nikon allegedASML’s infringement of Nikon patents generally relating to lithography. ASML in turn filed claims against Nikon. Pursuant toagreements executed on December 10, 2004, ASML and Nikon agreed to settle all pending worldwide patent litigation between thecompanies. The settlement included an exchange of releases, a patent cross-license agreement related to lithography equipmentused to manufacture semiconductor devices, and payments to Nikon by ASML. Under the Nikon Cross-License Agreement, ASMLand Nikon granted to each other a non-exclusive license for use in the manufacture, sale, and use of lithography equipment, undertheir respective patents. The license granted relating to many of the patents of each party was perpetual, but the license relating tocertain other of the patents expired at the end of 2009. Each party had the right to select a limited number of the other party'spatents where the license for such patents expired in 2009 to be subject to a permanent covenant not to sue in respect of patentinfringement claims. In October 2016, the Patent Selection was completed.

In addition, the Nikon Cross-License Agreement provided that following the termination of some of the licenses granted in theNikon Cross-License Agreement on December 31, 2009, there would be a standstill period during which the parties agreed not tobring patent infringement suits against each other. This standstill period ran from January 1, 2010 through December 31, 2014.Damages resulting from claims for patent infringement occurring during the Cross-License Transition Period are limited to threepercent of the net sales price of applicable licensed products including optical components.
Accordingly, from January 1, 2015, both Nikon and we are no longer prohibited under the agreement from bringing claims againsteach other on the basis of infringement of patents subject to the Nikon Cross-License Agreement, other than perpetually licensedpatents. In addition, as described above, the Patent Selection was completed in October 2016. Therefore, there is now a definedgroup of patents owned by each party for which the license granted to the other party has expired.
If Nikon files suit against us alleging patent infringement, we may incur substantial legal fees and expenses, and we may notprevail. Similarly, if we file suit against Nikon alleging patent infringement, we may incur substantial legal fees and expenses, andwe may not prevail. Patent litigation is complex and may extend for a protracted period of time, giving rise to the potential for bothsubstantial costs and diverting the attention of key management and technical personnel. Potential adverse outcomes from patentlitigation may include, without limitation, payment of significant monetary damages, injunctive relief prohibiting the sale of products,and/or settlement involving significant costs to be paid by us, any of which may have a material adverse effect on our business,financial condition and/or results of operations. We are unable to predict at this time whether any such patent suit will in factmaterialize, or, if so, what its outcome might be.
ASML ANNUAL REPORT 2016 F-37
19. Income TaxesThe components of the provision for income taxes are as follows:
Year ended December 31 2014 2015 2016
(in thousands) EUR EUR EUR
Current tax (130,425) (116,094) (157,834)
Deferred tax 53,430 (45,352) (61,650)
Provision for income taxes (76,995) (161,446) (219,484)
The Dutch statutory tax rate was 25.0 percent in 2016, 2015 and 2014. Tax amounts in other jurisdictions are calculated at the ratesprevailing in the relevant jurisdictions.
The reconciliation of the provision for income taxes is as follows:
Year ended December 31 2014 2015 2016
(in thousands) EUR % 1 EUR % 1 EUR % 1
Income before income taxes 1,273,635 100.0 % 1,548,620 100.0 % 1,691,378 100.0 %
Income tax provision based on ASML’s domestic rate (318,409) 25.0 % (387,155) 25.0 % (422,845) 25.0 %
Effects of tax rates in foreign jurisdictions (1,580) 0.1 % 5,370 (0.3)% (2,665) 0.2 %
Adjustments in respect of tax exempt income 23,899 (1.9)% 31,276 (2.0)% 31,307 (1.9)%
Adjustments in respect of tax incentives 159,728 (12.5)% 205,555 (13.3)% 178,294 (10.5)%
Adjustments in respect of prior years’ current taxes (6,474) 0.5 % (13,559) 0.9 % (4,719) 0.3 %
Adjustments in respect of prior years’ deferred taxes 1,325 (0.1)% 6,001 (0.4)% (6,604) 0.4 %
Movements in the liability for unrecognized tax benefits (9,669) 0.8 % (10,600) 0.7 % 3,995 (0.2)%
Tax effects in respect of acquisition related items 77,909 (6.1)% — — % 8,792 (0.5)%
Other credits and non tax deductible items (3,724) 0.3 % 1,666 (0.1)% (5,039) 0.3 %
Provision for income taxes (76,995) 6.0 % (161,446) 10.4 % (219,484) 13.0 %
1. As a percentage of income before income taxes.
Income tax provision based on ASML’s domestic rate The provision for income taxes based on ASML’s domestic rate is based on the Dutch statutory income tax rate. It reflects theprovision for income taxes that would have been applicable assuming that all of our income is taxable against the Dutch statutorytax rate and there were no permanent differences between taxable base and financial results and no Dutch tax incentives wereapplied.
Effects of tax rates in foreign jurisdictions A portion of our results is realized in countries other than the Netherlands where different tax rates are applicable.
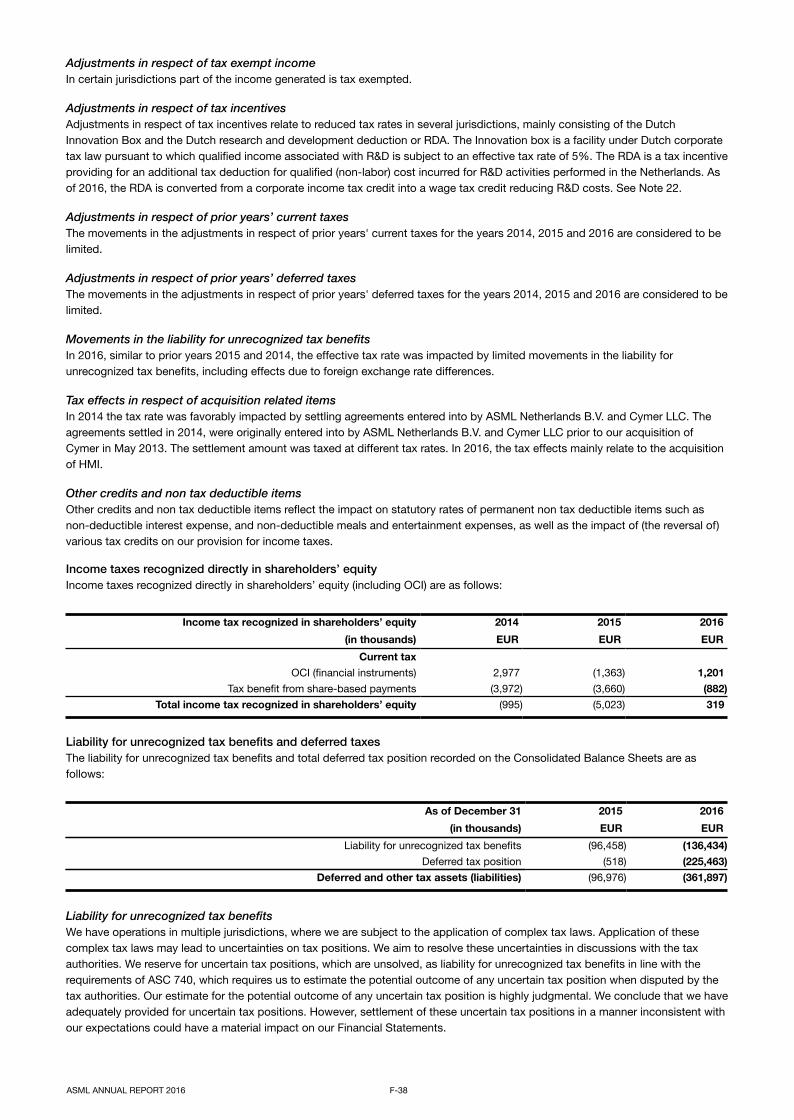
Adjustments in respect of tax exempt income In certain jurisdictions part of the income generated is tax exempted.
Adjustments in respect of tax incentives Adjustments in respect of tax incentives relate to reduced tax rates in several jurisdictions, mainly consisting of the DutchInnovation Box and the Dutch research and development deduction or RDA. The Innovation box is a facility under Dutch corporatetax law pursuant to which qualified income associated with R&D is subject to an effective tax rate of 5%. The RDA is a tax incentiveproviding for an additional tax deduction for qualified (non-labor) cost incurred for R&D activities performed in the Netherlands. Asof 2016, the RDA is converted from a corporate income tax credit into a wage tax credit reducing R&D costs. See Note 22.
Adjustments in respect of prior years’ current taxes The movements in the adjustments in respect of prior years' current taxes for the years 2014, 2015 and 2016 are considered to belimited.
Adjustments in respect of prior years’ deferred taxes The movements in the adjustments in respect of prior years' deferred taxes for the years 2014, 2015 and 2016 are considered to belimited.
Movements in the liability for unrecognized tax benefitsIn 2016, similar to prior years 2015 and 2014, the effective tax rate was impacted by limited movements in the liability forunrecognized tax benefits, including effects due to foreign exchange rate differences.
Tax effects in respect of acquisition related items In 2014 the tax rate was favorably impacted by settling agreements entered into by ASML Netherlands B.V. and Cymer LLC. Theagreements settled in 2014, were originally entered into by ASML Netherlands B.V. and Cymer LLC prior to our acquisition ofCymer in May 2013. The settlement amount was taxed at different tax rates. In 2016, the tax effects mainly relate to the acquisitionof HMI.
Other credits and non tax deductible items Other credits and non tax deductible items reflect the impact on statutory rates of permanent non tax deductible items such asnon-deductible interest expense, and non-deductible meals and entertainment expenses, as well as the impact of (the reversal of)various tax credits on our provision for income taxes.
Income taxes recognized directly in shareholders’ equity Income taxes recognized directly in shareholders’ equity (including OCI) are as follows:
Income tax recognized in shareholders’ equity 2014 2015 2016
(in thousands) EUR EUR EUR
Current taxOCI (financial instruments) 2,977 (1,363) 1,201
Tax benefit from share-based payments (3,972) (3,660) (882)Total income tax recognized in shareholders’ equity (995) (5,023) 319
Liability for unrecognized tax benefits and deferred taxesThe liability for unrecognized tax benefits and total deferred tax position recorded on the Consolidated Balance Sheets are asfollows:
As of December 31 2015 2016
(in thousands) EUR EUR
Liability for unrecognized tax benefits (96,458) (136,434)Deferred tax position (518) (225,463)
Deferred and other tax assets (liabilities) (96,976) (361,897)
Liability for unrecognized tax benefitsWe have operations in multiple jurisdictions, where we are subject to the application of complex tax laws. Application of thesecomplex tax laws may lead to uncertainties on tax positions. We aim to resolve these uncertainties in discussions with the taxauthorities. We reserve for uncertain tax positions, which are unsolved, as liability for unrecognized tax benefits in line with therequirements of ASC 740, which requires us to estimate the potential outcome of any uncertain tax position when disputed by thetax authorities. Our estimate for the potential outcome of any uncertain tax position is highly judgmental. We conclude that we haveadequately provided for uncertain tax positions. However, settlement of these uncertain tax positions in a manner inconsistent withour expectations could have a material impact on our Financial Statements.
ASML ANNUAL REPORT 2016 F-38
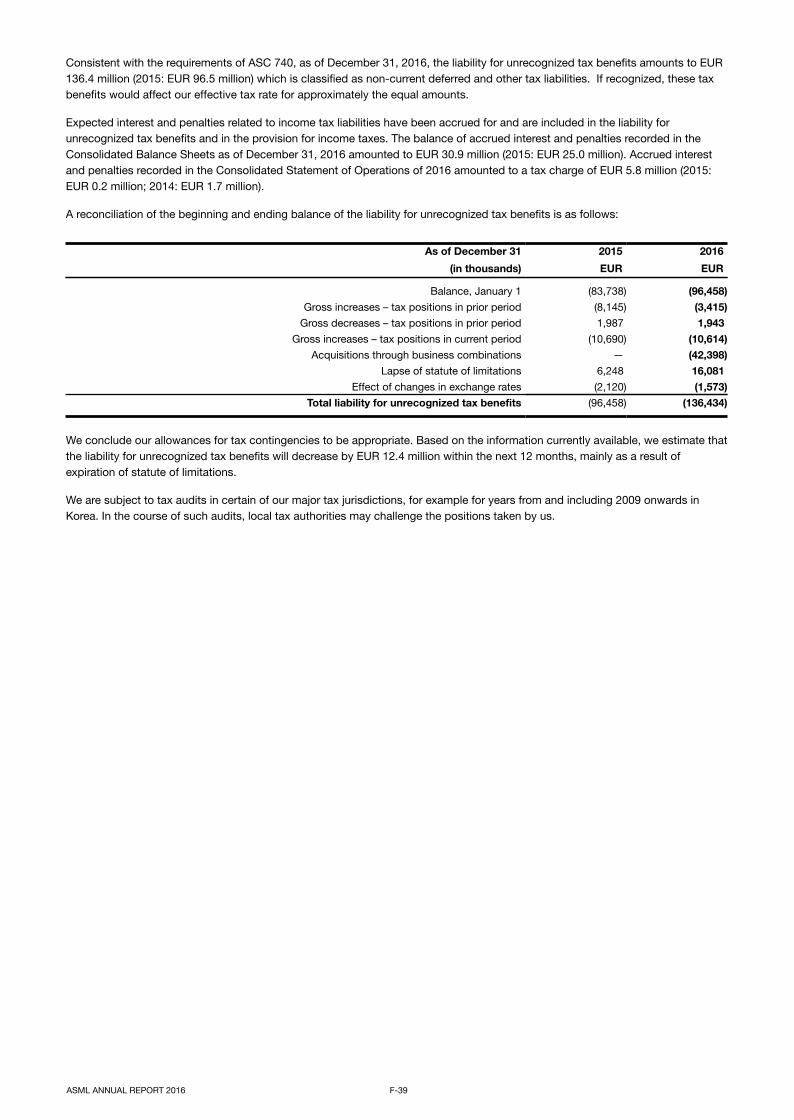
Consistent with the requirements of ASC 740, as of December 31, 2016, the liability for unrecognized tax benefits amounts to EUR136.4 million (2015: EUR 96.5 million) which is classified as non-current deferred and other tax liabilities. If recognized, these taxbenefits would affect our effective tax rate for approximately the equal amounts.
Expected interest and penalties related to income tax liabilities have been accrued for and are included in the liability forunrecognized tax benefits and in the provision for income taxes. The balance of accrued interest and penalties recorded in theConsolidated Balance Sheets as of December 31, 2016 amounted to EUR 30.9 million (2015: EUR 25.0 million). Accrued interestand penalties recorded in the Consolidated Statement of Operations of 2016 amounted to a tax charge of EUR 5.8 million (2015:EUR 0.2 million; 2014: EUR 1.7 million).
A reconciliation of the beginning and ending balance of the liability for unrecognized tax benefits is as follows:
As of December 31 2015 2016
(in thousands) EUR EUR
Balance, January 1 (83,738) (96,458)Gross increases – tax positions in prior period (8,145) (3,415)
Gross decreases – tax positions in prior period 1,987 1,943Gross increases – tax positions in current period (10,690) (10,614)
Acquisitions through business combinations — (42,398)Lapse of statute of limitations 6,248 16,081
Effect of changes in exchange rates (2,120) (1,573)Total liability for unrecognized tax benefits (96,458) (136,434)
We conclude our allowances for tax contingencies to be appropriate. Based on the information currently available, we estimate thatthe liability for unrecognized tax benefits will decrease by EUR 12.4 million within the next 12 months, mainly as a result ofexpiration of statute of limitations.
We are subject to tax audits in certain of our major tax jurisdictions, for example for years from and including 2009 onwards inKorea. In the course of such audits, local tax authorities may challenge the positions taken by us.
ASML ANNUAL REPORT 2016 F-39
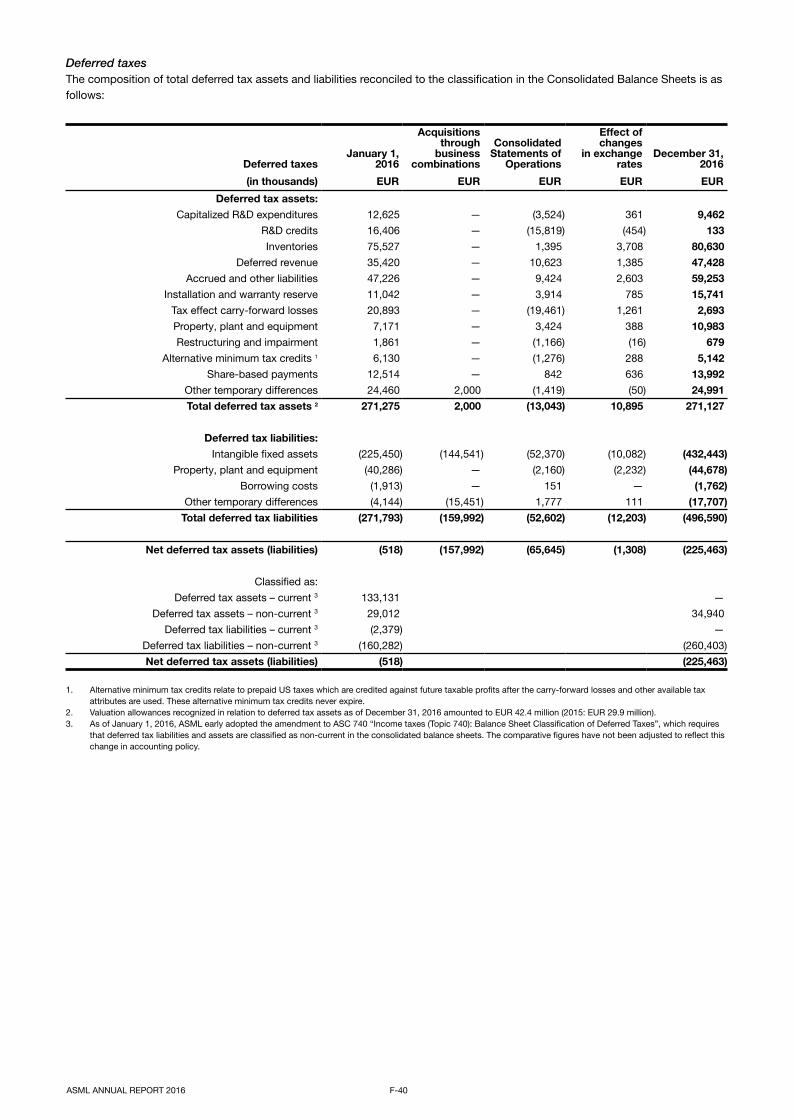
Deferred taxesThe composition of total deferred tax assets and liabilities reconciled to the classification in the Consolidated Balance Sheets is asfollows:
Deferred taxesJanuary 1,
2016
Acquisitionsthrough
businesscombinations
ConsolidatedStatements of
Operations
Effect ofchanges
in exchangerates
December 31,2016
(in thousands) EUR EUR EUR EUR EUR
Deferred tax assets:Capitalized R&D expenditures 12,625 — (3,524) 361 9,462
R&D credits 16,406 — (15,819) (454) 133Inventories 75,527 — 1,395 3,708 80,630
Deferred revenue 35,420 — 10,623 1,385 47,428Accrued and other liabilities 47,226 — 9,424 2,603 59,253
Installation and warranty reserve 11,042 — 3,914 785 15,741Tax effect carry-forward losses 20,893 — (19,461) 1,261 2,693Property, plant and equipment 7,171 — 3,424 388 10,983Restructuring and impairment 1,861 — (1,166) (16) 679
Alternative minimum tax credits 1 6,130 — (1,276) 288 5,142Share-based payments 12,514 — 842 636 13,992
Other temporary differences 24,460 2,000 (1,419) (50) 24,991Total deferred tax assets 2 271,275 2,000 (13,043) 10,895 271,127
Deferred tax liabilities:Intangible fixed assets (225,450) (144,541) (52,370) (10,082) (432,443)
Property, plant and equipment (40,286) — (2,160) (2,232) (44,678)Borrowing costs (1,913) — 151 — (1,762)
Other temporary differences (4,144) (15,451) 1,777 111 (17,707)Total deferred tax liabilities (271,793) (159,992) (52,602) (12,203) (496,590)
Net deferred tax assets (liabilities) (518) (157,992) (65,645) (1,308) (225,463)
Classified as:Deferred tax assets – current 3 133,131 —
Deferred tax assets – non-current 3 29,012 34,940Deferred tax liabilities – current 3 (2,379) —
Deferred tax liabilities – non-current 3 (160,282) (260,403)Net deferred tax assets (liabilities) (518) (225,463)
1. Alternative minimum tax credits relate to prepaid US taxes which are credited against future taxable profits after the carry-forward losses and other available taxattributes are used. These alternative minimum tax credits never expire.
2. Valuation allowances recognized in relation to deferred tax assets as of December 31, 2016 amounted to EUR 42.4 million (2015: EUR 29.9 million).3. As of January 1, 2016, ASML early adopted the amendment to ASC 740 “Income taxes (Topic 740): Balance Sheet Classification of Deferred Taxes”, which requires
that deferred tax liabilities and assets are classified as non-current in the consolidated balance sheets. The comparative figures have not been adjusted to reflect thischange in accounting policy.
ASML ANNUAL REPORT 2016 F-40
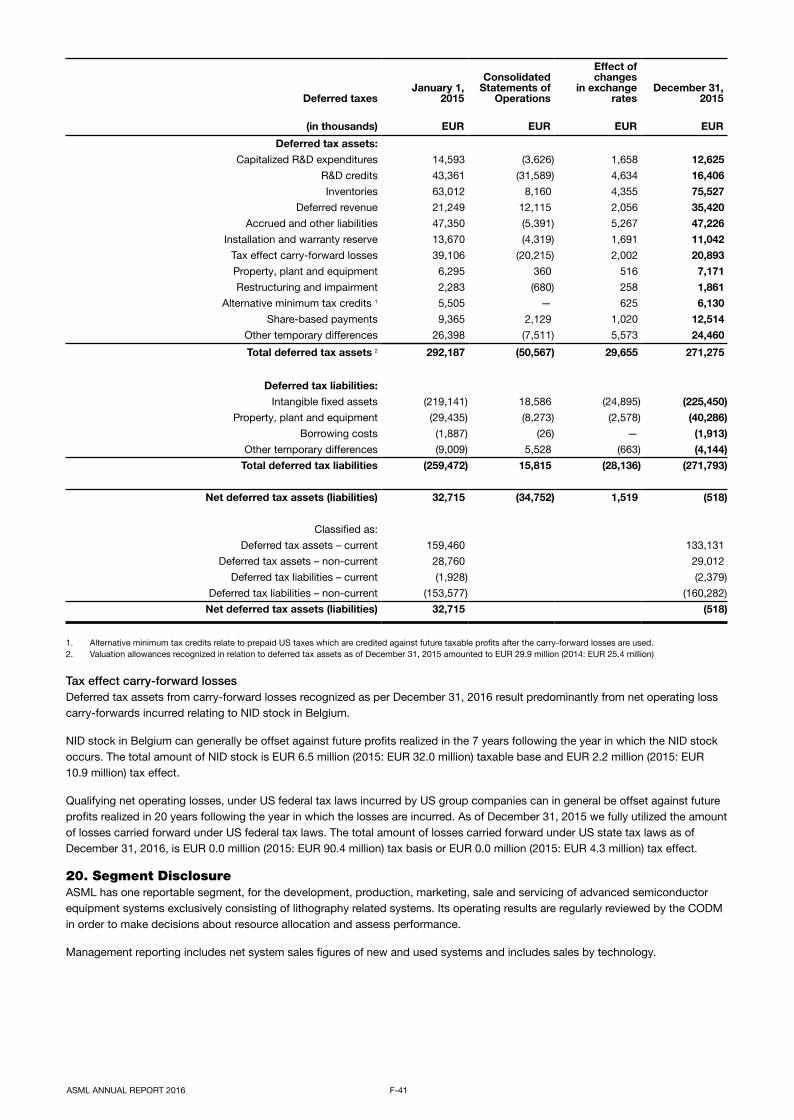
Deferred taxesJanuary 1,
2015
ConsolidatedStatements of
Operations
Effect ofchanges
in exchangerates
December 31,2015
(in thousands) EUR EUR EUR EUR
Deferred tax assets:Capitalized R&D expenditures 14,593 (3,626) 1,658 12,625
R&D credits 43,361 (31,589) 4,634 16,406Inventories 63,012 8,160 4,355 75,527
Deferred revenue 21,249 12,115 2,056 35,420Accrued and other liabilities 47,350 (5,391) 5,267 47,226
Installation and warranty reserve 13,670 (4,319) 1,691 11,042Tax effect carry-forward losses 39,106 (20,215) 2,002 20,893Property, plant and equipment 6,295 360 516 7,171Restructuring and impairment 2,283 (680) 258 1,861
Alternative minimum tax credits 1 5,505 — 625 6,130Share-based payments 9,365 2,129 1,020 12,514
Other temporary differences 26,398 (7,511) 5,573 24,460
Total deferred tax assets 2 292,187 (50,567) 29,655 271,275
Deferred tax liabilities:Intangible fixed assets (219,141) 18,586 (24,895) (225,450)
Property, plant and equipment (29,435) (8,273) (2,578) (40,286)Borrowing costs (1,887) (26) — (1,913)
Other temporary differences (9,009) 5,528 (663) (4,144)Total deferred tax liabilities (259,472) 15,815 (28,136) (271,793)
Net deferred tax assets (liabilities) 32,715 (34,752) 1,519 (518)
Classified as:Deferred tax assets – current 159,460 133,131
Deferred tax assets – non-current 28,760 29,012Deferred tax liabilities – current (1,928) (2,379)
Deferred tax liabilities – non-current (153,577) (160,282)Net deferred tax assets (liabilities) 32,715 (518)
1. Alternative minimum tax credits relate to prepaid US taxes which are credited against future taxable profits after the carry-forward losses are used.2. Valuation allowances recognized in relation to deferred tax assets as of December 31, 2015 amounted to EUR 29.9 million (2014: EUR 25.4 million)
Tax effect carry-forward losses Deferred tax assets from carry-forward losses recognized as per December 31, 2016 result predominantly from net operating losscarry-forwards incurred relating to NID stock in Belgium.
NID stock in Belgium can generally be offset against future profits realized in the 7 years following the year in which the NID stockoccurs. The total amount of NID stock is EUR 6.5 million (2015: EUR 32.0 million) taxable base and EUR 2.2 million (2015: EUR10.9 million) tax effect.
Qualifying net operating losses, under US federal tax laws incurred by US group companies can in general be offset against futureprofits realized in 20 years following the year in which the losses are incurred. As of December 31, 2015 we fully utilized the amountof losses carried forward under US federal tax laws. The total amount of losses carried forward under US state tax laws as ofDecember 31, 2016, is EUR 0.0 million (2015: EUR 90.4 million) tax basis or EUR 0.0 million (2015: EUR 4.3 million) tax effect.
ASML ANNUAL REPORT 2016 F-41
20. Segment DisclosureASML has one reportable segment, for the development, production, marketing, sale and servicing of advanced semiconductorequipment systems exclusively consisting of lithography related systems. Its operating results are regularly reviewed by the CODMin order to make decisions about resource allocation and assess performance.
Management reporting includes net system sales figures of new and used systems and includes sales by technology.

Net system sales for new and used systems were as follows:
Year ended December 31 2014 2015 2016
(in thousands) EUR EUR EUR
New systems 4,127,433 4,109,439 4,499,315Used systems 115,357 127,744 71,803
Net system sales 4,242,790 4,237,183 4,571,118
Net system sales per technology were as follows:
Year ended December 31Net system sales
in unitsNet system sales
in EUR thousands2016EUV 4 324,854ArFi 70 3,518,718ArF 6 116,876KrF 57 532,661
i-line 20 78,009Total 157 4,571,118
2015EUV 1 70,473ArFi 67 3,238,452ArF 9 107,522KrF 74 747,740
i-line 18 72,996Total 169 4,237,183
2014EUV 5 299,845ArFi 76 3,477,718ArF 3 32,611KrF 38 381,436
i-line 14 51,180Total 136 4,242,790
The increase in net system sales of EUR 333.9 million, or 7.9 percent, to EUR 4,571.1 million in 2016 from EUR 4,237.2 million in2015 (2014: EUR 4,242.8 million) is mainly due to an increase in the number of EUV and ArFi systems sold.
For geographical reporting, total net sales are attributed to the geographic location in which the customers’ facilities are located.Long-lived assets are attributed to the geographic location in which these assets are located.
ASML ANNUAL REPORT 2016 F-42

Total net sales and long-lived assets (consisting of property, plant and equipment) by geographic region were as follows:
Year ended December 31 Total net salesLong-lived
assets
(in thousands) EUR EUR
2016Japan 404,259 4,277Korea 1,579,907 17,354
Singapore 245,785 844Taiwan 2,084,702 125,456China 779,547 3,156
Rest of Asia 19,758 2,757Netherlands 1,512 1,201,437
EMEA 551,330 4,093United States 1,127,952 327,863
Total 6,794,752 1,687,237
2015Japan 668,381 3,209Korea 1,971,650 11,626
Singapore 121,390 422Taiwan 1,551,512 60,029China 541,899 1,390
Rest of Asia 2,077 2,095Netherlands 3,521 1,229,800
EMEA 211,038 1,313United States 1,215,907 310,794
Total 6,287,375 1,620,678
2014Japan 477,110 3,695Korea 1,624,059 16,684
Singapore 132,593 879Taiwan 1,124,883 60,241China 403,371 1,766
Rest of Asia 2,205 2,041Netherlands 1,334 1,124,632
EMEA 196,332 1,322United States 1,894,390 236,263
Total 5,856,277 1,447,523
In 2016, net sales to the largest customer accounted for EUR 1,646.2 million, or 24.2 percent, of total net sales (2015: EUR 1,633.6million, or 26.0 percent, of total net sales; 2014: EUR 1,532.1 million, or 26.2 percent, of total net sales). Our three largestcustomers (based on total net sales) accounted for EUR 655.3 million, or 51.8 percent, of accounts receivable and financereceivables at December 31, 2016, compared with EUR 704.1 million, or 58.3 percent, at December 31, 2015.
Substantially all of our sales were export sales in 2016, 2015 and 2014.
ASML ANNUAL REPORT 2016 F-43
21. Selected Operating Expenses and Additional InformationPersonnel expenses for all payroll employees were:
Year ended December 31 2014 2015 2016
(in thousands) EUR EUR EUR
Wages and salaries 985,883 1,165,433 1,279,550
Social security expenses 81,721 92,910 103,847
Pension and retirement expenses 71,316 79,717 85,677
Share-based payments 63,380 59,070 47,701
Personnel expenses 1,202,300 1,397,130 1,516,775
The average number of payroll employees in FTEs during 2016, 2015 and 2014 was 12,852, 11,824 and 10,942, respectively.

The average number of payroll employees in FTEs in our operations in the Netherlands during 2016, 2015 and 2014 was 6,567,6,113 and 5,589, respectively. Both increases in 2016 compared to 2015 and in 2015 compared to 2014 in payroll employees (inFTEs) were in line with our net sales growth.
The total number of payroll and temporary employees in FTEs per sector was:
As of December 31 2014 2015 2016
Customer Support 3,289 3,607 4,210
SG&A 1,240 1,380 1,561
Manufacturing & Logistics 3,846 3,833 4,443
R&D 5,697 5,861 6,433
Total FTEs 14,072 14,681 16,647
Less: Temporary employees (in FTEs) 2,754 2,513 2,656
Payroll employees (in FTEs) 11,318 12,168 13,991
ASML ANNUAL REPORT 2016 F-44
22. Research and Development CostsR&D costs (net of credits and excluding contributions under the NRE Funding Agreements from Participating Customers in theCCIP) increased by EUR 37.7 million, or 3.5 percent, to EUR 1,105.8 million in 2016 from EUR 1,068.1 million in 2015. R&D costsfor both 2016 and 2015 were primarily focused on programs supporting EUV, DUV immersion, and Holistic Lithography. In 2016,R&D activities mainly related to:
• EUV - Further improving productivity, and supporting the design and industrialization of our NXE:3400B system includingpellicle development.
• DUV immersion - Focused on development of our next generation immersion platform, the NXT:2000i, as well as maturing theproduct introduction in the field of our NXT:1980 system.
• Holistic Lithography - Further development of YieldStar, process window control and enlargement solutions.
R&D costs (net of credits and excluding contributions under the NRE Funding Agreements from Participating Customers in theCCIP) decreased by EUR 6.0 million, or 0.6 percent, to EUR 1,068.1 million in 2015, from EUR 1,074.1 million in 2014. R&D costsfor both 2015 and 2014 were primarily focused on programs supporting EUV, DUV immersion, and Holistic Lithography. In 2015,R&D activities mainly related to:
• EUV - Further improving availability and productivity, and supporting the design of our NXE:3400B system;• DUV immersion - Focused on the final stages of development relating to our NXT:1980 systems, of which we shipped the first
systems in 2015, as well as development of future DUV platforms; and • Holistic Lithography - Further development of Yieldstar and process window control solutions.
Due to changes in tax regulations in the Netherlands effectuated in 2016, the R&D programs formerly defined as corporate incometax benefits (RDA), are now defined as wage tax benefits and therefore included as a credit in the R&D costs.
23. Interest and Other, NetInterest and other income of EUR 71.7 million (2015: EUR 10.9 million and 2014: EUR 14.5 million) relates to interest income ondeposits, short-term investments, money market funds, bank accounts and on finance receivables. In addition, in 2016 werecognized EUR 55.2 million on foreign currency revaluations on transactions and balances relating to the HMI acquisition inInterest and other, net.
Interest and other costs of EUR 38.0 million (2015: EUR 27.4 million and 2014: EUR 23.1 million) mainly consist of net interestexpense on our Eurobonds and related interest rate swaps, hedges, interest on lease obligations and amortized financing costs.
Interest on cash pools is reported on a gross basis in both interest income and interest expense. From an economic and legalperspective, the interest on cash pools of EUR 0.9 million (2015: EUR 1.5 million and 2014: EUR 3.2 million) recorded in interestincome nets off against the same amount recorded in interest expense.

24. Vulnerability Due to Certain ConcentrationsWe rely on outside vendors for components and subassemblies used in our systems including the design thereof, each of which isobtained from a single supplier or a limited number of suppliers. Our reliance on a limited group of suppliers involves several risks,including a potential inability to obtain an adequate supply of required components, reduced control over pricing and the risk ofuntimely delivery of these components and subassemblies.
Carl Zeiss SMT is our single supplier, and we are their single customer, of optical components for lithography systems. Carl ZeissSMT is capable of developing and producing these items only in limited numbers and only through the use of manufacturing andtesting facilities in Oberkochen and Wetzlar, Germany. ASML has agreed with Zeiss to acquire a 24.9% minority stake in Carl ZeissSMT, for EUR 1 billion in cash. The closing of this transaction is expected in the second quarter of 2017 and is conditional on,among other things, customary merger control approvals. In addition, ASML agreed to support Carl Zeiss SMT's R&D costs, capitalexpenditures and other supply chain investments, in respect of High-NA, in an amount of EUR 760 million over 6 years. At the endof 2016 an amount of EUR 12.0 million was paid, resulting in a remaining commitment as of December 31, 2016 of EUR 748.0million.
ASML ANNUAL REPORT 2016 F-45
25. Shareholders’ EquityShare Capital ASML’s authorized share capital amounts to EUR 126.0 million and is divided into: • 700,000,000 Cumulative Preference Shares with a nominal value of EUR 0.09 each; • 699,999,000 Ordinary Shares with a nominal value of EUR 0.09 each; and • 9,000 Ordinary Shares B with a nominal value of EUR 0.01 each.
As of December 31, 2016, 439,199,514 ordinary shares with a nominal value of EUR 0.09 each were issued and fully paid up; thisincludes 9,258,282 treasury shares. No ordinary shares B and no cumulative preference shares have been issued.
Shares Issued as a Result of the Acquisition of HMI
ASML and HMI completed the merger pursuant to which ASML acquired HMI on November 22, 2016. As part of the transaction,HEC and certain HMI officers have also agreed to (re)invest in ASML part of the proceeds to be received by them from selling theirHMI shares in the transaction, underscoring their belief in the strategic rationale for the transaction and their commitment to thecombined businesses going forward. Accordingly, ASML has issued a total number of 5,866,001 ordinary shares for an aggregateamount of EUR 580.6 million.
Our BoM has the power to issue ordinary shares and cumulative preference shares insofar as the BoM has been authorized to doso by the General Meeting of Shareholders. The BoM requires approval of the SB for such an issue. The authorization by theGeneral Meeting of Shareholders can only be granted for a certain period not exceeding five years and may be extended for nolonger than five years on each occasion. In case the General Meeting of Shareholders has not authorized the BoM to issue shares,the General Meeting of Shareholders shall have the power to issue shares upon the proposal of the BoM, provided that the SB hasapproved such proposal.
Shares Issued as a Result of the Acquisition of Cymer ASML and Cymer completed the merger pursuant to which ASML acquired Cymer on May 30, 2013. As a result of the merger,each share of Cymer common stock outstanding immediately prior to the completion of the merger was converted into the right toreceive USD 20.00 in cash plus 1.1502 ASML ordinary shares. As of December 31, 2016, we have issued 36,474,035 ordinaryshares for an aggregate amount of EUR 2,347.3 million in relation to the acquisition of Cymer.
Shares Issued in Relation to Share-based Compensation We have adopted various share and option plans for our employees. Whenever ordinary shares have to be delivered pursuant tothese plans, we typically deliver treasury shares that we purchase in share buy-back programs for this purpose. Because thesetreasury shares were no longer available in the course of 2014, we issued new ordinary shares from time to time to meet ourdelivery obligations under the plans. In 2016, we issued no new ordinary shares in relation to our ESOPs. The aggregate fair valueof the new ordinary shares issued is EUR 0.0 million in 2016 (2015: EUR 36.9 million; 2014: EUR 51.3 million). Fair value isdetermined on the closing price of our ordinary shares at Amsterdam Euronext at the date of respective issuance.

Ordinary Shares An ordinary share entitles the holder thereof to cast nine votes in the General Meeting of Shareholders. Each ordinary shareconsists of 900 fractional shares. Fractional shares entitle the holder thereof to a fractional dividend but do not entitle the holderthereof to voting rights. Only those persons who hold shares directly in the share register in the Netherlands, held by us at ouraddress at 5504 DR Veldhoven, de Run 6501, the Netherlands, or in the New York share register, held by JP Morgan Chase Bank,N.A., P.O. Box 64506, St. Paul, MN 55164-0506, United States, can hold fractional shares. Persons who hold ordinary sharesthrough the deposit system under the Dutch Securities Bank Giro Transactions Act (Wet giraal effectenverkeer; the Giro Act)maintained by the Dutch central securities depository Euroclear Nederland or through the DTC cannot hold fractional shares. At our2016 AGM, the BoM was authorized from April 29, 2016 through October 29, 2017, subject to the approval of the SB, to issueshares and/or rights thereto representing up to a maximum of 5.0 percent of our issued share capital at April 29, 2016, plus anadditional 5.0 percent of our issued share capital at April 29, 2016 that may be issued in connection with mergers, acquisitions and/or (strategic) alliances. At our 2017 AGM, our shareholders will be asked to extend this authority through October 26, 2018.
Holders of ASML’s ordinary shares have a preemptive right, in proportion to the aggregate nominal amount of the ordinary sharesheld by them. This preemptive right may be restricted or excluded. Holders of ordinary shares do not have preemptive right withrespect to any ordinary shares issued for consideration other than cash or ordinary shares issued to employees. If authorized forthis purpose by the General Meeting of Shareholders, the BoM has the power subject to approval of the SB, to restrict or excludethe preemptive rights of holders of ordinary shares. At our 2016 AGM, our shareholders authorized the BoM through October 29,2017, subject to approval of the SB, to restrict or exclude preemptive rights of holders of ordinary shares up to a maximum of 10percent of our issued share capital. At our 2017 AGM, our shareholders will be asked to extend this authority through October 26,2018.
Ordinary Shares B The articles of association provide for 9,000 ordinary shares B with a nominal value of EUR 0.01. Each ordinary share B entitles theholder thereof to cast one vote at the General Meeting of Shareholders. Holders of fractional shares had the opportunity, until July31, 2013, to convert fractional shares into ordinary shares B to obtain voting rights with respect to those fractional shares. Noordinary shares B have been issued.
Cumulative Preference Shares In 1998, we granted the Preference Share Option to the Foundation. This option was amended and extended in 2003 and 2007. Athird amendment to the option agreement between the Foundation and ASML became effective on January 1, 2009, to clarify theprocedure for the repurchase and cancellation of the preference shares when issued.
The nominal value of the cumulative preference shares amounts to EUR 0.09 and the number of cumulative preference sharesincluded in the authorized share capital is 700,000,000. A cumulative preference share entitles the holder thereof to cast nine votesin the General Meeting of Shareholders.
The Foundation may exercise the Preference Share Option in situations where, in the opinion of the Board of Directors of theFoundation, ASML’s interests, ASML’s business or the interests of ASML’s stakeholders are at stake. This may be the case if apublic bid for ASML’s shares has been announced or has been made, or the justified expectation exists that such a bid will bemade without any agreement having been reached in relation to such a bid with ASML. The same may apply if one shareholder, ormore shareholders acting in concert, hold a substantial percentage of ASML’s issued ordinary shares without making an offer or if,in the opinion of the Board of Directors of the Foundation, the (attempted) exercise of the voting rights by one shareholder or moreshareholders, acting in concert, is materially in conflict with ASML’s interests, ASML’s business or ASML’s stakeholders.
The objectives of the Foundation are to look after the interests of ASML and of the enterprises maintained by ASML and of thecompanies which are affiliated in a group with ASML, in such a way that the interests of ASML, of those enterprises and of allparties concerned are safeguarded in the best possible way, and influences in conflict with these interests which might affect theindependence or the identity of ASML and those companies are deterred to the best of the Foundation’s ability, and everythingrelated to the above or possibly conducive thereto. The Foundation seeks to realize its objects by the acquiring and holding ofcumulative preference shares in the capital of ASML and by exercising the rights attached to these shares, particularly the votingrights attached to these shares.
The Preference Share Option gives the Foundation the right to acquire a number of cumulative preference shares as the Foundationwill require, provided that the aggregate nominal value of such number of cumulative preference shares shall not exceed theaggregate nominal value of the ordinary shares that have been issued at the time of exercise of the Preference Share Option for asubscription price equal to their nominal value. Only one-fourth of the subscription price would be payable at the time of initialissuance of the cumulative preference shares, with the other three-fourths of the nominal value only being payable when we call upthis amount. Exercise of the preference share option could effectively dilute the voting power of the outstanding ordinary shares byone-half.
ASML ANNUAL REPORT 2016 F-46

Cancellation and repayment of the issued cumulative preference shares by ASML requires the authorization by the General Meetingof Shareholders of a proposal to do so by the BoM approved by the SB. If the Preference Share Option is exercised and as a resultcumulative preference shares are issued, ASML, at the request of the Foundation, will initiate the repurchase or cancellation of allcumulative preference shares held by the Foundation. In that case ASML is obliged to effect the repurchase and cancellationrespectively as soon as possible. A cancellation will have as a result a repayment of the amount paid and exemption from theobligation to pay up on the cumulative preference shares. A repurchase of the cumulative preference shares can only take placewhen such shares are fully paid up.
If the Foundation does not request ASML to repurchase or cancel all cumulative preference shares held by the Foundation within 20months after issuance of these shares, we will be obliged to convene a General Meeting of Shareholders in order to decide on arepurchase or cancellation of these shares.
The Foundation is independent of ASML. The Board of Directors of the Foundation comprises four independent members from theDutch business and academic communities. The members of the Board of Directors of the Foundation are: Mr. H. Bodt, Mr. M.W.den Boogert, Mr. J.M. de Jong and Mr. A.H. Lundqvist.
Dividend PolicyAs part of our financing policy, we aim to pay an annual dividend that will be stable or growing over time. Annually, the BoM will,upon prior approval from the SB, submit a proposal to the AGM with respect to the amount of dividend to be declared with respectto the prior year. The dividend proposal in any given year will be subject to the availability of distributable profits or retainedearnings and may be affected by, among other factors, the BoM’s views on our potential future liquidity requirements, including forinvestments in production capacity, the funding of our R&D programs and for acquisition opportunities that may arise from time totime; and by future changes in applicable income tax and corporate laws. Accordingly, it may be decided to propose not to pay adividend or to pay a lower dividend with respect to any particular year in the future.
For 2016, a proposal to declare a dividend of EUR 1.20 per ordinary share of EUR 0.09 nominal value will be submitted to the 2017AGM.
ASML ANNUAL REPORT 2016 F-47
26. Purchases of Equity Securities by the Issuer and Affiliated PurchasersIn addition to dividend payments, we intend to return cash to our shareholders on a regular basis through share buybacks or capitalrepayment, subject to our actual and anticipated level of liquidity requirements and other relevant factors.
On January 20, 2016 we announced our intention to repurchase approximately EUR 1.5 billion of our own shares within the2016-2017 timeframe. This program includes an amount of approximately EUR 500.0 million remaining from the prior sharerepurchase program, announced January 21, 2015. We intend to cancel the shares upon repurchase. During the period fromJanuary 21, 2016 up to December 31, 2016, we purchased 4.8 million shares that will be canceled for a total consideration of EUR400.0 million. In the light of the acquisition of HMI and the announced investment in Carl Zeiss SMT, we have paused the sharebuyback program. As a result, the 2016–2017 program may not be completed for the full amount. Otherwise, the current programwill remain in place, yet it may be further suspended, modified or discontinued at any time. Furthermore, no shares were canceledin 2016, and we intend to cancel 7.7 million shares in 2017.
The following table provides a summary of shares repurchased by ASML in 2016:
Period
Totalnumber
of sharespurchased
Averageprice paidper Share
(EUR)
Total numberof shares
purchased aspart of
publiclyannounced plans
or programs
Maximum valueof shares
that may yetbe purchased
under theprogram (EUR
thousands)
January 21 - 31, 2016 268,537 82.08 268,537 1,477,957
February 1 - 29, 2016 1,306,921 78.12 1,575,458 1,375,859
March 1 - 31, 2016 1,045,133 86.51 2,620,591 1,285,449
April 1 - 30, 2016 1,138,127 87.95 3,758,718 1,185,356
May 1 - 31, 2016 278,182 82.15 4,036,900 1,162,504
June 1 - 30, 2016 560,410 85.57 4,597,310 1,114,552
July 1 - 31, 2016 166,068 87.63 4,763,378 1,100,000
August 1 - 31, 2016 — — 4,763,378 1,100,000
September 1 - 30, 2016 — — 4,763,378 1,100,000
October 1 - 31, 2016 — — 4,763,378 1,100,000
November 1 - 30, 2016 — — 4,763,378 1,100,000
December 1 - 31, 2016 — — 4,763,378 1,100,000
Total 4,763,378 83.97

27. Customer Co-Investment Program On July 9, 2012, we announced our CCIP to accelerate our development of EUV technology beyond the current generation and ourdevelopment of future 450mm silicon wafer technology. The Participating Customers collectively agreed to fund EUR 1.38 billion ofour R&D projects from 2013 through 2017. This program created risk sharing with some of our largest customers while the resultsof our development programs will be available to every semiconductor manufacturer with no restrictions.
Development 450mm silicon wafer technology As previously disclosed, in November 2013, ASML decided to pause the development of 450mm lithography systems untilcustomer demand and the timing related to such demand is clear. We have agreed with Intel that the 450mm NRE funding will beapplied to other lithography projects, including generic developments applicable to both 300mm and 450mm. We believe that our450mm development activities can be restarted if and when the industry demands the introduction of 450mm.
In addition to the EUV and 450mm funding commitments, the Participating Customers have invested in 96,566,077 of our ordinaryshares, the proceeds of which, totaling EUR 3.85 billion, were returned to the holders of ordinary shares (excluding the ParticipatingCustomers) through a synthetic share buyback executed in November 2012.
Description of the program Intel is the largest participant in the program, with an aggregate funding commitment of EUR 829 million - an aggregate amount ofEUR 553 million for the development of 450mm lithography technology (which, as a result of the pause of that program, has beenapplied to EUV technology development) and an aggregate amount of EUR 276 million for the development of EUV technology -and an investment in 62,977,877 of our ordinary shares for an aggregate subscription price of EUR 2,513 million.
In addition to Intel, TSMC acquired 20,992,625 of our ordinary shares for an aggregate subscription price of EUR 838 million andmade a EUR 276 million funding commitment relating to the development of 450mm lithography equipment and EUV technology,and Samsung acquired 12,595,575 of our ordinary shares for an aggregate subscription price of EUR 503 million and made a EUR276 million funding commitment relating to the development of EUV technology. Shares were acquired by Dutch foundations(Stichtingen) established for each participant. On June 12, 2015, TSMC reported to the AFM that its interest in ASML haddecreased below the three percent notification threshold. In its 2015 annual report, TSMC announced that it had sold its entirestake. Additionally, in its Q3 2016 report, Samsung announced that it had sold one-half of its holdings.
In connection with the investment by the Participating Customers in ASML, each of the Participating Customers, and the respectiveStichtingen, entered into a shareholder’s agreement with ASML. The shareholder’s agreements contain provisions restricting thevoting rights of the Participating Customers, such that the Participating Customers are not generally permitted to vote their sharesexcept in certain extraordinary circumstances, a standstill arrangement and restrictions on the sale of shares in order to preserve anorderly sell down of Participating Customer’s shares.
ASML ANNUAL REPORT 2016 F-48
28. Related Party TransactionsOn July 9, 2012, we announced our CCIP to accelerate our development of EUV technology beyond the current generation and ourdevelopment of future 450mm silicon wafer technology. One of the Participating Customers, Intel, agreed to fund EUR 829.0 millionfor our R&D projects. In addition Intel also agreed to invest in ordinary shares equal to 15 percent of our issued share capital(calculated giving effect to our synthetic share buyback in November 2012). Due to the equity investment, Intel is considered arelated party of ASML as of July 9, 2012.
The total net sales and the net outstanding liability to Intel (and its affiliates) were as follows:
Year ended December 31 2014 2015 2016
(in thousands) EUR EUR EUR
Total net sales to Intel 1,007,603 618,069 1,401,983
Net outstanding liability to Intel 386,824 700,156 379,774
There have been no transactions during our most recent fiscal year, and there are currently no transactions, between ASML or anyof its subsidiaries, and any other significant shareholder, and any director or officer or any relative or spouse thereof other thanordinary course (compensation) arrangements. During our most recent fiscal year, there has been no, and at present there is no,outstanding indebtedness to ASML owed by or owing to any director or officer of ASML or any associate thereof.
29. Subsequent EventsSubsequent events were evaluated up to February 7, 2017, which is the date the Financial Statements included in this AnnualReport were approved. There are no events to report.

Veldhoven, the Netherlands
February 7, 2017
/s/ Peter T.F.M. WenninkPeter T.F.M. WenninkPresident, CEO and member of the Board of Management
/s/ Wolfgang U. NicklWolfgang U. NicklExecutive Vice President, CFO and member of the Board of Management
ASML ANNUAL REPORT 2016 F-49