20 indicators everyone should know c2er’s 52 nd annual conference oklahoma city june 7, 2012 jenny...
TRANSCRIPT

20 Indicators Everyone Should Know
C2ER’s 52nd Annual ConferenceOklahoma City • June 7, 2012
Jenny HsuManager of Economic Research


Measuring the Economy - GDP
Consumption Investments Government Spending Net Exports GDP
Price Pressures

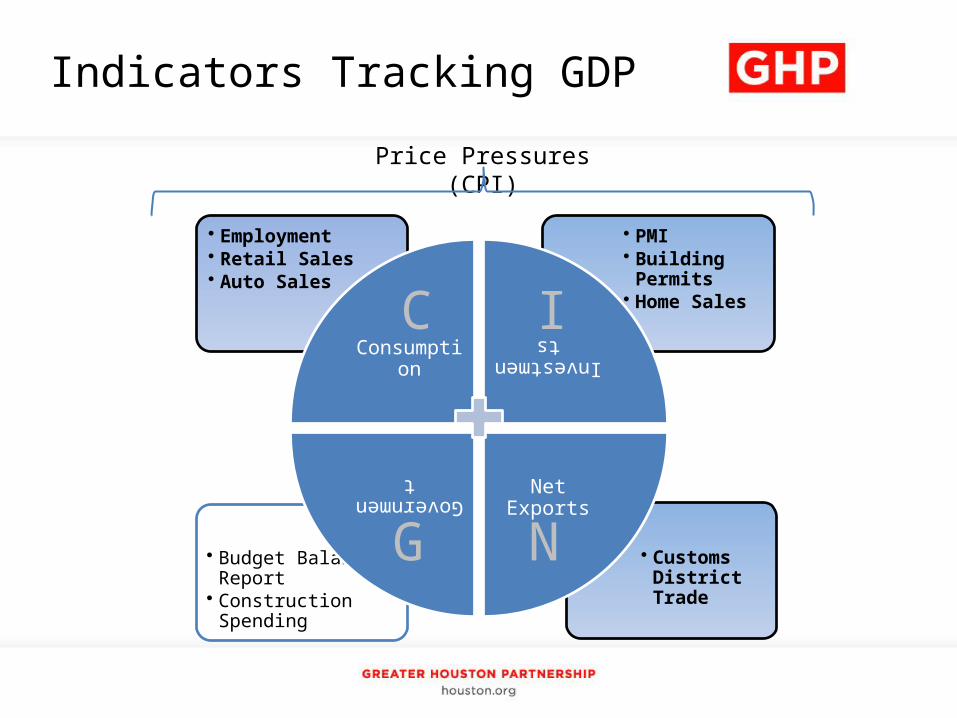
Indicators Tracking GDP
Price Pressures (CPI)
• Customs District Trade
• Budget Balance Report
• Construction Spending
• PMI• Building Permits• Home Sales
• Employment• Retail Sales• Auto Sales
ConsumptionInvestments
Net Exports
Government
C I
G N
Indicators Tracking GDP
Price Pressures (CPI)
• Customs District Trade
• Budget Balance Report
• Construction Spending
• PMI• Building Permits• Home Sales
• Employment• Retail Sales• Auto Sales
ConsumptionInvestments
Net Exports
Government
C I
G N

Houston Area ProfileEmployment
U.S. Bureau of Labor Statistics
Indicator Frequency
Nonfarm Payroll Employment Monthly
Unemployment Rate Monthly
Quarterly Census of Employment & Wages Quarterly
Occupational Employment Statistics Annually
C
I
N
G

Houston Area Profile
– Establishment survey
• 300,000 establishments
• 400 metro areas
• 40% of total nonfarm population
– Seasonal adjustments
Nonfarm Payroll Employment
C
I
N
G
Indicator #1

Houston Area ProfileNonfarm Payroll Employment
Indicator #1

Houston Area ProfileUnemployment Rate
C INGSource: U.S. Bureau of Labor Statistics
U3 = Total unemployed in the labor force
Indicator #2

Houston Area ProfileUnemployment Rate
C INGSource: U.S. Bureau of Labor Statistics
U4 = U3 + discouraged workers
U3 = Total unemployed in the labor force
U5 = U4 + marginally attached
Indicator #2

Houston Area ProfileUnemployment Rate
C INGSource: U.S. Bureau of Labor Statistics
U6 = U5 + part time for economic reasons
U4 = U3 + discouraged workers
U3 = Total unemployed in the labor force
U5 = U4 + marginally attached
Indicator #2

Quarterly Census of Employment and Wages (QCEW)
C ING
Indicator #3
• Census of 9 million establishments
• Unemployment insurance taxes
• Released 6 months after the quarter
• Benchmark revisions

Using the QCEW
C ING
19.2%
18.4%
16.9%11.8%
10.2%
7.2%
7.0%3.3%
2.8%1.7%
1.5%
21.5%
15.0%
21.8%
8.9%
3.6%
7.0%
5.3%
9.7%
2.8%3.1%1.3%
2011 Share of Jobs and Wages by IndustryOuter Loop: Share of Jobs
Inner Loop: Share of WagesTrade, Transportation and Utilities
Professional and Business Services
Education and Health Services
Manufacturing
Natural Resources and Mining
Construction
Financial Activities
Leisure and Hospitality
Public Administration
Other Services
Information
Source: Texas Workforce Commission, Quarterly Census for Employment and Wages
Indicator #3

Occupational Employment Statistics
OccupationPer 100,000 Workers
United States Houston
Petroleum Engineers 24 443
Marine Engineers 4 26
Chemical Engineers 22 119
Aerospace Engineers 62 113
Health and Safety Engineers 18 42
Civil Engineers 198 350
Materials Engineers 17 22
Engineering Managers 137 246
Mechanical Engineers 186 264
Engineers, All Others 98 180C I
NGIndicator #4

Houston Area ProfileEmployment
Houston Area ProfileEmployment

Retail & Auto Sales
• Consumer spending makes up 70% of all economic activity
• Retail sales account for 30% of consumer spending
• Sign of consumer confidence and overall economic growth
• Not adjusted for inflation
C ING
Indicators #5 & #6

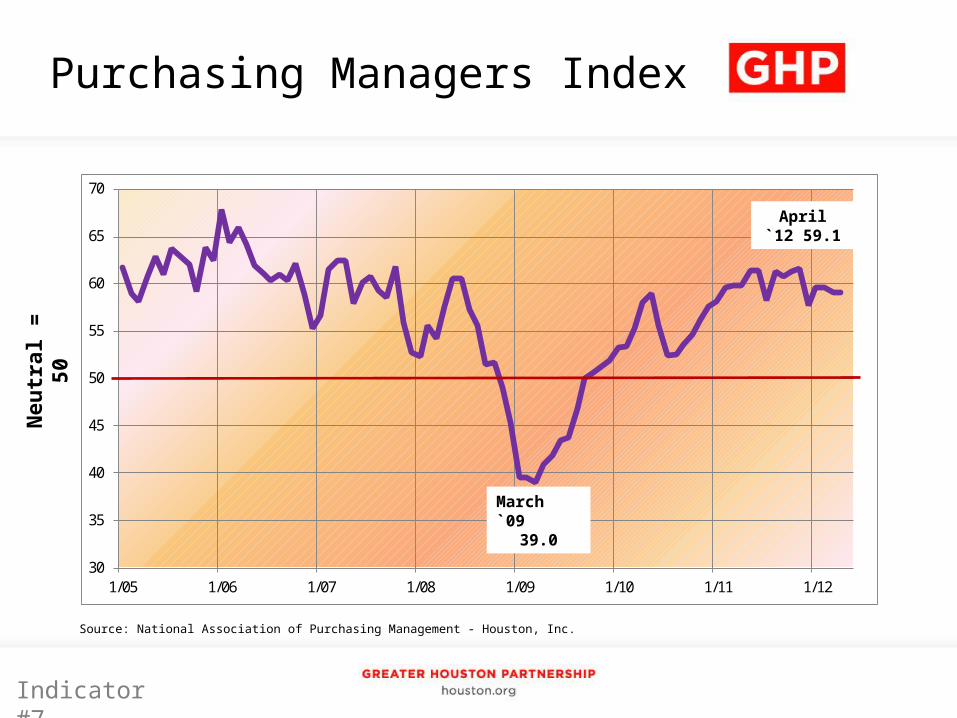
Purchasing Managers Index
• First indicator available every month
• Leading indicator for regional production
• Range of 0-10050 = neutral
> 50 = likely increase in production over next 3-4 months
< 50 = likely contraction in production over next 3-4 months
C ING
Indicator #7
Purchasing Managers Index
30
35
40
45
50
55
60
65
70
1/05 1/06 1/07 1/08 1/09 1/10 1/11 1/12
Source: National Association of Purchasing Management - Houston, Inc.
Neu
tral
= 5
0
March `0939.0
April `12 59.1
Indicator #7

North American Rig Count (monthly average)
500
700
900
1,100
1,300
1,500
1,700
1,900
2,100
2,300
1/05 1/06 1/07 1/08 1/09 1/10 1/11 1/12
June `09895
Apr ’12 1,962
Source: Baker Hughes
Sep `082,014

Housing Starts & Building Permits
• Reliable leading indicator
• Multiplier effects on other industries– 1,000 homes = 2,500 jobs = $100M wages
• Home construction = 5% of GDP
C ING
Indicators #8 & #9

Home Sales
• 8 out of 10 are existing home sales
• Signals confidence in jobs and income growth
• Foreshadows future consumer purchases
• 1-3 months lag in data– Time of actual closing vs. Pending
C ING
Indicator #10

Foreign Trade
• Trade Value vs. Weight/Units
• Top export, imports, & trade partners
C ING
Indicator #11

Using Foreign Trade data
Houston-China Total Trade
C ING
Indicator #11
2000 2001 2002 2003 2004 2005 2006 2007 2008 2009 2010 20110
2
4
6
8
10
12
14
Imports
Exports
Total

Inflation
• Price pressures on consumers and businesses
• Use CPI to adjust other indicators to “real” dollars
• CPI-W, CPI-U and Core CPI
C ING
Indicator #12

Indicators Tracking GDP
Price Pressures (CPI)
Consumption
Investments
Net Exports
Government

GDP comparison
Houston MSAGRP = $325.5 billion
Austria = $379.1 billion
Venezuela = $391.8 billion
Houston = $395.4 billion
Saudi Arabia = $434.7 billion
Norway = $413.0 billionHouston Metro AreaGDP = $395.4 Billion
Source: World Bank

An economist is an expert who will know tomorrow why
the things he predicted yesterday didn’t happen today.
-Dr. Laurence J. Peter

20 Indicators Everyone Should Know
C2ER’s 52nd Annual ConferenceOklahoma City • June 7, 2012
Jenny HsuManager of Economic Research