20 march 31, 2020 (un-audited) 0
TRANSCRIPT

Mar
ch 3
1, 2
020
(Un-
Aud
ited)
020
rd 3 Q
uart
erly
Acc
ount
s

COMPANY INFORMATION
13rd Quarterly AccountsFor the period March 31, 2020
Mr. Khawaja Sajid
Mr. Salim Ahmed
COMPANY PROFILE
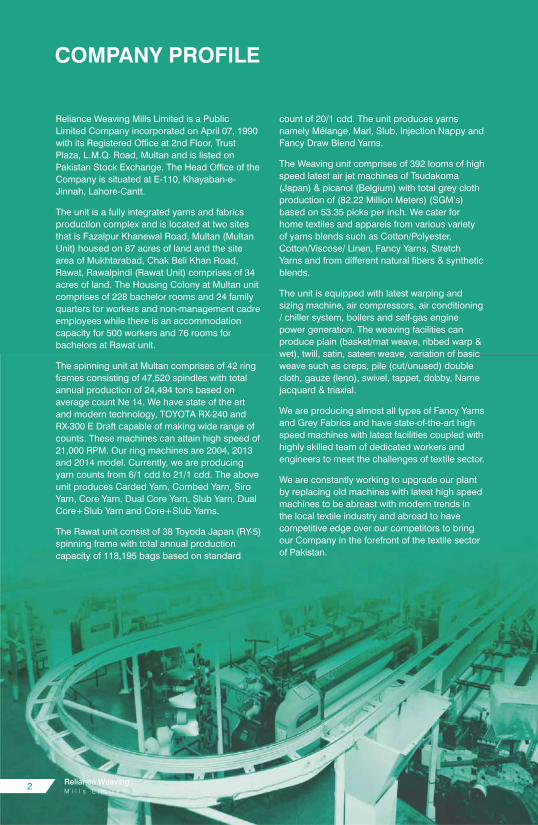
Reliance Weaving Mills Limited is a Public
Limited Company incorporated on April 07, 1990
with its Registered Office at 2nd Floor, Trust
Plaza, L.M.Q. Road, Multan and is listed on
Pakistan Stock Exchange. The Head Office of the
Company is situated at E-110, Khayaban-e-
Jinnah, Lahore-Cantt.
The unit is a fully integrated yarns and fabrics
production complex and is located at two sites
that is Fazalpur Khanewal Road, Multan (Multan
Unit) housed on 87 acres of land and the site
area of Mukhtarabad, Chak Beli Khan Road,
Rawat, Rawalpindi (Rawat Unit) comprises of 34
acres of land. The Housing Colony at Multan unit
comprises of 228 bachelor rooms and 24 family
quarters for workers and non-management cadre
employees while there is an accommodation
capacity for 500 workers and 76 rooms for
bachelors at Rawat unit.
The spinning unit at Multan comprises of 42 ring
frames consisting of 47,520 spindles with total
annual production of 24,494 tons based on
average count Ne 14. We have state of the art
and modern technology, TOYOTA RX-240 and
RX-300 E Draft capable of making wide range of
counts. These machines can attain high speed of
21,000 RPM. Our ring machines are 2004, 2013
and 2014 model. Currently, we are producing
yarn counts from 6/1 cdd to 21/1 cdd. The above
unit produces Carded Yarn, Combed Yarn, Siro
Yarn, Core Yarn, Dual Core Yarn, Slub Yarn, Dual
Core+Slub Yarn and Core+Slub Yarns.
The Rawat unit consist of 38 Toyoda Japan (RY-5)
spinning frame with total annual production
capacity of 118,195 bags based on standard
count of 20/1 cdd. The unit produces yarns
namely Mélange, Marl, Slub, Injection Nappy and
Fancy Draw Blend Yarns.
The Weaving unit comprises of 392 looms of high
speed latest air jet machines of Tsudakoma
(Japan) & picanol (Belgium) with total grey cloth
production of (82.22 Million Meters) (SGM’s)
based on 53.35 picks per inch. We cater for
home textiles and apparels from various variety
of yarns blends such as Cotton/Polyester,
Cotton/Viscose/ Linen, Fancy Yarns, Stretch
Yarns and from different natural fibers & synthetic
blends.
The unit is equipped with latest warping and
sizing machine, air compressors, air conditioning
/ chiller system, boilers and self-gas engine
power generation. The weaving facilities can
produce plain (basket/mat weave, ribbed warp &
wet), twill, satin, sateen weave, variation of basic
weave such as creps, pile (cut/unused) double
cloth, gauze (leno), swivel, tappet, dobby, Name
jacquard & triaxial.
We are producing almost all types of Fancy Yarns
and Grey Fabrics and have state-of-the-art high
speed machines with latest facilities coupled with
highly skilled team of dedicated workers and
engineers to meet the challenges of textile sector.
We are constantly working to upgrade our plant
by replacing old machines with latest high speed
machines to be abreast with modern trends in
the local textile industry and abroad to have
competitive edge over our competitors to bring
our Company in the forefront of the textile sector
of Pakistan.
2
33rd Quarterly AccountsFor the period March 31, 2020
4
CERTIFICATIONS

53rd Quarterly AccountsFor the period March 31, 2020
Date: April 29, 2020Place: Lahore
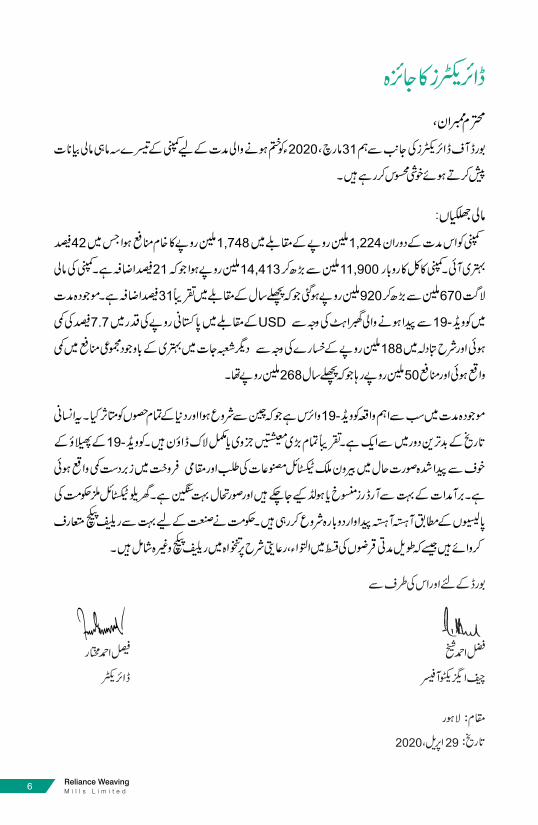
Dear Members,
On the behalf of the Board of Directors, We are pleased to present the nine months Financial
Statements of the company for the period ended March 31, 2020.
Financial Highlights
The company earned Gross profit of Rs 1,748 million during the period as compared to Rs.
1,224 million, which is 42% improved. Turnover of the company has improved from Rs 11,900
million to Rs 14,413 million, which is 21% increase. Financial cost of the company has
increased from Rs 670 million to Rs 920 million which is almost 31% increased as compare to
previous period. Major loss in current period is exchange loss of RS 188 million due to sudden
devaluation of PKR against USD by 7.7% due to panic created by COVID-19 , it hit the
profitability very badly and despite major improvements in all segments reduced the profit to
RS 50 million as compare to RS 268 million in last period.
The major event in current period is COVID-19 virus that started in china has affected all parts
of the world and is one of worst period in human history. Almost all major economies are
under complete or partial lockdown. The demand for textile products abroad and domestic
sales have come down to grinding halt due to panic situation created COVID-19 outbreak.
Plenty of export orders hold or cancelled and the situation is very serious. Domestic textile
mills are gradually resuming production in accordance with the policies of Government. GoP
has introduced many relief packages for industry like deferment of long term loans
installment, salary relief package at discounted rate etc.
On Behalf of Board of Directors
Fazal Ahmed Sheikh
(Chief Executive Officer)
DIRECTOR'S REPORTTO THE MEMBERS
Faisal Ahmed Mukhtar
(Director)
6
29

rd3 QuarterlyAccounts
March 31, 2020(Un-Audited)
73rd Quarterly AccountsFor the period March 31, 2020
8
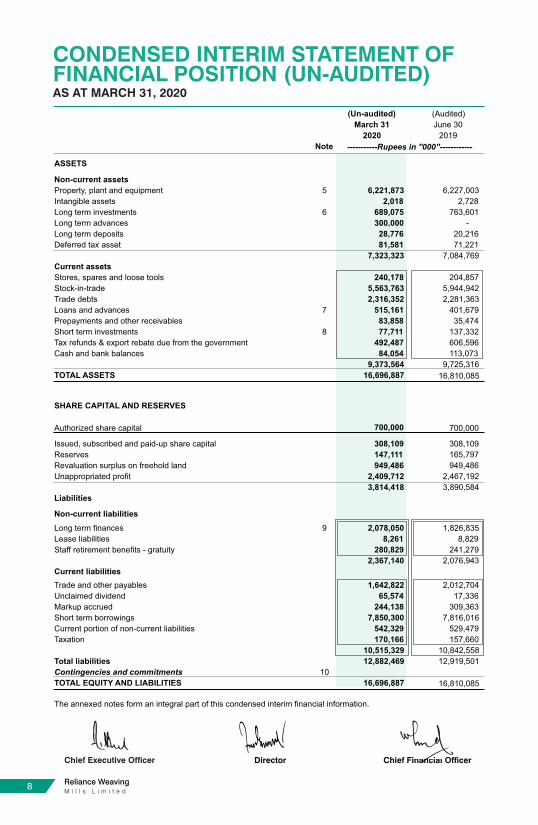
CONDENSED INTERIM STATEMENT OFFINANCIAL POSITION (UN-AUDITED)AS AT MARCH 31, 2020
Chief Executive Officer
ASSETS
Non-current assets
Property, plant and equipment
Intangible assets
Long term investments
Long term advances
Long term deposits
Deferred tax asset
Current assets
Stores, spares and loose tools
Stock-in-trade
Trade debts
Loans and advances
Prepayments and other receivables
Short term investments
Tax refunds & export rebate due from the government
Cash and bank balances
TOTAL ASSETS
SHARE CAPITAL AND RESERVES
Authorized share capital
Issued, subscribed and paid-up share capital
Reserves
Revaluation surplus on freehold land
Unappropriated profit
Liabilities
Non-current liabilities
Long term finances
Lease liabilities
Staff retirement benefits - gratuity
Current liabilities
Trade and other payables
Unclaimed dividend
Markup accrued
Short term borrowings
Current portion of non-current liabilities
Taxation
Total liabilities
Contingencies and commitments
TOTAL EQUITY AND LIABILITIES
The annexed notes form an integral part of this condensed interim financial information.
(Un-audited) (Audited)
March 31 June 30
2020 2019
Note
5 6,221,873 6,227,003
2,018 2,728
6 689,075 763,601
300,000 -
28,776 20,216
81,581 71,221
7,323,323 7,084,769
240,178 204,857
5,563,763 5,944,942
2,316,352 2,281,363
7 515,161 401,679
83,858 35,474
8 77,711 137,332
492,487 606,596
84,054 113,073
9,373,564 9,725,316
16,696,887 16,810,085
700,000 700,000
308,109 308,109
147,111 165,797
949,486 949,486
2,409,712 2,467,192
3,814,418 3,890,584
9 2,078,050 1,826,835
8,261 8,829
280,829 241,279
2,367,140 2,076,943
1,642,822 2,012,704
65,574 17,336
244,138 309,363
7,850,300 7,816,016
542,329 529,479
170,166 157,660
10,515,329 10,842,558
12,882,469 12,919,501
10
16,696,887 16,810,085
-----------Rupees in ''000''------------

93rd Quarterly AccountsFor the period March 31, 2020
CONDENSED INTERIM STATEMENTOF PROFIT OR LOSS (UN-AUDITED)
Chief Executive Officer
March 31 March 31 March 31 March 31
2020 2019 2020 2019
Sales - net 11 14,413,661 11,900,576
5,160,155
4,772,811
Cost of sales (12,665,114) (10,675,923)
(4,688,224)
(4,281,241)
Gross profit 1,748,547 1,224,653
471,931
491,570
Distribution and marketing expenses (179,107) (110,851)
(68,644)
(52,083)
Administrative expenses (155,240) (136,340)
(49,379) (45,901)
Other expenses 12 (287,245) (41,213)
(199,244) (12,810)
Other income 78,474 121,119 27,466 17,912
(543,118) (167,285) (289,801) (92,882)
Profit from operations 1,205,429 1,057,368 182,130 398,688
Finance cost (920,740) (670,486) (278,835) (273,351)
284,689 386,882 (96,705) 125,339
Share of loss of associates (74,790) (32,357) (5,733) (2,250)
Profit / (Loss) before taxation 209,899 354,525 (102,438) 123,087
Provision for taxation (159,806) (86,313) (53,938) (54,990)
Profit /(Loss) after Taxation 50,093 268,212 (156,376) 68,097
Earnings per share 1.63 8.71 (5.08) 2.21
The annexed notes form an integral part of this condensed interim financial information.
Nine months period ended Three months period ended
----------------------------------Rs in ''000''-----------------------------
Note
FOR THE NINE MONTHS PERIOD ENDED MARCH 31, 2020

10
CONDENSED INTERIM STATEMENT OFCOMPREHENSIVE INCOME (UN-AUDITED)
Chief Executive Officer
FOR THE NINE MONTHS PERIOD ENDED MARCH 31, 2020
March 31 March 31 March 31 March 31
2020 2019 2020 2019
50,093
268,212
(156,376)
68,097
(18,687) 2,573 (12,098) (8,112)
265 (3,318) - -
Profit / (Loss) after taxation
Other comprehensive income:
Items that will not be reclassified subsequently to
statement of profit or loss:
- Unrealised (Loss) / Gain on remeasurement of short
term investments at fair value through other
comprehensive income
- Share of other comprehensive income / (loss) of
Associated Companies
Total comprehensive income / (loss) for the period 31,671 267,467 (168,474) 59,985
The annexed notes form an integral part of this condensed interim financial information.
Nine months period ended Three months period ended
----------------------------------Rs in ''000''-----------------------------------
113rd Quarterly AccountsFor the period March 31, 2020
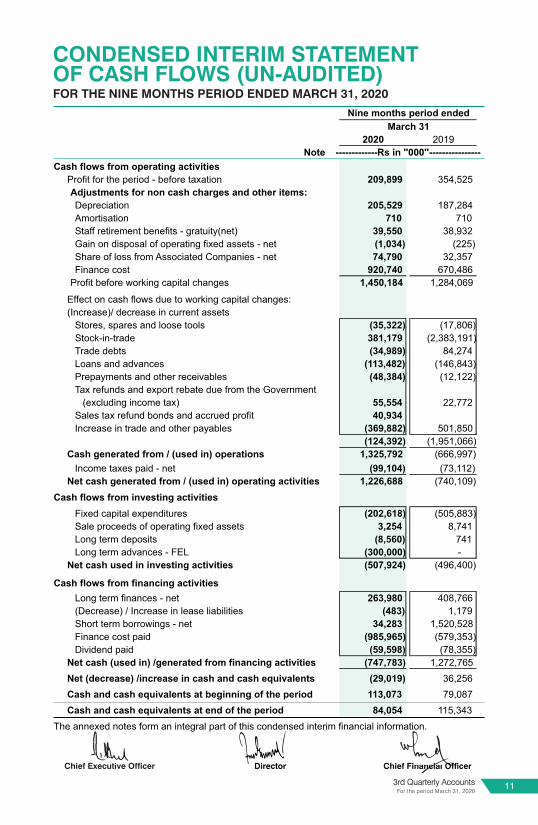
CONDENSED INTERIM STATEMENTOF CASH FLOWS (UN-AUDITED)FOR THE NINE MONTHS PERIOD ENDED MARCH 31, 2020
Chief Executive Officer
2020 2019
Note
Cash flows from operating activities
Profit for the period - before taxation 209,899 354,525
Adjustments for non cash charges and other items:
Depreciation 205,529 187,284
Amortisation 710 710
Staff retirement benefits - gratuity(net) 39,550 38,932
Gain on disposal of operating fixed assets - net (1,034) (225)
Share of loss from Associated Companies - net 74,790 32,357
Finance cost 920,740
670,486
Profit before working capital changes 1,450,184
1,284,069
Effect on cash flows due to working capital changes:
(Increase)/ decrease in current assets
Stores, spares and loose tools (35,322)
(17,806)
Stock-in-trade 381,179
(2,383,191)
Trade debts (34,989)
84,274
Loans and advances (113,482)
(146,843)
Prepayments and other receivables (48,384)
(12,122)
Tax refunds and export rebate due from the Government
(excluding income tax) 55,554
22,772
Sales tax refund bonds and accrued profit 40,934
Increase in trade and other payables (369,882) 501,850
(124,392)
(1,951,066)
Cash generated from / (used in) operations 1,325,792
(666,997)
Income taxes paid - net (99,104)
(73,112)
Net cash generated from / (used in) operating activities 1,226,688
(740,109)
Cash flows from investing activities
Fixed capital expenditures (202,618)
(505,883)
Sale proceeds of operating fixed assets 3,254
8,741
Long term deposits (8,560)
741
Long term advances - FEL (300,000) -
Net cash used in investing activities (507,924)
(496,400)
Cash flows from financing activities
Long term finances - net 263,980 408,766
(Decrease) / Increase in lease liabilities (483) 1,179
Short term borrowings - net 34,283 1,520,528
Finance cost paid (985,965) (579,353)
Dividend paid (59,598) (78,355)
Net cash (used in) /generated from financing activities (747,783) 1,272,765
Net (decrease) /increase in cash and cash equivalents (29,019) 36,256
Cash and cash equivalents at beginning of the period 113,073 79,087
Cash and cash equivalents at end of the period 84,054 115,343
The annexed notes form an integral part of this condensed interim financial information.
Nine months period ended
March 31
-------------Rs in ''000''----------------
12
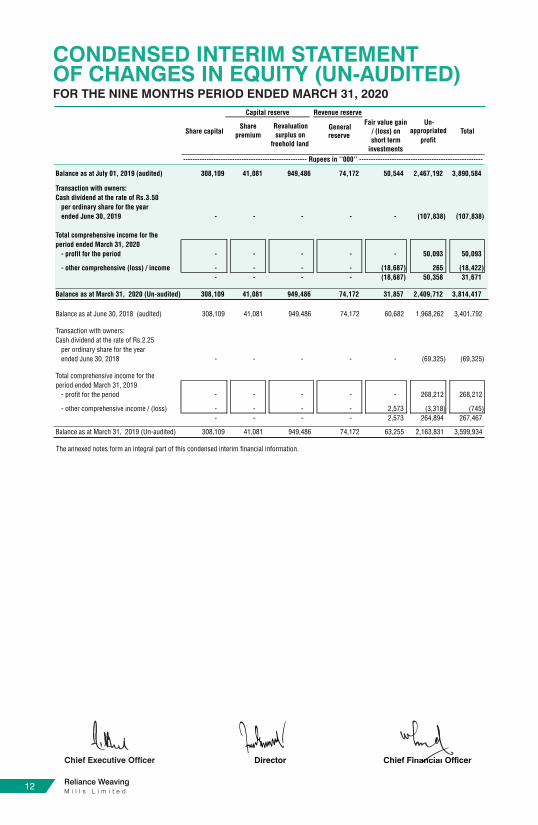
Revenue reserve
Balance as at July 01, 2019 (audited) 308,109 41,081 949,486
74,172
50,544
2,467,192 3,890,584
Transaction with owners:
Cash dividend at the rate of Rs.3.50
per ordinary share for the year
ended June 30, 2019 - - -
-
-
(107,838) (107,838)
Total comprehensive income for the
period ended March 31, 2020
- profit for the period - - -
-
-
50,093
50,093
- other comprehensive (loss) / income - - -
-
(18,687)
265
(18,422)
- - -
- (18,687) 50,358 31,671
Balance as at March 31, 2020 (Un-audited) 308,109 41,081 949,486 74,172 31,857 2,409,712 3,814,417
Balance as at June 30, 2018 (audited) 308,109 41,081 949,486 74,172 60,682 1,968,262 3,401,792
Transaction with owners:
Cash dividend at the rate of Rs.2.25
per ordinary share for the year
ended June 30, 2018 - - - - - (69,325) (69,325)
Total comprehensive income for the
period ended March 31, 2019
- profit for the period - - - - - 268,212 268,212
- other comprehensive income / (loss) - - - - 2,573 (3,318) (745)
- - - - 2,573 264,894 267,467
Balance as at March 31, 2019 (Un-audited) 308,109 41,081 949,486 74,172 63,255 2,163,831 3,599,934
The annexed notes form an integral part of this condensed interim financial information.
Un-appropriated
profit
Total
----------------------------------------------------- Rupees in ''000'' -----------------------------------------------------
Capital reserve
Share capital Share
premium
Revaluation
surplus on
freehold land
Generalreserve
Fair value gain
/ (loss) on
short term
investments
CONDENSED INTERIM STATEMENTOF CHANGES IN EQUITY (UN-AUDITED)
Chief Executive Officer
FOR THE NINE MONTHS PERIOD ENDED MARCH 31, 2020
133rd Quarterly AccountsFor the period March 31, 2020
NOTES TO THE CONDENSED INTERIMFINANCIAL STATEMENTS (UN-AUDITED)
1 Legal status and operations
2 Basis of preparation
-
-
-
3 Accounting policies
- Amendments to IAS 19, ‘Employee benefits’
- IAS 23, 'Borrowing costs'
- IFRIC 23, ‘Uncertainty over income tax treatments’
- IFRS 16, 'Leases'
4
The accounting policies and methods of computation adopted in the preparation of these
condensed interim financial statements are the same as those applied in the preparation of
preceding annual financial statements of the Company for the year ended June 30, 2019.
Standards, amendments to published standards and interpretations that are
effective in the current period
Certain standards, amendments and interpretations to IFRSs are effective for accounting
periods beginning on July 01, 2019 but are considered not to be relevant or to have any
significant effect on the Company’s operations (although they may affect the accounting
for future transactions and events) and are, therefore, not detailed in these condensed
interim financial statements, except for the following for which relevant effect has been
incorporated in these condensed interim financial statements:
These condensed interim financial statements are being submitted to the
shareholders as required by section 237 of the Companies Act, 2017. These
condensed interim financial statements do not include all the information and disclosures
as required in the annual financial statements and should be read in conjunction with the
Company's audited financial statements for the year ended June 30, 2019.
Where the provisions of and directives issued under the Companies Act, 2017 differ
with the requirements of IAS 34, the provisions of and directives issued under the
companies act, 2017 have been followed
Reliance Weaving Mills Ltd. (the Company) was incorporated in Pakistan as a public
limited company on April 07, 1990 under the Companies Ordinance, 1984 (now the
Companies Act, 2017) and its shares are quoted on Pakistan Stock Exchange Ltd. The
Company commenced its operations on May 14, 1990 and is principally engaged in the
manufacture and sale of yarn and fabric. The registered office of the Company is situated
at second Floor, Trust Plaza, L.M.Q. Road, Multan and its mills are located at Fazalpur
Khanewal Road, Multan and Mukhtarabad, Chak Beli Khan Road, Rawat, Rawalpindi.
These condensed interim financial statements have been prepared in accordance with
the accounting and reporting standards as applicable in Pakistan for interim financial
reporting. The accounting and reporting standards as applicable in Pakistan for interim
financial reporting comprise of:
International Accounting Standard ( IAS) 34, ''Interim financial reporting'', issued by the
International Accounting Standards Board (IASB) as notified under the Companies Act,
2017; and
Provisions of and directives issued under the Companies Act, 2017.
FOR THE NINE MONTHS PERIOD ENDED MARCH 31, 2020
3.1
14
Un-audited Audited
March 31, June 30,
Note 2020 2019
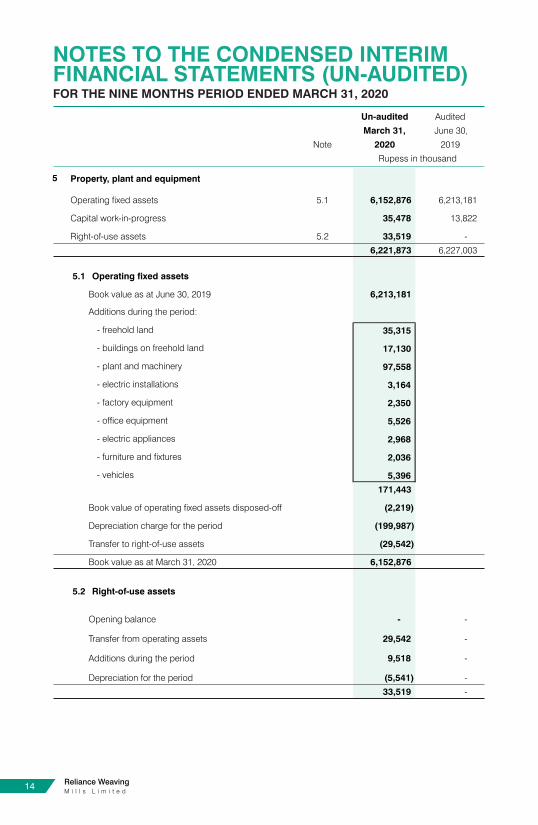
5 Property, plant and equipment
Operating fixed assets 5.1 6,152,876 6,213,181
Capital work-in-progress 35,478 13,822
Right-of-use assets 5.2 33,519 -
6,221,873 6,227,003
5.1 Operating fixed assets
Book value as at June 30, 2019 6,213,181
Additions during the period:
- freehold land 35,315
- buildings on freehold land 17,130
- plant and machinery 97,558
- electric installations 3,164
- factory equipment 2,350
- office equipment 5,526 - electric appliances 2,968
- furniture and fixtures 2,036
- vehicles 5,396
171,443
Book value of operating fixed assets disposed-off (2,219)
Depreciation charge for the period (199,987)
Transfer to right-of-use assets (29,542)
Book value as at March 31, 2020 6,152,876
5.2 Right-of-use assets
Opening balance - -
Transfer from operating assets 29,542 -
Additions during the period 9,518 -
Depreciation for the period (5,541) -
33,519 -
Rupess in thousand
NOTES TO THE CONDENSED INTERIMFINANCIAL STATEMENTS (UN-AUDITED)FOR THE NINE MONTHS PERIOD ENDED MARCH 31, 2020

153rd Quarterly AccountsFor the period March 31, 2020
Un-audited Audited
March 31, June 30,
2020 2019
Note
6 Long term investments
Investment in associates - Un-quoted
Fatima Energy Limited 6.1 653,408 728,907
Fatima Transmission Company Limited 6.2 35,667 34,694
689,075 763,601
6.1 Fatima Energy Limited ("FEL") at equity method
Cost 800,054 800,054
Share of post acquisition loss (157,398) (81,899)
Share of other comprehensive income 2,348 2,348
Gain on dilution of investment in associate 8,404 8,404
Carrying amount at end of the period 653,408
728,907
No. of shares held 80,016,370
80,016,370
Ownership interest in percentage 14.04% 14.04%
6.2 Fatima Transmission Company Limited ("FTCL") at equity method
Cost 71,875 71,875
Share of post acquisition loss (36,208)
(37,181)
Carrying amount at end of the period 35,667
34,694
No. of shares held 7,187,500 7,187,500
Ownership interest in percentage 31.25% 31.25%
7 Loans and advances
Advances - considered good
- To employees 214,702 202,772
- To suppliers 85,056
30,354
Due from related parties 165,088
141,090
Letters of credit - margins, deposits etc. 50,315
27,463
515,161 401,679
8 Short term investment
Short term investment - available for sale
Fatima Fertilizer Company Limited 8.1 56,231 78,361
Short term investment - Others
Multan Real Estate Company (PVT) Limited 21,480 21,480
Sales tax refund bonds and accrued profit thereon - 37,491
77,711 137,332
8.1 Fatima Fertilizer Company Limited
Carrying amount at beginning of 2,625,167
fully paid ordinary shares of Rs. 10 each 78,361 85,055
Fair value adjustment (22,130) (6,694)
Closing market value of 2,625,167 shares 56,231 78,361
Rupess in thousand
16
Un-audited Audited
March 31, June 30,
2020 2019
Note
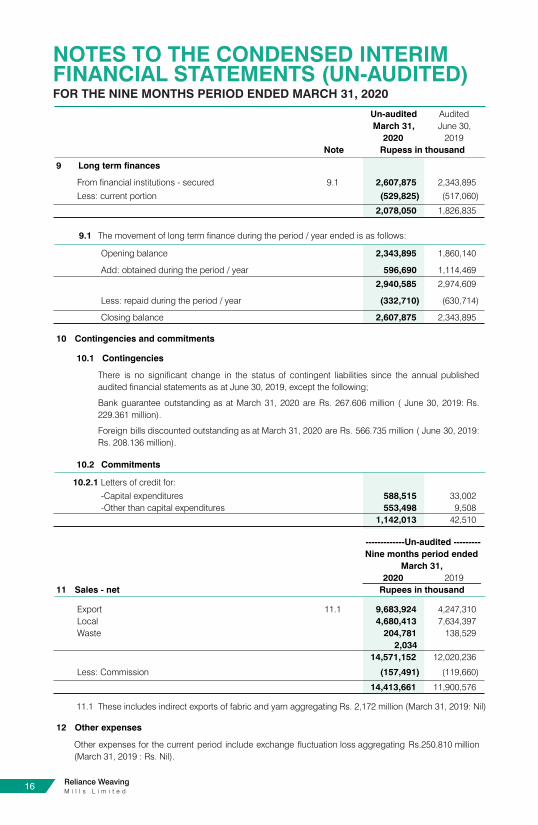
9 Long term finances
From financial institutions - secured 9.1 2,607,875 2,343,895
Less: current portion (529,825) (517,060)
2,078,050 1,826,835
9.1 The movement of long term finance during the period / year ended is as follows:
Opening balance 2,343,895 1,860,140
Add: obtained during the period / year 596,690 1,114,469
2,940,585 2,974,609
Less: repaid during the period / year (332,710)
(630,714)
Closing balance 2,607,875
2,343,895
10 Contingencies and commitments
10.1 Contingencies
10.2 Commitments
10.2.1 Letters of credit for:
-Capital expenditures 588,515
33,002
-Other than capital expenditures 553,498 9,508
1,142,013
42,510
2020 2019
11 Sales - net
Export 11.1 9,683,924 4,247,310
Local 4,680,413 7,634,397
Waste 204,781 138,529
2,034
14,571,152 12,020,236
Less: Commission (157,491) (119,660)
14,413,661 11,900,576
11.1 These includes indirect exports of fabric and yarn aggregating Rs. 2,172 million (March 31, 2019: Nil)
12 Other expenses
Nine months period ended
March 31,
Rupees in thousand
Other expenses for the current period include exchange fluctuation loss aggregating Rs.250.810 million
(March 31, 2019 : Rs. Nil).
-------------Un-audited ---------
Rupess in thousand
There is no significant change in the status of contingent liabilities since the annual published
audited financial statements as at June 30, 2019, except the following;
Bank guarantee outstanding as at March 31, 2020 are Rs. 267.606 million ( June 30, 2019: Rs.
229.361 million).
Foreign bills discounted outstanding as at March 31, 2020 are Rs. 566.735 million ( June 30, 2019:
Rs. 208.136 million).
NOTES TO THE CONDENSED INTERIMFINANCIAL STATEMENTS (UN-AUDITED)FOR THE NINE MONTHS PERIOD ENDED MARCH 31, 2020

173rd Quarterly AccountsFor the period March 31, 2020
13 Transactions with Related Parties
2020 2019
Nature of transaction
Associated undertakings
- purchase of goods 203,296
27,938
- sale of goods -
1,576
- mark-up income 23,472
1,461
- mark-up expense 960
2,031
- advances obtained 614,600 655,519
- advances repaid 974,133
729,297
- other expenses shared 18,739
11,502
Key management personnel
Remuneration and other benefits 20,464
15,541
Donations to Mian Mukhtar A. Sheikh Trust 23,964
20,200
14 Financial risk management
15 Capital management
The Company's financial risk management objective and policies are consistent with those
disclosed in the financial statements as at and for the year ended June 30, 2019.
The Company's capital management objective and policies are consistent with those disclosed in
the financial statements as at and for the year ended June 30, 2019.
The related parties comprise of associated companies, undertakings and key management
personnel. The Company in the normal course of business carries-out transactions with various
related parties. Amounts due from and to related parties are shown under receivables and
payables. Other significant transactions with related parties are as follows:
-----------Un-audited---------
Nine months period
ended March 31,
Rupees in thousand
Segment reporting16
16.1 Reportable segments
-
-
The Company's reportable segments are as follows:
Spinning segment - production of different quality of yarn using natural and artificial fibers
Weaving segment - production of different quality of greige fabric using yarn
Information regarding the Company’s reportable segments is presented below:
18
2020 2019 2020 2019 2020 2019 2020 2019
Sales - net
Cost of sales
Gross profit
Distribution and marketing expenses
Administrative expenses
Other expenses
Other income
Profit from operations
Finance cost
Share of loss from associate
Profit / (Loss) before taxation
Provision for taxation
Profit / (Loss) for the period
15.2.1
----------------------------------------------------------- Un-audited -----------------------------------------------------------
Nine months ended March 31,
------------------------------------------------------ Rupees in "000" ------------------------------------------------------
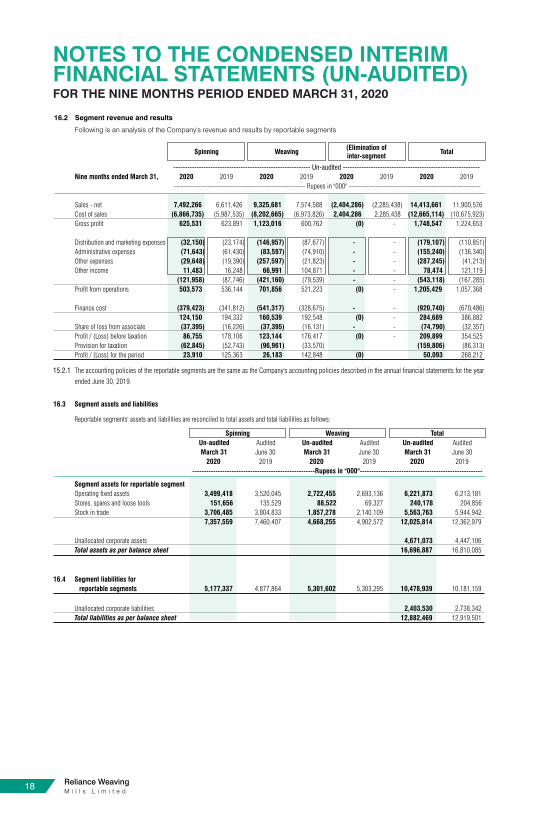
The accounting policies of the reportable segments are the same as the Company's accounting policies described in the annual financial statements for the year
ended June 30, 2019.
16.2 Segment revenue and results
Following is an analysis of the Company's revenue and results by reportable segments
Spinning Weaving(Elimination ofinter-segment
Total
7,492,266 6,611,426
7,574,588
(2,285,438) 14,413,661 11,900,576
(6,866,735) (5,987,535)
(6,973,826)
(2,404,286)
2,404,286
2,285,438 (12,665,114) (10,675,923)
625,531 623,891 600,762 (0) - 1,748,547 1,224,653
(32,150) (23,174)
(87,677)
-
- (179,107) (110,851)
(71,643) (61,430) (74,910) - - (155,240) (136,340)
(29,648) (19,390) (21,823) - - (287,245) (41,213)
11,483 16,248 104,871 - - 78,474 121,119
(121,958) (87,746) (79,539) - - (543,118) (167,285)
503,573 536,144 521,223 (0) - 1,205,429 1,057,368
(379,423) (341,812) (328,675) - - (920,740) (670,486)
124,150 194,332 192,548 (0) - 284,689 386,882
(37,395) (16,226) (16,131) - - (74,790) (32,357)
86,755 178,106 176,417 (0) - 209,899 354,525
(62,845) (52,743) (33,570) (159,806) (86,313)
23,910 125,363
9,325,681
(8,202,665)
1,123,016
(146,957)
(83,597)
(257,597)
66,991
(421,160)
701,856
(541,317)
160,539
(37,395)
123,144
(96,961)
26,183 142,848 (0) 50,093 268,212
16.3 Segment assets and liabilities
Un-audited Audited Un-audited Audited Un-audited
March 31 June 30 March 31 June 30 March 31
2020 2019 2020 2019 2020
Operating fixed assets 3,499,418 3,520,045 2,722,455 2,693,136
Stores, spares and loose tools 151,656 135,529
88,522
69,327
Stock in trade 3,706,485 3,804,833
1,857,278
2,140,109
7,357,559 7,460,407
4,668,255
4,902,572
Unallocated corporate assets
Total assets as per balance sheet
16.4 Segment liabilities for
reportable segments 5,177,337 4,877,864 5,301,602 5,303,295
Unallocated corporate liabilities
Total liabilities as per balance sheet
6,221,873
240,178
5,563,763
12,025,814
4,671,073
16,696,887
10,478,939
2,403,530
12,882,469
Audited
June 30
2019
6,213,181
204,856
5,944,942
12,362,979
4,447,106
16,810,085
10,181,159
2,738,342
12,919,501
-----------------------------------------------------Rupees in "000"-----------------------------------------------------
Segment assets for reportable segment
Reportable segments' assets and liabilities are reconciled to total assets and total liabilities as follows:
Spinning Weaving Total
NOTES TO THE CONDENSED INTERIMFINANCIAL STATEMENTS (UN-AUDITED)FOR THE NINE MONTHS PERIOD ENDED MARCH 31, 2020

193rd Quarterly AccountsFor the period March 31, 2020
17 Corresponding Figures
17.1
17.2
18 Date of authorization
19 General
Figures have been rounded off to the nearest thousand rupees except as stated otherwise.
In order to comply with the requirements of IAS 34 "Interim financial reporting", the
condensed interim statement of financial position has been compared with the balances of
annual audited financial statements of the preceding financial year, whereas, condensed
interim statement of profit or loss, condensed interim statement of other comprehensive
income, condensed interim statement of changes in equity and condensed interim
statement of cash flows have been compared with the balances of comparable period of
immediately preceding financial year.
Corresponding figures have been re-arranged and re-classified, wherever necessary, for the
purposes of comparison; however, no significant re-classifications / re-statements have
been made to these condensed interim financial statements.
These condensed interim financial information are authorized for issue on April 29, 2020 by the
Board of Directors of the Company.
Chief Executive Officer

20


2nd Floor Trust Plaza, LMQ Road, Multan
+92 61 450 9700, 450 9749
+92 61 458 4288, 451 1267