2000 annual report - zonebourse.com · 2000 annual report asm ... 16-22 kung yip street kwai chung,...
TRANSCRIPT
The Process of Innovation™
20
00
An
nu
al R
eport
ASM InternationalThe Process of Innovation™
ASM International N.V.
Jan van Eycklaan 10
3723 BC Bilthoven
The Netherlands
®
ASM International®
20
00
With the exception of historical information, the information
in this annual report contains forward-looking statements
within the meaning of the United States federal securities
laws. These statements include, among others, statements
regarding future expenditures, sufficiency of cash generated
from operations, maintenance of majority interest in ASM
Pacific Technology, business strategy, product development,
product acceptance, market penetration, market demand,
return on investment in new products, facility completion
dates and product shipment dates, and any other non-
historical information in this annual report.
Forward-looking statements typically are identified by use
of terms such as “believe,” “anticipate,” “estimate,” “expect,”
“intend,” “plan,” “will,” “may” and similar words, although
some forward-looking statements are expressed differently.
You should be aware that our actual results could differ
materially from those contained in the forward-looking
statements due to a number of factors. These include, but
are not limited to: economic conditions in the semiconductor
industry, currency fluctuations, the timing of significant
orders, market acceptance of new products, competitive
factors, risk factors related to litigation, and other risks
indicated in filings from time to time with the SEC.
In the more than 30-year history of our
Company ASM International N.V. has
witnessed the evolution of the semiconductor
equipment industry, from 2” wafers of the
late 1960’s, to the 300 mm today. Symbolic
of these products is the silicon crystal...
the basis of the ASM International logo. JAPAN:
ASM Japan K.K.
23-1, 6-chome Nagayama
Tama-shi,
Tokyo 206-0025
Tel. (81) 42 337-6311
Fax (81) 42 389-7555
Osaka Sales Office
4F, Shin-Osaka
Ueno Toyo Building
7-4-17 Nishinakajima
Yodogawa-ku, Osaka-shi
Osaka 532-0011
Tel. (81) 6 6390-9913
Fax (81) 6 6390-9917
Nagaoka Factory
392-One Shimbo, Mishima-machi
Santoh-gun
Niigata 940-2311
Tel. (81) 258 42-2400
Fax (81) 258 41-2490
Daini Technology Center
2-7-2 Kurikii
Asao-ku, Kawasaki-shi
Kanagawa 215-0033
Tel. (81) 44-986-6811
Fax (81) 44-986-6812
Hiroshima Service Center
5F, Daihyaku-seimei Building
One-14 Higashi-Hiratsuka-cho,
Naka-ku, Hiroshima-shi
Hiroshima 730-0025
Tel. (81) 82 542-3055
Fax (81) 82 542-3056
Kumamoto Service Center
1-14-63 Kuwamizu
Kumamoto-shi
Kumamoto 862-0954
Tel. (81) 96 387-7300
Fax (81) 96 387-7301
Sendai Service Center
4F, Ami-Grande building
14-15, Futsuka-machi
Aoba-ku, Sendai-shi
Miyagi 980-0802
Tel. (81) 22 262-8333
Fax (81) 22 262-8334
Shonai Service Point
8-32-2 Asahishin-machi, Sakata-shi
Yamagata 998-0021
Tel. (81) 234-26-4536
Fax (81) 234-26-4537
ASM Assembly Technology Co. Ltd.
2nd Floor, MS Building 2-3
Shouwa-cho, Akishima-shi
Tokyo 196-0015
Tel. (81) 425 45-7041
Fax (81) 425 45-7085
SOUTH-EAST ASIA:
ASM Pacific Technology Ltd.
12/F, Watson Center
16-22 Kung Yip Street
Kwai Chung, Hong Kong
Tel. (852) 2424-2021
Fax (852) 2481-3367
ASM Assembly Automation Ltd.
4/F, Watson Center
16-22 Kung Yip Street
Kwai Chung, Hong Kong
Tel. (852) 2619-2000
Fax (852) 2619-2118
ASM Assembly Materials Ltd.
14/F, Block A, Wo Kee Hong
Building
585-609 Castle Peak Road
Kwai Chung, Hong Kong
Tel. (852) 2619-4000
Fax (852) 2480-5852
ASM Wafer Process Equipment Ltd.
12/F., Room 1202, Stanhope House
734-738 King’s Road,
Quarry Bay, Hong Kong
Tel. (852) 2881-7522
Fax (852) 2881-7516
Shen Zhen ASM Micro Electronic
Technology Co. Ltd.
6/F Block A, Hoi Peng
Industrial Estate
2052, Wu Tung Road
Sha Tou Jiao, Shenzhen
Peoples Republic of China
Tel. (86) 755-5552-433
Fax (86) 755-5552-434
ASM Precision Machinery
Manufactory Ltd.
2048, Wu Tung Road
Sha Tou Jiao, Shenzhen
Peoples Republic of China
Tel. (86) 755-5553-590
Fax (86) 755-5552-434
ASM Pacific KOR Limited
3F1, 628-6, Deung Chon Dong
Kangseo Gu, Seoul
157-030 Korea
Tel. (82)-2-659 4174
Fax (82)-2-659 4216
ASM Korea Ltd.
4F, DaeWoo Engineering Bldg.
9-3, SuNae-Dong, BunDang-Ku
SungNam-City, Kyonggi-Do
463-020 Korea
Tel. (82) 31-738-1011
Fax (82) 31-738-1012
ASM Taiwan - Taipei Office
2nd Floor, No. 70, Sec. 2
Chang Sha Street,
Taipei, Taiwan, R.O.C.
Tel. (886) 2-32312 6800
Fax (886) 2-32312 6899
ASM Taiwan - Kaohsiung Office
No. 4-2, East 3 Road Street
N.E.P.Z. Kaohsiung
Taiwan, R.O.C.
Tel. (886) 7-367 6300
Fax (886) 7-367 6399
ASM Taiwan - Hsin Chu Office
2F, No.9, Lane 379, Sec 1
Ching Kuo Road
Hsin-Chu Hsien,
Taiwan, R.O.C.
Tel. (886) 3-543 1500
Fax (886) 3-543 1555
ASM Far East Marketing Ltd.
Taiwan Branch
1F, Nr. 58, Hsien-Cheng
Liu Road, Chu-Pei 302
Hsin-Chu Hsien,
Taiwan, R.O.C.
Tel. (886) 3-551-5596
Fax (886) 3-551-5597
ASM Pacific Philippines
Unit 401, The Sycamore Building
Alabang-Zapote Road
Alabang, Muntinlupa City
Philippines 1770
Tel. (632) 850-4543809 3917
(632) 809 3919/809 3931
Fax (632) 850-4547
ASM Technology Singapore Pte Ltd.
2, Yishun Avenue 7
Singapore 768924
Tel. (65) 7526-311
Fax (65) 7582-287
ASM Wafer Process Equipment
Singapore Pte Ltd.
2, Yishun Avenue 7
Singapore 768924
Tel. (65) 7503-192
Fax (65) 7535-485
ASM Shanghai
Room H, 4/F, AI HE Building
629 Ling Ling Road
200030 Shanghai
Peoples Republic of China
Tel. (86) 21-6427 6928
Fax (86) 21-6486 5304
ASM Assembly Equipment
(M) Sdn. Bhd.
Bayan Point, Block A
No. 15-1-23, 15-1-24
Medan Kampung Relau
11900 Penang, Malaysia
Tel. (604) 644 9490/642 0291
Fax (604) 645 1294
ASM Assembly Equipment
(M) Sdn. Bhd.
17 Tingkat Satu,
Taman Sri Mulia Sungai Abong
84000, Muar, Johor, Malaysia
Tel. (606) 951 5713
Fax (606) 951 5786
ASM Assembly Equipment
Bangkok Ltd.
51/3, Vibhavadi Tower, 18/2 Floor
Ngamwongwan Road, Ladyao,
Chathuchak
Bangkok, 10900, Thailand
Tel. (66) 2-941 3181/2
Fax (66) 2-941 3183
®
ASM International N.V. dedicates its resources to the research, development,
manufacturing, marketing and servicing of equipment and materials used to produce
semiconductor devices.
The Company provides solutions for the main areas of semiconductor production:
wafer processing, assembly and packaging.
The Company’s principal facilities in Europe, the United States, South-East Asia and
Japan enable it to meet local specifications and to sell and service its products in the
world’s major semiconductor markets: Europe, the United States and the Far East.
To meet the semiconductor industry’s demand for capital intensive production
solutions, the Company’s design concepts emphasize superior quality, ease of
operation and maintenance, reliability, safety and system integration.
ASM International

4 Financial Highlights and Selected Comparative Financial Data
5 Report from the Supervisory Board
6 Letter to Shareholders
8 ASM, The Process of Innovation
12 Management’s Discussion and Analysis
20 Consolidated Financial Statements20 Consolidated Balance Sheets
21 Consolidated Statements of Operations
22 Consolidated Statements of Comprehensive Income
22 Consolidated Statements of Shareholders’ Equity
23 Consolidated Statements of Cash Flows
24 Notes to Consolidated Financial Statements
40 Independent Auditors’ Report
42 Statutory Financial Statements42 Statutory Balance Sheets
42 Statutory Statements of Operations
43 Notes to Statutory Financial Statements
46 Additional Information
47 Independent Auditors’ Report
48 Common Stock Information
49 Corporate Information
50 ASM Worldwide
Contents
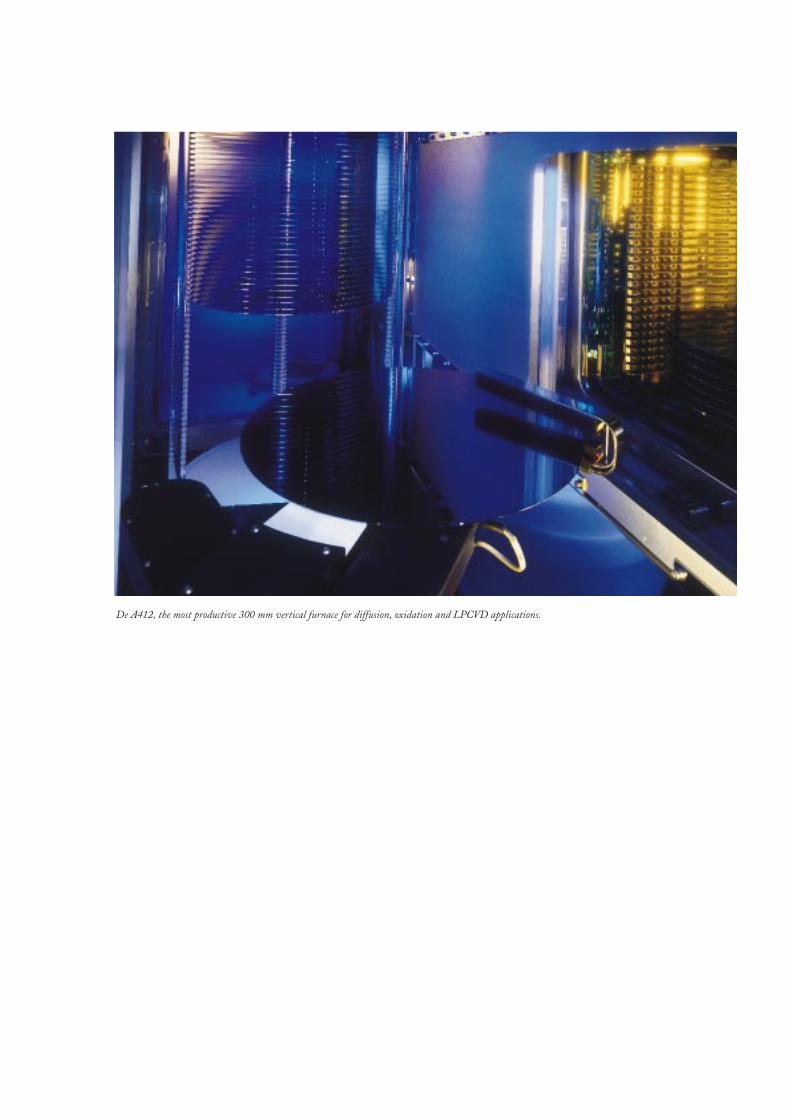
De A412, the most productive 300 mm vertical furnace for diffusion, oxidation and LPCVD applications.

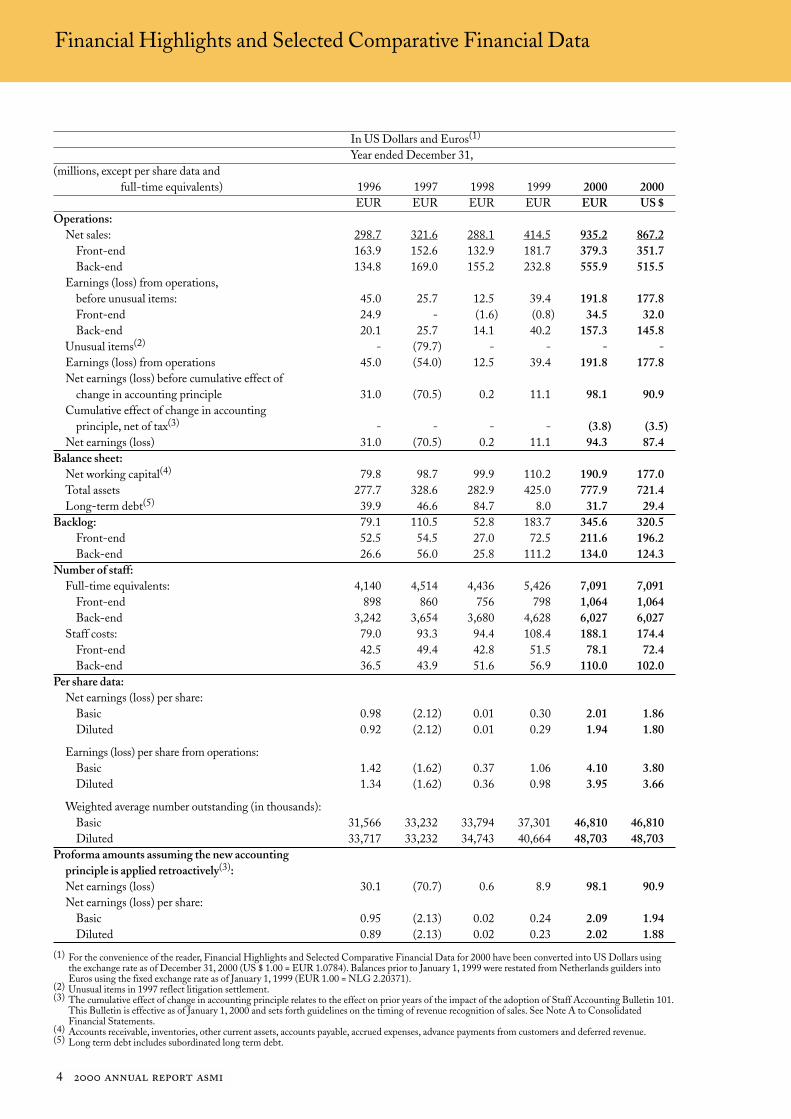
Financial Highlights and Selected Comparative Financial Data
In US Dollars and Euros(1)
Year ended December 31,
(millions, except per share data and
full-time equivalents) 1996) 1997) 1998) 1999) 2000) 2000)
EUR) EUR) EUR) EUR) EUR) US $)
Operations:
Net sales: 298.7) 321.6) 288.1) 414.5) 935.2) 867.2)
Front-end 163.9) 152.6) 132.9) 181.7) 379.3) 351.7)
Back-end 134.8) 169.0) 155.2) 232.8) 555.9) 515.5)
Earnings (loss) from operations,
before unusual items: 45.0) 25.7) 12.5) 39.4) 191.8) 177.8)
Front-end 24.9) -) (1.6) (0.8) 34.5) 32.0)
Back-end 20.1) 25.7) 14.1) 40.2) 157.3) 145.8)
Unusual items(2) -) (79.7) -) -) -) -)
Earnings (loss) from operations 45.0) (54.0) 12.5) 39.4) 191.8) 177.8)
Net earnings (loss) before cumulative effect of
change in accounting principle 31.0) (70.5) 0.2) 11.1) 98.1) 90.9)
Cumulative effect of change in accounting
principle, net of tax(3) -) -) -) -) (3.8) (3.5)
Net earnings (loss) 31.0) (70.5) 0.2) 11.1) 94.3) 87.4)
Balance sheet:
Net working capital(4) 79.8) 98.7) 99.9) 110.2) 190.9) 177.0)
Total assets 277.7) 328.6) 282.9) 425.0) 777.9) 721.4)
Long-term debt(5) 39.9) 46.6) 84.7) 8.0) 31.7) 29.4)
Backlog: 79.1) 110.5) 52.8) 183.7) 345.6) 320.5)
Front-end 52.5) 54.5) 27.0) 72.5) 211.6) 196.2)
Back-end 26.6) 56.0) 25.8) 111.2) 134.0) 124.3)
Number of staff:
Full-time equivalents: 4,140) 4,514) 4,436) 5,426) 7,091) 7,091)
Front-end 898) 860) 756) 798) 1,064) 1,064)
Back-end 3,242) 3,654) 3,680) 4,628) 6,027) 6,027)
Staff costs: 79.0) 93.3) 94.4) 108.4) 188.1) 174.4)
Front-end 42.5) 49.4) 42.8) 51.5) 78.1) 72.4)
Back-end 36.5) 43.9) 51.6) 56.9) 110.0) 102.0)
Per share data:
Net earnings (loss) per share:
Basic 0.98) (2.12) 0.01) 0.30) 2.01) 1.86)
Diluted 0.92) (2.12) 0.01) 0.29) 1.94) 1.80)
Earnings (loss) per share from operations:
Basic 1.42) (1.62) 0.37) 1.06) 4.10) 3.80)
Diluted 1.34) (1.62) 0.36) 0.98) 3.95) 3.66)
Weighted average number outstanding (in thousands):
Basic 31,566) 33,232) 33,794) 37,301) 46,810) 46,810)
Diluted 33,717) 33,232) 34,743) 40,664) 48,703) 48,703)
Proforma amounts assuming the new accounting
principle is applied retroactively(3):
Net earnings (loss) 30.1) (70.7) 0.6) 8.9) 98.1) 90.9)
Net earnings (loss) per share:
Basic 0.95) (2.13) 0.02) 0.24) 2.09) 1.94)
Diluted 0.89) (2.13) 0.02) 0.23) 2.02) 1.88)
(1) For the convenience of the reader, Financial Highlights and Selected Comparative Financial Data for 2000 have been converted into US Dollars using the exchange rate as of December 31, 2000 (US $ 1.00 = EUR 1.0784). Balances prior to January 1, 1999 were restated from Netherlands guilders into Euros using the fixed exchange rate as of January 1, 1999 (EUR 1.00 = NLG 2.20371).
(2) Unusual items in 1997 reflect litigation settlement.(3) The cumulative effect of change in accounting principle relates to the effect on prior years of the impact of the adoption of Staff Accounting Bulletin 101.
This Bulletin is effective as of January 1, 2000 and sets forth guidelines on the timing of revenue recognition of sales. See Note A to ConsolidatedFinancial Statements.
(4) Accounts receivable, inventories, other current assets, accounts payable, accrued expenses, advance payments from customers and deferred revenue.(5) Long term debt includes subordinated long term debt.
4

We submit herewith the 2000 Annual Report and
Accounts as prepared by the Management Board. As
Supervisory Directors, we have held several meetings
with the Management Board during the year and in our
assessment we have gained sufficient insight in the
Company’s strategy, the business risks, the ongoing
operations, market developments, its organization,
management and financials. The Board monitored the
compliance with the standards given by the Dutch
Corporate Governance Committee. The Board was also
actively involved in the refinancing activities during the
year. It continues to supervise the ongoing efforts to
change the maturity profile of the financing of the
Company into one with more emphasis on permanent
capital.
The Supervisory’s Board Audit Committee met
regularly with the Management Board and Deloitte &
Touche, the Company’s independent auditors. Matters
of discussion were the Company’s system of internal
control, the introduction of the Euro by the Company,
as well as the Company’s accounting principles
(including this year’s change to the new SAB 101 rules
for revenue recognition), the audit performed and its
findings and the 2000 Report and Accounts as prepared
by the Management Board. Deloitte & Touche has
issued an unqualified opinion on the 2000 Accounts
and we submit these Accounts to the General Meeting
of Shareholders for approval. We also recommend to
discharge the Managing Directors for their
management during the year 2000 and to discharge the
Supervisory Directors for their supervision during the
year 2000.
Mr. F.W. Saris retired from the Supervisory Board as of
May 30, 2000. The contributions he made to our
company since 1987 in the areas of technological know-
how and the facilitation of a dialogue with universities
and their students have been much appreciated.
On May 30, 2000 Mr. J.M.R. Danneels was appointed
as Supervisory Director. Mr. Danneels is Director of
Hardware Coordination and Chief Executive Officer of
Alcatel Microelectronics in Zaventem, Belgium.
We thank the staff of ASM International for their
commitment and support shown during the past year.
Supervisory Board,
P.C. van den Hoek
J.M.R. Danneels
J. den Hoed
F.C. Rauwenhoff
Bilthoven,
February 9, 2001
Report from the Supervisory Board
5
Letter to Shareholders
2000 was a breakthrough year for ASM International
- the best in our history. We not only achieved record
results that outperformed the industry for the fourth
consecutive year, we also realized our long-term vision
of market leadership through innovation. ASMI both
gained market share and solidified relationships with
most of the world’s top semiconductor manufacturers,
thus firmly establishing the company as a world-class
supplier of leading-edge capital equipment to the
semiconductor industry.
Of equal importance, ASMI substantially improved its
financial position. Net earnings of H 94.3 million
strengthened our equity position. Two successful
capital market transactions also improved our balance
sheet. In February 2000 we converted US $20 million
zero coupon convertible bonds. In April 2000 we
successfully completed a secondary offering that yielded
net proceeds of approximately H 120 million, which
was then used to substantially reduce our interest
bearing debt. As a result of the refinancing activities
that took place in 2000 and our dramatic growth over
the prior year, we now enjoy good financial health.
Industry outperformance
In a year when the industry had exceptional growth of
85%, our net sales surpassed that, growing 126% year
over year. Profits grew eight-fold from the prior year.
All major product lines in both Front-end and
Back-end businesses reported record sales for the year.
While we are proud of our financial performance this
year, we are equally enthusiastic that ASMI’s growth
has been organic, and stems from our broad range of
products and enabling technologies strategically
developed over the past several years. The increased
demand for all our products, the gain in new customers,
and expansion of market share validate our commitment
and our confidence in the quality of our core technology
platforms.
Meeting industry challenges:
The ASMI advantage
As a result of years of strategic initiatives and pioneering
new technologies, ASMI is strongly positioned to
capitalize on the semiconductor industry’s rapid evolution
toward smaller, faster and cheaper products. With
breakthrough technologies for 100 nanometer and
smaller device manufacturing, and system solutions for
the major assembly processes, ASMI holds a clear
competitive advantage in our industry today.
All of ASMI’s products directly address the major
drivers of our industry’s growth: shrinking feature sizes,
the move toward larger (300 mm) wafers, the need for
higher manufacturing productivity at lower costs, as
well as the demand for new materials and process
solutions, such as Silicon-Germanium epitaxy, copper
and low-k, “systems on a chip”, and “flash memory”.
Our leading-edge equipment and process technologies
enable the manufacture of advanced high speed and
high frequency devices used in wireless and broadband
applications, and other high growth semiconductor
markets including automotive applications, optical
networks, digital cameras and other hand-held devices.
Adding to ASMI’s competitive strength is our unique
position as world-class supplier to both the Front-end
and Back-end segments of the capital equipment market.
This not only enables us to participate dynamically in
the future of both segments, but due to the slightly
different demand cycles of wafer processing and
assembly and packaging, also helps stabilize our
company’s growth. Our ability to capitalize on our
diversification has clearly paid off, as is evident in our
outstanding results in 2000.
Assembly and packaging portfolio
ASM Pacific Technology Ltd. (‘ASMPT’), our
55-percent owned Back-end subsidiary, supplying
assembly and packaging products, contributed
significantly to 2000 first half year performance. This
year ASMPT became the world’s second-largest
Back-end equipment supplier, moving up from
number five. More importantly, ASMPT is the most
profitable company worldwide in its sector.
As a provider of both innovative low-cost solutions and
leading-edge technology, ASMPT is the only company
in the world today that manufactures equipment for all
6

major steps in assembly and packaging. In the year,
ASMPT’s award winning AB339 gold wire bonder
continued to gain major volume orders, as the next-
generation gold wire bonder entered the mass production
phase in the fourth quarter.
Wafer processing portfolio
In the second half of the year, while the chip assemblers
digested their extraordinarily high level of equipment
purchases, our Front-end wafer processing products
took the lead in order momentum.
Our epitaxial reactors, our plasma-enhanced chemical
vapor deposition (PECVD) product line and our vertical
furnaces increased market share across geographical
markets and with the top semiconductor producers.
Due to the success of our new applications in Silicon-
Germanium, our epitaxial line held its number one
market position, with over 70% market share. In
PECVD, we rank among the top three players, and
are the market leader in atomic layer deposition
(ALD). In vertical furnaces, ASMI became the world’s
third largest supplier, having added customers every
quarter since our market entry in 1993. We currently
maintain the largest installed base for 300 mm vertical
furnaces in the industry.
Financial management
On January 1, 2001, we welcomed Robert L. de Bakker
to our ASMI management team. He joins ASM
International as Chief Financial Officer, succeeding
Rinse de Jong, who retired early in 2001. Mr. de Bakker
brings extensive experience in financial management
of industrial companies. He was formerly Chief
Financial Officer of NKF Holding N.V., a Dutch
multinational industrial cable company.
Outlook
As we enter 2001, our markets are digesting record
capital equipment spending in 2000. At the same time,
the fundamental drivers of our industry remain
unchanged, fueling our optimism for stable long-term
growth.
Since the market for technology enabling solutions,
such as atomic layer deposition, copper, low-k and 300
mm is generally less susceptible than standard
products to market consolidations, these pockets of the
equipment market are expected to be relatively healthy
in the coming year.
Since ASMI’s portfolio of leading edge equipment for
these segments of the market is now stronger than ever,
we are confident that our company will use the
short-term negative market developments in 2001 to
further improve its competitive position.
While ASMI has gained significant market share over
the past 4 years, we feel that the years ahead present
abundant opportunities for our company, and our
industry. It is our intention to take every advantage of
those opportunities, building upon our record
achievements in 2000, to further enhance our company’s
value for our customers, our employees, and our
shareholders.
Arthur H. del Prado
President and Chief Executive Officer
Bilthoven,
February 9, 2001
7

ASM - The Process of Innovation
The basic driving forces behind continued industry
growth can be summarized as enhanced device
performance or speed, decreased size, and lower costs.
This is achieved mainly by:
• Decreasing the feature size or linewidth-device
scaling;
• Increasing wafer size;
• Improving yield and productivity.
The latter two points mainly affect the device cost,
while device scaling influences all the industry drivers.
By making the transistor - the basic building block of
the device - smaller, it also performs operations faster.
If transistors are smaller, a device with a certain
functionality becomes more compact. Thus, more
devices can be placed on a single wafer, and production
cost is reduced. But, as linewidths get smaller, layer
thickness must also decrease. With each generation,
this can lead to the introduction of new materials and
technologies such as atomic layer deposition (ALD),
and rapid thermal processing (RTP).
Historically, a change in the linewidth of 0.7x, meaning
about twice as many transistors can be placed on a
given wafer surface, occurred every three years.
Recently, however, the introduction of a new technology
generation has been accelerating, occurring every two
years. The industry is responding by introducing new
materials and technologies also at a faster rate.
ASMI has positioned itself to work within a two-year
generation cycle. Today, ASMI is leveraging its
capabilities to support 130 nm technology equipment,
beta testing for 100 nm technology, and the development
of 70 nm technology. For reference, 100 nm is 0.1
micron or 1/10000 of a millimeter.
To decrease costs, wafer sizes increase by a factor of 1.5
times approximately every 9-12 years. The industry is
currently transitioning from 200 mm to 300 mm wafers.
The number of devices that can be placed on a 300 mm
wafer is about 2.4 times greater than on a 200 mm or
8 inch wafer. The greater number of devices compensates
for the higher cost of 300 mm equipment. Presently, all
large semiconductor companies have committed to 300
mm facilities with about 25 plants already announced
for startup over the next two years. ASMI participates
in at least two out of every three 300 mm startups.
Pushing frontiers
Over the years, ASMI has invested heavily in both
core and new technologies. We continue to both pioneer
new technologies and push the frontiers of existing
technologies in order to move to smaller, better
performing and lower-cost transistors. What we are
seeing today is a merging of our long-term strategies
with our new competencies.
ASMI has followed a roadmap that includes both
Front-end and Back-end capabilities and batch and
single wafer processes.
Because of our position in both Front-end and Back-end
semiconductor equipment, we are the only company in
the industry that can address the complexities of copper
connection in both of these segments. Optimal
integration of these historically separate technologies
is crucial to yielding the best device performance at
the lowest cost.
ASMPT has now taken the technological lead in
leadframe-based alternatives for substrate-type chip
scale packages. With both equipment and materials
technology, ASMPT is perfectly positioned to provide
an integrated solution that affords a small footprint
package at a lower cost.
ASMI’s Front-end product portfolio includes both
batch and single wafer processing technologies. This
enables us to respond quickly to industry dynamics.
Due to the inherent robustness of batch systems, we
believe they will retain their desirability, particularly
where cycle time is not a major factor. On the other
hand, in selected applications, and especially those
where cycle time plays an important role, single wafer
processing may be preferred. ASMI’s flexibility and
experience in both processes ideally positions us to
address both markets.
In addition to our ability to respond to migrating
technologies and new materials in our existing
addressable markets, ASMI has an extensive record of
pioneering new technologies. Today, we are extending
our know-how into critical areas necessary to effect
solutions for the next generation of changes in the
microelectronics industry. The newest components of
our intellectual property portfolio, patent protected,
include systems and processes for ALD, RTP, copper
and low-k.
Unique production solutions
ASMI’s position in the accelerating technology scenario
has never been better. Our product portfolio supports
the industry’s changes. Productivity improvements and
the development of a complete set of 300 mm solutions
place our existing products such as the Advance 400,
Industry Trends
8

Epsilon and Eagle series reactors as major contenders
in the coming 300 mm investment waves for 130 and
100 nm technology devices.
At the same time, ASMI developed a new product
portfolio for next generation devices with linewidths
of 100 to 70 nm. These devices will enter mass
production in two to four years. The development of
our Pulsar ALD and RTP equipment is essential for
the production of those devices.
Smaller and faster transistors
As a CVD company, ASMI must match the shrinkage
in transistors, achievable by reducing linewidths from
current advanced levels of 0.18 micron through
successive steps down to sub 0.1 micron levels with the
ability to deposit thinner yet very uniform films. In
our Back-end group, we must supply smaller assembly
and packaging methods to protect the advantages
garnered in the Front-end processes.
Smaller transistors require extremely thin insulating
layers. Presently, standard silicon oxide can be used to
a thickness of six atoms, suitable for 130 to 100 nm
technology. These layers can be constructed with our
Advance 400 series reactors.
However, to get to a thickness of less than four atoms,
which is required for even smaller devices, new
materials and processes are required. ASMI’s solution
is Atomic Layer CVD™, depositing layers with atomic
control of flatness and composition, which satisfies
requirements of 100 to 70 nm transistors. ASMI,
IMEC and Philips Electronics have already
demonstrated the feasibility of such a thin dielectric
with very desirable properties. In addition to logic devices,
such thin insulating layers are also necessary for
memory devices such as flash memory and DRAMS.
ASMI’s market leadership in the area of atomic layer
deposition is firmly established with the ALCVD™
processes in the Pulsar and or Polygon cluster platform.
A breakthrough technology, for thin film applications,
atomic layer deposition is viewed as a successor
technology to many existing physical and chemical
vapor deposition processes.
Smaller transistors also require increasingly thinner
electrical contacts, or junctions, on the transistor. RTP,
which minimizes the time a wafer is exposed to high
temperatures, is essential to achieve such thin junctions.
ASMI’s Levitor RTP system uses gas-bearing principles
to hold a silicon wafer one-tenth of a millimeter
between the surface of two large refractory material
blocks for heating. With its floating wafer concept, it
has demonstrated heat-up rates that are twice as fast
as any radiantly heated systems. In addition, the
Levitor offers lower cost, reduced energy consumption
and high throughput.
Faster transistors, such as those required for wireless
devices, are being made with the Epsilon Silicon
Germanium processes. The Epsilon continues to hold
its dominant position in this growth market. Silicon
Germanium-Carbonfilms are the next step-up in chips
for wireless broadband applications and are now being
installed at customers for qualification.
A third area that ASMI has focused on is the
interconnections between the transistors. A greater
number of transistors must be electrically connected
with thinner and thinner wires. This has driven the
migration to copper as a conductor, replacing
aluminum, and a low-k insulator, which reduces
interaction between adjacent wires.
ASMI’s solution to reducing interaction between
adjacent wires is the Aurora low-k insulator. The
amount of interaction can be characterized by the
k-value. Aurora insulators with a k-value of 2.7
(compared to k=4 for conventional insulators) can be
deposited with our Eagle PECVD equipment. The
Aurora 2.7 process thus reduces interaction by 30% to
40%. A future generation, Aurora 2.0, currently in
development, is expected to provide a 50% reduction.
In order to provide adhesion and prevent interaction
between the copper and low-k insulator, a thin
so-called barrier and seed layer is required in-between
the copper and insulator. These layers need to uniformly
cover all surfaces. ALD films generally follow the
surface of the semiconductor perfectly. This makes
ASMI’s ALCVD technology ideal for this application.
Shrinking the dimension of chips and simultaneously
increasing their functionality affects the Back-end
production processes as well. We lead the industry
with fine pitch ball bonding capability. With successive
chip generations, the number of leads, or wires, must
increase on a smaller surface. This requires smaller
distances between the wires without the leads
interfering with each other. Our bonders have decreased
the physical distance between wires to 35 microns,
compared to an industry average of just 50 microns.
The complexities of copper connection extend also to
the assembly and packaging of devices. While studying
ways to reduce the impact of the high cost of new metal
�
9

ASM - The Process of Innovation (continued)
layers in the semiconductor structure of newer complex
devices, ASMI is looking for solutions both in the
semiconductor structure itself and the subsequent steps
where the semiconductor connects to the outside
world. ASMI is working on improved solutions for
copper, low-k and systems in a package by combining
its expertise in Front-end and Back-end competencies.
Wafer sizes and productivity
Wafer sizes affect the cost of semiconductor devices.
With 2.4 more dies derived per 300 mm wafer than
the prior generation, 300 mm equipment becomes
cost-effective despite the incremental cost.
ASMI was early in this generation change with a full
line of 300 mm equipment covering epitaxy,
LPCVD/diffusion/oxidation and PECVD. Our 300
mm vertical furnace, the A412, is in every 300 mm
pilot line in the world today, and it was the first 300
mm vertical furnace used in a production line.
For all newer offerings such as ALCVD and the Levitor
RTP system, 300 mm equipment is under development
and we expect to ship first products in 2001.
We have integrated metrology, measuring layer
thickness, uniformity and particle count, in our 300 mm
vertical furnace tool set. ASMI’s goal is to incorporate
metrology in all of its product offerings. Integrated
metrology allows the customer to reduce cycle time,
increase yield and throughput, and lower the overall
cost of production.
To satisfy the trend to automation in Back-end
processes, we offer a fully-automated Back-end
production line from die bonding and wire bonding,
to encapsulation and trim and form. This enables our
customers to meet their total system requirements by
offering the most innovative solution to assembly and
packaging, based on our own modular hardware and
software.
Research alliances
To expand and enhance our advanced research
capabilities beyond our own facilities located in the
principal semiconductor markets of the world, ASMI
is engaged in alliances with renowned customers and
institutes.
During 2000, we initiated a partnership with IHP, a
German research institute, to further enhance SiGe films.
These enhanced films will serve the rapidly expanding
need for more bandwidth in telecommunications
applications.
Our relationships with European research laboratories,
including IMEC in Belgium, LETI in France, and the
University of Helsinki in Finland, were strengthened
over the year. Such co-operations enable ASMI to not
only develop new films and process steps but also to
incorporate these steps in the process flow to complete
working devices.
Capacity additions
ASMI is at an exciting juncture in the company’s
history. 300 mm is a reality. As our 300 mm line
continues to gain broad customer acceptance, ASMI
took several steps in the year to expand our 300 mm
production capacity:
In Almere, the Netherlands, a new facility dedicated
to 300 mm furnace production is scheduled to open
Summer 2001, more than doubling ASMI’s furnace
capacity.
Our US subsidiary, ASM America, broke ground for a
demonstration laboratory and a Class-1 cleanroom to
showcase 300 mm and other leading-edge processes.
In June, 2000 ASM Japan opened a new Class-10
cleanroom facility at its Daini Technology Center, to
accommodate our growth in the Japanese market.
During the year, we also qualified additional
subcontractors and outsourced manufacturing of more
Front-end products to help balance production resources
with anticipated demand for our new product families.
ASMPT also took major steps in capacity expansion.
At its China factory, new equipment was added and
the construction of two nearby satellite plants was
completed.
To support ASMPT’s Singapore facility, a new
Malaysian factory came on stream early in 2000.
These additions not only strengthen ASMPT's ability
to meet rising demand for its products, but also help
maintain acceptable delivery lead times for its customers.
10
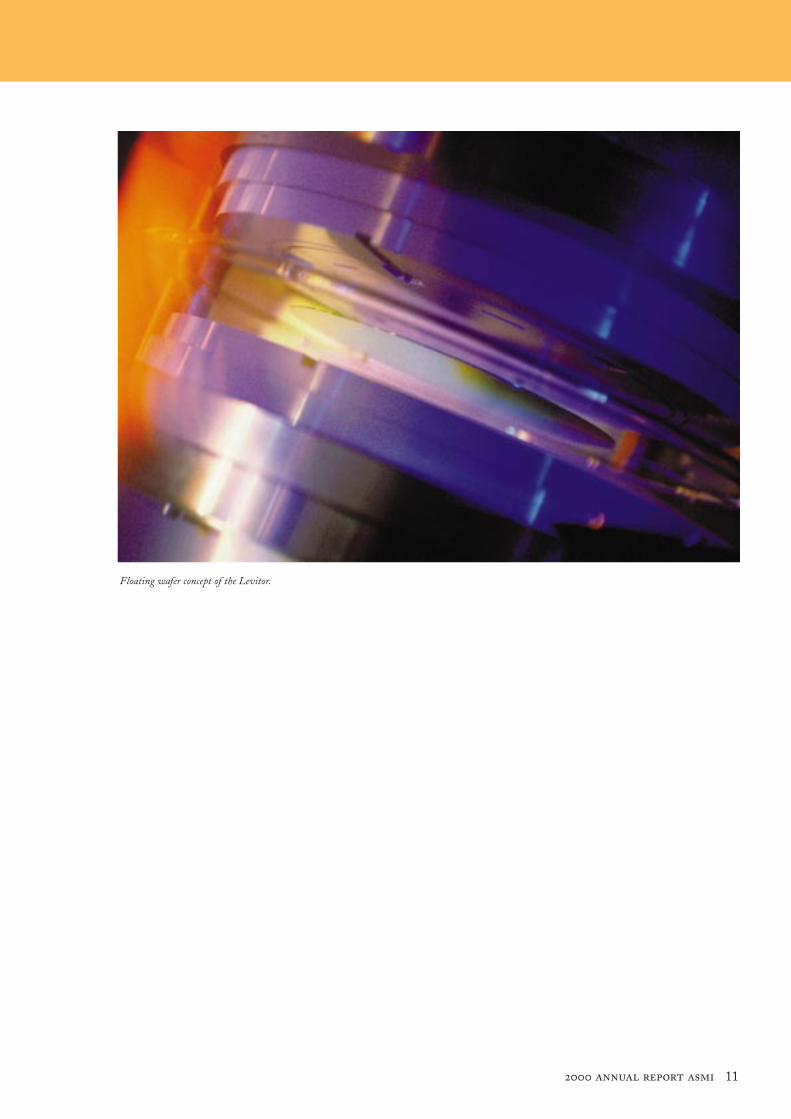
Floating wafer concept of the Levitor.
11
Management’s Discussion and AnalysisManagement’s Discussion and Analysis of Financial Condition and Results of Operations
We are a leader in the design, manufacture and sale
of equipment and solutions used to produce
semiconductor devices. Our production equipment
and solutions are used by both the Front-end and
Back-end segments of the semiconductor market. We
were incorporated under the laws of the Netherlands
in 1968. Throughout our history, we have conducted
business through subsidiaries located worldwide. We
established our operations in Hong Kong in 1975, in
the United States in 1976, in Japan in 1982, and in
Finland in 1999 through the acquisition of
Microchemistry Ltd. We completed our initial public
offering in the United States in 1981 and in the
Netherlands in 1996. We completed subsequent
public offerings in the United States in 1983 and in
the United States and the Netherlands in 2000. Our
common shares are listed on the Euronext
Amsterdam in the Netherlands and the Nasdaq
National Market in the United States.
We conduct our Back-end operations through ASM
Pacific Technology Ltd (‘ASMPT’), which was our
wholly-owned subsidiary until 1988, when we
completed an initial public offering of 25% of its
shares on the Hong Kong Stock Exchange. We have
since sold and purchased shares of ASMPT on the
open market, and as of December 31, 2000, we
owned 54.62% of its outstanding shares. ASMPT
expanded operations with significant new production
facilities in Shenzhen, China in 1989, Singapore in
1990, and completed new plants in China and
Malaysia in 2000.
The sales cycle from quotation to shipment for our
Front-end equipment generally ranges from five to
nine months, depending on capacity utilization and
the urgency of the order. The acceptance period after
installation may be as short as four to five weeks. If
customers are unfamiliar with our equipment or are
receiving new product models, the acceptance period
may take as long as ten weeks. The sales cycle is
longer for equipment which is installed at the
customer’s site for evaluation prior to sale. The typical
trial period ranges from six months to one year after
installation.
The sales cycle for Back-end products typically is
shorter than for Front-end. Generally, the majority of
our Back-end equipment is built in standard
configurations. We build Back-end products that are
approximately 85% complete in anticipation of
customer orders. Upon receipt of a customer’s order
and specifications, the remaining 15% of the
manufacturing is completed. This allows us to complete
the assembly of our equipment in a short period of
time. We therefore require between two to six weeks
for final manufacturing, testing, crating, and shipment
of our Back-end equipment. Our Back-end customers’
acceptance periods generally are shorter than those
for Front-end equipment. We provide installation,
training and technical support to our customers with
local staff in all of our major markets.
Effective January 1, 2000 the Company adopted new
guidance on revenue recognition as is described in
Staff Accounting Bulletin No. 101 “Revenue
Recognition in Financial Statements” (“SAB 101”),
issued by the staff of the Securities and Exchange
Commission (the “SEC”) in December 1999. See
Note A to Consolidated Financial Statements.
Net revenues include product revenues derived
primarily from sales of Front-end and Back-end
equipment used by both segments of the
semiconductor market. The Company recognizes
revenue from equipment sales upon shipment of its
products when it is proven prior to shipment that the
equipment has met all of the customers’ criteria and
specifications. The installation process is not believed
to be essential to the functionality of the Company’s
products. However, since under most of the Company’s
sales contracts, the timing of payment of a portion of
the sales price is coincident with installation, such
installation is not considered to be inconsequential or
perfunctory under the guidance of SAB 101.
Therefore, at the time of shipment, the Company
defers that portion of the sales price related to the
fair value of installation at the time of shipment. The
Company believes it has an enforceable claim for that
portion of the sales price not related to the fair value
of the installation should it not fulfill its installation
obligation. The fair value of the installation process is
measured based upon the per-hour amounts charged
by third parties for similar installation services. When
the Company can only satisfy the customer acceptance
criteria or specifications at the customer’s location,
revenue is deferred until final acceptance by the
customer or until contractual conditions lapse.
The Company provides training and technical support
to customers. Revenue related to such services are
recognized when the service is completed. Revenue
from the sale of spare parts and materials is recognized
when the goods are shipped.
The Company previously recognized revenue from
the sale of all equipment sales including installation
services at the time of transfer of title, and when no
Overview
12
significant contractual obligations remained. Revenue
recognition for sale of spare parts and services has not
been changed.
The adoption of the new accounting principle for
revenue recognition as of January 1, 2000 based on the
new guidance of SAB101 has an effect on the amounts
of revenue and net earnings reported in previous
periods. The effect of this change as of January 1,
2000 was to defer H 12.2 million net sales and H 3.8
million net earnings to future periods. The effect on
net earnings as of January 1, 2000 has been recorded
as a cumulative effect of change in accounting
principle in the Statement of Operations for the year
ended December 31, 2000.
Our Front-end sales are primarily concentrated in the
United States, Europe, Japan and South-East Asia.
During 2000, equipment shipped to destinations in
these regions accounted for sales of H 110.4 million,
H 87.0 million, H 108.7 million, and H 73.2 million,
respectively. Our Back-end sales, which approximated
H 555.9 million, are concentrated in Asia. Our ten
largest customers in 2000 accounted for approximately
45.2% of total sales.
We invested approximately H 73.8 million in research
and development during 2000. As part of our
research and development activities, we are engaged
in various development programs with customers and
institutes that allow us to develop products that meet
customer requirements and to obtain access to new
technology and expertise. We expense our research
and development costs. We charge to costs of sales
the costs which relate to prototype and experimental
models which we subsequently sell to customers.
Our reported research and development expenses are
after research and development credits, which
approximated H 2.2 million in 2000. Our Netherlands,
Belgium, Finnish and Singapore operations receive
research and development grants and credits from
various governmental sources. The research and
development grants we received in the Netherlands
are contingently repayable to the extent we recognize
sales of products to which the credit was related. These
repayments vary and range from 1.0% to 4.0% of the
realized sales, depending on the products sold. Our
actual and contingent repayments accrue interest at
rates ranging from 5.0% to 8.0% per annum. Our
contingent liability related to these possible repayments
approximated H 12.0 million at December 31, 2000.
During the first quarter of 1999, the Company
decided to close its manufacturing activities for wafer
processing equipment in the United States and in
combination therewith, to outsource to third parties
the manufacturing of substantially all parts previously
manufactured in-house. Concurrently, the United
States assembly and test activities were combined
with those in Europe. This resulted in a reduction in
employees in the United States by approximately 75
and in the vacating of certain facilities.
Approximately 50 new positions were created in
Europe. The Company incurred a restructuring
charge, covering employee terminations, write-offs
and occupancy costs of H 3.9 million associated with
these decisions.
The Company’s intention was to begin implementing
the steps necessary to complete the 1999 restructuring
program immediately on formalization thereof and to
substantially complete all necessary steps by the end
of 1999. At December 31, 1999, however, there was a
remaining accrual associated with the restructuring
program of H 2.5 million; implementation of certain
elements of the program had been delayed due to
longer than anticipated time taken to transfer certain
operations to Europe where plant modifications were
required. At December 31, 1999, the revised schedule
for completion of the program was mid 2000.
In the first half of 2000, the global demand for wafer
processing equipment and, as a consequence, the
assembly and final testing activities of such
equipment, increased sharply when compared to the
same period in 1999. The Company’s European
facilities and the Company’s third party subcontractors
had difficulty in coping with the significantly higher
volumes. Consequently, the Company decided to
partially reverse its earlier decision and reopened
facilities that were vacated under the 1999 restructuring
program. As a consequence, part of the restructuring
provision mainly related to legal contractual obligations
for leased properties in the amount of H 1.6 million
was reversed and credited to selling, general and
administrative expenses in the Consolidated Statement
of Operations in the second quarter of 2000.
Effective in July 1999, we purchased all of the
outstanding shares of Microchemistry, a company
located in Finland, for approximately H 3.9 million. In
September 1999 Microchemistry was renamed ASM
Microchemistry. Prior to our purchase, Microchemistry
developed the process to grow or deposit films one
layer at a time by means of ALCVD, and marketed
ALCVD processes to manufacturers of flat panel
displays and tape magnetic head products. Following
our acquisition, ASM Microchemistry is shifting its
focus to manufacturers of semiconductor devices.
�
13
In December 1999, we purchased a 24% interest in
NanoPhotonics AG, a German supplier of precision
thin film metrology equipment for H 338,000. The
technology supplied by NanoPhotonics allows for the
integration of high-resolution, ellipsometric thin film
metrology directly in a wafer-processing tool. We
believe that this investment will enable us to equip
our batch and single wafer equipment with integrated
thin film metrology.
In April 2000, the Company completed a public
offering of 4,250,000 common shares at a price of
US $ 29.00 per share. The net proceeds amounted to
H 119.7 million, which were used to repay
outstanding loans and funding of the Company’s
working capital needs.
Following the issuance of common shares under the
ASMPT Employee Incentive Scheme in March
2000, the Company’s shareholding in ASMPT
dropped slightly below 50%. In various transactions
in April and June, the Company acquired 0.3% of the
outstanding common shares of ASMPT, thereby
restoring its total shareholding in that company to
over 50%. Throughout this entire period, the
Company maintained control over ASMPT. On July 6,
2000, the Company completed a purchase of
approximately 4.7% of the outstanding common shares
in ASMPT from one institututional investor. At
December 31, 2000, the shareholding in ASMPT
amounts to 54.62% of the outstanding common shares.
As of December 31, 2000, we had net operating loss
tax carryforwards of H 260 million which we
can mainly apply against earnings reported in the
United States and the Netherlands.
The market value of our investment in ASMPT at
the end of 2000 was approximately H 318.4 million,
which is lower than the market value at the end of
1999, which was approximately H 333.9 million.
Results of Operations
Year Ended December 31, 2000 Compared to Year Ended
December 31, 1999
Net Sales. The market for semiconductor equipment
was strong in the first three quarters of the year and
started to become weaker at the end of the year.
Consolidated net sales increased 125.6% to
H 935.2 million in 2000 compared to H 414.5 in
1999. Front-end sales increased 108.8% from H 181.7
million in 1999 to H 379.3 million in 2000. Back-end
sales increased 138.8% from H 232.8 million in 1999
to H 555.9 million in 2000. The Front-end sales
increase was over all product lines. The Back-end sales
increase was primarily due to increased sales of
equipment and to a lesser extent, leadframes.
Gross Profit. Our consolidated gross profit increased
from 41.0% of net sales in 1999 to 44.6% of net sales
in 2000. The Front-end business gross profit decreased
slightly from 40.5% of net sales in 1999 to 40.3% of
net sales in 2000, while the Back-end division gross
profit grew from 41.4% of net sales in 1999 to 47.6%
of net sales in 2000. The decrease in gross profit as a
percentage of sales in Front-end is, despite efficiency
improvements in the manufacturing of existing product
lines, caused by initial lower margins on the introduction
of new technology in ALCVD and 300 mm
equipment. The improvement by our Back-end
segment was achieved through manufacturing
efficiencies related to the increased volumes and partly
through better pricing conditions for our products.
Selling, General and Administrative. Our selling,
general and administrative expenses increased from
H 83.2 million in 1999 to H 147.3 million in 2000.
Front-end and Back-end selling, general and
administrative expenses increased from H 48.6 million
and H 34.6 million in 1999 to H 66.2 million and
H 81.1 million in 2000. Throughout this year, we
have been investing in the expansion of our support
and overhead departments in order to handle
increased product and order volumes. Staff levels
increased from 2,387 as of December 31, 1999 to
2,895 as of December 31, 2000. As a percentage of
net sales, selling, general and administrative expenses
decreased from 20.1% for 1999 to 15.8% for 2000.
Amortization of Goodwill. The amortization of goodwill
increased from H 0.3 million in 1999 to H 4.3 million
in 2000. This increase relates to the amortization of
goodwill resulting from the acquisition of an additional
5.0% in ASMPT in 2000 and the acquisition of
Microchemistry and NanoPhotonics in 1999.
Research and Development. Research and development
expenses increased by 56.5% from H 47.1 million in
1999 to H 73.8 million in 2000. Front-end research
and development expenses increased by 63.4% from
H 29.3 million in 1999 to H 47.9 million in 2000
while Back-end research and development expenses
increased 45.2% from H 17.8 million in 1999 to
H 25.9 million in 2000. Net research and development
expenses declined from 11.4% of net sales in 1999 to
7.9% of net sales in 2000. The amounts of research
and development credits offset against research and
development expenses amounted to H 3.3 million in
Management’s Discussion and Analysis (continued)Management’s Discussion and Analysis of Financial Condition and Results of Operations
14
�
1999 and H 2.2 million in 2000. Investments in
research and development have been concentrated on
the products that have pushed our growth in the last
three years. In Front-end the concentration was on
high-k dielectrics, low-k dielectrics, ALD, RTP and
300 mm process applications while in Back-end our
concentration was on performance improvements and
the release of new or upgraded products.
Net Interest and Other Financial Income (Expenses).
Net interest and other financial income (expenses)
decreased by 81.5% from a net expense of H 8.6 million
in 1999 to a net expense of H 1.6 million in 2000 due
principally to the repayment of short-term loans with
the proceeds of the public offering of common shares
we completed in April 2000 and with cash generated
from operations. The strength of the US Dollar, the
Hong Kong Dollar versus the Euro, our reporting
currency, resulted in transaction exchange gains.
Income Taxes. We incurred H 22.8 million in income
taxes during 2000, compared to H 1.3 million in 1999.
As of December 31, 2000, we have a H 260 million
net operating loss carryforward which we mainly can
apply against future earnings reported in the United
States and the Netherlands.
Net Earnings. Our net earnings in 2000 were
approximately H 94.3 million compared to H 11.1
million in 1999. These 2000 net earnings were
influenced by a cumulative effect of change in
accounting principle of H 3.8 million due to the
adoption of new accounting guidelines for revenue
recognition. Our Front-end operation reported net
earnings before the cumulative effect of change in
accounting principle of H 16.8 million in 2000
compared to a net loss of H 7.8 million in 1999. Our
portion of our Back-end operation's net earnings
before the cumulative effect of change in accounting
principle was H 81.3 million compared to H 18.9 mil-
lion in 1999.
Year Ended December 31, 1999 Compared to Year Ended
December 31, 1998
Net Sales. While the market for semiconductor
equipment was still weak in the first quarter of 1999,
net sales increased in both Front-end and Back-end
segments during the second through fourth quarters
of 1999 and consolidated sales increased by 43.9% in
1999 compared to 1998. Front-end sales increased
36.8% from H 132.9 million in 1998 to H 181.7 million
in 1999. Back-end sales increased 49.9% from
H 155.2 million in 1998 to H 232.8 million in 1999.
The Front-end sales increase was primarily due to
higher sales of our Eagle 10 products. The Back-end
sales increase was primarily due to increased sales of
equipment and to a lesser extent, leadframes. Pricing
in the leadframe market, which was depressed in
1998, improved in 1999.
Gross Profit. Our consolidated gross profit increased
from 37.8% of net sales in 1998 to 41.0% of net sales
in 1999. The Front-end business gross profit increased
from 39.4% of net sales in 1998 to 40.5% of net sales
in 1999, while the Back-end division gross profit grew
from 36.4% of net sales in 1998 to 41.4% of net sales
in 1999. Semiconductor equipment market growth in
the second half of 1999 led to an easing of pricing
pressures experienced during 1998. In addition, our
introduction of new process technology helped
improve our margins.
Selling, General and Administrative. To keep pace with
the general semiconductor market expansion and to
meet increasing customer orders in 1999, selling, general
and administrative expenses increased from H 60.0
million in 1998 to H 83.2 million in 1999. Front-end
and Back-end selling, general and administrative
expenses increased from H 30.2 million and H 29.8
million in 1998 to H 48.9 million and H 34.6 million
in 1999. Increased costs primarily reflected expansion
in personnel and the restructuring of the ASM America
manufacturing related operations. However, selling,
general and administrative expenses as a percentage of
net sales declined from 20.8% in 1998 to 20.1% in 1999.
Research and Development. Research and development
expenses increased by 30.0% from H 36.3 million in
1998 to H 47.1 million in 1999. Front-end research
and development expenses increased by 23.4% from
H 23.7 million in 1998 to H 29.3 million in 1999
while Back-end research and development expenses
increased 42.3% from H 12.6 million in 1998 to
H 17.8 million in 1999. Net research and
development expenses declined from 12.6% of net
sales in 1998 to 11.4% of net sales in 1999. The
amounts of research and development credits offset
against research and development expenses amounted
to H 5.2 million in 1998 and H 3.3 million in 1999.
Net Interest and Other Financial Income (Expenses).
Net interest and other financial income (expenses)
increased by 60.9% from H 5.4 million in 1998 to
H 8.6 million in 1999 due to the repayment of a non-
interest bearing short-term loan which became due in
November 1998 with an interest-bearing, longer term
loan with warrants. In addition, in October 1999 we
issued a zero-coupon US $14.9 million debenture
with a maturity value of US $20.0 million which
15
accrued interest at 6% per annum, and which had
warrants attached. We also borrowed more frequently
on our revolving lines of credit to finance receivables
and work-in-process which, on average, were larger
in 1999 than in 1998.
Income Taxes. We paid H 1.3 million in income taxes
during 1999, compared to H 0.6 million in 1998. As of
December 31, 1999, we had a H 275 million net
operating loss carryforward which we can apply
against future earnings reported in the United States
and the Netherlands.
Net Earnings. Our net earnings in 1999 were
approximately H 11.1 million compared to H 0.2 million
in 1998. Our Front-end operation reported a net loss
approximating H 7.8 million in 1999, including the
H 3.9 million restructuring charge incurred in
connection with moving manufacturing operations from
ASM America to ASM Europe. Our Front-end
operation’s net loss in 1999 was larger than its net loss
in 1998 approximating H 6.6 million. Our portion of
our Back-end operation’s net earnings approximated H
18.9 million compared to H 6.8 million in 1998.
Backlog
Our backlog of orders booked increased from
approximately H 183.7 million at December 31, 1999
to approximately H 345.6 million at December 31,
2000, of which a substantial majority was for
deliveries in the first and second quarter of 2001.
Our backlog consists of orders of products by
purchase orders or letters of intent for future periods,
typically for up to the next twelve months. In
markets such as Japan it is common practice for
letters of intent to be used in place of firm purchase
orders. We sometimes allow customers to cancel or
reschedule deliveries. In addition, purchase orders are
subject to price negotiations and changes in
quantities of products ordered as a result of changes
in customers’ requirements. Depending on the
complexity of an order, we generally ship our
products from one to six months after receipt of an
order. We include in the backlog only orders for
which a delivery schedule has been specified and to
which the customer has assigned an order number.
Liquidity and Capital Resources
Our liquidity is affected by many factors, some of
which are related to our ongoing operations and
others of which are related to the semiconductor and
semiconductor equipment industries and to the
economies of the countries in which we operate.
Although our cash requirements will fluctuate based
on the timing and extent of these factors, we believe
that cash generated by operations, together with the
liquidity provided by our existing cash resources and
the arrangements governing our current indebtedness,
will be sufficient to fund working capital, capital
expenditures and other ongoing business requirements.
In addition, we have equipment in the field that is
being evaluated by customers. This ‘seeding’ of new
equipment is an important tool for us to enlarge our
customer base and our installed base, requiring
significant capital during the evaluation period.
At December 31, 2000 our principal sources of
liquidity consisted of H 106.8 million in cash and
cash equivalents and H 68.5 million in undrawn bank
lines. H 89.7 million of the cash and cash equivalents
and H 48.8 million of the undrawn bank lines are res-
tricted to use in our Back-end operations.
During 2000, operating activities generated a net
cash inflow of H 153.1 million as compared to H 46.9
million during 1999. The increase was primarily due
to higher cash flow from operations, which was
partially offset by a net outflow of H 72.7 million in
other assets and liabilities in 2000 compared to a
H 7.9 million outflow in 1999. These outflows
resulted primarily from an increase in accounts
receivable and inventories due to the increase in
business activities in 2000. Cash flow used in
investment activities amounted to H 136.4 million
during 2000, an increase compared to H 26.8 million
in 1999. Those investments were made to increase
our manufacturing and assembly capacity, particularly
to complete new plants in Malaysia and China.
In April 2000, we completed a public offering of
common shares, which gave us net proceeds of
approximately H 119.7 million. We used H 76.8 million
of these proceeds for repayment of loans. Following
the repayment, the assets securing these loans have
been released from their liens.
In July 2000, we completed the purchase of
approximately 4.7% of the outstanding shares in
ASMPT, bringing our total shareholding in this
company to 54.88% at that date. The investment,
including some smaller purchases of shares in April
and June of this year, amounted to H 75.5 million.
The purchase was funded with cash and with the
proceeds of a two-year loan facility with Canadian
Imperial Bank of Commerce (“CIBC”). We borrowed
US $ 69 million under the loan facility. The loan is
secured by our shareholding in ASMPT.
The excess of the purchase price over the fair market
Management’s Discussion and Analysis (continued)Management’s Discussion and Analysis of Financial Condition and Results of Operations
16
�
value of the underlying net assets acquired in the
amount of H 65.0 million has been recorded as
goodwill and is amortized over a period of ten years,
on a straight line basis. The fair market value approxi-
mates the bookvalue of such net assets of ASMPT.
On October 6, 2000 the Company repaid US $ 10
million in principle amount under the CIBC loan
facility consisting of US $ 5.5 million installment and
US $ 4.5 million partial prepayment. On December
21, 2000 a second partial prepayment of US $ 13.0
million was made. The outstanding balance as of
December 31, 2000 is US $ 46.0 million.
In connection with the CIBC loan facility, we entered
into an equity line of credit with Canadian Imperial
Holdings, Inc. (“CIHI”), an affiliate of CIBC, pursuant
to which we have the right to sell up to an aggregate
of US $ 65 million of newly issued shares to CIHI
from time to time over a two year period. Pursuant to
the equity line, we are required to register with the
US Securities and Exchange Commission (“SEC”)
US $ 65 million of our common shares for offer and
sale pursuant to the equity line. The registration
statement must remain in effect for the duration of
the equity line. CIHI is under no obligation to
purchase our newly issued common shares under the
equity line if effectiveness of our registration statement
is withdrawn, certain conditions precedent to the
equity line are not satisfied or certain covenants are
not complied with.
We have filed a registration statement with the SEC
for these shares on March 9, 2001. Until the registration
statement is declared effective by the SEC, we are
unable to issue shares under this equity line of credit.
Registration must be effective by April 23, 2001. If it
is not effective by that date, we must pay CIHI a
monthly fee of 3/4% of the outstanding CIBC loan
amount and 1% per month if the registration statement
is not effective by June 8, 2001.
In April 2000 we repaid a term loan of H 25.0 million
to the Nationale Investeringsbank N.V. (‘NIB’) from
the proceeds of the share offering and during the year
2000 we repaid the remaining installments of a
subordinated loan to the NIB in the amount of H 2.0
million and a H 1.4 million subordinated loan to a
related party.
During 2000 we negotiated an increase of the term
loans with our banks in Japan and increased our loans
with our bank in Finland and repaid outstanding
bank loans in Hong Kong.
During 1998 we negotiated an extension of an
original US $ 80.0 million convertible note provided
by Applied Materials following the settlement of the
patent dispute in 1997. After paying Applied
Materials US $ 15.0 million in 1997 and US $ 20.0
million in 1998, the remaining balance of US $ 45.0
million of the initial interest-free subordinated
convertible loan was replaced by an interest-bearing
note for which we provided security. In addition, we
issued a warrant to Applied Materials to purchase
1.5 million of our common shares at a price of
US $ 5.375 per share. The note was repayable in two
installments: US $ 10.0 million was paid in 1999 and
the remaining US $ 35.0 million was due in 2000 which
was repaid from the the proceeds of the exercise of
the 1.5 million warrants in March 2000 and from the
proceeds of the share offering in April 2000.
On October 1, 1999, we placed 6% zero-coupon
debentures with a maturity value of US $ 20.0 million
with a group of United States institutional investors.
The debentures had a five year maturity. The
debentures were discounted by 6% annual interest
for a net purchase value of approximately US $ 14.9
million. As part of the debenture agreement, the
investors received 2,037,957 non-detachable warrants
and 200,000 supplemental warrants on common shares
of the Company with an exercise price of US $ 9.81
per share, a premium to market at the date of issuance
of 20%. In February 2000, the 2,037,957 warrants
were exercised and the debentures were cancelled in
partial payment of the exercise price of the warrants.
The remaining portion of the exercise price of the
warrants was fulfilled by the investors contributing
US $ 4.8 million in cash.
In 1998 we entered into a H 20.4 million, 6%
subordinated convertible loan with three lenders.
During 1999, all three lenders converted their loan
into common shares.
The Front-end business finances its operations from
the cash flows derived from its business activities and
from collateralization of fixed and current assets.
Back-end operations are entirely self-financed by
ASM Pacific Technology. The cash resources and
borrowing capacity of ASM Pacific Technology are
not available to our Front-end operations.
We support borrowings of our Front-end subsidiaries
with guarantees. We have also mortgaged certain
land and buildings to secure our Front-end
borrowings. We have also pledged all of our
shareholding in ASMPT. The market value of our
investment in ASMPT at the end of 2000 was
17
Management’s Discussion and Analysis (continued)Management’s Discussion and Analysis of Financial Condition and Results of Operations
approximately H 318.4 million, which is slightly
lower than the market value at the end of 1999,
which was approximately H 333.9 million.
Market Risk Disclosure
We are exposed to currency fluctuations, most notably
fluctuations of the United States dollar, the Hong
Kong dollar and the Japanese yen against the Euro.
To the extent that these fluctuations affect the value
of our investments in our affiliates, they are not
hedged. The cumulative effect of these fluctuations
are separately reported in shareholders’ equity and
2000 showed a negative movement of H 0.9 million.
Currency
Currency fluctuations that affect operating cash flows
are hedged as a policy. We view exposures on a
consolidated basis and sell off or cover excess or short
positions, using spot or forward contracts which are
entered into with commercial banks of good standing.
At December 31, 2000 we had outstanding forward
exchange contracts in which we agreed to buy foreign
currencies in the amount of H 5,5 million and to sell
foreign currencies in the amount of H 7,5 million. At
December 31, 2000 the fair market value of these
exchange contracts were H 5,8 million and
H 7,2 million respectively.
The operations of our subsidiaries are generally financed
with debt issued in our subsidiaries’ respective functional
currencies. Thus, we believe we do not have significant
currency exposure related to our borrowings.
Interest Rates
A considerable percentage of our outstanding debt
bears interest which are typically variable in nature.
We are exposed to interest rate risk primarily through
our borrowing activities. We do not enter into
financial instrument transactions for trading or
speculative purposes or to manage interest rate
exposure. Therefore, a 1% adverse change in interest
rates on the portion of our debt bearing interest at
variable rates would result in an annual increase in
interest expense of approximately H 0.8 million at
December 31, 2000 borrowing levels.
Euro
The Netherlands, our country of domicile, is one of
the countries that participates in the use of the Euro,
the new currency unit that has been available since
January 1, 1999. Until 2002, the participating
countries will allow both the Euro and local
currencies as legal tender. Our European operations
will therefore use the Euro as their functional
currency as soon as possible after its introduction. The
actual introduction is not critical for our business but
will depend on availability of reliable software for
accounting, payroll and other internal functions and
will be achieved over a period of time, but before 2002.
The introduction of the Euro will not significantly
affect our currency profile or risk as the Euro has a
fixed exchange rate against the Netherlands guilder.
Effective beginning of fiscal year 1999, we changed
our reporting currency from Netherlands guilders to
Euros. Prior year balances have been restated based
on the fixed exchange rate of H 1.00 to NLG 2.20371.
The comparative balances reported in Euros depict
the same trends as would have been presented if we
had continued to present balances in Netherlands
guilders. Balances for periods prior to January 1, 1999
are not comparable to the balances of other companies
that report in Euros but restated amounts from a
different currency than Netherlands guilders due to
the fixing of the exchange rate between the Euro and
the currencies of participating countries. See Note A
of the Consolidated Financial Statements.
Financial Instruments
SFAS No. 133, “Accounting for Derivative
Instruments and Hedging Activities” (‘SFAS 133’) as
amended by SFAS No. 137, “Accounting for Derivative
Instruments and Hedging Activities - Deferral of the
Effective Date of FASB Statement No. 133”, and
SFAS No. 138, “Accounting for Certain Derivative
Instruments and Certain Hedging Activities”, is
effective for the Company as of January 1, 2001.
SFAS 133 requires that all derivative instruments be
recorded on the balance sheet at fair value. Gains or
losses resulting from changes in the value of
derivatives are accounted for depending on the
intended use of the derivative and whether they
qualify for hedge accounting. The Company believes
that the adoption of SFAS 133, effective January 1,
2001, will not have a significant impact on the results
of operations or financial position.
18

Floating wafer concept of the Levitor.
19

(thousands except share data) EUR)
December 31,
Assets Note 1999) 2000)
Cash and cash equivalents B 14,153) 106,805)
Marketable securities B 5,709) 5)
Accounts receivable (less allowance for doubtful
accounts of H 1,432 and H 8,734) 149,115) 238,620)
Inventories C 107,280) 188,001)
Other current assets 15,844) 23,828)
Total current assets 292,101) 557,259)
Property, plant and equipment, net D 127,176) 152,168)
Goodwill, net E 5,758) 68,513)
Total Assets 425,035) 777,940)
Liabilities and Shareholders’ Equity
Notes payable to banks F 22,667) 13,136)
Accounts payable 108,922) 142,342)
Accrued expenses 48,566) 88,703)
Advance payments from customers 4,595) 13,623)
Deferred revenue -) 14,913)
Income taxes G 3,887) 22,988)
Current portion of long-term debt H 36,944) 31,484)
Subordinated debt I 52,285) -)
Total current liabilities 277,866) 327,189)
Long-term debt H 7,997) 31,660)
Deferred income taxes G 3,490) 838)
Total liabilities 289,353) 359,687)
Minority interest in subsidiary 70,130) 109,931)
Shareholders’ Equity:
Common shares
Authorized 60,000,000 shares, par value NLG .01,
issued and outstanding 40,107,784 and 48,797,346 shares 182) 221)
Financing preferred shares
Authorized 900 shares, par value NLG 100, none issued -) -)
Preferred shares
Authorized 6,900 shares, par value NLG 100, none issued -) -)
Capital in excess of par value 103,443) 252,784)
Retained (deficit) earnings (35,454) 58,818)
Accumulated other comprehensive loss (2,619) (3,501)
Total Shareholders’ Equity J 65,552) 308,322)
Total Liabilities and Shareholders’ Equity 425,035) 777,940)
See Notes to Consolidated Financial Statements.
Consolidated Balance Sheets
20

(thousands except per share data) EUR)
Year ended December 31,
Note 1998) 1999) 2000)
Net sales Q 288,111) 414,495) 935,212)
Cost of sales (179,326) (244,485) (518,027)
Gross profit 108,785) 170,010) 417,185)
Operating expenses:
Selling, general and administrative costs (59,924) (83,170) (147,318)
Research and development, net M (36,277) (47,145) (73,800)
Amortization of goodwill E (93) (340) (4,295)
Total operating expenses (96,294) (130,655) (225,413)
Earnings from operations Q 12,491) 39,355) 191,772)
Net interest and other financial income (expenses) (5,350) (8,608) (1,595)
Earnings before income taxes, minority interest and
cumulative effect of change in accounting principle 7,141) 30,747) 190,177)
Income taxes G (648) (1,274) (22,830)
Earnings before income taxes, minority interest and
cumulative effect of change in accounting principle 6,493) 29,473) 167,347)
Minority interest (6,261) (18,374) (69,285)
Net earnings before cumulative effect of change in
accounting principle Q 232) 11,099) 98,062)
Cumulative effect of change in accounting principle, net of tax A -) -) (3,790)
Net earnings 232) 11,099) 94,272)
Basic net earnings per share:
Net earnings before cumulative effect of change in
accounting principle 0.01) 0.30) 2.09)
Cumulative effect of change in accounting principle A -) -) (0.08)
Net earnings 0.01) 0.30) 2.01)
Diluted net earnings per share:
Net earnings before cumulative effect of change in
accounting principle 0.01) 0.29) 2.02)
Cumulative effect of change in accounting principle A -) -) (0.08)
Net earnings 0.01) 0.29) 1.94)
Proforma amounts assuming the new accounting principle
is applied retroactively: A
Net earnings 585) 8,881) 98,062)
Basic net earnings per share 0.02) 0.24) 2.09)
Diluted net earnings per share 0.02) 0.23) 2.02)
Weighted average number of shares:
Basic S 33,794) 37,301) 46,810)
Diluted S 34,743) 40,664) 48,703)
See Notes to Consolidated Financial Statements.
Balances prior to January 1, 1999 were restated from Netherlands guilders into Euros using the fixed exchange rate as of January 1, 1999 (EUR 1.00 = NLG 2.20371).
Consolidated Statements of Operations
21

(thousands, except for number of common shares) EUR)
Accumulated) Total)
Number of ) Capital in) Retained) other com-) Share-)
common) Common) excess of ) earnings) prehensive) holders’)
Note shares) shares) par value) (deficit) income (loss)) Equity)
Balance December 31, 1997 33,379,043) 151) 74,858) (46,785) (12,204) 16,020)
Issuance of common shares:
For stock options P 961,800) 5) 436) -) -) 441)
Other 200,000) 1) 702) -) -) 703)
Net earnings -) -) -) 232) -) 232)
Fair value of warrants issued -) -) 2,455) -) -) 2,455)
Debt conversion discount -) -) 476) -) -) 476)
Exchange rate changes for the year -) -) -) -) 137) 137)
Balance December 31, 1998 34,540,843) 157) 78,927) (46,553) (12,067) 20,464)
Issuance of common shares:
For stock options P 169,900) 1) 495) -) -) 496)
Conversion of subordinated notes 5,397,041) 24) 24,021) -) -) 24,045)
Net earnings -) -) -) 11,099) -) 11,099)
Exchange rate changes for the year -) -) -) -) 9,448) 9,448)
Balance December 31, 1999 40,107,784) 182) 103,443) (35,454) (2,619) 65,552)
Issuance of common shares:
For stock options P 901,605) 4) 3,123) -) -) 3,127)
Exercise of warrants J 3,537,957) 16) 27,514) -) -) 27,530)
Public offering J 4,250,000) 19) 119,692) -) -) 119,711)
Net earnings -) -) -) 94,272) -) 94,272)
Fair value of put option for structured
equity line -) -) (988) -) -) (988)
Exchange rate changes for the year -) -) -) -) (882) (882)
Balance December 31, 2000 48,797,346) 221) 252,784) 58,818) (3,501) 308,322)
See Notes to Consolidated Financial Statements.
Balances prior to January 1, 1999 were restated from Netherlands guilders into Euros using the fixed exchange rate as of January 1, 1999 (EUR 1.00 = NLG 2.20371).
Consolidated Statements of Comprehensive Income
(thousands) EUR)
Year ended December 31,)
1998) 1999) 2000)
Net earnings 232) 11,099) 94,272)
Other comprehensive income (loss)
Exchange rate changes for the year 137) 9,448) (882)
Total other comprehensive income (loss) 137) 9,448) (882)
Comprehensive income 369) 20,547) 93,390)
See Notes to Consolidated Financial Statements.
Balances prior to January 1, 1999 were restated from Netherlands guilders into Euros using the fixed exchange rate as of January 1, 1999 (EUR 1.00 = NLG 2.20371).
Consolidated Statements of Shareholders’ Equity
22

(thousands) EUR)
Year ended December 31,)
1998) 1999) 2000)
Cash flows from operating activities:
Net earnings 232) 11,099) 94,272)
Adjustments to reconcile net earnings to net
cash from operating activities:
Depreciation and amortization 22,688) 24,487) 52,223)
Amortization of discounted financing costs -) 1,421) 1,575)
Cumulative effect of change in accounting principle, net of tax -) -) 3,790)
Deferred income taxes (56) (123) (2,652)
Minority interest 6,261) 18,374) 69,285)
Increase (decrease) in allowance for doubtful receivables (1,492) (407) 7,302)
Changes in other assets and liabilities:
Accounts receivable 12,831) (64,514) (96,807)
Inventories 14,230) (42,644) (73,462)
Other current assets 850) (7,091) (7,984)
Accounts payable and accrued expenses (25,002) 102,928) 74,757)
Advance payments from customers (2,573) 1,468) 9,028)
Deferred revenue -) -) 2,664)
Income taxes (1,935) 1,904) 19,101)
Net cash provided by operating activities 26,034) 46,902) 153,092)
Cash flows from investing activities:
Capital expenditures (24,142) (30,587) (71,366)
Acquisition of shares from minority shareholders -) -) (75,461)
Acquisition of business -) (1,267) (96)
Proceeds from sale of property, plant and equipment 2,448) 2,453) 4,332)
Proceeds from (purchase of ) marketable securities (1,538) 2,607) 6,214)
Net cash (used in) investing activities (23,232) (26,794) (136,377)
Cash flows from financing activities:
Notes payable to banks, net (8,567) (15,372) (9,531)
Proceeds from long-term debt and subordinated debt 27,574) 16,652) 78,466)
Repayments of long-term debt and subordinated debt (29,730) (19,690) (96,202)
Proceeds from issuance of common shares 1,144) 496) 126,813)
Fair value of put option for structured equity line -) -) (988)
Dividends paid to minority shareholders (5,526) (8,384) (28,249)
Net cash (used in) provided by financing activities (15,105) (26,298) 70,309)
Exchange rate effects (3,418) 8,619) 5,628)
Net increase (decrease) in cash and cash equivalents (15,721) 2,429) 92,652)
Cash and cash equivalents at beginning of year 27,445) 11,724) 14,153)
Cash and cash equivalents at end of year 11,724) 14,153) 106,805)
Supplemental disclosures of cash flow information
Cash paid (received) during the year for:
Interest 7,232) 7,916) 2,257)
Income taxes 2,638) (505) 6,381)
Non cash investing activities:
Acquisition of business through issuance of convertible note -) (3,868) -)
Non cash financing activities:
Conversion of subordinated notes and 6% zero-coupon
debentures into common shares -) 24,045) 23,555)
See Notes to Consolidated Financial Statements.
Balances prior to January 1, 1999 were restated from Netherlands guilders into Euros using the fixed exchange rate as of January 1, 1999 (EUR 1.00 = NLG 2.20371).
Consolidated Statements of Cash Flows
23
Notes to Consolidated Financial Statements(EUR in thousands, unless otherwise stated)
General - ASM International N.V. (‘ASMI’ or ‘the Company’)
is a corporation domiciled in the Netherlands with principal
operations in Europe, the United States, South East Asia and
Japan. The Company dedicates its resources to the research,
development, manufacturing, marketing and servicing of
equipment and materials used to produce semiconductor devices.
ASMI provides production solutions for the main areas of
semiconductor production: wafer processing (Front-end),
assembly and packaging (Back-end). The Company follows
accounting principles generally accepted in the United States of
America. Effective beginning of the year ended December 31,
1999, the Company changed its reporting currency from
Netherlands guilders (NLG) to Euros (EUR or H). Balances
for the year ended December 31, 1998 have been restated
using the fixed exchange rate as of January 1, 1999
(EUR 1.00 = NLG 2.20371).
The comparative balances reported in Euros depict the same
trends as would have been presented if the Company had
continued to present balances in Netherlands guilders. Balances
for periods prior to January 1, 1999 are not comparable to the
balances of other companies that report in Euros having restated
amounts from a different currency than Netherlands guilders.
Principles of Consolidation - The Consolidated Financial
Statements include the accounts of ASMI and its subsidiaries
(‘the Company’), in all of which ASMI holds a controlling
interest. The minority interest of third parties is disclosed
separately in the Financial Statements. All intercompany profits,
transactions and balances have been eliminated in consolidation.
Intercompany profits included in inventory are recognized in the
Statement of Operations upon the sale of the respective inventory.
Foreign Currency Translation - Assets and liabilities of foreign
subsidiaries are translated into Euros at exchange rates prevailing
at the end of the year. Revenues and costs relating to the
operation of such subsidiaries are translated at average exchange
rates during the period. Resulting translation adjustments are
directly recorded in Shareholders’ Equity. Foreign currency
transaction gains and losses generally are included in determining
net earnings. From time to time the Company enters into foreign
currency exchange contracts as a hedge against transactions
denominated in foreign currencies. Gains and losses in market
value of such contracts are recognized as an offset against
foreign exchange gains or losses on the underlying transactions.
A change in the market value of a foreign exchange contract
that is a hedge of a firm commitment is deferred and included
in the valuation of the completed transaction.
Revenue Recognition - Effective January 1, 2000 the Company
adopted new guidance on revenue recognition as is described
in Staff Accounting Bulletin No. 101 “Revenue Recognition
in Financial Statements” (“SAB 101”), issued by the staff of
the Securities and Exchange Commission (the “SEC”) in
December 1999.
Net revenues include product revenues derived primarily from
sales of Front-end and Back-end equipment used by both
segments of the semiconductor market. The Company
recognizes revenue from equipment sales upon shipment of its
products when it is proven prior to shipment that the
equipment has met all of the customers’ criteria and
specifications. The installation process is not believed to be
essential to the functionality of the Company’s products.
However, since under most of the Company’s sales contracts,
the timing of payment of a portion of the sales price is coincident
with installation, such installation is not considered to be
inconsequential or perfunctory under the guidance of SAB 101.
Therefore, at the time of shipment, the Company defers that
portion of the sales price related to the fair value of installation
at the time of shipment. The Company believes it has an
enforceable claim for that portion of the sales price not related
to the fair value of the installation should it not fulfill its
installation obligation. The fair value of the installation process
is measured based upon the per-hour amounts charged by third
parties for similar installation services. When the Company can
only satisfy the customer acceptance criteria or specifications
at the customer’s location, revenue is deferred until final
acceptance by the customer or until contractual conditions lapse.
The Company provides training and technical support to
customers. Revenue related to such services are recognized
when the service is completed. Revenue from the sale of spare
parts and materials is recognized when the goods are shipped.
The Company previously recognized revenue from the sale of
all equipment sales including installation services at the time
of transfer of title, and when no significant contractual
obligations remained. Revenue recognition for sale of spare
parts and services has not been changed.
Cash and Cash Equivalents - Cash and cash equivalents
include cash on hand, amounts due from banks on demand,
and short-term deposits with a maturity of three months or
less at the date of purchase.
Marketable Securities - The Company classifies all its
investments in marketable securities as available for sale which
requires the Company to report these investments at fair market
value and record the unrealised gains and losses, after tax, as a
component of Shareholders’ Equity. In the accompanying
Financial Statements the marketable securities are carried at
cost which approximates fair market value. Realized gains and
losses on securities sold are included in net earnings.
Inventories - Inventories are stated at the lower of cost (first-
in, first-out method) or market. Costs include net prices paid
for materials purchased, charges for freight and custom duties,
direct wages of employees and charges for factory production
overhead.
NOTE A Summary of Significant Accounting Policies
24

Property, Plant and Equipment - Property, plant and equipment
are carried at cost (net of government grants), less accumulated
depreciation. Capital leased assets are recorded at the present
value of future lease obligations. Depreciation is calculated
using the straight-line method over the estimated useful lives.
Goodwill - Goodwill represents the excess of the cost of
businesses acquired over the fair market value of identifiable
net assets at the dates of acquisition. Goodwill arising on
acquisitions is amortized on a straight-line basis over the
estimated useful life thereof. The Company reviews goodwill
for impairment whenever facts or circumstances indicate that
the carrying amounts may not be recoverable.
Recoverability of Long-Lived Assets - In accordance with
Statement of Financial Accounting Standard (‘SFAS’) No. 121,
“Accounting for the Impairment of Long-Lived Assets and
Long-Lived Assets to be Disposed Of ”, long-lived assets and
certain identifiable intangibles held and used by a company
are required to be reviewed for impairment whenever events
or changes in circumstances indicate that the carrying amount
of an asset may not be recoverable. In performing the review
for recoverability, the Company estimates the future cash flows
expected to result from the use of the asset and its eventual
disposition. If the undiscounted future cash flow is less than
the carrying amount of the asset, the asset is deemed impaired.
The amount of the impairment is measured as the difference
between the carrying value and the fair value of the asset.
Generally, long-lived assets and certain identifiable intangibles
to be disposed of are reported at the lower of carrying amount
or fair value less cost to sell.
Income Taxes - The Company accounts for income taxes under
the provisions of SFAS No. 109, “Accounting for Income
Taxes” (‘SFAS 109’). SFAS 109 requires recognition of
deferred tax assets and liabilities for the estimated future tax
consequences of events attributable to differences between the
financial statement carrying amounts of existing assets and
liabilities and their respective tax bases and operating loss and
tax credit carryforwards. Deferred tax assets and liabilities are
measured using enacted rates in effect for the year in which
the differences are expected to be recovered or settled. The
effect on deferred tax assets and liabilities of changes in tax
rates is recognized in the Statement of Operations in the
period in which the enactment date changes. Deferred tax
assets and liabilities are reduced through the establishment of
a valuation allowance at such time as, based on available
evidence, it is more likely than not that the deferred tax assets
will not be realized.
Stock-Based Compensation - The Company accounts for its
stock option and stock-based compensation plans using the
intrinsic-value method prescribed in Accounting Principles
Board Opinion No. 25, “Accounting for Stock Issued to
Employees” (‘APB 25’). Accordingly, the Company computes
compensation costs for each employee stock option granted as
the amount by which the estimated fair value of the Company’s
common shares on the date of the grant exceeds the amount
the employee must pay to acquire the shares. As required by
SFAS No. 123, “Accounting for Stock-Based Compensation”
(‘SFAS 123’), the Company has included, in Note P, the
required SFAS 123 proforma disclosures of net income (loss)
and earnings (loss) per share as if the fair value-based method
of accounting had been applied.
Research and Development Expenses - Research and
development costs are expensed as incurred. Costs which
relate to prototype and experimental models which are sold to
customers are charged to cost of sales. Subsidies and other
governmental credits to cover research and development costs
relating to approved projects are recorded as research and
development credits in the period when such project costs
occur. Technical development credits (Technische
Ontwikkelings Kredieten or ‘TOK’s’) received from the
Netherlands government to offset the cost of certain research
and development projects are contingently repayable to the
extent sales of equipment developed in such projects occur.
Such repayments are calculated as a percentage of sales and
are charged to cost of sales. No such repayments are required
if such sales do not occur (see Note M).
Comprehensive Income - Effective fiscal year 1998, the Company
adopted Statement of Financial Accounting Standards No. 130
(FASB 130), ‘Reporting Comprehensive Income’
New Accounting Pronouncements - SFAS No. 133, “Accounting
for Derivative Instruments and Hedging Activities” (‘SFAS 133’)
as amended by SFAS No. 137, “Accounting for Derivative
Instruments and Hedging Activities - Deferral of the Effective
Date of FASB Statement No. 133”, and SFAS No. 138,
“Accounting for Certain Derivative Instruments and Certain
Hedging Activities”, is effective for the Company as of
January 1, 2001. SFAS 133 requires that all derivative
instruments be recorded on the balance sheet at fair value.
Gains or losses resulting from changes in the value of
derivatives are accounted for depending on the intended use
of the derivative and whether they qualify for hedge
accounting. The Company believes that the adoption of
SFAS 133, effective January 1, 2001, will not have a significant
impact on the results of operations or financial position.
Use of Estimates - The preparation of the Company’s
consolidated financial statements in conformity with generally
accepted accounting principles necessarily requires Management
to make estimates and assumptions that affect the reported
amounts of assets and liabilities and disclosure of contingent
assets and liabilities at the balance sheet dates and the reported
amounts of revenue and expense during the reported periods.
Actual results could differ from those estimates.
Reclassifications - Certain reclassifications have been made to
prior year Financial Statements to conform to the current year
presentation.
�
25
Land,) Machinery,)
buildings and) equipment,)
leasehold) furniture)
improvements) and fixtures) Total)
At cost:
Balance January 1, 2000 74,389) 201,730) 276,119)
Capital expenditures 5,847) 65,519) 71,366)
Retirements and sales (3,463) (35,857) (39,320)
Translation effect 6,439) 6,284) 12,723)
Balance December 31, 2000 83,212) 237,676) 320,888)
Accumulated depreciation:
Balance January 1, 2000 30,729) 118,214) 148,943)
Depreciation for the year 9,525) 38,403) 47,928)
Retirements and sales (1,885) (33,103) (34,988)
Translation effect 2,317) 4,520) 6,837)
Balance December 31, 2000 40,686) 128,034) 168,720)
Property, plant and equipment, net:
January 1, 2000 43,660) 83,516) 127,176)
December 31, 2000 42,526) 109,642) 152,168)
Useful lives in years: - Buildings and leasehold improvements 10 -25 year
- Machinery and equipment 2 - 10 year
- Furniture and fixtures 2 - 10 year
Leasehold improvements are depreciated over the lesser of the useful life of the underlying property and the lease term.
At December 31, 2000, cash and cash equivalents and
marketable securities of the Company’s subsidiary ASMPacific Technology Ltd (‘ASMPT’) amounting to H 89,708
are restricted to use in the operations of this company only.
Inventories are comprised of the following:
December 31,
1999) 2000)
Components and raw materials 41,052) 68,786)
Work in process 50,612) 104,875)
Finished goods 15,616) 14,340)
Inventories 107,280) 188,001)
Notes to Consolidated Financial Statements (continued)(EUR in thousands, unless otherwise stated)
NOTE B
NOTE C
NOTE D
Cash and Cash Equivalents, Marketable Securities
Inventories
Property, Plant and Equipment
Cumulative Effect of Change in Accounting Principle - As more
fully described under Revenue Recognition, the Company
adopted the guidance outlined in SAB 101. The new method
of revenue recognition was adopted January 1, 2000 and has
been applied retroactively to revenue earned in prior years.
The effect of the change in 2000 was to decrease net earnings
by H 1,710 (or H 0.04 per basic and diluted earnings per share).
The adjustment of H 3,790 to apply retroactively the new method
is included in the Statement of Operations for the year ended
December 31, 2000. The proforma amounts shown on the
income statement have been adjusted for the effect of retroactive
application on revenues and costs and related income taxes.
26

ASMI and its individual subsidiaries borrow under separate
short-term lines of credit with banks in the countries where
they are located. The lines, which contain general provisions
concerning renewal and continuance at the option of the
banks, bear a weighted average interest of 4.65% at
December 31, 2000.
Total short-term lines of credit available amounted to
H 81,685 at December 31, 2000. The amount outstanding at
December 31, 2000 was H 13,136 and the unused portion
totalled H 68,549. The unused portion includes H 48,794
relating to ASMPT and such amount is authorized solely for
use in the operations of ASMPT. At December 31, 2000
ASMI has guaranteed available short-term facilities and other
obligations of certain subsidiaries of H 32,887. The Company
does not provide guarantees for borrowings of ASMPT and
there are no guarantees from ASMPT to secure indebtedness
of the Company. Under the rules of the Stock Exchange of
Hong Kong, ASMPT is precluded from providing loans and
advances other than trade receivables in the normal course of
business, to other ASM subsidiaries.
Following the issuance of common shares under the ASMPT
Employee Incentive Scheme in March 2000, the Company’s
shareholding in ASMPT dropped slightly below 50%. In
various transactions in April and June, the Company acquired
0.3% of the outstanding common shares of ASMPT, thereby
restoring its total shareholding in that company to over 50 %.
Throughout this entire period, the Company maintained
control over ASMPT.
On July 6, 2000, the Company completed a purchase of
approximately 4.7% of the outstanding common shares in
ASMPT from one institutional investor. At December 31,
2000, ASMI’s shareholding in ASMPT amounts to 54.62%
of the outstanding common shares.
The total purchase price of the acquired shares of ASMPT
in 2000 amounted to H 74,757. The acquisition of these
shares was accounted for using the purchase method and the
excess of the purchase price over the fair market value of the
underlying net assets acquired in the amount of H 64,985 has
been recorded as goodwill. The fair market value approximates
the bookvalue of such net assets of ASMPT. The proforma
impact on minority interest in the Statement of Operations
based on the assumption that the Company acquired the
total additional 5% interest in ASMPT as of January 1, 2000
and 1999 is H 3,182 and H 1,964, respectively.
In July 1999, the Company acquired all the outstanding shares
of Microchemistry Ltd. The acquisition was accounted for using
the purchase method. Total consideration paid amounted to
FIM (Finnish Marks) 23.2 million or H 3,868 and after adding
the assets deficiency recorded goodwill totalled H 4,747.
In December 1999, the Company acquired a 24% interest in
NanoPhotonics AG, a German supplier of precision thin film
metrology equipment, for H 388. An officer of the Company
also holds a 44.5% interest in NanoPhotonics AG. The
Company has the option to purchase the 44.5% interest from
the officer at the same price as paid by the officer at the time
of purchase in December 1999. In exchange for this option,
the Company granted the officer a five-year option to
purchase 25,000 common shares in ASMI at the fair market
value of the shares at the option grant date.
The weighted average amortization period for acquired goodwill
is 10 years.
NOTE E
NOTE F
Goodwill
Notes Payable to Banks
At cost:
Balance January 1, 2000 6,202)
Acquired 65,081)
Translation effect 1,786)
Balance December 31, 2000 73,069)
Accumulated amortization:
Balance January 1, 2000 444)
Amortization for the year 4,295)
Translation effect (183)
Balance December 31, 2000 4,556)
Goodwill, net:
January 1, 2000 5,758)
December 31, 2000 68,513)
�
27
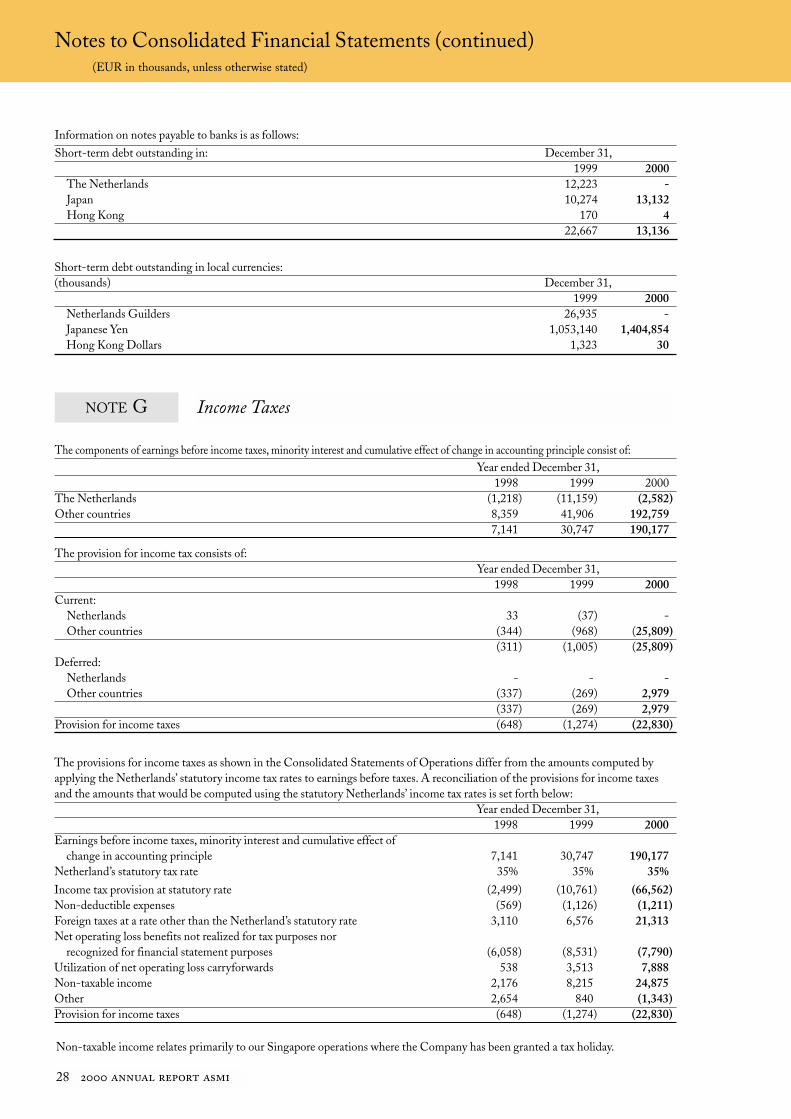
The components of earnings before income taxes, minority interest and cumulative effect of change in accounting principle consist of:
Year ended December 31,
1998) 1999) 2000)
The Netherlands (1,218) (11,159) (2,582)
Other countries 8,359) 41,906) 192,759)
7,141) 30,747) 190,177)
The provision for income tax consists of:
Year ended December 31,
1998) 1999) 2000)
Current:
Netherlands 33) (37) -)
Other countries (344) (968) (25,809)
(311) (1,005) (25,809)
Deferred:
Netherlands -) -) -)
Other countries (337) (269) 2,979)
(337) (269) 2,979)
Provision for income taxes (648) (1,274) (22,830)
The provisions for income taxes as shown in the Consolidated Statements of Operations differ from the amounts computed by
applying the Netherlands’ statutory income tax rates to earnings before taxes. A reconciliation of the provisions for income taxes
and the amounts that would be computed using the statutory Netherlands’ income tax rates is set forth below:
Year ended December 31,
1998) 1999) 2000)
Earnings before income taxes, minority interest and cumulative effect of
change in accounting principle 7,141) 30,747) 190,177)
Netherland’s statutory tax rate 35%) 35%) 35%)
Income tax provision at statutory rate (2,499) (10,761) (66,562)
Non-deductible expenses (569) (1,126) (1,211)
Foreign taxes at a rate other than the Netherland’s statutory rate 3,110) 6,576) 21,313)
Net operating loss benefits not realized for tax purposes nor
recognized for financial statement purposes (6,058) (8,531) (7,790)
Utilization of net operating loss carryforwards 538) 3,513) 7,888)
Non-taxable income 2,176) 8,215) 24,875)
Other 2,654) 840) (1,343)
Provision for income taxes (648) (1,274) (22,830)
Short-term debt outstanding in local currencies:
(thousands) December 31,
1999 2000
Netherlands Guilders 26,935 -
Japanese Yen 1,053,140 1,404,854
Hong Kong Dollars 1,323 30
NOTE G Income Taxes
Notes to Consolidated Financial Statements (continued)(EUR in thousands, unless otherwise stated)
Information on notes payable to banks is as follows:
Short-term debt outstanding in: December 31,
1999 2000
The Netherlands 12,223 -
Japan 10,274 13,132
Hong Kong 170 4
22,667 13,136
Non-taxable income relates primarily to our Singapore operations where the Company has been granted a tax holiday.
28

Long-term debt outstanding in local currencies:
(thousands) December 31,1999 2000
Including current portion:
Netherlands Guilders 59,674 4,128
Finnish Marks 15,135 20,119
United States Dollars 311 46,328
Japanese Yen 413,270 847,990
Hong Kong Dollars 85,521 -
Substantially all of the net deferred tax liabilities are of a
long- term nature.
Based on tax filings, ASMI and its individual subsidiaries have
net operating losses available at December 31, 2000, of H 260
million for tax return purposes to reduce future income taxes.
ASMI believes that realization of its net deferred tax assets is
dependent on the ability of ASMI to generate taxable profits
in the future. Given the volatile nature of the semiconductor
equipment industry, past experience, and the tax jurisdictions
where ASMI has net operating loss carryforwards ASMI
believes that there is currently insufficient evidence to
substantiate recognition of all net deferred tax assets with
respect to net operating loss carryforwards in the financial
statements. Accordingly, a valuation reserve of H 79.9 million
in 1998, H 90.2 million in 1999 and H 86.2 million in 2000 has
been recorded; the resulting deferred tax asset amounts to H
5.9 million at the end of 1998,H 5.9 million at the end of 1999
and H 5.3 million at the end of 2000.
The Company has not provided for deferred foreign
withholding taxes, if any, on undistributed earnings of its
foreign subsidiaries, because it considers such earnings to be
indefinitely invested in those subsidiaries.
Deferred income tax consist of the following:
Year ended December 31,
1998) 1999) 2000)
Depreciation (5,257) (5,274) (5,523)
Reserves and allowances 64) 51) 2,053)
Research and development credits (4,223) (4,152) (4,215)
Net operating loss carryforwards 5,873) 5,909) 5,276)
Other (70) (24) 1,571)
Total deferred income tax (3,613) (3,490) (838)
Long-term debt consists of the following:
December 31,
1999 2000
Term loans:
The Netherlands, 5.16 - 6.75%, due 2000 24,958 -
The Netherlands, US $ facility, 8.65%, due 2001-2002 - 49,607
Japan, 2.15 - 3.30%, due 2005 - 2006 800 3,459
Hong Kong, 7.3 - 7.5% due 2000 10,975 -
Finland, 2.25 - 4.25%, due 2004 - 2005 2,545 3,383
Mortgage loans:
The Netherlands, 5.35 - 6.75%, due 2007 - 2026 2,121 1,873
Japan, 1.71 - 2.75%, due 2005 - 2006 3,232 4,468
Lease commitments, 5.75 - 12.60%, due 1999 - 2002 310 354
44,941 63,144
Current portion 36,944 31,484
7,997 31,660
NOTE H Long-term Debt
�
29

Aggregate annual principal repayments for years
subsequent to December 31, 2000 are:
2001 31,484
2002 21,494
2003 1,902
2004 2,210
2005 3,479
Thereafter 2,575
63,144
In April 2000 the Company repaid its term loan of H 24,958
to the Nationale Investeringsbank N.V. (NIB) in full and
repaid its term loans in Hong Kong during 2000.
On July 6, 2000, the Company entered into two financing
arrangements. Pursuant to the first such financing arrangement,
the Company received a two-year credit facility of US $ 75
million from Canadian Imperial Bank of Commerce, a bank
organized and validly existing under the laws of Canada, acting
through its New York Agency, carrying a variable interest rate
linked to London Inter Bank Offered Rates and secured by
substantially all of the Company’s shareholding in ASMPT.
US $ 69 million of this facility was drawn down and the
funds were used to purchase additional shares in ASMPT
(see Note E). The facility has a quarterly repayment schedule.
On October 6, 2000 the Company repaid US $ 10 million in
principle amount under the loan facility consisting of US $ 5.5
million installment and US $ 4.5 million partial prepayment.
On December 21, 2000 a second partial prepayment of US $ 13
million was made. The outstanding balance as of December
31, 2000 is US $ 46 million. The loan is secured by our
shareholding in ASMPT.
Pursuant to the second facility, the Company entered into a
Structured Equity Line (the “Line”) with an investor, who is
an affiliate of the bank providing the credit facility, mentioned
immediately above. Under the Line, the Company can issue,
with intervals of at least five business days between two
issuances, common shares to the investor in amounts not
exceeding US $ 10 million and for a total not exceeding
US $ 140 million. This maximum amount of shares to be
issued has been lovered to US $ 65 million by an amendment
to the line as of March 9, 2001 The investor has committed
to purchase these shares at market price, which is defined as
the volume weighted average price of five trading days
preceding the date of issuance, minus a discount of 4.5%. The
investor is not obligated to purchase shares if the purchase
would cause the aggregate number of common shares in the
Company owned by the investor, including those purchased
during the previous 60 days, to exceed 9.9% of all of the
issued and outstanding common shares of the Company. The
investor is also under no obligation to purchase newly issued
shares under the Line in the event that the effectiveness of
the Company’s registration statement is withdrawn, certain
conditions precedent to the Line are not satisfied or certain
covenants are not complied with. The Company is obligated
to register their shares issuable under the Line with the
Securities and Exchange Commission.
The Company filed a registration statement on September 6,
2000, but, addressing concerns of the SEC, voluntarily
withdrew this statement on October 12, 2000. A new
registration statement will be filed in due course. Until the
registration statement is filed and declared effective by the
SEC, the Company is unable to issue shares under this equity
line of credit. The investor has agreed to extend the date by
which such registration must be effective until April 23, 2001.
We must pay to the investor a monthly fee of 3/4 % of the
outstanding loan amount if the registration statement is not
effective by April 23, 2001, which fee increases to 1% per
month if effectiveness is not achieved by June 8, 2001.
In the event of a collateral value shortfall under the Line, the
Company is obligated to either deposit cash with the investor,
make prepayments to the Line or issue shares to the
investor to the extent of the collateral value shortfall.
The long-term facilities offered by the Japanese banks to
ASM Japan are collaterized by the real estate and other assets
of ASM Japan, with guarantees provided by ASMI. In
Finland, the long-term loans offered by Leonia Bank are
collaterized by machinery and equipment of ASM
Microchemistry and guaranteed by ASMI.
Lease commitments relate to lease commitments on
property, equipment and machines in the United States of
America.
Interest income, which is included in net interest and other
financial income (expenses), amounted to H 1,569, H 913 and
H 6,695 in 1998, 1999 and 2000, respectively, and interest
expense, which is also included in net interest and other
financial income (expenses), amounted to H 7,566, H 13,210
and H 10,232 in 1998, 1999 and 2000, respectively.
Notes to Consolidated Financial Statements (continued)(EUR in thousands, unless otherwise stated)
30

Subordinated debt consists of the following:
December 31,
1999 2000
Current:
subordinated loan-NIB 2,042 -
subordinated loan-related party 1,361 -
subordinated note-Applied Materials 33,744 -
6 % zero-coupon debentures, (less unamortized discount of H 4,817 and -) 15,138 -
52,285 -
In 2000 the Company paid the last installments of
subordinated loans from De Nationale Investeringsbank N.V.
(NIB) and an officer of ASMI who is also a major shareholder.
During 1998, the Company negotiated an extension of an
original US $ 80.0 million convertible note provided by
Applied Materials following the settlement of the patent
dispute in 1997. After paying Applied Materials US $ 15.0
million in 1997 and US $ 20.0 million in 1998, the remaining
balance of US $ 45.0 million of the initial interest-free
subordinated convertible loan was replaced by an interest-
bearing note for which the Company provided security. In
addition, the Company issued a warrant to Applied Materials
to purchase 1,500,000 shares in ASMI, of which 750,000 were
immediately exercisable. See Note J to Consolidated Financial
Statements. The note was repayable in two installments: US $
10.0 million was paid in 1999 and the remaining US $ 35.0
million due in 2000 was repaid from the proceeds of the
exercise of the 1,500,000 warrants in March 2000 and from
the proceeds of the share offering in April 2000.
On October 1, 1999, the Company issued US $ 20 million,
five-year, zero-coupon debentures. The debentures were
discounted at 6% annual interest; the Company received net
proceeds of US $ 14.9 million. As part of the debenture
agreement, the investors received 2,037,957 non-detachable
warrants and 200,000 supplemental warrants on common
shares of the Company with an exercise price of US $ 9.81
per share, a premium to market at the date of issuance of 20%.
In February 2000, the 2,037,957 warrants were exercised and
the debentures were cancelled in partial payment of the exercise
price of the warrants. The remaining portion of the exercise
price of the warrants was fulfilled by the investors contributing
US $ 4.8 million in cash.
In December 1998, the Company issued a H 20,420 (NLG
45 million), 6% subordinated convertible note, due December 4,
2003, which has been purchased by strategic and financial
investors. The conversion price had been set at H 4.08 per
common share, the average of the share price on the Euronext
Amsterdam during a set period previous to concluding the
contract, with protection clauses for below market price stock
issues and stock dividends. The note was fully converted in 1999.
The authorized capital of the Company amounts to
NLG 1,380,000. It is divided into 60,000,000 common sha-
res, each with a par value of NLG 0.01, 900 financing prefer-
red shares, each with a par value of NLG 100, and 6,900 pre-
ferred shares, each with a nominal value of NLG 100.
Shareholders are entitled to cast a number of votes equal to
the par value of shares held; consequently, each holder of a
common share (par value of NLG 0.01) is entitled to a single
vote while each holder of preferred shares and financing
preferred shares is entitled to ten thousand votes (par value of
NLG 100).
Preferred shares carry the right to a cumulative dividend
based on a promissory discount rate as established by the
Dutch Central Bank. Financing preferred shares are also
entitled to a cumulative dividend based on the par value and
share premium paid on such shares. Dividends distributable
to common shareholders are limited to retained earnings of
ASMI decreased by the legal reserves which must be
maintained. At December 31, 2000, ASMI had no
distributable retained earnings.
NOTE I Subordinated Debt
NOTE J Shareholders’ Equity
�
31
The Company has retirement plans covering substantially all
employees. The principal plans are defined contribution plans,
except that of the Company’s Japanese operations, which is a
defined benefit pension plan.The Company has no major
continuing obligations other than the payment of annual
contributions. Aggregate retirement plan contributions
including those for the Japanese operations, which are
determined by an actuary were H 3,117 in 1998, H 3,225 in
1999 and H 5,756 in 2000.
Employees of the Company’s Japanese operations terminating
their employment are generally entitled to a lump-sum
severance payment or to pension plan benefits based on years
of service and certain other factors. Plan assets are held as
general assets by a life insurance company. There are no
unrecognized prior service costs.
The Company does not provide any post retirement benefits
other than pensions.
Warrants
In December 1998, in conjunction with the restructuring of a
subordinated convertible note with Applied Materials, Inc.,
the Company issued to Applied Materials warrants to purchase
1,500,000 of ASMI’s common shares, of which 750,000 were
immediately exercisable at a price of US $ 5.375 per share.
Exercise of the remaining 750,000 warrants was contingent
upon the Company not repaying all outstanding debt due to
Applied Materials by February 15, 1999. At December 31, 1998
it was determined that the Company would be unable to repay
the outstanding debt by February 15, 1999 and, therefore, the
entire fair value of the warrants amounting to H 2.5 million has
been added to Shareholders’ Equity in 1998. In March 2000,
Applied Materials exercised the warrants and the proceeds
therefrom were used to reduce the outstanding balance of the
subordinated note.
In conjunction with a US $ 20 million five-year zero-bond
debentures issued on October 1, 1999 (see Note I to
Consolidated Financial Statements), the Company issued
2,037,957 non-detachable exercise warrants and 200,000
supplemental warrants on common shares of the Company at
a price of US $ 9.81 per share, a premium to market at the
date of issuance of 20%. In February 2000 the 2,037,957
warrants were exercised and the debentures were cancelled in
partial payment of the exercise price of the warrants. The
remaining portion of the exercise price was fulfilled by the
investors contributing US $ 4.8 million in cash. At
December 31, 2000 the 200,000 supplemental warrants have
not been exercised.
Public Offering of Common Shares
In April 2000, the Company completed a public offering of
4,250,000 common shares at a price of US $ 29.00 per share.
The net proceeds amounted to H 119,711, which were used
to repay outstanding loans and fund working capital needs.
NOTE K Pension Plans
Notes to Consolidated Financial Statements (continued)(EUR in thousands, unless otherwise stated)
32
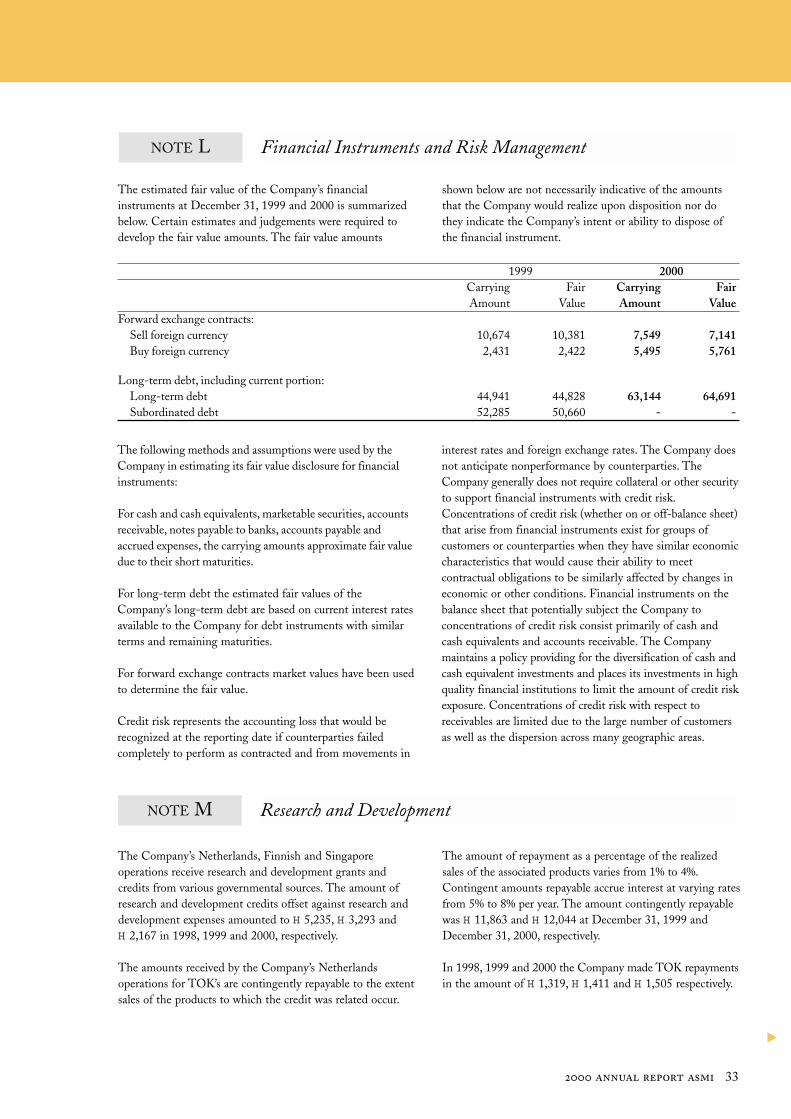
The estimated fair value of the Company’s financial
instruments at December 31, 1999 and 2000 is summarized
below. Certain estimates and judgements were required to
develop the fair value amounts. The fair value amounts
shown below are not necessarily indicative of the amounts
that the Company would realize upon disposition nor do
they indicate the Company’s intent or ability to dispose of
the financial instrument.
1999 2000
Carrying Fair Carrying Fair
Amount Value Amount Value
Forward exchange contracts:
Sell foreign currency 10,674 10,381 7,549 7,141
Buy foreign currency 2,431 2,422 5,495 5,761
Long-term debt, including current portion:
Long-term debt 44,941 44,828 63,144 64,691
Subordinated debt 52,285 50,660 - -
The following methods and assumptions were used by the
Company in estimating its fair value disclosure for financial
instruments:
For cash and cash equivalents, marketable securities, accounts
receivable, notes payable to banks, accounts payable and
accrued expenses, the carrying amounts approximate fair value
due to their short maturities.
For long-term debt the estimated fair values of the
Company’s long-term debt are based on current interest rates
available to the Company for debt instruments with similar
terms and remaining maturities.
For forward exchange contracts market values have been used
to determine the fair value.
Credit risk represents the accounting loss that would be
recognized at the reporting date if counterparties failed
completely to perform as contracted and from movements in
interest rates and foreign exchange rates. The Company does
not anticipate nonperformance by counterparties. The
Company generally does not require collateral or other security
to support financial instruments with credit risk.
Concentrations of credit risk (whether on or off-balance sheet)
that arise from financial instruments exist for groups of
customers or counterparties when they have similar economic
characteristics that would cause their ability to meet
contractual obligations to be similarly affected by changes in
economic or other conditions. Financial instruments on the
balance sheet that potentially subject the Company to
concentrations of credit risk consist primarily of cash and
cash equivalents and accounts receivable. The Company
maintains a policy providing for the diversification of cash and
cash equivalent investments and places its investments in high
quality financial institutions to limit the amount of credit risk
exposure. Concentrations of credit risk with respect to
receivables are limited due to the large number of customers
as well as the dispersion across many geographic areas.
The Company’s Netherlands, Finnish and Singapore
operations receive research and development grants and
credits from various governmental sources. The amount of
research and development credits offset against research and
development expenses amounted to H 5,235, H 3,293 and
H 2,167 in 1998, 1999 and 2000, respectively.
The amounts received by the Company’s Netherlands
operations for TOK’s are contingently repayable to the extent
sales of the products to which the credit was related occur.
The amount of repayment as a percentage of the realized
sales of the associated products varies from 1% to 4%.
Contingent amounts repayable accrue interest at varying rates
from 5% to 8% per year. The amount contingently repayable
was H 11,863 and H 12,044 at December 31, 1999 and
December 31, 2000, respectively.
In 1998, 1999 and 2000 the Company made TOK repayments
in the amount of H 1,319, H 1,411 and H 1,505 respectively.
NOTE L Financial Instruments and Risk Management
NOTE M Research and Development
�
33

Capital leases included in property, plant and equipment are as follows:
December 31,
1999) 2000)
Machinery and equipment 225) 402)
Furniture and fixtures 354) 420)
579) 822)
Less accumulated depreciation (292) (484)
287) 338)
The Company leases certain office and plant facilities and equipment under various operating lease arrangements. Original
non-cancelable lease terms typically are between 1 and 15 years.
At December 31, 2000, minimum rental commitments under capital leases and operating leases having initial or remaining
non-cancelable terms in excess of one year are as follows:
Capital) Operating
leases) leases)
2001 229) 9,702)
2002 140) 7,503)
2003 38) 5,919)
2004 7) 4,741)
2005 4) 3,141)
Thereafter 3) 18,494)
Total 421) 49,500)
Less amount representing interest (68)
Present value of net minimum lease payments 353)
Aggregate rental expense for operating leases in 1998 was
H 6,925, in 1999 H 8,039 and in 2000 H 9,847.
The Company is subject to legal proceedings and claims that
arise in the ordinary course of its business. Although occasional
adverse decisions or settlements may occur, the Company
believes that the final disposition of such matters will not
have a material adverse effect on its financial position, results
of operations or liquidity.
During the first quarter of 1999, the Company decided to
close its manufacturing activities for wafer processing
equipment in the United States and in combination therewith,
to outsource to third parties the manufacturing of substantially
all parts previously manufactured in-house. Concurrently, the
United States assembly and test activities were combined
with those in Europe. This resulted in a reduction of employees
in the United States by approximately 75 and in the vacating
of certain facilities. Approximately 50 new positions were
created in Europe. The Company incurred a restructuring
charge, covering employee terminations, write-offs and
occupancy costs of H 3,854 associated with these decisions.
The Company’s intention was to begin implementing the
steps necessary to complete the 1999 restructuring program
immediately on formalization thereof and to substantially
complete all necessary steps by the end of 1999. At
December 31, 1999, however, there was a remaining accrual
associated with the restructuring program of H 2,504;
implementation of the certain elements of the program had
been delayed due to longer than anticipated time taken to
transfer certain operations to Europe where plant modifications
were required. At December 31, 1999, the revised schedule
for completion of the program was mid 2000.
NOTE N Commitments and Contingencies
NOTE O Restructuring
Notes to Consolidated Financial Statements (continued)(EUR in thousands, unless otherwise stated)
34
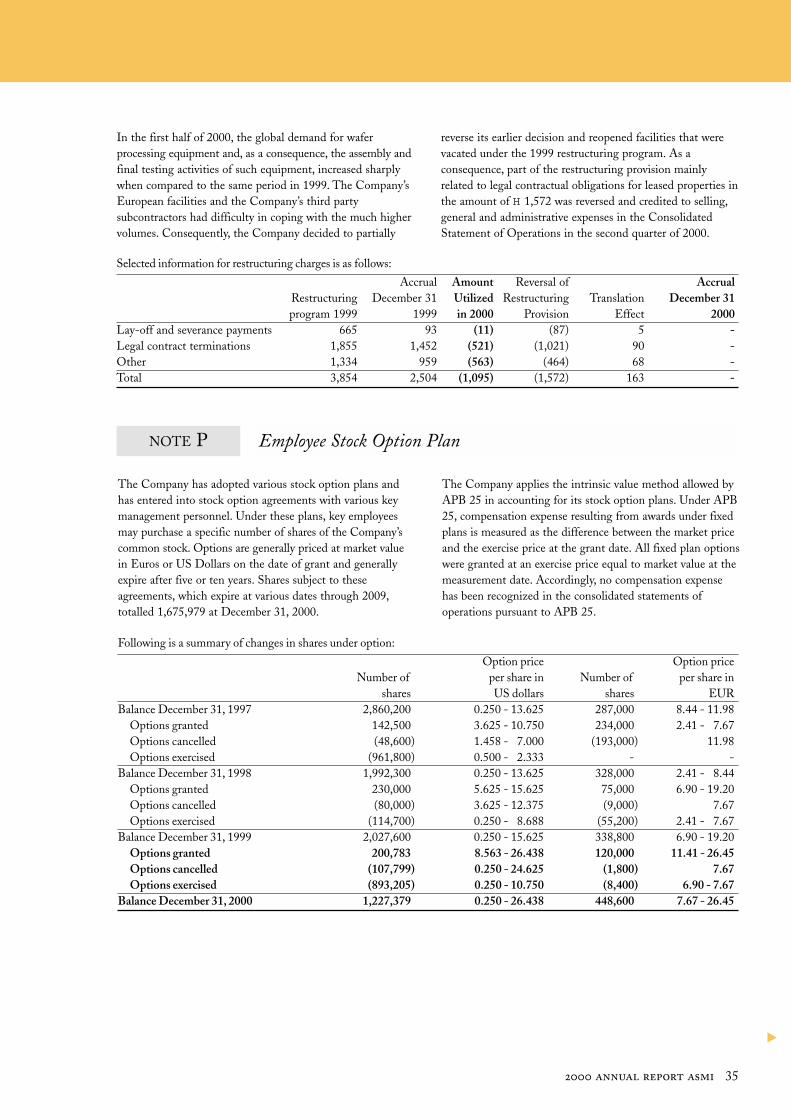
In the first half of 2000, the global demand for wafer
processing equipment and, as a consequence, the assembly and
final testing activities of such equipment, increased sharply
when compared to the same period in 1999. The Company’s
European facilities and the Company’s third party
subcontractors had difficulty in coping with the much higher
volumes. Consequently, the Company decided to partially
reverse its earlier decision and reopened facilities that were
vacated under the 1999 restructuring program. As a
consequence, part of the restructuring provision mainly
related to legal contractual obligations for leased properties in
the amount of H 1,572 was reversed and credited to selling,
general and administrative expenses in the Consolidated
Statement of Operations in the second quarter of 2000.
The Company has adopted various stock option plans and
has entered into stock option agreements with various key
management personnel. Under these plans, key employees
may purchase a specific number of shares of the Company’s
common stock. Options are generally priced at market value
in Euros or US Dollars on the date of grant and generally
expire after five or ten years. Shares subject to these
agreements, which expire at various dates through 2009,
totalled 1,675,979 at December 31, 2000.
The Company applies the intrinsic value method allowed by
APB 25 in accounting for its stock option plans. Under APB
25, compensation expense resulting from awards under fixed
plans is measured as the difference between the market price
and the exercise price at the grant date. All fixed plan options
were granted at an exercise price equal to market value at the
measurement date. Accordingly, no compensation expense
has been recognized in the consolidated statements of
operations pursuant to APB 25.
Following is a summary of changes in shares under option:
Option price Option price)
Number of ) per share in Number of ) per share in)
shares) US dollars shares) EUR)
Balance December 31, 1997 2,860,200) 0.250 - 13.625 287,000) 8.44 - 11.98)
Options granted 142,500) 3.625 - 10.750 234,000) 2.41 - 07.67)
Options cancelled (48,600) 1.458 - 07.000 (193,000) 11.98)
Options exercised (961,800) 0.500 - 02.333 -) -)
Balance December 31, 1998 1,992,300) 0.250 - 13.625 328,000) 2.41 - 08.44)
Options granted 230,000) 5.625 - 15.625 75,000) 6.90 - 19.20)
Options cancelled (80,000) 3.625 - 12.375 (9,000) 7.67)
Options exercised (114,700) 0.250 - 08.688 (55,200) 2.41 - 07.67)
Balance December 31, 1999 2,027,600) 0.250 - 15.625 338,800) 6.90 - 19.20)
Options granted 200,783) 8.563 - 26.438 120,000) 11.41 - 26.45)
Options cancelled (107,799) 0.250 - 24.625 (1,800) 7.67)
Options exercised (893,205) 0.250 - 10.750 (8,400) 6.90 - 7.67)
Balance December 31, 2000 1,227,379) 0.250 - 26.438 448,600) 7.67 - 26.45)
Selected information for restructuring charges is as follows:
Accrual Amount Reversal of Accrual
Restructuring December 31 Utilized Restructuring Translation December 31
program 1999 1999 in 2000 Provision Effect 2000
Lay-off and severance payments 665 93 (11) (87) 5 -
Legal contract terminations 1,855 1,452 (521) (1,021) 90 -
Other 1,334 959 (563) (464) 68 -
Total 3,854 2,504 (1,095) (1,572) 163 -
NOTE P Employee Stock Option Plan
�
35

In 1989, the shareholders of ASMPT approved a plan to issue
up to 5 percent of the total issued shares of ASMPT to directors
and employees. The directors annually may approve an amount
of supplemental compensation to the designated directors and
officers which will be used to issue or purchase ASMPT’s
common shares for the designees at current market value.
In 2000 2,828,000 common shares of ASMPT were issued, for
cash at par, pursuant to the Employee Share Incentive Scheme
of ASMPT. In 1999 and 1998, respectively 1,796,000 and
1,610,000 ASMPT shares were issued to certain directors
and employees under the plan. The effect of this transaction
on ASMI was a dilution of its ownership interest in ASMPT
with 0.41% in 2000, 0.24% in 1999 and 0.22% in 1998.
Following the issuance of 1,043,000 common shares under
the plan in March 2000, the Company’s shareholding in
ASMPT dropped slightly below 50%. In various transactions
in April, June and July, the Company acquired 18,897,500 of
the outstanding common shares of ASMPT, thereby restoring
its total shareholding in that company to 54.88%.
Throughout this entire period, the Company maintained
control over ASMPT. In December 2000 1,785,000 common
shares were issued under the plan diluting ASMI’s ownership
in ASMPT to 54.62%. As of December 31, 2000
management of ASMPT has determined that 1,800,000
common shares will be allocated to employees for their services
in the year 2000, which shares will be issued in the year 2001.
Total compensation expense related to the Employee Share
Incentive Scheme of ASMPT of respectively HK $ 20.0 million
(H 2,773) in 2000, HK $ 38.7 million (H 5,463) in 1999 and
HK $ 5.9 million (H 737) in 1998 was charged to the
Statement of Operations.
Options Outstanding Options Exercisable
Number Weighted Average Weighted Number Weighted
Range of Outstanding at Remaining Average Exercisable at Average
Exercise December 31, Contractual Exercise December 31, Exercise
Prices in US $ 2000 Life, in years Price in US $ 2000 Price in US $
00.25 - 03.00 165,500 2.18 0.32 165,500 0.32
03.00 - 06.00 324,496 7.00 5.17 146,171 5.15
06.00 - 09.00 547,883 4.08 8.18 326,300 8.26
09.00 - 14.00 500,600 6.39 9.08 129,500 7.84
14.00 - 20.00 100,000 7.92 16.60 6,000 15.66
20.00 - 30.00 37,500 7.90 25.08 – –
00.25 - 30.00 1,675,979 5.46 7.97 773,471 5.96
The average remaining contractual life of the outstanding options granted in 2000 is 6.58 years at December 31, 2000.
Had compensation cost been determined consistent with Statement of Financial Accounting Standards No. 123, “Accounting
for Stock-Based Compensation” (“SFAS 123”), proforma net earnings, basic and diluted earnings per share would have been as
follows:Year ended December 31,) )
1998) 1999) 2000)
Expected life (years) 3-8) 3-10) 3-10)
Risk free interest rate 5.0%) 5.0%) 5.0%)
Volatility 60.0%) 85.0%) 81.0%)
Assumed forfeitures -) -) -)
Net earnings (loss):
As reported 232) 11,099) 94,272)
Proforma (1,389) 9,621) 92,921)
Basic earnings (loss) per share:
As reported 0.01) 0.30) 2.01)
Proforma (0.04) 0.26) 1.98)
Diluted earnings (loss) per share:
As reported 0.01) 0.29) 1.94)
Proforma (0.04) 0.25) 1.90)
Notes to Consolidated Financial Statements (continued)(EUR in thousands, unless otherwise stated)
36
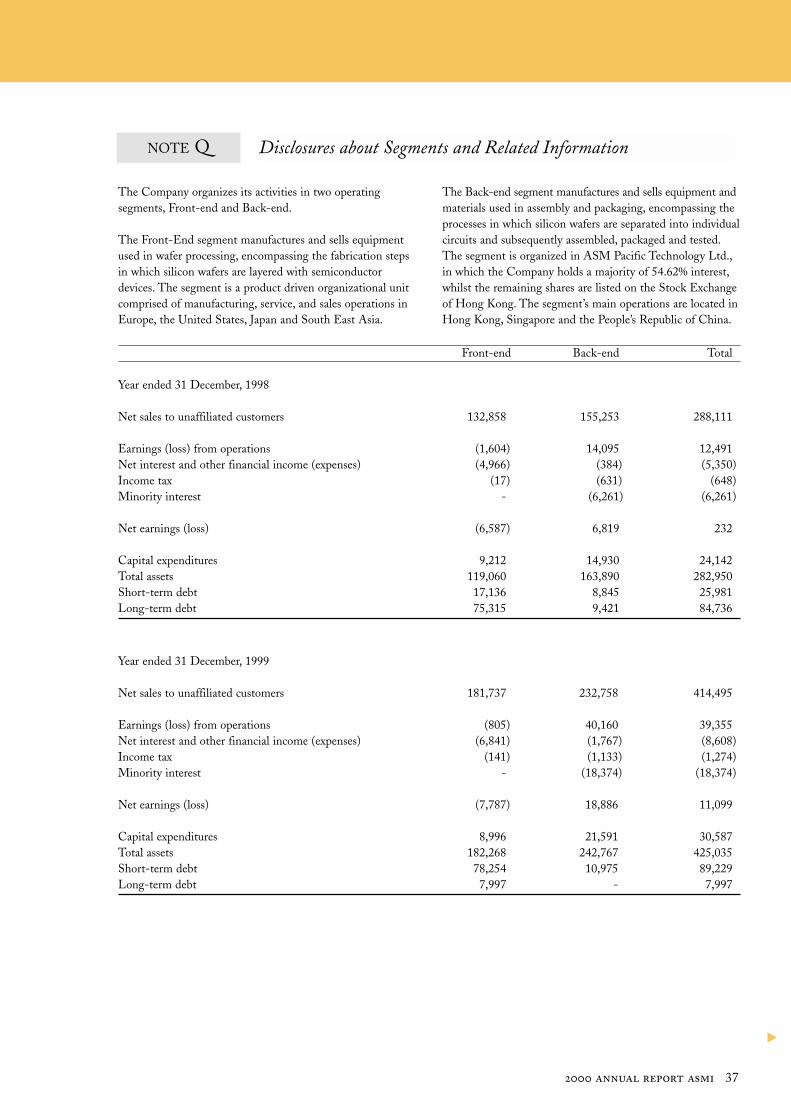
The Company organizes its activities in two operating
segments, Front-end and Back-end.
The Front-End segment manufactures and sells equipment
used in wafer processing, encompassing the fabrication steps
in which silicon wafers are layered with semiconductor
devices. The segment is a product driven organizational unit
comprised of manufacturing, service, and sales operations in
Europe, the United States, Japan and South East Asia.
The Back-end segment manufactures and sells equipment and
materials used in assembly and packaging, encompassing the
processes in which silicon wafers are separated into individual
circuits and subsequently assembled, packaged and tested.
The segment is organized in ASM Pacific Technology Ltd.,
in which the Company holds a majority of 54.62% interest,
whilst the remaining shares are listed on the Stock Exchange
of Hong Kong. The segment’s main operations are located in
Hong Kong, Singapore and the People’s Republic of China.
Year ended 31 December, 1999
Net sales to unaffiliated customers 181,737) 232,758) 414,495)
Earnings (loss) from operations (805) 40,160) 39,355)
Net interest and other financial income (expenses) (6,841) (1,767) (8,608)
Income tax (141) (1,133) (1,274)
Minority interest -) (18,374) (18,374)
Net earnings (loss) (7,787) 18,886) 11,099)
Capital expenditures 8,996) 21,591) 30,587)
Total assets 182,268) 242,767) 425,035)
Short-term debt 78,254) 10,975) 89,229)
Long-term debt 7,997) -) 7,997)
Front-end) Back-end) Total)
Year ended 31 December, 1998
Net sales to unaffiliated customers 132,858) 155,253) 288,111)
Earnings (loss) from operations (1,604) 14,095) 12,491)
Net interest and other financial income (expenses) (4,966) (384) (5,350)
Income tax (17) (631) (648)
Minority interest -) (6,261) (6,261)
Net earnings (loss) (6,587) 6,819) 232)
Capital expenditures 9,212) 14,930) 24,142)
Total assets 119,060) 163,890) 282,950)
Short-term debt 17,136) 8,845) 25,981)
Long-term debt 75,315) 9,421) 84,736)
NOTE Q Disclosures about Segments and Related Information
�
37
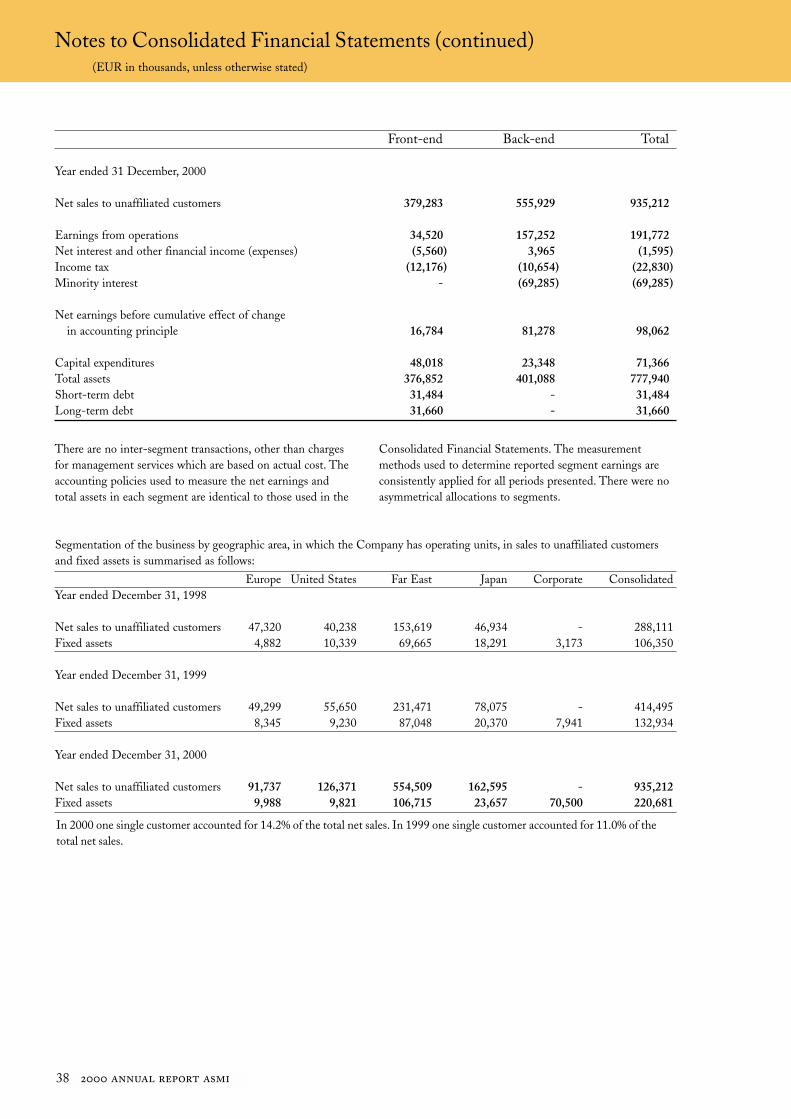
There are no inter-segment transactions, other than charges
for management services which are based on actual cost. The
accounting policies used to measure the net earnings and
total assets in each segment are identical to those used in the
Consolidated Financial Statements. The measurement
methods used to determine reported segment earnings are
consistently applied for all periods presented. There were no
asymmetrical allocations to segments.
In 2000 one single customer accounted for 14.2% of the total net sales. In 1999 one single customer accounted for 11.0% of the
total net sales.
Segmentation of the business by geographic area, in which the Company has operating units, in sales to unaffiliated customers
and fixed assets is summarised as follows:
Europe United States Far East Japan Corporate Consolidated
Year ended December 31, 1998
Net sales to unaffiliated customers 47,320 40,238 153,619 46,934 - 288,111
Fixed assets 4,882 10,339 69,665 18,291 3,173 106,350
Year ended December 31, 1999
Net sales to unaffiliated customers 49,299 55,650 231,471 78,075 - 414,495
Fixed assets 8,345 9,230 87,048 20,370 7,941 132,934
Year ended December 31, 2000
Net sales to unaffiliated customers 91,737 126,371 554,509 162,595 - 935,212
Fixed assets 9,988 9,821 106,715 23,657 70,500 220,681
Front-end) Back-end) Total)
Year ended 31 December, 2000
Net sales to unaffiliated customers 379,283) 555,929) 935,212)
Earnings from operations 34,520) 157,252) 191,772)
Net interest and other financial income (expenses) (5,560) 3,965) (1,595)
Income tax (12,176) (10,654) (22,830)
Minority interest -) (69,285) (69,285)
Net earnings before cumulative effect of change
in accounting principle 16,784) 81,278) 98,062)
Capital expenditures 48,018) 23,348) 71,366)
Total assets 376,852) 401,088) 777,940)
Short-term debt 31,484) -) 31,484)
Long-term debt 31,660) -) 31,660)
Notes to Consolidated Financial Statements (continued)(EUR in thousands, unless otherwise stated)
38

Aggregate cash compensation paid or accrued by ASMI for
the Management Board of the Company was H 1,037 in 1998,
H 1,366 in 1999 and H 1,925 in 2000. Aggregate compensation
for the members of the Supervisory Board amounted to H 50
in 1998, H 59 in 1999 and H 61 in 2000.
Personnel expenses for employees were as follows:
Year ended December 31,
1998 1999 2000
Wages, salaries and social charges 90,003 105,137 178,427
Pensions 3,117 3,225 5,756
93,120 108,362 184,183
The average number of employees by geographic area during the year were as follows:
Year ended December 31,
1998 1999 2000
Netherlands 227 226 284
Other European countries 37 53 103
United States of America 322 254 279
Far East 3,817 4,026 5,622
Japan 178 180 203
4,581 4,739 6,491
The following represents a reconciliation of net earnings and weighted average number of shares outstanding (in thousands) for
purposes of calculating basic and diluted net earnings per share:
Year ended December 31,
1998 1999 2000
Net earnings used for purpose of computing basic earnings per share 232 11,099 94,272
After-tax equivalent of interest expense on convertible
notes and exercisable warrants - 565 430
Net earnings used for purposes of computing diluted
earnings per share 232 11,664 94,702
Basic weighted average number of shares outstanding at the
end of period used for purpose of computing basic earnings per share 33,794 37,301 46,810
Dilutive effect of stock options 949 934 1,112
Dilutive effect of convertible notes and exercisable warrants - 2,429 781
Dilutive weighted average number of shares outstanding 34,743 40,664 48,703
Net earnings per share
Basic 0.01 0.30 2.01
Diluted 0.01 0.29 1.94
NOTE R Selected Operating Expenses and Additional Information
NOTE S Earnings per Share
39

Independent Auditors’ Report
Board of Directors and Shareholders
ASM International N.V.
Bilthoven, the Netherlands
We have audited the accompanying consolidated balance sheets
of ASM International N.V. and subsidiaries (collectively, the
‘Company’) as of December 31, 1999 and 2000, and the
related consolidated statements of operations, comprehensive
income, shareholders’ equity and cash flows for each of the
three years in the period ended December 31, 2000. These
financial statements are the responsibility of the Company’s
management. Our responsibility is to express an opinion on
these consolidated financial statements based on our audits.
We conducted our audits in accordance with generally
accepted auditing standards in the United States of America.
Those standards require that we plan and perform the audit
to obtain reasonable assurance about whether the financial
statements are free of material misstatement. An audit
includes examining, on a test basis, evidence supporting the
amounts and disclosures in the financial statements. An
audit also includes assessing the accounting principles used
and significant estimates made by management, as well as
evaluating the overall financial statement presentation. We
believe that our audits provide a reasonable basis for our
opinion.
In our opinion, such consolidated financial statements
referred to above present fairly, in all material respects, the
financial position of the Company as of December 31, 1999
and 2000, and the results of their operations and their cash
flows for each of the three years in the period ended
December 31, 2000, in conformity with generally accepted
accounting principles in the United States of America.
Deloitte & Touche
Accountants
Amsterdam, the Netherlands,
February 9, 2001
40

This leadframe shows the Progress of Innovation of the semi-conductor industry in general and of ASM International in particular.
41

(thousands except share data) EUR)
December 31,
Assets Note 1999) 2000)
Cash and cash equivalents 2,208) 45,862)
Amounts due from subsidiaries 17,079) 49,434)
Other current assets 2,578) 2,877)
Total current assets 21,865) 98,173)
Investments in subsidiaries B 90,707) 264,970)
Loans due from subsidiaries B 35,720) 6,723)
Property, plant and equipment, net D 2,183) 1,987)
Goodwill, net E 4,897) 4,404)
Total Assets 155,372) 376,257)
Liabilities and Shareholders’ Equity
Notes payable to banks 825) -)
Amounts due to subsidiaries 3,158) 12,877)
Accrued liabilities and other 6,299) 3,293)
Income taxes 174) 285)
Current portion of long-term debt F 25,206) 30,012)
Subordinated debt 52,285) -)
Total current liabilities 87,947) 46,467)
Long-term debt F 1,873) 21,468)
Total liabilities 89,820) 67,935)
Shareholders’ Equity:
Common shares
Authorized 60,000,000 shares, par value NLG .01,
issued and outstanding 40,107,784 and 48,797,346 shares 182) 221)
Financing preferred shares
Authorized 900 shares, par value NLG 100, none issued -) -)
Preferred shares
Authorized 6,900 shares, par value NLG 100, none issued -) -)
Capital in excess of par value 103,443) 252,784)
Retained (deficit) earnings (35,454) 58,818)
Accumulated other comprehensive loss (2,619) (3,501)
Total Shareholders’ Equity 65,552) 308,322)
Total Liabilities and Shareholders’ Equity 155,372) 376,257)
See Notes to Statutory Financial Statements.
(thousands) EUR)
Year ended December 31,
1998) 1999) 2000)
Net income of subsidiaries 4,871) 18,786) 97,460)
Net (loss) from holding activities (4,639) (7,687) (3,188)
Consolidated net earnings 232) 11,099) 94,272)
See Notes to Statutory Financial Statements.
Balances prior to January 1, 1999 were restated from Netherlands guilders into Euros using the fixed exchange rate as of January 1, 1999 (EUR 1.00 = NLG 2.20371).
Statutory Balance Sheets(After Appropriation of Net Earnings for the Year)
Statutory Statements of Operations
42

Notes to Statutory Financial Statements(EUR in thousands)
NOTE A Summary of Significant Accounting Policies
NOTE B Investments in Subsidiaries and Loans due from Subsidiaries
Significant Accounting Policies - The accounting policies used
for the preparation of the Statutory Financial Statements are
the same as those used in the preparation of the
Consolidated Financial Statements. Reference is made to
Note A to Consolidated Financial Statements. In addition to
those accounting policies, the following accounting policies
for the Statutory Financial Statements are described below.
Presentation of Amounts - Amounts presented in the Statutory
Statements of Operations are presented net of income taxes.
The Statutory Financial Statements include the accounts of
ASM International N.V. and follows accounting principles
that conform with those generally accepted in the United
States of America (‘US GAAP’). Had ASM International
N.V. prepared its Financial Statements following accounting
principles generally accepted in the Netherlands, the
Statements of Operations and the Balance Sheets would not
have differed significantly from those presented herein.
Investments in Subsidiaries - Investments in subsidiaries
include capital investments in subsidiaries in which ASM
International N.V. owns more than 50% of the shares and
participating interests in legal entities with a capital
investment of more than 20% and loans due from subsidiaries.
Investments in subsidiaries are valued using the equity
method of accounting.
With respect to the availability of retained earnings of the
investment in ASM Pacific Technology (‘ASMPT’), these
retained earnings can be distributed as dividend to shareholders,
including ASM International N.V. to the extent of its share
in ASMPT. As of December 31, 2000 these retained earnings
of ASMPT amounted to 496.7 million Hong Kong dollar
(H 68,677). Other than these distributions ASMPT is
precluded to provide loans and advances other than trade
receivables in the normal course of business to ASM
International N.V. under the rules of the Stock Exchange of
Hong Kong.
ASM International NV has guaranteed available short term
facilities and other obligations of certain subsidiaries of
H 32,887. With respect to certain Dutch subsidiaries ASM
International N.V. has asssumed joint and several liability in
accordance with Article 403 of Book 2 of the Netherlands
Civil Code.
Investments) Loans due) )
) in) from) )
) subsidiaries) subsidiaries) Total)
Balance January 1, 2000 ) 90,707) 35,720) 126,427)
Capital investments ) 77,932) -) 77,932)
Net income of subsidiaries ) 97,460) -) 97,460)
Issuance of loans ) -) 6,157) 6,157)
Transfer to current assets ) -) (31,436) (31,436)
Repayments of loans ) -) (5,263) (5,263)
Translation effect ) (1,129) 1,545) 416)
Balance December 31, 2000 ) 264,970) 6,723) 271,693)
�
43
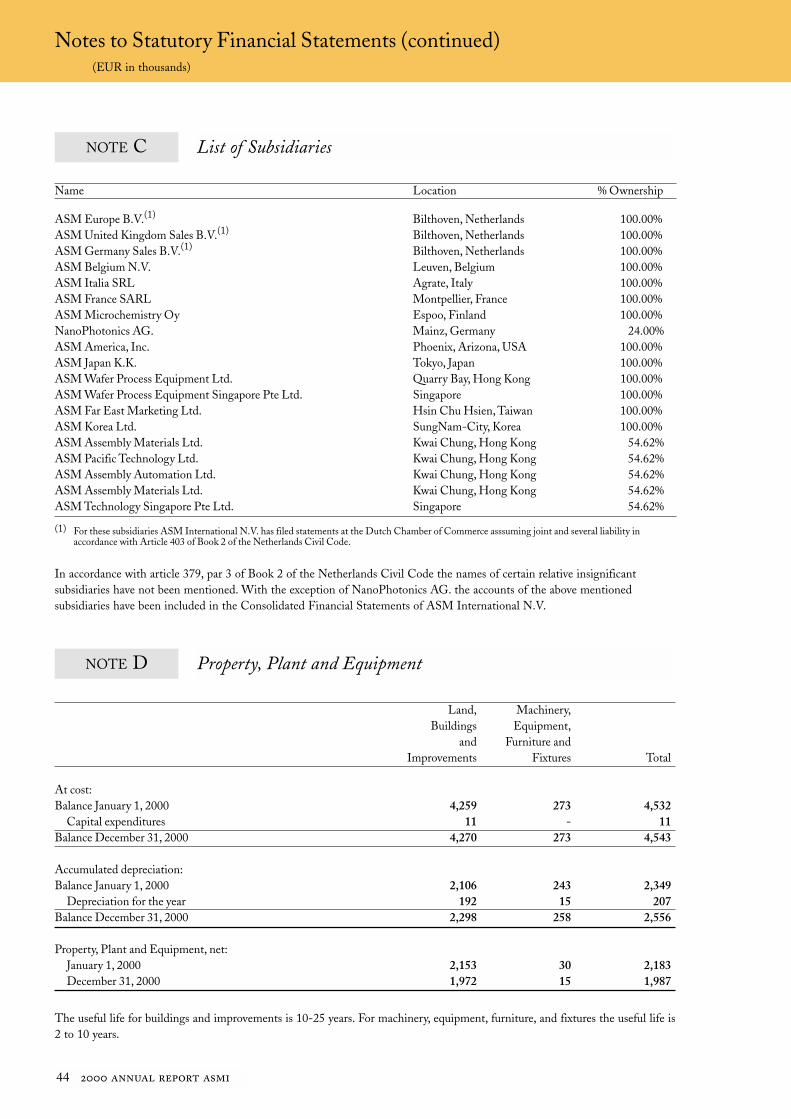
Notes to Statutory Financial Statements (continued)(EUR in thousands)
NOTE D Property, Plant and Equipment
The useful life for buildings and improvements is 10-25 years. For machinery, equipment, furniture, and fixtures the useful life is
2 to 10 years.
) Land,) Machinery,) )
) Buildings) Equipment,) )
) and) Furniture and) )
) Improvements) Fixtures) Total)
At cost: ) ) ) )
Balance January 1, 2000 ) 4,259) 273) 4,532)
Capital expenditures ) 11) -) 11)
Balance December 31, 2000 ) 4,270) 273) 4,543)
Accumulated depreciation: ) ) ) )
Balance January 1, 2000 ) 2,106) 243) 2,349)
Depreciation for the year ) 192) 15) 207)
Balance December 31, 2000 ) 2,298) 258) 2,556)
Property, Plant and Equipment, net:
January 1, 2000 2,153) 30) 2,183)
December 31, 2000 ) 1,972) 15) 1,987)
NOTE C List of Subsidiaries
In accordance with article 379, par 3 of Book 2 of the Netherlands Civil Code the names of certain relative insignificant
subsidiaries have not been mentioned. With the exception of NanoPhotonics AG. the accounts of the above mentioned
subsidiaries have been included in the Consolidated Financial Statements of ASM International N.V.
Name Location % Ownership
ASM Europe B.V.(1) Bilthoven, Netherlands 100.00%
ASM United Kingdom Sales B.V.(1) Bilthoven, Netherlands 100.00%
ASM Germany Sales B.V.(1) Bilthoven, Netherlands 100.00%
ASM Belgium N.V. Leuven, Belgium 100.00%
ASM Italia SRL Agrate, Italy 100.00%
ASM France SARL Montpellier, France 100.00%
ASM Microchemistry Oy Espoo, Finland 100.00%
NanoPhotonics AG. Mainz, Germany 24.00%
ASM America, Inc. Phoenix, Arizona, USA 100.00%
ASM Japan K.K. Tokyo, Japan 100.00%
ASM Wafer Process Equipment Ltd. Quarry Bay, Hong Kong 100.00%
ASM Wafer Process Equipment Singapore Pte Ltd. Singapore 100.00%
ASM Far East Marketing Ltd. Hsin Chu Hsien, Taiwan 100.00%
ASM Korea Ltd. SungNam-City, Korea 100.00%
ASM Assembly Materials Ltd. Kwai Chung, Hong Kong 54.62%
ASM Pacific Technology Ltd. Kwai Chung, Hong Kong 54.62%
ASM Assembly Automation Ltd. Kwai Chung, Hong Kong 54.62%
ASM Assembly Materials Ltd. Kwai Chung, Hong Kong 54.62%
ASM Technology Singapore Pte Ltd. Singapore 54.62%
(1) For these subsidiaries ASM International N.V. has filed statements at the Dutch Chamber of Commerce asssuming joint and several liability in accordance with Article 403 of Book 2 of the Netherlands Civil Code.
44
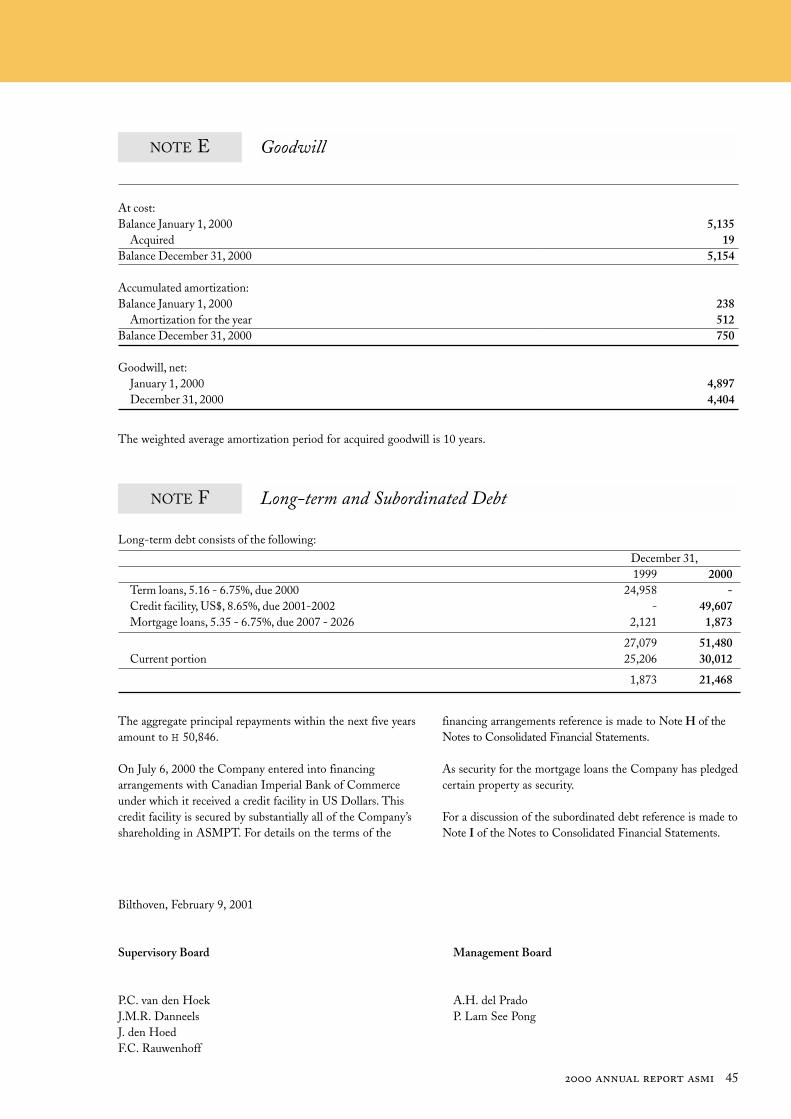
NOTE F Long-term and Subordinated Debt
NOTE E Goodwill
The aggregate principal repayments within the next five years
amount to H 50,846.
On July 6, 2000 the Company entered into financing
arrangements with Canadian Imperial Bank of Commerce
under which it received a credit facility in US Dollars. This
credit facility is secured by substantially all of the Company’s
shareholding in ASMPT. For details on the terms of the
financing arrangements reference is made to Note H of the
Notes to Consolidated Financial Statements.
As security for the mortgage loans the Company has pledged
certain property as security.
For a discussion of the subordinated debt reference is made to
Note I of the Notes to Consolidated Financial Statements.
Bilthoven, February 9, 2001
Supervisory Board Management Board
P.C. van den Hoek A.H. del Prado
J.M.R. Danneels P. Lam See Pong
J. den Hoed
F.C. Rauwenhoff
The weighted average amortization period for acquired goodwill is 10 years.
At cost: ) ) ) )
Balance January 1, 2000 ) ) ) 5,135)
Acquired ) ) ) 19)
Balance December 31, 2000 ) ) ) 5,154)
Accumulated amortization: ) ) ) )
Balance January 1, 2000 ) ) ) 238)
Amortization for the year ) ) ) 512)
Balance December 31, 2000 ) ) ) 750)
Goodwill, net:
January 1, 2000 ) ) 4,897)
December 31, 2000 ) ) ) 4,404)
Long-term debt consists of the following:
December 31,
1999) 2000)
Term loans, 5.16 - 6.75%, due 2000 24,958) -)
Credit facility, US$, 8.65%, due 2001-2002 -) 49,607)
Mortgage loans, 5.35 - 6.75%, due 2007 - 2026 2,121) 1,873)
27,079) 51,480)
Current portion 25,206) 30,012)
1,873) 21,468)
45

Additional Information
Appropriation and Determination of Profit
Article 32 of the Articles of Association of ASM International
N.V. (the Company) provides the following with regard to
distribution of profit:
Para 1-3:
First, a dividend equal to the promissory discount rate as
established by De Nederlandsche Bank N.V. (the Dutch
Central Bank) as applicable on the first stock exchange day of
the financial year over which the dividend is distributed,
increased by one and a half, is paid on the paid up amount which
had to be paid on the preferred shares. If profits are insufficient,
the dividend will be paid from retained earnings with priority
over any dividends. If retained earnings are insufficient, the
dividend deficit has to be made up in future years;
Para 4-6:
Second, a dividend is paid on financing preferred shares. The
dividend is a percentage of the par value, plus share premium
paid, on the financing preferred shares. The percentage and
the period for its payment (the tenure of the financing preferred
shares) is determined by the Management Board, subject to
approval of the Supervisory Board. The percentage depends on
the weighted average return of Dutch government bonds with
a weighted average remaining life of no more than ten years, plus
a premium not to exceed three percent. If profits are insufficient,
the dividend shall be paid from retained earnings. If retained
earnings are insufficient, the dividend deficit has to be made
up in future years;
Para 7:
After application of the provisions in the foregoing
paragraphs, the Management Board, subject to approval from
the Supervisory Board, shall determine which portion of the
remaining profits is to be reserved. The profits which remain
after reservation are at the disposal of the General Meeting;
Para 9:
The Company can only make distributions to shareholders and
other entitled parties from the profits subject to distribution to
the extent its Shareholders’ Equity exceeds the amount of the
paid up and called up portion of the capital increased by the
reserves which must be maintained by virtue of the law;
Article 33, para 3 of the Articles of Association provides that
dividend claims expire after the lapse of five years.
The Management Board with the approval of the Supervisory
Board has decided that the profit for the year 2000 will be
retained by way of reserve and not be available for distribution.
Special Statutory Control Rights
Article 27 of the Articles of Association provides that each
shareholder shall be entitled to cast a number of votes equal to
the nominal amount of his shares, such that each share with a
par value of one cent (NLG 0.01) entitles the holder to a single
vote and each share with a par value of one hundred guilders
(NLG 100) entitles the holder to ten thousand votes;
Article 29 of the Articles of Association provides that meetings
of holders of preferred shares or of financing preferred shares
shall be convened as often as a decision by the meeting of
preferred shares or of financing preferred shares is desired, and
also as often as the Management Board and or the Supervisory
Board shall decide to hold such a meeting. Decisions at such
meetings shall be made with an absolute majority of votes
and in the event of a tie, no decision shall be made;
The following resolutions and actions can only be taken on a
proposal by the Management Board and the Supervisory Board:
- the amendment of the Articles of the Company;
- the dissolution of the Company.
Stichting Continuïteit ASM International
The object of ‘Stichting Continuïteit ASM International’
(‘Stichting’) is to own and vote the Company’s preferred shares
in order to maintain the continuity of the Company. Toward
that objective, Stichting will evaluate, when called for, whether
a take-over offer is in the best interest of the Company. In
accordance with the applicable regulations of the Euronext
Amsterdam, Stichting is managed by majority vote of a five-
person Board, not more than two of which (Directors A) may
be officers of the Company and at least three of which
(Directors B) must be independent from the Company.
Directors A are appointed by the Management Board, subject
to the approval of the Supervisory Board, from among the
Management and Supervisory Boards. Directors B must be
independent from the Company and are appointed by the
Board of Stichting, subject to approval of the Management
Board with the consent of the Supervisory Board. The
Company may not provide financial support to Stichting.
The Company has, as approved in the General Meeting of
May 28, 1997, granted a right to purchase preferred shares to
Stichting for a par value equal to the par value of half of the
outstanding common shares at the time of purchase. The
minimum purchase price of the preferred shares is 25% of the
par value. The shareholders must be informed about the
Company’s motives within four weeks after issuance of preferred
shares. Within two years after issuing preferred shares, a proposal
to withdraw or repurchase the shares must be submitted to
shareholders and, if not accepted, every two years thereafter.
No preferred shares are outstanding as per December 31, 2000.
The two directors of the Company (Directors A) who have
been appointed to the Board of Stichting are Messrs.
P.C. van den Hoek, Chairman of the Supervisory Board and
A.H. del Prado, Chief Executive Officer.
The three independent directors (Directors B) appointed to
the Board of Stichting are Messrs. M.J.C. van Galen, R.
Veenenga Kingma and L. Traas.
46

Independent Auditors’ Report
Board of Directors and Shareholders
ASM International N.V.
Bilthoven, the Netherlands
Introduction
We have audited the 2000 financial statements of
ASM International N.V. These financial statements are the
responsibility of the Company’s management. Our
responsibility is to express an opinion on these consolidated
financial statements based on our audits.
Scope
We conducted our audits in accordance with generally
accepted auditing standards in the Netherlands. Those
standards require that we plan and perform the audit to
obtain reasonable assurance about whether the financial
statements are free of material misstatement. An audit
includes examining, on a test basis, evidence supporting the
amounts and disclosures in the financial statements. An
audit also includes assessing the accounting principles used
and significant estimates made by management, as well as
evaluating the overall financial statement presentation. We
believe that our audits provide a reasonable basis for our
opinion.
Opinion
In our opinion, the financial statements of
ASM International N.V. give a true and fair view of the
financial position of the Company as of December 31, 2000
and the net earnings for the year then ended in accordance
with accounting principles generally accepted in the
Netherlands and comply with the legal requirements for
financial statements as included in Part 9, Book2 of the
Netherlands Civil Code.
Deloitte & Touche
Accountants
Amsterdam, the Netherlands,
February 9, 2001
47

NASDAQ bid prices per share in US dollars
1999 2000
high low high low
first quarter 6.750 3.625 37.000 19.875
second quarter 7.875 3.688 37.625 21.875
third quarter 9.000 7.000 31.000 16.750
fourth quarter 24.375 7.500 18.125 9.250
full year 24.375 3.625 37.625 9.250
The Company’s common shares are quoted on the Euronext Amsterdam since the completion of its offering in December 1996.
Euronext Amsterdam bid prices per share in Euros
1999 2000
high low high low
first quarter 5.600 3.550 36.600 18.750
second quarter 7.650 3.550 38.250 25.900
third quarter 8.400 6.750 32.450 19.700
fourth quarter 24.000 7.000 20.950 10.550
full year 24.000 3.550 38.250 10.550
Bid prices per share in Hong Kong dollars
1999 2000
high low high low
first quarter 4.350 3.100 27.900 11.200
second quarter 5.900 4.050 34.000 22.400
third quarter 10.300 5.250 34.800 15.000
fourth quarter 15.300 7.950 17.500 9.050
full year 15.300 3.100 34.800 9.050
The common stock of ASM Pacific Technology Ltd. is quoted on The Stock Exchange of Hong Kong.
At December 31, 2000 and 1999 ASMI held 207,427,500
and 188,530,000 shares of ASMPT respectively. The quoted
market value of these shares at December 31, 2000 was
H 318.4 million (using a year-end share price of HK $ 11.10
and an exchange rate of HK $ 1 = H 0.1383). The value of
the shares at December 31, 1999 was H 333.9 million (using
a year-end share price of HK $ 13.80 and an exchange rate
of HK $ 1 = H 0.1283).
The Company’s common shares are traded over-the-counter
and are quoted on the NASDAQ National Market System in
the United States of America under the symbol ‘ASMI’. The
Company to date has not paid cash dividends on its common
shares. It is the intention of the Company’s management to
retain its earnings for use in the development of its business.
The following table sets forth, for the periods indicated, the
high and low prices of the common shares as reported on
NASDAQ.
Common Stock Information
48

Corporate Information
Management
Arthur H. del PradoManaging Director,President and Chief Executive Officer,(Principal Executive Officer)
Lam See Pong, PatrickVice President Asian Operations andManaging Director of ASM PacificTechnology Ltd.
Daniel QueyssacChief Operating Officer of Front-end Operations and President of ASM America, Inc.
Robert de Bakker(appointed as of January 1, 2001)Chief Financial Officer,(Principal Financial and Accounting Officer)
Rinse de Jong (until December 31, 2000)Chief Financial Officer,(Principal Financial and Accounting Officer)
Fukumi TominoVice President Japanese Operationsand Managing Director of ASM Japan K.K.
Han WestendorpGeneral Manager of ASM Europe B.V.
Hans WunderlGeneral Manager ofASM America, Inc.
Ivo RaaijmakersChief TechnologyOfficer of Front-end Operations
Ernst GrannemanBusiness Unit Manager
Supervisory Board of Directors
Paul C. van den Hoek* (1939)ChairmanNationality: DutchCurrent term expires: 2001Partner in the law firm of StibbeSimont Monahan Duhot,Chairman Supervisory Board ofBallast Nedam N.V.,Buhrmann N.V.,Het Financieele Dagblad B.V. and Wavin B.V.,Member Supervisory Board AONGroep Nederland B.V., Robeco N.V.,Rolinco N.V., Rorento N.V. andChairman Robeco Groep N.V.
Johan M.R. Danneels (1949)Nationality: BelgianCurrent term expires: 2004President and CEO of AlcatelMicroelectronics,Chairman of IMEC
Jean den Hoed* (1937)Nationality: DutchCurrent term expires: 2003Former Chief Financial Officer Akzo Nobel N.V.,Member Supervisory BoardVendex/KBB and N.V. Verenigd StreekvervoerNederland “Connexxion”
Ferdinand C. Rauwenhoff * (1930) Nationality: DutchCurrent term expires: 2002Former Chairman of the SeniorManagement Committee of theDutch Philips Companies,Member Supervisory Board of Cap Gemini N.V. and HSA N.V.
*Member Audit Committee
Transfer Agents and Registrars
CitibankNew York, NY, U.S.A.
ABN AMRO BankBreda, the Netherlands
Independent Auditors
Deloitte and ToucheAmsterdam, the Netherlands
Trade Register
Chamber of CommerceUtrecht, the NetherlandsNumber 30037466
Investor Relations
Mary Jo DieckhausDD & W Ltd.New York, U.S.A.Tel. (1) 212 986-2900Fax (1) 212 986-2303E-mail: [email protected]: http//www.asm.com
Form 20-F
A copy of ASM International’s Form 20-F as filed with the U.S.Securities and Exchange Commissionis available without charge by writingto the Corporate CommunicationsOffice.
Primary Financial Statements
The primary financial statements ofthe Company are basically prepared inaccordance with statutoryrequirements in the Netherlands.Copies of these statutory financialstatements are available toshareholders on request.
Annual Meeting
The annual meeting of shareholderswill be held at 15.00 p.m.,May 23, 2001,at Hotel HeideparkJan Steenlaan 22-243723 BV BilthovenThe Netherlands
Corporate Offices
Jan van Eycklaan 103723 BC BilthovenThe NetherlandsTel. (31) 30 229 84 11Fax (31) 30 228 74 69
Financial Calendar for 2001
Q1 April 23, 2001Q2 July 23, 2001Q3 October 22, 2001
49

EUROPE
ASM International N.V.
Jan van Eycklaan 10
3723 BC Bilthoven
The Netherlands
Tel. (31) 30-229 84 11
Fax (31) 30-228 74 69
ASM Europe B.V.
Rembrandtlaan 9
3723 BG Bilthoven
The Netherlands
Tel. (31) 30-229 84 11
Fax (31) 30-229 38 23
ASM Belgium N.V.
Kapeldreef 75
B-3001 Leuven
Belgium
Tel. (32) 1628 1410
Fax (32) 1628 1221
ASM France SARL
1025, rue Henri Becquerel
Parc Club du Millénaire-Bat.14
34036 Montpellier Cedex 1
France
Tel. (33) 499-13 66 40
Fax (33) 467-64 27 78
ASM Germany Sales B.V.
Peter-Henlein-Strasse 28
85540 Haar
Germany
Tel. (49) 89-462 36 50
Fax (49) 89-462 365 66
ASM Italia SRL
Via IV Novembre 21
20041 Agrate Brianza (MI)
Italy
Tel. (39) 39-6892696
Fax (39) 39-6892696
ASM Microchemistry Oy
Kutojantie 2 B
FIN-02630 ESPOO
Finland
Tel. (358) 9 525 540
Fax (358) 9 525 54600
ASM United Kingdom Sales B.V.
1, The Courtyard,
Denmark Street, Wokingham
Berks RG40 2AZ
England
Tel. (44) 118-978 62 60
Fax (44) 118-977 45 18
ASM Assembly Products B.V.
Jan van Eycklaan 10
3723 BC Bilthoven
The Netherlands
Tel. (31) 30-229 84 11
Fax (31) 30-225 05 84
U.S.A.:
ASM America Inc.
3440 E. University Drive
Phoenix, Arizona 85034
Tel. (1) 602 470-5700
Fax (1) 602 437-1403
Central Regional Office
5446 Highway 290 West, Suite 107
Austin, TX 78735
Tel. (1) 512 892-9062
Fax (1) 512 892-9063
Western Regional Offices
97 E. Brokaw Road, Suite 100
San Jose, CA 95112
Tel. (1) 408 451-0830
Fax (1) 408 451-0835
12 Macomber Road
Danville, CA 94526
Tel. (1) 925 837 9200
Fax (1) 925 837 1494
Eastern Regional Offices
1018 Bethlehem Pike, Suite 203 A
P.O. Box 855
Spring House, PA 19477
Tel. (1) 215 646-7791
Fax (1) 215 646-8604
107 Crooked Trial Extension
Woodstock, CT 06281
Tel. (1) 860 974 1444
Fax (1) 860 974 3799
North Eastern Service Office
86 Pearl Street
Essex Junction, VT 05452
Tel. (1) 802 879-5255
Fax (1) 802 879-1301
North Western Service Office
3935 N.W. Aloclek Place
Building No. C300
Hillsboro, OR 97124-7114
Tel. (1) 503 533-0777
Fax (1) 503 533-4637
ASM Pacific Assembly Products Inc.
3440 E. University Drive
Phoenix, Arizona 85034
Tel. (1) 602 437-4760
Fax (1) 602 437-4630
ASM Pacific Assembly Products Inc.
Western Regional Office
97 E. Brokaw Road, Suite 100
San Jose, California 95112-4209
Tel. (1) 408 451-0800
Fax (1) 408 451-0808
ASM Worldwide
50