2000 california high school fast food survey: findings …
TRANSCRIPT

2000 CALIFORNIA HIGH SCHOOL FAST FOOD SURVEY:
Findings and Recommendations
February 2000
Public Health Institute
Prepared by:
Samuels & Associates
3900 Lake Shore Avenue
Oakland, CA 94610
For more information, contact:
Amanda Purcell, M.P.H.
Assistant Director
Food on the Run
Public Health Institute
P.O. Box 942732, MS 675
Sacramento, CA 94234-7320
(916) 445-3513
(916) 445-7571 fax
This survey was funded by a grant from The California Endowment

I
Executive Summary
BACKGROUND
Obesity has become an epidemic in the United States, affecting one-third of all adults. 1-2 Obesity
is also the most prevalent nutritional disease among youth with 27 percent of children and 21
percent of adolescents currently considered obese. 3-4 Concern about obesity among adolescents
has grown given studies that indicate a two-fold increase in the youth obesity rate over the past
two decades. 4-6 Obese adolescents face increased risks for many serious health problems that do
not commonly occur during childhood, including high blood cholesterol levels, abnormal glucose
tolerance, and high blood pressure. 7-8 These are compounded by discrimination, psychological
stress, poor body image, and low self-esteem. 8-9 More than 80 percent of obese adolescents
remain obese as adults, with even more severe consequences including heart disease, cancer and
type 2 diabetes. 10-11
Although genetics can play an important role in obesity, dietary factors are also essential
components. Poor diet has been found to adversely influence the ability to learn and to decrease
motivation and attentiveness. 12 Such findings indicate that young people will not be ready to
learn and achieve their full potential unless they are well nourished and healthy. Fast foods,
available both on and off school campuses, may be an important part of this complex problem due
to their limited nutritional value and high levels of fat, salt, and sugar. 13
The Public Health Institute commissioned the 2000 California High School Fast Food Survey to
describe the prevalence of fast foods on California high school campuses and student access to
healthy foods at school. Findings from the survey will be used by public health programs such as
California Project LEAN (Leaders Encouraging Activity and Nutrition), California Adolescent
Nutrition and Fitness Program (CANFit) and the Southern California Public Health Association,
in their work on adolescent nutrition and physical activity issues.
The 2000 California High School Fast Food Survey sought to describe the types of fast food
being sold on California high school campuses, the factors that influence such sales, and the
economic and policy issues associated with them. The study included a literature review, a self-
II
administered survey to all (323) district-level food service directors with a high school in their
district, and a follow-up phone interview with 50 food service directors responding to the survey.
While the survey uses only self-reported data from voluntary participants and cannot be assumed
to represent all California public high schools, many of its findings are similar to those of a 1996
study conducted by the U.S. General Accounting Office.14
FINDINGS
Surveys were returned by 171 school districts that represent 345 high schools. Responding
districts serve 16 percent of California’s 1.7 million public high school students. Just under half of
the schools represented by the responding districts (44 percent; 153) report that 40 percent or
more of their student body is eligible for free or reduced-price meals from the U.S. Department of
Agriculture’s National School Lunch Program (NSLP). NSLP subsidizes nutritionally healthy
meals at participating schools. In slightly more than a third of the schools that serve a substantial
number of low-income students, fewer than 40 percent of the students participate in the NSLP.
Campuses that do not allow students to leave the grounds during lunch have a higher participation
rate in the NSLP than campuses that allow students to leave at lunchtime.
At 71 percent of the school districts surveyed, a la carte items, including pizza, hamburgers,
submarine sandwiches, french fries, chips, cookies, yogurt, bagels, ice cream, and sodas,
accounted for up to 70 percent of all food sales at the school. Brand-name products proliferate:
more than half the schools either carry Taco Bell, Subway, Dominos, Pizza Hut, or other branded
foods. Many school districts also sell healthier a la carte items. More than half offer fruit, yogurt,
bagels, and packaged salads. A la carte items are primarily sold from free-standing vending
machines, fast food carts, and snack bars. Of the high schools that sell a la carte items, more than
half sell them in the cafeteria.
A growing trend, present in 14 percent of the responding districts, is to market fast foods under a
district brand name, with foods either prepared by the district or purchased as generic items from
a vendor. When the district controls the production, it can modify the foods to be healthier, for
example, by using low-fat cheese on pizza and low-fat beans in burritos. Fifty-four percent of the
districts sell modified versions of traditional fast foods.
III
Nearly two-thirds of the districts that sell a la carte items reported that the main reason they do so
is because students like them. Nearly 30 percent said these items add variety, and another 30
percent said sales of these items keep the food service program operating in the black. About
one-fourth said the foods are popular, affordable, and can adhere to nutritional guidelines. Others
identified the constraints of a short lunch period or lack of facilities, personnel, and food options
as the main reasons for offering students a la carte foods.
More than 85 percent of the districts that sell fast foods as a la carte items use the profits from
sales of these foods to support their food service operations. Others use the profits to support
other aspects of school functioning, including extracurricular activities, athletics, and educational
programs.
Only a few of the districts actually contract with a vendor to operate a fast food concession. In a
few other instances, a school organization such as a student club or student council shares profits
with a vendor on campus.
At least 72 percent of the responding districts allow fast food and beverage advertising such as
posters, advertisements on scoreboards, and other signage on high school campuses. Only 13
percent prohibit such advertising. Twenty-four percent of the districts that allow advertising have
contracted promotional rights to a fast food or beverage company in exchange for cash or
equipment.
In addition to the financial aspects, some food service directors characterized fast food sales as a
tactic for keeping their student customers eating at the school; others felt high school students
were old enough to make their own choices among the array of foods offered, including fast
foods. Still others felt that education about healthy eating should begin with parents; some
bemoaned the contradictions between the nutrition education the school was trying to imbue and
the food being offered.
In a few school districts, food service directors, parents, or politicians have attempted to limit fast
food sales by decreasing the number of days fast foods are available or by increasing the use of
organic produce and milk.

IV
CONCLUSIONS
Over the past ten years, fast foods have become a staple on high school campuses. Consideration
must be given to the impact these foods have on the diets of teens now and the life-long eating
habits they develop. Food service directors are hard pressed to find a balance between providing
adolescents with healthy food choices that meet their nutritional needs, satisfying their student
customers, and running a financially stable business.
Further research is needed on student food preferences, the reasons behind their food selections at
school, reasons for students’ low participation in the NSLP, and the availability and affordability
of healthier food items for purchase by food service directors.

V
RECOMMENDATIONS
• Promote the link between a nutritious diet and learning.
• Investigate the reasons that students do not participate in the National School
Lunch Program. Develop strategies to increase participation.
• Offer students more healthy foods that are just as convenient, inexpensive and
appealing as fast foods.
• Involve students in choosing the healthy foods available in their school through
taste tests, surveys, and classroom activities.
• Hold forums that inform students, parents, decision-makers, and the community
about the effect of fast food on health.
• Examine the use of schools as a channel for food and beverage company
promotions.
• Explore new opportunities to generate support and revenue that are not based on
the sale of unhealthy foods.
VI
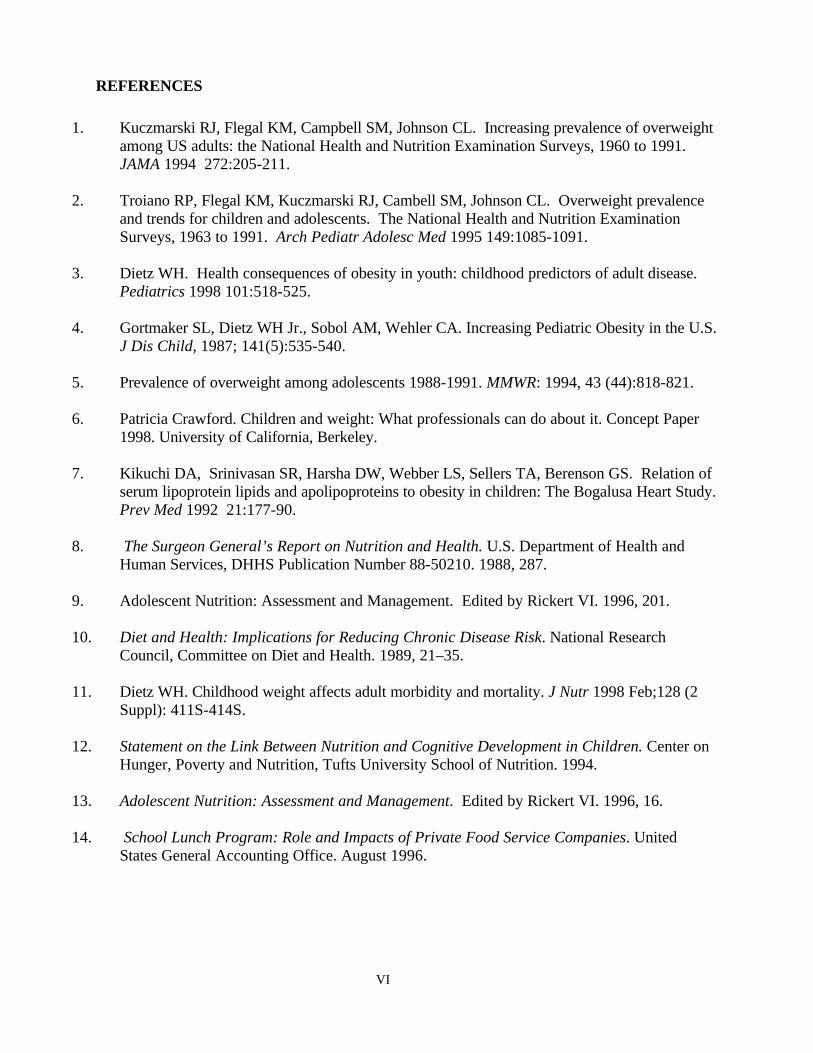
REFERENCES
1. Kuczmarski RJ, Flegal KM, Campbell SM, Johnson CL. Increasing prevalence of overweight
among US adults: the National Health and Nutrition Examination Surveys, 1960 to 1991. JAMA 1994 272:205-211.
2. Troiano RP, Flegal KM, Kuczmarski RJ, Cambell SM, Johnson CL. Overweight prevalence
and trends for children and adolescents. The National Health and Nutrition Examination Surveys, 1963 to 1991. Arch Pediatr Adolesc Med 1995 149:1085-1091.
3. Dietz WH. Health consequences of obesity in youth: childhood predictors of adult disease.
Pediatrics 1998 101:518-525. 4. Gortmaker SL, Dietz WH Jr., Sobol AM, Wehler CA. Increasing Pediatric Obesity in the U.S.
J Dis Child, 1987; 141(5):535-540. 5. Prevalence of overweight among adolescents 1988-1991. MMWR: 1994, 43 (44):818-821. 6. Patricia Crawford. Children and weight: What professionals can do about it. Concept Paper
1998. University of California, Berkeley. 7. Kikuchi DA, Srinivasan SR, Harsha DW, Webber LS, Sellers TA, Berenson GS. Relation of
serum lipoprotein lipids and apolipoproteins to obesity in children: The Bogalusa Heart Study. Prev Med 1992 21:177-90.
8. The Surgeon General’s Report on Nutrition and Health. U.S. Department of Health and
Human Services, DHHS Publication Number 88-50210. 1988, 287. 9. Adolescent Nutrition: Assessment and Management. Edited by Rickert VI. 1996, 201. 10. Diet and Health: Implications for Reducing Chronic Disease Risk. National Research
Council, Committee on Diet and Health. 1989, 21–35. 11. Dietz WH. Childhood weight affects adult morbidity and mortality. J Nutr 1998 Feb;128 (2
Suppl): 411S-414S. 12. Statement on the Link Between Nutrition and Cognitive Development in Children. Center on
Hunger, Poverty and Nutrition, Tufts University School of Nutrition. 1994. 13. Adolescent Nutrition: Assessment and Management. Edited by Rickert VI. 1996, 16. 14. School Lunch Program: Role and Impacts of Private Food Service Companies. United
States General Accounting Office. August 1996.

1
2000 California High School Fast Food Survey
INTRODUCTION
Obesity has become an epidemic in the United States. 1-2 It is the most prevalent nutritional
disease among children and adolescents. 3-4 Concern about adolescent obesity has grown given
studies that indicate a two-fold increase in the youth obesity rate over the past two decades. 4-6
Research shows that obese adolescents become obese adults. According to the National Research
Council, more than 80 percent of obese adolescents remain obese as adults.7 Obese teens face an
increased risk of many serious health problems that do not commonly occur during childhood,
including high blood cholesterol levels, abnormal glucose tolerance, and high blood pressure.8-9
Adolescent health problems related to obesity can lead to chronic diseases in adulthood, such as
heart disease, cancer, and type 2 diabetes.7-8 Obese adolescents also suffer from discrimination
psychological stress, poor body image, and low self-esteem.10-11 Research indicates a clear link
between nutrition and learning. Poor diets have been found to adversely influence the ability to
learn and have been shown to decrease motivation and attentiveness12. These findings indicate
that young people will not be ready to learn and achieve their full potential unless they are well
nourished and healthy.
Although a number of factors, including genetics, contribute to the rising rate of adolescent
obesity, there is consensus among medical professionals that poor diet plays an important role.
For the most part, teens in the United States follow eating patterns that do not meet national
dietary recommendations. Over 84 percent consume more than the recommended 30 percent of
daily calories from fat13, and 90 percent exceed the recommendation for no more than 10 percent
of daily calories from saturated fat.14 Fewer than five percent of teens eat the recommended five
daily servings of fruits and vegetables.14 Some experts believe that poor teen diets have been
influenced by the easy availability of fast foods high in calories and fat.15 Over the past decade, fast foods have become increasingly common on high school campuses.
The General Accounting Office reported that brand name fast foods were found in 13 percent of
schools nationwide in 1996, an increase from 2 percent of schools in 1990-91.16 Fast food sales
have generated revenues that support food service operations and other school activities.
However, the availability of fast food on high school campuses may contribute to the poor quality
of student diets and negatively affect teen food choices, both in and out of school. Further, fast
food at school may undermine nutrition education messages presented at school and may affect
the lifelong eating habits of students.

2
BACKGROUND The Public Health Institute commissioned the health program, policy, and research firm of
Samuels & Associates to conduct the 2000 California High School Fast Food Survey. The
purpose of the survey is to describe the prevalence of fast foods on California high school
campuses and student access to healthy foods at school. Findings from the survey will be used by
public health programs such as California Project LEAN (Leaders Encouraging Activity and
Nutrition), California Adolescent Nutrition and Fitness Program (CANFit) and the Southern
California Public Health Association, in their work on adolescent nutrition and physical activity
issues.
Three primary research objectives guided this study:
• To determine the extent of fast food sales on high school campuses.
• To assess the factors that influence fast food sales on high school campuses.
• To identify the economic and policy issues associated with fast food sales on high
school campuses.
The study utilized a mixed-method approach: a literature review to identify priorities, a self-
administered survey of all district-level food service directors with at least one public high school
in their district, and a follow-up phone interview with a limited sample of food service directors
who responded to the self-administered survey.
These survey findings provide preliminary data about the prevalence of fast food sales and a
framework within which the health, economic, social, and policy implications associated with fast
foods on high school campuses can be examined.
TERMINOLOGY
The following terms are used in this report:
Fast Foods: These include a wide variety of foods such as popular entrees like pizza and tacos, as
well as items such as cookies, chips, and pastries. Fast foods are classified as branded and non-
branded items.
Branded Foods: Items sold under a recognized retail brand name such as Domino’s Pizza or
Taco Bell.

3
Non-branded Foods: Generic items that are not sold under a brand name.
Food Service: The department within the school district or school that operates the school
breakfast and/or lunch program. This includes the operation of the National School Lunch
Program. The Food Service Department also may be referred to as the Child Nutrition Program.
National School Lunch Program (NSLP): This program, administered by the United States
Department of Agriculture (USDA) in cooperation with state and local education agencies,
subsidizes the cost of preparing and serving meals at participating schools. The NSLP assures
that lunch is available to all students at participating schools and that the meals meet specific
nutritional requirements.
Free or Reduced-Price Lunch: Students are eligible for a free NSLP meal if their family income
is 130 percent of the federal poverty level or below. Students are eligible for a reduced price
NSLP meal if their family income is between 130 percent and 185 percent of the federal poverty
level. Students who do not meet the family income requirements for a free or reduced price
lunches are allowed to purchase the NSLP meal at full price.
A La Carte: Foods sold individually and not as part of a complete NSLP meal. A la carte items
are exempt from the dietary guidelines to which the NSLP meals must adhere. A la carte items
may include fast foods.
Open Campus: On an open campus, students are allowed to leave during break periods and
lunch.
Closed Campus: A closed campus does not allow students to leave during the school day.
SURVEY METHODOLOGY
A self-administered survey instrument was created and pre-tested with a small sample of food
service directors. The survey included 19 multiple-choice questions and one open-ended
question. The survey was designed to take no more than 15 minutes to complete. Survey
questions focused on the following topics regarding food sales on high school campuses within
the respondent’s district:
• Availability of fast food

4
• Specific locations and times for fast food sales
• Economic issues associated with fast food sales
• Policy issues associated with fast food sales
• Identification of the decision makers involved with fast food sales
• Sales of branded versus non-branded fast foods
• Fast food advertising and promotion rights
The survey was mailed to all food service directors in California with at least one high school in
their district (n=323) in March 1999. Only public school districts were included and a self-
addressed stamped envelope was provided for return of the survey. To enhance the survey
response rate, a second mailing of the survey was sent to all non-respondents approximately three
weeks after the initial mailing. As an incentive to respond, food service directors were offered a
free cookbook featuring recipes from premiere California chefs and a summary of the survey
results.
Brief follow-up telephone interviews, 5 to 15 minutes long, were conducted with 50 food service
directors who responded to the self-administered survey. The interview sample was designed to
include a geographic mix of districts, with representation from urban, rural, and suburban
communities. The telephone interviews provided more detailed, qualitative data on the factors
that influence fast food sales and experiences with promoting and limiting fast food sales.
Survey data were cleaned, entered, and frequencies were calculated using the Statistical Analysis
System.
SURVEY LIMITATIONS
Consideration of the findings from this survey should take into account the following study
limitations:
• The survey uses only self-reported data.
• A validity study was not conducted with the survey instrument.
• Response to the survey was on a voluntary basis.
• The authors did not collect information on the non-respondents and do not know
how their responses would have differed from the surveys completed.
• The survey sample is not representative of all California public high schools and
therefore is not generalizable to all high schools.
5
SURVEY FINDINGS
A. Response Rate
Surveys were mailed to 323 California school districts that contain at least one high school. After
a second mailing was sent to non-respondents, 171 completed surveys were received, resulting in
a response rate of 53 percent. The responding districts represent 345 high schools with 264,595
high school students which is 16 percent of California’s 1,659,030 public high school students.
B. Profile of Responding School Districts
A number of data elements were collected to describe the responding districts and the high
schools within them. Profile information included the number of high schools in the district,
whether the high school campuses are open or closed, the percentage of students eligible for free
or reduced-price meals, the student participation rate in the NSLP, and the percentage of food
sales accounted for by a la carte items.
Number of Schools in the District
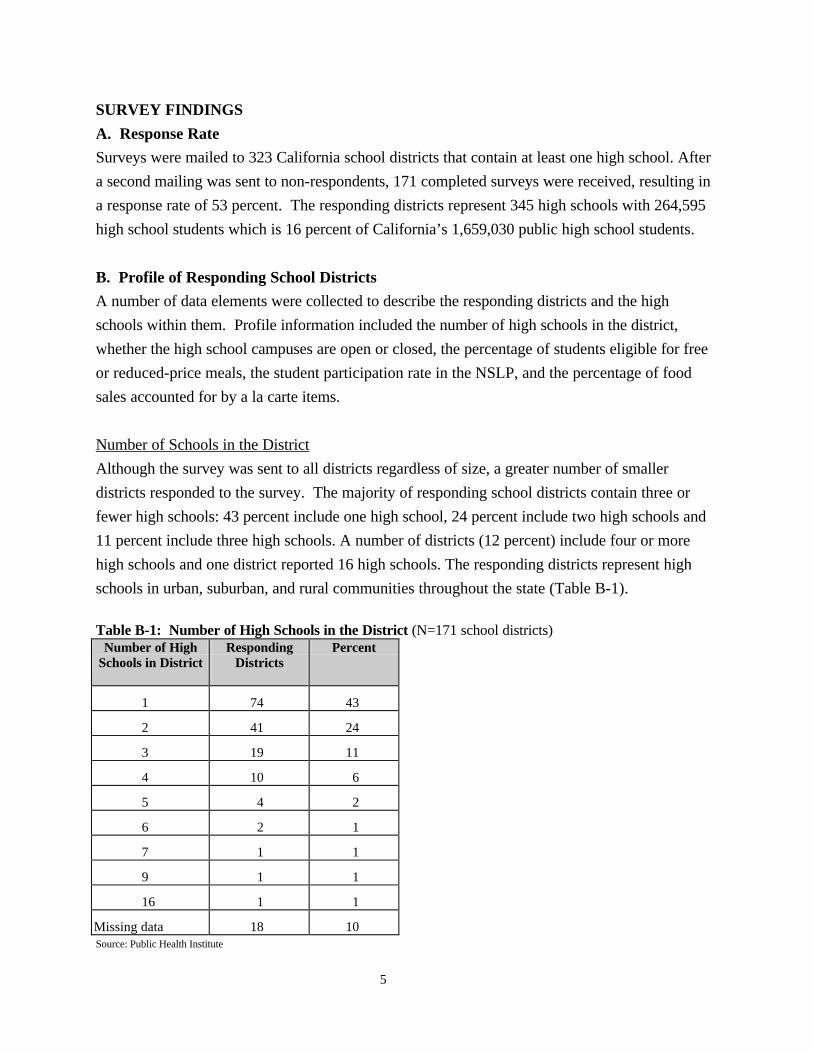
Although the survey was sent to all districts regardless of size, a greater number of smaller
districts responded to the survey. The majority of responding school districts contain three or
fewer high schools: 43 percent include one high school, 24 percent include two high schools and
11 percent include three high schools. A number of districts (12 percent) include four or more
high schools and one district reported 16 high schools. The responding districts represent high
schools in urban, suburban, and rural communities throughout the state (Table B-1).
Table B-1: Number of High Schools in the District (N=171 school districts)
Number of High Schools in District
Responding Districts
Percent
1 74 43
2 41 24
3 19 11
4 10 6
5 4 2
6 2 1
7 1 1
9 1 1
16 1 1
Missing data 18 10 Source: Public Health Institute

6

7
Campus Status: Open or Closed
Respondents were asked to report if the high schools in their districts had open or closed
campuses (Table B-2). Just under half of the schools in the responding districts have open
campuses. Table B-2: Open or Closed Campus (N=345 High Schools) Type of Campus Schools Percent*
Closed 182 53
Open 157 46
Missing data 6 2 * Does not total 100 percent due to rounding
Source: Public Health Institute
Percentage of the Students Eligible for Free or Reduced-Price Meals
Students are eligible for a free NSLP meal if their family income is at or below 130 percent of the
federal poverty level. Students are eligible for reduced-price NSLP meals if their family income is
between 130 percent and 185 percent of the federal poverty level. Just under half of the schools
represented by the responding districts (44 percent; 153) report that 40 percent or more of their
student body is eligible for free or reduced-price meals, indicating that these schools are serving
communities with a significant portion of children living in poverty
(Table B-3).
Table B-3: Percentage of Students Eligible for Free or Reduced-Price Meals (N=345 High Schools) Percent of eligible students
Schools Percent
0-39% 175 51
40-69% 119 34
70-100% 34 10
Missing Data 17 5 Source: Public Health Institute
Participation in the National School Lunch Program
Meals served as part of the NSLP must adhere to nutritional requirements that reflect the United
States government’s recommendations for a healthy diet. Significant progress has been made in
improving the nutrient profile of the NSLP meals. However, most high school students do not
appear to be eating the NSLP meal. Students who are not participating in the NSLP are choosing
foods that are not regulated for nutrient content, increasing the likelihood that these foods will not
meet dietary recommendations and will be higher in fat, sodium, and sugar.

8
Survey respondents were queried as to overall student participation in the NSLP at each high
school in their district (Table B-4). Fifty-six percent of schools have student participation rates
below 40 percent. One-third of schools have student participation rates ranging from 40 percent
to 69 percent, and only fourteen high schools have a 70 percent participation rate or higher.
Participation in the NSLP is higher at schools with a closed campus. Forty-seven percent of
closed campuses versus 30 percent of open campuses have NSLP participation over 40 percent
(Table B-5). Participation in the school lunch program is highest at schools where more than 40
percent of the students are eligible for free or reduced-price meals. Of these schools, 62 percent
have student participation rate over 40 percent (Table B-6).
Table B-4: Student Participation in the National School Lunch Program (N=345 high schools) Student Participation Rate in NSLP
Schools Percent
0-39% of all students 194 56
40-69% 118 34
70-100% 14 4
Missing Data 19 6% Source: Public Health Institute Table B-5: Participation in the National School Lunch Program—Open vs. Closed Campuses** (N=339 high schools)
OPEN CAMPUS
CLOSED CAMPUS Student Participation Rate in NSLP
Schools Percent Schools Percent*
0%-39% 105 67 89 49
40%-69% 46 29 72 40
70%-100% 2 1 12 7
Missing data 4 3 9 5 * Does not total 100 percent due to rounding ** Six schools did not report whether campus was open or closed
Source: Public Health Institute
Table B-6: Participation in the National School Lunch Program of High Schools with 40 percent to 100 percent of Students Eligible for Free or Reduced-Price Lunch (N=153 high schools)
Participation Rate: Schools with 40%- 100% of Students Eligible for Free or Reduced-Price Meals
Schools Percent
0-39% of students 58 38
40-69% 82 54
70-100% 13 8 Source: Public Health Institute

9
Percentage of Overall Food Sales Accounted for by A La Carte Items
A la carte items account for a substantial portion of food sales on high school campuses.
Examples of a la carte items include fast food items such as pizza, hamburgers, submarine
sandwiches, french fries, chips, cookies, yogurt, bagels, ice cream, and sodas. A la carte items are
sold separately from the NSLP meal and, thus, are exempt from the federal dietary guidelines to
which the NSLP meals must adhere. As a result, a la carte items are often higher in fat, sodium,
and sugar than the items offered as part of the NSLP meal.17 Nearly 60 percent of respondents say
a la carte sales account for more than 40 percent of their total food sales (Table B-7).
Table B-7: Percentage of Overall Food Sales Accounted for by A La Carte Items (N=345 high schools) Percent of Sales from A La Carte Food
Schools Percent
0-39% 123 36
40-69% 121 35
70-100% 80 23
Missing data 21 6 Source: Public Health Institute
C. Current Fast Food Sales
A series of questions was asked regarding current a la carte fast food sales. Fast foods were
loosely defined as branded and non-branded items, including entrees and snack foods such as
chips, cookies, and pastries. Respondents were asked to choose their responses from a list of
common fast food items. The findings create a snapshot of the type, location, and frequency of
fast food sales in the responding high schools.
Fast Foods Sold as A La Carte Items
Ninety-five percent of responding districts reported selling fast foods as a la carte items. These
include a variety of foods, including entrees, snacks, and desserts. The most common fast foods
sold as a la carte items are pizza, cookies, chips, and burritos (Table C-1). Traditionally, these
foods are high in total fat, saturated fat, and sodium. Few of these foods include fruits,
vegetables, or whole grains.
Seven (four percent) of the responding districts do not sell a la carte items. These are primarily
small districts located in rural communities.

10
Table C-1: Fast Foods Sold as A La Carte Items (N=171 school districts. Respondents selected all that apply.)
Fast Foods Sold as A La Carte Items Districts Percent
Pizza 149 87
Cookies 147 86
Chips 144 84
Burritos 142 83
Hamburgers 120 70
Nachos 115 67
Donuts 103 60
Cinnamon rolls 91 53
Pastries 91 53
Corn dogs 88 52
French fries (fried, not baked) 86 50
Hot dogs 72 42
Fried chicken sandwich/nuggets 67 39
Tacos 50 29
Taquitos 32 19
Fried fish sandwich/nuggets 22 13
Other fast food items 8 5
Soda 6 4
Ice cream 3 2
Don't sell a la carte items 7 4 Source: Public Health Institute
Fast Food Brands
Three brands are most prevalent in California high school districts (Table C-2). Represented in
the survey are Taco Bell (sold in more than half of the districts), Subway sandwiches (sold in
more than 20 percent of the districts), and Domino’s Pizza (sold in nearly 20 percent of the
districts). Sixteen percent of the districts sell non-branded fast foods such as pizza and burritos.
Fourteen percent of districts are part of a growing trend, the sale of fast food items under the
school district’s own brand name. These districts create and copyright their own brand name,
logo, and food product line. District-branded foods are either prepared by the district, or are
purchased as generic items from a vendor. Districts successfully using this tactic have found that

11
these foods sell well because the students feel a sense of ownership of the district brand and
quickly develop brand loyalty.18
Table C-2: Fast Food Brands (N=171 school districts. Respondents selected all that apply.)
Fast Food Brands Districts Percent
Taco Bell 91 53
Subway 38 22
Dominos 32 19
Non-branded fast foods 28 16
Other pizza brands 27 16
Pizza Hut 24 14
School district brand food 24 14
Round Table pizza 19 11
McDonalds 14 8
Little Caesars 14 8
Kentucky Fried Chicken 5 3
Burger King 3 2
Arby's 3 2 Other fast food brands chosen by less than 3 respondents 26 15
Source: Public Health Institute
Where are Fast Foods Sold as A La Carte Items?
Among those districts that sell a la carte fast food (N=164), the snack bar is the most popular
location (Table C-3). Three-quarters of the responding districts use stands or small portable food
carts to sell fast foods. But just over half of the districts also sell a la carte fast food items in the
cafeteria.

12
Table C-3: Where are fast foods sold as a la carte items? (N=164 school districts. Respondents selected all that apply.)
Locations Districts
Percent
Snack bar 128 78
Fast food cart 106 65
Cafeteria 93 57
Fast food stand 18 11
Coffee cart 9 6
Vending machine 4 2
Campus or student store 3 2
Other 3 2 Source: Public Health Institute
When are Fast Foods Sold?
Fast foods are most commonly sold during the morning and afternoon breaks and for lunch (Table
C-4). One in ten districts sells a la carte fast foods during after-school activities. Eight percent of
districts sell a la carte fast food items during fundraisers.
Table C-4: When are fast foods sold? (N=164 school districts. Respondents selected all that apply.)
Times food sold Districts
Percent
During lunch 152 93
During morning/afternoon break 129 79
During after school activities 17 10
During fundraisers 13 8
During other times 2 1 Source: Public Health Institute
D. Healthy A La Carte Items
Most school districts sell a variety of healthy a la carte items, and a number of districts are re-
working standard fast food recipes to improve the nutrient profile.
Healthy A La Carte Items Sold
A number of districts offer a la carte items that tend to have a lower fat content or contain fruits
or vegetables. The majority of respondents list fruit, yogurt, bagels, and packaged salads among
their a la carte selections (Table D-1).

13
Table D-1: Healthy A La Carte Items (N=164 school districts. Respondents selected all that apply.)
Healthy A La Carte Items Districts
Percent
Fruit 133 81
Yogurt 118 72
Bagels 111 68
Packaged salads 103 63
Other a la carte items 30 18
Sandwiches 6 4 Source: Public Health Institute
Modified Fast Food Recipes
More than half of the districts that sell a la carte fast foods have modified traditional fast food
recipes to meet dietary guidelines that recommend no more than 30 percent of daily calories from
fat, including no more than 10 percent of daily calories from saturated fat (Table D-2). Common
modifications include substituting low-fat cheese for full-fat cheese on pizza and filling burritos
with up to a half cup of low-fat beans.
The majority of districts that modify fast foods are selling these modified foods as both NSLP and
as a la carte items (Table D-3).
Table D-2: Has Your District Modified Fast Food Recipes? (N=164 school districts) Modified Fast Food Recipes
Districts
Percent
Yes 88 54
No 67 41
Don’t know 4 2
Missing data 5 3 Source: Public Health Institute Table D-3: How are Modified Fast Food Items Sold? (N=88 school districts. Respondents selected all that apply) How modified fast food items are sold.
Districts
Percent
Both a la carte and in NSLP 54 61
Part of NSLP only 27 31
A la carte items only 7 8 Source: Public Health Institute
14
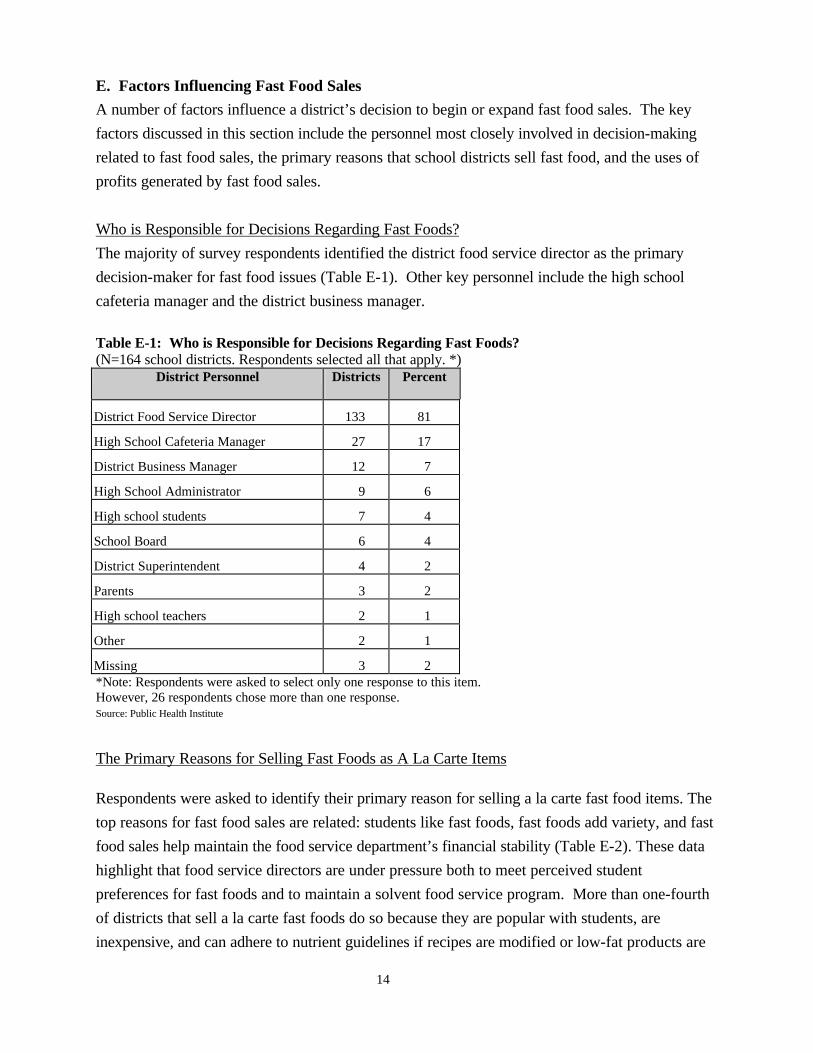
E. Factors Influencing Fast Food Sales
A number of factors influence a district’s decision to begin or expand fast food sales. The key
factors discussed in this section include the personnel most closely involved in decision-making
related to fast food sales, the primary reasons that school districts sell fast food, and the uses of
profits generated by fast food sales.
Who is Responsible for Decisions Regarding Fast Foods?
The majority of survey respondents identified the district food service director as the primary
decision-maker for fast food issues (Table E-1). Other key personnel include the high school
cafeteria manager and the district business manager.
Table E-1: Who is Responsible for Decisions Regarding Fast Foods? (N=164 school districts. Respondents selected all that apply. *)
District Personnel Districts
Percent
District Food Service Director 133 81
High School Cafeteria Manager 27 17
District Business Manager 12 7
High School Administrator 9 6
High school students 7 4
School Board 6 4
District Superintendent 4 2
Parents 3 2
High school teachers 2 1
Other 2 1
Missing 3 2 *Note: Respondents were asked to select only one response to this item. However, 26 respondents chose more than one response. Source: Public Health Institute
The Primary Reasons for Selling Fast Foods as A La Carte Items
Respondents were asked to identify their primary reason for selling a la carte fast food items. The
top reasons for fast food sales are related: students like fast foods, fast foods add variety, and fast
food sales help maintain the food service department’s financial stability (Table E-2). These data
highlight that food service directors are under pressure both to meet perceived student
preferences for fast foods and to maintain a solvent food service program. More than one-fourth
of districts that sell a la carte fast foods do so because they are popular with students, are
inexpensive, and can adhere to nutrient guidelines if recipes are modified or low-fat products are

15
selected. Seventeen percent of respondents identified the constraints of a short lunch period as
their primary reason for selling a la carte items. Food service directors participating in the phone
surveys also mentioned time constraints as an important factor in the decision to sell a la carte fast
foods. Other factors include lack of facilities, personnel, and food options. Table E-2: The Primary Reasons for Selling Fast Foods as A La Carte Items (N=164 school districts. Respondents selected all that apply.*)
Reasons for Fast Food Sales Districts
Percent
Students like fast food 106 65
Keep food service out of red 47 29
Fast foods add variety 46 28
Affordable, popular and can adhere to guidelines 43 26
Brief amount of time for meals 27 17
No adequate prep facilities 27 16
Food service is short staffed 19 12
Limited availability of commodities 4 2
Other reasons for fast food 3 2
Missing 2 1 *Note: Respondents were asked to select only one response to this item. However, 64 respondents chose more than one response. Source: Public Health Institute
Utilization of Fast Food Profits
Eighty-eight percent (144) of the districts that sell a la carte fast foods use profits from sales of
fast foods to support food service operations (Table E-3). In the telephone interviews, a number
of food service directors reported that profits from fast food and other a la carte sales often
subsidize preparation of the reimbursable lunch. Others use the profit to support other aspects of
school functioning, including extracurricular activities, athletics, and educational programs.

16
Table E-3: Utilization of Fast Food Profits (N=164 school districts. Respondents selected all that apply.)
Uses for Fast Food Profits Districts
Percent
Supports food service operations 144 88
Supports facilities and equipment 39 24
Supports extracurricular activities 11 7
Supports athletic department 6 4
Supports expanded educational programs 4 2
Other 4 2 Source: Public Health Institute
F. Concessions, Advertising, and Promotional Contracts
Concession Contracts with Fast Food Vendors
Seven percent (12) of the responding food service departments contract with a vendor to operate
a fast food concession (Table F-1). Of the 12 districts that operate vendor concessions, there
does not appear to be a single brand-name vendor dominating the market. However, pizza
vendors are the most common, with nine (75 percent) of the concessions operated by pizza
vendors (Table F-2).
Table F-1: Do you have a Concession Contracted to a Fast Food Vendor? (N=164 school districts) Concession Contract Districts
Percent
Yes 12 7
No 152 93 Source: Public Health Institute
Table F-2: Vendors Operating Concessions on High School Campuses (N=12 school districts)
Vendors Districts
Percent
Other branded pizza concessions 4 33
Little Caesar’s 3 25
Taco Bell 2 17
Pizza Hut 2 17
Subway 1 8 Source: Public Health Institute

17
School Organizations Contracting Concessions to a Fast Food Vendor
In 16 percent (N=27) of the districts that sell a la carte items, an organization other than the food
service department holds a contract with a fast food vendor (Table F-3). These contracts specify
a profit-sharing arrangement where both the vendor and the school organization benefit from the
vendor’s presence on campus. Student clubs, such as the Associated Student Body, are the most
common organizations to contract with a fast food concessionaire.
Table F-3: Other School Organizations Contracting Concessions to a Fast Food Vendor (N=164 school districts. Respondents selected all that apply.)
School Organizations Districts
Percent
Student clubs 13 8
Booster groups 5 3
Other concession contracts 4 2
PE department 3 2
PTA 2 1
Food service contracts with vendors only 137 84 Source: Public Health Institute
Fast Food and Beverage Advertising on High School Campuses
The types of fast food and beverage advertising most commonly found on high school campuses
are posters and advertisements on scoreboards and other signage (Table F-4). Thirteen percent of
the responding districts do not allow advertising on campus.

18
Table F-4: Fast Food and Beverage Advertising on High School Campuses (N=171 school districts. Respondents selected all that apply.)
Types of Advertising Districts
Percent
Posters 66 39
Ads on scoreboards or signs 48 28
Ads in school paper 9 5
Ads over PA system 6 4
Ads on vending machine 5 3
Ads on menu 3 2
Ads on school radio 2 1
Ads on the school TV 1 1
Other types of advertising 1 1
Advertising not allowed 22 13
Missing 26 15 Source: Public Health Institute
Promotion Rights Contracted to Fast Food and Beverage Companies
Twenty-four percent of responding districts contracts promotion rights to a fast food or beverage
company (Table F-5). Districts that contract promotion rights receive money or equipment in
exchange for the company’s right to sell their products on campus and to place the company’s
name and logo on school equipment and facilities. The most common promotion among the
districts surveyed is the display of brand names on school facilities, and at school events
(Table F-6).
Table F-5: Has Your District Contracted Promotion Rights to a Fast Food or Beverage Company? (N=171 school districts)
Contracted Promotion Rights
Districts Percent
Yes 41 24
No 114 67
Don’t know 12 7
Missing data 4 2 Source: Public Health Institute

19
Table F-6: Types of Fast Food and Beverage Promotions (N=41 school districts. Respondents selected all that apply.) Promotion Types Districts
Percent
Brand names on facilities and equipment 28 68
Sponsorship of school events 22 54
Retail coupons 2 5
Food tastings 1 2
Other 2 5 Source: Public Health Institute
G. Philosophy Regarding Fast Food Sales
Fast foods are extremely common on the California high school campuses included in the survey
responses. Although most of the districts sell fast foods, food service directors have varying
philosophies regarding their sale. Many food service directors wholeheartedly endorse fast food
sales because they vastly improve food service profit margins and allow food service departments
to become the district’s “cash cow” rather than the district’s “cash drain.” A number of food
service directors feel that fast foods greatly expand the food selection available to students on
campus and that fast foods can be part of a carefully chosen well-balanced diet. The following
comments from the survey respondents illustrate this viewpoint:
• “[Fast food sales are] an excellent way to boost all around sales. [They] help to ease the
workload when short staffed. Most companies are willing to assist with school promotions by
supplying ads or contest awards.”
• “If we do not supply the students with the items they want, they will leave the campus. Some
do not return after lunch. Students are safer on campus.”
• “As long as they are priced correctly and students buy them, I’m all for fast foods.”
• “High school students have established eating habits. We supply students with a choice and
we believe they are old enough to responsibly make that choice. Our program provides
nutritious meals in the national school lunch and breakfast program and a la carte.”

20
Other food service directors view fast food as a necessary evil. They do not like selling fast
foods, but feel compelled to continue to maintain profit margins and to keep their customers, the
students, happy.
• “We have tried several healthy a la carte choices and the student response was extremely
poor. We will lose them as our customers if we do not offer what they want.”
• “Fast foods are part of the high school generation. I would prefer other types of meals but the
students don’t eat them. They have been brought up on fast food. We need to educate
parents about nutritious foods in order for them to pass it [this information] on to their
children.”
• “As a district that participates in the SHAPE project [Shaping Health as Partners in
Education—a statewide effort to promote comprehensive school nutrition services, including
healthy meals and nutrition education], I don’t feel fast foods promote the same healthy
philosophy we are trying to attain.”
• “[Fast foods are a] very necessary evil. It helps pay all of the bills in food services and allows
some money to go to special events.”
As mentioned earlier, a number of school districts are serving items that look like traditional fast
foods but are lower in fat, higher in protein, and include fruits and vegetables. The districts
selling these items have had a positive response from students and the school community. They
feel strongly that these types of fast foods satisfy both customer satisfaction and nutrition
requirements.
• “Fast foods are popular and are what the students like. We choose healthy ones and buy as
low-fat as we can.”
• “My food service student [assistants] assist in food preparation so we can offer lots of yummy
good-for-you specials. Today, they made grilled veggie wraps on homemade flat bread and
Turkey Cutlets California [with guacamole and jack cheese on French bread].”
• “Fast food, particularly school-produced fast food, can be nutritious, meet the dietary
guidelines, and appeal to our student customers.”

21
• “Fast food is the food of choice for our students. Food and nutrition services want to provide
fast foods to our students that meet the nutrition standards. This creates a positive halo effect
for our department among our students and the community in regard to our business.”
H. Attempts to Reduce or Curtail Fast Food Sales
Most of the food service directors surveyed are not attempting to curtail or reduce fast food sales.
They believe the loss in revenue would severely hamper the food service department’s ability to
operate as a financially sound business.
Fifteen percent of the school districts reported attempts to reduce or curtail fast food sales. These
attempts were initiated by food service directors, parents, teachers, and in one case, a local
politician and community members. Strategies to reduce or curtail sales include decreasing the
frequency of fast food sales to one or two days a week. For example, in one district, french fries
are sold only once a week and nachos are sold only twice a month. Another district has a policy
mandating the use of organic foods, specifically produce and milk.
I. Student Input Into Foods Sold
Food service directors take student input on food selections very seriously. Many districts
conduct formal written surveys and informal, in-person interviews to assess student likes and
dislikes. A number of directors have regularly scheduled student advisory meetings in order to
create food service products that meet students’ desires. Other directors listen in as students
comment and complain during the lunch period. Finally, taste-testing has become a popular
method for assessing the potential acceptance of new products and building excitement and
enthusiasm for new items. Taste tests are often tied to promotions for new fast food products and
are sponsored by food companies.
DISCUSSION
Very little has been published in the public health literature regarding fast food sales on high
school campuses, indicating that this is a relatively new area of interest for public health
professionals. However, a number of articles on fast food in schools have appeared in the lay
literature and in publications for food service professionals. These publications corroborate the
same top priority issues for high school food services that have emerged from this analysis.
The food service directors surveyed in this study consistently referred to keeping students happy
and maintaining a financially sound business as primary reasons for selling a la carte fast foods. An
American School Food Service Association (ASFSA) publication on branding illustrates the

22
appeal of branded fast foods: when three high schools in San Juan Capistrano, California began
serving Taco Bell products, approximately 1,200 additional students patronized the cafeterias
because the brand name gave the food service greater prestige and acceptability with students.18
The report comments that food service is a business with a bottom line to meet, and an increasing
number of food service operators see branding as the key to ending up in the black rather than the
red.18 Corporations agree. The Los Angeles Times reported that corporate executives believe
there is no better place than the classroom to find new customers, and that the cafeteria has
become a magnet for corporate promotions.19-20
The findings of the present study echo a 1996 United States General Accounting Office (GAO)
survey that found that the most popular branded fast foods on school campuses were pizza (sold
by 80 percent of schools), burritos (sold by 21 percent of schools), and subs and sandwiches (sold
by 11 percent of schools).16 The most common brands sold were Pizza Hut (36 percent),
Domino’s Pizza (27 percent), Taco Bell (22 percent), and Subway (6 percent).16
The GAO reported that brand name fast foods were found in 13 percent of schools nationwide in
1996, an increase from two percent of schools in 1990-1991. This sharp rise signifies the market
power of nationally recognized brand-name fast food and the growing number of food service
departments that are hoping to profit from fast food’s popularity.21 Similar to the California food
service directors surveyed, food service operators across the country stated the following reasons
for selling branded fast foods: increase in school lunch and a la carte sales, student demand,
potential decrease in plate waste, potential cost reductions, strong vendor sales pitch, lack of on-
site cooking facilities, and parental suggestions.21 The California food service directors surveyed
for this report also listed the brief amount of time allotted to lunch service as a motivation for fast
food sales.
The GAO report showed that larger schools were more likely than smaller schools to serve fast
food. Schools in suburban communities were most likely to serve branded fast foods, and rural
schools were least likely to serve branded fast foods.16 The survey reported here also found that
rural California school districts were least likely to serve generic or branded a la carte fast foods.
Clearly, student desires have a strong influence on what is sold by the school food service.
Students participating in the 1997 ASFSA Nutrition Advisory Council survey said they would like
to see schools offer more ethnic foods (25 percent), desserts (13 percent), beef items (12
percent), and fruits and vegetables (11 percent).18 Food service departments will make efforts to
fulfill student demands, many with the expanded use of branded and generic fast foods and some
with other alternatives.

23
CONCLUSIONS
The poor quality of teen diets is likely to be a major factor contributing to obesity, with its
connected risks and problems. Fast foods, with their high fat, salt, and sugar contents, play a part
in poor adolescent diets.
The majority of responding California school districts provide fast foods and other a la carte
items, including brand-name and non-brand-name foods, to their students. With pizza, burritos,
and submarine sandwiches topping the list of foods consumed by students, and with far fewer
students than are eligible taking advantage of the National School Lunch Program’s nutritiously
balanced meals, it is clear that many of California’s high school students are not getting the
nutritional foundation that would enhance their ability to achieve in school. Although fifty-four
percent report modifying at least some fast food items to meet dietary guidelines, work still needs
to be done to assure that all food items sold at school offer students a strong nutritional
foundation.
Food service directors are hard pressed to find a balance between the conflicting pressures of
providing adolescents with healthy food choices that meet their nutritional needs, satisfying their
student customers, and running a financially stable business. The solutions do not necessarily
create healthy food choices at school. Many a la carte foods are sold at snack bars and food carts,
and thus, many students never enter the cafeteria where they might be encouraged to experience a
wider varity of food items.
For many school districts, feeding the student body nutritious meals and maintaining enough
money to do so have become contradictory pursuits. Some are trying to turn the tide by creating
their own school-branded versions of students’ favorite foods, in which they have more control
over the fat, sodium, and sugar content. Others are offering expanded choices, including fruit,
yogurt, bagels, and packaged salads.
The findings of the 2000 California High School Fast Food Survey reflect the situation across the
country, as the United States General Accounting Office has reported. These findings, then, raise
a number of important questions about the place of fast foods in high schools:
• How do fast foods affect the nutritional quality of the students’ diets?
• How does the food available at school influence students’ food choices outside of
school?

24
• Should school food services consistently model good dietary practices for
students?
• How do fast food sales influence students’ perceptions of nutrition education
messages?
• Are fast food sales to students the best way to generate additional resources for
schools? Are there other ways to raise additional funds?
• Are fast food sales and promotions contributing to the increased commercialization
of high school campuses?
This study is unable to answer these questions, but it does raise significant concerns about the role
of commercial fast food sales on high school campuses. More research is needed to fully
understand the impact of fast food sales at school on adolescent dietary behavior and quality.
Steps need to be taken that support food service in its mission to serve healthy, affordable foods
and that enable schools to respond to the findings in this study. The following require
consideration by district and school administrators when making decisions about food sales on
high school campuses.
RECOMMENDATIONS
• Promote the link between a nutritious diet and learning.
• Investigate the reasons that students do not participate in the National School
Lunch Program. Develop strategies to increase participation.
• Offer students more healthy foods that are just as convenient, inexpensive, and
appealing as fast foods.
• Involve students in choosing the healthy foods available in their school through
taste tests, surveys, and classroom activities.
• Hold forums that inform students, parents, decision-makers, and the community
about the effect of fast food on health.
• Examine the use of schools as a channel for food and beverage company
promotions.
25
• Explore new opportunities to generate support and revenue that are not based on
the sale of unhealthy foods.
REFERENCES
1. Kuczmarski RJ, Flegal KM, Campbell SM, Johnson CL. Increasing prevalence of overweight
among US adults: the National Health and Nutrition Examination Surveys, 1960 to 1991. JAMA 1994 272:205-211.
2. Troiano RP, Flegal KM, Kuczmarski RJ, Cambell SM, Johnson CL. Overweight prevalence
and trends for children and adolescents. The National Health and Nutrition Examination Surveys, 1963 to 1991. Arch Pediatr Adolesc Med 1995 149:1085-1091.
3. Dietz WH. Health consequences of obesity in youth: childhood predictors of adult disease.
Pediatrics 1998 101:518-525. 4. Gortmaker SL, Dietz WH Jr., Sobol AM, Wehler CA. Increasing Pediatric Obesity in the U.S.
J Dis Child, 1987; 141(5):535-540. 5. Prevalence of overweight among adolescents 1988-1991. MMWR: 1994, 43 (44):818-821. 6. Patricia Crawford. Children and weight: What professionals can do about it. Concept Paper
1998. University of California, Berkeley. 7. Diet and Health: Implications for Reducing Chronic Disease Risk. National Research
Council, Committee on Diet and Health. 1989, 21–35. 8. Dietz WH. Childhood weight affects adult morbidity and mortality. J Nutr 1998 Feb;128 (2
Suppl): 411S-414S.
9. Kikuchi DA, Srinivasan SR, Harsha DW, Webber LS, Sellers TA, Berenson GS. Relation of serum lipoprotein lipids and apolipoproteins to obesity in children: The Bogalusa Heart Study. Prev Med 1992 21:177-90.
10. The Surgeon General’s Report on Nutrition and Health. U.S. Department of Health and
Human Services, DHHS Publication Number 88-50210. 1988, 287. 11. Adolescent Nutrition: Assessment and Management. Edited by Rickert VI. 1996, 201. 12. Statement on the Link Between Nutrition and Cognitive Development in Children. Center on
Hunger, Poverty and Nutrition, Tufts University School of Nutrition. 1994. 13. Lewis CJ, Crane NT, Moore BJ. Healthy People 2000: Report on the 1994 nutrition progress
review. Nutrition Today 1994; 29(6): 6-14.

26
14. Krebs-Smith SM, Cook DA, Subar AF, Cleavland L, Friday J & Kahle LL. Fruit and Vegetable Intakes of Children and Adolescents in the United States. Archives of Pediatric and Adolescent Medicine 1996; 150: 81-86.
15. Jacobson MF, Maxwell B. What are we feeding our kids? Workman Publishing, New York,
New York 1994: 50-57. 16. School Lunch Program: Role and Impacts of Private Food Service Companies. United States
General Accounting Office. August 1996. 17. Harris E, Lanzidelle D, McKinney S. The nutritional value of food purchased from an a la
carte lunch menu. School Food Service Revue, 1990;14(2): 94-97. 18. Fitzgerald PL. Branding: The building blocks to develop a branding program in your school
meals operation. American School Food Service Association, 1997. 19. Seymour L. A is for ad as firms gain hold on campus. Los Angeles Times, November 23,
1998. 20. Hamm J. Education: Some observers worry that schools are being sold to the highest bidder in
accepting corporate sponsorships. Los Angeles Times, January 17, 1999. 21. White P. A brand new trend. American School Food Service Association, 1997.

27
12 12