2001 texture analysis of the transition from slip to grain … · · 2016-07-04calhoun: the nps...
TRANSCRIPT

Calhoun: The NPS Institutional Archive
Faculty and Researcher Publications Faculty and Researcher Publications
2001
Texture analysis of the transition from
slip to grain boundary sliding in a
discontinuously recrystallized
superplastic aluminum alloy
Ruano, O.A.
þÿ�A�c�t�a� �m�a�t�e�r�.� �V�o�l�u�m�e� �4�9�,� �(�2�0�0�1�)�,� �p�p�.� �2�2�5�9 ��2�2�6�8
http://hdl.handle.net/10945/43193

Acta mater. 49 (2001) 2259–2268www.elsevier.com/locate/actamat
TEXTURE ANALYSIS OF THE TRANSITION FROM SLIP TOGRAIN BOUNDARY SLIDING IN A DISCONTINUOUSLYRECRYSTALLIZED SUPERPLASTIC ALUMINUM ALLOY
M. T. PEREZ-PRADO1, 2, G. GONZALEZ-DONCEL1, O. A. RUANO1 and T. R.MCNELLEY3†
1Departamento de Metalurgia Fısica, Centro Nacional de Investigaciones Metalurgicas, C.S.I.C., Avda. deGregorio del Amo 8, 28040 Madrid, Spain, 2Department of Mechanical and Aerospace Engineering,
University of California—San Diego, 9500 Gilman Drive, La Jolla, CA 92093-0411, USA and3Department of Mechanical Engineering, Naval Postgraduate School, 700 Dyer Road, Monterey, CA
93943-5146, USA
( Received 29 December 2000; accepted 15 March 2001 )
Abstract—Texture and microtexture measurements were correlated with mechanical property data for asuperplastic 5083 aluminum alloy. Prior processing had included an overaging treatment followed by severerolling deformation and the as-received material was annealed prior to mechanical testing. Discontinuousrecrystallization by particle-stimulated nucleation during the annealing accounts for a predominantly randomtexture, although a weak {100}�0vw> component was present, as well as a random grain boundary disorien-tation angle distribution. During elevated temperature deformation under dislocation-creep-controlled con-ditions, a distinct �111> fiber component and a relatively weak {100}�001> cube orientation, which aremutually compatible during uniaxial tensile extension, became apparent in the texture. Also, low-angle bound-aries became evident in the disorientation distribution. In contrast, the random texture component and therandomness of the disorientation distribution became more evident when the material was deformed underconditions of grain boundary sliding control of deformation. A transition from dislocation creep to grainboundary sliding observed in the microtexture measurements of this work may be predicted by treatingconstitutive equations for dislocation creep and grain boundary sliding in an additive manner. Published byElsevier Science Ltd on behalf of Acta Materialia Inc.
Keywords: Aluminum alloys; Recrystallization & recovery; Grain boundaries; Creep; Superplasticity
1. INTRODUCTION
The microstructural prerequisites for superplasticityare now well established. They include fine grain sizeand grain boundaries capable of sliding whileresisting tensile separation [1, 2]. The need for a finegrain size reflects the independent contributions ofgrain boundary sliding (GBS) and dislocation creepduring elevated temperature deformation [1, 3–5].According to our current understanding of the physi-cal laws governing creep of polycrystalline materialsthese mechanisms operate independently and there-fore in an additive manner. It follows that the fasterof these two mechanisms will control the deformationresponse at a given temperature and strain rate [6].This understanding has been derived from phenom-enological analysis of extensive mechanical property
† To whom all correspondence should be addressed.E-mail address: [email protected] (T. R.
McNelley)
1359-6454/01/$20.00 Published by Elsevier Science Ltd on behalf of Acta Materialia Inc.PII: S13 59-6454( 01 )0 0128-8
data as well as from microstructural observations byoptical and electron microscopy [1–6].
GBS and its accommodation are usually envisionedto occur within the boundaries themselves and inadjacent, mantle-like regions of the grains [7, 8].Accordingly, the deformation rate associated withGBS increases as the grain size becomes finer. In con-trast, dislocation creep is presumed to occur indepen-dently by dislocation motion within the core regionsof the grains and so the deformation rate for dislo-cation creep is unaffected by changes in grain size.This suggests a grain-size dependent transition indeformation mechanism, and superplasticity at higherstrain rates in materials of finer grain size. Such tran-sitions in rate-controlling deformation mechanisms,e.g. from GBS to dislocation creep, should occur overa narrow range corresponding to about an order ofmagnitude in strain rate [9].
Grain refinement for superplasticity in wroughtaluminum alloys can only be achieved by defor-mation and recrystallization. Empirical approaches
2260 PEREZ-PRADO et al.: TEXTURE ANALYSIS
have led to the development of two distinct thermo-mechanical processing (TMP) routes, the details ofwhich depend on alloy constitution. For TMP routesinvolving discontinuous (or primary) recrystallizationreactions, overaging treatments are used to developcoarse precipitate particles, �1 µm in size, prior tocold working. These precipitate particles are intendedto become sites for particle-stimulated nucleation(PSN) of recrystallization. This involves the forma-tion of high-angle boundaries within the deformationzones around the particles and subsequent high-angleboundary migration into surrounding material [10–14]. Resulting recrystallization textures tend to berandom, reflecting random grain orientations due toPSN [14], and there is a predominance of random,high-angle boundaries in the microstructure. ForTMPs involving the continuous recrystallization reac-tion, deformation processing of as-cast material byhot and cold working is accomplished under con-ditions designed to allow retention of a dispersion offine (10–50 nm) second-phase particles. In turn, suchparticles hinder the migration of high-angle grainboundaries during subsequent thermal treatments orelevated temperature deformation. The term “continu-ous recrystallization” has been used to describe therecovery-dominated processes that occur in thesealloys containing fine, second-phase dispersions [14–17]. Well-defined deformation textures and bimodaldistributions of grain boundary disorientation anglespersist during even prolonged annealing treatmentsfor such materials [18–24]. The disorientation angleis the minimum angle among all crystallographicallyequivalent rotations that relate two lattice orien-tations; the term “correlated disorientation” is usedhere to refer specifically to disorientations of adjac-ent grains.
Slip processes are influenced by lattice orientationand may also result in characteristic lattice rotationsduring plastic deformation. On the other hand, GBSis sensitive to disorientation but is thought to resultin random grain rotations during elevated temperatureflow. Thus, the occurrence of dislocation creep andGBS as well as the interaction between them will beaffected by the differences in texture and disorien-tation for materials representing these different pro-cessing routes. Differences in interaction may providefurther insight into microstructures developed by pro-cessing as well as insight into the dislocation creepand GBS mechanisms.
Previous texture studies on superplastic materialshave generally shown an overall reduction in the tex-ture intensity after deformation within the superplas-tic regime [24–26]. This has usually been attributedto random grain rotation during GBS. It has also beenreported that certain texture components become stab-ilized and that other, new components appear duringdeformation outside of the superplastic regime; theseobservations have been attributed to dislocation creep[24, 27–29]. However, considerable controversyexists for many superplastic materials because the sta-
bilization of some texture components and the appear-ance of other, new texture components have also beenobserved to occur within the superplastic regime. Thishas usually been interpreted as the result of a jointand simultaneous contribution to the superplasticstrain by both dislocation creep processes and GBSover a wide range of rates. However, this is inconsist-ent with well-accepted creep models which predictthat two mechanisms may contribute simultaneouslybut only over a narrow range of deformation con-ditions. Furthermore, the relationship between theprocessing history and the texture of the initial micro-structure, or between the texture of the initial and thefinal, superplastically deformed microstructures, hasnot been systematically studied. Recent advances inunderstanding of textures and recrystallization sug-gest that such relations are critical to interpretation ofthe material behavior. Furthermore, few studies haveconsidered grain boundary disorientation in relationto processing and mechanisms of recrystallization anddeformation for such microstructures [14].
The aim of the present investigation is to evaluateby microtexture methods the transition from dislo-cation creep to GBS in an alloy that has undergonediscontinuous recrystallization. The evolution of thetexture from that of the as-received condition to thatof various deformed states has been fully charac-terized and related to the operative deformation mech-anisms. Altogether, this work provides a basis forfurther studies of microstructure–mechanical proper-ties relationships in superplastic materials. Sub-sequent reports will adopt a similar approach to dislo-cation creep and GBS in superplastic alloys thatundergo a continuous recrystallization reaction.
2. EXPERIMENTAL PROCEDURE
The 5083 aluminum alloy of this research was sup-plied by the manufacturer (SKY) as specially pro-cessed for grain refinement and its composition isgiven in Table 1. While details of the TMP are pro-prietary, the processing is similar to that initiallydeveloped for the 7475 aluminum alloy [10, 11]. Dur-ing rolling, deformation zones form around theAl6Mn particles and PSN may then take place. Theas-received material exhibited a partially recrys-tallized grain size of about 9 µm as determined bymean linear intercept measurement [20, 30].
Tension test samples were prepared with tensileaxes either parallel or transverse to the prior rollingdirection (RD). Details of the sample geometry havebeen provided previously [19, 20, 30]. All sampleswere annealed for 30 min at 535°C prior to sub-sequent deformation. Constant crosshead speed ten-sion tests were conducted to failure over a wide rangeof temperatures and nominal strain rates for samplesoriented with tensile axes parallel to RD. In selectedcases, testing was also conducted with the tensile axisparallel to the transverse direction (TD) of the rolledsheet of the alloy material. Stress–strain curves were

2261PEREZ-PRADO et al.: TEXTURE ANALYSIS
Table 1. Alloy composition (wt%)
Alloy Mg Mn Cr Fe Si Al
5083 Al 4.48 0.65 0.11 0.07 0.05 Bal.
flat beyond a nominal strain of about 0.05, indicatingessentially steady state behavior for these testing con-ditions. Emphasis was placed on testing at 535°Cbecause that is the optimum superplastic forming tem-perature for the alloy.
Macrotexture measurement was carried out onregions close to the mid-thickness of an annealedsample of this material by means of the Schultzreflection method using a diffractometer and closedEulerian cradle. The (111), (200), (211) and (311)pole figures were obtained. The polar angle rangedfrom 0 to 90° in steps of 3°. From the pole figuresthe even part of the three-dimensional orientation dis-tribution function (ODF) of the Euler angles j1, �and j2 was calculated by a series expansion method.Sample preparation consisted of grinding on success-ively finer silicon carbide papers and final mechanicalpolishing with 1.0 µm diamond paste.
Microtexture measurements were carried out bymeans of computer-aided EBSP analysis methods.Sample preparation included final electropolishing ina solution of nitric acid and methanol (1:4) at �22°Cand 7 V DC. System hardware was installed on aTopcon SM510 scanning electron microscope (SEM)while system software ran on an SGI Indy computerworkstation. The interactive method chosen for datacollection has been exhaustively described previously[19–23, 30, 31]. Data sets consisting of 500 individualgrain orientations were collected. Microtexture dataare presented here in the form of discrete pole figuresand correlated (nearest neighbor) disorientation distri-bution histograms [21, 23]. Finally, microstructureswere examined using the SEM operating in the mixed(backscatter and secondary) mode.
3. RESULTS
Figure 1 illustrates the microstructure of the 5083alloy following a 30 min annealing treatment at535°C. An annealing time of 30 min was chosenbecause this is approximately the time needed forequilibration at the testing temperature during tensiontesting. The mean linear intercept value for thismicrostructure is 12.7 µm, which indicates slightgrain growth relative to the as-received condition.Particles of the Al6Mn phase appear dark in Fig. 1;they range up to about 2–3 µm in size. The largerparticles of this phase tend to be irregular in shapeand are aligned with the prior rolling direction. Since535°C is the highest test temperature employed in thisstudy it was anticipated that further grain growthwould be minimal upon heating to test temperaturesless than 535°C.
Texture and microtexture data for this condition are
Fig. 1. Microstructure of the 5083 aluminum alloy afterannealing at 535°C for 30 min. Secondary and backscattered
electron image. Orientation contrast, no etchant.
shown in Fig. 2. The texture data are displayed in theform of an ODF [Fig. 2(a)] while the microtexturedata are presented in the form of discrete pole figures[Fig. 2(b)] and the corresponding correlated disorien-tation distribution in the form of a histogram [Fig.2(c)]. Overall, these data reveal that the distributionof orientations is nearly random but weak texturecomponents are also evident. The ODF data suggestthe presence of a weak {100}�0vw> component(reflected in the contours located along the j2 axis forall j1 sections). This component is also discernable inthe {200} discrete pole figure as a concentration ofpoles near the center as well as in an approximatelyuniform distribution of poles around the periphery. Aweak Goss component ({110}�100>, or j1 = 0°,� = 45°, and j2 = 0°) is also evident in the ODF [Fig.2(a)] and may also be reflected in the {220} discretepole figure as in the concentration of poles in thecenter [Fig. 2(b)]. This was present in the as-receivedmaterial [20, 30] and has become slightly strongerin this annealed condition. A very weak Cu texturecomponent ({112}�111>, or j1 = 90°, � = 30° andj2 = 45°) was present in the as-received material butis no longer discernable following this annealingtreatment. The discrete pole figures demonstrate mostclearly the predominance of the random component inthe texture. The correlated disorientation distributionexhibits a peak at 40–45°, and is close to that pre-dicted by Mackenzie for the disorientations of ran-domly oriented cubes [32]; such a distribution is con-sistent with the predominance of the randomcomponent in the texture. Altogether the microstruc-ture and texture data reflect grain refinement by PSNof recrystallization during the prior processing andfinal annealing of this material.

2262 PEREZ-PRADO et al.: TEXTURE ANALYSIS
Fig. 2. Texture data for the annealed 5083 aluminum alloy inthe form of (a) the ODF determined by X-ray methods; (b)discrete pole figures determined by EBSD methods; and (c) ahistogram representing the distribution of disorientation angles
for adjacent grains.
The results of the mechanical testing are summar-ized in Figs 3 and 4. Data are included for tests con-ducted with the tensile axis parallel to the final rollingdirection (filled symbols) as well as for tests in thetransverse orientation (open symbols). In Fig. 3 thedata are plotted on double logarithmic axes as theflow stress at a true strain of 0.1, se = 0.1, vs the nomi-nal strain rate, e. The stress exponent, n(d log e/d log s), has a value of about 1.5 at the low-est strain rates for testing conducted at T = 535°C; then-value increases for testing conducted at higherstrain rates and a transition is apparent at a strain rate�2×10�3 s�1. Above this strain rate the stressexponent increases to a value of �5. For the twolower test temperatures employed here a value ofn�5 was also obtained, although fewer tests wereconducted at these temperatures. An apparent acti-vation energy value for deformation, 140 kJ/mol, maybe estimated from these data. Binary Al–Mg alloyscontaining from 2.2 up to 10 wt% Mg have beenshown to exhibit stress exponents of n�3 and appar-ent activation energies of about 136 kJ/mol in thistemperature and strain rate regime, values which areindicative of solute-drag control of creep [33]. How-ever, recent work [34, 35] has demonstrated that ter-
Fig. 3. The strain rate as a function of stress at various tempera-tures for tests conducted with the tensile axis parallel to thefinal rolling direction (filled symbols) as well as for tests in
the transverse orientation (open symbols).
Fig. 4. The elongation to failure as a function of strain rate atvarious temperatures for tests conducted with the tensile axisparallel to the final rolling direction (filled symbols) as well as
for tests in the transverse orientation (open symbols).
nary additions of 0.25 wt% Mn, or more, in Al–Mg–Mn alloys result in an increase in the stress exponentto a value of between 4 and 5 while activation energyvalues remain at about 140 kJ/mol. The increase inthe stress exponent, n, to a value similar to that forpure metal behavior has been attributed to an effec-tive reduction of Mg content due to interactionbetween the Mg and Mn solutes [34].
Elongations to failure data obtained here are shownin Fig. 4. The maximum ductility of about 400%elongation was obtained for testing conducted at thelowest strain rate and T = 535°C. This corresponds tothe smallest n, which, in turn, gives the largest strain

2263PEREZ-PRADO et al.: TEXTURE ANALYSIS
rate sensitivity coefficient m ( = 1/n). The ductilitydecreased for higher strain rates and lower ductilitieswere also obtained at the lower test temperatures.Finally, Figs 3 and 4 suggest isotropic behavior forthis material as can be deduced by comparing the dataobtained from testing in the TD to corresponding datafrom the RD tests.
Microtexture measurements were employed tocharacterize the deformation mechanisms associatedwith the two regimes (n�5 and n�2) apparent in themechanical property data of Fig. 3. A stress exponentof 5 is consistent with deformation under dislocationcreep conditions. Samples deformed to failure underdislocation creep conditions (at 335°C ande = 10�2 s�1 for tensile axes parallel to both the RDand TD of the rolled sheet; and at 535°C ande = 10�1 s�1 for the tensile axis parallel to RD) wereselected as representative of this regime. Discretepole figures and correlated disorientation distributionhistograms are shown in Fig. 5 for the tests conductedat 335°C. Distinct �111> fiber textures, wherein the�111> fiber axis is aligned with the tensile axis, havebecome apparent for both sample orientations. These�111> fiber textures are most obvious in the {111}and {220} pole figures. In Fig. 5(a) the bands indicaterotational symmetry about RD, which, in turn, is thesample’s tensile axis. The {111} poles are alignedwith the RD and in bands at about 70.5° to RD, whilein the {220} pole figure the corresponding bands arelocated at about 35.3 and 90° to the RD. These samefeatures are apparent in Fig. 5(b) but the bands indi-cate rotational symmetry about TD, which is the ten-
Fig. 5. Discrete pole figures and histograms of the correlatedmisorientation distributions for 5083 aluminum deformed in thedislocation creep regime at 335°C and 10�2 s�1. Data for ten-sion testing parallel to RD are shown in (a), and for tension
testing parallel to TD are shown in (b).
sile axis for this sample. The appearance of a �111>fiber texture reflects lattice rotation due to slip andsix slip systems of the fcc lattice have equal resolvedshear stress in this orientation. The {200} pole figuresfor both sample orientations reveal concentrations ofpoles along the rolling, transverse and normal direc-tions, suggesting the development of a {100}�001>cube component in the texture as well. This texturecomponent has eight equally stressed fcc slip systems.Finally, grains with �110> near the tensile axis ineither Fig. 5(a) or (b) have rotated away from thisorientation. This may be seen by comparing the distri-butions of poles in the {220} discrete pole figures ofFig. 2(b) and Figs 5(a) and (b).
The correlated disorientation histograms for bothsample tensile axis orientations exhibit two peaks.Comparison with the disorientation data for theannealed condition suggests that the low-angle peak(at 5–10°) for both sample orientations is the resultof deformation, and may reflect substructure forma-tion by recovery of slip dislocations. While a purefiber texture would result in an equal population ofboundaries in all disorientation ranges in such histo-grams the pole figures also indicate a large populationof random orientations. Following Mackenzie, this isconsistent with the peak near 45° in these histograms.Thus, the disorientation data are consistent with thesuperposition of a distribution due to substructure for-mation by recovery following slip upon a distributiondue to the initial, random grain orientations in themicrostructure and a weak fiber. Finally, Fig. 6 illus-trates grain elongation during tensile straining for dis-location creep control of deformation at this tempera-ture (535°C/10�2 s�1). Extensive additionalprecipitation of the Al8Mg5 phase on grain boundariesand within the grains is also evident.
Figure 7 illustrates the microtexture data corre-sponding to this 5083 alloy following deformation at535°C and a strain rate of 10�1 s�1 along the RD.
Fig. 6. The microstructure of the 5083 aluminum alloy follow-ing tensile deformation at 335°C and 10�2 s�1, showing grainelongation parallel to the tensile axis. Precipitation of theAl8Mg5 phase, especially on the grain boundaries, is evident.Secondary and backscatter electron image, orientation contrast,
no etchant.

2264 PEREZ-PRADO et al.: TEXTURE ANALYSIS
Fig. 7. Microtexture data in the form of discrete pole figuresand a histogram of the distribution of the correlated misorien-tation angles for the 5083 aluminum alloy deformed in the dis-
location creep regime at 535°C and 10�1 s�1.
The stress exponent, n, is again about 5 for these con-ditions (Fig. 3). A �111> fiber texture and the{100}�001> cube component are both apparent, butcomparison with Fig. 5 reveals that these componentsare both less distinct in the pole figures than theywere for deformation at the lower temperature. Also,the relative population of low-angle boundaries islower for this condition. This is consistent with thedevelopment of a coarser substructure and lower sub-boundary disorientations for deformation at thishigher temperature (and lower stress).
Microtexture data are shown in Fig. 8 that corre-spond to tests performed along the RD [Fig. 8(a)] andalong the TD [Fig. 8(b)] under optimum superplasticconditions (535°C and 10�4 s�1). The stress exponent,n, is about 1.5 for these conditions and the tensile
Fig. 8. Discrete pole figures and histograms of the correlatedmisorientation distributions for 5083 aluminum deformed in theGBS regime at 535°C and 10�4 s�1. Data for tension testingparallel to RD are shown in (a), and for tension testing parallel
to TD are shown in (b).
ductility values are 375–400% elongation to failure.The �111> fiber does not form for these deformationconditions and the {111} and {220} pole figures sug-gest randomization of texture, which is consistentwith GBS. However, a weak {100}�0vw> compo-nent can still be seen in the {200} pole figure. Thiscomponent was evident in the annealed condition andmay be slightly less well defined after deformationhere; however it is apparently stable against randomgrain rotations during deformation by GBS. Again,the deformation behavior is isotropic for these data.The micrograph in Fig. 9 illustrates the absence ofgrain elongation during deformation under conditionsof GBS control of deformation. Comparison with Fig.1 reveals that grain growth has occurred but grainsremain equiaxed. This is indicative of the absence ofslip processes during straining in these conditions.
4. DISCUSSION
Processing history governs microstructure and ther-eby controls the mechanical behavior of engineeringalloys. The 5083 alloy of this research is a typicalexample of aluminum alloys processed utilizing PSNof recrystallization to achieve a uniform, refined grainstructure capable of superplastic response.
4.1. The initial, annealed microstructure
The conditions for PSN of recrystallization arereasonably well known although many details remainto be determined. Severe low-temperature defor-mation of a particle-containing alloy results in thedevelopment of deformation zones around the par-ticles. PSN during annealing tends to occur mostreadily for coarse dispersed particles and, from apractical viewpoint, the minimum particle size forPSN is apparently about 1 µm. Grain orientationsassociated with PSN tend to be random because of thelarge spread of lattice orientation around the particles
Fig. 9. The microstructure of the 5083 aluminum alloy follow-ing tensile deformation in the GBS regime at 535°C and 10�4
s�1. Grain growth is evident, as revealed by comparison withthe microstructure of the annealed condition in Fig. 1. Second-ary and backscatter electron image, orientation contrast, no
etchant.

2265PEREZ-PRADO et al.: TEXTURE ANALYSIS
following the prior deformation of the material. Ingeneral, recrystallization after deformation producespreferred orientation in materials; PSN is one of thefew recrystallization mechanisms available to pro-duce random textures in wrought aluminum alloys.This is an important mechanism since a fine grainstructure with random grain orientations and high-angle grain boundaries are prerequisites for superplas-tic response. As can be seen in Fig. 2, some fainttexture components are also apparent in the as-received material. Such non-random recrystallizationtexture components are often seen in particle-contain-ing alloys and their presence may reflect one or moreof several factors [14]. These include the formation ofother types of recrystallization nuclei in local regions,preferential PSN for particles located on prior grainboundaries, and selective growth of some orientationsamong those produced by PSN.
4.2. Mechanical behavior at elevated temperature
The microstructure in Fig. 1 is implicit in constitut-ive models of the elevated temperature mechanicalbehavior of polycrystalline materials. Because theorientations of grains are determined by random pro-cesses there are no orientation relationships betweenadjacent grains and there is a predominance of high-angle grain boundaries in the microstructure. Forhomogeneous, compatible deformation among ran-domly oriented grains in a polycrystalline metal Tay-lor’s analysis specifies that a minimum of five inde-pendent slip systems must be available fordeformation by intragranular dislocation motion [36].On the other hand, deformation by GBS requires dis-ordered, high-angle grain boundaries (although theminimum disorientation necessary for this mechanismremains to be established). The disorientation for ran-domly oriented grains will meet this latter require-ment.
A stress exponent of 5 coupled with an activationenergy near that for self-diffusion in aluminum sug-gests lattice-diffusion controlled dislocation creep forthe higher strain rate data obtained at 535°C and forall the data at the lower two test temperatures. A gen-eral constitutive law for lattice-diffusion controlleddislocation creep in polycrystalline metals of highstacking fault energy metals is given by [1, 2, 4, 5]
eslip = 1011�DL
b2��sE�5
(1)
where eslip is the dislocation creep strain rate (s�1),DL is the lattice diffusivity (m2 s�1), b is the Burger’svector (m), s is the flow stress, and E is the dynamic,unrelaxed Young’s modulus for the temperature inquestion (s and E in MPa). Similarly, a constitutiveequation for the lower stress exponent regimeobserved during low strain rate testing at 535°C is [1,2, 4, 5]
eGBS = 2×10⁹�DL
L2��sE�2
(2)
where eGBS is the strain rate due to GBS (s�1), andL is the mean linear intercept grain size (m).Together, these equations suggest that the data of Fig.3 may be replotted in normalized form as e/DL vss/E. Lattice diffusivity and dynamic Young’s modu-lus data for pure aluminum were used in the absenceof specific data for this aluminum–magnesium alloyand the results are plotted in Fig. 10. The data fallon a single curve (indicated by the solid line) with atransition from n�1.5 to n�5 at e/DL�5×1010 m�2.
With the assumption that dislocation creep andGBS contribute in an independent, additive mannerto the total deformation rate, eT, the mechanicalbehavior of this alloy may be modeled in terms ofequations (1) and (2) as
eT = eslip + eGBS (3)
where eslip and eGBS are given by equations (1) and(2), respectively. Since DL appears in both equations(1) and (2), equation (3) may be written in the form
eTDL
=1011
b2 �sE�5
+2×10⁹
L2 �sE�2
(4)
Equation (4) is plotted as the dashed line in Fig. 10while equations (1) and (2) are indicated separately
Fig. 10. Lattice-diffusion compensated strain rate as a functionof modulus compensated stress for the 5083 aluminum alloy.The predictions of the dislocation creep and GBS models areshown as the dashed line. The arrows indicate the conditions
investigated by EBSP analysis methods.
2266 PEREZ-PRADO et al.: TEXTURE ANALYSIS
by dotted lines; L was assumed equal to 12.7 µm. Themodel is in good agreement with the experimentaldata. Equation (4) correctly predicts the stress levelfor the observed transition from GBS to dislocationcreep control of deformation. The transition is pre-dicted to take place over a little more than an orderof magnitude in strain rate, which is consistent withthe shape of the solid curve fitting the experimentaldata. However, equation (4) overestimates the defor-mation rate by about one and one-half orders of mag-nitude.
4.3. Variation of microtexture during dislocationcreep
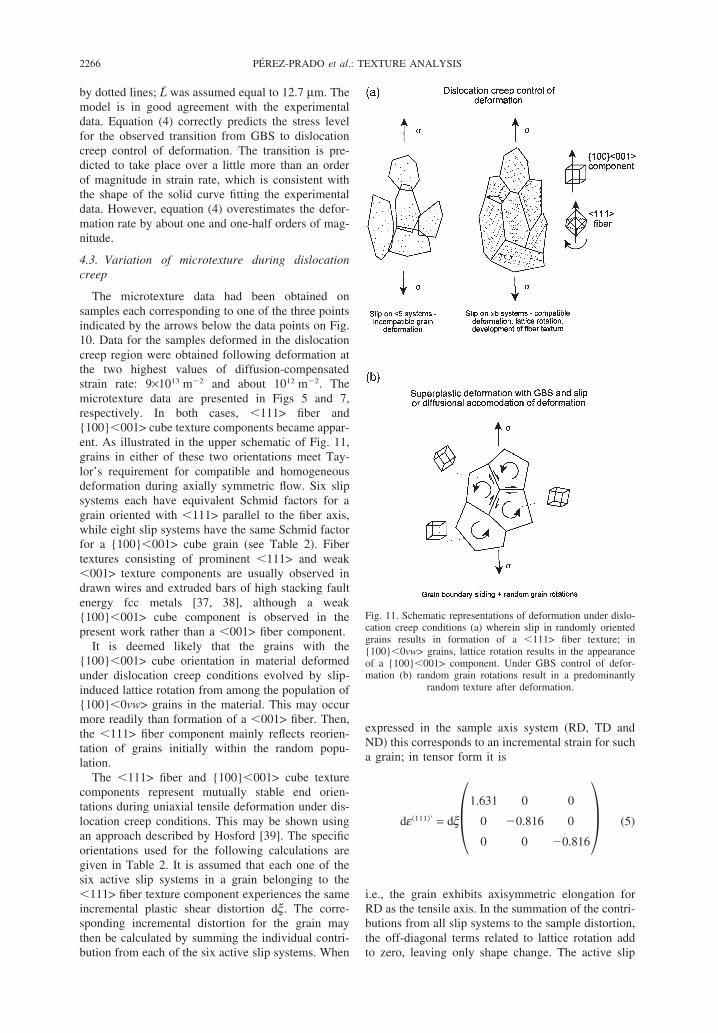
The microtexture data had been obtained onsamples each corresponding to one of the three pointsindicated by the arrows below the data points on Fig.10. Data for the samples deformed in the dislocationcreep region were obtained following deformation atthe two highest values of diffusion-compensatedstrain rate: 9×10¹³ m�2 and about 1012 m�2. Themicrotexture data are presented in Figs 5 and 7,respectively. In both cases, �111> fiber and{100}�001> cube texture components became appar-ent. As illustrated in the upper schematic of Fig. 11,grains in either of these two orientations meet Tay-lor’s requirement for compatible and homogeneousdeformation during axially symmetric flow. Six slipsystems each have equivalent Schmid factors for agrain oriented with �111> parallel to the fiber axis,while eight slip systems have the same Schmid factorfor a {100}�001> cube grain (see Table 2). Fibertextures consisting of prominent �111> and weak�001> texture components are usually observed indrawn wires and extruded bars of high stacking faultenergy fcc metals [37, 38], although a weak{100}�001> cube component is observed in thepresent work rather than a �001> fiber component.
It is deemed likely that the grains with the{100}�001> cube orientation in material deformedunder dislocation creep conditions evolved by slip-induced lattice rotation from among the population of{100}�0vw> grains in the material. This may occurmore readily than formation of a �001> fiber. Then,the �111> fiber component mainly reflects reorien-tation of grains initially within the random popu-lation.
The �111> fiber and {100}�001> cube texturecomponents represent mutually stable end orien-tations during uniaxial tensile deformation under dis-location creep conditions. This may be shown usingan approach described by Hosford [39]. The specificorientations used for the following calculations aregiven in Table 2. It is assumed that each one of thesix active slip systems in a grain belonging to the�111> fiber texture component experiences the sameincremental plastic shear distortion dx. The corre-sponding incremental distortion for the grain maythen be calculated by summing the individual contri-bution from each of the six active slip systems. When
Fig. 11. Schematic representations of deformation under dislo-cation creep conditions (a) wherein slip in randomly orientedgrains results in formation of a �111> fiber texture; in{100}�0vw> grains, lattice rotation results in the appearanceof a {100}�001> component. Under GBS control of defor-mation (b) random grain rotations result in a predominantly
random texture after deformation.
expressed in the sample axis system (RD, TD andND) this corresponds to an incremental strain for sucha grain; in tensor form it is
de�111�� = dx�1.631 0 0
0 �0.816 0
0 0 �0.816� (5)
i.e., the grain exhibits axisymmetric elongation forRD as the tensile axis. In the summation of the contri-butions from all slip systems to the sample distortion,the off-diagonal terms related to lattice rotation addto zero, leaving only shape change. The active slip

2267PEREZ-PRADO et al.: TEXTURE ANALYSIS
Table 2. Schmid factors for (a) [111] parallel to the tensile axis and (b) for the (100)[001] orientation
Slip plane Slip direction (a) (b)
(111) [011] 0 �0.408[101] 0 0.408[110] 0 0
(111) [011] �0.272 0.408[101] 0.272 �0.408[110] 0 0
(111) [011] 0 �0.408[101] 0.272 0.408[110] �0.272 0
(111) [011] �0.272 �0.408[101] 0 0.408[110] 0.272 0
systems occur in conjugate pairs and so the grain maycontinue to elongate without further lattice rotation.Similarly, for an incremental shear distortion dz oneach of the eight active slip systems in an{100}�001> cube grain the incremental strain is
de{100}�001�� = dz�3.263 0 0
0 �1.632 0
0 0 �1.632� (6)
and, again, such a grain may elongate in uniaxial ten-sion without lattice rotation. It also follows that grainsin these different orientations are able to undergoshape changes consistent with uniaxial extension. Theincremental shears will be different for grains of thesetwo orientations but the grains may deform withoutmutual interference and so these two orientations aremutually stable during deformation under dislocationcreep conditions.
Finally, grains in the random population orientedwith a �110> parallel to the tensile axis have fourslip systems with equivalent, non-zero Schmid fac-tors. Such grains would not experience an incrementaldistortion that is compatible with uniaxial tension. Forthis reason, the �110> fiber orientation is not stableand this is consistent with the decrease in the popu-lation of grains with this orientation as noted in com-parison of the discrete {220} pole figures of Figs 5(a)and (b) with those of Fig. 2(b).
4.4. Variation of microtexture in relation to GBS
The variation of texture with deformation con-ditions shown in this work corresponds well with thatpredicted by the operation of two independent defor-mation mechanisms: dislocation creep at high dif-fusion-compensated strain rates giving way to GBS asthe diffusion-compensated strain rate decreases. Thetransition from dislocation creep to GBS appears tobegin as the modulus compensated stress, s/E,decreases below about 6×10�4. At this stress, GBSapparently begins to contribute appreciably to thetotal deformation rate and this is seen in the microtex-
ture data of Fig. 7 for the sample deformed for con-ditions within the transition region. These data showsa less distinct �111> fiber texture than observed inthe sample deformed entirely in the slip region (Fig.5). Conversely, the data for the sample deformedentirely within the GBS at s/E�2×10�5 show prim-arily an enhancement of the random component inthe texture.
The presence of a weakened {100}�0vw> orien-tation even after an elongation of 400% under GBSconditions is consistent with the texture weakeningnormally associated with GBS. This is illustrated inthe lower schematic of Fig. 11. Lattice rotation asso-ciated with GBS is often reported to be relativelyslow and this may be reflected here as an apparentstability of this component.
These microtexture data demonstrate that the tran-sition from dislocation creep to GBS takes place asanticipated in phenomenological models that considerthese mechanisms to operate in an independent, addi-tive manner. The initially weak texture only weakensfurther during deformation under GBS control ofdeformation in the superplastic regime, while a defor-mation texture develops during deformation in thedislocation creep regime. The foregoing is consistentwith the premise that grain orientations in the micro-structure are random in nature. Thus, the behaviordescribed is characteristic of superplastic aluminumalloys that have experienced discontinuous recrys-tallization reactions via PSN during processing. Foraluminum alloys that exhibit continuous recrystalliz-ation reactions preferred orientation and orientationrelationships within the microstructure may alter thispattern of behavior; this will be the subject offuture reports.
5. CONCLUSIONS
The following conclusions may be drawn fromthis work.
1. Grain refinement of 5083 aluminum for superplas-ticity using PSN of discontinuous recrystallizationresults in random grain orientations, with mainlyhigh-angle boundaries in the microstructure.

2268 PEREZ-PRADO et al.: TEXTURE ANALYSIS
2. Dislocation creep and GBS contribute indepen-dently and additively to the deformation rate dur-ing elevated temperature tensile straining for sucha microstructure.
3. When dislocation creep predominates, a �111>fiber and a {100}�001> cube component developin the texture. These components reflect Taylor’srequirement of five or more independent mech-anisms for homogeneous, compatible deformationof a random polycrystal under uniaxial tensileextension, and they are also mutually compatibleend orientations for uniaxial tensile deformation.
4. For dislocation creep control of deformation theactivation energy was equal to that for lattice self-diffusion while the stress exponent, n, was 5. Atransition to GBS control occurred over about oneand one-half orders of magnitude in strain rate;GBS control of deformation was reflected in avalue for the stress exponent, n, of about 1.5, whilethe activation energy was again equal to that forlattice self-diffusion. The independent contri-butions of dislocation creep and GBS may bemodeled by addition of constitutive laws for thesemechanisms and the resulting relationship accu-rately reflects the mechanical behavior of thismaterial.
5. Conversely, when GBS is the predominant defor-mation mode the random component in the textureis enhanced although retention of a weakened{100}�0vw> component reflects slow grainrotation in association with this mechanism.
Acknowledgements—The authors gratefully acknowledge thefinancial support of the CICYT under grant MAT97/0700.
REFERENCES
1. Sherby, O. D. and Ruano, O. A., in Superplastic Formingof Structural Alloys, ed. N. E. Paton and C. H. Hamilton.TMS-AIME, New York, 1982, p. 241.
2. Ruano, O. A. and Sherby, O. D., Rev. Metal. Madrid, 1983,19, 261.
3. Langdon, T. G., Metall. Trans. A, 1982, 13A, 689.4. Sherby, O. D. and Wadsworth, J., in Deformation Pro-
cessing and Microstructure, ed. G. Krauss. ASM,Materials Park, OH, 1984, p. 355.
5. Ruano, O. A. and Sherby, O. D., Rev. Phys. Appl., 1988,23, 625.
6. Poirier, J. P., in Creep of Crystals. Cambridge UniversityPress, 1985, p. 79.
7. Gifkins, R. C., Metall. Trans. A, 1976, 7A, 1225.8. Ball, A. and Hutchison, M. M., Met. Sci. J., 1969, 3, 1.
9. Ruano, O. A., Miller, A. K. and Sherby, O. D., Mater. Sci.Eng., 1981, 51, 9.
10. Waldman, J., Sulinski, H. and Markus, H., Metall. Trans.A, 1974, 5, 573.
11. Wert, J. A., Paton, N. E., Hamilton, C. H. and Mahoney,M. W., Metall. Trans. A, 1981, 12A, 1267.
12. Paton, N.E. and Hamilton, C. H., US Patent No.4,092,181, 1978.
13. Humphreys, F. J., Acta metall., 1977, 25, 1323.14. Doherty, R. D., Hughes, D. A., Humphreys, F. J., Jonas,
J. J., Juul Jensen, D., Kassner, M. E., King, W. E., McNel-ley, T. R., McQueen, H. J. and Rollett, A. D., Mater. Sci.Eng. A, 1997, A238, 219.
15. Grimes R., NATO-AGARD Lecture Series No. 168, 8.1–8.16, 1988.
16. Watts, B. M., Stowell, M. J., Baike, B. L. and Owen, D.G. E., Metal. Sci. J., 1976, 10, 189.
17. Hornbogen, E., Metall. Trans. A., 1979, 10A, 947.18. Chokshi, A. H., Mukherjee, A. K. and Langdon, T. G.,
Mater. Sci. Eng., 1993, R10, 237.19. McNelley, T. R. and McMahon, M. E., Metall. Mater.
Trans. A, 1996, 27A, 2252.20. McNelley, T. R., McMahon, M. E. and Hales, S. J., Scripta
mater., 1997, 36, 369.21. McNelley, T. R. and McMahon, M. E., Metall. Mater.
Trans. A, 1997, 28A, 1879.22. Perez-Prado, M. T., McNelley, T. R., Ruano, O. A. and
Gonzalez-Doncel, G., Metall. Mater. Trans. A, 1998,29A, 485.
23. McNelley, T. R., McMahon, M. E. and Perez-Prado, M.T., Phil. Trans. A, 1999, 357, 1683.
24. Edington, J. W., Melton, K. N. and Cutler, C. P., Prog.Mater. Sci., 1976, 21, 63.
25. Padmanabhan, K. A. and Lucke, K., Z. Metallkde., 1986,7, 765.
26. Hirsch, J. R., Mater. Sci. Technol., 1990, 6, 1048.27. Kaibyshev, O. A., Rodionov, B. V. and Valiev, R. Z., Acta
metall., 1978, 26, 1877.28. Kaibyshev, O. A., Kazachkov, I. V. and Galeev, R. M., J.
Mater. Sci., 1981, 16, 2501.29. Matsuki, K., Morita, H., Yamada, M. and Murakami, Y.,
Met. Sci., 1977, 6, 156.30. McMahon M. E., Ph.D. Thesis, Naval Postgraduate
School, Monterey, CA, 1996.31. McNelley, T. R. and McMahon, M. E., J. Met., 1996,
48(2), 58.32. Mackenzie, J. K., Biometrica, 1958, 45, 229.33. McNelley, T. R., Michel, D. J. and Salama, A., Scripta
metall., 1989, 23, 1657.34. Taleff, E. M., Henshall, G. A., Nieh, T. G., Lesuer, D. R.
and Wadsworth, J., Metall. Mater. Trans. A, 1998, 29A,1081.
35. Hsiao, I. C., Huang, J. C. and Su, S. W., Mater. Trans.JIM, 1999, 40, 744.
36. Taylor, G. I., J. Inst. Met., 1938, 62, 307.37. McHargue, C. J., Jetter, L. K. and Ogle, J. C., Trans.
AIME, 1959, 215, 233.38. English, A. T. and Chin, G. Y., Acta metall., 1965, 13,
1013.39. Hosford, W. F., The Mechanics of Crystals and Textured
Polycrystals. Oxford University Press, Oxford, UK, 1993.