2002 directionfinder survey
TRANSCRIPT
…helping organizations make better decisions since 1982
Submitted to the City of South Bend, Indiana ETC Institute 725 W. Frontier Lane, Olathe, Kansas 66061
October 2020
City of South Bend Community Survey
Findings Report
2020

Contents
Executive Summary .............................................................................................. i
Section 1: Charts and Graphs .............................................................................. 1
Section 2: Trend Charts ..................................................................................... 57
Section 3: Benchmarking Data .......................................................................... 89
Section 4: Importance-Satisfaction Analysis ................................................... 107
Section 5: Tabular Data ................................................................................... 118
Section 6: Survey Instrument .......................................................................... 186
i
Executive Summ
ary Report
2020 City of South Bend Community Survey Executive Summary
Overview and Methodology
ETC Institute administered a survey to residents of the City of South Bend during the summer of 2020. The purpose of the survey was to gather feedback on city services and performance. The information provided will be used to improve existing services and help the city better understand the evolving needs of residents of South Bend.
The seven-page survey, cover letter and postage paid return envelope were mailed to a random sample of households in the City of South Bend. The cover letter explained the purpose of the survey and encouraged residents to either return their survey by mail or complete the survey online. At the end of the online survey, residents were asked to enter their home address, this was done to ensure that only responses from residents who were part of the random sample were included in the final survey database.
Ten days after the surveys were mailed, ETC Institute sent emails and placed phone calls to the households that received the survey to encourage participation. The emails contained a link to the on-line version of the survey to make it easy for residents to complete the survey. To prevent people who were not residents of South Bend from participating, everyone who completed the survey on-line was required to enter their home address prior to submitting the survey. ETC Institute then matched the addresses that were entered on-line with the addresses that were originally selected for the random sample. If the address from a survey completed on-line did not match one of the addresses selected for the sample, the on-line survey was not counted.
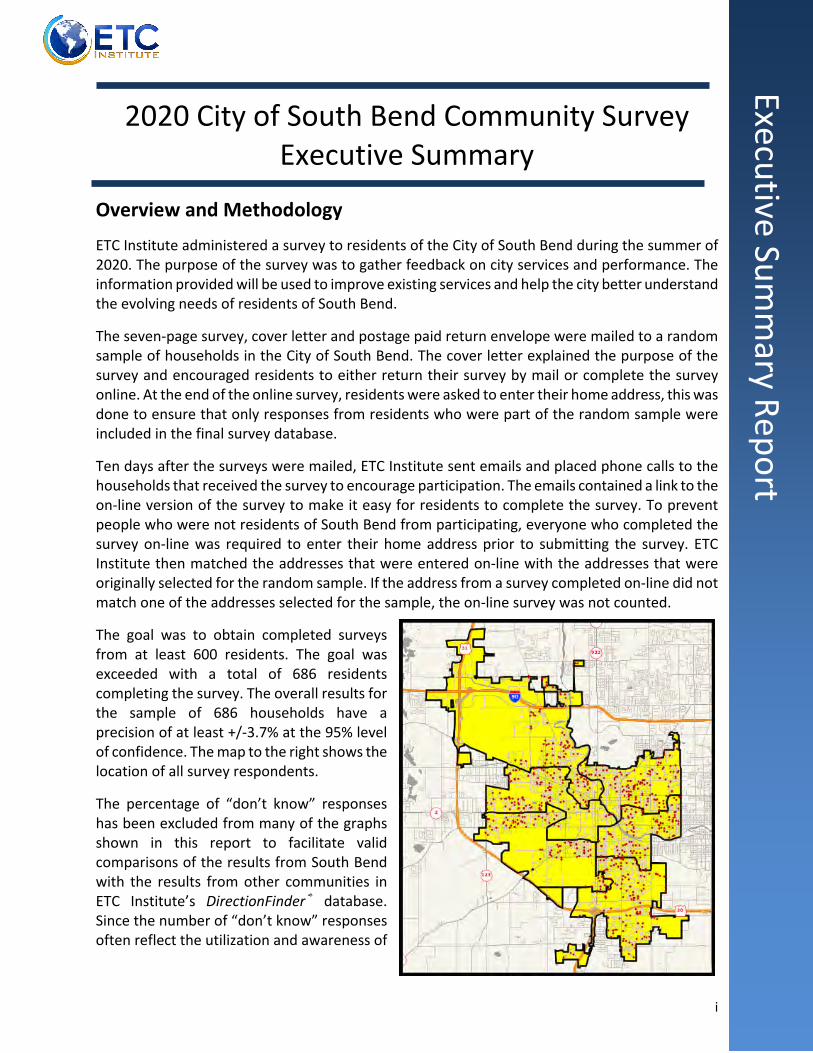
The goal was to obtain completed surveys from at least 600 residents. The goal was exceeded with a total of 686 residents completing the survey. The overall results for the sample of 686 households have a precision of at least +/-3.7% at the 95% level of confidence. The map to the right shows the location of all survey respondents.
The percentage of “don’t know” responses has been excluded from many of the graphs shown in this report to facilitate valid comparisons of the results from South Bend with the results from other communities in ETC Institute’s DirectionFinder® database. Since the number of “don’t know” responses often reflect the utilization and awareness of

ii
Executive Summ
ary Report city services, the percentage of “don’t know” responses have been provided in the tabular data section of this report. When the “don’t know” responses have been excluded, the text of this report will indicate that the responses have been excluded with the phrase “who had an opinion.”
This report contains:
• An executive summary of the methodology for administering the survey and major findings, • charts and graphs for most questions on the survey, • trend charts that show the difference in the 2020 and 2018 survey results, • benchmarking data that shows how the results for South Bend compare to other
communities, • importance-satisfaction analysis: this analysis was done to determine priority actions for
the city to address based upon the survey results, • tables that show the results of the random sample for each question on the survey, • a copy of the survey instrument.
Overall Perceptions of the City The statements regarding the overall perception of the city that had the highest level of agreement, based upon the combined percentage of “strongly agree” and “agree” responses among residents who had an opinion were: the city should build reliable infrastructure (88.9%), the city should support economic recovery (87.7%), the city should rebuild vibrant neighborhoods (83.7%), and the city should protect the vulnerable (82.3%). The item that received the lowest level of agreement was: the city should reform public safety systems (65.5%).
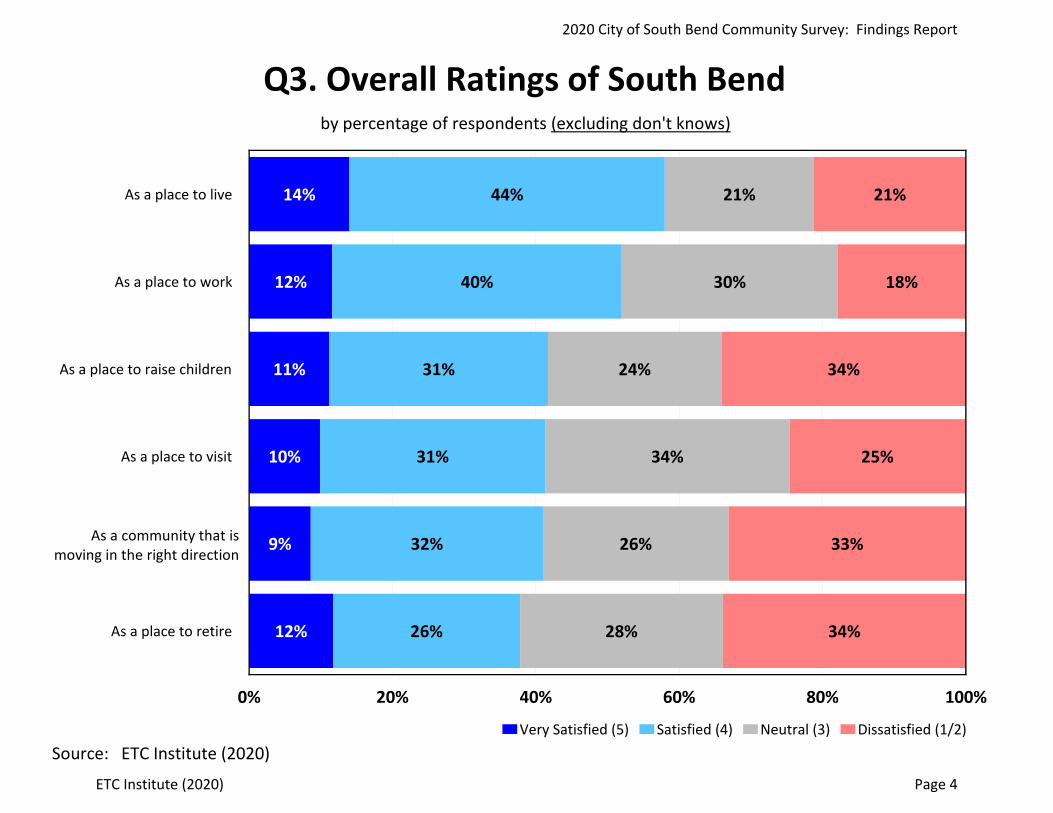
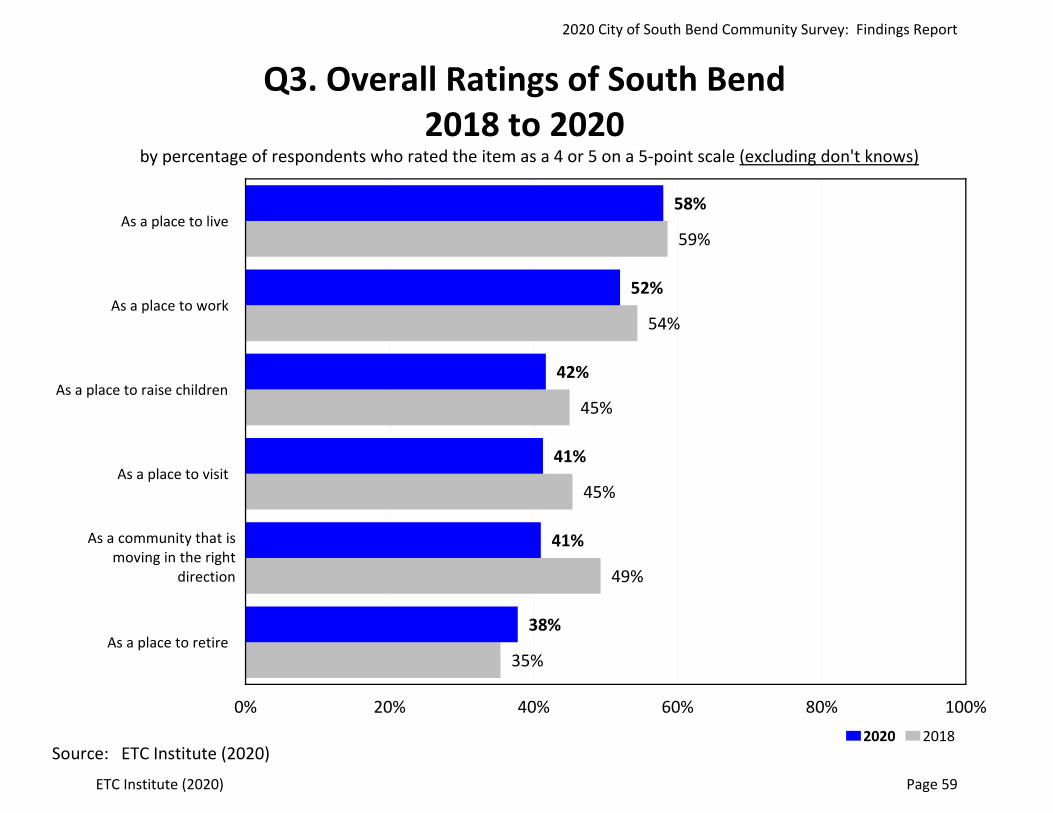
When asked to rate various aspects of the City of South Bend, the items that had the highest levels of satisfaction, based upon the combined percentage of “very satisfied” and “satisfied” responses among residents who had an opinion, were: the city as a place to live (58%) and the city as a place to work (52%).
Overall Satisfaction with City Leadership The major areas of city leadership that had the highest levels of satisfaction, based upon the combined percentage of “very satisfied” and “satisfied” responses among residents who had an opinion, were: the overall quality of life in the community (55.5%), the quality of local government services (37.9%), and the leadership of elected officials (34%). Respondents were least satisfied with the level of public involvement in local decision making (18.7%).
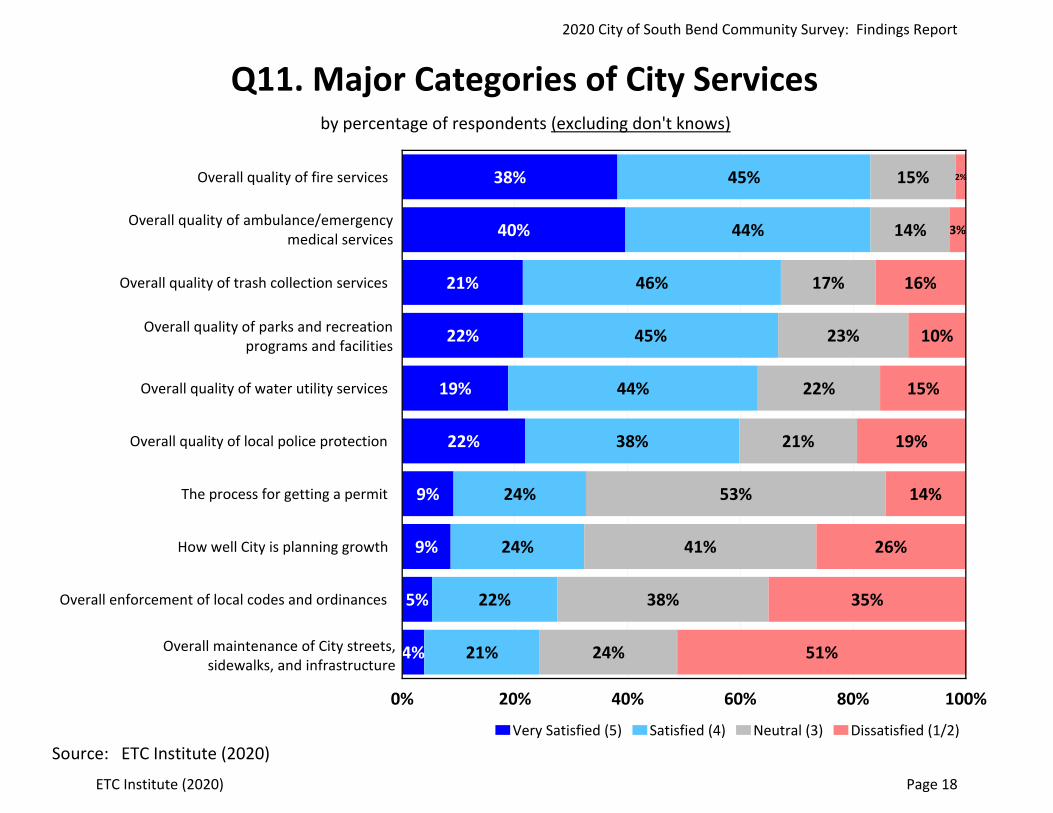
Overall Satisfaction with City Services The major categories of city services that had the highest levels of satisfaction, based upon the combined percentage of “very satisfied” and “satisfied” responses among residents who had an opinion, were: the overall quality of fire services (83.1%), overall quality of ambulance/emergency medical services (83.1%), overall quality of trash collection services (67.2%), and overall quality of parks and recreation programs and facilities (66.7%). The overall maintenance of city streets, sidewalks and infrastructure received the lowest level of satisfied ratings (24.4%) and was also the top priority for improvement based on the Importance-Satisfaction Analysis.

iii
Executive Summ
ary Report Satisfaction with Specific City Services
• Community Investment. The highest levels of satisfaction with community investment, based upon the combined percentage of “very satisfied” and “satisfied” responses among residents who had an opinion, were: the quality of Downtown revitalization (59.7%), overall quality of new development in Downtown (54.2%), and the overall appearance of your neighborhood (44.2%). The community investment items residents indicated should receive the most emphasis over the next two years were: the housing quality in neighborhoods and the overall appearance of neighborhoods.
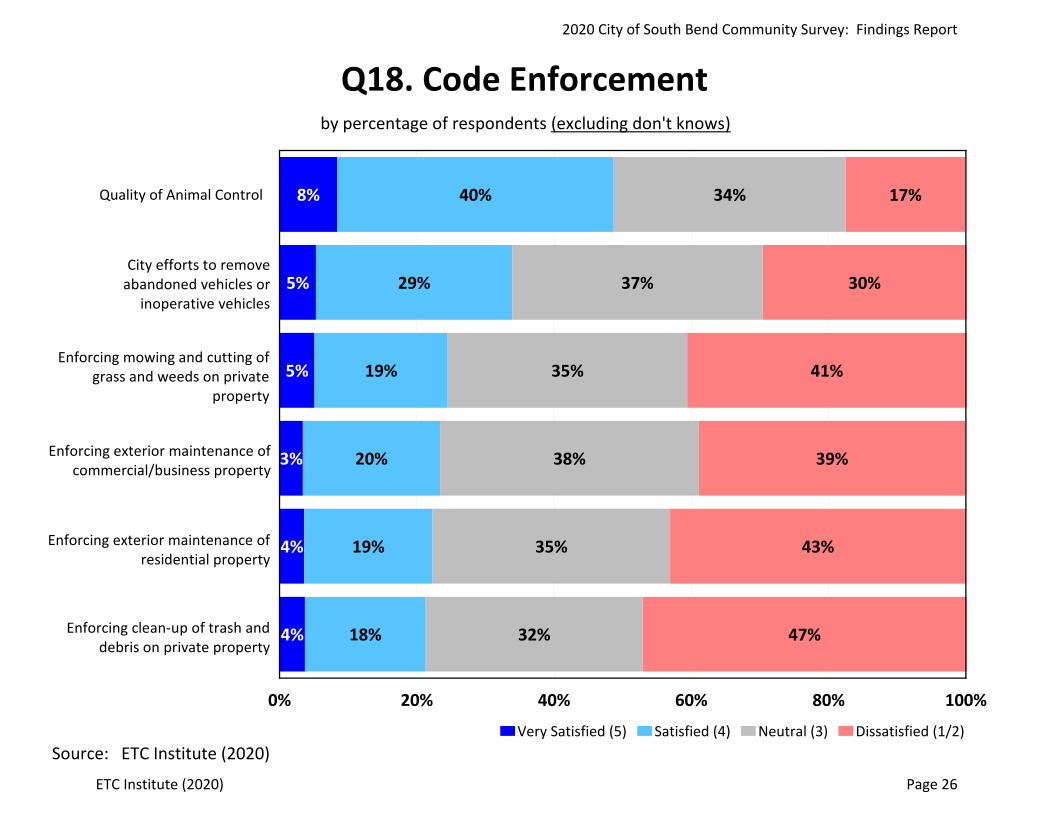
• Code Enforcement. The highest levels of satisfaction with city code enforcement, based upon the combined percentage of “very satisfied” and “satisfied” responses among residents who had an opinion, were: the quality of animal control (48.7%) and city efforts to remove abandoned or inoperative vehicles (33.9%). The two items respondents indicated should receive the most emphasis over the next two years were: enforcing clean-up trash and debris on private property and enforcing exterior maintenance of commercial/business properties.
• Solid Waste. The highest levels of satisfaction with city solid waste services, based upon the combined percentage of “very satisfied” and “satisfied” responses among residents who had an opinion, were: timeliness of trash services (79.3%), efforts by employees to ensure all of your trash/yard waste is removed (58.4%), and city efforts to keep you informed about disruptions to trash service (58.2%). The two items respondents indicated should receive the most emphasis over the next two years were: what is being charged for trash service and the quality of yard waste collection services.
• Public Safety. The highest levels of satisfaction with public safety services, based upon the combined percentage of “very satisfied” and “satisfied” responses among residents who had an opinion, were: the professionalism of fire and EMS personnel (86.9%), the professionalism of city police officers (65.4%), and how quickly police respond to emergencies (61.8%). The three items respondents indicated should receive the most emphasis over the next two years were: efforts by local government to prevent crime, the visibility of police in neighborhoods, and the overall feeling of safety in neighborhoods.
• Traffic and Transportation. The highest levels of satisfaction with traffic and transportation services, based upon the combined percentage of “very satisfied” and “satisfied” responses among residents who had an opinion, were: snow removal on major city streets (68.3%), the condition of street signs and traffic signals (66.0%), and the adequacy of street lighting in neighborhoods (52.1%). The three items residents indicated should receive the most emphasis over the next two years were: the condition of streets in neighborhoods, the condition of major city streets, and the condition of sidewalks in neighborhoods.
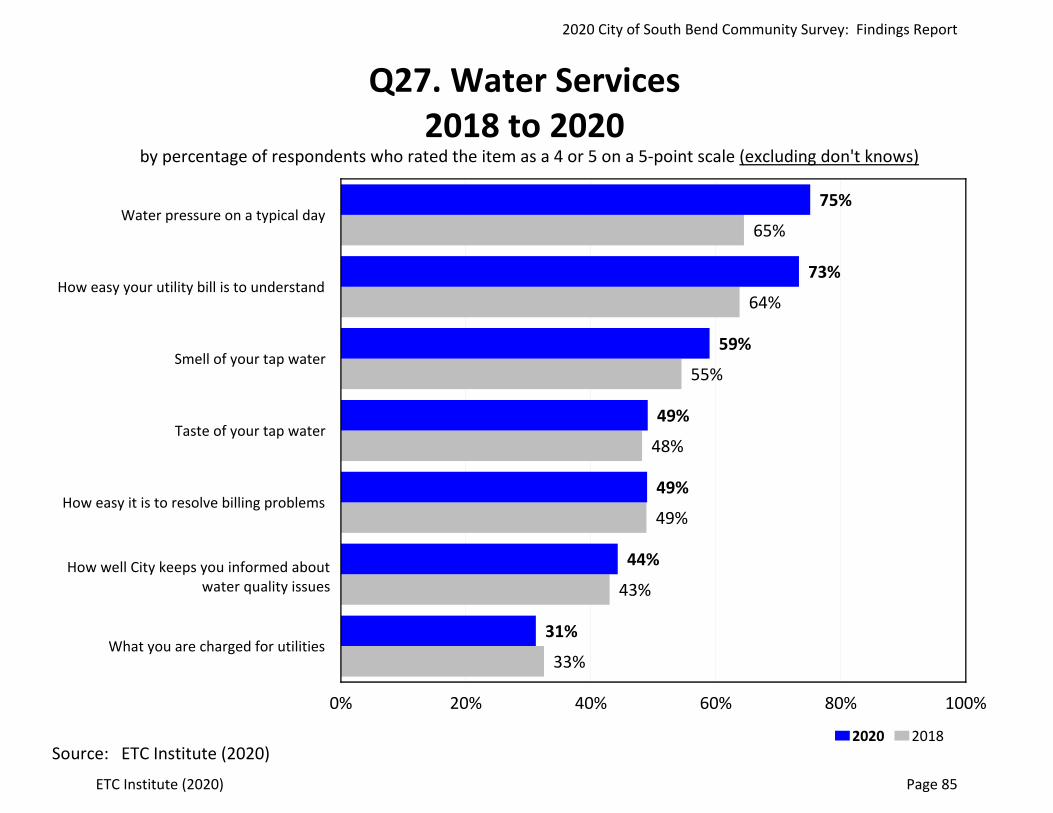
• Water Services. The highest levels of satisfaction with water utilities, based upon the combined percentage of “very satisfied” and “satisfied” responses among residents who had an opinion, were: the water pressure on a typical day (75.1%), the ease of
iv
Executive Summ
ary Report understanding the utility bill (13.3%), and the smell of tap water (59.0%). The two items residents indicated should receive the most emphasis over the next two years were: what respondents are charged for utilities and the taste of tap water.
• Venues, Parks, and Arts. Seventy-two percent (71.8%) of respondents have visited a city recreation facility or park in the past year. The highest levels of satisfaction with parks and recreation services, based upon the combined percentage of “very satisfied” and “satisfied” responses among residents who had an opinion, were: the maintenance of city parks (71.6%), access to parks in neighborhoods (67.2%), and the number of walking and biking trails (64.0%). The top two parks and recreation services respondents indicated should receive the most emphasis over the next two years were: the condition of restrooms in parks and the maintenance of city parks.
Additional Findings
Fifty-one percent (51.3%) of respondents indicated that they do not feel their neighborhood has improved over the past five years, 29.5% indicated their neighborhood has improved, and 19.2% indicated they have not lived in their neighborhood for five years.
Most (81.1%) of respondents do not belong to a neighborhood association. Of those who belong to a neighborhood association, 30.4% are “very satisfied” or “satisfied” with the city’s engagement with the neighborhood association while 43.2% of respondents indicated they were neutral, and 26.4% were either “dissatisfied” or “very dissatisfied.”
Only 10.5% of respondents indicated they have met the current Mayor of South Bend.
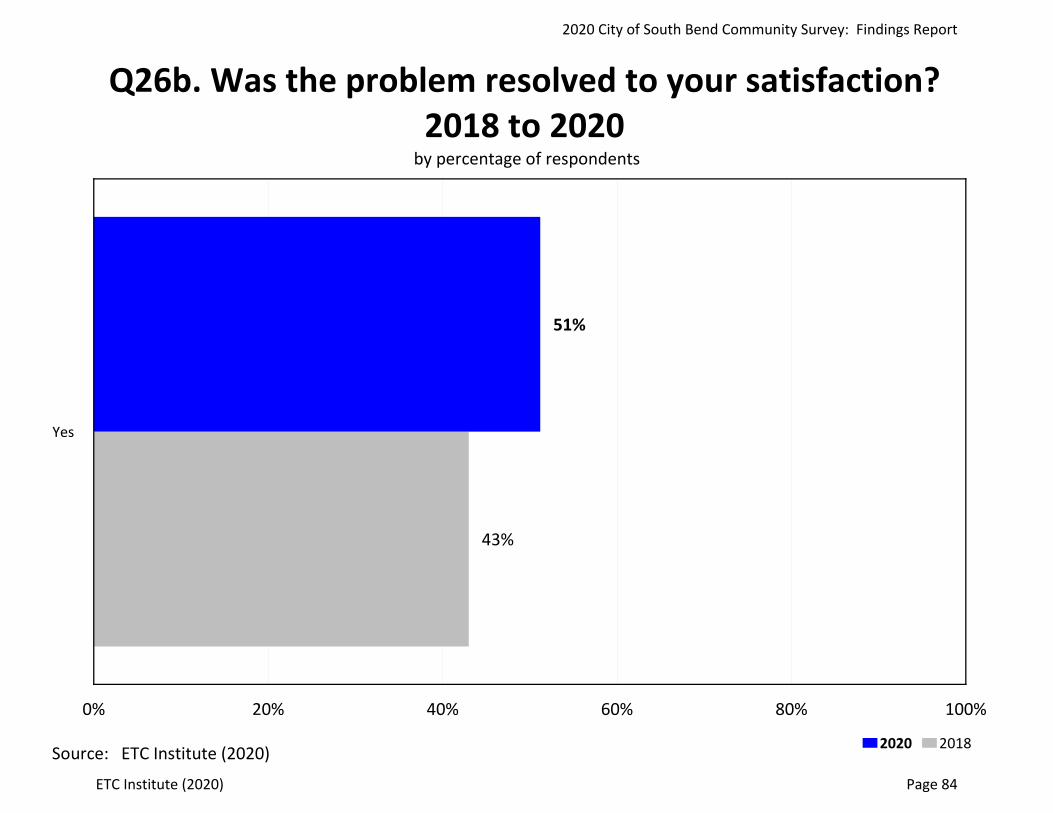
Fourteen percent (14.3%) of respondents indicated they have had a sewer backup in their home during the past year. Of those who have had a sewer backup, 63.2% indicated it was caused by problems in the city’s system and 51.2% indicated the problem was resolved to their satisfaction.
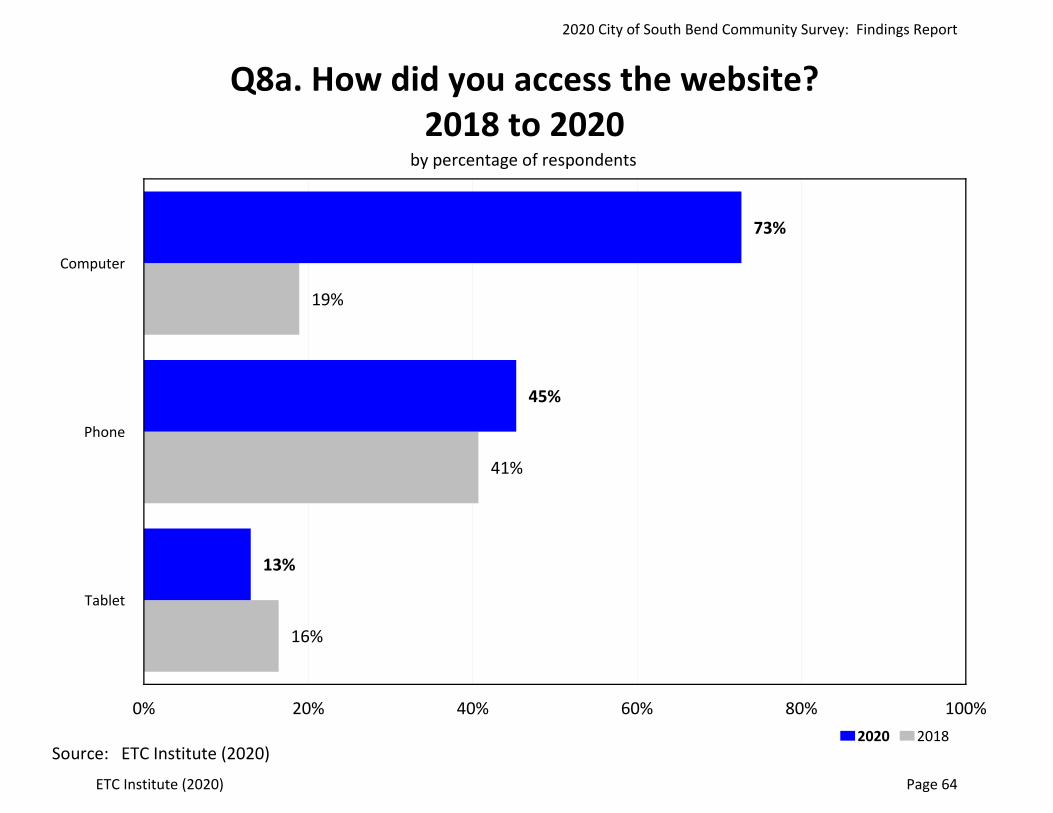
Fifty-three percent (52.8%) of respondents indicated that they or other members of their household used the City of South Bend’s website in the last year. Of those, 72.7% used a computer to access the website, 45.3% used a smartphone, and 13% used a tablet. Forty-nine percent (49.2%) of respondents indicated they were satisfied with the overall usefulness of the city’s website.
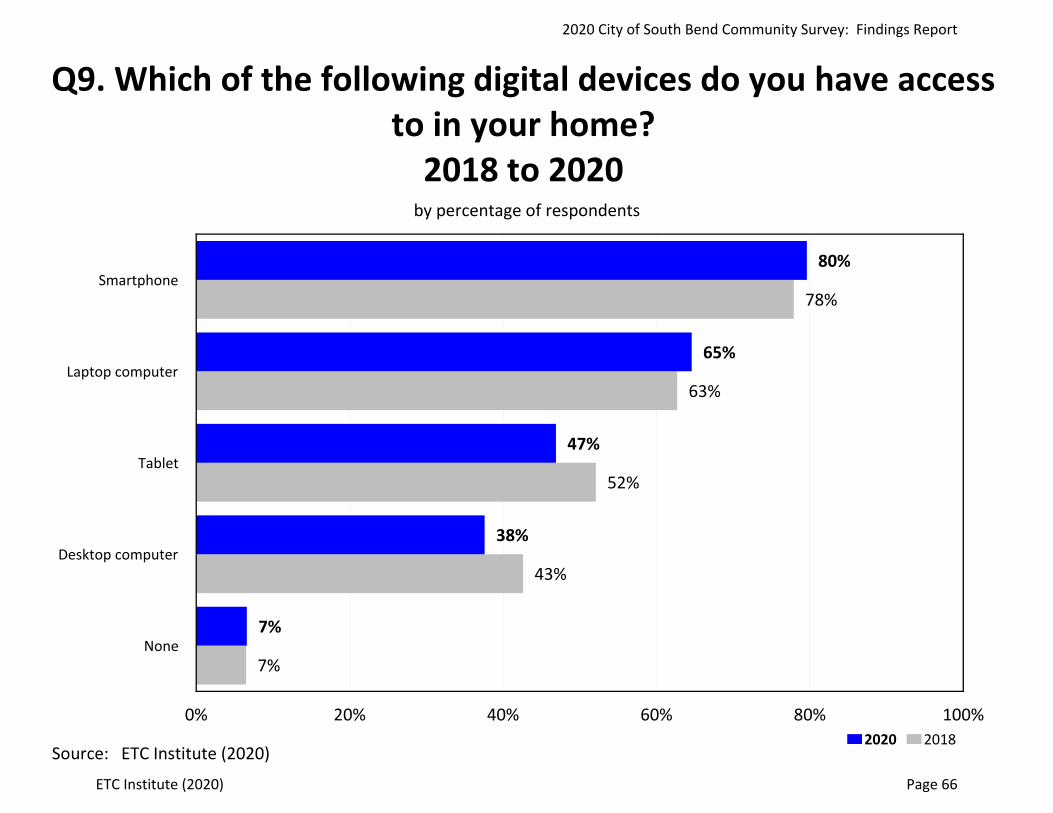
Eighty percent (79.6%) of respondents indicated they have access to a smartphone in their home, 64.6% have access to a laptop, 46.9% have access to a tablet, and 37.6% have access to a desktop computer. Only 6.6% of respondents indicated they did not have access to any of the digital devices listed on the survey.
Fifty-eight percent (58.0%) of respondents indicated they have called or visited the city with a question, problem, or complaint during the past year. Most (91.4%) of respondents contacted the city by phone, and 57.8% of respondents indicated it was either “very easy” or “easy” to address their issue with the city. Seventy-nine percent (79.5%) of respondents
v
Executive Summ
ary Report indicated that the employee they interacted with was “always” or “usually” courteous and polite, and 67.7% indicated the employee they interacted with “always” or “usually” gave accurate answers to questions.
Investment Priorities Recommended Priorities for the Next Two Years. In order to help the city identify investment priorities for the next two years, ETC Institute conducted an Importance-Satisfaction (I-S) analysis. This analysis examined the importance residents placed on each city service and the level of satisfaction with each service. By identifying services of high importance and low satisfaction, the analysis identified which services will have the most impact on overall satisfaction with city services over the next two years. If the city wants to improve its overall satisfaction rating, the city should prioritize investments in services with the highest Importance Satisfaction (I-S) ratings. Details regarding the methodology for the analysis are provided in Section 4 of this report.
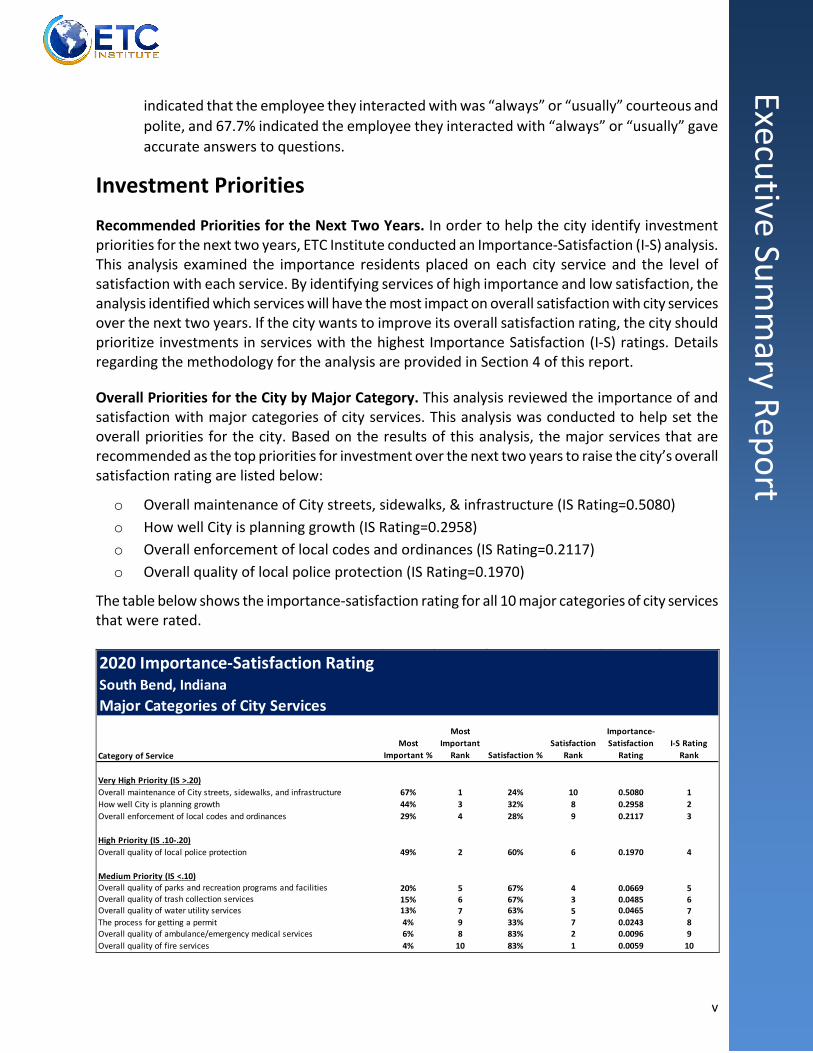
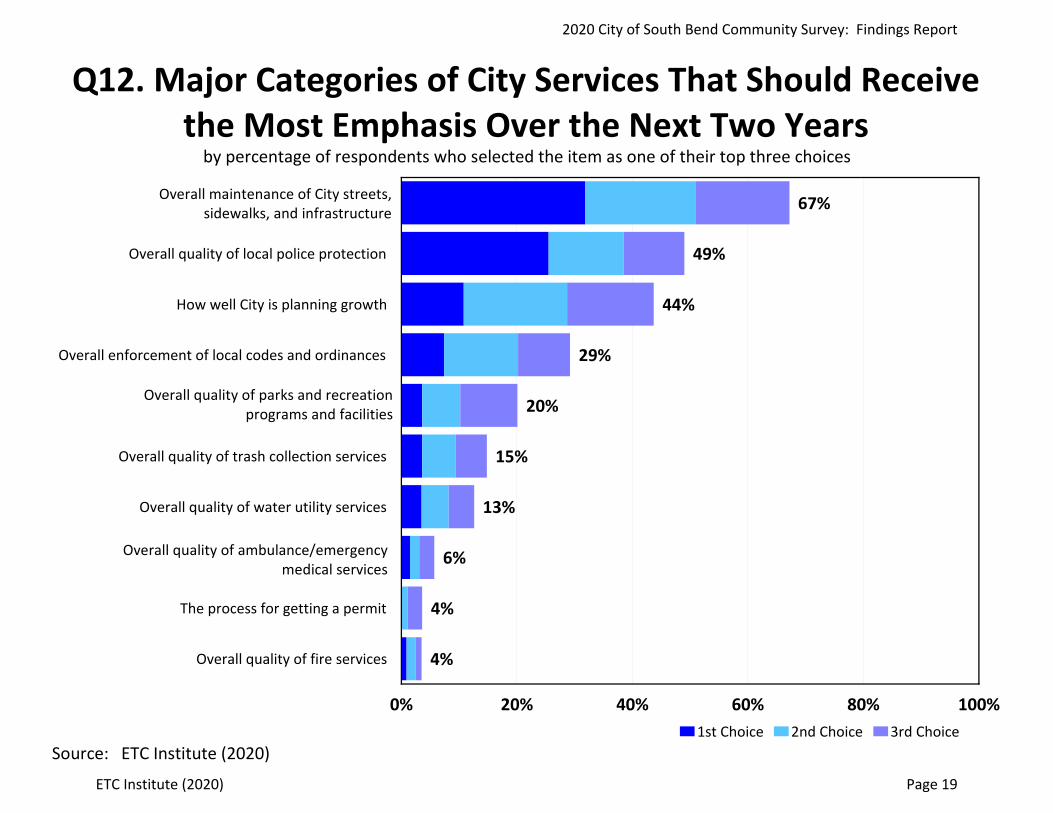
Overall Priorities for the City by Major Category. This analysis reviewed the importance of and satisfaction with major categories of city services. This analysis was conducted to help set the overall priorities for the city. Based on the results of this analysis, the major services that are recommended as the top priorities for investment over the next two years to raise the city’s overall satisfaction rating are listed below:
o Overall maintenance of City streets, sidewalks, & infrastructure (IS Rating=0.5080) o How well City is planning growth (IS Rating=0.2958) o Overall enforcement of local codes and ordinances (IS Rating=0.2117) o Overall quality of local police protection (IS Rating=0.1970)
The table below shows the importance-satisfaction rating for all 10 major categories of city services that were rated.
2020 Importance-Satisfaction RatingSouth Bend, IndianaMajor Categories of City Services
Category of ServiceMost
Important %
Most Important
Rank Satisfaction %Satisfaction
Rank
Importance-Satisfaction
RatingI-S Rating
Rank
Very High Priority (IS >.20)Overall maintenance of City streets, sidewalks, and infrastructure 67% 1 24% 10 0.5080 1How well City is planning growth 44% 3 32% 8 0.2958 2Overall enforcement of local codes and ordinances 29% 4 28% 9 0.2117 3
High Priority (IS .10-.20)Overall quality of local police protection 49% 2 60% 6 0.1970 4
Medium Priority (IS <.10)Overall quality of parks and recreation programs and facilities 20% 5 67% 4 0.0669 5Overall quality of trash collection services 15% 6 67% 3 0.0485 6Overall quality of water utility services 13% 7 63% 5 0.0465 7The process for getting a permit 4% 9 33% 7 0.0243 8Overall quality of ambulance/emergency medical services 6% 8 83% 2 0.0096 9Overall quality of fire services 4% 10 83% 1 0.0059 10

Section 1:
Charts and Graphs
2020 City of South Bend Community Survey: Findings Report
ETC Institute (2020) Page 1

46%
46%
49%
51%
46%
32%
43%
42%
35%
31%
31%
34%
10%
10%
12%
14%
19%
23%
1%
2%
4%
4%
4%
11%
The City should build reliable infrastructure
The City should support economic recovery
The City should rebuild vibrant neighborhoods
The City should protect the vulnerable
The City should expand access to opportunity
The City should reform public safety systems
0% 20% 40% 60% 80% 100%
Strongly Agree (5) Agree (4) Neutral (3) Disagree (1/2)
Q1. Perceptions of the Cityby percentage of respondents (excluding don't knows)
Source: ETC Institute (2020)
2020 City of South Bend Community Survey: Findings Report
ETC Institute (2020) Page 2

9%
5%
6%
5%
5%
2%
46%
33%
28%
23%
20%
17%
24%
35%
33%
30%
40%
43%
20%
28%
33%
41%
35%
38%
Overall quality of life in your community
Overall quality of local government services
Leadership of elected officials
Overall value you receive for your taxes and fees
0% 20% 40% 60% 80% 100%
Very Satisfied (5) Satisfied (4) Neutral (3) Dissatisfied (1/2)
Q2. City Leadershipby percentage of respondents (excluding don't knows)
Source: ETC Institute (2020)
Level of public involvement in local decision‐making and planning
Communication of opportunities for public involvement in City decision‐making and planning
2020 City of South Bend Community Survey: Findings Report
ETC Institute (2020) Page 3
14%
12%
11%
10%
9%
12%
44%
40%
31%
31%
32%
26%
21%
30%
24%
34%
26%
28%
21%
18%
34%
25%
33%
34%
As a place to live
As a place to work
As a place to raise children
As a place to visit
As a place to retire
0% 20% 40% 60% 80% 100%
Very Satisfied (5) Satisfied (4) Neutral (3) Dissatisfied (1/2)
Q3. Overall Ratings of South Bendby percentage of respondents (excluding don't knows)
Source: ETC Institute (2020)
As a community that is moving in the right direction
2020 City of South Bend Community Survey: Findings Report
ETC Institute (2020) Page 4

Q4. How do you feel about South Bend?by percentage of respondents who rated the item as a 1 to 10 on a 10‐point scale (excluding don't knows)
14%
34%
29%15%
8%
10-9 8-7 6-5 4-3 2-1Source: ETC Institute (2020)
2020 City of South Bend Community Survey: Findings Report
ETC Institute (2020) Page 5

8%
8%
5%
35%
31%
27%
37%
37%
54%
20%
24%
14%
Hours that customer service is available
Quality of social media outlets
0% 20% 40% 60% 80% 100%
Very Satisfied (5) Satisfied (4) Neutral (3) Dissatisfied (1/2)
Q5. Customer Service and Communicationby percentage of respondents (excluding don't knows)
Source: ETC Institute (2020)
Availability of information about local government services and activities
2020 City of South Bend Community Survey: Findings Report
ETC Institute (2020) Page 6

79%
44%
32%
18%
8%
12%
Local news
Social media
City website
Contacting City directly
Public meetings
Other
0% 20% 40% 60% 80% 100%
Q6. Which of the following are your primary sources of information about city issues, services, and events?
by percentage of respondents (multiple selections could be made)
Source: ETC Institute (2020)
2020 City of South Bend Community Survey: Findings Report
ETC Institute (2020) Page 7

64%
37%
31%
12%
8%
10%
Local news
Social media
City website
Contacting City directly
Public meetings
Other
0% 20% 40% 60% 80% 100%1st Choice 2nd Choice
Q7. Which two information sources do you most prefer to learn about city issues, services, and events?
by percentage of respondents who selected the item as one of their top two choices
Source: ETC Institute (2020)
2020 City of South Bend Community Survey: Findings Report
ETC Institute (2020) Page 8

Q8. Have you or other members of your household used the City of South Bend's website in the last year?
by percentage of respondents
Source: ETC Institute (2020)
53%
47%
Yes No
2020 City of South Bend Community Survey: Findings Report
ETC Institute (2020) Page 9

Q8a. How did you access the city’s website? by percentage of respondents who used the City of South Bend's website in the last year
(multiple selections could be made)
Source: ETC Institute (2020)
55%
35%
10%
Computer Phone Tablet
2020 City of South Bend Community Survey: Findings Report
ETC Institute (2020) Page 10

Q8b. How would you rate the overall usefulness of the city’s website?
Source: ETC Institute (2020)
by percentage of respondents who used the City of South Bend's website in the last year (excluding don’t knows)
6%
43%
43%
8%
Excellent Good Fair Poor
2020 City of South Bend Community Survey: Findings Report
ETC Institute (2020) Page 11

80%
65%
47%
38%
7%
Smartphone
Laptop computer
Tablet
Desktop computer
None
0% 20% 40% 60% 80% 100%
Q9. Which of the following digital devices do you have access to in your home?
by percentage of respondents (multiple selections could be made)
Source: ETC Institute (2020)
2020 City of South Bend Community Survey: Findings Report
ETC Institute (2020) Page 12

Q10. Have you called or visited the city with a question, problem, or complaint during the past year?
by percentage of respondents
Source: ETC Institute (2020)
58%
42%
Yes No
2020 City of South Bend Community Survey: Findings Report
ETC Institute (2020) Page 13

Q10a. How did you contact the city?
92%
5%
4%
Phone Email In-person
Source: ETC Institute (2020)
by percentage of respondents who have contacted the city in the last year
Social Media: 0.5%
2020 City of South Bend Community Survey: Findings Report
ETC Institute (2020) Page 14

Q10b. Did you contact 311?by percentage of respondents who have contacted the city in the last year
Source: ETC Institute (2020)
81%
19%
Yes No
2020 City of South Bend Community Survey: Findings Report
ETC Institute (2020) Page 15

Q10c. How easy was it to address your issue?
29%
29%
15%16%
11%
Very easy Somewhat easy Neutral Difficult Very difficult
Source: ETC Institute (2020)
by percentage of respondents who have contacted the city in the last year
2020 City of South Bend Community Survey: Findings Report
ETC Institute (2020) Page 16

42%
34%
37%
34%
14%
19%
7%
13%
They were courteous and polite
They gave accurate answers to your questions
0% 20% 40% 60% 80% 100%
Always (5) Usually (4) Sometimes (3) Seldom/Never (1/2)
Q10e. Quality of Customer Serviceby percentage of respondents (excluding don't knows)
Source: ETC Institute (2020)
2020 City of South Bend Community Survey: Findings Report
ETC Institute (2020) Page 17
38%
40%
21%
22%
19%
22%
9%
9%
5%
4%
45%
44%
46%
45%
44%
38%
24%
24%
22%
21%
15%
14%
17%
23%
22%
21%
53%
41%
38%
24%
2%
3%
16%
10%
15%
19%
14%
26%
35%
51%
Overall quality of fire services
Overall quality of trash collection services
Overall quality of water utility services
Overall quality of local police protection
The process for getting a permit
How well City is planning growth
Overall enforcement of local codes and ordinances
0% 20% 40% 60% 80% 100%
Very Satisfied (5) Satisfied (4) Neutral (3) Dissatisfied (1/2)
Q11. Major Categories of City Servicesby percentage of respondents (excluding don't knows)
Source: ETC Institute (2020)
Overall maintenance of City streets, sidewalks, and infrastructure
Overall quality of ambulance/emergency medical services
Overall quality of parks and recreation programs and facilities
2020 City of South Bend Community Survey: Findings Report
ETC Institute (2020) Page 18
67%
49%
44%
29%
20%
15%
13%
6%
4%
4%
Overall quality of local police protection
How well City is planning growth
Overall enforcement of local codes and ordinances
Overall quality of trash collection services
Overall quality of water utility services
The process for getting a permit
Overall quality of fire services
0% 20% 40% 60% 80% 100%1st Choice 2nd Choice 3rd Choice
Q12. Major Categories of City Services That Should Receive the Most Emphasis Over the Next Two Years
by percentage of respondents who selected the item as one of their top three choices
Source: ETC Institute (2020)
Overall maintenance of City streets, sidewalks, and infrastructure
Overall quality of ambulance/emergency medical services
Overall quality of parks and recreation programs and facilities
2020 City of South Bend Community Survey: Findings Report
ETC Institute (2020) Page 19

14%
14%
10%
9%
5%
3%
45%
41%
35%
30%
16%
13%
25%
30%
22%
31%
41%
41%
15%
15%
34%
31%
39%
43%
Overall quality of Downtown revitalization
Overall quality of new development in Downtown
Overall appearance of your neighborhood
Housing quality in your neighborhood
Communication of plans for development projects
0% 20% 40% 60% 80% 100%
Very Satisfied (5) Satisfied (4) Neutral (3) Dissatisfied (1/2)
Q13. Community Investmentby percentage of respondents (excluding don't knows)
Source: ETC Institute (2020)
Overall quality of new development in your neighborhood
2020 City of South Bend Community Survey: Findings Report
ETC Institute (2020) Page 20

35%
35%
29%
27%
20%
20%
Housing quality in your neighborhood
Overall appearance of your neighborhood
Communication of plans for development projects
Overall quality of Downtown revitalization
Overall quality of new development in Downtown
0% 20% 40% 60% 80% 100%
1st Choice 2nd Choice
Q14. Community Investments That Should Receive the Most Emphasis Over the Next Two Years
by percentage of respondents who selected the item as one of their top two choices
Source: ETC Institute (2020)
Overall quality of new development in your neighborhood
2020 City of South Bend Community Survey: Findings Report
ETC Institute (2020) Page 21

Q15. Do you feel that your neighborhood has improved over the past five years?
by percentage of respondents
Source: ETC Institute (2020)
30%
51%
19%
Yes No Have not lived in my neighborhood for 5 years
2020 City of South Bend Community Survey: Findings Report
ETC Institute (2020) Page 22

Q16. Do you belong to a neighborhood association?by percentage of respondents
Source: ETC Institute (2020)
19%
81%
Yes No
2020 City of South Bend Community Survey: Findings Report
ETC Institute (2020) Page 23

Q16a. How satisfied are you with the city’s engagement with your neighborhood association?
by percentage of respondents
Source: ETC Institute (2020)
6%
24%
43%
17%
10%
Very satisfied Satisfied Neutral Dissatisfied Very dissatisfied
2020 City of South Bend Community Survey: Findings Report
ETC Institute (2020) Page 24

Q17. Are you aware of development plans for your neighborhood?
by percentage of respondents
Source: ETC Institute (2020)
9%
91%
Yes No
2020 City of South Bend Community Survey: Findings Report
ETC Institute (2020) Page 25
8%
5%
5%
3%
4%
4%
40%
29%
19%
20%
19%
18%
34%
37%
35%
38%
35%
32%
17%
30%
41%
39%
43%
47%
Quality of Animal Control
0% 20% 40% 60% 80% 100%
Very Satisfied (5) Satisfied (4) Neutral (3) Dissatisfied (1/2)
Q18. Code Enforcementby percentage of respondents (excluding don't knows)
Source: ETC Institute (2020)
Enforcing clean‐up of trash and debris on private property
City efforts to remove abandoned vehicles or
inoperative vehicles
Enforcing mowing and cutting of grass and weeds on private
property
Enforcing exterior maintenance of commercial/business property
Enforcing exterior maintenance of residential property
2020 City of South Bend Community Survey: Findings Report
ETC Institute (2020) Page 26
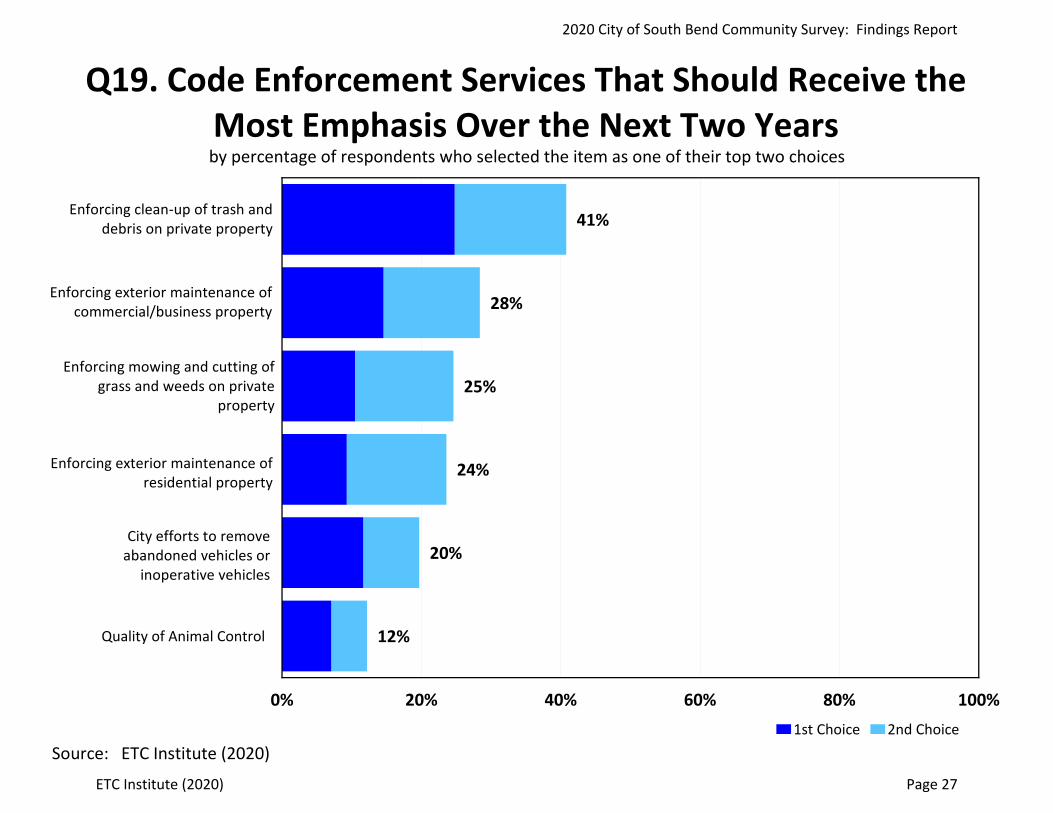
41%
28%
25%
24%
20%
12%Quality of Animal Control
0% 20% 40% 60% 80% 100%1st Choice 2nd Choice
Q19. Code Enforcement Services That Should Receive the Most Emphasis Over the Next Two Years
by percentage of respondents who selected the item as one of their top two choices
Source: ETC Institute (2020)
Enforcing clean‐up of trash and debris on private property
City efforts to remove abandoned vehicles or
inoperative vehicles
Enforcing mowing and cutting of grass and weeds on private
property
Enforcing exterior maintenance of commercial/business property
Enforcing exterior maintenance of residential property
2020 City of South Bend Community Survey: Findings Report
ETC Institute (2020) Page 27
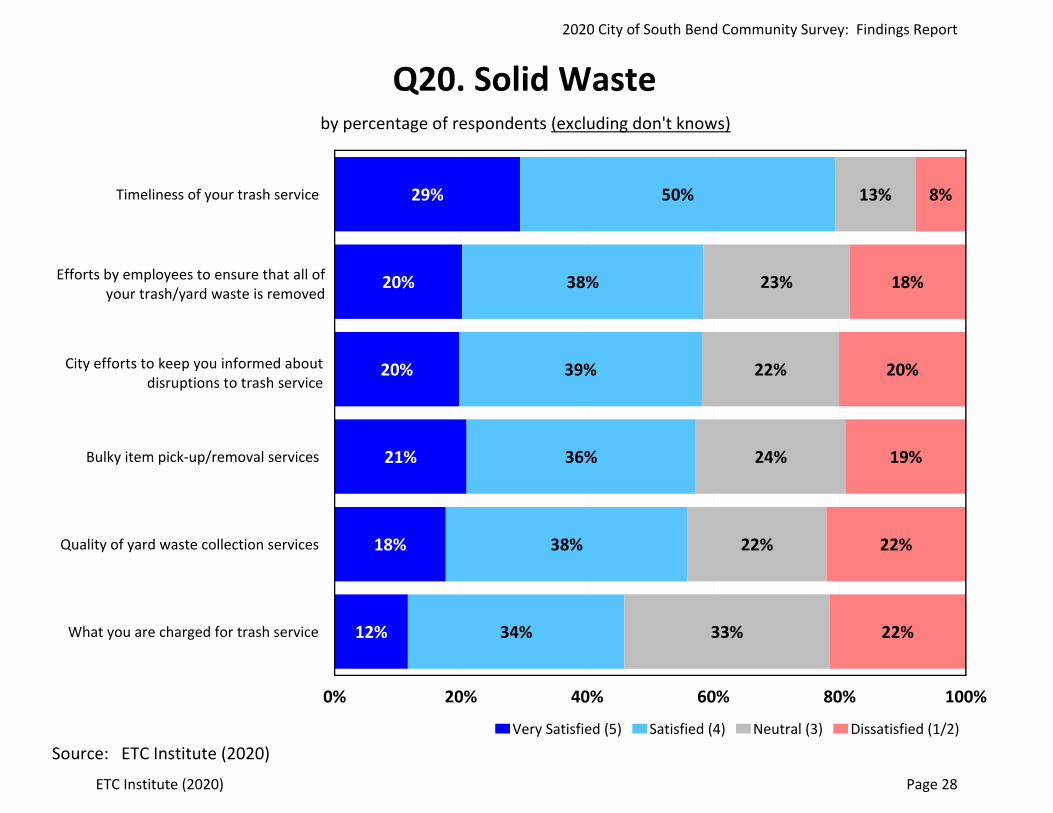
29%
20%
20%
21%
18%
12%
50%
38%
39%
36%
38%
34%
13%
23%
22%
24%
22%
33%
8%
18%
20%
19%
22%
22%
Timeliness of your trash service
Bulky item pick‐up/removal services
Quality of yard waste collection services
What you are charged for trash service
0% 20% 40% 60% 80% 100%
Very Satisfied (5) Satisfied (4) Neutral (3) Dissatisfied (1/2)
Q20. Solid Wasteby percentage of respondents (excluding don't knows)
Source: ETC Institute (2020)
City efforts to keep you informed about disruptions to trash service
Efforts by employees to ensure that all of your trash/yard waste is removed
2020 City of South Bend Community Survey: Findings Report
ETC Institute (2020) Page 28

26%
24%
23%
23%
22%
13%
What you are charged for trash service
Quality of yard waste collection services
Bulky item pick‐up/removal services
Timeliness of your trash service
0% 20% 40% 60% 80% 100%
1st Choice 2nd Choice
Q21. Solid Waste Services That Should Receive the Most Emphasis Over the Next Two Years
by percentage of respondents who selected the item as one of their top two choices
Source: ETC Institute (2020)
City efforts to keep you informed about disruptions to trash service
Efforts by employees to ensure that all of your trash/yard waste is removed
2020 City of South Bend Community Survey: Findings Report
ETC Institute (2020) Page 29

44%
30%
26%
13%
16%
10%
13%
13%
9%
6%
43%
35%
36%
38%
34%
30%
26%
26%
26%
19%
11%
19%
24%
26%
33%
31%
48%
47%
34%
31%
2%
15%
14%
23%
18%
29%
13%
14%
32%
45%
Professionalism of fire and EMS personnel
Professionalism of City police officers
How quickly police respond to emergencies
Overall feeling of safety in your neighborhood
Enforcement of local traffic laws
Fire education programs in your community
Fire inspection programs in your community
Visibility of police in neighborhoods
0% 20% 40% 60% 80% 100%
Very Satisfied (5) Satisfied (4) Neutral (3) Dissatisfied (1/2)
Q22. Public Safetyby percentage of respondents (excluding don't knows)
Source: ETC Institute (2020)
Efforts by local government in your area to prevent crime
Visibility of police in commercial and retail areas
2020 City of South Bend Community Survey: Findings Report
ETC Institute (2020) Page 30

51%
37%
36%
26%
22%
18%
17%
6%
6%
4%
Visibility of police in neighborhoods
Overall feeling of safety in your neighborhood
Professionalism of City police officers
Enforcement of local traffic laws
How quickly police respond to emergencies
Fire education programs in your community
Fire inspection programs in your community
Professionalism of fire & EMS personnel
0% 20% 40% 60% 80% 100%1st Choice 2nd Choice 3rd Choice
Q23. Public Safety Services That Should Receive the Most Emphasis Over the Next Two Years
by percentage of respondents who selected the item as one of their top three choices
Source: ETC Institute (2020)
Efforts by local government in your area to prevent crime
Visibility of police in commercial and retail areas
2020 City of South Bend Community Survey: Findings Report
ETC Institute (2020) Page 31
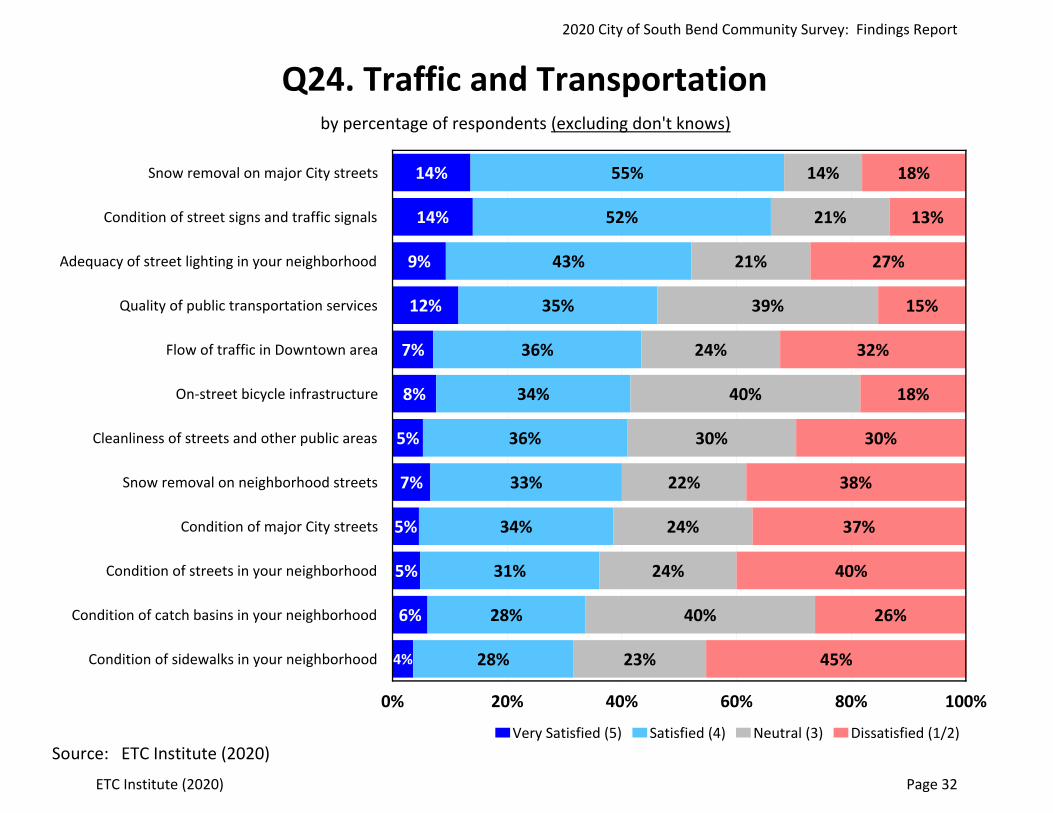
14%
14%
9%
12%
7%
8%
5%
7%
5%
5%
6%
4%
55%
52%
43%
35%
36%
34%
36%
33%
34%
31%
28%
28%
14%
21%
21%
39%
24%
40%
30%
22%
24%
24%
40%
23%
18%
13%
27%
15%
32%
18%
30%
38%
37%
40%
26%
45%
Snow removal on major City streets
Condition of street signs and traffic signals
Adequacy of street lighting in your neighborhood
Quality of public transportation services
Flow of traffic in Downtown area
On‐street bicycle infrastructure
Cleanliness of streets and other public areas
Snow removal on neighborhood streets
Condition of major City streets
Condition of streets in your neighborhood
Condition of catch basins in your neighborhood
Condition of sidewalks in your neighborhood
0% 20% 40% 60% 80% 100%
Very Satisfied (5) Satisfied (4) Neutral (3) Dissatisfied (1/2)
Q24. Traffic and Transportationby percentage of respondents (excluding don't knows)
Source: ETC Institute (2020)
2020 City of South Bend Community Survey: Findings Report
ETC Institute (2020) Page 32
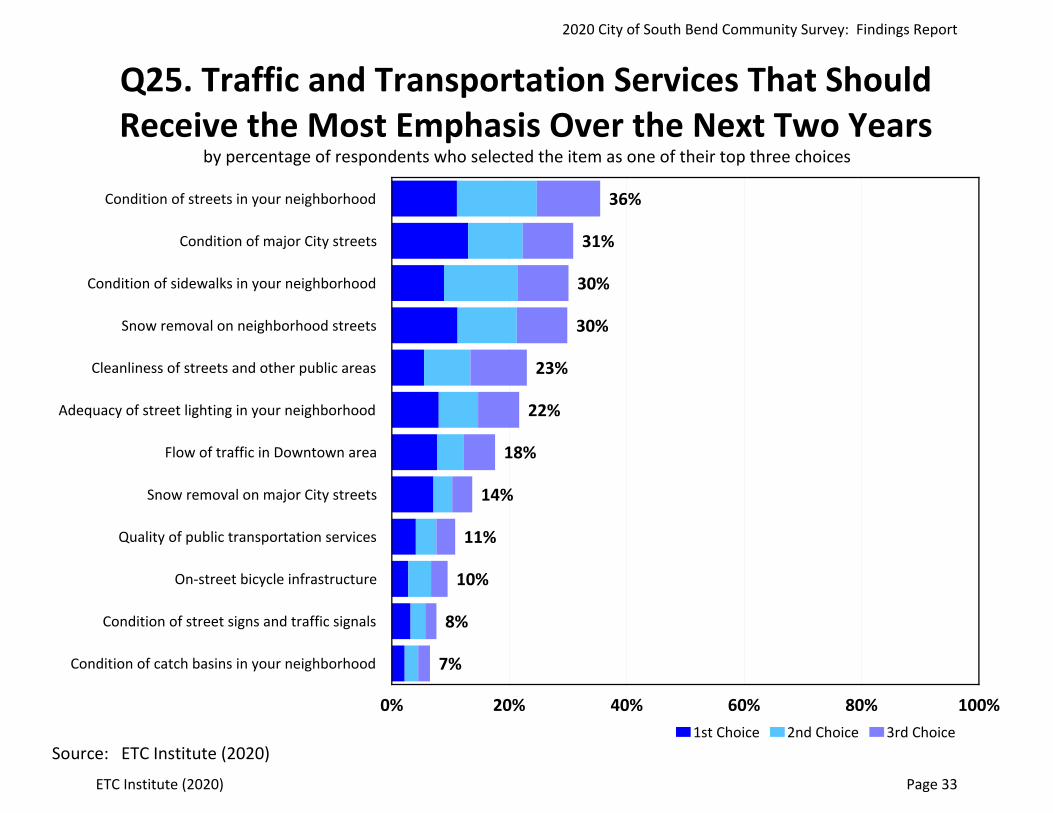
36%
31%
30%
30%
23%
22%
18%
14%
11%
10%
8%
7%
Condition of streets in your neighborhood
Condition of major City streets
Condition of sidewalks in your neighborhood
Snow removal on neighborhood streets
Cleanliness of streets and other public areas
Adequacy of street lighting in your neighborhood
Flow of traffic in Downtown area
Snow removal on major City streets
Quality of public transportation services
On‐street bicycle infrastructure
Condition of street signs and traffic signals
Condition of catch basins in your neighborhood
0% 20% 40% 60% 80% 100%1st Choice 2nd Choice 3rd Choice
Q25. Traffic and Transportation Services That Should Receive the Most Emphasis Over the Next Two Years
by percentage of respondents who selected the item as one of their top three choices
Source: ETC Institute (2020)
2020 City of South Bend Community Survey: Findings Report
ETC Institute (2020) Page 33

Q26. Have you had a sewer backup in your home during the past year?
by percentage of respondents
Source: ETC Institute (2020)
14%
86%
Yes No
2020 City of South Bend Community Survey: Findings Report
ETC Institute (2020) Page 34

Q26a. Was the backup caused by problems in the City's system?
by percentage of respondents who had a sewer backup within the past year
Source: ETC Institute (2020)
63%
37%
Yes No
2020 City of South Bend Community Survey: Findings Report
ETC Institute (2020) Page 35
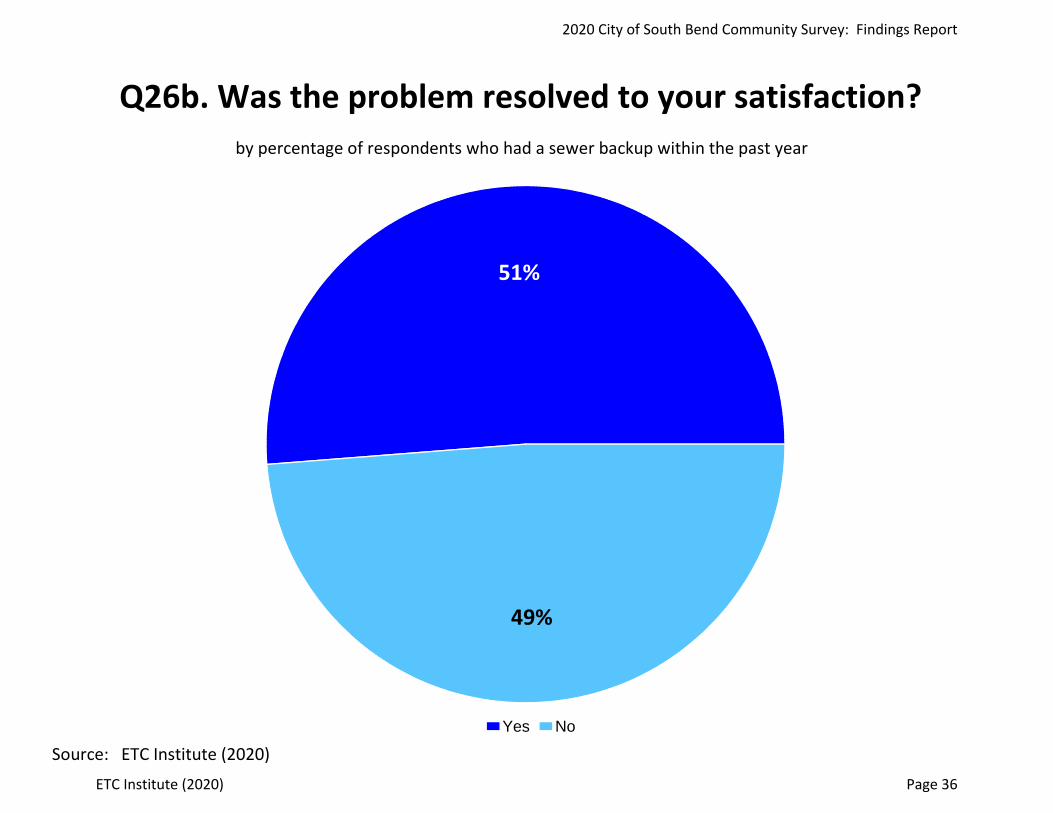
Q26b. Was the problem resolved to your satisfaction?by percentage of respondents who had a sewer backup within the past year
Source: ETC Institute (2020)
51%
49%
Yes No
2020 City of South Bend Community Survey: Findings Report
ETC Institute (2020) Page 36
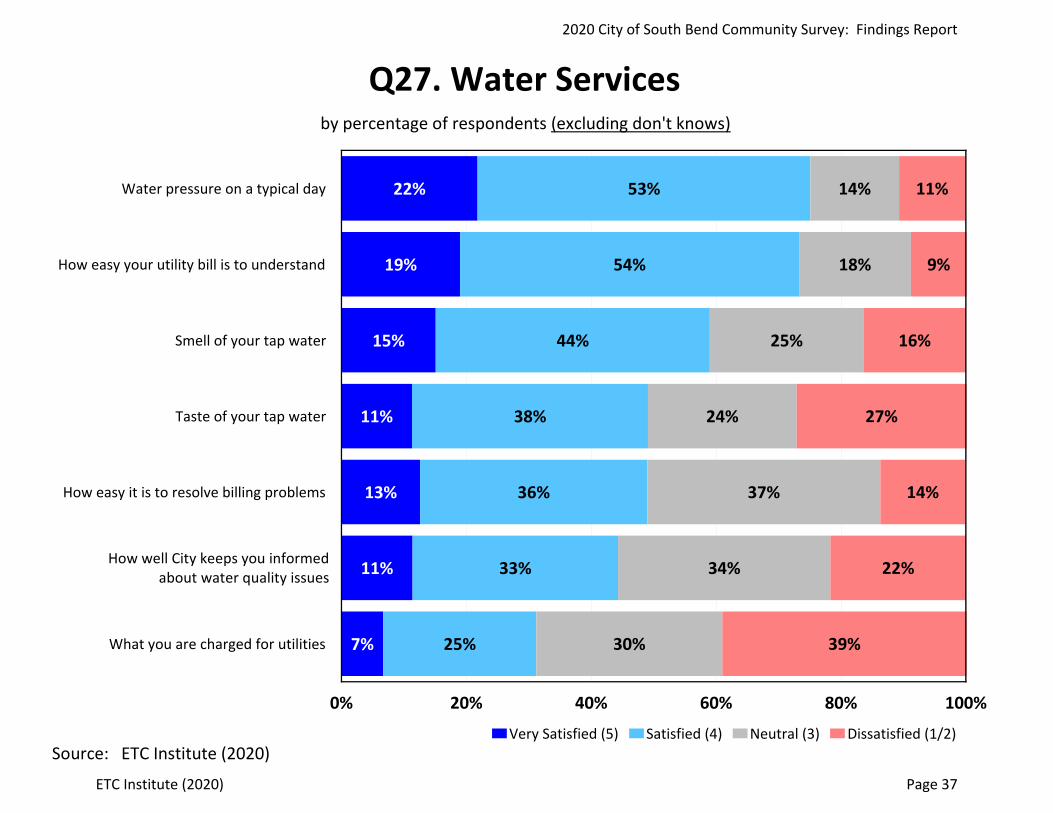
22%
19%
15%
11%
13%
11%
7%
53%
54%
44%
38%
36%
33%
25%
14%
18%
25%
24%
37%
34%
30%
11%
9%
16%
27%
14%
22%
39%
Water pressure on a typical day
How easy your utility bill is to understand
Smell of your tap water
Taste of your tap water
How easy it is to resolve billing problems
What you are charged for utilities
0% 20% 40% 60% 80% 100%
Very Satisfied (5) Satisfied (4) Neutral (3) Dissatisfied (1/2)
Q27. Water Servicesby percentage of respondents (excluding don't knows)
Source: ETC Institute (2020)
How well City keeps you informed about water quality issues
2020 City of South Bend Community Survey: Findings Report
ETC Institute (2020) Page 37

45%
30%
22%
14%
13%
7%
7%
What you are charged for utilities
Taste of your tap water
Water pressure on a typical day
Smell of your tap water
How easy it is to resolve billing problems
How easy your utility bill is to understand
0% 20% 40% 60% 80% 100%1st Choice 2nd Choice
Q28. Water Services That Should Receive the Most Emphasis Over the Next Two Years
by percentage of respondents who selected the item as one of their top two choices
Source: ETC Institute (2020)
How well City keeps you informed about water quality issues
2020 City of South Bend Community Survey: Findings Report
ETC Institute (2020) Page 38

20%
19%
18%
13%
11%
10%
7%
51%
48%
46%
31%
31%
24%
15%
20%
22%
21%
45%
43%
40%
43%
8%
11%
15%
11%
16%
26%
35%
Maintenance of City parks
Access to parks in your neighborhood
Number of walking and biking trails
Fees charged for recreation programs
Condition of restrooms in public parks
0% 20% 40% 60% 80% 100%
Very Satisfied (5) Satisfied (4) Neutral (3) Dissatisfied (1/2)
Q29. Venues, Parks, and Artsby percentage of respondents (excluding don't knows)
Source: ETC Institute (2020)
Ease of registering for recreation programs such as classes, trips, and
special events
Availability of recreation programming in your neighborhood
2020 City of South Bend Community Survey: Findings Report
ETC Institute (2020) Page 39
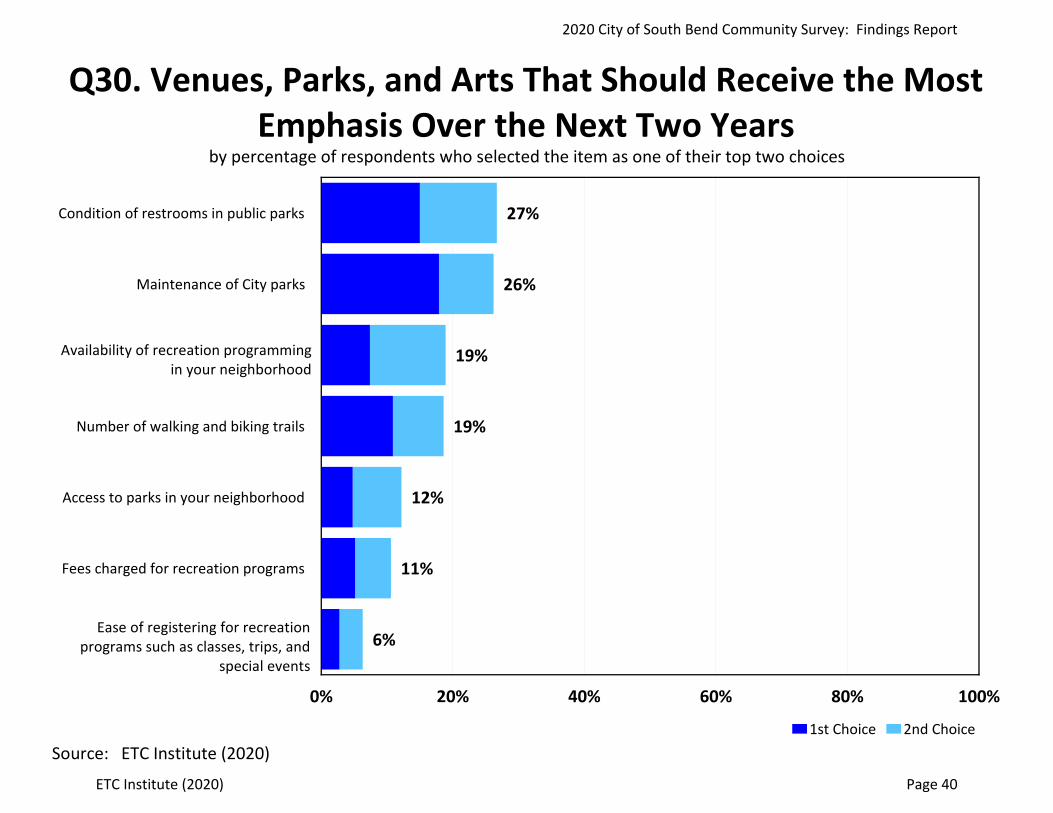
27%
26%
19%
19%
12%
11%
6%
Condition of restrooms in public parks
Maintenance of City parks
Number of walking and biking trails
Access to parks in your neighborhood
Fees charged for recreation programs
0% 20% 40% 60% 80% 100%
1st Choice 2nd Choice
Q30. Venues, Parks, and Arts That Should Receive the Most Emphasis Over the Next Two Years
by percentage of respondents who selected the item as one of their top two choices
Source: ETC Institute (2020)
Ease of registering for recreation programs such as classes, trips, and
special events
Availability of recreation programming in your neighborhood
2020 City of South Bend Community Survey: Findings Report
ETC Institute (2020) Page 40

Q31. In the past year, have you visited a city recreation facility or park?
by percentage of respondents
Source: ETC Institute (2020)
72%
28%
Yes No
2020 City of South Bend Community Survey: Findings Report
ETC Institute (2020) Page 41

Q32. Approximately, how many years have you lived in South Bend?
by percentage of respondents
15%
11%6%
10%
16%
43%
0-5 6-10 11-15 16-20 21-30 31+
Source: ETC Institute (2020)
2020 City of South Bend Community Survey: Findings Report
ETC Institute (2020) Page 42
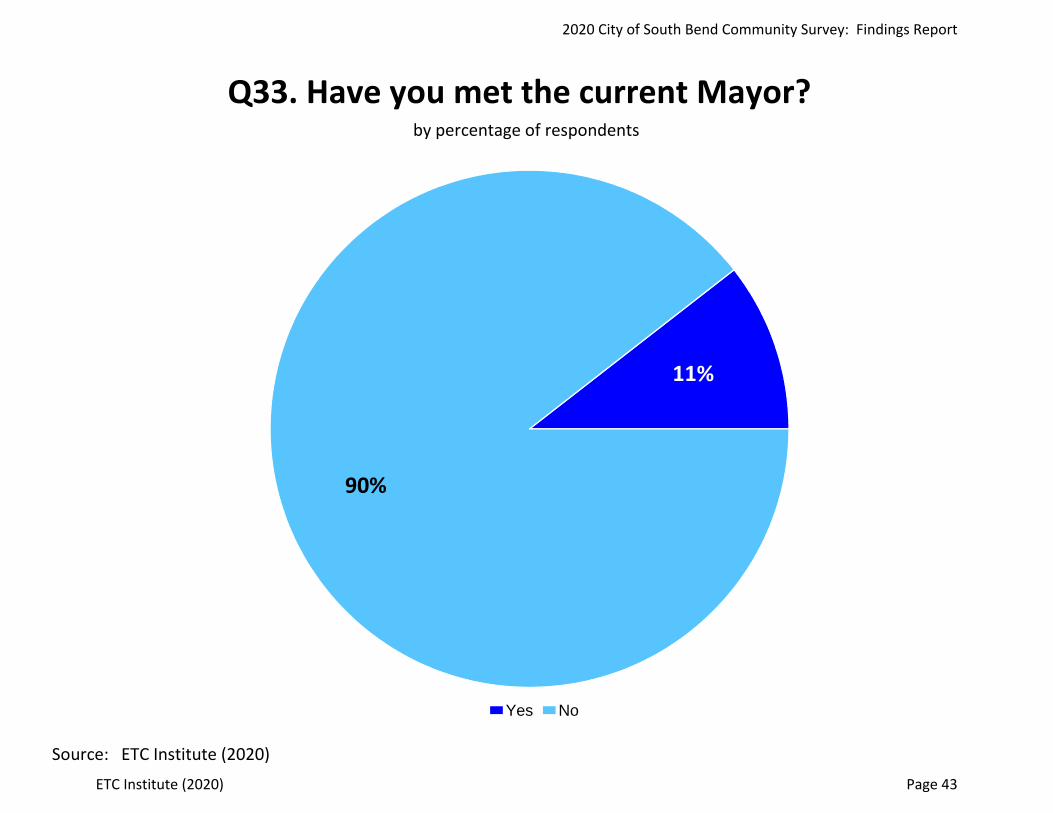
Q33. Have you met the current Mayor?by percentage of respondents
Source: ETC Institute (2020)
11%
90%
Yes No
2020 City of South Bend Community Survey: Findings Report
ETC Institute (2020) Page 43

Q34. Do you own or rent your current residence?by percentage of respondents
Source: ETC Institute (2020)
67%
33%
Own Rent
2020 City of South Bend Community Survey: Findings Report
ETC Institute (2020) Page 44

Q35. What is your age?by percentage of respondents
22%
20%
21%
18%
20%
18-34 35-44 45-54 55-64 65+
Source: ETC Institute (2020)
2020 City of South Bend Community Survey: Findings Report
ETC Institute (2020) Page 45

Q36. What is your gender identity?by percentage of respondents
49%
51%
Male Female
Source: ETC Institute (2020)Gender variant/Non-Conforming: 0.1%
2020 City of South Bend Community Survey: Findings Report
ETC Institute (2020) Page 46

Q37. Including yourself, how many people live in your household?
by percentage of respondents
19%38%
23%11%
6%
2%1%
1 2 3 4 5 6 7+Source: ETC Institute (2020)
2020 City of South Bend Community Survey: Findings Report
ETC Institute (2020) Page 47

Q38. How many people in your household are employed?
by percentage of respondents
19%44%
29%
6%
2%
0 1 2 3 4+
Source: ETC Institute (2020)
2020 City of South Bend Community Survey: Findings Report
ETC Institute (2020) Page 48

Q39. Which of the following best describes your employment status?
by percentage of respondents
51%
13%
4%3% 24%
1%
6%
Employed full time Employed part time Not employed, looking for work Not employed, not looking for workRetired Student Disabled, not able to work
Source: ETC Institute (2020)
2020 City of South Bend Community Survey: Findings Report
ETC Institute (2020) Page 49

Q40. Would you say your total annual household income is...
by percentage of respondents
11%
19%
33%
22%
9%
6%
Under $15K $15K to $29,999 $30K to $59,999$60K to $99,999 $100K to $124,999 $125K+
Source: ETC Institute (2020)
2020 City of South Bend Community Survey: Findings Report
ETC Institute (2020) Page 50
63%
25%
14%
2%
2%
1%
White/Caucasian
African American/Black
Hispanic/Latinx
Native American/Eskimo
Asian/Pacific Islander
Other
0% 20% 40% 60% 80% 100%
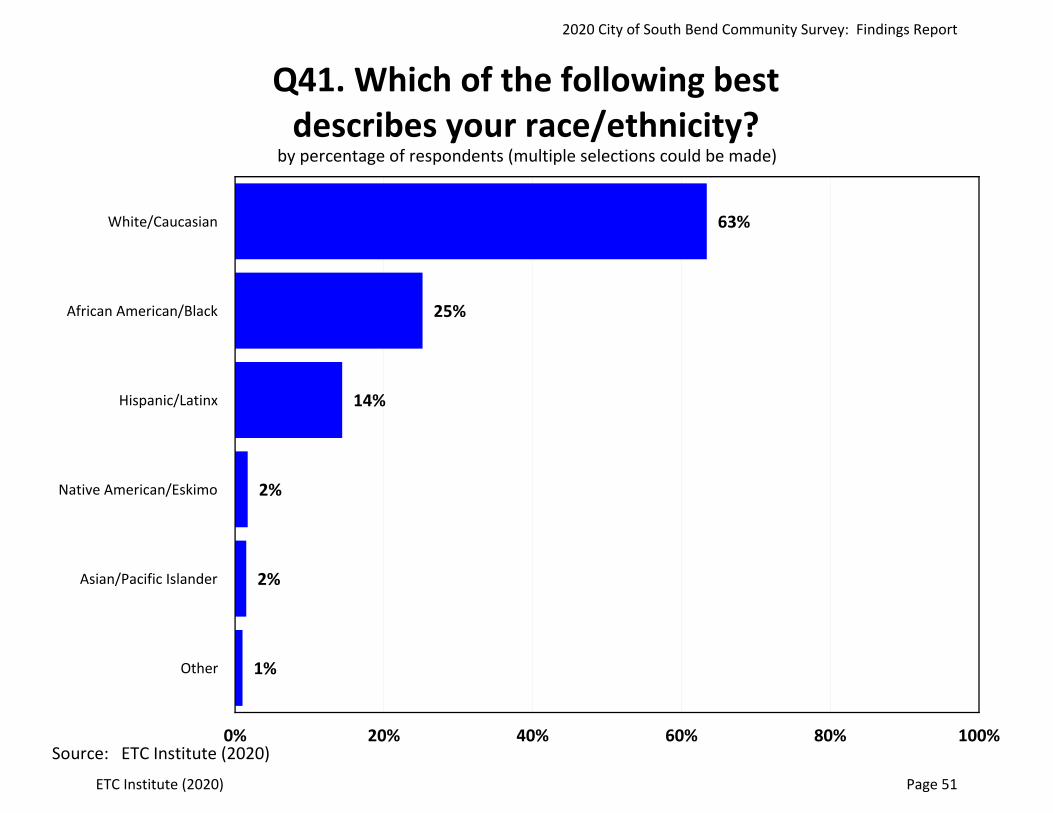
Q41. Which of the following best describes your race/ethnicity?
by percentage of respondents (multiple selections could be made)
Source: ETC Institute (2020)
2020 City of South Bend Community Survey: Findings Report
ETC Institute (2020) Page 51

Q42. How would you describe your overall state of health these days. Would you say...
by percentage of respondents
Source: ETC Institute (2020)
16%45%
20%
15%
5%
Excellent Good Average Fair Poor
2020 City of South Bend Community Survey: Findings Report
ETC Institute (2020) Page 52

Q43. How would you compare your standard of living to your parents’ when they were your age?
by percentage of respondents
Source: ETC Institute (2020)
17%
28%
34% 15%
6%
Much better Somewhat better About the same Somewhat worse Much worse
2020 City of South Bend Community Survey: Findings Report
ETC Institute (2020) Page 53

Q44. Do you think local officials in your community are doing a good job of keeping your informed
about the COVID‐19 Pandemic?by percentage of respondents
60%
23%
17%
Yes No Don't knowSource: ETC Institute (2020)
2020 City of South Bend Community Survey: Findings Report
ETC Institute (2020) Page 54

Q45. Please rate your satisfaction with the City's response to COVID‐19
by percentage of respondents
Source: ETC Institute (2020)
10%
36%
26%
18%
10%
Very satisfied Satisfied Neutral Dissatisfied Very dissatisfied
2020 City of South Bend Community Survey: Findings Report
ETC Institute (2020) Page 55

Q46. Please rate your satisfaction with the County's response to COVID‐19
by percentage of respondents
Source: ETC Institute (2020)
6%
24%
43%
17%
10%
Very satisfied Satisfied Neutral Dissatisfied Very dissatisfied
2020 City of South Bend Community Survey: Findings Report
ETC Institute (2020) Page 56

Section 2:
Trend Charts
2020 City of South Bend Community Survey: Findings Report
ETC Institute (2020) Page 57

56%
38%
34%
29%
25%
19%
50%
41%
43%
33%
34%
29%
Overall quality of life in your community
Overall quality of local government services
Leadership of elected officials
Overall value you receive for your taxes and fees
0% 20% 40% 60% 80% 100%
2020 2018
Q2. City Leadership2018 to 2020
by percentage of respondents who rated the item as a 4 or 5 on a 5‐point scale (excluding don't knows)
Source: ETC Institute (2020)
Communication of opportunities for public involvement in City decision‐making and
planning
Level of public involvement in local decision‐making and planning
2020 City of South Bend Community Survey: Findings Report
ETC Institute (2020) Page 58
58%
52%
42%
41%
41%
38%
59%
54%
45%
45%
49%
35%
As a place to live
As a place to work
As a place to raise children
As a place to visit
As a place to retire
0% 20% 40% 60% 80% 100%2020 2018
Q3. Overall Ratings of South Bend2018 to 2020
by percentage of respondents who rated the item as a 4 or 5 on a 5‐point scale (excluding don't knows)
Source: ETC Institute (2020)
As a community that is moving in the right
direction
2020 City of South Bend Community Survey: Findings Report
ETC Institute (2020) Page 59
14%
34%
29%
15%
8%
14%
38%
34%
9%
6%
10‐9
8‐7
6‐5
4‐3
2‐1
0% 20% 40% 60% 80% 100%2020 2018
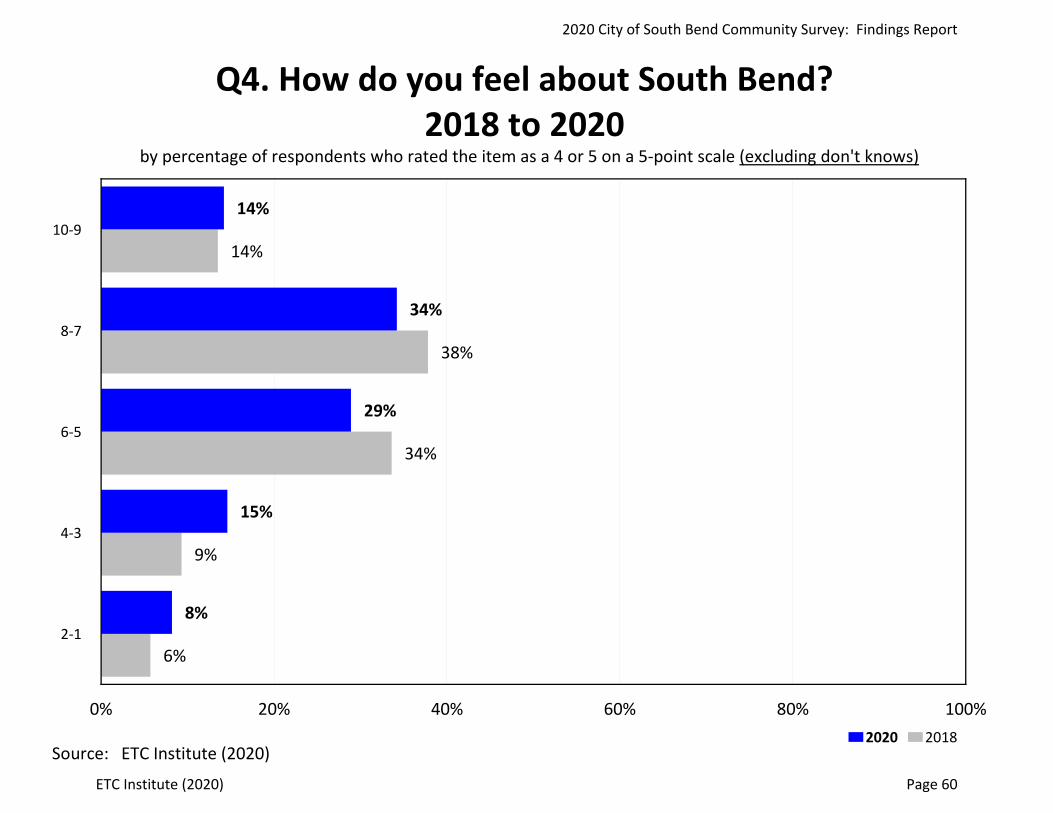
Q4. How do you feel about South Bend?2018 to 2020
by percentage of respondents who rated the item as a 4 or 5 on a 5‐point scale (excluding don't knows)
Source: ETC Institute (2020)
2020 City of South Bend Community Survey: Findings Report
ETC Institute (2020) Page 60

43%
39%
33%
48%
49%
43%
Hours that customer service is available
Quality of social media outlets
0% 20% 40% 60% 80% 100%
2020 2018
Q5. Customer Service and Communication2018 to 2020
by percentage of respondents who rated the item as a 4 or 5 on a 5‐point scale (excluding don't knows)
Source: ETC Institute (2020)
Availability of information about local government services and activities
2020 City of South Bend Community Survey: Findings Report
ETC Institute (2020) Page 61

79%
44%
32%
18%
8%
12%
83%
44%
33%
19%
10%
15%
Local news
Social media
City website
Contacting City directly
Public meetings
Other
0% 20% 40% 60% 80% 100%2020 2018
Q6. Which of the following are your PRIMARY SOURCES of information about city issues, services, and events?
2018 to 2020by percentage of respondents
Source: ETC Institute (2020)
2020 City of South Bend Community Survey: Findings Report
ETC Institute (2020) Page 62

53%
53%
Yes
0% 20% 40% 60% 80% 100%
2020 2018
Q8. Have you or other members of your household used the City of South Bend's website in the last year?
2018 to 2020by percentage of respondents
Source: ETC Institute (2020)
2020 City of South Bend Community Survey: Findings Report
ETC Institute (2020) Page 63
73%
45%
13%
19%
41%
16%
Computer
Phone
Tablet
0% 20% 40% 60% 80% 100%2020 2018
Q8a. How did you access the website?2018 to 2020
by percentage of respondents
Source: ETC Institute (2020)
2020 City of South Bend Community Survey: Findings Report
ETC Institute (2020) Page 64

6%
43%
43%
8%
9%
52%
33%
7%
Excellent
Good
Fair
Poor
0% 20% 40% 60% 80% 100%
2020 2018
Q8b. How would you rate the overall usefulness of the City's website?
2018 to 2020by percentage of respondents
Source: ETC Institute (2020)
2020 City of South Bend Community Survey: Findings Report
ETC Institute (2020) Page 65
80%
65%
47%
38%
7%
78%
63%
52%
43%
7%
Smartphone
Laptop computer
Tablet
Desktop computer
None
0% 20% 40% 60% 80% 100%2020 2018
Q9. Which of the following digital devices do you have access to in your home?2018 to 2020
by percentage of respondents
Source: ETC Institute (2020)
2020 City of South Bend Community Survey: Findings Report
ETC Institute (2020) Page 66

58%
56%
Yes
0% 20% 40% 60% 80% 100%
2020 2018
Q10. Have you called or visited the City with a question, problem, or complaint during the past year?
2018 to 2020by percentage of respondents
Source: ETC Institute (2020)
2020 City of South Bend Community Survey: Findings Report
ETC Institute (2020) Page 67

91%
5%
4%
1%
85%
7%
7%
0%
Phone
In‐person
Social media
0% 20% 40% 60% 80% 100%2020 2018
Q10a. How did you contact the city?2018 to 2020
by percentage of respondents
Source: ETC Institute (2020)
2020 City of South Bend Community Survey: Findings Report
ETC Institute (2020) Page 68
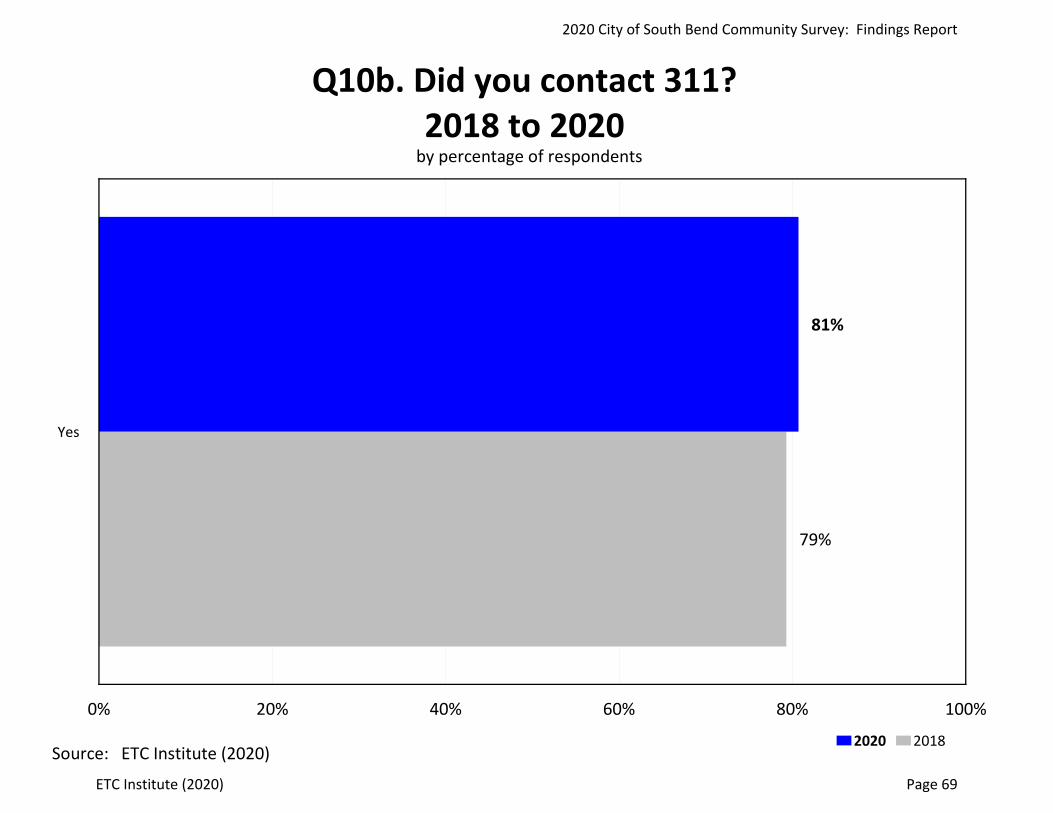
81%
79%
Yes
0% 20% 40% 60% 80% 100%
2020 2018
Q10b. Did you contact 311?2018 to 2020
by percentage of respondents
Source: ETC Institute (2020)
2020 City of South Bend Community Survey: Findings Report
ETC Institute (2020) Page 69
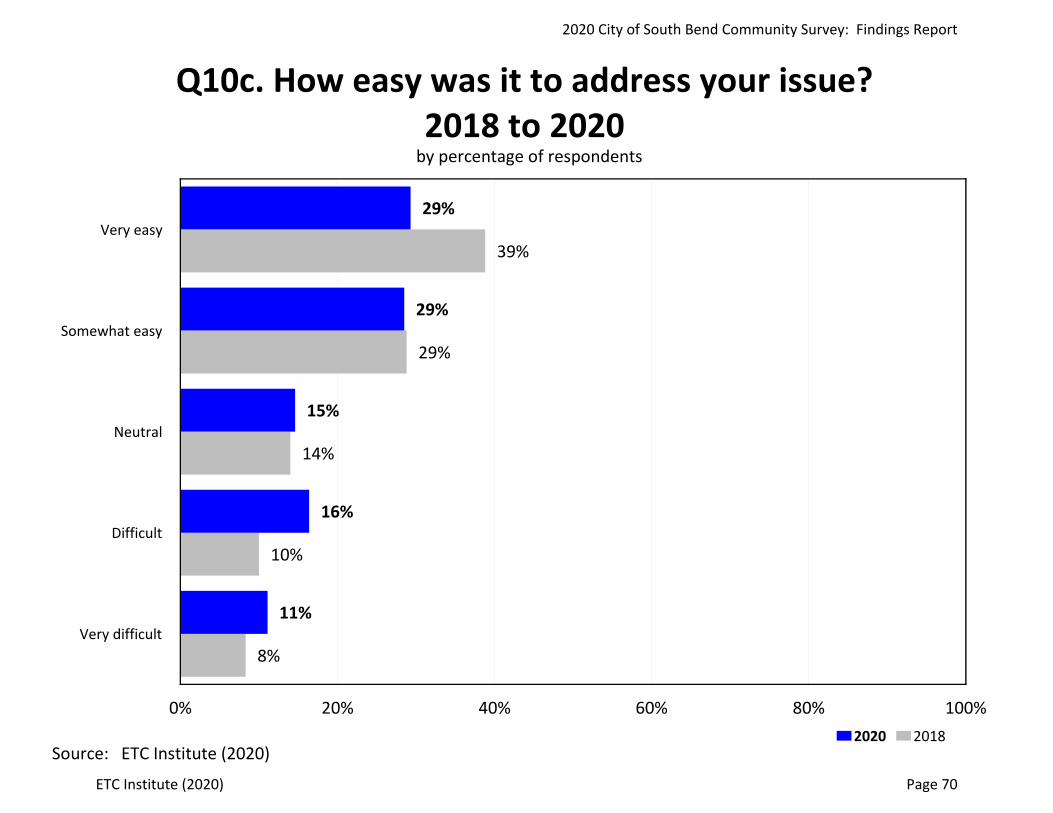
29%
29%
15%
16%
11%
39%
29%
14%
10%
8%
Very easy
Somewhat easy
Neutral
Difficult
Very difficult
0% 20% 40% 60% 80% 100%2020 2018
Q10c. How easy was it to address your issue?2018 to 2020
by percentage of respondents
Source: ETC Institute (2020)
2020 City of South Bend Community Survey: Findings Report
ETC Institute (2020) Page 70

79%
68%
80%
71%
They were courteous and polite
They gave accurate answers to your questions
0% 20% 40% 60% 80% 100%
2020 2018
Q10e. Customer Service2018 to 2020
by percentage of respondents who rated the item as a 4 or 5 on a 5‐point scale (excluding don't knows)
Source: ETC Institute (2020)
2020 City of South Bend Community Survey: Findings Report
ETC Institute (2020) Page 71

83%
83%
67%
67%
63%
60%
33%
32%
28%
24%
83%
79%
67%
63%
58%
56%
37%
50%
38%
19%
Overall quality of fire services
Overall quality of trash collection services
Overall quality of water utility services
Overall quality of local police protection
The process for getting a permit
How well City is planning growth
Overall enforcement of local codes and ordinances
0% 20% 40% 60% 80% 100%
2020 2018
Q11. Major Categories of City Services2018 to 2020
by percentage of respondents who rated the item as a 4 or 5 on a 5‐point scale (excluding don't knows)
Source: ETC Institute (2020)
Overall quality of ambulance/emergency medical services
Overall quality of parks and recreation programs and facilities
Overall maintenance of City streets, sidewalks, and infrastructure
2020 City of South Bend Community Survey: Findings Report
ETC Institute (2020) Page 72
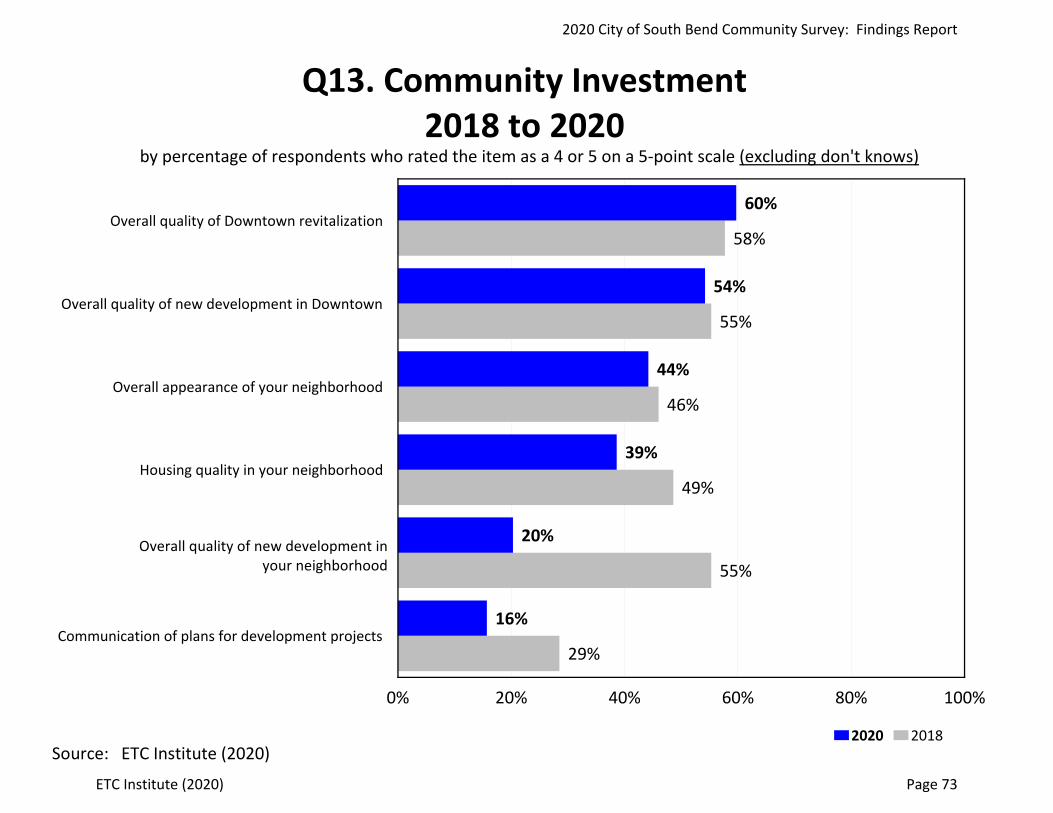
60%
54%
44%
39%
20%
16%
58%
55%
46%
49%
55%
29%
Overall quality of Downtown revitalization
Overall quality of new development in Downtown
Overall appearance of your neighborhood
Housing quality in your neighborhood
Communication of plans for development projects
0% 20% 40% 60% 80% 100%
2020 2018
Q13. Community Investment2018 to 2020
by percentage of respondents who rated the item as a 4 or 5 on a 5‐point scale (excluding don't knows)
Source: ETC Institute (2020)
Overall quality of new development in your neighborhood
2020 City of South Bend Community Survey: Findings Report
ETC Institute (2020) Page 73

30%
51%
19%
27%
52%
20%
Yes
No
Have not lived in my neighborhood for 5 years
0% 20% 40% 60% 80% 100%
2020 2018
Q15. Do you feel that your neighborhood has improved over the past FIVE years?
2018 to 2020by percentage of respondents
Source: ETC Institute (2020)
2020 City of South Bend Community Survey: Findings Report
ETC Institute (2020) Page 74
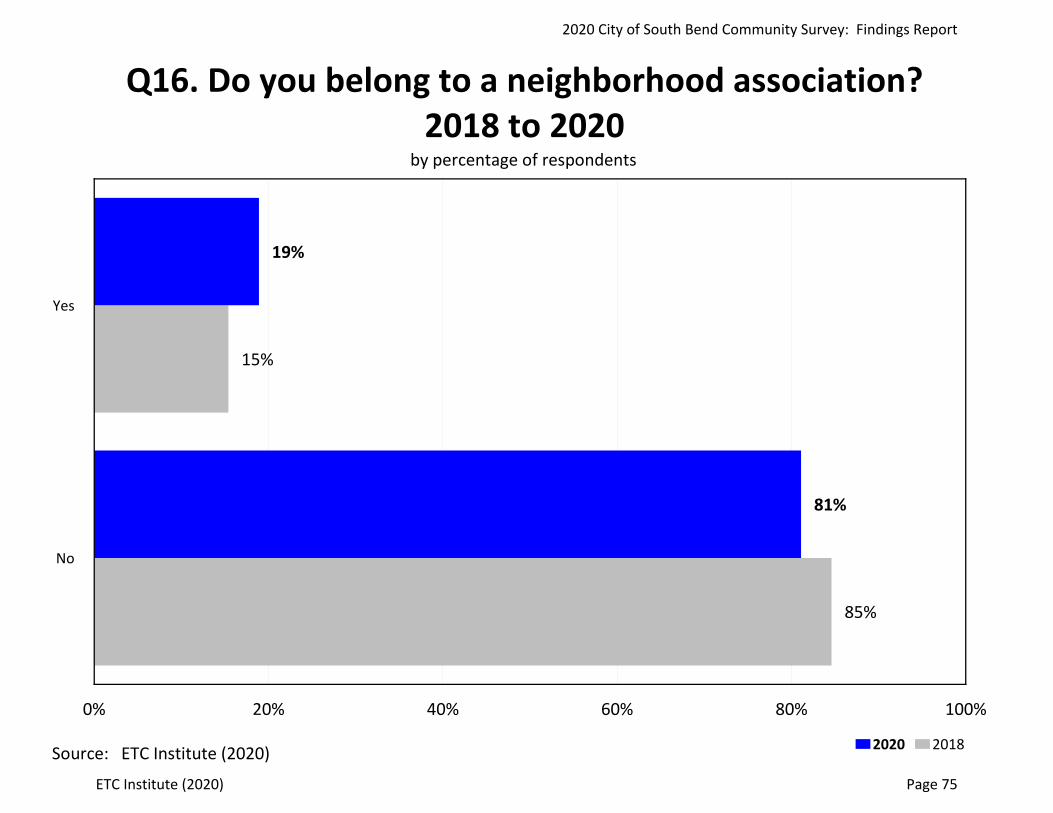
19%
81%
15%
85%
Yes
No
0% 20% 40% 60% 80% 100%
2020 2018
Q16. Do you belong to a neighborhood association?2018 to 2020
by percentage of respondents
Source: ETC Institute (2020)
2020 City of South Bend Community Survey: Findings Report
ETC Institute (2020) Page 75

6%
24%
43%
17%
10%
8%
26%
42%
17%
8%
Very satisfied
Satisfied
Neutral
Dissatisfied
Very dissatisfied
0% 20% 40% 60% 80% 100%
2020 2018
Q16a. How satisfied are you with the city's engagement with your neighborhood association?
2018 to 2020by percentage of respondents
Source: ETC Institute (2020)
2020 City of South Bend Community Survey: Findings Report
ETC Institute (2020) Page 76

9%
91%
13%
87%
Yes
No
0% 20% 40% 60% 80% 100%
2020 2018
Q17. Are you aware of development plans for your neighborhood?2018 to 2020
by percentage of respondents
Source: ETC Institute (2020)
2020 City of South Bend Community Survey: Findings Report
ETC Institute (2020) Page 77

49%
34%
25%
23%
22%
21%
44%
32%
29%
28%
22%
30%
Quality of Animal Control
0% 20% 40% 60% 80% 100%
2020 2018
Q18. Code Enforcement2018 to 2020
by percentage of respondents who rated the item as a 4 or 5 on a 5‐point scale (excluding don't knows)
Source: ETC Institute (2020)
City efforts to remove abandoned vehicles or
inoperative vehicles
Enforcing mowing and cutting of grass and
weeds on private property
Enforcing exterior maintenance of
commercial/business property
Enforcing exterior maintenance of
residential property
Enforcing clean‐up of trash and debris on
private property
2020 City of South Bend Community Survey: Findings Report
ETC Institute (2020) Page 78
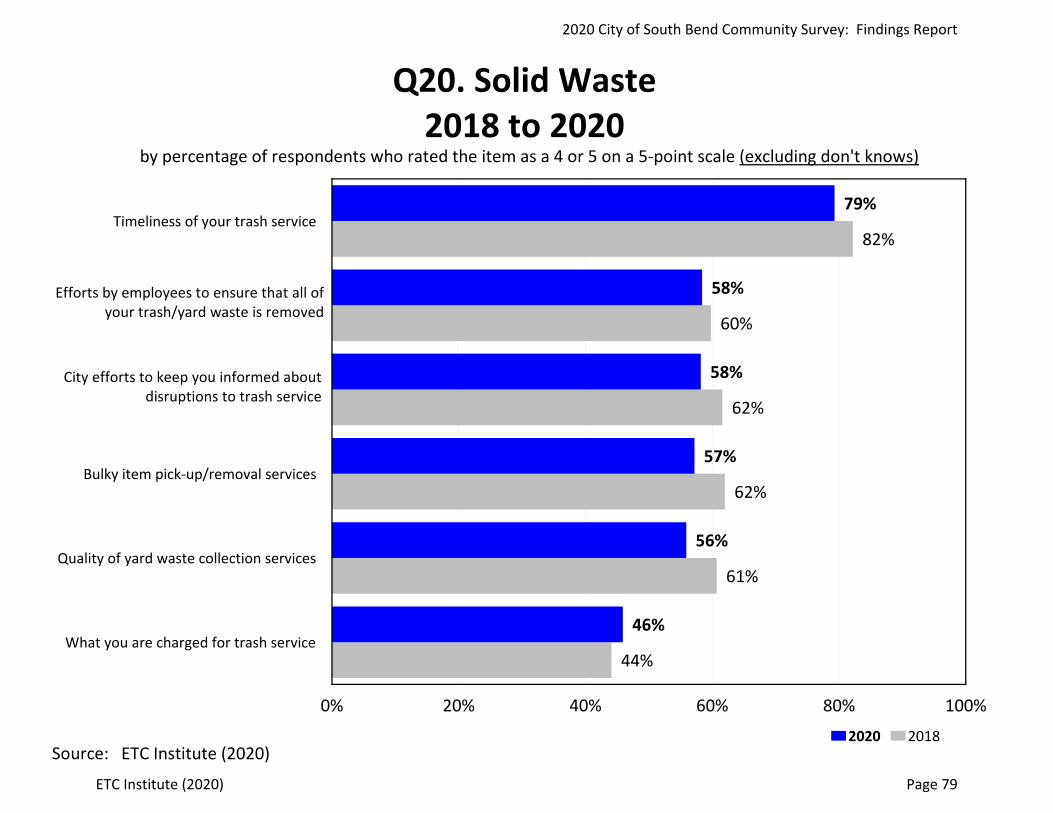
79%
58%
58%
57%
56%
46%
82%
60%
62%
62%
61%
44%
Timeliness of your trash service
Bulky item pick‐up/removal services
Quality of yard waste collection services
What you are charged for trash service
0% 20% 40% 60% 80% 100%
2020 2018
Q20. Solid Waste2018 to 2020
by percentage of respondents who rated the item as a 4 or 5 on a 5‐point scale (excluding don't knows)
Source: ETC Institute (2020)
Efforts by employees to ensure that all of your trash/yard waste is removed
City efforts to keep you informed about disruptions to trash service
2020 City of South Bend Community Survey: Findings Report
ETC Institute (2020) Page 79
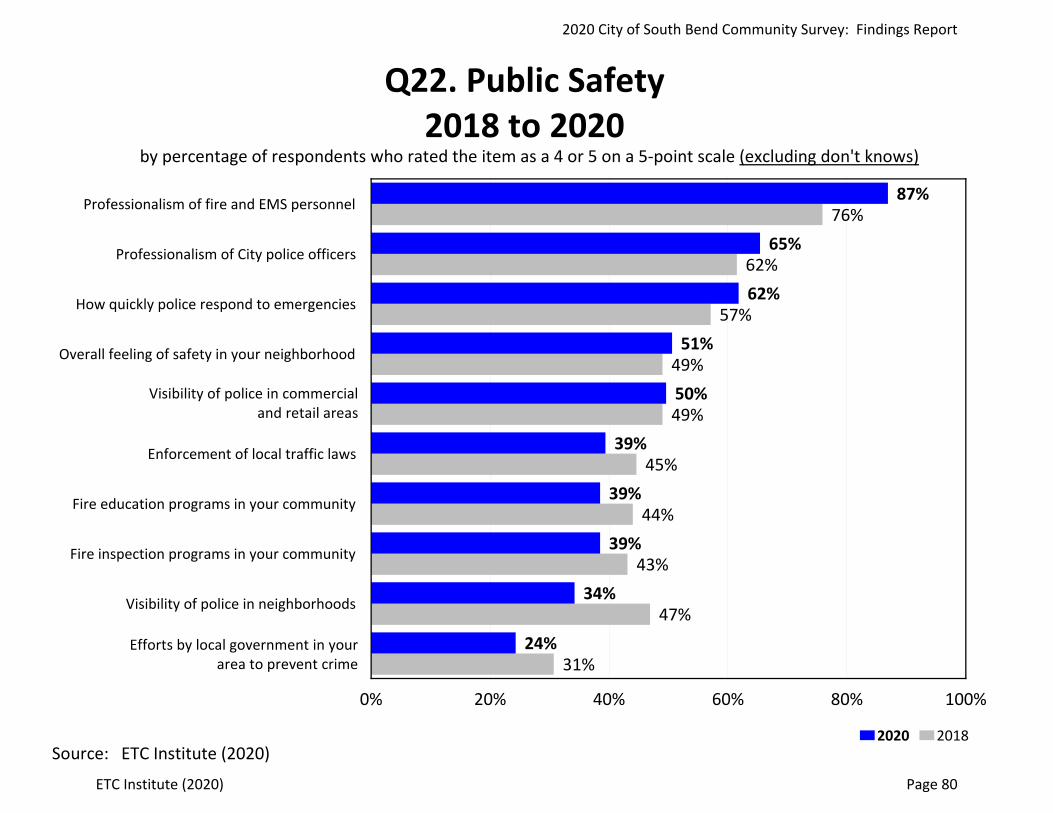
87%
65%
62%
51%
50%
39%
39%
39%
34%
24%
76%
62%
57%
49%
49%
45%
44%
43%
47%
31%
Professionalism of fire and EMS personnel
Professionalism of City police officers
How quickly police respond to emergencies
Overall feeling of safety in your neighborhood
Enforcement of local traffic laws
Fire education programs in your community
Fire inspection programs in your community
Visibility of police in neighborhoods
0% 20% 40% 60% 80% 100%
2020 2018
Q22. Public Safety2018 to 2020
by percentage of respondents who rated the item as a 4 or 5 on a 5‐point scale (excluding don't knows)
Source: ETC Institute (2020)
Efforts by local government in your area to prevent crime
Visibility of police in commercial and retail areas
2020 City of South Bend Community Survey: Findings Report
ETC Institute (2020) Page 80
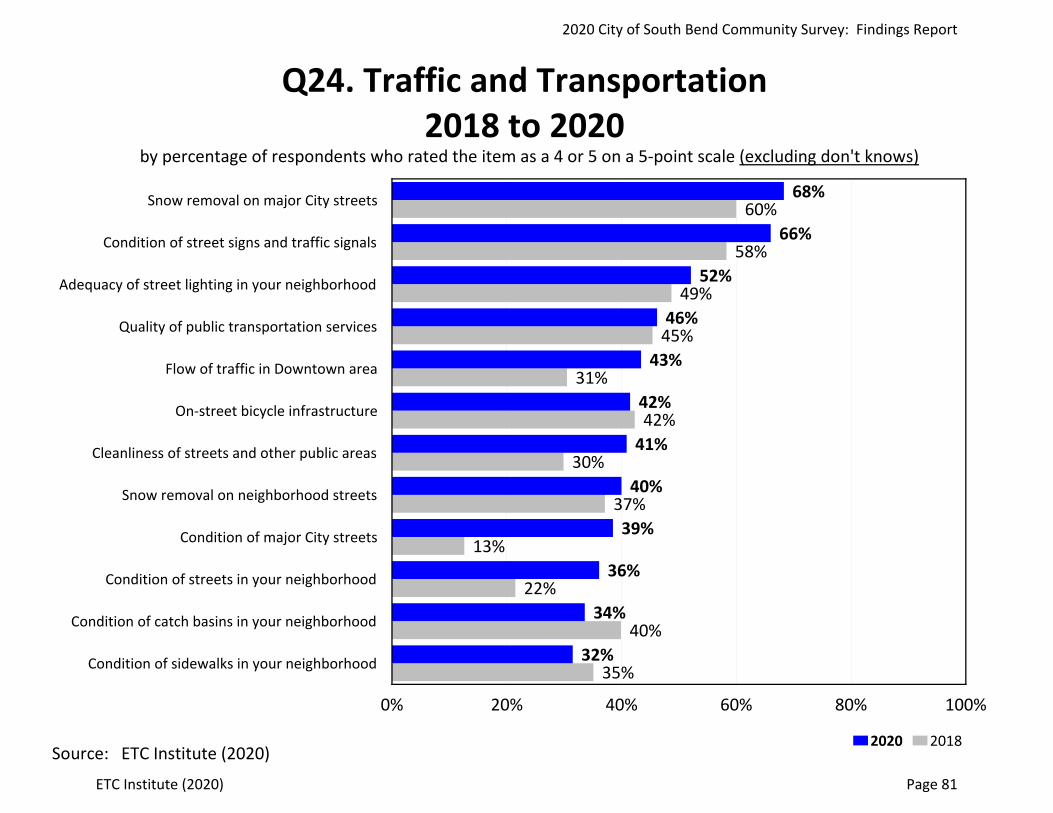
68%
66%
52%
46%
43%
42%
41%
40%
39%
36%
34%
32%
60%
58%
49%
45%
31%
42%
30%
37%
13%
22%
40%
35%
Snow removal on major City streets
Condition of street signs and traffic signals
Adequacy of street lighting in your neighborhood
Quality of public transportation services
Flow of traffic in Downtown area
On‐street bicycle infrastructure
Cleanliness of streets and other public areas
Snow removal on neighborhood streets
Condition of major City streets
Condition of streets in your neighborhood
Condition of catch basins in your neighborhood
Condition of sidewalks in your neighborhood
0% 20% 40% 60% 80% 100%
2020 2018
Q24. Traffic and Transportation2018 to 2020
by percentage of respondents who rated the item as a 4 or 5 on a 5‐point scale (excluding don't knows)
Source: ETC Institute (2020)
2020 City of South Bend Community Survey: Findings Report
ETC Institute (2020) Page 81

14%
15%
Yes
0% 20% 40% 60% 80% 100%
2020 2018
Q26. Have you had a sewer backup in your home during the past year?
2018 to 2020by percentage of respondents
Source: ETC Institute (2020)
2020 City of South Bend Community Survey: Findings Report
ETC Institute (2020) Page 82

63%
71%
Yes
0% 20% 40% 60% 80% 100%
2020 2018
Q26a. Was the backup caused by problems in the City's system?
2018 to 2020by percentage of respondents
Source: ETC Institute (2020)
2020 City of South Bend Community Survey: Findings Report
ETC Institute (2020) Page 83
51%
43%
Yes
0% 20% 40% 60% 80% 100%
2020 2018
Q26b. Was the problem resolved to your satisfaction?2018 to 2020
by percentage of respondents
Source: ETC Institute (2020)
2020 City of South Bend Community Survey: Findings Report
ETC Institute (2020) Page 84
75%
73%
59%
49%
49%
44%
31%
65%
64%
55%
48%
49%
43%
33%
Water pressure on a typical day
How easy your utility bill is to understand
Smell of your tap water
Taste of your tap water
How easy it is to resolve billing problems
What you are charged for utilities
0% 20% 40% 60% 80% 100%
2020 2018
Q27. Water Services2018 to 2020
by percentage of respondents who rated the item as a 4 or 5 on a 5‐point scale (excluding don't knows)
Source: ETC Institute (2020)
How well City keeps you informed about water quality issues
2020 City of South Bend Community Survey: Findings Report
ETC Institute (2020) Page 85

72%
67%
64%
44%
42%
34%
22%
62%
60%
61%
39%
35%
33%
22%
Maintenance of City parks
Access to parks in your neighborhood
Number of walking and biking trails
Fees charged for recreation programs
Condition of restrooms in public parks
0% 20% 40% 60% 80% 100%
2020 2018
Q29. Venues, Parks, and Arts2018 to 2020
by percentage of respondents who rated the item as a 4 or 5 on a 5‐point scale (excluding don't knows)
Source: ETC Institute (2020)
Ease of registering for recreation programs such as classes, trips, and
special events
Availability of recreation programming in your neighborhood
2020 City of South Bend Community Survey: Findings Report
ETC Institute (2020) Page 86

72%
73%
Yes
0% 20% 40% 60% 80% 100%
2020 2018
Q31. In the past year have you visited a city recreation facility or park? 2018 to 2020
by percentage of respondents
Source: ETC Institute (2020)
2020 City of South Bend Community Survey: Findings Report
ETC Institute (2020) Page 87

11%
40%
Yes
0% 20% 40% 60% 80% 100%
2020 2018
Q33. Have you met the current Mayor of South Bend?2018 to 2020
by percentage of respondents
Source: ETC Institute (2020)
2020 City of South Bend Community Survey: Findings Report
ETC Institute (2020) Page 88

Section 3:
Benchmarking Data
2020 City of South Bend Community Survey: Findings Report
ETC Institute (2020) Page 89

Benchmarking Summary City of South Bend, Indiana
Overview
ETC Institute’s DirectionFinder® program was originally developed in 1999 to help community leaders use statistically valid community survey data as a tool for making better decisions. Since November 1999, the survey has been administered in more than 400 cities and counties in 43 states. Most participating communities conduct the survey on an annual or biennial basis.
This report contains benchmarking data from two sources: (1) a national survey that was administered by ETC Institute in the summer of 2020 to a random sample of more than 4,000 residents across the United States, and (2) a survey administered by ETC Institute in the summer of 2020 to over 350 residents living in the Great Lakes Region which includes the following states: Pennsylvania, Ohio, Indiana, Illinois, and Michigan.
Interpreting the Charts
The charts on the following pages show how the overall ratings for South Bend compare to the national average based on the results of an annual survey that was administered by ETC Institute to a random sample of more than 4,000 U.S. households. The blue bar shows the ratings for South Bend, the gray bar shows the ratings for the United States, and the gold bar for the Great Lakes regional average.
2020 City of South Bend Community Survey: Findings Report
ETC Institute (2020) Page 90
2020 City of South Bend Community Survey: Findings Report
ETC Institute (2020) Page 91

56%
38%
34%
29%
19%
72%
48%
38%
37%
31%
71%
51%
43%
41%
31%
Overall quality of life in your community
Overall quality of local government services
Leadership of elected officials
Overall value you receive for your taxes and fees
0% 20% 40% 60% 80% 100%
South Bend US Great Lakes
Q2. City LeadershipSouth Bend vs. the United States vs. Great Lakes Region
by percentage of respondents who rated the item as a 4 or 5 on a 5‐point scale
Source: ETC Institute (2020)
Level of public involvement in local decision‐making and planning
2020 City of South Bend Community Survey: Findings Report
ETC Institute (2020) Page 92
58%
52%
42%
41%
41%
38%
71%
54%
70%
57%
48%
56%
77%
57%
76%
58%
55%
63%
As a place to live
As a place to work
As a place to raise children
As a place to visit
As a place to retire
0% 20% 40% 60% 80% 100%
South Bend US Great Lakes
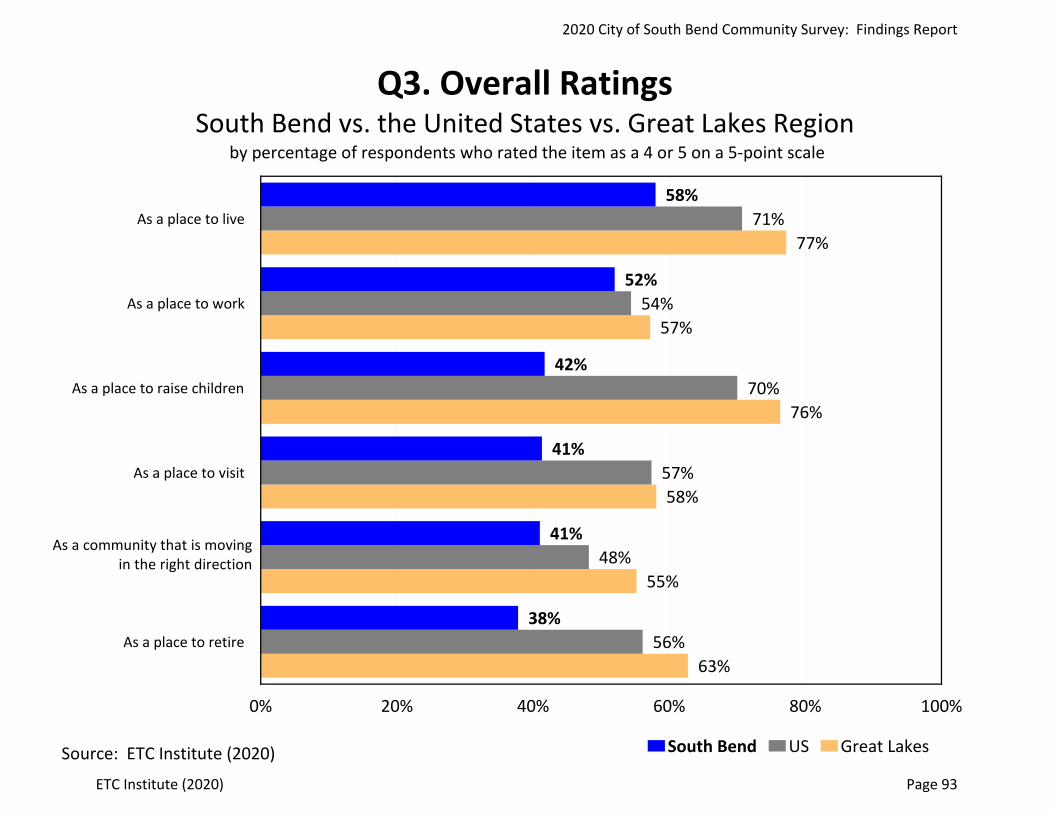
Q3. Overall RatingsSouth Bend vs. the United States vs. Great Lakes Region
by percentage of respondents who rated the item as a 4 or 5 on a 5‐point scale
Source: ETC Institute (2020)
As a community that is moving in the right direction
2020 City of South Bend Community Survey: Findings Report
ETC Institute (2020) Page 93
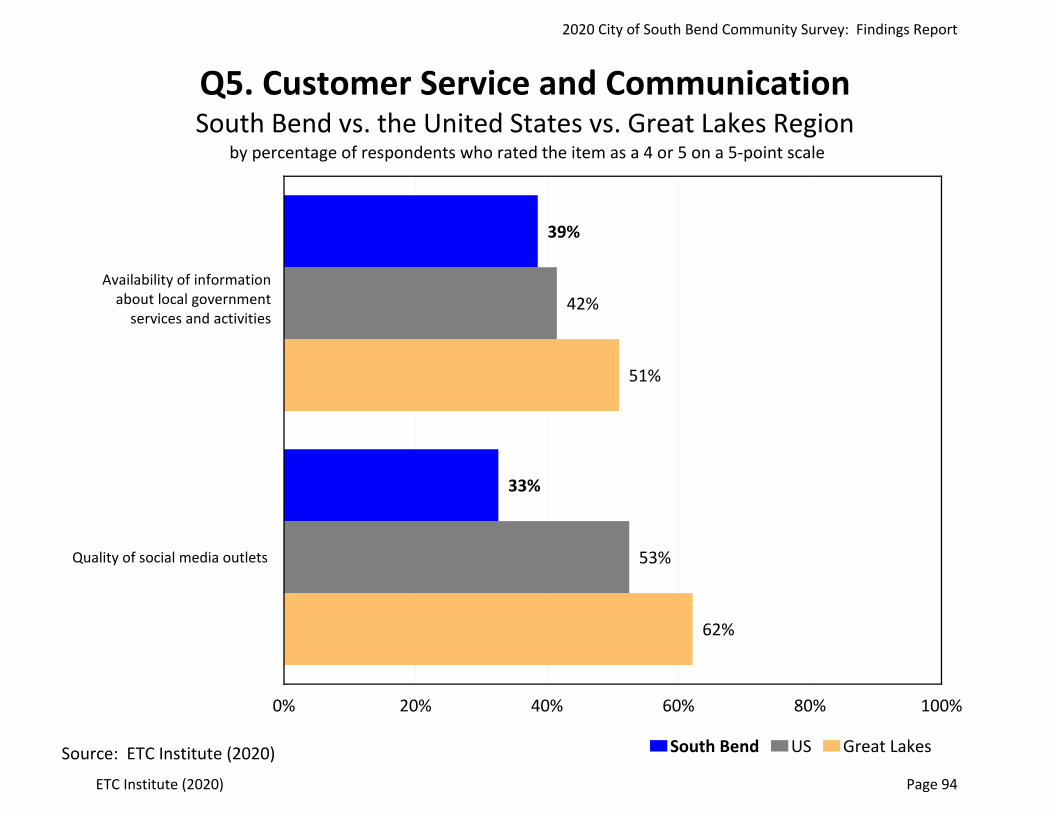
39%
33%
42%
53%
51%
62%
Quality of social media outlets
0% 20% 40% 60% 80% 100%
South Bend US Great Lakes
Q5. Customer Service and CommunicationSouth Bend vs. the United States vs. Great Lakes Region
by percentage of respondents who rated the item as a 4 or 5 on a 5‐point scale
Source: ETC Institute (2020)
Availability of information about local government
services and activities
2020 City of South Bend Community Survey: Findings Report
ETC Institute (2020) Page 94
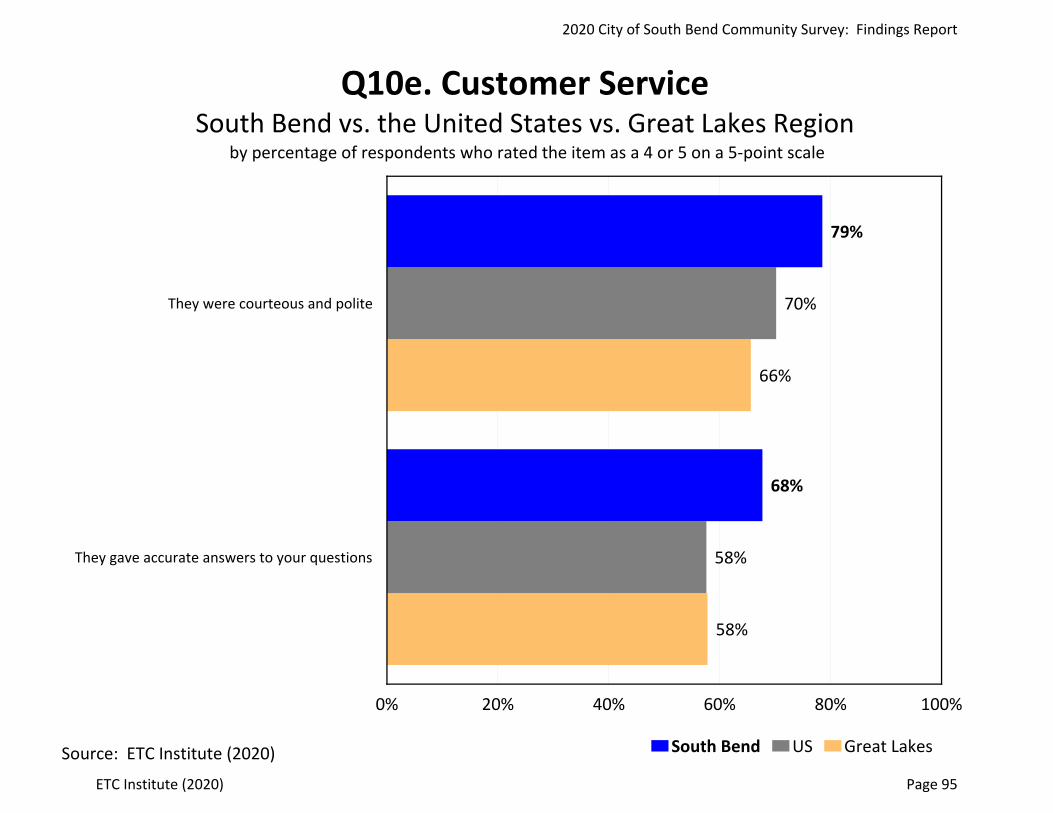
79%
68%
70%
58%
66%
58%
They were courteous and polite
They gave accurate answers to your questions
0% 20% 40% 60% 80% 100%
South Bend US Great Lakes
Q10e. Customer ServiceSouth Bend vs. the United States vs. Great Lakes Region
by percentage of respondents who rated the item as a 4 or 5 on a 5‐point scale
Source: ETC Institute (2020)
2020 City of South Bend Community Survey: Findings Report
ETC Institute (2020) Page 95

83%
83%
67%
67%
63%
60%
32%
28%
24%
81%
81%
68%
61%
64%
68%
45%
53%
42%
85%
77%
66%
68%
60%
65%
56%
51%
45%
Overall quality of fire services
Overall quality of trash collection services
Overall quality of water utility services
Overall quality of local police protection
How well City is planning growth
Overall enforcement of local codes and ordinances
0% 20% 40% 60% 80% 100%
South Bend US Great Lakes
Q11. Major Categories of ServicesSouth Bend vs. the United States vs. Great Lakes Region
by percentage of respondents who rated the item as a 4 or 5 on a 5‐point scale
Source: ETC Institute (2020)
Overall quality of ambulance/emergency medical services
Overall quality of parks and recreation programs and facilities
Overall maintenance of City streets, sidewalks, and infrastructure
2020 City of South Bend Community Survey: Findings Report
ETC Institute (2020) Page 96
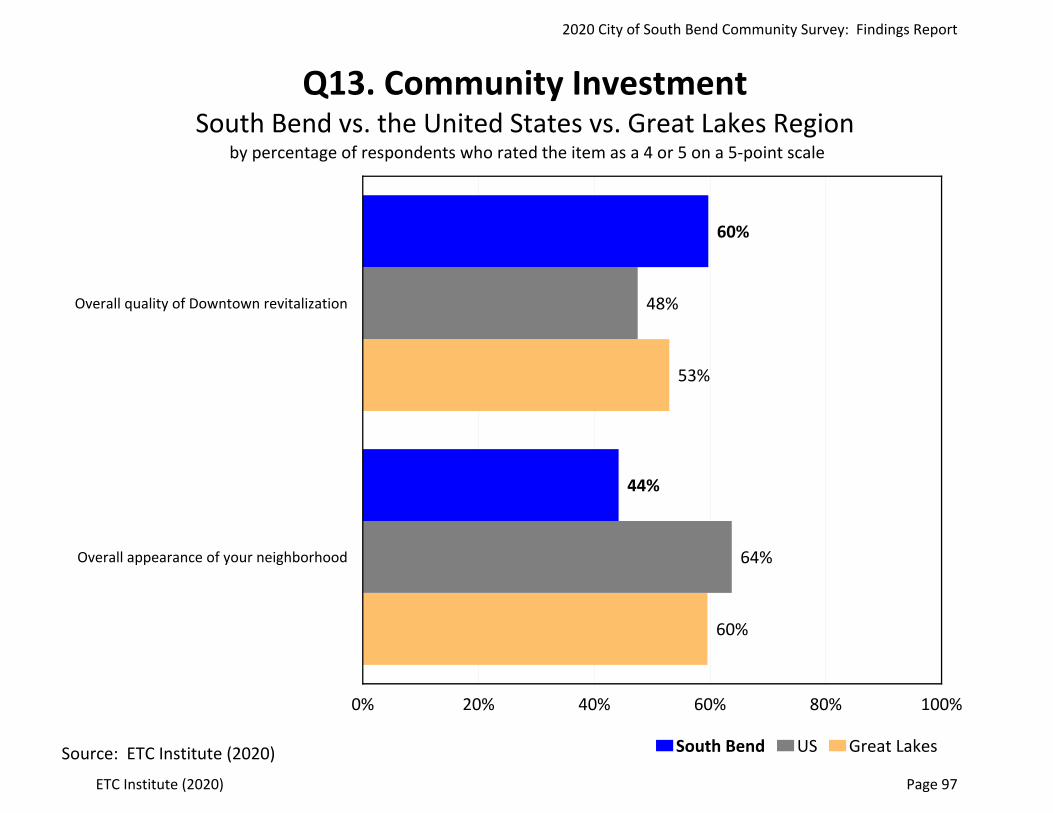
60%
44%
48%
64%
53%
60%
Overall quality of Downtown revitalization
Overall appearance of your neighborhood
0% 20% 40% 60% 80% 100%
South Bend US Great Lakes
Q13. Community InvestmentSouth Bend vs. the United States vs. Great Lakes Region
by percentage of respondents who rated the item as a 4 or 5 on a 5‐point scale
Source: ETC Institute (2020)
2020 City of South Bend Community Survey: Findings Report
ETC Institute (2020) Page 97
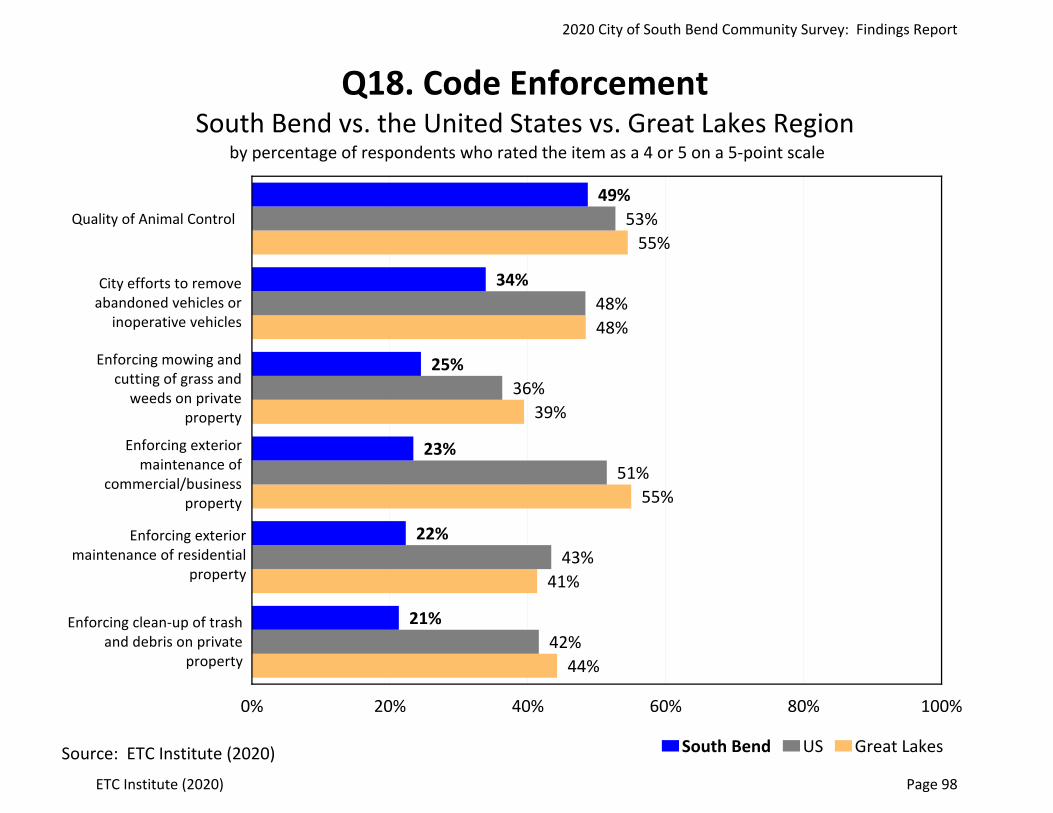
49%
34%
25%
23%
22%
21%
53%
48%
36%
51%
43%
42%
55%
48%
39%
55%
41%
44%
Quality of Animal Control
0% 20% 40% 60% 80% 100%
South Bend US Great Lakes
Q18. Code EnforcementSouth Bend vs. the United States vs. Great Lakes Region
by percentage of respondents who rated the item as a 4 or 5 on a 5‐point scale
Source: ETC Institute (2020)
City efforts to remove abandoned vehicles or
inoperative vehicles
Enforcing mowing and cutting of grass and
weeds on private property
Enforcing exterior maintenance of
commercial/business property
Enforcing exterior maintenance of residential
property
Enforcing clean‐up of trash and debris on private
property
2020 City of South Bend Community Survey: Findings Report
ETC Institute (2020) Page 98

57%
56%
54%
57%
44%
58%
Bulky item pick‐up/removal services
Quality of yard waste collection services
0% 20% 40% 60% 80% 100%
South Bend US Great Lakes
Q20. Solid WasteSouth Bend vs. the United States vs. Great Lakes Region
by percentage of respondents who rated the item as a 4 or 5 on a 5‐point scale
Source: ETC Institute (2020)
2020 City of South Bend Community Survey: Findings Report
ETC Institute (2020) Page 99
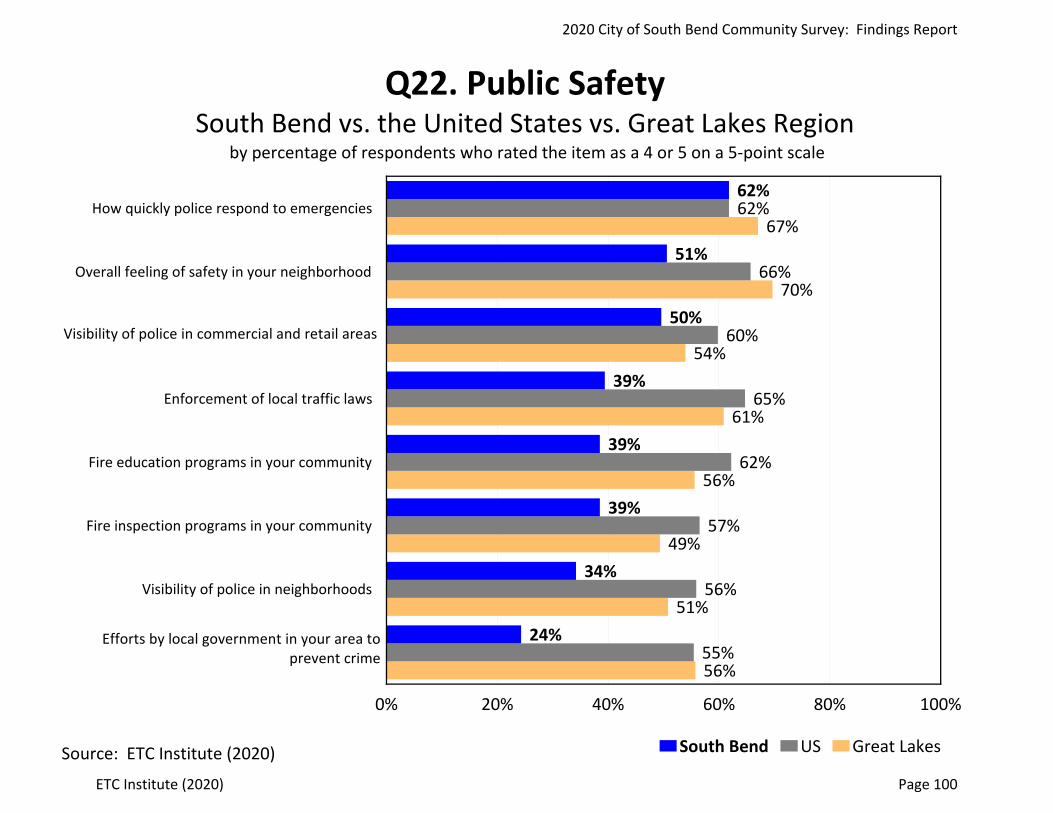
62%
51%
50%
39%
39%
39%
34%
24%
62%
66%
60%
65%
62%
57%
56%
55%
67%
70%
54%
61%
56%
49%
51%
56%
How quickly police respond to emergencies
Overall feeling of safety in your neighborhood
Enforcement of local traffic laws
Fire education programs in your community
Fire inspection programs in your community
Visibility of police in neighborhoods
0% 20% 40% 60% 80% 100%
South Bend US Great Lakes
Q22. Public SafetySouth Bend vs. the United States vs. Great Lakes Region
by percentage of respondents who rated the item as a 4 or 5 on a 5‐point scale
Source: ETC Institute (2020)
Efforts by local government in your area to prevent crime
Visibility of police in commercial and retail areas
2020 City of South Bend Community Survey: Findings Report
ETC Institute (2020) Page 100
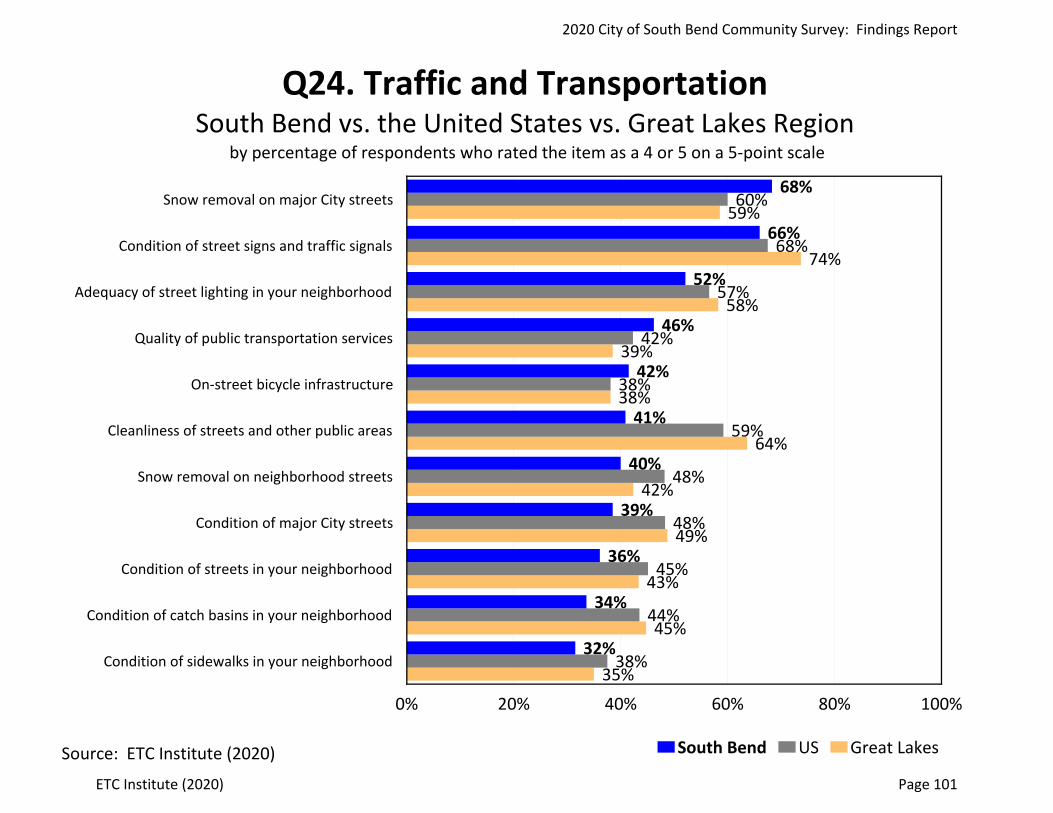
68%
66%
52%
46%
42%
41%
40%
39%
36%
34%
32%
60%
68%
57%
42%
38%
59%
48%
48%
45%
44%
38%
59%
74%
58%
39%
38%
64%
42%
49%
43%
45%
35%
Snow removal on major City streets
Condition of street signs and traffic signals
Adequacy of street lighting in your neighborhood
Quality of public transportation services
On‐street bicycle infrastructure
Cleanliness of streets and other public areas
Snow removal on neighborhood streets
Condition of major City streets
Condition of streets in your neighborhood
Condition of catch basins in your neighborhood
Condition of sidewalks in your neighborhood
0% 20% 40% 60% 80% 100%
South Bend US Great Lakes
Q24. Traffic and TransportationSouth Bend vs. the United States vs. Great Lakes Region
by percentage of respondents who rated the item as a 4 or 5 on a 5‐point scale
Source: ETC Institute (2020)
2020 City of South Bend Community Survey: Findings Report
ETC Institute (2020) Page 101
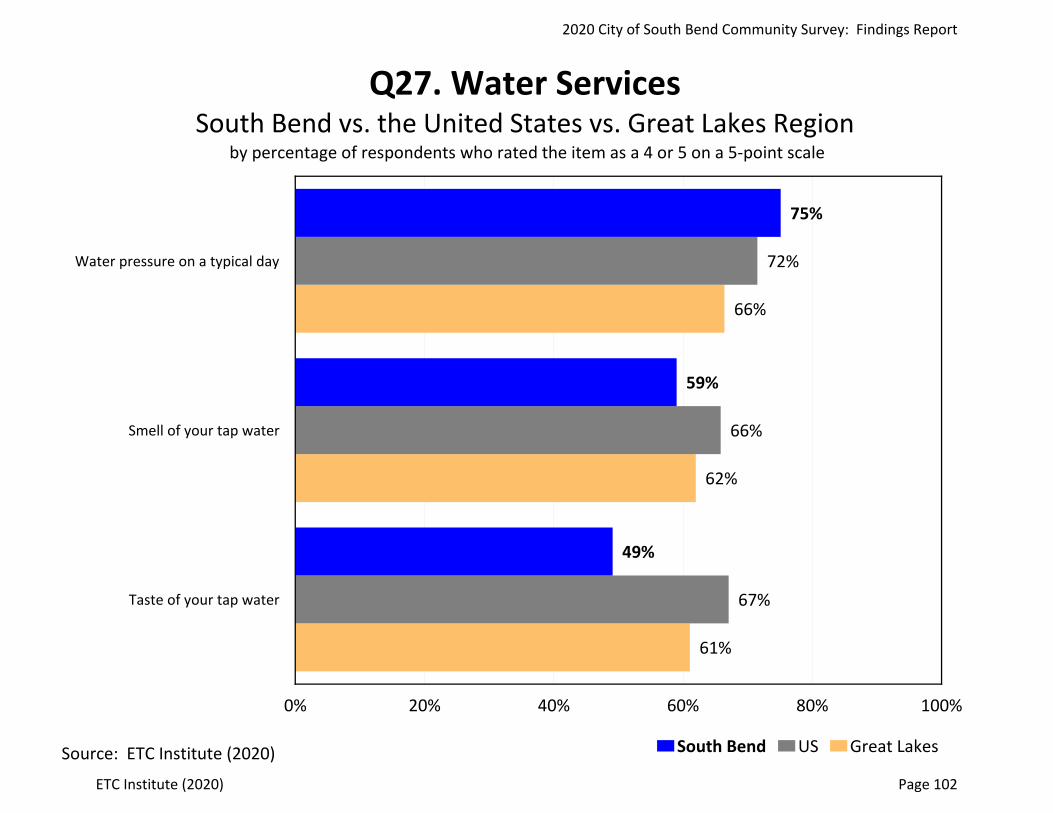
75%
59%
49%
72%
66%
67%
66%
62%
61%
Water pressure on a typical day
Smell of your tap water
Taste of your tap water
0% 20% 40% 60% 80% 100%
South Bend US Great Lakes
Q27. Water ServicesSouth Bend vs. the United States vs. Great Lakes Region
by percentage of respondents who rated the item as a 4 or 5 on a 5‐point scale
Source: ETC Institute (2020)
2020 City of South Bend Community Survey: Findings Report
ETC Institute (2020) Page 102
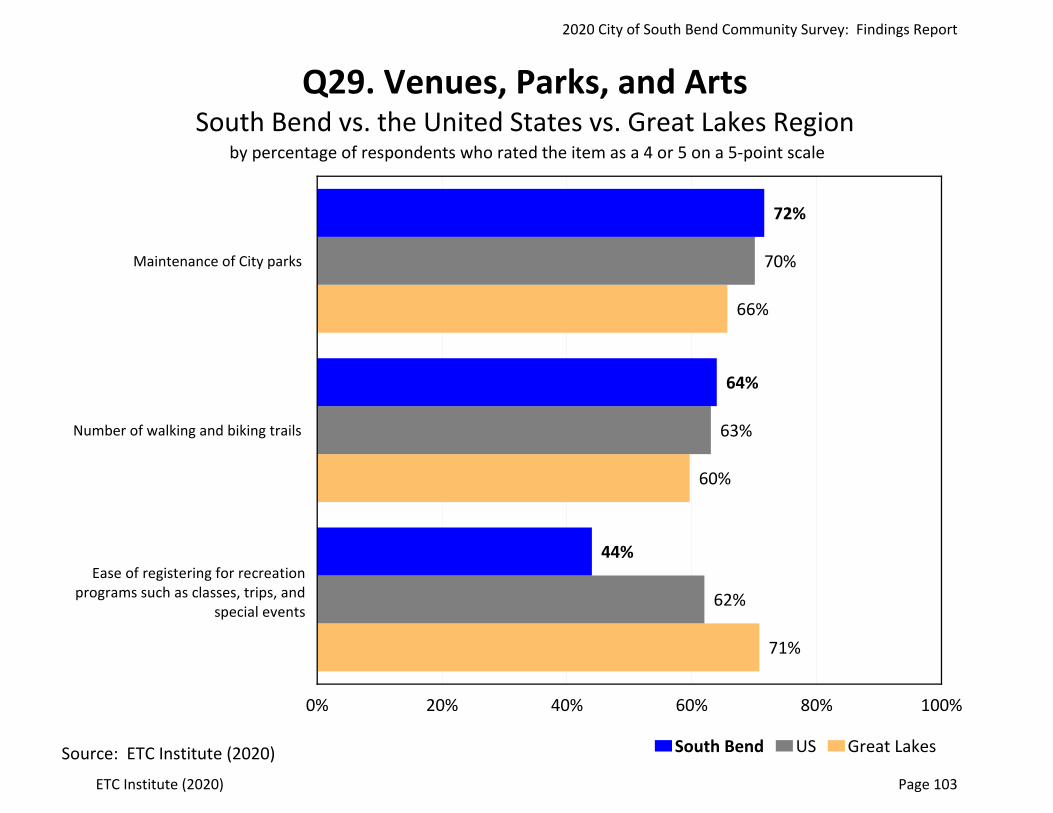
72%
64%
44%
70%
63%
62%
66%
60%
71%
Maintenance of City parks
Number of walking and biking trails
0% 20% 40% 60% 80% 100%
South Bend US Great Lakes
Q29. Venues, Parks, and ArtsSouth Bend vs. the United States vs. Great Lakes Region
by percentage of respondents who rated the item as a 4 or 5 on a 5‐point scale
Source: ETC Institute (2020)
Ease of registering for recreation programs such as classes, trips, and
special events
2020 City of South Bend Community Survey: Findings Report
ETC Institute (2020) Page 103

60%
66%
52%
Yes
0% 20% 40% 60% 80% 100%
South Bend US Great Lakes
Q44. Do you think local officials in your community are doing a good job of keeping you informed about the COVID‐19 Pandemic?
South Bend vs. the United States vs. Great Lakes Regionby percentage of respondents
Source: ETC Institute (2020)
2020 City of South Bend Community Survey: Findings Report
ETC Institute (2020) Page 104

51%
40%
41%
Very satisfied/Satisfied
0% 20% 40% 60% 80% 100%
South Bend US Great Lakes
Q45. Please rate your satisfaction with the City’s response to COVID‐19
South Bend vs. the United States vs. Great Lakes Regionby percentage of respondents who rated the item as a 4 or 5 on a 5‐point scale
Source: ETC Institute (2020)
2020 City of South Bend Community Survey: Findings Report
ETC Institute (2020) Page 105
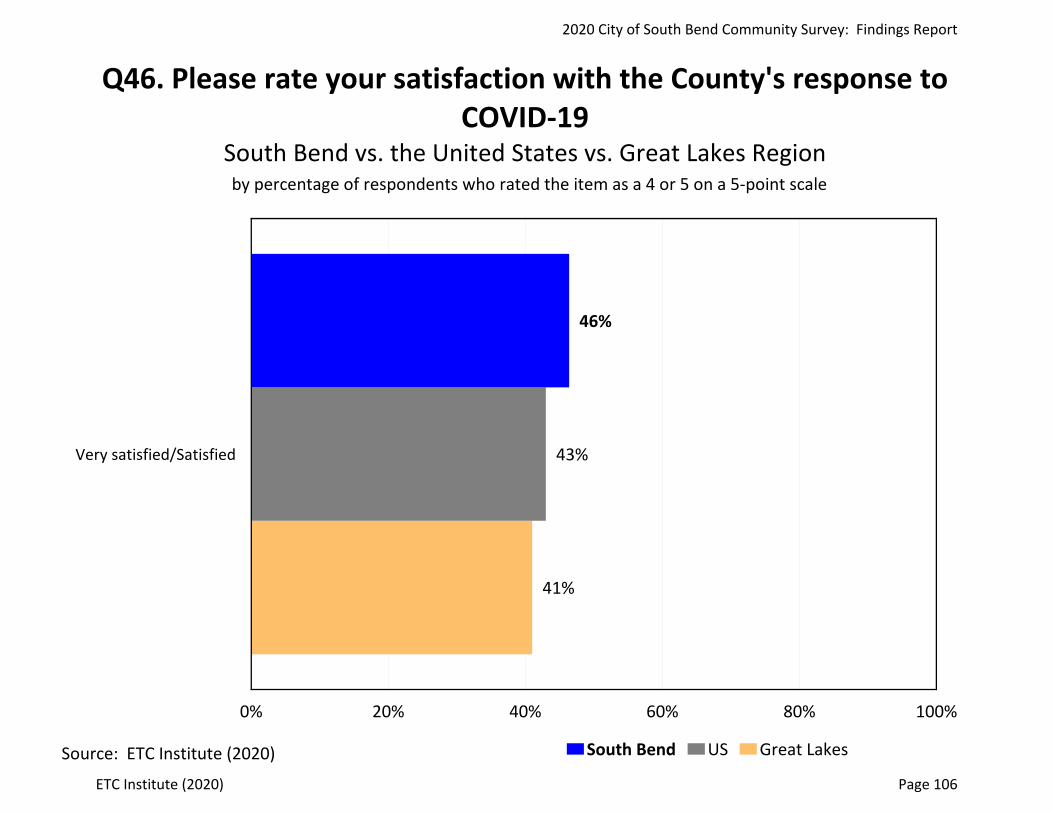
46%
43%
41%
Very satisfied/Satisfied
0% 20% 40% 60% 80% 100%
South Bend US Great Lakes
Q46. Please rate your satisfaction with the County's response to COVID‐19
South Bend vs. the United States vs. Great Lakes Regionby percentage of respondents who rated the item as a 4 or 5 on a 5‐point scale
Source: ETC Institute (2020)
2020 City of South Bend Community Survey: Findings Report
ETC Institute (2020) Page 106

Section 4:
Importance-Satisfaction
Analysis
2020 City of South Bend Community Survey: Findings Report
ETC Institute (2020) Page 107
Importance‐Satisfaction Analysis City of South Bend, Indiana
Overview
Today, City officials have limited resources which need to be targeted to activities that are of the most benefit to their residents. Two of the most important criteria for decision making are (1) to target resources toward services of the highest importance to residents; and (2) to target resources toward those services where residents are the least satisfied.
The Importance‐Satisfaction (IS) rating is a unique tool that allows public officials to better understand both of these highly important decision‐making criteria for each of the services they are providing. The Importance‐Satisfaction rating is based on the concept that public agencies will maximize overall customer satisfaction by emphasizing improvements in those areas where the level of satisfaction is relatively low, and the perceived importance of the service is relatively high.
Methodology
The rating is calculated by summing the percentage of responses for items selected as the first, second, and third most important services for the City to provide. The sum is then multiplied by 1 minus the percentage of respondents who indicated they were positively satisfied with the City’s performance in the related area (the sum of the ratings of 4 and 5 on a 5‐point scale excluding “Don’t Know” responses). “Don’t Know” responses are excluded from the calculation to ensure the satisfaction ratings among service categories are comparable. [IS=Importance x (1‐Satisfaction)].
Example of the Calculation: Respondents were asked to identify the mobility services they think are most important for the City to provide. Sixty‐seven percent (67.2%) of respondents selected the overall maintenance of City streets, sidewalks, and infrastructure, as one of the most important services for the City to emphasize.
With regard to satisfaction, 24.4% of respondents surveyed rated the City’s overall performance in the overall maintenance of City streets, sidewalks, and infrastructure, as a “4” or “5” on a 5‐point scale (where “5” means “Very Satisfied”) excluding “Don’t Know” responses. The I‐S rating for the overall maintenance of City streets, sidewalks, and infrastructure, was calculated by multiplying the sum of the most important percentages by 1 minus the sum of the satisfaction percentages. In this example 67.2% was multiplied by 75.6% (1‐0.244). This calculation yielded an I‐S rating of 0.5080 which ranked first out of 10 major service categories.
The maximum rating is 1.00 and would be achieved when 100% of the respondents select an item as one of their top three choices to emphasize over the next two years and 0% indicate they are positively satisfied with the delivery of the service.
2020 City of South Bend Community Survey: Findings Report
ETC Institute (2020) Page 108
The lowest rating is 0.00 and could be achieved under either of the following two situations:
If 100% of the respondents were positively satisfied with the delivery of the service If none (0%) of the respondents selected the service as one for the three most important
areas for the City to emphasize over the next two years.
Interpreting the Ratings
Ratings that are greater than or equal to 0.20 identify areas that should receive significantly more emphasis over the next two years. Ratings from 0.10 to 0.20 identify service areas that should receive increased emphasis. Ratings less than 0.10 should continue to receive the current level of emphasis.
Definitely Increase Emphasis (IS>=0.20) Increase Current Emphasis (0.10<=IS<0.20) Maintain Current Emphasis (IS<0.10)
The results for the City of South Bend are provided on the following pages.
2020 City of South Bend Community Survey: Findings Report
ETC Institute (2020) Page 109

2020 Importance‐Satisfaction RatingSouth Bend, IndianaMajor Categories of City Services
Category of ServiceMost
Important %
Most Important
Rank Satisfaction %Satisfaction
Rank
Importance‐Satisfaction
Rating I‐S Rating Rank
Very High Priority (IS >.20)Overall maintenance of City streets, sidewalks, and infrastructure 67% 1 24% 10 0.5080 1How well City is planning growth 44% 3 32% 8 0.2958 2Overall enforcement of local codes and ordinances 29% 4 28% 9 0.2117 3
High Priority (IS .10‐.20)Overall quality of local police protection 49% 2 60% 6 0.1970 4
Medium Priority (IS <.10)Overall quality of parks and recreation programs and facilities 20% 5 67% 4 0.0669 5Overall quality of trash collection services 15% 6 67% 3 0.0485 6Overall quality of water utility services 13% 7 63% 5 0.0465 7The process for getting a permit 4% 9 33% 7 0.0243 8Overall quality of ambulance/emergency medical services 6% 8 83% 2 0.0096 9Overall quality of fire services 4% 10 83% 1 0.0059 10
Note: The I‐S Rating is calculated by multiplying the "Most Important" % by (1‐'Satisfaction' %)
Most Important %: The "Most Important" percentage represents the sum of the first, second, and third
most important responses for each item. Respondents were asked to identify
the items they thought should be the City's top priorities.
Satisfaction %: The "Satisfaction" percentage represents the sum of the ratings "5" and "4" excluding 'don't knows.'Respondents ranked their level of satisfaction with each of the items on a scaleof 5 to 1 with "5" being Very Satisfied and "1" being Very Dissatisfied.
© 2020 DirectionFinder by ETC Institute
2020 City of South Bend Community Survey: Findings Report
ETC Institute (2020) Page 110

2020 Importance‐Satisfaction RatingSouth Bend, IndianaCommunity Investments
Category of ServiceMost
Important %
Most Important
Rank Satisfaction %Satisfaction
Rank
Importance‐Satisfaction
Rating I‐S Rating Rank
Very High Priority (IS >.20)Communication of plans for development projects 27% 4 16% 6 0.2293 1Overall quality of new development in your neighborhood 29% 3 20% 5 0.2319 2Housing quality in your neighborhood 35% 1 39% 4 0.2137 3
High Priority (IS .10‐.20)Overall appearance of your neighborhood 35% 2 44% 3 0.1936 4
Medium Priority (IS <.10)Overall quality of new development in Downtown 20% 6 54% 2 0.0916 5Overall quality of Downtown revitalization 20% 5 60% 1 0.0814 6
Note: The I‐S Rating is calculated by multiplying the "Most Important" % by (1‐'Satisfaction' %)
Most Important %: The "Most Important" percentage represents the sum of the first and second
most important responses for each item. Respondents were asked to identify
the items they thought should be the City's top priorities.
Satisfaction %: The "Satisfaction" percentage represents the sum of the ratings "5" and "4" excluding 'don't knows.'Respondents ranked their level of satisfaction with each of the items on a scaleof 5 to 1 with "5" being Very Satisfied and "1" being Very Dissatisfied.
© 2020 DirectionFinder by ETC Institute
2020 City of South Bend Community Survey: Findings Report
ETC Institute (2020) Page 111
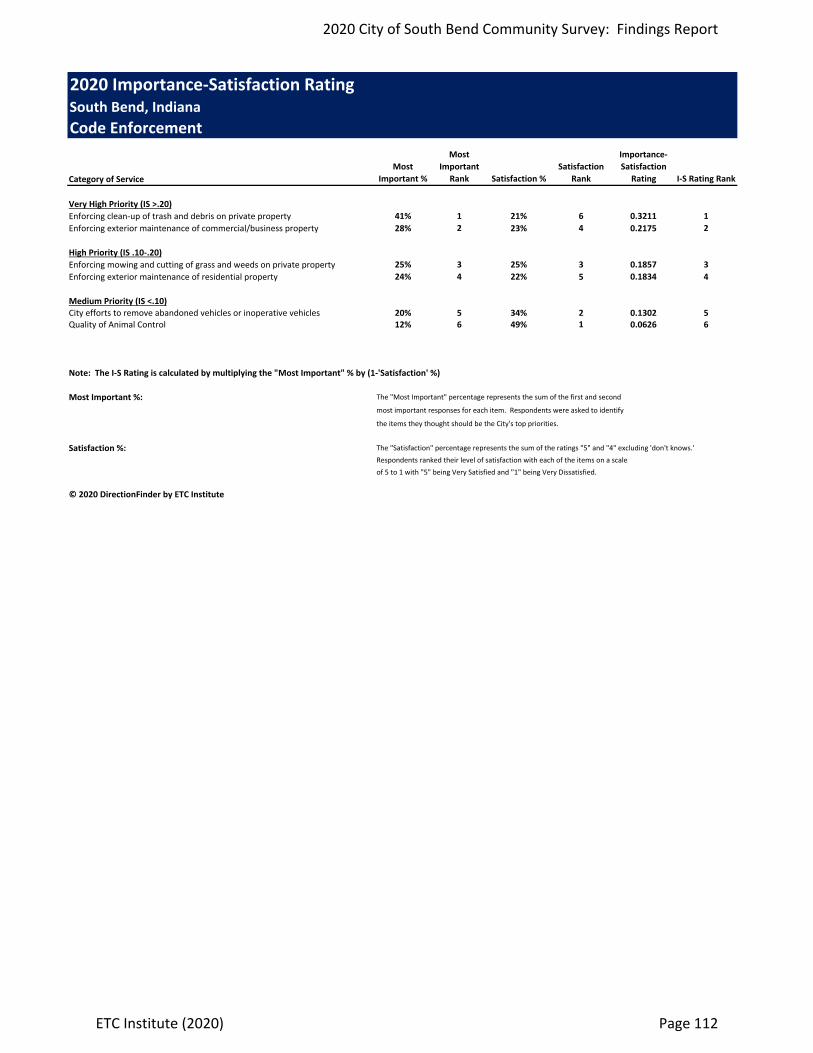
2020 Importance‐Satisfaction RatingSouth Bend, IndianaCode Enforcement
Category of ServiceMost
Important %
Most Important
Rank Satisfaction %Satisfaction
Rank
Importance‐Satisfaction
Rating I‐S Rating Rank
Very High Priority (IS >.20)Enforcing clean‐up of trash and debris on private property 41% 1 21% 6 0.3211 1Enforcing exterior maintenance of commercial/business property 28% 2 23% 4 0.2175 2
High Priority (IS .10‐.20)Enforcing mowing and cutting of grass and weeds on private property 25% 3 25% 3 0.1857 3Enforcing exterior maintenance of residential property 24% 4 22% 5 0.1834 4
Medium Priority (IS <.10)City efforts to remove abandoned vehicles or inoperative vehicles 20% 5 34% 2 0.1302 5Quality of Animal Control 12% 6 49% 1 0.0626 6
Note: The I‐S Rating is calculated by multiplying the "Most Important" % by (1‐'Satisfaction' %)
Most Important %: The "Most Important" percentage represents the sum of the first and second
most important responses for each item. Respondents were asked to identify
the items they thought should be the City's top priorities.
Satisfaction %: The "Satisfaction" percentage represents the sum of the ratings "5" and "4" excluding 'don't knows.'Respondents ranked their level of satisfaction with each of the items on a scaleof 5 to 1 with "5" being Very Satisfied and "1" being Very Dissatisfied.
© 2020 DirectionFinder by ETC Institute
2020 City of South Bend Community Survey: Findings Report
ETC Institute (2020) Page 112

2020 Importance‐Satisfaction RatingSouth Bend, IndianaSolid Waste
Category of ServiceMost
Important %
Most Important
Rank Satisfaction %Satisfaction
Rank
Importance‐Satisfaction
Rating I‐S Rating Rank
High Priority (IS .10‐.20)What you are charged for trash service 26% 1 46% 6 0.1396 1Quality of yard waste collection services 24% 2 56% 5 0.1050 2Bulky item pick‐up/removal services (e.g. old furniture, appliances) 23% 3 57% 4 0.1002 3
Medium Priority (IS <.10)City efforts to keep you informed about disruptions to trash service 23% 4 58% 3 0.0953 4Efforts by employees to ensure that all of your trash/yard waste is removed 22% 5 58% 2 0.0907 5Timeliness of your trash service 13% 6 79% 1 0.0275 6
Note: The I‐S Rating is calculated by multiplying the "Most Important" % by (1‐'Satisfaction' %)
Most Important %: The "Most Important" percentage represents the sum of the first and second
most important responses for each item. Respondents were asked to identify
the items they thought should be the City's top priorities.
Satisfaction %: The "Satisfaction" percentage represents the sum of the ratings "5" and "4" excluding 'don't knows.'Respondents ranked their level of satisfaction with each of the items on a scaleof 5 to 1 with "5" being Very Satisfied and "1" being Very Dissatisfied.
© 2020 DirectionFinder by ETC Institute
2020 City of South Bend Community Survey: Findings Report
ETC Institute (2020) Page 113

2020 Importance‐Satisfaction RatingSouth Bend, IndianaPublic Safety
Category of ServiceMost
Important %
Most Important
Rank Satisfaction %Satisfaction
Rank
Importance‐Satisfaction
Rating I‐S Rating Rank
Very High Priority (IS >.20)Efforts by local government in your area to prevent crime 51% 1 24% 10 0.3853 1Visibility of police in neighborhoods 37% 2 34% 9 0.2454 2
High Priority (IS .10‐.20)Overall feeling of safety in your neighborhood 36% 3 51% 4 0.1793 3Enforcement of local traffic laws 22% 5 39% 6 0.1357 4
Medium Priority (IS <.10)Professionalism of City police officers 26% 4 65% 2 0.0913 5Visibility of police in commercial and retail areas 17% 7 50% 5 0.0852 6How quickly police respond to emergencies 18% 6 62% 3 0.0684 7Fire education programs in your community 6% 8 39% 7 0.0375 8Fire inspection programs in your community 6% 9 39% 8 0.0375 9Professionalism of fire and EMS personnel 4% 10 87% 1 0.0046 10
Note: The I‐S Rating is calculated by multiplying the "Most Important" % by (1‐'Satisfaction' %)
Most Important %: The "Most Important" percentage represents the sum of the first, second, and third
most important responses for each item. Respondents were asked to identify
the items they thought should be the City's top priorities.
Satisfaction %: The "Satisfaction" percentage represents the sum of the ratings "5" and "4" excluding 'don't knows.'Respondents ranked their level of satisfaction with each of the items on a scaleof 5 to 1 with "5" being Very Satisfied and "1" being Very Dissatisfied.
© 2020 DirectionFinder by ETC Institute
2020 City of South Bend Community Survey: Findings Report
ETC Institute (2020) Page 114

2020 Importance‐Satisfaction RatingSouth Bend, IndianaTraffic and Transportation
Category of ServiceMost
Important %
Most Important
Rank Satisfaction %Satisfaction
Rank
Importance‐Satisfaction
Rating I‐S Rating Rank
Very High Priority (IS >.20)Condition of streets in your neighborhood 36% 1 36% 10 0.2268 1Condition of sidewalks in your neighborhood 30% 3 32% 12 0.2062 2
High Priority (IS .10‐.20)Condition of major City streets 31% 2 39% 9 0.1900 3Snow removal on neighborhood streets 30% 4 40% 8 0.1794 4Cleanliness of streets and other public areas 23% 5 41% 7 0.1359 5Adequacy of street lighting in your neighborhood 22% 6 52% 3 0.1039 6
Medium Priority (IS <.10)Flow of traffic in Downtown area 18% 7 43% 5 0.0996 7Quality of public transportation services 11% 9 46% 4 0.0581 8On‐street bicycle infrastructure 10% 10 42% 6 0.0556 9Snow removal on major City streets 14% 8 68% 1 0.0434 10Condition of catch basins in your neighborhood 7% 12 34% 11 0.0432 11Condition of street signs and traffic signals 8% 11 66% 2 0.0258 12
Note: The I‐S Rating is calculated by multiplying the "Most Important" % by (1‐'Satisfaction' %)
Most Important %: The "Most Important" percentage represents the sum of the first, second, and third
most important responses for each item. Respondents were asked to identify
the items they thought should be the City's top priorities.
Satisfaction %: The "Satisfaction" percentage represents the sum of the ratings "5" and "4" excluding 'don't knows.'Respondents ranked their level of satisfaction with each of the items on a scaleof 5 to 1 with "5" being Very Satisfied and "1" being Very Dissatisfied.
© 2020 DirectionFinder by ETC Institute
2020 City of South Bend Community Survey: Findings Report
ETC Institute (2020) Page 115
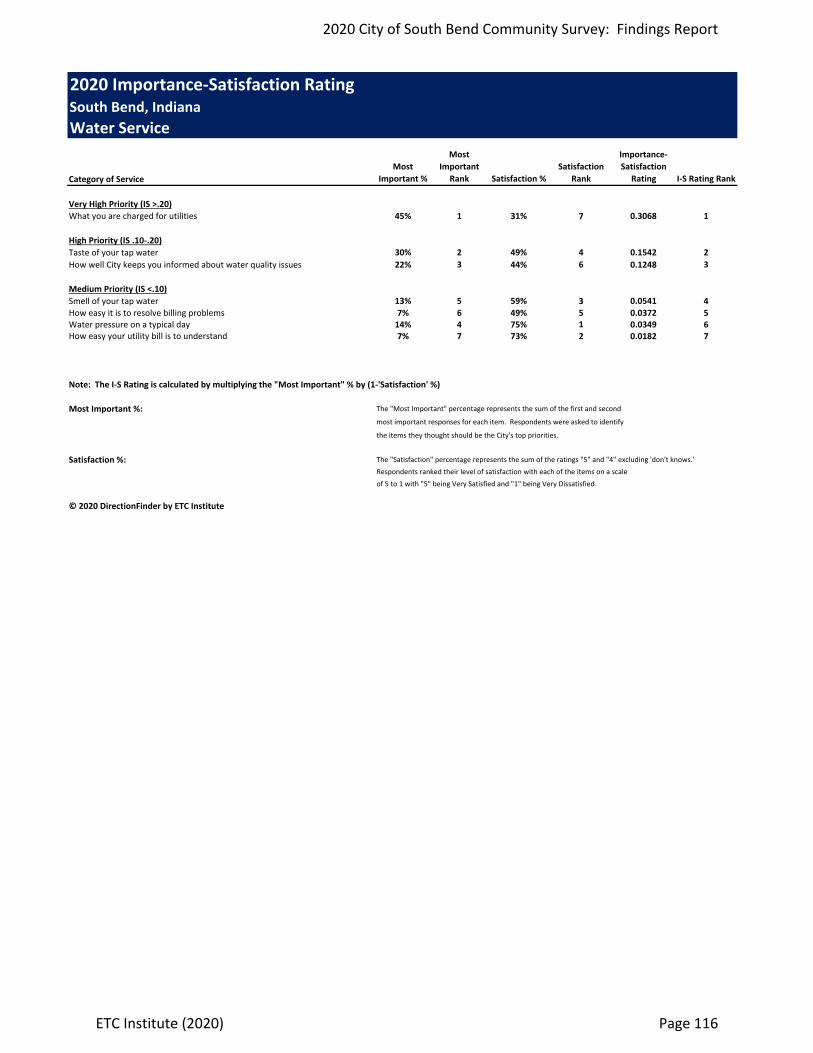
2020 Importance‐Satisfaction RatingSouth Bend, IndianaWater Service
Category of ServiceMost
Important %
Most Important
Rank Satisfaction %Satisfaction
Rank
Importance‐Satisfaction
Rating I‐S Rating Rank
Very High Priority (IS >.20)What you are charged for utilities 45% 1 31% 7 0.3068 1
High Priority (IS .10‐.20)Taste of your tap water 30% 2 49% 4 0.1542 2How well City keeps you informed about water quality issues 22% 3 44% 6 0.1248 3
Medium Priority (IS <.10)Smell of your tap water 13% 5 59% 3 0.0541 4How easy it is to resolve billing problems 7% 6 49% 5 0.0372 5Water pressure on a typical day 14% 4 75% 1 0.0349 6How easy your utility bill is to understand 7% 7 73% 2 0.0182 7
Note: The I‐S Rating is calculated by multiplying the "Most Important" % by (1‐'Satisfaction' %)
Most Important %: The "Most Important" percentage represents the sum of the first and second
most important responses for each item. Respondents were asked to identify
the items they thought should be the City's top priorities.
Satisfaction %: The "Satisfaction" percentage represents the sum of the ratings "5" and "4" excluding 'don't knows.'Respondents ranked their level of satisfaction with each of the items on a scaleof 5 to 1 with "5" being Very Satisfied and "1" being Very Dissatisfied.
© 2020 DirectionFinder by ETC Institute
2020 City of South Bend Community Survey: Findings Report
ETC Institute (2020) Page 116
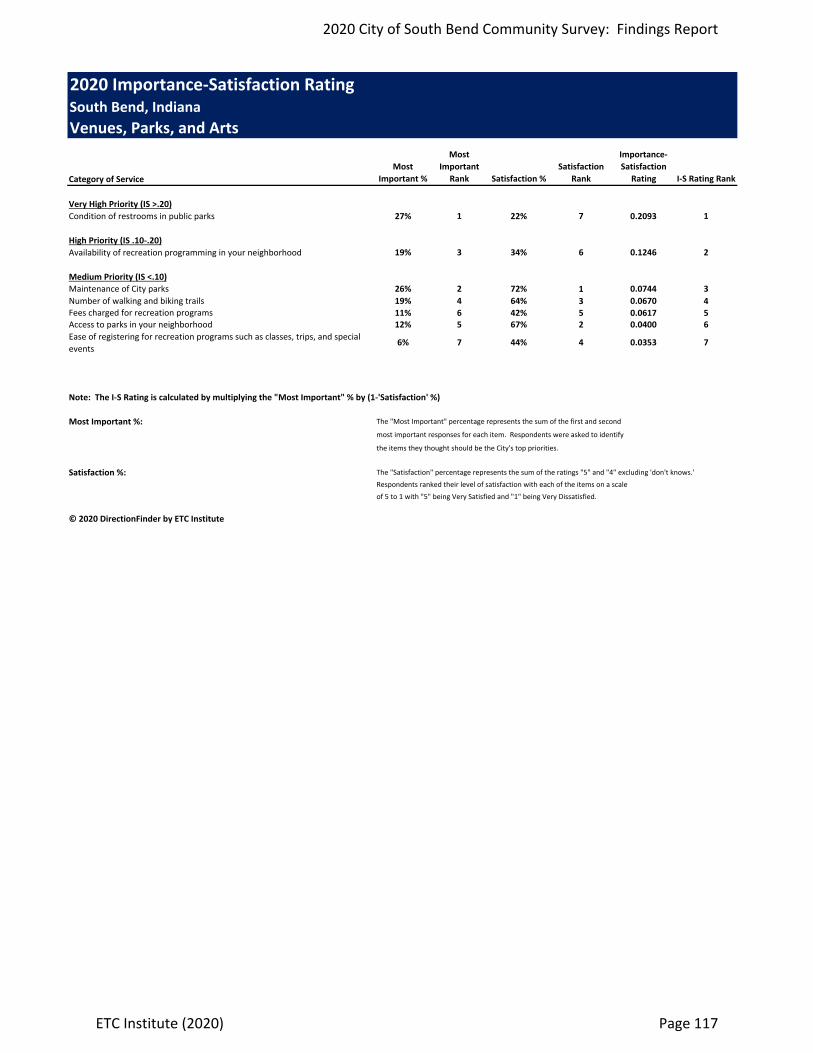
2020 Importance‐Satisfaction RatingSouth Bend, IndianaVenues, Parks, and Arts
Category of ServiceMost
Important %
Most Important
Rank Satisfaction %Satisfaction
Rank
Importance‐Satisfaction
Rating I‐S Rating Rank
Very High Priority (IS >.20)Condition of restrooms in public parks 27% 1 22% 7 0.2093 1
High Priority (IS .10‐.20)Availability of recreation programming in your neighborhood 19% 3 34% 6 0.1246 2
Medium Priority (IS <.10)Maintenance of City parks 26% 2 72% 1 0.0744 3Number of walking and biking trails 19% 4 64% 3 0.0670 4Fees charged for recreation programs 11% 6 42% 5 0.0617 5Access to parks in your neighborhood 12% 5 67% 2 0.0400 6Ease of registering for recreation programs such as classes, trips, and special events
6% 7 44% 4 0.0353 7
Note: The I‐S Rating is calculated by multiplying the "Most Important" % by (1‐'Satisfaction' %)
Most Important %: The "Most Important" percentage represents the sum of the first and second
most important responses for each item. Respondents were asked to identify
the items they thought should be the City's top priorities.
Satisfaction %: The "Satisfaction" percentage represents the sum of the ratings "5" and "4" excluding 'don't knows.'Respondents ranked their level of satisfaction with each of the items on a scaleof 5 to 1 with "5" being Very Satisfied and "1" being Very Dissatisfied.
© 2020 DirectionFinder by ETC Institute
2020 City of South Bend Community Survey: Findings Report
ETC Institute (2020) Page 117

Section 5:
Tabular Data
2020 City of South Bend Community Survey: Findings Report
ETC Institute (2020) Page 118
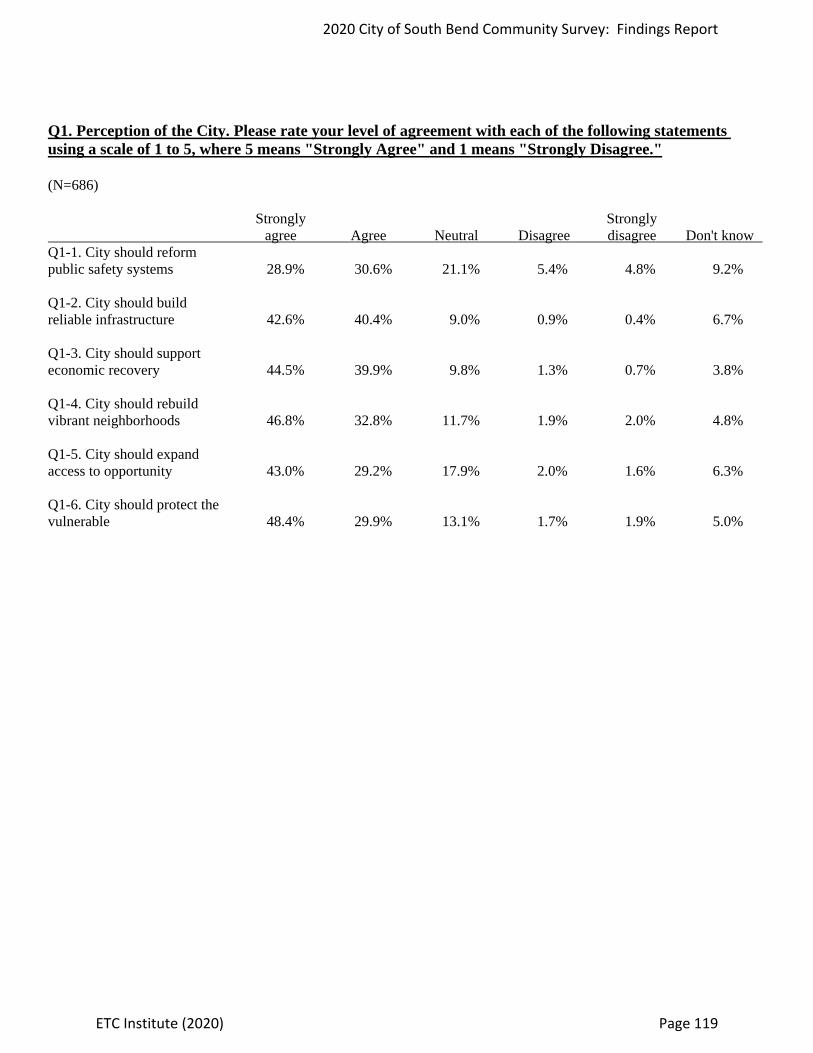
Q1. Perception of the City. Please rate your level of agreement with each of the following statements using a scale of 1 to 5, where 5 means "Strongly Agree" and 1 means "Strongly Disagree."
(N=686)
Strongly Stronglyagree Agree Neutral Disagree disagree Don't know
Q1-1. City should reform public safety systems 28.9% 30.6% 21.1% 5.4% 4.8% 9.2%
Q1-2. City should build reliable infrastructure 42.6% 40.4% 9.0% 0.9% 0.4% 6.7%
Q1-3. City should support economic recovery 44.5% 39.9% 9.8% 1.3% 0.7% 3.8%
Q1-4. City should rebuild vibrant neighborhoods 46.8% 32.8% 11.7% 1.9% 2.0% 4.8%
Q1-5. City should expand access to opportunity 43.0% 29.2% 17.9% 2.0% 1.6% 6.3%
Q1-6. City should protect the vulnerable 48.4% 29.9% 13.1% 1.7% 1.9% 5.0%
2020 City of South Bend Community Survey: Findings Report
ETC Institute (2020) Page 119
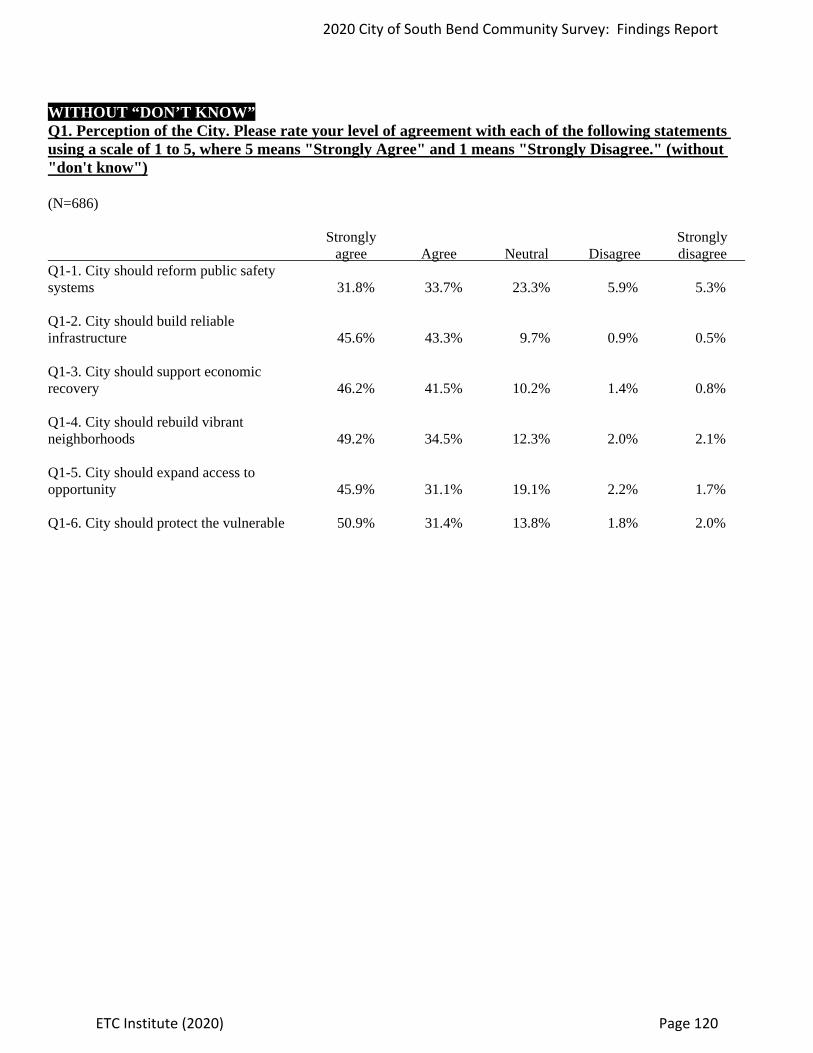
WITHOUT “DON’T KNOW” Q1. Perception of the City. Please rate your level of agreement with each of the following statements using a scale of 1 to 5, where 5 means "Strongly Agree" and 1 means "Strongly Disagree." (without "don't know")
(N=686)
Strongly Stronglyagree Agree Neutral Disagree disagree
Q1-1. City should reform public safety systems 31.8% 33.7% 23.3% 5.9% 5.3%
Q1-2. City should build reliable infrastructure 45.6% 43.3% 9.7% 0.9% 0.5%
Q1-3. City should support economic recovery 46.2% 41.5% 10.2% 1.4% 0.8%
Q1-4. City should rebuild vibrant neighborhoods 49.2% 34.5% 12.3% 2.0% 2.1%
Q1-5. City should expand access to opportunity 45.9% 31.1% 19.1% 2.2% 1.7%
Q1-6. City should protect the vulnerable 50.9% 31.4% 13.8% 1.8% 2.0%
2020 City of South Bend Community Survey: Findings Report
ETC Institute (2020) Page 120
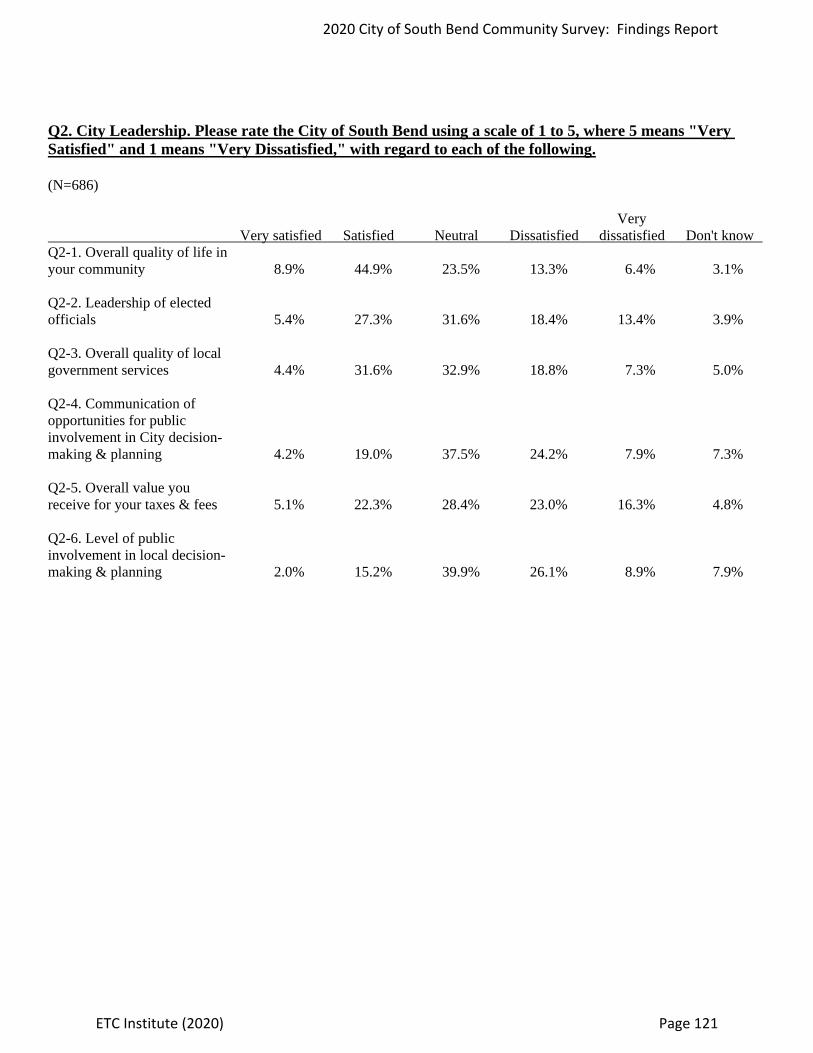
Q2. City Leadership. Please rate the City of South Bend using a scale of 1 to 5, where 5 means "Very Satisfied" and 1 means "Very Dissatisfied," with regard to each of the following. (N=686) Very Very satisfied Satisfied Neutral Dissatisfied dissatisfied Don't know Q2-1. Overall quality of life in your community 8.9% 44.9% 23.5% 13.3% 6.4% 3.1% Q2-2. Leadership of elected officials 5.4% 27.3% 31.6% 18.4% 13.4% 3.9% Q2-3. Overall quality of local government services 4.4% 31.6% 32.9% 18.8% 7.3% 5.0% Q2-4. Communication of opportunities for public involvement in City decision- making & planning 4.2% 19.0% 37.5% 24.2% 7.9% 7.3% Q2-5. Overall value you receive for your taxes & fees 5.1% 22.3% 28.4% 23.0% 16.3% 4.8% Q2-6. Level of public involvement in local decision- making & planning 2.0% 15.2% 39.9% 26.1% 8.9% 7.9%
2020 City of South Bend Community Survey: Findings Report
ETC Institute (2020) Page 121

WITHOUT “DON’T KNOW” Q2. City Leadership. Please rate the City of South Bend using a scale of 1 to 5, where 5 means "Very Satisfied" and 1 means "Very Dissatisfied," with regard to each of the following. (without "don't know")
(N=686)
VeryVery satisfied Satisfied Neutral Dissatisfied dissatisfied
Q2-1. Overall quality of life in your community 9.2% 46.3% 24.2% 13.7% 6.6%
Q2-2. Leadership of elected officials 5.6% 28.4% 32.9% 19.1% 14.0%
Q2-3. Overall quality of local government services 4.6% 33.3% 34.7% 19.8% 7.7%
Q2-4. Communication of opportunities for public involvement in City decision- making & planning 4.6% 20.4% 40.4% 26.1% 8.5%
Q2-5. Overall value you receive for your taxes & fees 5.4% 23.4% 29.9% 24.2% 17.2%
Q2-6. Level of public involvement in local decision-making & planning 2.2% 16.5% 43.4% 28.3% 9.7%
2020 City of South Bend Community Survey: Findings Report
ETC Institute (2020) Page 122

Q3. Overall Ratings of South Bend. Please rate the City of South Bend using a scale of 1 to 5, where 5 means "Very Satisfied" and 1 means "Very Dissatisfied," with regard to each of the following.
(N=686)
VeryVery satisfied Satisfied Neutral Dissatisfied dissatisfied Don't know
Q3-1. As a place to live 13.7% 43.1% 20.4% 13.6% 7.3% 1.9%
Q3-2. As a place to work 10.9% 38.2% 28.4% 10.8% 6.1% 5.5%
Q3-3. As a community that is moving in the right direction 8.3% 31.2% 24.9% 20.6% 11.4% 3.6%
Q3-4. As a place to visit 9.6% 30.5% 33.1% 15.7% 8.0% 3.1%
Q3-5. As a place to raise children 10.5% 28.7% 22.7% 18.4% 13.7% 6.0%
Q3-6. As a place to retire 10.9% 24.3% 26.4% 16.8% 14.9% 6.7%
2020 City of South Bend Community Survey: Findings Report
ETC Institute (2020) Page 123
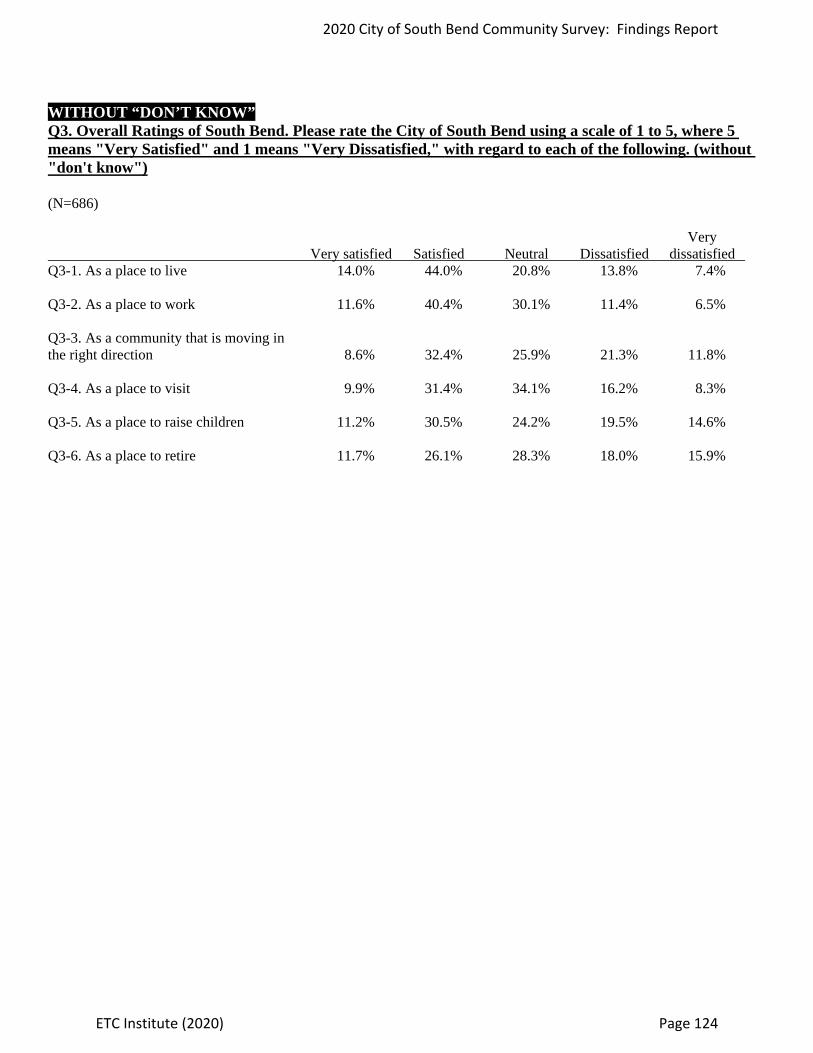
WITHOUT “DON’T KNOW” Q3. Overall Ratings of South Bend. Please rate the City of South Bend using a scale of 1 to 5, where 5 means "Very Satisfied" and 1 means "Very Dissatisfied," with regard to each of the following. (without "don't know")
(N=686)
VeryVery satisfied Satisfied Neutral Dissatisfied dissatisfied
Q3-1. As a place to live 14.0% 44.0% 20.8% 13.8% 7.4%
Q3-2. As a place to work 11.6% 40.4% 30.1% 11.4% 6.5%
Q3-3. As a community that is moving in the right direction 8.6% 32.4% 25.9% 21.3% 11.8%
Q3-4. As a place to visit 9.9% 31.4% 34.1% 16.2% 8.3%
Q3-5. As a place to raise children 11.2% 30.5% 24.2% 19.5% 14.6%
Q3-6. As a place to retire 11.7% 26.1% 28.3% 18.0% 15.9%
2020 City of South Bend Community Survey: Findings Report
ETC Institute (2020) Page 124
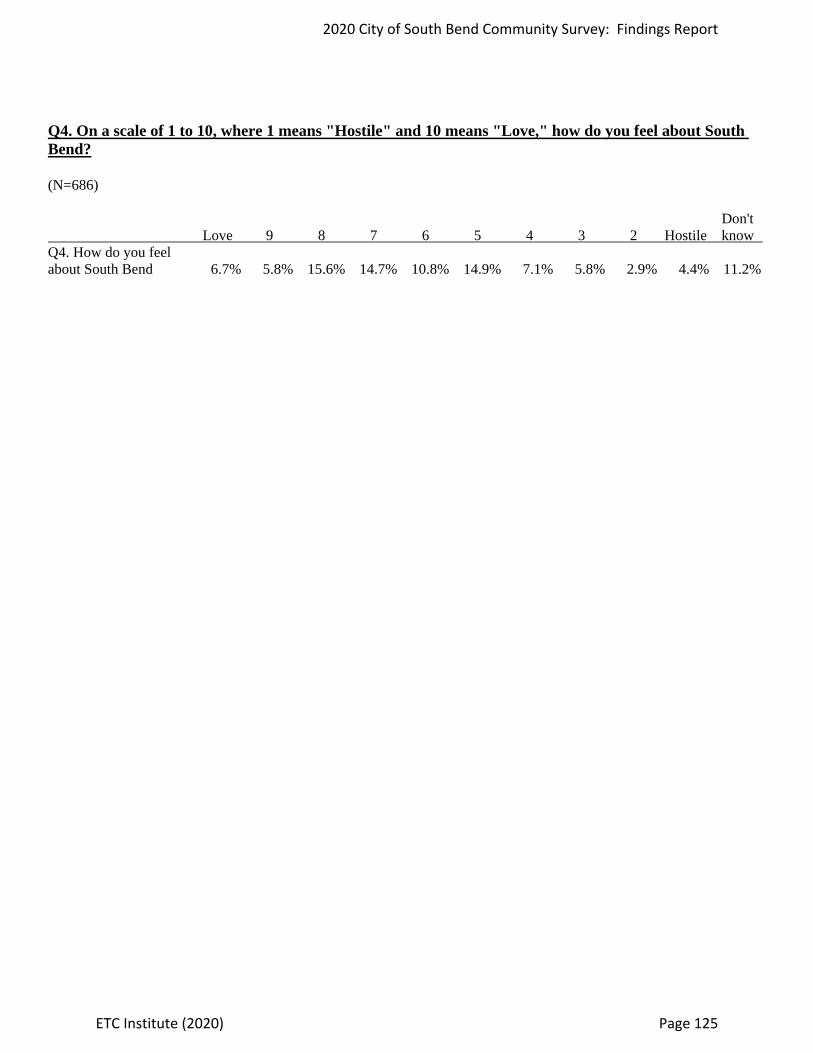
Q4. On a scale of 1 to 10, where 1 means "Hostile" and 10 means "Love," how do you feel about South Bend?
(N=686)
Don't Love 9 8 7 6 5 4 3 2 Hostile know
Q4. How do you feel about South Bend 6.7% 5.8% 15.6% 14.7% 10.8% 14.9% 7.1% 5.8% 2.9% 4.4% 11.2%
2020 City of South Bend Community Survey: Findings Report
ETC Institute (2020) Page 125

WITHOUT “DON’T KNOW” Q4. On a scale of 1 to 10, where 1 means "Hostile" and 10 means "Love," how do you feel about South Bend? (without "don't know")
(N=686)
Love 9 8 7 6 5 4 3 2 Hostile Q4. How do you feel about South Bend 7.6% 6.6% 17.6% 16.6% 12.2% 16.7% 8.0% 6.6% 3.3% 4.9%
2020 City of South Bend Community Survey: Findings Report
ETC Institute (2020) Page 126

Q5. Customer Service and Communication. Please rate the City of South Bend using a scale of 1 to 5, where 5 means "Very Satisfied" and 1 means "Very Dissatisfied," with regard to each of the following. (N=686) Very Very satisfied Satisfied Neutral Dissatisfied dissatisfied Don't know Q5-1. Availability of information about local government services & activities 7.4% 29.2% 35.3% 17.8% 5.1% 5.2% Q5-2. Hours that customer service is available 7.0% 31.2% 33.2% 12.8% 5.1% 10.6% Q5-3. Quality of social media outlets (e.g. Facebook, Twitter) 4.2% 21.4% 42.4% 6.7% 4.1% 21.1%
2020 City of South Bend Community Survey: Findings Report
ETC Institute (2020) Page 127

WITHOUT “DON’T KNOW” Q5. Customer Service and Communication. Please rate the City of South Bend using a scale of 1 to 5, where 5 means "Very Satisfied" and 1 means "Very Dissatisfied," with regard to each of the following. (without "don't know") (N=686) Very Very satisfied Satisfied Neutral Dissatisfied dissatisfied Q5-1. Availability of information about local government services & activities 7.8% 30.8% 37.2% 18.8% 5.4% Q5-2. Hours that customer service is available 7.8% 34.9% 37.2% 14.4% 5.7% Q5-3. Quality of social media outlets (e.g. Facebook, Twitter) 5.4% 27.2% 53.8% 8.5% 5.2%
2020 City of South Bend Community Survey: Findings Report
ETC Institute (2020) Page 128

Q6. Which of the following are your PRIMARY SOURCES of information about City issues, services, and events?
Q6. What are your primary sources of information about City issues, services, & events Number Percent City website 216 31.5 % Social media 300 43.7 % Public meetings 55 8.0 % Local news 544 79.3 % Contacting City directly 124 18.1 %
Other 83 12.1 % Total 1322
2020 City of South Bend Community Survey: Findings Report
ETC Institute (2020) Page 129

Q7. Which TWO of the information sources listed in Question 6 do you MOST PREFER to learn about City issues, services, and events?
Q7. Top choice Number Percent City website 108 15.7 % Social media 125 18.2 % Public meetings 19 2.8 % Local news 290 42.3 % Contacting City directly 22 3.2 %
Other 32 4.7 % None chosen 90 13.1 %
Total 686 100.0 %
Q7. Which TWO of the information sources listed in Question 6 do you MOST PREFER to learn about City issues, services, and events?
Q7. 2nd choice Number Percent City website 108 15.7 % Social media 132 19.2 % Public meetings 32 4.7 % Local news 149 21.7 % Contacting City directly 62 9.0 %
Other 36 5.2 % None chosen 167 24.3 %
Total 686 100.0 %
Q7. Which TWO of the information sources listed in Question 6 do you MOST PREFER to learn about City issues, services, and events? (top 2)
Q7. Sum of top 2 choices Number Percent City website 216 31.5 % Social media 257 37.5 % Public meetings 51 7.4 % Local news 439 64.0 % Contacting City directly 84 12.2 %
Other 68 9.9 % None chosen 90 13.1 %
Total 1205
2020 City of South Bend Community Survey: Findings Report
ETC Institute (2020) Page 130

Q8. Have you or other members of your household used the City of South Bend's website in the last year?
Q8. Have you used City's website in last year Number Percent Yes 362 52.8 % No 324 47.2 % Total 686 100.0 %
Q8a. How did you access the City's website?
Q8a. How did you access City's website Number Percent Computer 263 72.7 % Phone 164 45.3 % Tablet 47 13.0 % Total 474
Q8b. How would you rate the overall usefulness of the City's website?
Q8b. How would you rate overall usefulness of City's website Number Percent Excellent 21 5.8 % Good 155 42.8 % Fair 153 42.3 % Poor 29 8.0 %
Don't know 4 1.1 % Total 362 100.0 %
WITHOUT “DON’T KNOW” Q8b. How would you rate the overall usefulness of the City's website? (without "don't know")
Q8b. How would you rate overall usefulness of City's website Number Percent Excellent 21 5.9 % Good 155 43.3 % Fair 153 42.7 % Poor 29 8.1 % Total 358 100.0 %
2020 City of South Bend Community Survey: Findings Report
ETC Institute (2020) Page 131
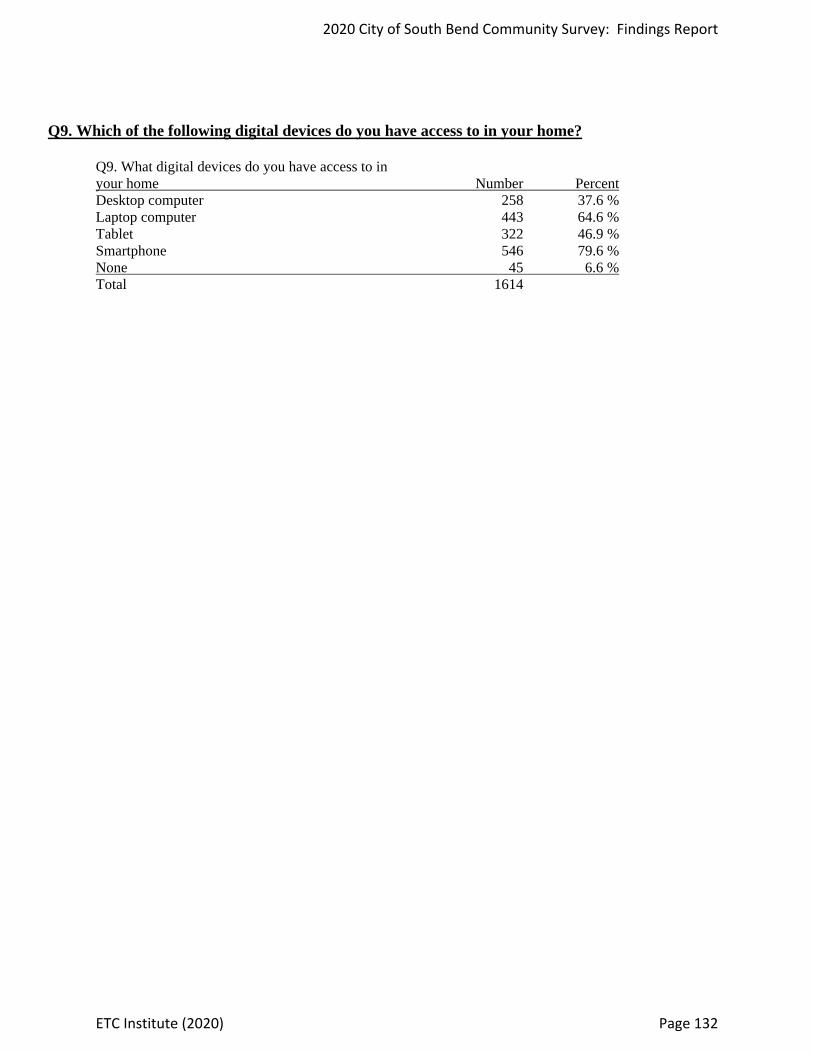
Q9. Which of the following digital devices do you have access to in your home? Q9. What digital devices do you have access to in your home Number Percent Desktop computer 258 37.6 % Laptop computer 443 64.6 % Tablet 322 46.9 % Smartphone 546 79.6 % None 45 6.6 % Total 1614
2020 City of South Bend Community Survey: Findings Report
ETC Institute (2020) Page 132
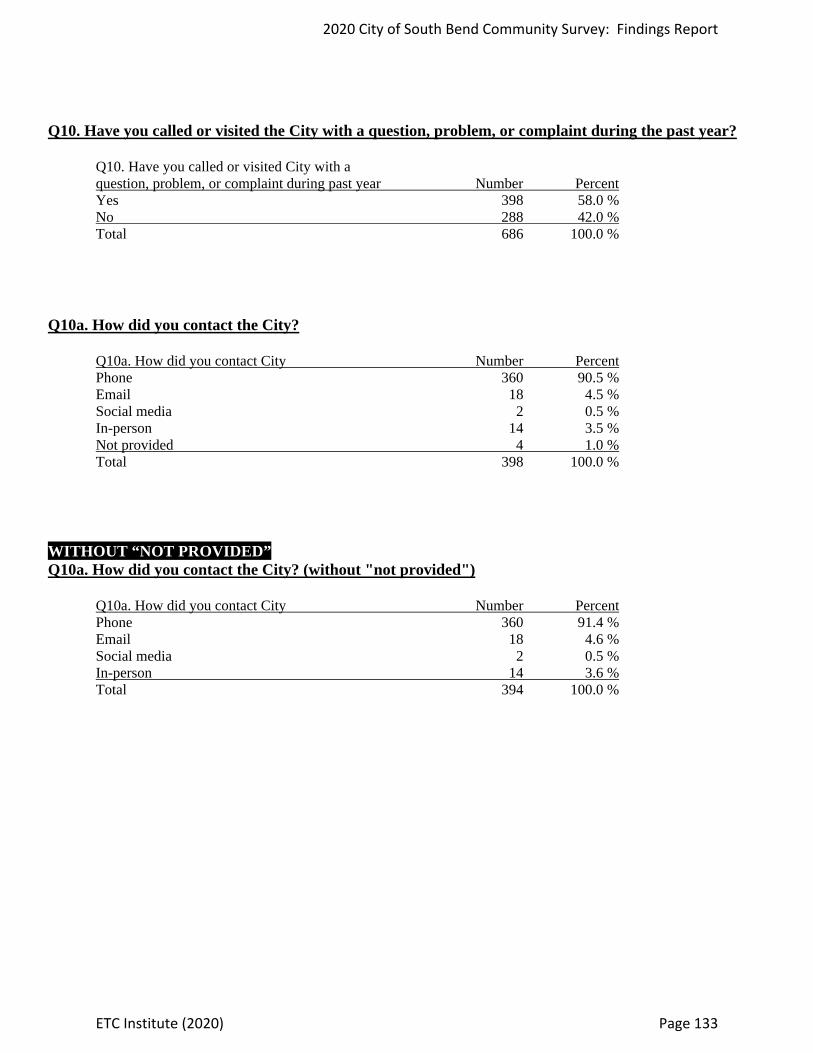
Q10. Have you called or visited the City with a question, problem, or complaint during the past year?
Q10. Have you called or visited City with a question, problem, or complaint during past year Number Percent
Yes 398 58.0 % No 288 42.0 % Total 686 100.0 %
Q10a. How did you contact the City?
Q10a. How did you contact City Number Percent Phone 360 90.5 % Email 18 4.5 %
Social media 2 0.5 % In-person 14 3.5 %
Not provided 4 1.0 % Total 398 100.0 %
WITHOUT “NOT PROVIDED” Q10a. How did you contact the City? (without "not provided")
Q10a. How did you contact City Number Percent Phone 360 91.4 % Email 18 4.6 %
Social media 2 0.5 % In-person 14 3.6 % Total 394 100.0 %
2020 City of South Bend Community Survey: Findings Report
ETC Institute (2020) Page 133

Q10b. Did you contact 311?
Q10b. Did you contact 311 Number Percent Yes 321 80.7 % No 77 19.3 % Total 398 100.0 %
Q10c. How easy was it to address your issue?
Q10c. How easy was it to address your issue Number Percent Very easy 116 29.1 % Somewhat easy 113 28.4 %
Neutral 58 14.6 % Difficult 65 16.3 %
Very difficult 44 11.1 % Not provided 2 0.5 %
Total 398 100.0 %
WITHOUT “NOT PROVIDED” Q10c. How easy was it to address your issue? (without "not provided")
Q10c. How easy was it to address your issue Number Percent Very easy 116 29.3 % Somewhat easy 113 28.5 %
Neutral 58 14.6 % Difficult 65 16.4 %
Very difficult 44 11.1 % Total 396 100.0 %
2020 City of South Bend Community Survey: Findings Report
ETC Institute (2020) Page 134

Q10e. For each of the factors below that may influence your perception of the quality of customer service you receive from City employees, please rate how often the employees you have contacted during the past year have displayed the behavior described using a scale of 1 to 5, where 5 means "Always" and 1 means "Never."
(N=398)
Always Usually Sometimes Seldom Never Don't know Q10e-1. They were courteous & polite 40.5% 35.7% 13.8% 5.5% 1.5% 3.0%
Q10e-2. They gave accurate answers to your questions 31.9% 32.2% 18.1% 9.0% 3.5% 5.3%
WITHOUT “DON’T KNOW” Q10e. For each of the factors below that may influence your perception of the quality of customer service you receive from City employees, please rate how often the employees you have contacted during the past year have displayed the behavior described using a scale of 1 to 5, where 5 means "Always" and 1 means "Never." (without "don't know")
(N=398)
Always Usually Sometimes Seldom Never Q10e-1. They were courteous & polite 41.7% 36.8% 14.2% 5.7% 1.6%
Q10e-2. They gave accurate answers to your questions 33.7% 34.0% 19.1% 9.5% 3.7%
2020 City of South Bend Community Survey: Findings Report
ETC Institute (2020) Page 135

Q11. Major Categories of City Services. Please rate the City of South Bend using a scale of 1 to 5, where 5 means "Very Satisfied" and 1 means "Very Dissatisfied," with regard to each of the following.
(N=686)
VeryVery satisfied Satisfied Neutral Dissatisfied dissatisfied Don't know
Q11-1. Overall quality of fire services 31.0% 36.4% 12.2% 0.9% 0.6% 18.8%
Q11-2. Overall quality of ambulance/emergency medical services 31.5% 34.5% 11.2% 1.6% 0.6% 20.6%
Q11-3. Overall quality of trash collection services 20.6% 44.0% 16.2% 11.5% 3.8% 3.9%
Q11-4. Overall quality of parks & recreation programs & facilities 20.0% 42.0% 21.4% 7.9% 1.6% 7.1%
Q11-5. Overall quality of water utility services 17.9% 42.3% 20.7% 8.9% 5.7% 4.5%
Q11-6. Overall quality of local police protection 20.3% 35.3% 19.4% 11.2% 6.7% 7.1%
Q11-7. How well City is planning growth 7.4% 20.4% 35.4% 15.3% 7.4% 14.0%
Q11-8. Overall enforcement of local codes & ordinances 4.7% 19.5% 32.9% 18.4% 12.4% 12.1%
Q11-9. The process for getting a permit 4.8% 12.4% 28.0% 4.4% 3.1% 47.4%
Q11-10. Overall maintenance of City streets, sidewalks, & infrastructure 3.8% 19.8% 23.6% 28.9% 20.8% 3.1%
2020 City of South Bend Community Survey: Findings Report
ETC Institute (2020) Page 136
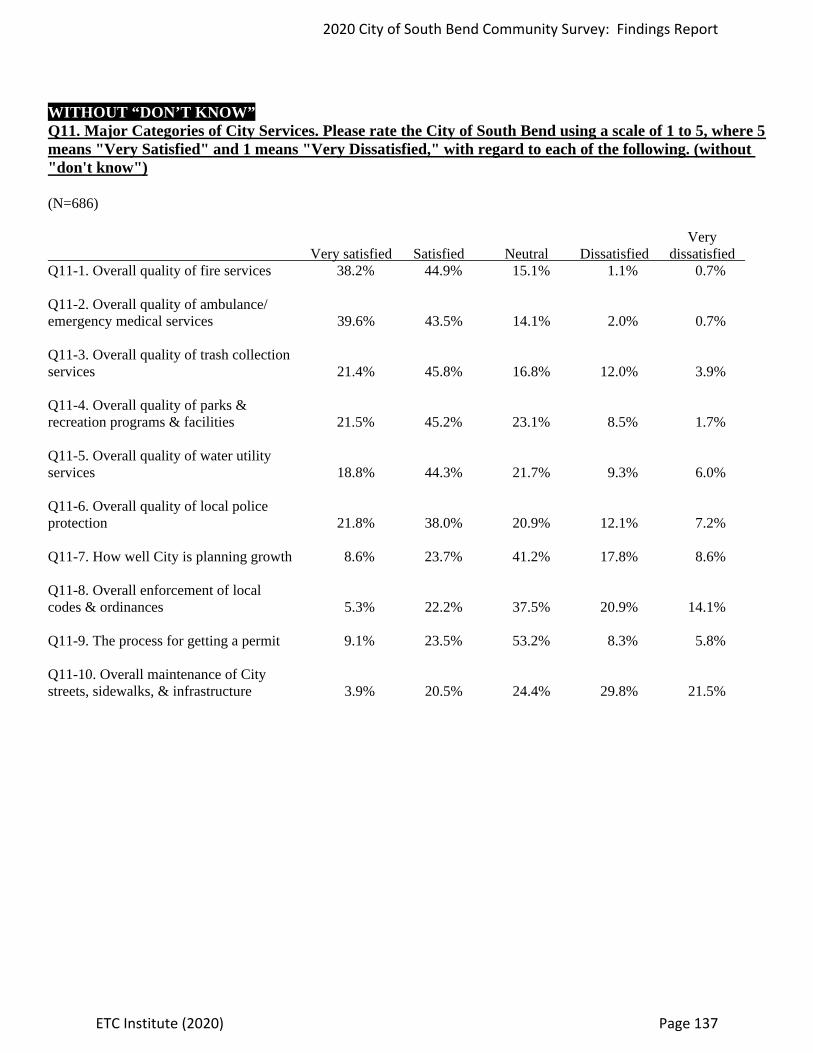
WITHOUT “DON’T KNOW” Q11. Major Categories of City Services. Please rate the City of South Bend using a scale of 1 to 5, where 5 means "Very Satisfied" and 1 means "Very Dissatisfied," with regard to each of the following. (without "don't know")
(N=686)
VeryVery satisfied Satisfied Neutral Dissatisfied dissatisfied
Q11-1. Overall quality of fire services 38.2% 44.9% 15.1% 1.1% 0.7%
Q11-2. Overall quality of ambulance/ emergency medical services 39.6% 43.5% 14.1% 2.0% 0.7%
Q11-3. Overall quality of trash collection services 21.4% 45.8% 16.8% 12.0% 3.9%
Q11-4. Overall quality of parks & recreation programs & facilities 21.5% 45.2% 23.1% 8.5% 1.7%
Q11-5. Overall quality of water utility services 18.8% 44.3% 21.7% 9.3% 6.0%
Q11-6. Overall quality of local police protection 21.8% 38.0% 20.9% 12.1% 7.2%
Q11-7. How well City is planning growth 8.6% 23.7% 41.2% 17.8% 8.6%
Q11-8. Overall enforcement of local codes & ordinances 5.3% 22.2% 37.5% 20.9% 14.1%
Q11-9. The process for getting a permit 9.1% 23.5% 53.2% 8.3% 5.8%
Q11-10. Overall maintenance of City streets, sidewalks, & infrastructure 3.9% 20.5% 24.4% 29.8% 21.5%
2020 City of South Bend Community Survey: Findings Report
ETC Institute (2020) Page 137
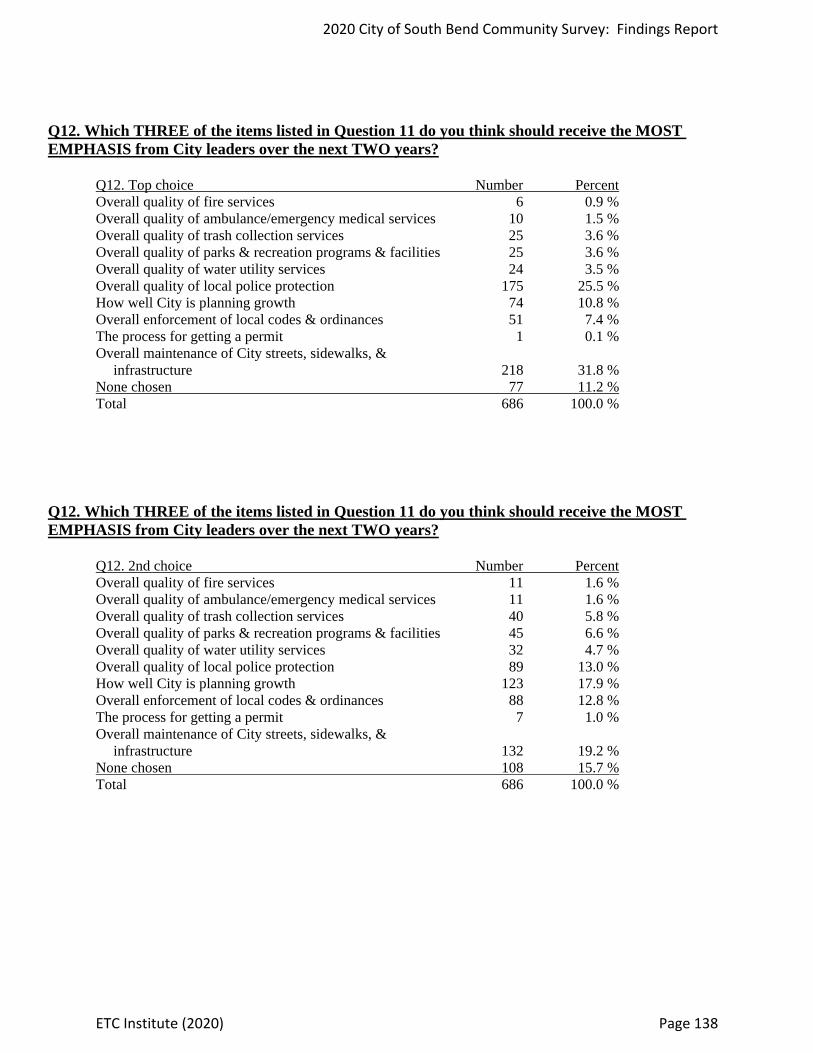
Q12. Which THREE of the items listed in Question 11 do you think should receive the MOST EMPHASIS from City leaders over the next TWO years?
Q12. Top choice Number Percent Overall quality of fire services 6 0.9 % Overall quality of ambulance/emergency medical services 10 1.5 % Overall quality of trash collection services 25 3.6 % Overall quality of parks & recreation programs & facilities 25 3.6 % Overall quality of water utility services 24 3.5 % Overall quality of local police protection 175 25.5 % How well City is planning growth 74 10.8 % Overall enforcement of local codes & ordinances 51 7.4 % The process for getting a permit 1 0.1 % Overall maintenance of City streets, sidewalks, & infrastructure 218 31.8 % None chosen 77 11.2 %
Total 686 100.0 %
Q12. Which THREE of the items listed in Question 11 do you think should receive the MOST EMPHASIS from City leaders over the next TWO years?
Q12. 2nd choice Number Percent Overall quality of fire services 11 1.6 % Overall quality of ambulance/emergency medical services 11 1.6 % Overall quality of trash collection services 40 5.8 % Overall quality of parks & recreation programs & facilities 45 6.6 % Overall quality of water utility services 32 4.7 % Overall quality of local police protection 89 13.0 % How well City is planning growth 123 17.9 % Overall enforcement of local codes & ordinances 88 12.8 % The process for getting a permit 7 1.0 % Overall maintenance of City streets, sidewalks, & infrastructure 132 19.2 % None chosen 108 15.7 %
Total 686 100.0 %
2020 City of South Bend Community Survey: Findings Report
ETC Institute (2020) Page 138
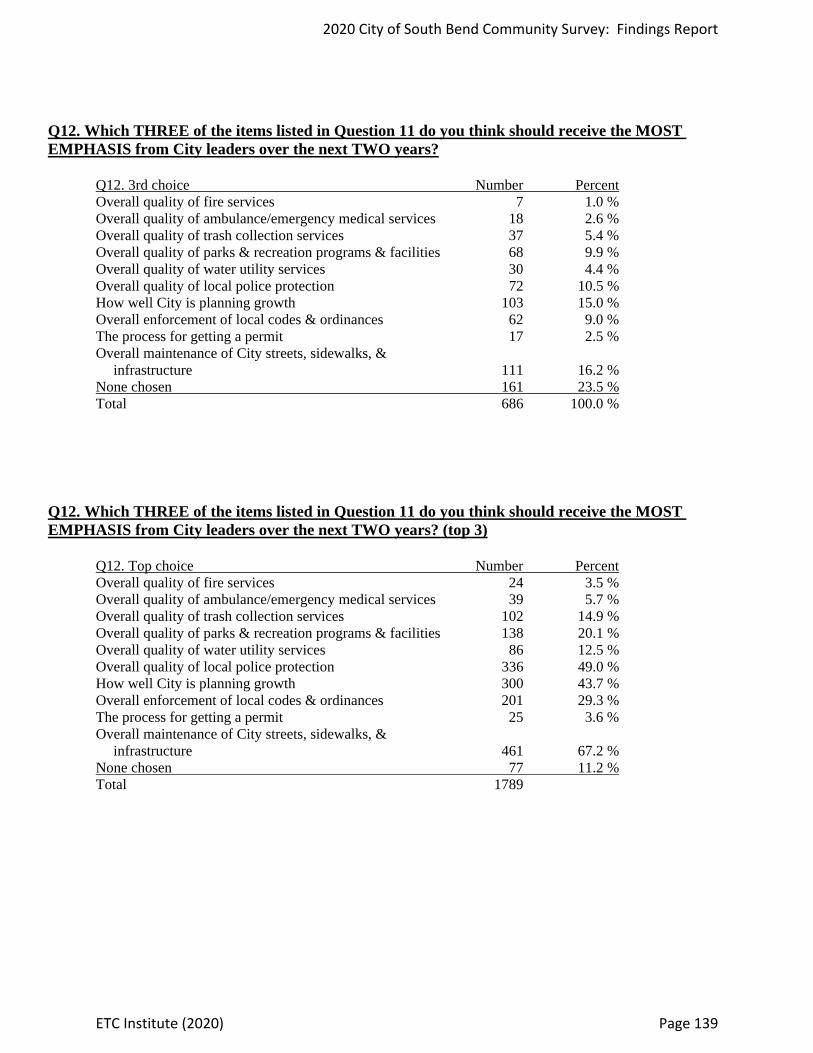
Q12. Which THREE of the items listed in Question 11 do you think should receive the MOST EMPHASIS from City leaders over the next TWO years?
Q12. 3rd choice Number Percent Overall quality of fire services 7 1.0 % Overall quality of ambulance/emergency medical services 18 2.6 % Overall quality of trash collection services 37 5.4 % Overall quality of parks & recreation programs & facilities 68 9.9 % Overall quality of water utility services 30 4.4 % Overall quality of local police protection 72 10.5 % How well City is planning growth 103 15.0 % Overall enforcement of local codes & ordinances 62 9.0 % The process for getting a permit 17 2.5 % Overall maintenance of City streets, sidewalks, & infrastructure 111 16.2 % None chosen 161 23.5 %
Total 686 100.0 %
Q12. Which THREE of the items listed in Question 11 do you think should receive the MOST EMPHASIS from City leaders over the next TWO years? (top 3)
Q12. Top choice Number Percent Overall quality of fire services 24 3.5 % Overall quality of ambulance/emergency medical services 39 5.7 % Overall quality of trash collection services 102 14.9 % Overall quality of parks & recreation programs & facilities 138 20.1 % Overall quality of water utility services 86 12.5 % Overall quality of local police protection 336 49.0 % How well City is planning growth 300 43.7 % Overall enforcement of local codes & ordinances 201 29.3 % The process for getting a permit 25 3.6 % Overall maintenance of City streets, sidewalks, & infrastructure 461 67.2 % None chosen 77 11.2 %
Total 1789
2020 City of South Bend Community Survey: Findings Report
ETC Institute (2020) Page 139
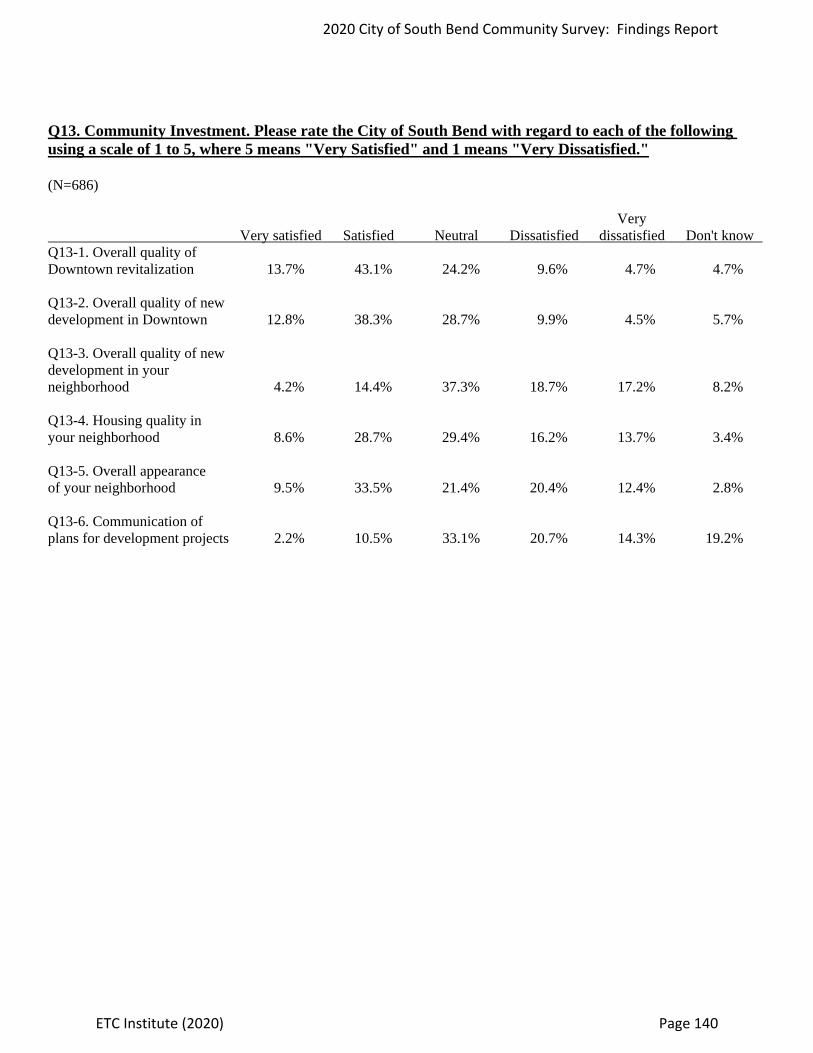
Q13. Community Investment. Please rate the City of South Bend with regard to each of the following using a scale of 1 to 5, where 5 means "Very Satisfied" and 1 means "Very Dissatisfied."
(N=686)
VeryVery satisfied Satisfied Neutral Dissatisfied dissatisfied Don't know
Q13-1. Overall quality of Downtown revitalization 13.7% 43.1% 24.2% 9.6% 4.7% 4.7%
Q13-2. Overall quality of new development in Downtown 12.8% 38.3% 28.7% 9.9% 4.5% 5.7%
Q13-3. Overall quality of new development in your neighborhood 4.2% 14.4% 37.3% 18.7% 17.2% 8.2%
Q13-4. Housing quality in your neighborhood 8.6% 28.7% 29.4% 16.2% 13.7% 3.4%
Q13-5. Overall appearance of your neighborhood 9.5% 33.5% 21.4% 20.4% 12.4% 2.8%
Q13-6. Communication of plans for development projects 2.2% 10.5% 33.1% 20.7% 14.3% 19.2%
2020 City of South Bend Community Survey: Findings Report
ETC Institute (2020) Page 140

WITHOUT “DON’T KNOW” Q13. Community Investment. Please rate the City of South Bend with regard to each of the following using a scale of 1 to 5, where 5 means "Very Satisfied" and 1 means "Very Dissatisfied." (without "don't know")
(N=686)
VeryVery satisfied Satisfied Neutral Dissatisfied dissatisfied
Q13-1. Overall quality of Downtown revitalization 14.4% 45.3% 25.4% 10.1% 4.9%
Q13-2. Overall quality of new development in Downtown 13.6% 40.6% 30.4% 10.5% 4.8%
Q13-3. Overall quality of new development in your neighborhood 4.6% 15.7% 40.6% 20.3% 18.7%
Q13-4. Housing quality in your neighborhood 8.9% 29.7% 30.5% 16.7% 14.2%
Q13-5. Overall appearance of your neighborhood 9.7% 34.5% 22.0% 21.0% 12.7%
Q13-6. Communication of plans for development projects 2.7% 13.0% 41.0% 25.6% 17.7%
2020 City of South Bend Community Survey: Findings Report
ETC Institute (2020) Page 141
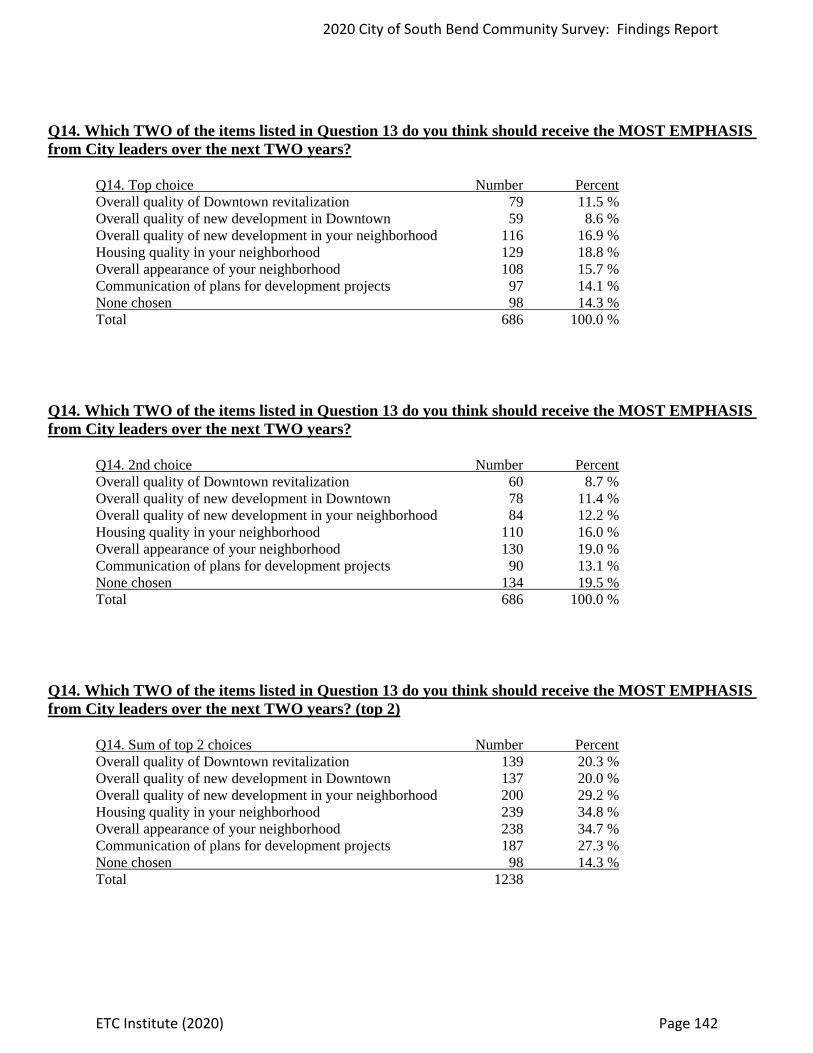
Q14. Which TWO of the items listed in Question 13 do you think should receive the MOST EMPHASIS from City leaders over the next TWO years? Q14. Top choice Number Percent Overall quality of Downtown revitalization 79 11.5 % Overall quality of new development in Downtown 59 8.6 % Overall quality of new development in your neighborhood 116 16.9 % Housing quality in your neighborhood 129 18.8 % Overall appearance of your neighborhood 108 15.7 % Communication of plans for development projects 97 14.1 % None chosen 98 14.3 % Total 686 100.0 %
Q14. Which TWO of the items listed in Question 13 do you think should receive the MOST EMPHASIS from City leaders over the next TWO years? Q14. 2nd choice Number Percent Overall quality of Downtown revitalization 60 8.7 % Overall quality of new development in Downtown 78 11.4 % Overall quality of new development in your neighborhood 84 12.2 % Housing quality in your neighborhood 110 16.0 % Overall appearance of your neighborhood 130 19.0 % Communication of plans for development projects 90 13.1 % None chosen 134 19.5 % Total 686 100.0 %
Q14. Which TWO of the items listed in Question 13 do you think should receive the MOST EMPHASIS from City leaders over the next TWO years? (top 2) Q14. Sum of top 2 choices Number Percent Overall quality of Downtown revitalization 139 20.3 % Overall quality of new development in Downtown 137 20.0 % Overall quality of new development in your neighborhood 200 29.2 % Housing quality in your neighborhood 239 34.8 % Overall appearance of your neighborhood 238 34.7 % Communication of plans for development projects 187 27.3 % None chosen 98 14.3 % Total 1238
2020 City of South Bend Community Survey: Findings Report
ETC Institute (2020) Page 142

Q15. Do you feel that your neighborhood has improved over the past FIVE years? Q15. Has your neighborhood improved over the past five years Number Percent Yes 196 28.6 % No 341 49.7 % Have not lived in my neighborhood for 5 years 128 18.7 % Not provided 21 3.1 % Total 686 100.0 %
WITHOUT “NOT PROVIDED” Q15. Do you feel that your neighborhood has improved over the past FIVE years? (without "not provided") Q15. Has your neighborhood improved over the past five years Number Percent Yes 196 29.5 % No 341 51.3 % Have not lived in my neighborhood for 5 years 128 19.2 % Total 665 100.0 %
2020 City of South Bend Community Survey: Findings Report
ETC Institute (2020) Page 143

Q16. Do you belong to a neighborhood association? Q16. Do you belong to a neighborhood association Number Percent Yes 128 18.7 % No 548 79.9 % Not provided 10 1.5 % Total 686 100.0 %
WITHOUT “NOT PROVIDED” Q16. Do you belong to a neighborhood association? (without "not provided") Q16. Do you belong to a neighborhood association Number Percent Yes 128 18.9 % No 548 81.1 % Total 676 100.0 %
2020 City of South Bend Community Survey: Findings Report
ETC Institute (2020) Page 144

Q16a. How satisfied are you with the City's engagement with your neighborhood association? Q16a. How satisfied are you with City's engagement with your neighborhood association Number Percent Very satisfied 8 6.3 % Satisfied 30 23.4 % Neutral 54 42.2 % Dissatisfied 21 16.4 % Very dissatisfied 12 9.4 % Not provided 3 2.3 % Total 128 100.0 % WITHOUT “NOT PROVIDED” Q16a. How satisfied are you with the City's engagement with your neighborhood association? (without "not provided") Q16a. How satisfied are you with City's engagement with your neighborhood association Number Percent Very satisfied 8 6.4 % Satisfied 30 24.0 % Neutral 54 43.2 % Dissatisfied 21 16.8 % Very dissatisfied 12 9.6 % Total 125 100.0 %
2020 City of South Bend Community Survey: Findings Report
ETC Institute (2020) Page 145
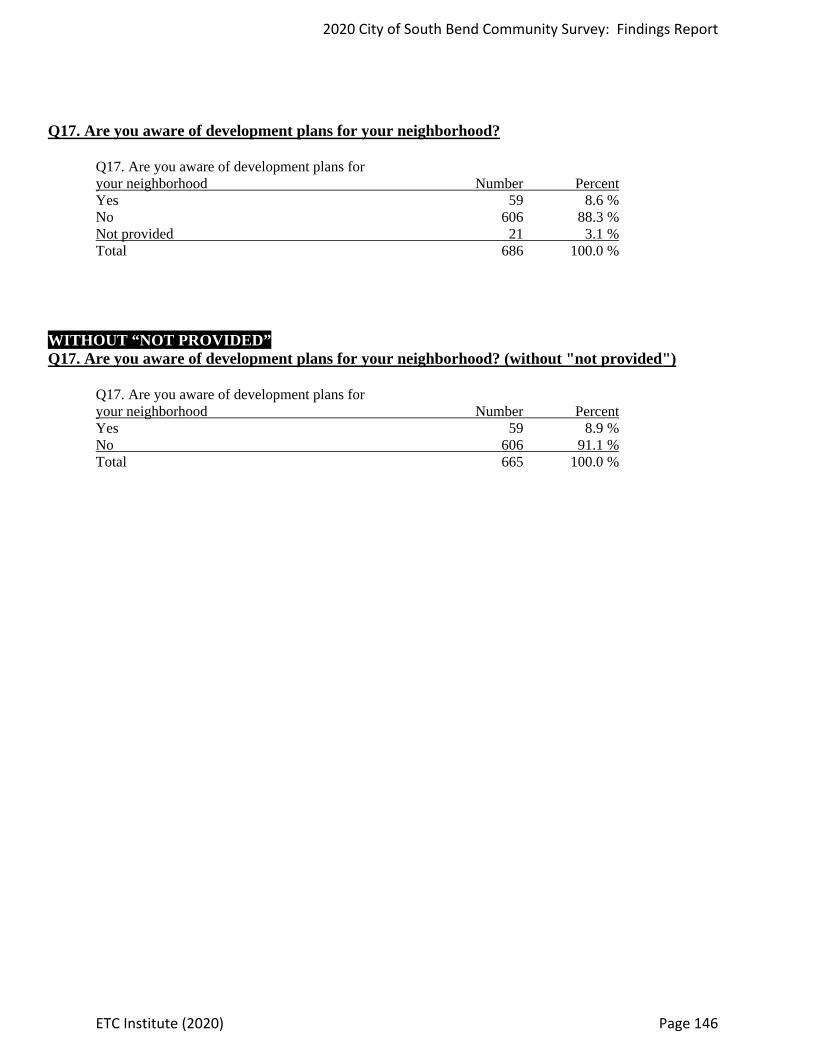
Q17. Are you aware of development plans for your neighborhood? Q17. Are you aware of development plans for your neighborhood Number Percent Yes 59 8.6 % No 606 88.3 % Not provided 21 3.1 % Total 686 100.0 %
WITHOUT “NOT PROVIDED” Q17. Are you aware of development plans for your neighborhood? (without "not provided") Q17. Are you aware of development plans for your neighborhood Number Percent Yes 59 8.9 % No 606 91.1 % Total 665 100.0 %
2020 City of South Bend Community Survey: Findings Report
ETC Institute (2020) Page 146

Q18. Code Enforcement. Please rate the City of South Bend using a scale of 1 to 5, where 5 means "Very Satisfied" and 1 means "Very Dissatisfied," with regard to each of the following. (N=686) Very Very satisfied Satisfied Neutral Dissatisfied dissatisfied Don't know Q18-1. Quality of animal control 6.6% 31.6% 26.5% 9.0% 4.7% 21.6% Q18-2. City efforts to remove abandoned vehicles or inoperative vehicles 4.1% 22.2% 28.3% 16.5% 6.6% 22.4% Q18-3. Enforcing clean-up of trash & debris on private property 3.2% 15.2% 27.3% 25.9% 14.7% 13.7% Q18-4. Enforcing mowing & cutting of grass & weeds on private property 4.4% 16.6% 29.9% 22.2% 12.7% 14.3% Q18-5. Enforcing exterior maintenance of commercial/ business property 2.8% 16.3% 30.8% 21.1% 10.5% 18.5% Q18-6. Enforcing exterior maintenance of residential property 2.9% 15.3% 28.4% 24.5% 10.9% 17.9%
2020 City of South Bend Community Survey: Findings Report
ETC Institute (2020) Page 147
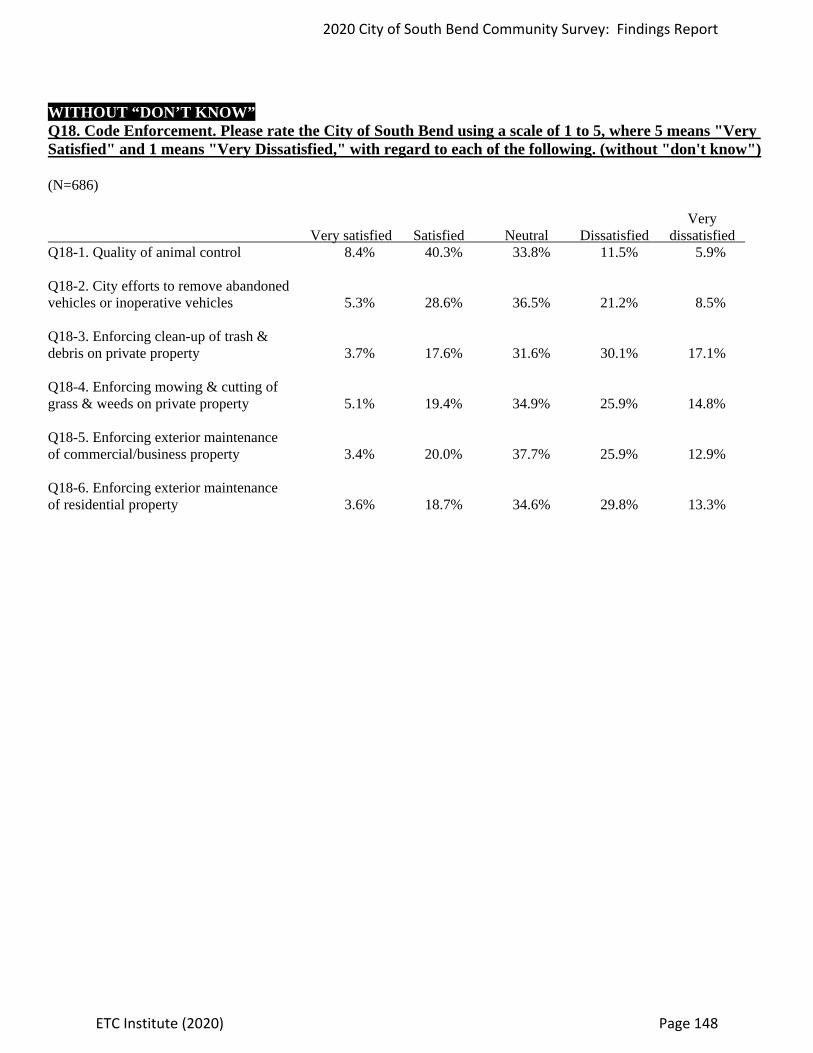
WITHOUT “DON’T KNOW” Q18. Code Enforcement. Please rate the City of South Bend using a scale of 1 to 5, where 5 means "Very Satisfied" and 1 means "Very Dissatisfied," with regard to each of the following. (without "don't know") (N=686) Very Very satisfied Satisfied Neutral Dissatisfied dissatisfied Q18-1. Quality of animal control 8.4% 40.3% 33.8% 11.5% 5.9% Q18-2. City efforts to remove abandoned vehicles or inoperative vehicles 5.3% 28.6% 36.5% 21.2% 8.5% Q18-3. Enforcing clean-up of trash & debris on private property 3.7% 17.6% 31.6% 30.1% 17.1% Q18-4. Enforcing mowing & cutting of grass & weeds on private property 5.1% 19.4% 34.9% 25.9% 14.8% Q18-5. Enforcing exterior maintenance of commercial/business property 3.4% 20.0% 37.7% 25.9% 12.9% Q18-6. Enforcing exterior maintenance of residential property 3.6% 18.7% 34.6% 29.8% 13.3%
2020 City of South Bend Community Survey: Findings Report
ETC Institute (2020) Page 148
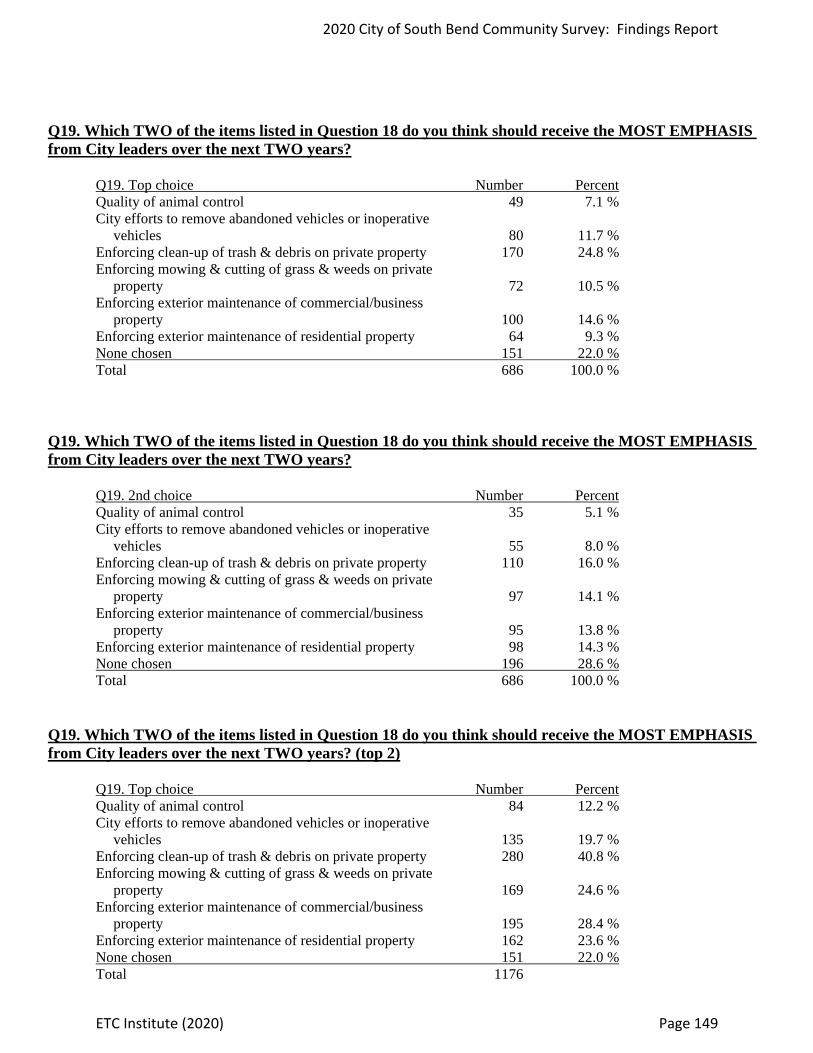
Q19. Which TWO of the items listed in Question 18 do you think should receive the MOST EMPHASIS from City leaders over the next TWO years? Q19. Top choice Number Percent Quality of animal control 49 7.1 % City efforts to remove abandoned vehicles or inoperative vehicles 80 11.7 % Enforcing clean-up of trash & debris on private property 170 24.8 % Enforcing mowing & cutting of grass & weeds on private property 72 10.5 % Enforcing exterior maintenance of commercial/business property 100 14.6 % Enforcing exterior maintenance of residential property 64 9.3 % None chosen 151 22.0 % Total 686 100.0 %
Q19. Which TWO of the items listed in Question 18 do you think should receive the MOST EMPHASIS from City leaders over the next TWO years? Q19. 2nd choice Number Percent Quality of animal control 35 5.1 % City efforts to remove abandoned vehicles or inoperative vehicles 55 8.0 % Enforcing clean-up of trash & debris on private property 110 16.0 % Enforcing mowing & cutting of grass & weeds on private property 97 14.1 % Enforcing exterior maintenance of commercial/business property 95 13.8 % Enforcing exterior maintenance of residential property 98 14.3 % None chosen 196 28.6 % Total 686 100.0 %
Q19. Which TWO of the items listed in Question 18 do you think should receive the MOST EMPHASIS from City leaders over the next TWO years? (top 2) Q19. Top choice Number Percent Quality of animal control 84 12.2 % City efforts to remove abandoned vehicles or inoperative vehicles 135 19.7 % Enforcing clean-up of trash & debris on private property 280 40.8 % Enforcing mowing & cutting of grass & weeds on private property 169 24.6 % Enforcing exterior maintenance of commercial/business property 195 28.4 % Enforcing exterior maintenance of residential property 162 23.6 % None chosen 151 22.0 % Total 1176
2020 City of South Bend Community Survey: Findings Report
ETC Institute (2020) Page 149
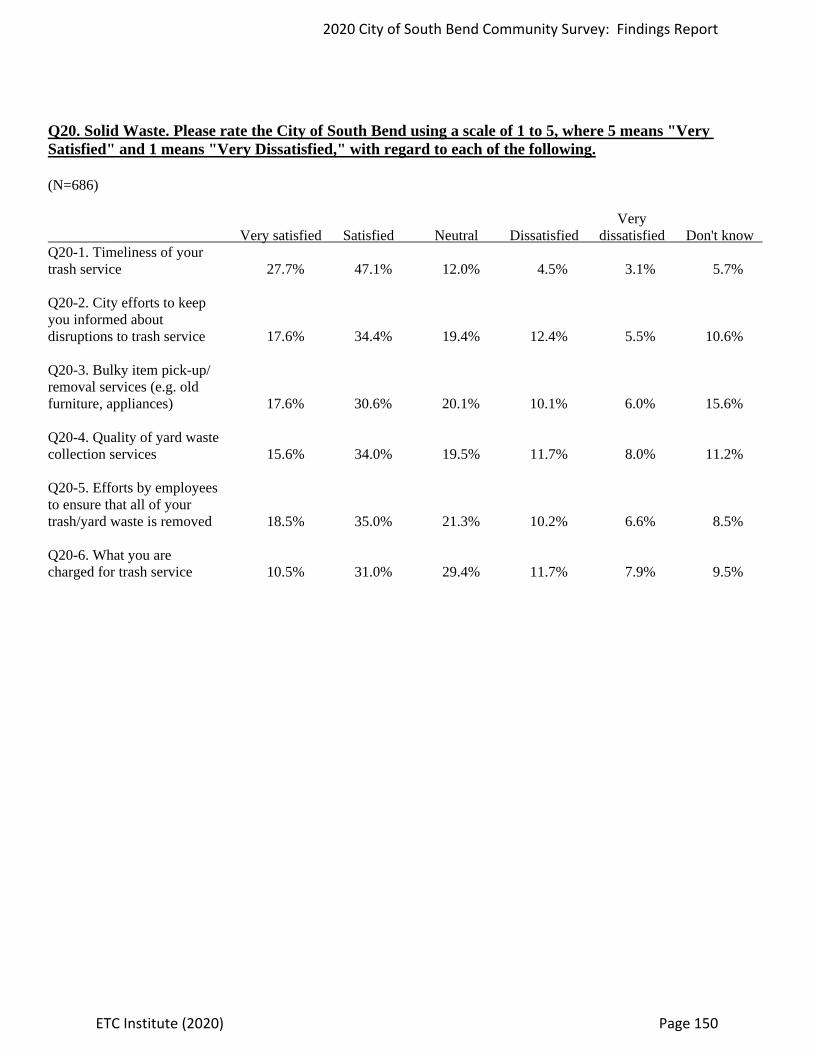
Q20. Solid Waste. Please rate the City of South Bend using a scale of 1 to 5, where 5 means "Very Satisfied" and 1 means "Very Dissatisfied," with regard to each of the following. (N=686) Very Very satisfied Satisfied Neutral Dissatisfied dissatisfied Don't know Q20-1. Timeliness of your trash service 27.7% 47.1% 12.0% 4.5% 3.1% 5.7% Q20-2. City efforts to keep you informed about disruptions to trash service 17.6% 34.4% 19.4% 12.4% 5.5% 10.6% Q20-3. Bulky item pick-up/ removal services (e.g. old furniture, appliances) 17.6% 30.6% 20.1% 10.1% 6.0% 15.6% Q20-4. Quality of yard waste collection services 15.6% 34.0% 19.5% 11.7% 8.0% 11.2% Q20-5. Efforts by employees to ensure that all of your trash/yard waste is removed 18.5% 35.0% 21.3% 10.2% 6.6% 8.5% Q20-6. What you are charged for trash service 10.5% 31.0% 29.4% 11.7% 7.9% 9.5%
2020 City of South Bend Community Survey: Findings Report
ETC Institute (2020) Page 150

WITHOUT “DON’T KNOW” Q20. Solid Waste. Please rate the City of South Bend using a scale of 1 to 5, where 5 means "Very Satisfied" and 1 means "Very Dissatisfied," with regard to each of the following. (without "don't know") (N=686) Very Very satisfied Satisfied Neutral Dissatisfied dissatisfied Q20-1. Timeliness of your trash service 29.4% 49.9% 12.7% 4.8% 3.2% Q20-2. City efforts to keep you informed about disruptions to trash service 19.7% 38.5% 21.7% 13.9% 6.2% Q20-3. Bulky item pick-up/removal services (e.g. old furniture, appliances) 20.9% 36.3% 23.8% 11.9% 7.1% Q20-4. Quality of yard waste collection services 17.6% 38.3% 22.0% 13.1% 9.0% Q20-5. Efforts by employees to ensure that all of your trash/yard waste is removed 20.2% 38.2% 23.2% 11.1% 7.2% Q20-6. What you are charged for trash service 11.6% 34.3% 32.5% 12.9% 8.7%
2020 City of South Bend Community Survey: Findings Report
ETC Institute (2020) Page 151
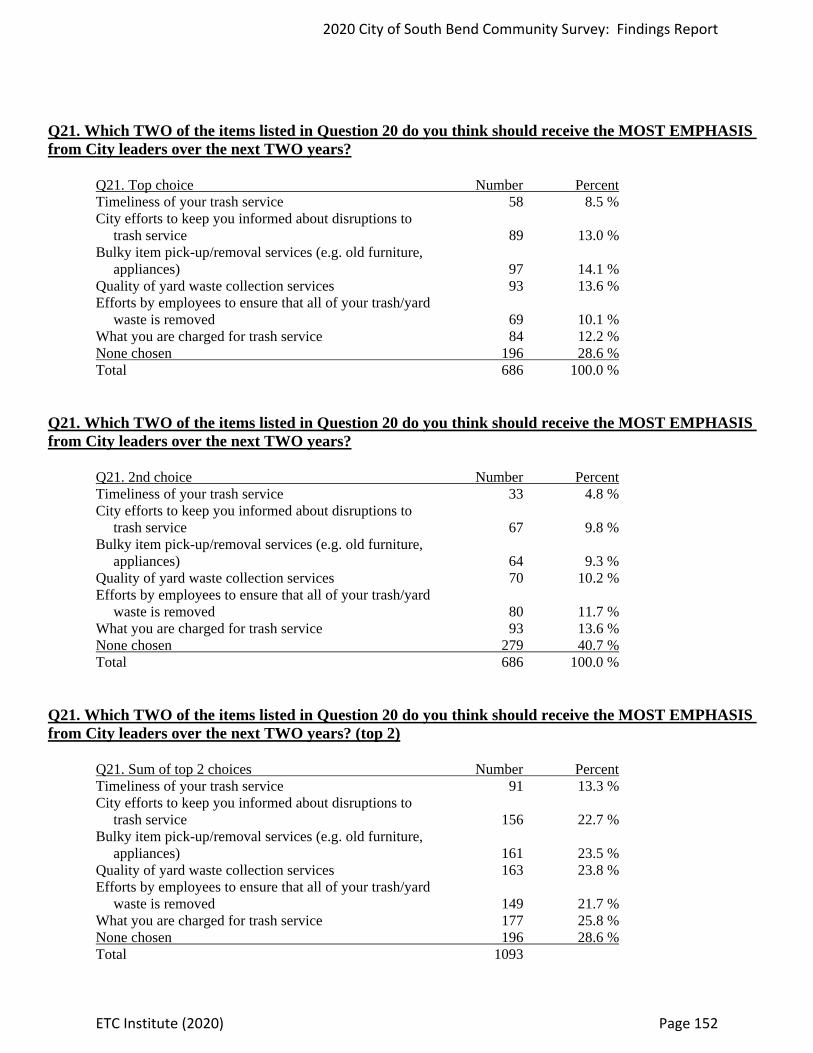
Q21. Which TWO of the items listed in Question 20 do you think should receive the MOST EMPHASIS from City leaders over the next TWO years? Q21. Top choice Number Percent Timeliness of your trash service 58 8.5 % City efforts to keep you informed about disruptions to trash service 89 13.0 % Bulky item pick-up/removal services (e.g. old furniture, appliances) 97 14.1 % Quality of yard waste collection services 93 13.6 % Efforts by employees to ensure that all of your trash/yard waste is removed 69 10.1 % What you are charged for trash service 84 12.2 % None chosen 196 28.6 % Total 686 100.0 %
Q21. Which TWO of the items listed in Question 20 do you think should receive the MOST EMPHASIS from City leaders over the next TWO years? Q21. 2nd choice Number Percent Timeliness of your trash service 33 4.8 % City efforts to keep you informed about disruptions to trash service 67 9.8 % Bulky item pick-up/removal services (e.g. old furniture, appliances) 64 9.3 % Quality of yard waste collection services 70 10.2 % Efforts by employees to ensure that all of your trash/yard waste is removed 80 11.7 % What you are charged for trash service 93 13.6 % None chosen 279 40.7 % Total 686 100.0 % Q21. Which TWO of the items listed in Question 20 do you think should receive the MOST EMPHASIS from City leaders over the next TWO years? (top 2) Q21. Sum of top 2 choices Number Percent Timeliness of your trash service 91 13.3 % City efforts to keep you informed about disruptions to trash service 156 22.7 % Bulky item pick-up/removal services (e.g. old furniture, appliances) 161 23.5 % Quality of yard waste collection services 163 23.8 % Efforts by employees to ensure that all of your trash/yard waste is removed 149 21.7 % What you are charged for trash service 177 25.8 % None chosen 196 28.6 % Total 1093
2020 City of South Bend Community Survey: Findings Report
ETC Institute (2020) Page 152

Q22. Public Safety. Please rate the City of South Bend using a scale of 1 to 5, where 5 means "Very Satisfied" and 1 means "Very Dissatisfied," with regard to each of the following. (N=686) Very Very satisfied Satisfied Neutral Dissatisfied dissatisfied Don't know Q22-1. Professionalism of fire & EMS personnel 34.3% 33.5% 8.7% 1.2% 0.3% 22.0% Q22-2. Professionalism of City police officers 26.5% 31.0% 17.1% 8.7% 4.7% 12.0% Q22-3. How quickly police respond to emergencies 21.1% 28.7% 19.5% 8.2% 3.2% 19.2% Q22-4. Visibility of police in commercial & retail areas 14.0% 30.5% 29.3% 10.5% 5.2% 10.5% Q22-5. Overall feeling of safety in your neighborhood 12.4% 36.3% 24.9% 14.3% 8.3% 3.8% Q22-6. Visibility of police in neighborhoods 7.9% 23.5% 31.3% 21.1% 8.0% 8.2% Q22-7. Enforcement of local traffic laws 8.3% 26.2% 27.4% 14.9% 10.9% 12.2% Q22-8. Fire education programs in your community 8.3% 16.3% 30.9% 6.0% 2.5% 36.0% Q22-9. Fire inspection programs in your community 7.9% 16.0% 29.3% 6.4% 2.5% 37.9% Q22-10. Efforts by local government in your area to prevent crime 4.5% 15.5% 25.2% 22.6% 14.6% 17.6%
2020 City of South Bend Community Survey: Findings Report
ETC Institute (2020) Page 153

WITHOUT “DON’T KNOW” Q22. Public Safety. Please rate the City of South Bend using a scale of 1 to 5, where 5 means "Very Satisfied" and 1 means "Very Dissatisfied," with regard to each of the following. (without "don't know") (N=686) Very Very satisfied Satisfied Neutral Dissatisfied dissatisfied Q22-1. Professionalism of fire & EMS personnel 43.9% 43.0% 11.2% 1.5% 0.4% Q22-2. Professionalism of City police officers 30.1% 35.3% 19.4% 9.9% 5.3% Q22-3. How quickly police respond to emergencies 26.2% 35.6% 24.2% 10.1% 4.0% Q22-4. Visibility of police in commercial & retail areas 15.6% 34.0% 32.7% 11.7% 5.9% Q22-5. Overall feeling of safety in your neighborhood 12.9% 37.7% 25.9% 14.8% 8.6% Q22-6. Visibility of police in neighborhoods 8.6% 25.6% 34.1% 23.0% 8.7% Q22-7. Enforcement of local traffic laws 9.5% 29.9% 31.2% 16.9% 12.5% Q22-8. Fire education programs in your community 13.0% 25.5% 48.3% 9.3% 3.9% Q22-9. Fire inspection programs in your community 12.7% 25.8% 47.2% 10.3% 4.0% Q22-10. Efforts by local government in your area to prevent crime 5.5% 18.8% 30.6% 27.4% 17.7%
2020 City of South Bend Community Survey: Findings Report
ETC Institute (2020) Page 154

Q23. Which THREE of the items listed in Question 22 do you think should receive the MOST EMPHASIS from City leaders over the next TWO years? Q23. Top choice Number Percent Professionalism of fire & EMS personnel 9 1.3 % Professionalism of City police officers 112 16.3 % How quickly police respond to emergencies 39 5.7 % Visibility of police in commercial & retail areas 27 3.9 % Overall feeling of safety in your neighborhood 89 13.0 % Visibility of police in neighborhoods 69 10.1 % Enforcement of local traffic laws 51 7.4 % Fire education programs in your community 13 1.9 % Fire inspection programs in your community 2 0.3 % Efforts by local government in your area to prevent crime 157 22.9 % None chosen 118 17.2 % Total 686 100.0 %
Q23. Which THREE of the items listed in Question 22 do you think should receive the MOST EMPHASIS from City leaders over the next TWO years? Q23. 2nd choice Number Percent Professionalism of fire & EMS personnel 10 1.5 % Professionalism of City police officers 35 5.1 % How quickly police respond to emergencies 46 6.7 % Visibility of police in commercial & retail areas 41 6.0 % Overall feeling of safety in your neighborhood 95 13.8 % Visibility of police in neighborhoods 108 15.7 % Enforcement of local traffic laws 63 9.2 % Fire education programs in your community 15 2.2 % Fire inspection programs in your community 18 2.6 % Efforts by local government in your area to prevent crime 93 13.6 % None chosen 162 23.6 % Total 686 100.0 %
2020 City of South Bend Community Survey: Findings Report
ETC Institute (2020) Page 155
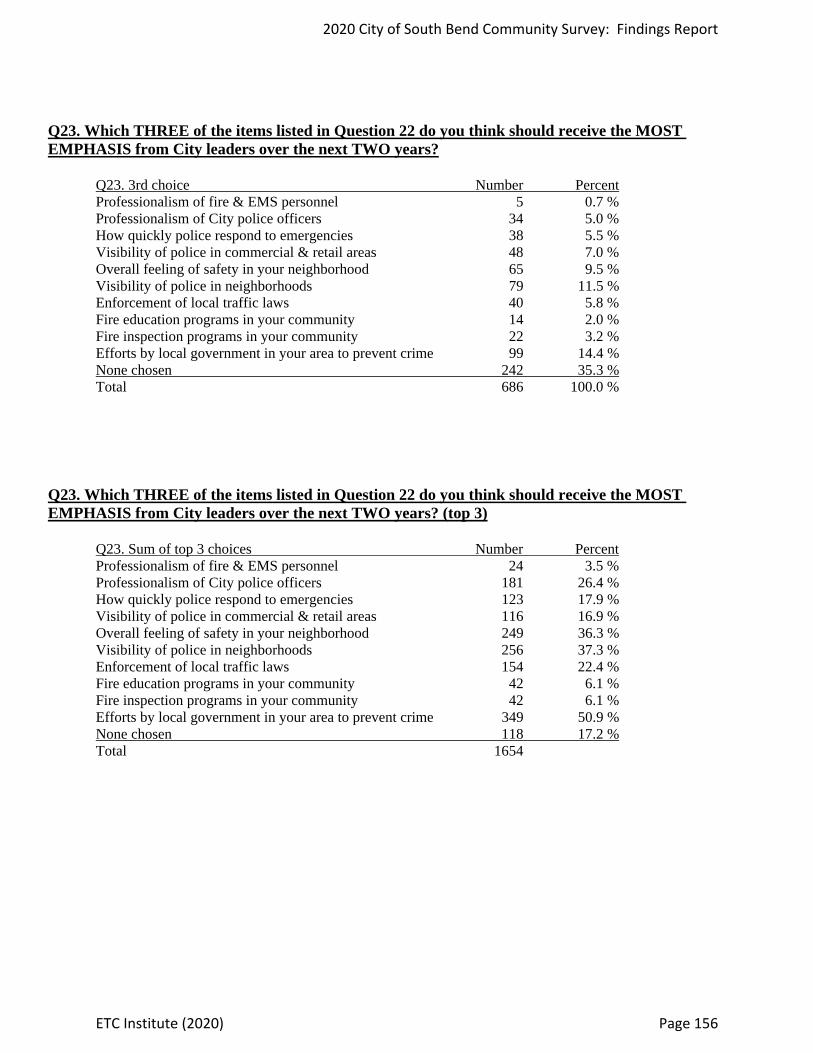
Q23. Which THREE of the items listed in Question 22 do you think should receive the MOST EMPHASIS from City leaders over the next TWO years? Q23. 3rd choice Number Percent Professionalism of fire & EMS personnel 5 0.7 % Professionalism of City police officers 34 5.0 % How quickly police respond to emergencies 38 5.5 % Visibility of police in commercial & retail areas 48 7.0 % Overall feeling of safety in your neighborhood 65 9.5 % Visibility of police in neighborhoods 79 11.5 % Enforcement of local traffic laws 40 5.8 % Fire education programs in your community 14 2.0 % Fire inspection programs in your community 22 3.2 % Efforts by local government in your area to prevent crime 99 14.4 % None chosen 242 35.3 % Total 686 100.0 %
Q23. Which THREE of the items listed in Question 22 do you think should receive the MOST EMPHASIS from City leaders over the next TWO years? (top 3) Q23. Sum of top 3 choices Number Percent Professionalism of fire & EMS personnel 24 3.5 % Professionalism of City police officers 181 26.4 % How quickly police respond to emergencies 123 17.9 % Visibility of police in commercial & retail areas 116 16.9 % Overall feeling of safety in your neighborhood 249 36.3 % Visibility of police in neighborhoods 256 37.3 % Enforcement of local traffic laws 154 22.4 % Fire education programs in your community 42 6.1 % Fire inspection programs in your community 42 6.1 % Efforts by local government in your area to prevent crime 349 50.9 % None chosen 118 17.2 % Total 1654
2020 City of South Bend Community Survey: Findings Report
ETC Institute (2020) Page 156

Q24. Traffic and Transportation. Please rate the City of South Bend using a scale of 1 to 5, where 5 means "Very Satisfied" and 1 means "Very Dissatisfied," with regard to each of the following. (N=686) Very Very satisfied Satisfied Neutral Dissatisfied dissatisfied Don't know Q24-1. Snow removal on major City streets 13.1% 52.6% 13.1% 11.4% 6.0% 3.8% Q24-2. Condition of street signs & traffic signals 13.6% 50.3% 20.0% 8.2% 4.7% 3.4% Q24-3. Adequacy of street lighting in your neighborhood 8.9% 41.1% 20.0% 18.5% 7.6% 3.9% Q24-4. Quality of public transportation services 7.6% 22.9% 25.4% 6.3% 3.8% 34.1% Q24-5. On-street bicycle infrastructure 6.1% 27.4% 32.4% 9.5% 5.4% 19.2% Q24-6. Condition of catch basins in your neighborhood 4.1% 18.5% 27.0% 12.0% 5.7% 32.8% Q24-7. Snow removal on neighborhood streets 6.3% 31.6% 20.6% 21.9% 14.3% 5.4% Q24-8. Condition of sidewalks in your neighborhood 3.4% 26.2% 21.9% 27.8% 14.9% 5.8% Q24-9. Flow of traffic in Downtown area 6.6% 33.7% 22.4% 14.6% 15.5% 7.3% Q24-10. Cleanliness of streets & other public areas 5.1% 34.3% 28.4% 19.2% 9.2% 3.8% Q24-11. Condition of streets in your neighborhood 4.7% 30.3% 23.2% 24.6% 14.0% 3.2% Q24-12. Condition of major City streets 4.4% 32.4% 23.2% 24.6% 10.8% 4.7%
2020 City of South Bend Community Survey: Findings Report
ETC Institute (2020) Page 157

WITHOUT “DON’T KNOW” Q24. Traffic and Transportation. Please rate the City of South Bend using a scale of 1 to 5, where 5 means "Very Satisfied" and 1 means "Very Dissatisfied," with regard to each of the following. (without "don't know") (N=686) Very Very satisfied Satisfied Neutral Dissatisfied dissatisfied Q24-1. Snow removal on major City streets 13.6% 54.7% 13.6% 11.8% 6.2% Q24-2. Condition of street signs & traffic signals 14.0% 52.0% 20.7% 8.4% 4.8% Q24-3. Adequacy of street lighting in your neighborhood 9.3% 42.8% 20.8% 19.3% 7.9% Q24-4. Quality of public transportation services 11.5% 34.7% 38.5% 9.5% 5.8% Q24-5. On-street bicycle infrastructure 7.6% 33.9% 40.1% 11.7% 6.7% Q24-6. Condition of catch basins in your neighborhood 6.1% 27.5% 40.1% 17.8% 8.5% Q24-7. Snow removal on neighborhood streets 6.6% 33.4% 21.7% 23.1% 15.1% Q24-8. Condition of sidewalks in your neighborhood 3.6% 27.9% 23.2% 29.6% 15.8% Q24-9. Flow of traffic in Downtown area 7.1% 36.3% 24.2% 15.7% 16.7% Q24-10. Cleanliness of streets & other public areas 5.3% 35.6% 29.5% 20.0% 9.5% Q24-11. Condition of streets in your neighborhood 4.8% 31.3% 23.9% 25.5% 14.5% Q24-12. Condition of major City streets 4.6% 33.9% 24.3% 25.8% 11.3%
2020 City of South Bend Community Survey: Findings Report
ETC Institute (2020) Page 158
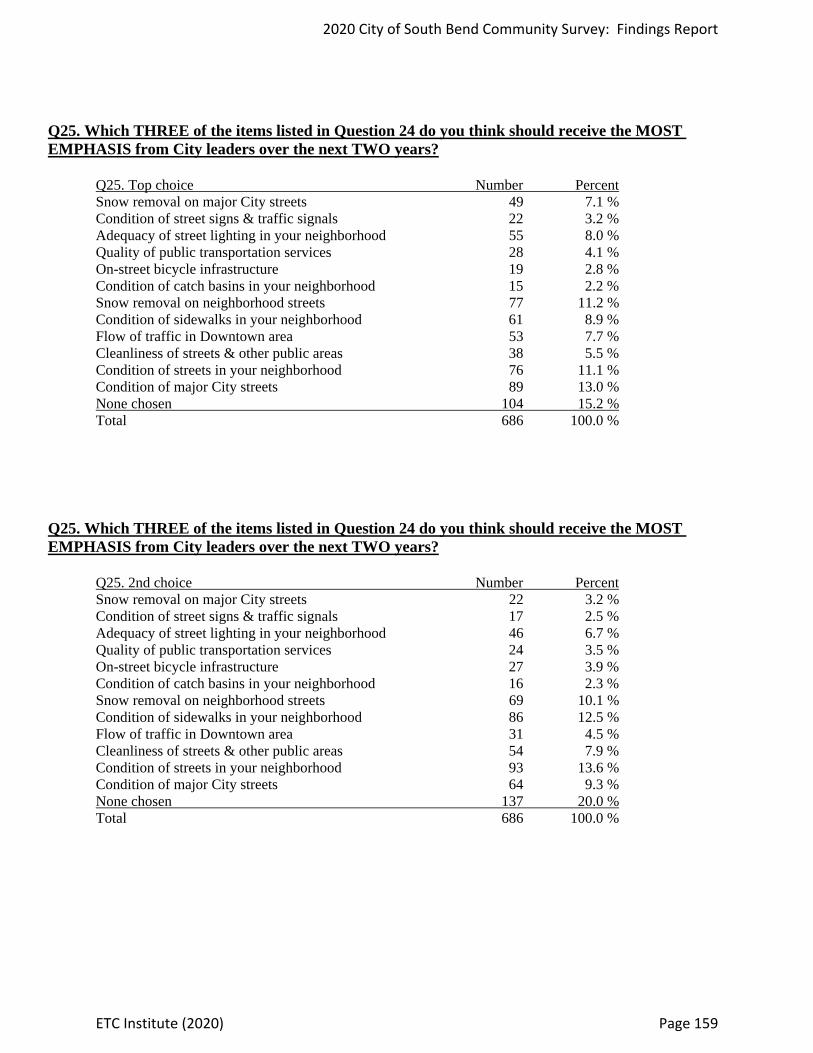
Q25. Which THREE of the items listed in Question 24 do you think should receive the MOST EMPHASIS from City leaders over the next TWO years? Q25. Top choice Number Percent Snow removal on major City streets 49 7.1 % Condition of street signs & traffic signals 22 3.2 % Adequacy of street lighting in your neighborhood 55 8.0 % Quality of public transportation services 28 4.1 % On-street bicycle infrastructure 19 2.8 % Condition of catch basins in your neighborhood 15 2.2 % Snow removal on neighborhood streets 77 11.2 % Condition of sidewalks in your neighborhood 61 8.9 % Flow of traffic in Downtown area 53 7.7 % Cleanliness of streets & other public areas 38 5.5 % Condition of streets in your neighborhood 76 11.1 % Condition of major City streets 89 13.0 % None chosen 104 15.2 % Total 686 100.0 %
Q25. Which THREE of the items listed in Question 24 do you think should receive the MOST EMPHASIS from City leaders over the next TWO years? Q25. 2nd choice Number Percent Snow removal on major City streets 22 3.2 % Condition of street signs & traffic signals 17 2.5 % Adequacy of street lighting in your neighborhood 46 6.7 % Quality of public transportation services 24 3.5 % On-street bicycle infrastructure 27 3.9 % Condition of catch basins in your neighborhood 16 2.3 % Snow removal on neighborhood streets 69 10.1 % Condition of sidewalks in your neighborhood 86 12.5 % Flow of traffic in Downtown area 31 4.5 % Cleanliness of streets & other public areas 54 7.9 % Condition of streets in your neighborhood 93 13.6 % Condition of major City streets 64 9.3 % None chosen 137 20.0 % Total 686 100.0 %
2020 City of South Bend Community Survey: Findings Report
ETC Institute (2020) Page 159

Q25. Which THREE of the items listed in Question 24 do you think should receive the MOST EMPHASIS from City leaders over the next TWO years? Q25. 3rd choice Number Percent Snow removal on major City streets 23 3.4 % Condition of street signs & traffic signals 13 1.9 % Adequacy of street lighting in your neighborhood 48 7.0 % Quality of public transportation services 22 3.2 % On-street bicycle infrastructure 19 2.8 % Condition of catch basins in your neighborhood 14 2.0 % Snow removal on neighborhood streets 59 8.6 % Condition of sidewalks in your neighborhood 60 8.7 % Flow of traffic in Downtown area 37 5.4 % Cleanliness of streets & other public areas 66 9.6 % Condition of streets in your neighborhood 74 10.8 % Condition of major City streets 59 8.6 % None chosen 192 28.0 % Total 686 100.0 %
Q25. Which THREE of the items listed in Question 24 do you think should receive the MOST EMPHASIS from City leaders over the next TWO years? (top 3) Q25. Sum of top 3 choices Number Percent Snow removal on major City streets 94 13.7 % Condition of street signs & traffic signals 52 7.6 % Adequacy of street lighting in your neighborhood 149 21.7 % Quality of public transportation services 74 10.8 % On-street bicycle infrastructure 65 9.5 % Condition of catch basins in your neighborhood 45 6.6 % Snow removal on neighborhood streets 205 29.9 % Condition of sidewalks in your neighborhood 207 30.2 % Flow of traffic in Downtown area 121 17.6 % Cleanliness of streets & other public areas 158 23.0 % Condition of streets in your neighborhood 243 35.4 % Condition of major City streets 212 30.9 % None chosen 104 15.2 % Total 1729
2020 City of South Bend Community Survey: Findings Report
ETC Institute (2020) Page 160

Q26. Water Utility. Have you had a sewer backup in your home during the past year? Q26. Have you had a sewer backup in your home during past year Number Percent Yes 97 14.1 % No 581 84.7 % Not provided 8 1.2 % Total 686 100.0 %
WITHOUT “NOT PROVIDED” Q26. Water Utility. Have you had a sewer backup in your home during the past year? (without "not provided") Q26. Have you had a sewer backup in your home during past year Number Percent Yes 97 14.3 % No 581 85.7 % Total 678 100.0 %
2020 City of South Bend Community Survey: Findings Report
ETC Institute (2020) Page 161
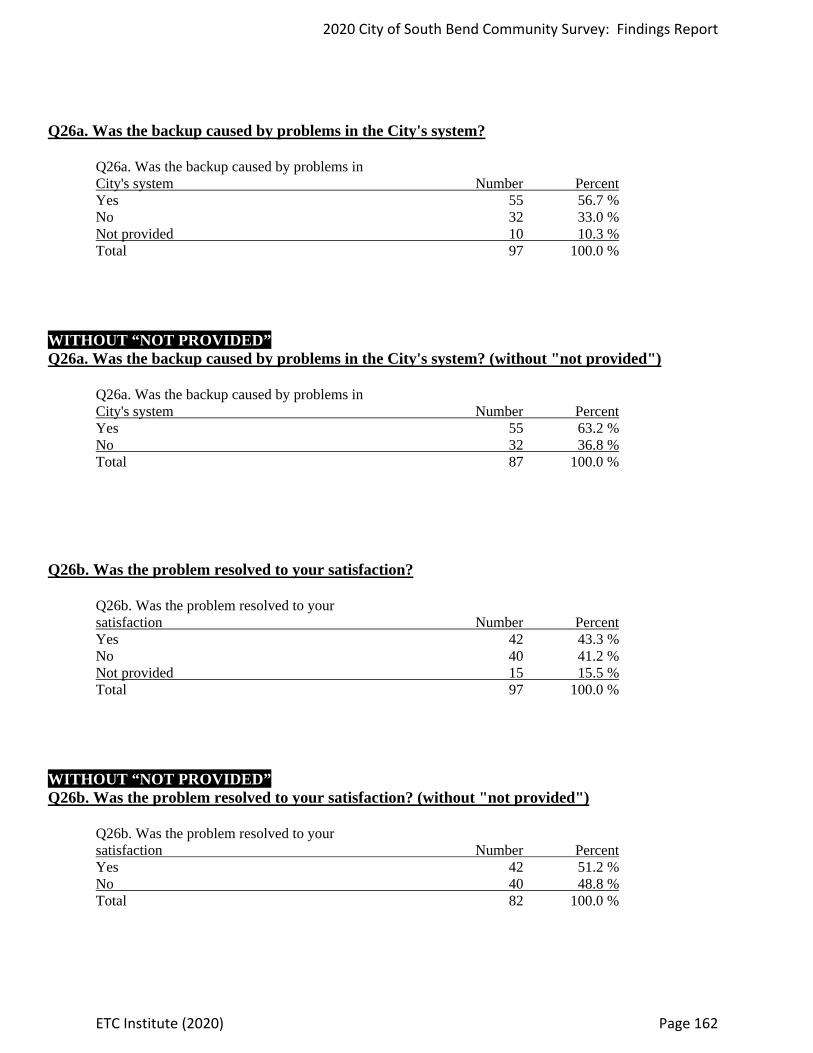
Q26a. Was the backup caused by problems in the City's system? Q26a. Was the backup caused by problems in City's system Number Percent Yes 55 56.7 % No 32 33.0 % Not provided 10 10.3 % Total 97 100.0 %
WITHOUT “NOT PROVIDED” Q26a. Was the backup caused by problems in the City's system? (without "not provided") Q26a. Was the backup caused by problems in City's system Number Percent Yes 55 63.2 % No 32 36.8 % Total 87 100.0 %
Q26b. Was the problem resolved to your satisfaction? Q26b. Was the problem resolved to your satisfaction Number Percent Yes 42 43.3 % No 40 41.2 % Not provided 15 15.5 % Total 97 100.0 %
WITHOUT “NOT PROVIDED” Q26b. Was the problem resolved to your satisfaction? (without "not provided") Q26b. Was the problem resolved to your satisfaction Number Percent Yes 42 51.2 % No 40 48.8 % Total 82 100.0 %
2020 City of South Bend Community Survey: Findings Report
ETC Institute (2020) Page 162

Q27. Please rate the City of South Bend using a scale of 1 to 5, where 5 means "Very Satisfied" and 1 means "Very Dissatisfied," with regard to each of the following. (N=686) Very Very satisfied Satisfied Neutral Dissatisfied dissatisfied Don't know Q27-1. Water pressure on a typical day 21.0% 51.3% 13.7% 6.9% 3.4% 3.8% Q27-2. How easy your utility bill is to understand 17.8% 50.9% 16.8% 5.4% 2.9% 6.3% Q27-3. Smell of your tap water 14.4% 41.8% 23.5% 10.5% 5.1% 4.7% Q27-4. How easy it is to resolve billing problems 8.5% 24.5% 25.1% 4.7% 4.5% 32.8% Q27-5. Taste of your tap water 10.5% 35.1% 22.2% 17.3% 7.9% 7.0% Q27-6. How well City keeps you informed about water quality issues 9.8% 28.3% 29.2% 11.7% 7.0% 14.1% Q27-7. What you are charged for utilities 6.3% 22.9% 27.8% 20.8% 15.7% 6.4%
2020 City of South Bend Community Survey: Findings Report
ETC Institute (2020) Page 163

WITHOUT “DON’T KNOW” Q27. Please rate the City of South Bend using a scale of 1 to 5, where 5 means "Very Satisfied" and 1 means "Very Dissatisfied," with regard to each of the following. (without "don't know") (N=686) Very Very satisfied Satisfied Neutral Dissatisfied dissatisfied Q27-1. Water pressure on a typical day 21.8% 53.3% 14.2% 7.1% 3.5% Q27-2. How easy your utility bill is to understand 19.0% 54.3% 17.9% 5.8% 3.1% Q27-3. Smell of your tap water 15.1% 43.9% 24.6% 11.0% 5.4% Q27-4. How easy it is to resolve billing problems 12.6% 36.4% 37.3% 6.9% 6.7% Q27-5. Taste of your tap water 11.3% 37.8% 23.8% 18.7% 8.5% Q27-6. How well City keeps you informed about water quality issues 11.4% 32.9% 34.0% 13.6% 8.1% Q27-7. What you are charged for utilities 6.7% 24.5% 29.8% 22.3% 16.8%
2020 City of South Bend Community Survey: Findings Report
ETC Institute (2020) Page 164

Q28. Which TWO of the items listed in Question 27 do you think should receive the MOST EMPHASIS from City leaders over the next TWO years? Q28. Top choice Number Percent Water pressure on a typical day 51 7.4 % How easy your utility bill is to understand 16 2.3 % Smell of your tap water 34 5.0 % How easy it is to resolve billing problems 23 3.4 % Taste of your tap water 119 17.3 % How well City keeps you informed about water quality issues 68 9.9 % What you are charged for utilities 208 30.3 % None chosen 167 24.3 % Total 686 100.0 %
Q28. Which TWO of the items listed in Question 27 do you think should receive the MOST EMPHASIS from City leaders over the next TWO years? Q28. 2nd choice Number Percent Water pressure on a typical day 45 6.6 % How easy your utility bill is to understand 31 4.5 % Smell of your tap water 56 8.2 % How easy it is to resolve billing problems 27 3.9 % Taste of your tap water 89 13.0 % How well City keeps you informed about water quality issues 86 12.5 % What you are charged for utilities 98 14.3 % None chosen 254 37.0 % Total 686 100.0 % Q28. Which TWO of the items listed in Question 27 do you think should receive the MOST EMPHASIS from City leaders over the next TWO years? (top 2) Q28. Sum of top 2 choices Number Percent Water pressure on a typical day 96 14.0 % How easy your utility bill is to understand 47 6.9 % Smell of your tap water 90 13.1 % How easy it is to resolve billing problems 50 7.3 % Taste of your tap water 208 30.3 % How well City keeps you informed about water quality issues 154 22.4 % What you are charged for utilities 306 44.6 % None chosen 167 24.3 % Total 1118
2020 City of South Bend Community Survey: Findings Report
ETC Institute (2020) Page 165

Q29. Venues, Parks, and Arts. Please rate the City of South Bend using a scale of 1 to 5, where 5 means "Very Satisfied" and 1 means "Very Dissatisfied," with regard to each of the following. (N=686) Very Very satisfied Satisfied Neutral Dissatisfied dissatisfied Don't know Q29-1. Maintenance of City parks 17.8% 45.0% 17.6% 5.5% 1.7% 12.2% Q29-2. Number of walking & biking trails 15.6% 39.4% 17.9% 10.1% 2.9% 14.1% Q29-3. Access to parks in your neighborhood 16.8% 43.1% 19.4% 6.7% 3.1% 10.9% Q29-4. Ease of registering for recreation programs such as classes, trips, & special events 7.6% 18.2% 26.5% 5.1% 1.2% 41.4% Q29-5. Fees charged for recreation programs 6.4% 17.8% 24.6% 6.1% 3.1% 42.0% Q29-6. Availability of recreation programming in your neighborhood 6.4% 15.2% 25.2% 12.1% 4.4% 36.7% Q29-7. Condition of restrooms in public parks 4.1% 8.9% 25.8% 13.7% 7.6% 39.9%
2020 City of South Bend Community Survey: Findings Report
ETC Institute (2020) Page 166
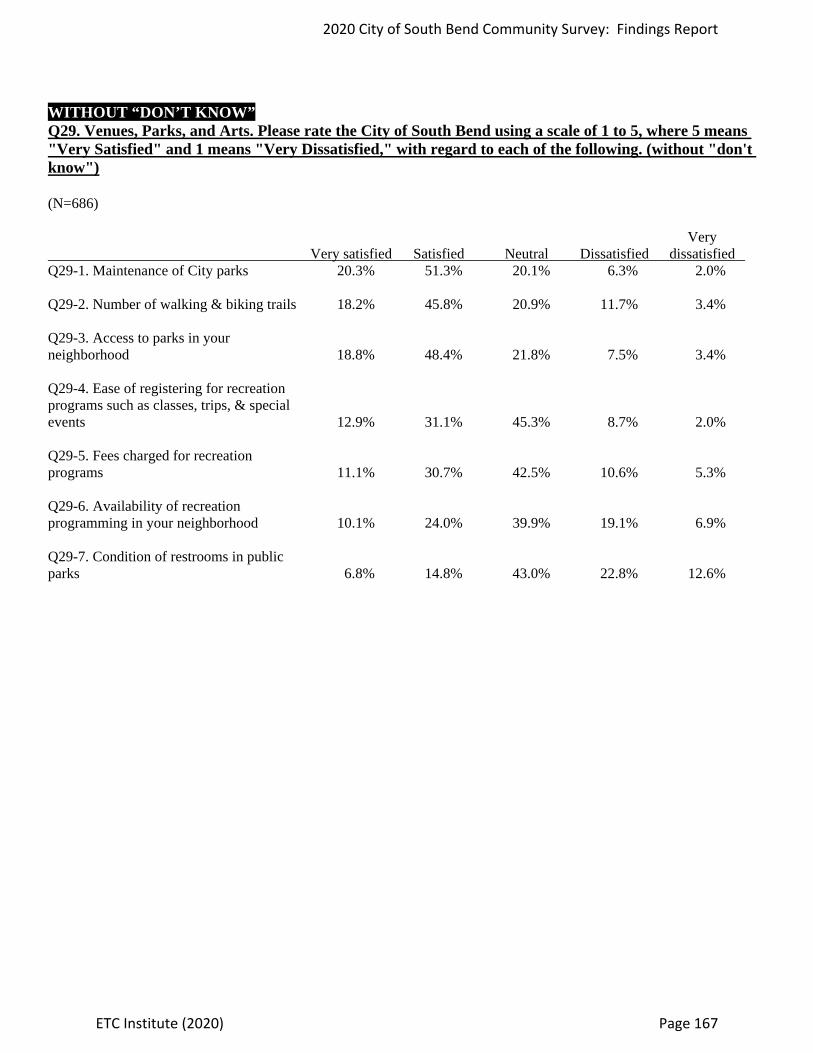
WITHOUT “DON’T KNOW” Q29. Venues, Parks, and Arts. Please rate the City of South Bend using a scale of 1 to 5, where 5 means "Very Satisfied" and 1 means "Very Dissatisfied," with regard to each of the following. (without "don't know") (N=686) Very Very satisfied Satisfied Neutral Dissatisfied dissatisfied Q29-1. Maintenance of City parks 20.3% 51.3% 20.1% 6.3% 2.0% Q29-2. Number of walking & biking trails 18.2% 45.8% 20.9% 11.7% 3.4% Q29-3. Access to parks in your neighborhood 18.8% 48.4% 21.8% 7.5% 3.4% Q29-4. Ease of registering for recreation programs such as classes, trips, & special events 12.9% 31.1% 45.3% 8.7% 2.0% Q29-5. Fees charged for recreation programs 11.1% 30.7% 42.5% 10.6% 5.3% Q29-6. Availability of recreation programming in your neighborhood 10.1% 24.0% 39.9% 19.1% 6.9% Q29-7. Condition of restrooms in public parks 6.8% 14.8% 43.0% 22.8% 12.6%
2020 City of South Bend Community Survey: Findings Report
ETC Institute (2020) Page 167
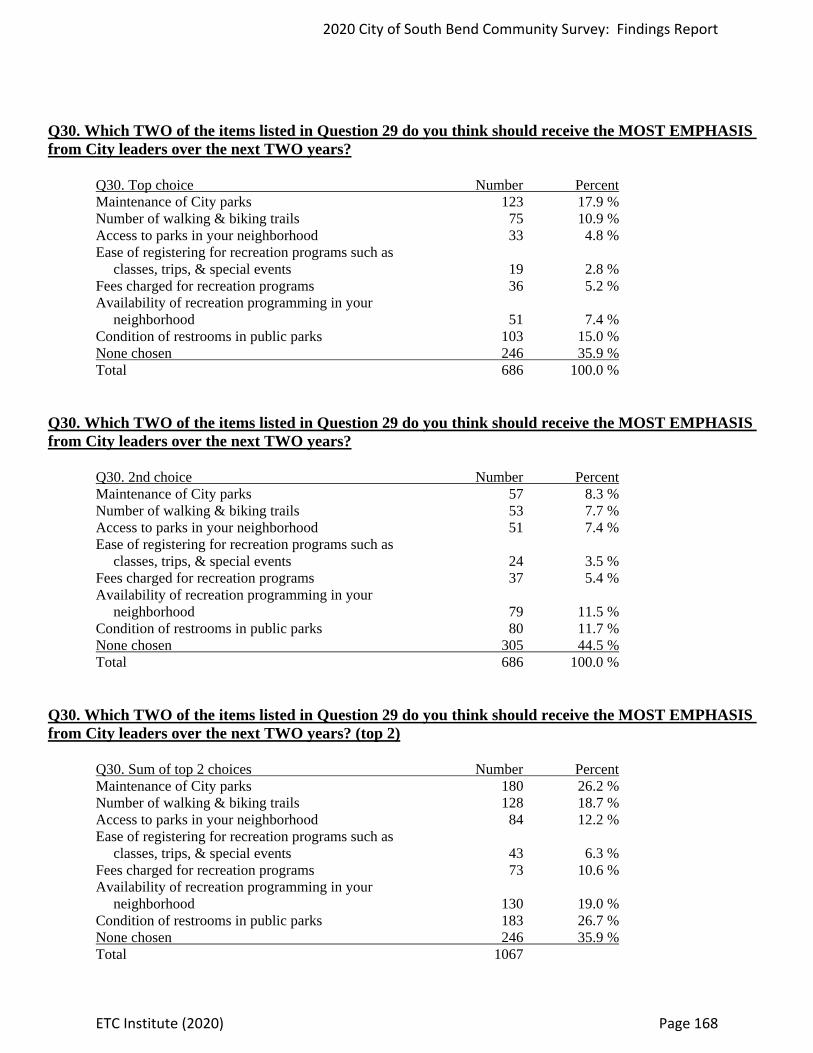
Q30. Which TWO of the items listed in Question 29 do you think should receive the MOST EMPHASIS from City leaders over the next TWO years? Q30. Top choice Number Percent Maintenance of City parks 123 17.9 % Number of walking & biking trails 75 10.9 % Access to parks in your neighborhood 33 4.8 % Ease of registering for recreation programs such as classes, trips, & special events 19 2.8 % Fees charged for recreation programs 36 5.2 % Availability of recreation programming in your neighborhood 51 7.4 % Condition of restrooms in public parks 103 15.0 % None chosen 246 35.9 % Total 686 100.0 % Q30. Which TWO of the items listed in Question 29 do you think should receive the MOST EMPHASIS from City leaders over the next TWO years? Q30. 2nd choice Number Percent Maintenance of City parks 57 8.3 % Number of walking & biking trails 53 7.7 % Access to parks in your neighborhood 51 7.4 % Ease of registering for recreation programs such as classes, trips, & special events 24 3.5 % Fees charged for recreation programs 37 5.4 % Availability of recreation programming in your neighborhood 79 11.5 % Condition of restrooms in public parks 80 11.7 % None chosen 305 44.5 % Total 686 100.0 %
Q30. Which TWO of the items listed in Question 29 do you think should receive the MOST EMPHASIS from City leaders over the next TWO years? (top 2) Q30. Sum of top 2 choices Number Percent Maintenance of City parks 180 26.2 % Number of walking & biking trails 128 18.7 % Access to parks in your neighborhood 84 12.2 % Ease of registering for recreation programs such as classes, trips, & special events 43 6.3 % Fees charged for recreation programs 73 10.6 % Availability of recreation programming in your neighborhood 130 19.0 % Condition of restrooms in public parks 183 26.7 % None chosen 246 35.9 % Total 1067
2020 City of South Bend Community Survey: Findings Report
ETC Institute (2020) Page 168

Q31. In the past year, have you visited a City recreation facility or park? Q31. Have you visited a City recreation facility or park in past year Number Percent Yes 479 69.8 % No 188 27.4 % Not provided 19 2.8 % Total 686 100.0 %
WITHOUT “NOT PROVIDED” Q31. In the past year, have you visited a City recreation facility or park? (without "not provided") Q31. Have you visited a City recreation facility or park in past year Number Percent Yes 479 71.8 % No 188 28.2 % Total 667 100.0 %
2020 City of South Bend Community Survey: Findings Report
ETC Institute (2020) Page 169

Q32. Approximately how many years have you lived in South Bend? Q32. How many years have you lived in South Bend Number Percent 0-5 97 14.1 % 6-10 75 10.9 % 11-15 41 6.0 % 16-20 63 9.2 % 21-30 105 15.3 % 31+ 283 41.3 % Not provided 22 3.2 % Total 686 100.0 %
WITHOUT “NOT PROVIDED” Q32. Approximately how many years have you lived in South Bend? (without "not provided") Q32. How many years have you lived in South Bend Number Percent 0-5 97 14.6 % 6-10 75 11.3 % 11-15 41 6.2 % 16-20 63 9.5 % 21-30 105 15.8 % 31+ 283 42.6 % Total 664 100.0 %
2020 City of South Bend Community Survey: Findings Report
ETC Institute (2020) Page 170

Q33. Have you met the current Mayor? Q33. Have you met current Mayor Number Percent Yes 72 10.5 % No 614 89.5 % Total 686 100.0 %
2020 City of South Bend Community Survey: Findings Report
ETC Institute (2020) Page 171

Q34. Do you own or rent your current residence? Q34. Do you own or rent your current residence Number Percent Own 456 66.5 % Rent 223 32.5 % Not provided 7 1.0 % Total 686 100.0 %
WITHOUT “NOT PROVIDED” Q34. Do you own or rent your current residence? (without "not provided") Q34. Do you own or rent your current residence Number Percent Own 456 67.2 % Rent 223 32.8 % Total 679 100.0 %
2020 City of South Bend Community Survey: Findings Report
ETC Institute (2020) Page 172

Q35. What is your age? Q35. Your age Number Percent 18-34 142 20.7 % 35-44 131 19.1 % 45-54 135 19.7 % 55-64 118 17.2 % 65+ 129 18.8 % Not provided 31 4.5 % Total 686 100.0 %
WITHOUT “NOT PROVIDED” Q35. What is your age? (without "not provided") Q35. Your age Number Percent 18-34 142 21.7 % 35-44 131 20.0 % 45-54 135 20.6 % 55-64 118 18.0 % 65+ 129 19.7 % Total 655 100.0 %
2020 City of South Bend Community Survey: Findings Report
ETC Institute (2020) Page 173

Q36. What is your gender identity? Q36. Your gender identity Number Percent Male 336 49.0 % Female 346 50.4 % Gender variant/non-conforming 1 0.1 % Not provided 3 0.4 % Total 686 100.0 %
WITHOUT “NOT PROVIDED” Q36. What is your gender identity? (without "not provided") Q36. Your gender identity Number Percent Male 336 49.2 % Female 346 50.7 % Gender variant/non-conforming 1 0.1 % Total 683 100.0 %
2020 City of South Bend Community Survey: Findings Report
ETC Institute (2020) Page 174

Q37. Including yourself, how many people live in your household? Q37. How many people live in your household Number Percent 1 128 18.7 % 2 255 37.2 % 3 151 22.0 % 4 75 10.9 % 5 37 5.4 % 6 13 1.9 % 7+ 9 1.3 % Not provided 18 2.6 % Total 686 100.0 %
WITHOUT “NOT PROVIDED” Q37. Including yourself, how many people live in your household? (without "not provided") Q37. How many people live in your household Number Percent 1 128 19.2 % 2 255 38.2 % 3 151 22.6 % 4 75 11.2 % 5 37 5.5 % 6 13 1.9 % 7+ 9 1.3 % Total 668 100.0 %
2020 City of South Bend Community Survey: Findings Report
ETC Institute (2020) Page 175

Q38. How many people in your household are employed? Q38. How many people in your household are employed Number Percent 0 126 18.4 % 1 292 42.6 % 2 187 27.3 % 3 37 5.4 % 4+ 15 2.2 % Not provided 29 4.2 % Total 686 100.0 %
WITHOUT “NOT PROVIDED” Q38. How many people in your household are employed? (without "not provided") Q38. How many people in your household are employed Number Percent 0 126 19.2 % 1 292 44.4 % 2 187 28.5 % 3 37 5.6 % 4+ 15 2.3 % Total 657 100.0 %
2020 City of South Bend Community Survey: Findings Report
ETC Institute (2020) Page 176
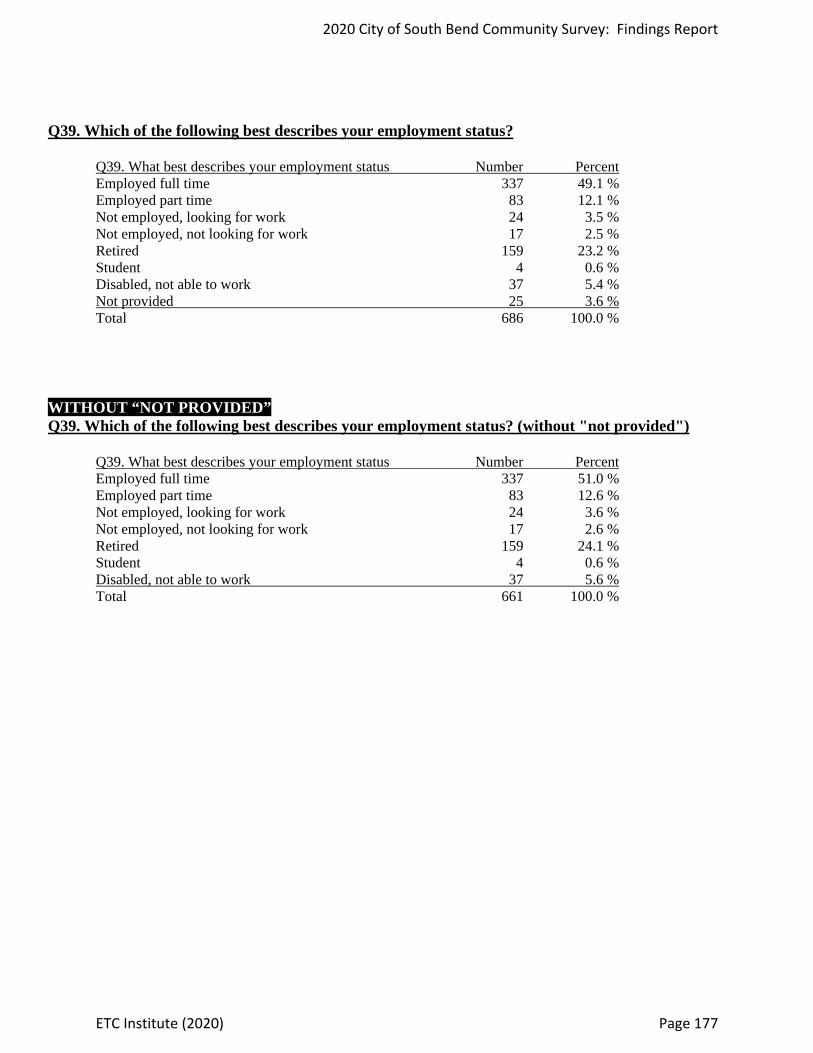
Q39. Which of the following best describes your employment status? Q39. What best describes your employment status Number Percent Employed full time 337 49.1 % Employed part time 83 12.1 % Not employed, looking for work 24 3.5 % Not employed, not looking for work 17 2.5 % Retired 159 23.2 % Student 4 0.6 % Disabled, not able to work 37 5.4 % Not provided 25 3.6 % Total 686 100.0 %
WITHOUT “NOT PROVIDED” Q39. Which of the following best describes your employment status? (without "not provided") Q39. What best describes your employment status Number Percent Employed full time 337 51.0 % Employed part time 83 12.6 % Not employed, looking for work 24 3.6 % Not employed, not looking for work 17 2.6 % Retired 159 24.1 % Student 4 0.6 % Disabled, not able to work 37 5.6 % Total 661 100.0 %
2020 City of South Bend Community Survey: Findings Report
ETC Institute (2020) Page 177

Q39a. What is the zip code where you work? Q39a. What is the zip code where you work Number Percent 46601 50 14.1 % 46628 39 11.0 % 46614 32 9.0 % 46615 30 8.5 % 46545 30 8.5 % 46617 25 7.1 % 46619 22 6.2 % 46556 21 5.9 % 46613 16 4.5 % 46544 14 4.0 % 46635 11 3.1 % 46616 10 2.8 % 46530 5 1.4 % 46514 5 1.4 % 46517 5 1.4 % 46637 4 1.1 % 46656 4 1.1 % 46563 4 1.1 % 46526 3 0.8 % 49120 3 0.8 % 46574 2 0.6 % 46516 2 0.6 % 46561 1 0.3 % 46624 1 0.3 % 46554 1 0.3 % 46360 1 0.3 % 46268 1 0.3 % 49112 1 0.3 % 46228 1 0.3 % 49127 1 0.3 % 46205 1 0.3 % 46675 1 0.3 % 46627 1 0.3 % 45344 1 0.3 % 46612 1 0.3 % 46634 1 0.3 % 46609 1 0.3 % 46536 1 0.3 % 46618 1 0.3 % Total 354 100.0 % Missing Cases = 0 Response Percent = 100.0 %
2020 City of South Bend Community Survey: Findings Report
ETC Institute (2020) Page 178

Q40. Would you say your total annual household income is… Q40. What is your total annual household income Number Percent Under $15K 68 9.9 % $15K to $29,999 114 16.6 % $30K to $59,999 201 29.3 % $60K to $99,999 131 19.1 % $100K to $124,999 53 7.7 % $125K+ 35 5.1 % Not provided 84 12.2 % Total 686 100.0 %
WITHOUT “NOT PROVIDED” Q40. Would you say your total annual household income is… (without "not provided") Q40. What is your total annual household income Number Percent Under $15K 68 11.3 % $15K to $29,999 114 18.9 % $30K to $59,999 201 33.4 % $60K to $99,999 131 21.8 % $100K to $124,999 53 8.8 % $125K+ 35 5.8 % Total 602 100.0 %
2020 City of South Bend Community Survey: Findings Report
ETC Institute (2020) Page 179

Q41. Which of the following best describes your race/ethnicity? Q41. Your race/ethnicity Number Percent African American/Black 173 25.2 % Asian/Pacific Islander 10 1.5 % Hispanic/Latinx 99 14.4 % Native American/Eskimo 12 1.7 % White/Caucasian 435 63.4 % Other 7 1.0 % Total 736
Q41-6. Other Q41-6. Other Number Percent Mixed 2 28.6 % West Indian 1 14.3 % Multi racial 1 14.3 % More than one 1 14.3 % European American 1 14.3 % Multiple 1 14.3 % Total 7 100.0 %
2020 City of South Bend Community Survey: Findings Report
ETC Institute (2020) Page 180
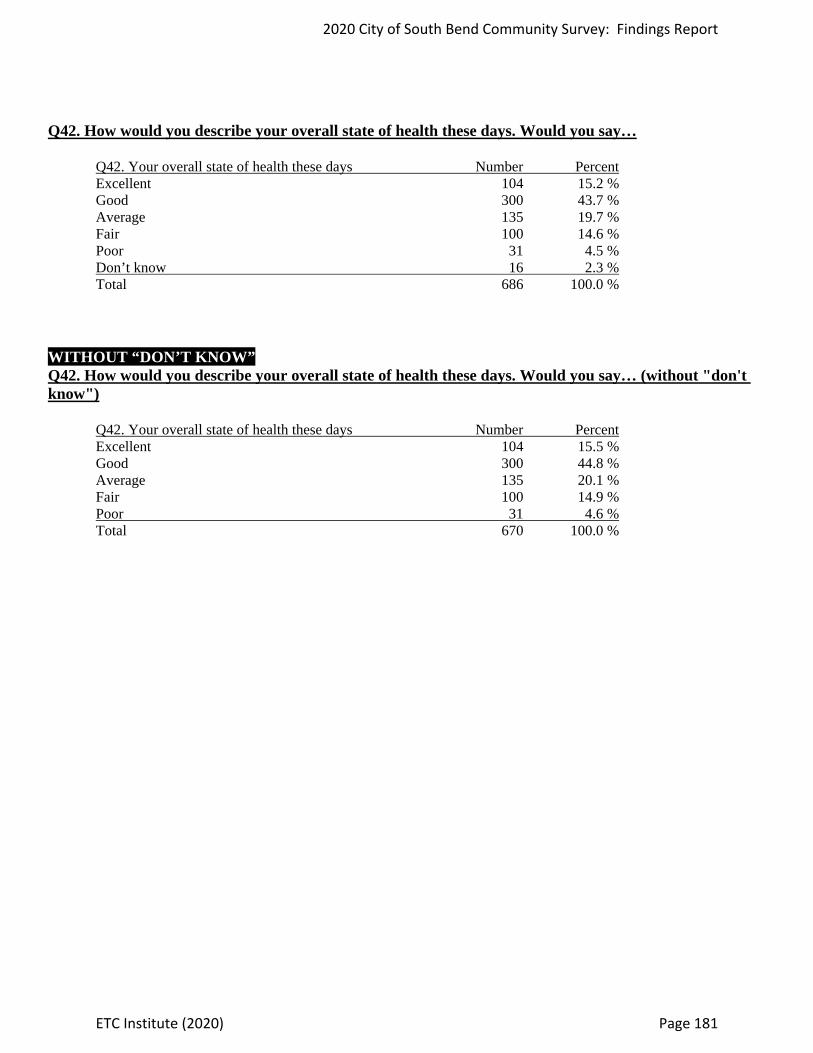
Q42. How would you describe your overall state of health these days. Would you say… Q42. Your overall state of health these days Number Percent Excellent 104 15.2 % Good 300 43.7 % Average 135 19.7 % Fair 100 14.6 % Poor 31 4.5 % Don’t know 16 2.3 % Total 686 100.0 %
WITHOUT “DON’T KNOW” Q42. How would you describe your overall state of health these days. Would you say… (without "don't know") Q42. Your overall state of health these days Number Percent Excellent 104 15.5 % Good 300 44.8 % Average 135 20.1 % Fair 100 14.9 % Poor 31 4.6 % Total 670 100.0 %
2020 City of South Bend Community Survey: Findings Report
ETC Institute (2020) Page 181

Q43. How would you compare your standard of living to your parents' when they were your age? Q43. Compare your standard of living to your parents' when they were your age Number Percent Much better 112 16.3 % Somewhat better 182 26.5 % About the same 222 32.4 % Somewhat worse 95 13.8 % Much worse 40 5.8 % Don’t know 35 5.1 % Total 686 100.0 %
WITHOUT “DON’T KNOW” Q43. How would you compare your standard of living to your parents' when they were your age? (without "don't know") Q43. Compare your standard of living to your parents' when they were your age Number Percent Much better 112 17.2 % Somewhat better 182 28.0 % About the same 222 34.1 % Somewhat worse 95 14.6 % Much worse 40 6.1 % Total 651 100.0 %
2020 City of South Bend Community Survey: Findings Report
ETC Institute (2020) Page 182

Q44. Do you think local officials in your community are doing a good job of keeping you informed about the COVID-19 Pandemic? Q44. Are local officials in your community doing a good job of keeping you informed about COVID- 19 pandemic Number Percent Yes 413 60.2 % No 157 22.9 % Don't know 116 16.9 % Total 686 100.0 %
WITHOUT “DON’T KNOW” Q44. Do you think local officials in your community are doing a good job of keeping you informed about the COVID-19 Pandemic? (without "don't know") Q44. Are local officials in your community doing a good job of keeping you informed about COVID- 19 pandemic Number Percent Yes 413 72.5 % No 157 27.5 % Total 570 100.0 %
2020 City of South Bend Community Survey: Findings Report
ETC Institute (2020) Page 183
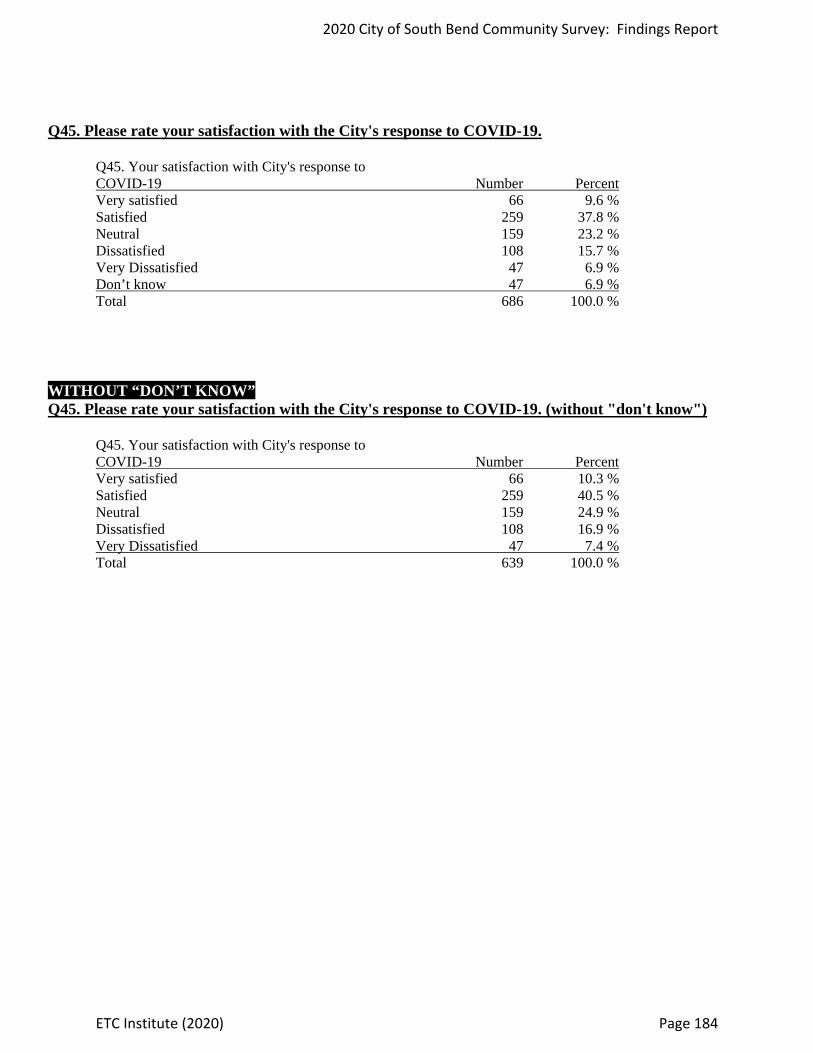
Q45. Please rate your satisfaction with the City's response to COVID-19. Q45. Your satisfaction with City's response to COVID-19 Number Percent Very satisfied 66 9.6 % Satisfied 259 37.8 % Neutral 159 23.2 % Dissatisfied 108 15.7 % Very Dissatisfied 47 6.9 % Don’t know 47 6.9 % Total 686 100.0 %
WITHOUT “DON’T KNOW” Q45. Please rate your satisfaction with the City's response to COVID-19. (without "don't know") Q45. Your satisfaction with City's response to COVID-19 Number Percent Very satisfied 66 10.3 % Satisfied 259 40.5 % Neutral 159 24.9 % Dissatisfied 108 16.9 % Very Dissatisfied 47 7.4 % Total 639 100.0 %
2020 City of South Bend Community Survey: Findings Report
ETC Institute (2020) Page 184

Q46. Please rate your satisfaction with the County's response to COVID-19. Q46. Your satisfaction with County's response to COVID-19 Number Percent Very satisfied 62 9.0 % Satisfied 227 33.1 % Neutral 162 23.6 % Dissatisfied 109 15.9 % Very Dissatisfied 63 9.2 % Don't know 63 9.2 % Total 686 100.0 %
WITHOUT “DON’T KNOW” Q46. Please rate your satisfaction with the County's response to COVID-19. (without "don't know") Q46. Your satisfaction with County's response to COVID-19 Number Percent Very satisfied 62 10.0 % Satisfied 227 36.4 % Neutral 162 26.0 % Dissatisfied 109 17.5 % Very Dissatisfied 63 10.1 % Total 623 100.0 %
2020 City of South Bend Community Survey: Findings Report
ETC Institute (2020) Page 185

Section 6:
Survey Instrument
2020 City of South Bend Community Survey: Findings Report
ETC Institute (2020) Page 186
CITY OF SOUTH BEND JAMES MUELLER, MAYOR
OFFICE OF THE MAYOR
1400 COUNTY-CITY BUILDING · 227 W. JEFFERSON BOULEVARD · SOUTH BEND, INDIANA 46601 PHONE 574/235-9261 · FAX 574/235-9892 · TTY 574/235-5567
Dear South Bend Resident, The City of South Bend is requesting your help and a few minutes of your time. You have been selected to participate in a survey designed to gather feedback on City services and performance. The information you provide in this survey will be used to improve existing services and help us understand the evolving needs of residents of South Bend. We greatly appreciate your time, which we realize is valuable. Your answers will help us provide the very best city services possible and help me make better-informed decisions about the city's future. Especially as we continue to respond to the COVID-19 pandemic, your input can help the City develop programs and policies that assist our recovery. A postage-paid envelope addressed to ETC Institute has been provided for your convenience. If you would prefer to take the survey over the web, the address is www.SouthBendCommunitySurvey.org. The survey data will be compiled and analyzed by ETC Institute, one of the nation's leading firms in the field of local governmental research. Your individual responses to the survey will remain confidential. ETC will present the results to the City this summer. The results will also be posted on our website for your review at www.southbendin.gov once they have been presented to the City Council. If you have any questions, please contact David Finley, Director of Business Analytics, at [email protected]. Thank you for helping the City of South Bend deliver services that empower everyone to thrive. Sincerely, Mayor James Mueller Si tiene preguntas acerca de la encuesta y no habla Inglés, por favor llame al 913-829-1215. Gracias.

©2020 ETC Institute for the City of South Bend Page 1
2020 City of South Bend Community Survey Please take a few minutes to complete this survey. Your input is an important part of the city's strategic planning process and will be used by city leaders to make planning and investment decisions. If you have questions, please contact David Finley, Director of Business Analytics, at [email protected].
1. Perception of the City. Please rate your level of agreement with each of the following statements using a scale of 1 to 5, where 5 means "Strongly Agree" and 1 means "Strongly Disagree".
Strongly Agree
Agree Neutral Disagree Strongly Disagree
Don't Know
1. The City should reform public safety systems 5 4 3 2 1 9 2. The City should build reliable infrastructure 5 4 3 2 1 9 3. The City should support economic recovery 5 4 3 2 1 9 4. The City should rebuild vibrant neighborhoods 5 4 3 2 1 9 5. The City should expand access to opportunity 5 4 3 2 1 9 6. The City should protect the vulnerable 5 4 3 2 1 9
2. City Leadership. Please rate the City of South Bend using a scale of 1 to 5, where 5 means "Very Satisfied" and 1 means "Very Dissatisfied", with regard to each of the following.
How satisfied are you with... Very Satisfied
Satisfied Neutral Dissatisfied Very
Dissatisfied Don't Know
1. Overall quality of life in your community 5 4 3 2 1 9 2. Leadership of elected officials 5 4 3 2 1 9 3. Overall quality of local government services 5 4 3 2 1 9
4. Communication of opportunities for public involvement in City decision-making and planning
5 4 3 2 1 9
5. Overall value you receive for your taxes and fees 5 4 3 2 1 9 6. Level of public involvement in local decision-making and planning 5 4 3 2 1 9
3. Overall Ratings of South Bend. Please rate the City of South Bend using a scale of 1 to 5, where 5 means "Very Satisfied" and 1 means "Very Dissatisfied", with regard to each of the following.
How would you rate South Bend... Very Satisfied
Satisfied Neutral Dissatisfied Very
Dissatisfied Don't Know
1. As a place to live 5 4 3 2 1 9 2. As a place to work 5 4 3 2 1 9 3. As a community that is moving in the right direction 5 4 3 2 1 9 4. As a place to visit 5 4 3 2 1 9 5. As a place to raise children 5 4 3 2 1 9 6. As a place to retire 5 4 3 2 1 9
4. On a scale of 1 to 10, where 1 means "Hostile" and 10 means "Love," how do you feel about South Bend? [Write a number between 1 and 10 in the space below.]
______
5. Customer Service and Communication. Please rate the City of South Bend using a scale of 1 to 5, where 5 means "Very Satisfied" and 1 means "Very Dissatisfied", with regard to each of the following.
How satisfied are you with... Very Satisfied
Satisfied Neutral Dissatisfied Very
Dissatisfied Don't Know
1. Availability of information about local government services and activities
5 4 3 2 1 9
2. Hours that customer service is available 5 4 3 2 1 9 3. Quality of social media outlets (e.g. Facebook, Twitter) 5 4 3 2 1 9

©2020 ETC Institute for the City of South Bend Page 2
6. Which of the following are your PRIMARY SOURCES of information about city issues, services, and events? [Check all that apply.] ____(1) City website ____(2) Social media
____(3) Public meetings ____(4) Local news
____(5) Contacting the city directly ____(6) Other: __________________________________
7. Which TWO of the information sources listed in Question 6 do you MOST PREFER to learn about city issues, services, and events? [Write in your answers below using the numbers from the list in Question 6, or circle "NONE".]
1st: ____ 2nd: ____ NONE
8. Have you or other members of your household used the City of South Bend's website in the last year? ____(1) Yes ____(2) No [Skip to Q9.]
8a. How did you access the city's website? [Check all that apply.] ____(1) Computer ____(2) Phone ____(3) Tablet
8b. How would you rate the overall usefulness of the city's website? ____(1) Excellent ____(2) Good
____(3) Fair ____(4) Poor
____(9) Don't know
9. Which of the following digital devices do you have access to in your home? [Check all that apply.] ____(1) Desktop Computer ____(2) Laptop Computer
____(3) Tablet ____(4) Smartphone
____(5) None
10. Have you called or visited the city with a question, problem, or complaint during the past year? ____(1) Yes ____(2) No [Skip to Q11.]
10a. How did you contact the city? ____(1) Phone ____(2) Email ____(3) Social media ____(4) In-person
10b. Did you contact 311? ____(1) Yes ____(2) No
10c. How easy was it to address your issue? ____(1) Very easy ____(2) Somewhat easy
____(3) Neutral ____(4) Difficult
____(5) Very difficult
10d. What service did you contact the city about most recently?
10e. For each of the factors below that may influence your perception of the quality of customer service you receive from city employees, please rate how often the employees you have contacted during the past year have displayed the behavior described using a scale of 1 to 5, where 5 means "Always" and 1 means "Never".
Frequency that... Always Usually Sometimes Seldom Never Don't Know
1. They were courteous and polite 5 4 3 2 1 9 2. They gave accurate answers to your questions 5 4 3 2 1 9

©2020 ETC Institute for the City of South Bend Page 3
11. Major Categories of City Services. Please rate the City of South Bend using a scale of 1 to 5, where 5 means "Very Satisfied" and 1 means "Very Dissatisfied", with regard to each of the following.
How satisfied are you with... Very Satisfied
Satisfied Neutral Dissatisfied Very
Dissatisfied Don't Know
01. Overall quality of fire services 5 4 3 2 1 9 02. Overall quality of ambulance/emergency medical services 5 4 3 2 1 9 03. Overall quality of trash collection services 5 4 3 2 1 9 04. Overall quality of parks and recreation programs and facilities 5 4 3 2 1 9 05. Overall quality of water utility services 5 4 3 2 1 9 06. Overall quality of local police protection 5 4 3 2 1 9 07. How well City is planning growth 5 4 3 2 1 9 08. Overall enforcement of local codes and ordinances 5 4 3 2 1 9 09. The process for getting a permit 5 4 3 2 1 9 10. Overall maintenance of City streets, sidewalks, and infrastructure 5 4 3 2 1 9
12. Which THREE of the items listed in Question 11 do you think should receive the MOST EMPHASIS from city leaders over the next TWO years? [Write in your answers below using the numbers from the list in Question 11, or circle "NONE".]
1st: ____ 2nd: ____ 3rd: ____ NONE
13. Community Investment. Please rate the City of South Bend with regard to each of the following using a scale of 1 to 5, where 5 means "Very Satisfied" and 1 means "Very Dissatisfied".
How satisfied are you with... Very Satisfied
Satisfied Neutral Dissatisfied Very
Dissatisfied Don't Know
1. Overall quality of Downtown revitalization 5 4 3 2 1 9 2. Overall quality of new development in Downtown 5 4 3 2 1 9 3. Overall quality of new development in your neighborhood 5 4 3 2 1 9 4. Housing quality in your neighborhood 5 4 3 2 1 9 5. Overall appearance of your neighborhood 5 4 3 2 1 9 6. Communication of plans for development projects 5 4 3 2 1 9
14. Which TWO of the items listed in Question 13 do you think should receive the MOST EMPHASIS from city leaders over the next TWO years? [Write in your answers below using the numbers from the list in Question 13, or circle "NONE".]
1st: ____ 2nd: ____ NONE
15. Do you feel that your neighborhood has improved over the past FIVE years? ____(1) Yes ____(2) No ____(3) Have not lived in my neighborhood 5 years
16. Do you belong to a neighborhood association? ____(1) Yes ____(2) No [Skip to Q17.]
16a. How satisfied are you with the city's engagement with your neighborhood association? ____(1) Very satisfied ____(2) Satisfied
____(3) Neutral ____(4) Dissatisfied
____(5) Very dissatisfied
17. Are you aware of development plans for your neighborhood? ____(1) Yes ____(2) No
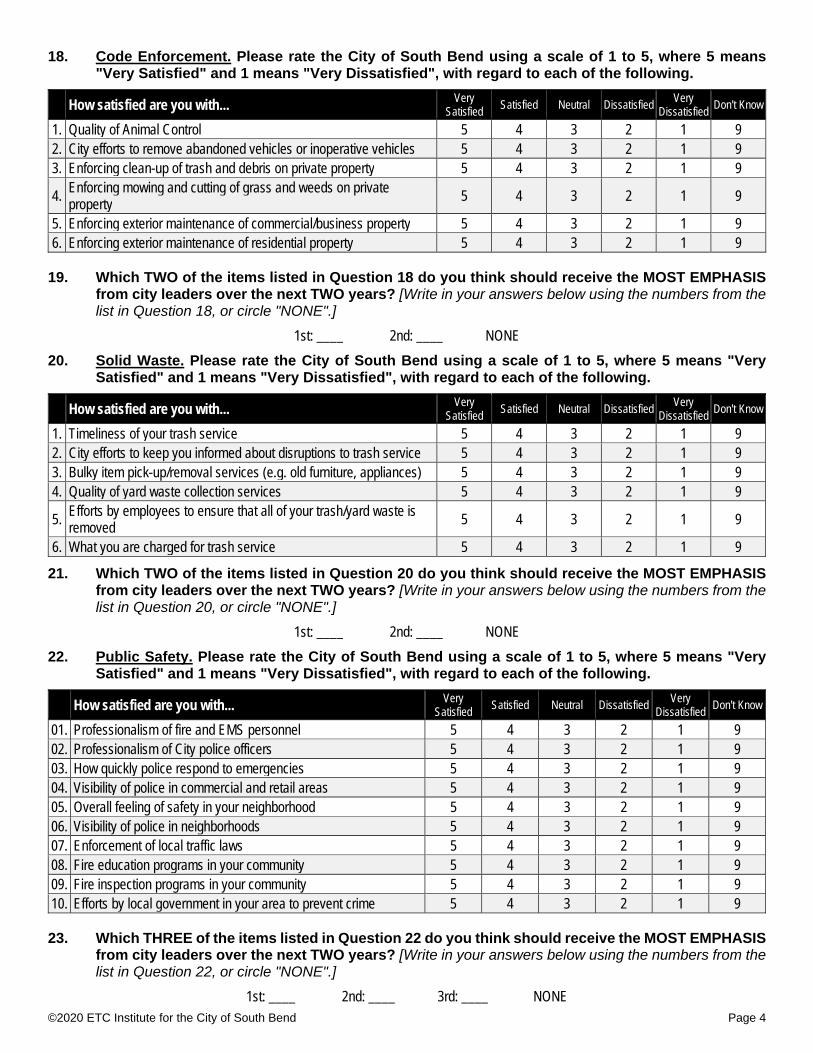
©2020 ETC Institute for the City of South Bend Page 4
18. Code Enforcement. Please rate the City of South Bend using a scale of 1 to 5, where 5 means "Very Satisfied" and 1 means "Very Dissatisfied", with regard to each of the following.
How satisfied are you with... Very Satisfied
Satisfied Neutral Dissatisfied Very
Dissatisfied Don't Know
1. Quality of Animal Control 5 4 3 2 1 9 2. City efforts to remove abandoned vehicles or inoperative vehicles 5 4 3 2 1 9 3. Enforcing clean-up of trash and debris on private property 5 4 3 2 1 9
4. Enforcing mowing and cutting of grass and weeds on private property
5 4 3 2 1 9
5. Enforcing exterior maintenance of commercial/business property 5 4 3 2 1 9 6. Enforcing exterior maintenance of residential property 5 4 3 2 1 9
19. Which TWO of the items listed in Question 18 do you think should receive the MOST EMPHASIS from city leaders over the next TWO years? [Write in your answers below using the numbers from the list in Question 18, or circle "NONE".]
1st: ____ 2nd: ____ NONE
20. Solid Waste. Please rate the City of South Bend using a scale of 1 to 5, where 5 means "Very Satisfied" and 1 means "Very Dissatisfied", with regard to each of the following.
How satisfied are you with... Very Satisfied
Satisfied Neutral Dissatisfied Very
Dissatisfied Don't Know
1. Timeliness of your trash service 5 4 3 2 1 9 2. City efforts to keep you informed about disruptions to trash service 5 4 3 2 1 9 3. Bulky item pick-up/removal services (e.g. old furniture, appliances) 5 4 3 2 1 9 4. Quality of yard waste collection services 5 4 3 2 1 9
5. Efforts by employees to ensure that all of your trash/yard waste is removed
5 4 3 2 1 9
6. What you are charged for trash service 5 4 3 2 1 9
21. Which TWO of the items listed in Question 20 do you think should receive the MOST EMPHASIS from city leaders over the next TWO years? [Write in your answers below using the numbers from the list in Question 20, or circle "NONE".]
1st: ____ 2nd: ____ NONE
22. Public Safety. Please rate the City of South Bend using a scale of 1 to 5, where 5 means "Very Satisfied" and 1 means "Very Dissatisfied", with regard to each of the following.
How satisfied are you with... Very Satisfied
Satisfied Neutral Dissatisfied Very
Dissatisfied Don't Know
01. Professionalism of fire and EMS personnel 5 4 3 2 1 9 02. Professionalism of City police officers 5 4 3 2 1 9 03. How quickly police respond to emergencies 5 4 3 2 1 9 04. Visibility of police in commercial and retail areas 5 4 3 2 1 9 05. Overall feeling of safety in your neighborhood 5 4 3 2 1 9 06. Visibility of police in neighborhoods 5 4 3 2 1 9 07. Enforcement of local traffic laws 5 4 3 2 1 9 08. Fire education programs in your community 5 4 3 2 1 9 09. Fire inspection programs in your community 5 4 3 2 1 9 10. Efforts by local government in your area to prevent crime 5 4 3 2 1 9
23. Which THREE of the items listed in Question 22 do you think should receive the MOST EMPHASIS from city leaders over the next TWO years? [Write in your answers below using the numbers from the list in Question 22, or circle "NONE".]
1st: ____ 2nd: ____ 3rd: ____ NONE
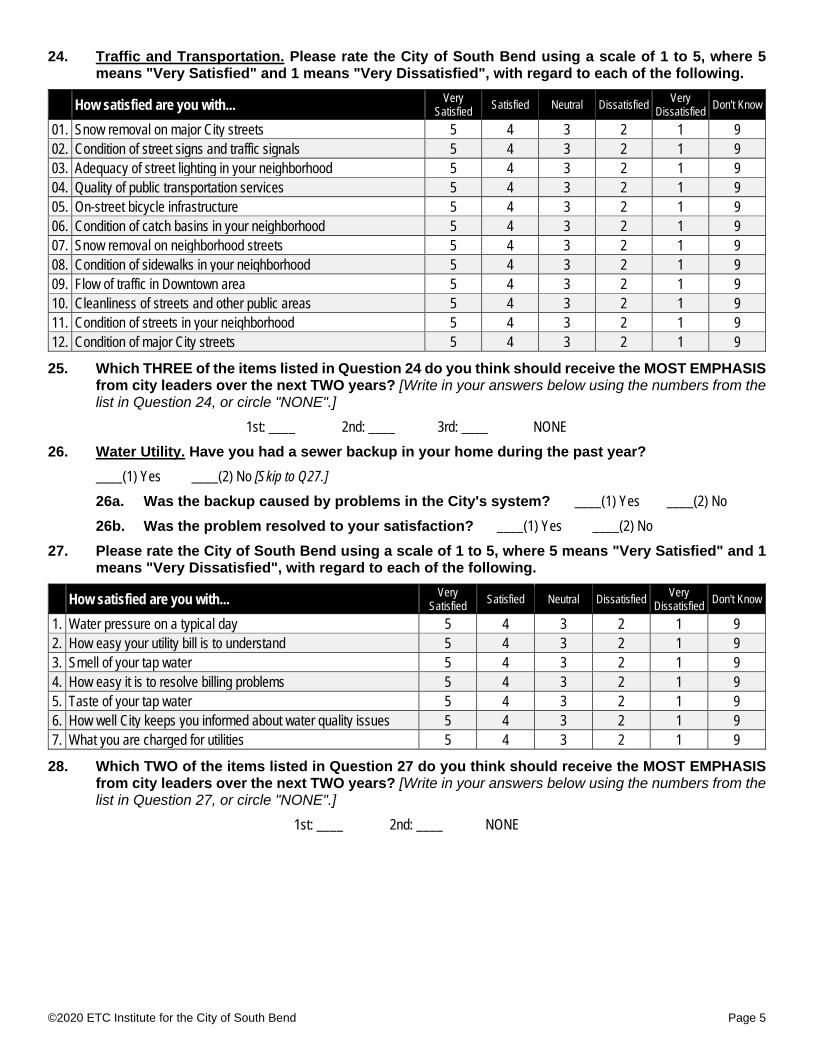
©2020 ETC Institute for the City of South Bend Page 5
24. Traffic and Transportation. Please rate the City of South Bend using a scale of 1 to 5, where 5 means "Very Satisfied" and 1 means "Very Dissatisfied", with regard to each of the following.
How satisfied are you with... Very Satisfied
Satisfied Neutral Dissatisfied Very
Dissatisfied Don't Know
01. Snow removal on major City streets 5 4 3 2 1 9 02. Condition of street signs and traffic signals 5 4 3 2 1 9 03. Adequacy of street lighting in your neighborhood 5 4 3 2 1 9 04. Quality of public transportation services 5 4 3 2 1 9 05. On-street bicycle infrastructure 5 4 3 2 1 9 06. Condition of catch basins in your neighborhood 5 4 3 2 1 9 07. Snow removal on neighborhood streets 5 4 3 2 1 9 08. Condition of sidewalks in your neighborhood 5 4 3 2 1 9 09. Flow of traffic in Downtown area 5 4 3 2 1 9 10. Cleanliness of streets and other public areas 5 4 3 2 1 9 11. Condition of streets in your neighborhood 5 4 3 2 1 9 12. Condition of major City streets 5 4 3 2 1 9
25. Which THREE of the items listed in Question 24 do you think should receive the MOST EMPHASIS from city leaders over the next TWO years? [Write in your answers below using the numbers from the list in Question 24, or circle "NONE".]
1st: ____ 2nd: ____ 3rd: ____ NONE
26. Water Utility. Have you had a sewer backup in your home during the past year? ____(1) Yes ____(2) No [Skip to Q27.]
26a. Was the backup caused by problems in the City's system? ____(1) Yes ____(2) No
26b. Was the problem resolved to your satisfaction? ____(1) Yes ____(2) No
27. Please rate the City of South Bend using a scale of 1 to 5, where 5 means "Very Satisfied" and 1 means "Very Dissatisfied", with regard to each of the following.
How satisfied are you with... Very Satisfied
Satisfied Neutral Dissatisfied Very
Dissatisfied Don't Know
1. Water pressure on a typical day 5 4 3 2 1 9 2. How easy your utility bill is to understand 5 4 3 2 1 9 3. Smell of your tap water 5 4 3 2 1 9 4. How easy it is to resolve billing problems 5 4 3 2 1 9 5. Taste of your tap water 5 4 3 2 1 9 6. How well City keeps you informed about water quality issues 5 4 3 2 1 9 7. What you are charged for utilities 5 4 3 2 1 9
28. Which TWO of the items listed in Question 27 do you think should receive the MOST EMPHASIS from city leaders over the next TWO years? [Write in your answers below using the numbers from the list in Question 27, or circle "NONE".]
1st: ____ 2nd: ____ NONE

©2020 ETC Institute for the City of South Bend Page 6
29. Venues, Parks, and Arts. Please rate the City of South Bend using a scale of 1 to 5, where 5 means "Very Satisfied" and 1 means "Very Dissatisfied", with regard to each of the following.
How satisfied are you with... Very Satisfied
Satisfied Neutral Dissatisfied Very
Dissatisfied Don't Know
1. Maintenance of City parks 5 4 3 2 1 9 2. Number of walking and biking trails 5 4 3 2 1 9 3. Access to parks in your neighborhood 5 4 3 2 1 9
4. Ease of registering for recreation programs such as classes, trips, and special events
5 4 3 2 1 9
5. Fees charged for recreation programs 5 4 3 2 1 9 6. Availability of recreation programming in your neighborhood 5 4 3 2 1 9 7. Condition of restrooms in public parks 5 4 3 2 1 9
30. Which TWO of the items listed in Question 29 do you think should receive the MOST EMPHASIS from city leaders over the next TWO years? [Write in your answers below using the numbers from the list in Question 29, or circle "NONE".]
1st: ____ 2nd: ____ NONE
31. In the past year, have you visited a city recreation facility or park? ____(1) Yes ____(2) No
Demographics
32. Approximately how many years have you lived in South Bend? ______ years
33. Have you met the current Mayor? ____(1) Yes ____(2) No
34. Do you own or rent your current residence? ____(1) Own ____(2) Rent
35. What is your age? ______ years
36. What is your gender identity? ____(1) Male ____(2) Female ____(3) Gender variant/Non-conforming
37. Including yourself, how many people live in your household? ______ people
38. How many people in your household are employed? ______ people
39. Which of the following best describes your employment status? ____(1) Employed full time [Answer Q39a.] ____(2) Employed part time [Answer Q39a.] ____(3) Not employed, looking for work ____(4) Not employed, NOT looking for work
____(5) Retired ____(6) Student ____(7) Disabled, not able to work
39a. What is the zip code where you work? ________________
40. Would you say your total annual household income is… ____(1) Under $15,000 ____(2) $15,000 to $29,999
____(3) $30,000 to $59,999 ____(4) $60,000 to $99,999
____(5) $100,000 to $124,999 ____(6) $125,000 or more
41. Which of the following best describes your race/ethnicity? [Check all that apply.] ____(1) African American/Black ____(2) Asian/Pacific Islander
____(3) Hispanic/Latinx ____(4) Native American/Eskimo
____(5) White/Caucasian ____(6) Other: ____________________
42. How would you describe your overall state of health these days. Would you say… ____(1) Excellent ____(2) Good
____(3) Average ____(4) Fair
____(5) Poor ____(9) Don’t know
43. How would you compare your standard of living to your parents’ when they were your age? ____(1) Much better ____(2) Somewhat better
____(3) About the same ____(4) Somewhat worse
____(5) Much worse ____(9) Don’t know

©2020 ETC Institute for the City of South Bend Page 7
44. Do you think local officials in your community are doing a good job of keeping you informed about the COVID-19 Pandemic? ____(1) Yes ____(2) No ____(9) Don’t know
45. Please rate your satisfaction with the City’s response to COVID-19. ____(1) Very satisfied ____(2) Satisfied
____(3) Neutral ____(4) Dissatisfied
____(5) Very Dissatisfied ____(9) Don’t know
46. Please rate your satisfaction with the County’s response to COVID-19. ____(1) Very satisfied ____(2) Satisfied
____(3) Neutral ____(4) Dissatisfied
____(5) Very Dissatisfied ____(9) Don’t know
Your responses will remain completely confidential. The information printed to the right will ONLY be used to help identify which areas of the city are having problems with city services. If your address is not correct, please provide the correct information. Thank you.
This concludes the survey – Thank you for your time! Please return your completed survey in the enclosed postage-paid envelope addressed to:
ETC Institute, 725 W. Frontier Circle, Olathe, KS 66061