2002 hakidi cluster validity methods part ii
TRANSCRIPT

5/14/2018 2002 Hakidi Cluster Validity Methods Part II - slidepdf.com
http://slidepdf.com/reader/full/2002-hakidi-cluster-validity-methods-part-ii 1/9
Clustering Validity Checking Methods: Part II
Maria Halkidi, Yan nis Batistakis, Michalis Vazirgiannis
Department of Informatics,
Athens University of Economics & BusinessEmail: {mhalk, yannis, mvazirg}@aueb.gr
A B S T R A C T
Clustering resul ts val idat ion is an im porta nt topic in the
context of pa t t e rn recogni t ion . We review approaches
and sys tems in this context . In the f i rs t part of this
paper we presented clus tering val idi ty checking
approaches based on internal and external cri ter ia . In
the second, current part , we present a review of
clustering validity approaches based on relative criteria.
Also we discuss the resul ts of an experimental s tudybased on widely known val idi ty indices . Final ly the
paper i l lus trates the issues that are under-addressed by
the recent approaches and proposes the research
directions in the field.
Keywords : clustering validation, pattern discovery,
unsupervised learning.
1 . I N T R O D U C T I O N
Clustering is perceived as an unsupe rvised process s ince
there are no predefined classes and no examples that
would show wha t kind of des irable relat ions should be
val id among the data . As a consequence, the f inal
part i t ions of a data set require some sort of evaluat ionin most applications [15]. For instance questions like
"how many clus ters are there in the data set?" , "does
the resulting clustering scheme fits our data set?", "is
there a bet ter part i t ioning for our data set?" cal l for
clustering results validation and are the subjects of a
number of methods discussed in the l i terature. They
aim at the quant i ta t ive evaluat ion of the resul ts of the
clus tering algori thms and are known under the general
term cluster validity methods .
In Par t I o f the paper we in t roduced the
fundamenta l concept s of cluster vali&~yand we presented
a review of clustering validity indices that are based on
external and internal criteria. As mentioned in Part I theseapproaches are based on statistical tests and their major
drawback is their high computat ional cos t . Moreover,
the indices related to these approaches aim at measuring
the degree to which a data set confirms an a-priorispecified scheme.
On the other hand, c lus tering val idi ty approaches
which are based on relative criteria aim at f inding the bes t
clus tering scheme that a c lus tering algori thm can define
under certain assumptions and parameters . Here the
basic idea is the evaluation of a clustering structure by
comparing i t to other clus tering schemes, resul t ing by
th e same algori thm but w ith differen t parameter values .
The remainder of the paper is organized as fol lows.
In the next sect ion we discuss the fundamental
concepts and representat ive indices for val idi ty
approaches based on relative criteria. In Section 3 an
experimental s tudy based on some of these val idi tyindices is presented, using synthetic and real data sets.
We conclude in Sect ion 4 by summarizing and
providing the t rends in clus ter validity.
2 . R e l a t i v e C r i t e r i a .
The bas is of the above described val idat ion methods is
statistical testing. Thus, the major drawback of
techniques based on internal or external criter ia is their
high compu tat ional demands . A d ifferent val idation
approach is discussed in this section. It is based on
relative criteria and does no t inv olve statistical tests. Th e
fundamental idea of this approach is to choose the bes t
clus tering scheme of a set of defined schemes accord ing
to a pre-specified criterion. More specifically, theproblem can be s tated as fol lows:
"Let Palgbe the set ofparameters assodated with a gpedflc
clustering algorithm (e.g. the number of clusters n~). Amon g
the clustering schemes C,~ i= 1,.., no defined by a ~edf lc
algorithm, for di~rent values of the parameters in Poe,
choose the one that best lt s the data se t."
Then, we can consider the fol lowing cases of the
problem:
I) Pdg d o e s n o t c o n t a i n t h e n u m b e r o f c l u st e rs , n o
as a pa ram ete r . In this case, the choice of the
opt imal parameter values are described as fol lows:
We m n the algori thm fo r a wide range of its
parameters ' values and we choose the larges t rangefor whic h nc remains co nstan t (usually ~ << N
(number of tuples)) . Then we choose as appropriate
values of the Poe parameters the values that
correspond to the middle of this range. Also, this
procedure ident i f ies the number of c lus ters that
underlie our data set.
II) P~/# con tai ns n, a s a p a r a m e t e r . T h e p r o c e d u r e o f
ident i fying the bes t c lus tering scheme is based on a
S I G M O D R e c o r d , V o l . 3 1 , N o . 3 , S e p t e m b e r 2 0 0 2 1 9

5/14/2018 2002 Hakidi Cluster Validity Methods Part II - slidepdf.com
http://slidepdf.com/reader/full/2002-hakidi-cluster-validity-methods-part-ii 2/9
validity index. Selecting a suitable performance
index, q, we proce ed with the fol lowing s teps :
• the clustering algorith m is run fo r all values of n,
between a minim um ncmin and a m aximum n . . . . .
The minimum and maximum va lues have beendefined a-priori by user .
• For each of the values of n,, the algori thm is run r
t imes , us ing different set of values for the o ther
parameters of the algorithm (e.g. different initial
condi t ions) .
• Th e bes t values of the index q obtained by each
n, is plotted as the func tion o f n,.
Based on this plot we may ident i fy the bes t
clus tering scheme. We have to s t ress that there are two
approaches for defining the bes t c lus tering depending
on the behaviour of q with respect to n, . Thus , i f the
val idi ty index does not exhibi t an increas ing or
decreas ing t rend as n, increases we seek the maximum(minimum) o f the plot . On the other hand, for indices
that increase (or decrease) as the number of c lus ters
increase we search for the values of n, a t which a
s ignif icant local change in value of the index occurs .
This change appears as a "knee" in the plot and i t i s an
indicat ion of the number of c lus ters underlying the
dataset . Moreover, the absence of a knee may be an
indicat ion that the data set possesses no clus tering
structure.
In the sequel, som e representat ive val idi ty indices for
crisp a nd fuzzy clus tering are presented.
2 .1 Cr i sp c lus te r ing .
Crib dasterin& considers non-overlapping part i t ionsmeaning that a data point either belongs to a class ornot. In this section discusses validity indices suitable for
crisp clustering.
2.1. I The modified Hub ert F statistic.Th e defini t ion of the m odified Hu ber t F [18] s tat ist ic is
given by the equat ionN-I N
F = (1 / M ) E E P(i, j) . a(i, j) (1)i=| j=i+l
where N is the num ber o f objects in a dataset , M=N (N -1)/2, P is the proximity matrix of the data set and Q is
an NxN matrix whose ( i , j ) e lement is equal to thedistance betw een the rep resentative points (v¢i, vc) o f
the clusters whe re the objects xi and x belong.Similarly, we can define the normalized Hubert F
statistic, given by equa tionN- I N
[(lfM) E E (X (i , j)- gx)(Y(i, J) - I.tv)] ( 2 )~ i=l j=i+l
CIXC~Y
If the d(v~i, vci) is close to d(xi, xj) for i , j=I,2,.. ,N , P and
Q will be in close agree men t and th e values of r" and ~"(normalized I) will be high. C onversely, a high value of
^
F ( r) indicates the exis tence of comp act c lusters. Thus ,
in the plot of normalized F versus n, , we seek as ignif icant knee that corresponds to a s ignif icantinc rease of normal ized F . The number of c lus te rs a twhich the knee occurs i s an indica tion of the n umb er o fclus ters that occurs in the data . We note, that for n, = Iand n, =N the index is not defined.
2.1.2 Dunn fam i~ of indices.A clus ter val idity index fo r crisp clus tering prop osed in
[5], a ims at the ident i f icat ion of "compact and wel lseparated clusters". Th e index is defined in equat ion (3)for a specific num ber of c lus ters _~
I f &,,c,)D. = m i n t m i n I ~ ,-I}
, ,=l.....,,,[/=,+i...... max diam[ck) l l 0)[ k*=i.....,,, j j
whe re d(ci, c o is the dissimilarity fun ction betw een two
clusters ci and c defin ed as d(c~ ,cj)= rain d ( x , y ) ,x~Ct,yeC 1
and diam(c) is the diameter of a clus ter , which may beconsidered as a measure of c lus ters ' dispers ion. Thediameter o f a clus ter C can be defined as fol lows:
diam( C ) = max d ( x, y) (4)x,yeC
If the dataset contains compact and wel l -separatedclusters, the dis tance between the clus ters is expec ted to
be large and the diameter of the clus ters is expected tobe small . Thus , based on the Dunn's index defini t ion,
we may conclude that large values of the index indicatethe presence o f com pact and wel l -separated clusters .
Index D,,, does not exhibi t any t rend with respect tonumb er of c lus te rs. Thus , the max imum in the p lo t ofD,, versus the number of c lus ters can be an indicat ionof the nu mb er o f c lusters that f its the data .
Th e problem s o f the Du nn index are: i ) i ts
considerable time complexity, ii) i ts sensitivity to thepresence of noise in datasets , s ince these are l ikely to
increase the values of diam(c) (i .e., dominator of
equat ion (3)) .Th ree indices, are prop osed in [14] that are more
robus t to the presence of noise . The y a re known as
Dunn-l ike indices s ince they are based on Dunn index.Moreover, the three indices use for their defini t ion theconcept s of Minimum Spanning Tree (MST) , there la t ive ne ighbourhood graph (RNG) and the Gabr ie l
graph respectively [18].Consider the index based on MST. Let a clus ter c i
and the comple te graph Gi whose ver t i ces cor respondto the vectors o f c i. Th e weight , we, of an edge, e, of th isgraph equals the dis tance between i ts two end points , x,y. Let EiMsT be the set of edges o f the M ST of the graphGi and eiMsT the edge in Ei MST with the maximum
weight . Th en the diameter o f Ci is defined as the weightof e iMsT. Dunn-l ike index based on the co ncep t of the
MS T is given by equat ion
2 0 S I G M O D R e c o r d , V ol . 3 1 , N o . 3 , S e p t e m b e r 2 0 0 2

5/14/2018 2002 Hakidi Cluster Validity Methods Part II - slidepdf.com
http://slidepdf.com/reader/full/2002-hakidi-cluster-validity-methods-part-ii 3/9
O=m l=/ 1}i~.....,,Aj=~.l,...,,,,/ max diam usr[ ~,=, ........ l
The number of c lus te r s a t which DmMsT takes its
max imu m va lue indica tes the num ber o f dus te r s in theunder ly ing da ta . Based on s imi la r a r guments we may
def ine the Dunn- l ike ind ices f or GG and RGN gr aphs .
2.1.3 The Davies-Bouldin (DB) index.
A similar i ty measu re Rii betw een the clus ters Ci and C isde f ined based on a measur e o f d ispe r s ion of a dus te r Ci
, le t s i , and a diss imilar i ty measure between two clus ters
di b The Rii index is def ined to sat is fy the fol lowingcondit ions [4] :
1. Rij_>0
2. Rij = Rii3. if si = 0 and s = 0 then Rii = 0
4. if s > sk an d dii = dik th en Rii > Rik
5. if s = Sk an d di i < dik then Rii > Rik.
These condit ions s ta te that Rii is non-negative andsymmetr ic .
A s imple choice for Rii that sat is f ies the aboveconditions is [4]:
Rii = (si + si)/d i . (6)
The n the D B index i s de fined as
DB+ =--L R, (7 )nc i=1
R~ = max R , i= l, . . . ,n~t=l,...,nc,i# j
I t is c lear for the above def ini t ion that DB,c is the
average s imilar i ty betw een each clus ter c i, i=1, . . . , nc
and i ts most s imilar one. I t is des irable for the clus tersto have the min imu m poss ib le s imi lar ity to each o the r ;the r e f or e we seek c lus te r ings tha t min imize DB. The
DB= index exhib i t s no t r ends wi th r espec t to then u m b e r o f d u s t e r s a n d t h u s w e s e e k t h e m i n i m u m
value of DB,c in i t s p lo t ve r sus the n umb er of c lus te r s.
Some al ternat ive def ini t ions of the diss imilar i ty
between two clus ters as well as the dispers ion of acluster, ci, is define d in [4].
Thr ee va r ian ts o f the DBac index a r e pr oposed in
[ 14] . They a r e based on MST, RNG and GG concepts
s imilar ly to the cases o f the D unn- l ike indices.
Other val idi ty indices for cr isp clus ter ing have been
pr opo sed in [3] and [ 13]. The implem enta t ion o f mos t
of these ind ices i s computa t iona l ly ve r y expens ive ,espec ial ly when the n umb er of c lus te r s and ob jec t s in
the data set grow s ve ry large [19] . In [13], an eva luat ion
study of thir ty val idi ty indices proposed in l i terature is
presented. I t is based on t iny data sets (about 50 points
each) with well- separated clus ters . The results of this
s tudy [13] place Caliski and Harabasz(1974) , Je(2) /Je(1)(1984) , C- index (1976) , Gamma and Beale among thes ix bes t indices . However , i t is noted that a l though ther esu l t s concer n ing these methods a r e encour ag ing they
ar e l ike ly to be da ta dependent . Thus , the behaviour oindices may change if dif ferent data s tructures w erused . Also , some ind ices based on a s ample o
clus ter ing results . A representat ive example Je ( 2) / J e ( 1) whose computa t ions based on ly on th
inf or mat ion pr ovided by the i t ems involved in the la sclus ter merge.
2.1.4 RM SSD T, SPR, RS, CD.This family of val idi ty indices is applicable in the case
that hierarchical a lgor i thms are used to clus ter thdatasets . Hereaf te r we refer to the def ini t ions o f fou
validi ty indices , which have to be used s imultaneously tde te r mine the number of c lus te r s ex i s t ing in the da t
set . These four indices are applied to each s tep of hierarchical c lus te r ing a lgor i thm and they a r e known a[16]:
Root-mean-square standard deviation R M SS TD ) of the necluster
Semi-partial R-squared (SPR)
R-squared (RS) Distance between two clusters (CD).
Get t ing in to a mor e de ta i led desc r ip t ion of them we casay that:
RM SST D of a new c lus te r ing scheme def ined a t
level of a c lus ter ing hierarchy is the square root of th
var iance of a l l the var iables (at tr ibutes used in th
clus ter ing process) . This index measures th
homogene i ty of the f or med c lus te r s a t each s tep of th
hierarchical a lgor i thm. Since the object ive of c lus te
ana lys i s i s to f or m homogeneous gr oups the RMSSTD
of a clus ter should b e as small as poss ible . In case tha
the va lues of RMSST D ar e h igher than the ones of th
pr ev ious s tep , we have an ind ica t ion tha t the new
cluster ing schem e is worse.
In the fol lowing def ini t ions we shall use the term SS
which means Sum of Squares and refers to the equation:
N
( 83S =i=l
Along with this we shall use some addit ional symbolism
like:
i) SSw refer r ing to the sum o f squares within group,
i i ) SSb refer r ing to the sum of squares between
gr oups .
i ii ) SSt referr ing to the total su m of squares , of the
whole data set .
SPR for a the new clus ter is the dif ference between
SSw of the new clus ter and the sum of the SSw's value
of dus te r s jo ined to ob ta in the new c lus te r (loss ohomogeneity), divided by the SSt for the whole data set
This index measur es the los s o f homogene i ty a f temerging the two clus ters of a s ingle algor i thm s tep. Ithe index value is zero then the new clus ter is obtained
by mer g ing two pe r f ec tly hom ogen eous dus te r s . I f it
S I G M O D R e c o r d , V o l . 3 1, N o . 3 , S e p t e m b e r 2 0 0 2 21

5/14/2018 2002 Hakidi Cluster Validity Methods Part II - slidepdf.com
http://slidepdf.com/reader/full/2002-hakidi-cluster-validity-methods-part-ii 4/9
value is high then the new clus ter is obtained by
mer ging two he te r ogeneous dus te r s .
RS o f the new clus ter is the rat io of SSb ov er SS,. SSb
is a measure of dif ference between groups . S ince SSt =
SSb + SSw. the great er the SSb the sm aller the SSw an d
vise versa. As a result , the greater the dif ferencesb e t w e e n g r o u p s a r e t h e m o r e h o m o g e n o u s e a c h g r o u pis and vise versa. Thus , RS may be considered as a
measure of diss imilar i ty between clus ters . Fur thermore,
i t measur es the degr ee of homogen e i ty be tween gr oups .The va lues of RS r ange be tween 0 and 1 . I n case tha tthe value of RS is zero (0) indicates that no dif ference
exis t s amo ng gr oups . On the o the r hand , when RS
equals 1 there is an indicat ion of s ignif icant dif ference
a m o n g g r o up s .T h e CD index measur es the d i s tance be tween the
two clus ters that are merged in a given s tep of the
hierarchical c lus ter ing. This dis tance depends on the
selected representat ives for the hierarchical c lus ter ing
we per f or m. For ins tance , in case of Centroid hierarchicalclustering the representat ives of the formed clus ters are
the cen te r s o f each dus te r , so CD i s the d i s tance
be tween the cen te r s o f the dus te r s . I n case tha t we use
single linkage C D m e a s u r e s t h e m i n i m u m E u c l i d e a ndis tance bet wee n al l poss ible pairs of points . In case o f
complete linkage CD is the maximum Euc l idean d i s tance
between al l pairs of data points , and so on.Us ing these f our ind ices we de te r mine the number
of c lus ters that exis t in a data set , plot t ing a gra ph of a l l
these indices values for a number of dif ferent s tages of
the clus ter ing algor i thm. In this graph we search for the
s teepes t knee , o r in o the r wor ds , the gr ea te r jump ofthese ind ices ' va lues f r om h igher to smal le r number of
clusters.
N on-hierarchical clustering. I n the case of nonhie r a r ch ica l
clus ter ing (e .g. K-Means) we may also use some of theseindices in order to evaluate the result ing clus ter ing. The
indices that are more meaningf ial to use in this case are
RMSSTD and RS . The idea , he r e , i s to r un the
a lgor i thm a number of t imes f or d i f f e r en t number of
clus ters each t ime. Then the respective graphs of the
validi ty indices is plot ted fo r these duster in gs and as theprevious example shows, we search for the s ignif icant
"knee" in these gr aphs . The number of c lus te r s a t
which the "kn ee" i s obse r ved ind ica tes the op t imalclus ter ing for our data set . In this case the val idi ty
indices descr ibed before take the fol lowing form:
RMSSTD
£ ~ ( x , - 7 - k ) 2i= I , , . nc k= |. / = 1 . . . v
~ , ( n o - 1 )i= ,. .j= I . . . v
(9)
an d
R S =SS b
S S ,
S S , - SS w
S S ,
R S =
RS =
S S b S S , - SS w=
S S ~ S S ,
Z ( x~ - x ~ ) -CS:l '"" L t:l ~ ~'
j= l . . .v k= l
( x ~ - 7 ,
(lo)
w h e r e n, i s the num ber of c luste rs , d the num ber o fvar iables(data dimensionali ty) , n i is the n um be r o f data
va lues of i d imens ion whi le n i i cor r esponds to the
number of da ta va lues of i d imens ion tha t be long to
cluster i. Also xj i s the mean of da ta va lues of J
d imens ion .
2.1 .5 The SD validity index.
Ano ther c lus ter ing val id ity appr oach i s p r oposed in [ 8].
The SD va l id i ty index de f in i t ion i s based on the
concepts o f average scatteringJbr clustersan d total separationbetween clusters. I n the seque l , we g ive the f undamenta l
def ini t ion for this index.
Average scattering J br clusters. The aver age sca t te r ing f or
clus ters is def ined asn¢
Scat, (n:) = ~ I I < > - ( v , ) l l / l l < , - ( a ' ) l l . = ( 1 1 )
Total separation between clusters. The de f in i t ion of to ta l
scat ter ing (separat ion) between clus ters is given by
equa t ion ( 12)
Dmax nc nc
Dis(n,) = vk _vz (12)
rain k=l ~ z= l
wh ere D,,~. = ma x(] Ivi - vii i) Vi, j e{ 1, 2,3, . . . , no} isthe max imum dis tance be tw een c lus te r cen te r s. The D,~i,
= min(I Iv i- vi i i ) Vi, j e{1 , 2 . . . . . nc } is the m inim umdis tance between clus ter centers .
No w, w e can de f ine a va l idi ty index based on equa t ions
(11) and (12) as fol lows
SD(n,) = a. Scat(n~) + Dis(n,) ( 13)
where a is a weighting factor equal to Dis(c,,,~) where c,,,,<
i s the maxim um nu mbe r of input c lus te r s.The first term (i.e. , gcat(n~) is def ined in equation (11)
indicates the average compactness of c lus ters ( i .e . , intra-
clus ter dis tance) . A small value for this term indicates
com pac t c lusters and as the scat ter ing within clus tersincreases ( i .e . , they become less compact) the value of
Scat(nJ also increases . The second term Dis(n~) indicates
the to ta l s epar a t ion be tween the n, dusters ( i.e. , anindicat ion of inter -clus ter dis tance) . Con trary to the f ir s t
t e r m the second one , Dis(nJ, is inf luenced by the
geomet r y of the dus te r s and inc r ease wi th the numbe rof dus te rs . The two te r ms of SD ar e of the d i f f e r en trange, thus a weighting factor is needed in order to
incor por a te bo th te r ms in a ba lanced way. The num ber
2 2 S I G M O D R e c o r d , V o l . 3 1 , N o . 3 , S e p t e m b e r 2 0 0 2

5/14/2018 2002 Hakidi Cluster Validity Methods Part II - slidepdf.com
http://slidepdf.com/reader/full/2002-hakidi-cluster-validity-methods-part-ii 5/9
of dus te rs , n,, that minimizes the above index is anopt imal value. Also, the influence of the maximumnumber of c lus ters c . . . re lated to the weight ing factor ,in the select ion of the opt imal clus tering scheme isdiscussed in [8] . I t i s pro ved that SD proposes an
opt imal nu mb er o f c lus ters a lmost i rrespect ively of theC m a x value.
2.1.6 The S Dbw validity index.A recent val idi ty index is proposed in [10]. I t exploi ts
the inh erent features of c lus ters to assess the val idi ty ofresul ts and select the opt imal part i t ioning for the dataunder concern. Similarly to the SD index, i ts defini t ionis based on compactness and separat ion taking also intoaccou nt densi ty.
In the fol lowing, S_Dbw is formalized based on: i .c lus ters ' compa ctness ( in terms o f intra-clus ter
variance), and ii . density between clusters (in terms ofinter-cluster density).
L e t D = {v i l i = 1 , . . . , n, } be a part i t ioning of a dataset S into c conv ex clus ters where vi is the center of eachcluster as it results from applying a clustering algorithmto S.
Le t stdev be the average s tandard deviat ion of clus ters
defined as: sider= 7~l]a(v,) l ] •
Furthe r the term I I xl [ is defined as : I Ixl I = (xrx) /z,where x is a vector.
Th en the overal l inter-du ster densi ty is defined as:
D e f i n i t i o n 1 . Inter-cluster Density (ID) - It evaluates the
average density in the region am ong clus ters in relat ionto the densi ty of the clus ters . The goal is the densi tyamo ng duste rs b e low in comparison with the densi ty in
the clusters. Then, inter-cluster density is defined asfollows:
l ~ f ~ densiry(u,j) .l (14)
whe re vi, v I are the centers of clusters ci, ci, respectively
and ui j the middle point of the l ine segment defined bythe dusters ' centers V i , V j . The term densi ty(u) definedin equation (15):
no
d ~ . ~ ( ~ )= ~ s(-<,,,, ) , ( 1 5 )
where ni l is the number of tuples that belong to the
clu ster c~ an d % i.e., x~ e c~, q _G S. It re pr ese nt s th e
number of poin t s in the ne ighbourhood of u . In ourwork, the neighbourhood of a data point , u, is defined
to be a hyper-sphere with center u and radius the
average s tandard deviat ion of the clus ters , stdev. M o r especifically, functionf(x,t 0 is define d as:
f(x,u)=(~' if(x,u)>stdeVotherwise (16)
A poin t be longs to the ne ighbou rhood of u i f i tsdis tance from u is smaller than the average s tandarddeviat ion of clus ters . Here we assume that data ranges
are normalized across al l dimensions of f inding theneighbo urs of a mult idimensional point [1] .
D e f i n i t i o n 2 . Intrd-cluster yah'ante. I t measures theaverage scat tering of dusters . I ts defini t ion is given byequanon 11.
Th en the val idi ty index S Db w is defined as :
S_D bw (n,) = Scat(n<) + Dens_b w(m) (17)
The defini t ion of S_Dbw indicates that both cri ter ia of"go od " clus tering ( i.e. , compactness and separation) areproperly combined, enabl ing rel iable evaluat ion ofclustering results. Also, the density variations among
clus ters are taken into account to achieve in morerel iable resul ts . The number of dusters , no thatminimizes the above index an opt imal value indicat ing
the num ber of c lus ters present in the data set .Moreover , an approach based on the S_Dbw indexis propo sed in [9] . I t evaluates the clus tering schemes o fa data set as defined by different c lus tering algori thmsand selects the algorithm resulting m optimalpart i t ioning of the data .
In general terms, S Dbw enables the select ion both
of the algori thm and i ts parameters values for which theopt imal part i t ioning of a data set is defined (assuming
that the data set presents clustering tendency).However, the index cannot handle properly arbi t rari lyshaped clusters. The same applies to all theaforem entione d indices.
2 . 2 F u z z y C l u s t e ri n g .
In this section, we present validity indices suitable forfuzzy clustering. The objective is to seek clusteringschemes where most of the vectors of the datasetexhibi t high degree of mem bership in one clus ter . Fuzzy
clustering is defined by a matrix U=[uii], where uiidenotes the degree of membership of the vec tor x i incluster j . Also, a set of cluster representatives is defined.Similarly to crisp clustering case a validity index, q, isde f ined and we sea rch for the minimum or maximum inthe plot of q versus n,. Also, in case that q exhibits at rend with respect to the number of c lus ters , we seek as ignif icant knee of decrease (or increase) in the plot ofq.
In the sequel two categories of fuzzy validity indicesare discussed. The first category uses only the
mem berships values , ui i , of a fu z zy part i t ion of data .The second involves both the U matrix and the datasetitself.
2.2. I V alidily Indices involving on~ the membership values.Bezdek proposed in [2] the parfftion coeffcient, which isdefined as
n c
c=± E4 (is)N ~77~ =1
S I G M O D R e c o r d , V o l. 3 1 , N o . 3 , S e p t e m b e r 2 0 0 2 2 3
5/14/2018 2002 Hakidi Cluster Validity Methods Part II - slidepdf.com
http://slidepdf.com/reader/full/2002-hakidi-cluster-validity-methods-part-ii 6/9
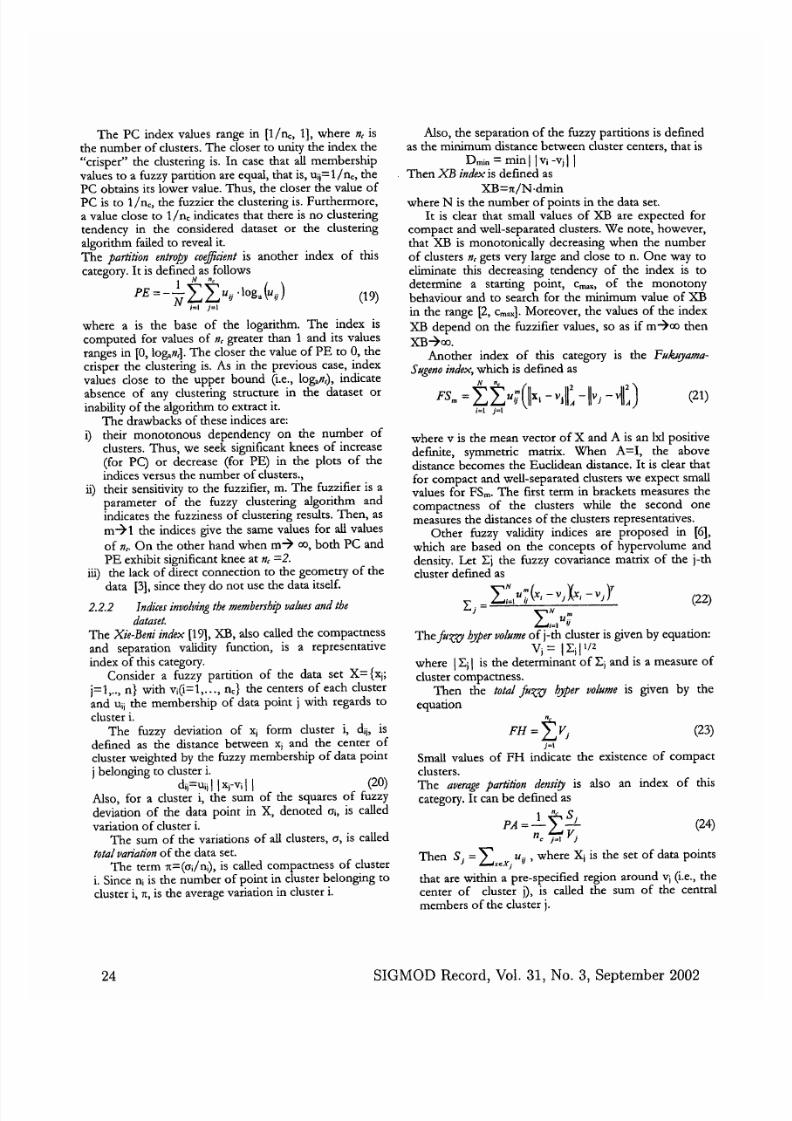
Th e PC index values range in [1/no, 1] , wher e m isthe num ber of c lus ters . The closer to uni ty the index the"crisper" the clus tering is . In case that a l l membership
values to a fuzz y partition are equal, that is , uii= l/n¢ , th e
PC obtains i ts lower value. Thus , the closer the value ofPC is to 1/no, the fuzzier the clus tering is . Furtherm ore,a value close to 1/n¢ indicates that there is no clusteringtendency in the considered dataset or the clus tering
algorithm failed to reveal it.
Th e partition entropy coqfident is another index of this
category. It is defined as follows• N nc
P E = - ~ i ~ l u o ' l ° g , ( u o ) == (19)
where a is the base of the logari thm. The index iscomputed for values of m greater than 1 and i ts valuesranges in [0, log, n,] . The closer the value o f PE to 0, thecrisper the clustering is. As in the previous case, indexvalues clo se to the u pp er bo un d (i.e., log, n,), indicate
absence of any clus tering s t ructure in the dataset orinability of the algorithm to extract it .
Th e drawbacks of these indices are:i ) the ir mon otono us dependency on the num ber of
clusters. Thus, we seek significant knees of increase(for PC) or decrease (for PE) in the plots of the
indices versus the nu mb er o f c lusters. ,fi) their sensitivity to the fuzzifier, m. Th e fuzzifier is a
parame ter of the fuzzy clus tering algori thm and
indicates the fuzziness of clustering results. Then, as
m ~ 1 the indices give the sam e values for all values
of n ,. On the o ther hand when m -) o0, both P C and
PE exhibi t s ignif icant knee at m =2.i ii ) the lack of direct conn ect ion to the geo metry of the
data [3], since they do no t use the data itself.
2.2.2 Indicesnvolving the membership values and thedataset.
T h e Xie-Beni index [19], XB, also called the compactness
and separation validity function, is a representative
index o f this category.Consider a fuzz y part it ion o f the data set X = {xj;
j=l , . . , n} w ith vi( i=l , . . . , no} the centers o f each clus ter
and ui i the membership of data point j wi th regards to
cluster i .Th e fuzzy deviat ion of x form clus ter i, di i, i s
defined as the dis tance between x and the center ofclus ter weighted by the fuzzy membership of data point
j belon ging to cluster i.
dii=uii] I xi vi I I (20)Also, for a clus ter i , the sum of the squares of fuzzy
deviat ion of the data point in X, denoted oi , i s cal led
var iat ion of dus te r i.The sum of the variations of all clusters, o, is called
total variationof the data set.The term n=(oi /ni) , i s cal led compactness of c lus ter
i . Since ni is the nu mb er of po int in clus ter belonging tocluster i , ~, is the average variation in cluster i .
Also, the separat ion o f the fu zzy part i t ions is definedas the minim um dis tance between clus ter centers , that is
Dmin -~ mi n I ] vi -vii IT h e n XB index is defined as
X B = n / N . d m i nwhere N is the num ber of points in the data set .I t i s c lear that small values of XB are expected for
compact and wel l -separated clus ters . We note, however,
tha t XB i s monotonica l ly decreas ing when the nu mber
of clus ters n, gets very large and close to n. O ne way toel iminate this decreas ing tendency of the index is tode te rmine a s t a rt ing poin t , c . . . o f the mo noto ny
behaviour and to s ea rch for the m inimum va lue of XBin the range [2, cm=]. Mo reove r, the values o f the inde x
XB depend o n the fuzz if i er va lues, so as i f m~ o0 then
XB'-~o0.An othe r index o f this category is the Fukqyama-
Sugeno index, which is defined as
i=1 j=l
where v is the mea n ve ctor o f X and A is an lxl pos i t ivedefini te , symmetric matrix. When A=I, the abovedis tance bec omes the Eucfide an dis tance. I t i s c lear thatfor com pact an d wel l -separated clus ters we expect smallvalues for FSm. Th e f i rs t term in brackets measures thecompactness of the clus ters while the second one
measures the dis tances of the clus ters representat ives .Oth er fuzzy val idi ty indices are pr opo sed in [6] ,
which a re based on the concept s of hypervolume anddensity. Let Z i the fuzzy covariance matrix of the j - th
clus ter defined as
E : u ~ ( x , - v , ~ x , - v j ) r (22)
~ j = N m
Ei=I I . /~
Th e fuz zy hyper volumeof j - th clus ter is given by equat ion:
V j = Ixj l * /z
where I ZJ l is the determ inant o f £j and is a measure of
clus ter compactness .T h e n t h e total fuz z y hyper volume is given by the
equat ionnc
FH = Z V, (23)
Small values of FH indicate the exis tence of compact
clusters.
T h e average partition density is also an index of thiscategory. I t can be defined as
n¢
1~ - , S j (24)
eA=.oT h e n Sj = Zx~ Xj u•, where X i is the set o f data points
that are within a pre- speeified region arou nd v i (i.e., thecenter of c lus ter j) , i s cal led the sum o f the central
mem bers o f the clus ter j .
2 4 S I G M O D R e c o r d , V o l. 3 1 , N o . 3 , S e p t e m b e r 2 0 0 2

5/14/2018 2002 Hakidi Cluster Validity Methods Part II - slidepdf.com
http://slidepdf.com/reader/full/2002-hakidi-cluster-validity-methods-part-ii 7/9
0 20 4O
(a) DataSetl
Figure 1.Datasets
£~ 80
50 70 90 110 150 150 17 0 190 210 250 250
(b) DataSet2
1400
I ~ 0
I ~ 0
6 ~
4 ~
2 ~
0
20 0 4OO
(c) DataSet3
600 800
Table 1. Optimal nu mbe r of clusters proposed by validi ty indices
DataSet l I DataSet2 I DataSet3 I N d S e tO p t i m a l n u m b e r o f clusters
R S, R M SST D 3 2 5 3
DB 6 3 7 3
SD 4 3 6 3
S_D bw 4 2 7 3
A different measure is the partition density index tdef ined as
P D = S / F H ( 2 5 )
where S= E ; : S i .
A few other indices are proposed and discussed in [11,13].
2 .3 O t h e r ap p r o ach es f o r c l u s t e r v a l i d i t yAnoth er approach for f inding the best number ofcluster of a data set was prop osed in [17] . I t introducesa practical clustering algorithm based on Monte Carlo
cross-validation. More specifically, the algorithmconsists of M cross-validation runs over M chosentrain/ test par t i t ions of a data set , D. For each par t i t ion
u, the EM algorithm is used to define nc clusters to thetraining data, while nc is varied from 1 to c .. . The n, thelog-likelihood Lu(D) is calculated for each model withn¢ clusters. I t is defin ed usin g the probability densityfunction of the data as
Lk(D) = E, :, l og f , ( x , / ¢ , )(26)
where f i is the probabil i ty density function for the data
and Oh denotes parameters that have been est imatedfrom data. This is repeated M times and the M cross-validated estimates are averaged for each n,. Based on
these est imates we may def ine the poster ior
probabil it ies for each value o f the n umb er o f clusters nop(nc/D) . I f one of p(nc/D) is near 1 , there is s trongevidence that the par t icular number of dusters is thebest for ou r data set .
The evaluation approach proposed in [171 is basedon density functions considered for the data set . Thus,it is based on concepts related to probabilistic models inorder to est imate the num ber of clusters, bet ter f i tt ing a
data set, and it does not use concepts directly related tothe data, (i.e., inter-cluster and intra-clusters distances).
3 . A N E X P E R I M E N T A L S T U D Y
In this section we present a comparative exper imentalevaluation of the importa nt validity measures, aiming atillustrating their advantages and disadvantages.
We conside r relative validity indices prop osed in the
literature, such as RS-RM SSTD [16], DB [18] and th emos t recent ones SD [8] , and S_Dbw[10]. T he
defirfitions of these validity indices can be found inSection2.1. Fo r our study, we used four synthetic two-
dimensional data sets fur ther referred to as DataSetl ,DataSet2, DataSet3 (see Figure la-c) and a six-dimensional dataset N d S e t containing three clusters .
Table 1 summa rizes the results of the validity indices
(RS, RMSSDT, DB, SD and S_Dbw), for dif ferentcluster ing schemes of the above-mentioned data sets asresulting from a clustering algorithm. For our study, weuse the results of the algorithms K-Means[12] and
CURE[7] with their input value (number of clusters)ranging between 2 and 8. Indices RS, R.MSSTD proposethe par t i t ioning of DataSetl into three clusters whileDB selects six clusters as the best partitioning. On the
other hand, SD and S Dbw select four clusters as thebest par t i t ioning for DataS etl , wh ich is also the correct
number of clusters f i t t ing the under lying data.
Moreover , the indices S_Dbw and DB select the correctnum ber o f clusters(i.e., seven) as the optima lpar t i t ioning for DataSet3 while RS, RMSSTD and SD
select the clustering scheme of five and six clustersrespectively. Also, all indices propose three clusters asthe best par t i t ioning for Nd Set . In the case ofDataSet2, DB and SD select three clusters as theoptimal scheme, while RS-RMSSDT and S_Dbw select
S I G M O D R e c o r d , V o l. 3 1, N o . 3 , S e p t e m b e r 2 0 02 2 5

5/14/2018 2002 Hakidi Cluster Validity Methods Part II - slidepdf.com
http://slidepdf.com/reader/full/2002-hakidi-cluster-validity-methods-part-ii 8/9
two clusters (i.e., the correct number of clusters fittingthe data set).
Here, we have to men tion tha t a validi ty index is not
a clustering algorithm itself but a measure to evaluate theresults of clustering algorithms and gives an indication
of a partitioning that best fits a data set. The semanticsof clustering is not a totally resolved issue and
depending on the applicat ion domain we may considerdifferent aspects as more significant. For instance, for a
specif ic applicat ion i t may be important to have wellseparated clusters while for another to consider morethe compacmess of the clusters . In the case of S_Dbw,the relat ive importance of the two terms on which the
index def ini t ion is based can be adjusted. Having anindication of a good par t i t ioning as proposed by theindex, the domain exper ts may analyse fur ther thevalidation procedure results . Thus, they could select
some of the par t i t ioning schemes proposed by S_Dbw,and select the one better f i t t ing their demands for cr isp
or over lapping clusters . For instance DataSet2 can beconsidered as having three clusters with two of themslighdy overlapping or having two well-separated
clusters. In this case we ob serve th at S D bw values fortwo an d three clusters are no t significandy differe nt(0.311, 0.324 respectively). This is an indication that wemay select ei ther of the two par t i t ioning schemesdepending on the cluster ing interpretat ion. Then, wecompare the values of Scat and Dens bw terms for the
cases of two and three clusters . We observe that the twoclusters scheme corresponds to well-separated clusters(Dens_bw(2)= 0.0976 < Dens_bw(3)= 0.2154) while
the three-clusters scheme contains more compactclusters (Scat(2)= 0.21409 > Sca t(3)= 0.1089).
4. C O N C L U S I O N S A N D T R E N D S INC L U S T E R I N G V A L I D IT Y
Cluster validi ty checking is one of the m ost importan tissues in cluster analysis related to the inherent features
of the data set under concern. I t aims at the evaluationof cluster ing results and the select ion of the scheme tha t
best fits the unde rlying data.The major i ty of algor i thms are based on cer tain
criteria in order to define the clusters in which a data setcan be partitioned. Since clustering is an unsupervisedme thod and there is no a-pr ior i indication for the actual
number of clusters presented in a data set, there is aneed of some kind of cluster ing results validation. Wepresented a survey of the most known validi ty cr i ter ia
available in literature, classified in three categories:external, internal, and relative. Moreover, we discussed
some representative validity indices o f these criteriaalong with a sample experimenta l evaluation.
As we discussed earlier the validity assessmentapproaches works better when the clusters are mosdycompact . However , there are a number of applicat ionswhere we have to handle arbitrarily shaped clusters (e.g.spatial data, medicine, biology). In this case the
traditional validity criteria (variance, density a nd itscontinuity, separauon) are no t any mo re suff icient .
There is a need for developing quali ty measures tha tassess the quality of the par t i t ioning taking into a ccou nti. intra-cluster quality, ii. inter-cluster separation and iii.
geometry of the clusters , using sets of representat ivepoints , or even mult idimensional curves rather tha n asingle representative point.
Another challenge is the def ini t ion of an integrated
quali ty assessment model for data mining results . Thefundamental concepts and cr i ter ia for a global datamining validi ty checking process have to be introducedand integrated to def ine a quali ty model. Th is will
contr ibute to more eff icient usage of data miningtechniques for the extraction of valid , interest ing, andexploitable patterns o f knowledge.
A C K N O W L E D G E M E N T S
This work was suppor ted by the G eneral Secretar iat forResearch and Technology th rough the PE NE D ("99E&85") project . We thank C. Amanatidis for hissuggestions and his help in the exper imental s tudy.
Also, we are grateful to C. Rodopoulos for theimplementat ion of CURE algor i thm as well as to DrEui-Hong (Sam) Han for providing information and
the source code for CUR E algor i thm.
R E F E R E N C E S
[1] Michael J . A. Berry, G ordo n Lin off . Data MiningTechniques For m arketing Sal es and C ustomer Support.
Joh n Willey & Sons, Inc, 1996.
[2] Bezdeck, J .C, Ehr l ich, R., Full , W.. "FC M:F uzzy C-Means Algor i thm", Computers and Geosdence, 1984.
[3] Dave, R. N .. "Validating fuzzy par ti t ions obtainedthrough c-shells clustering", Pattern Recognition Letters,
Vol .17, pp613-623, 1996.
[4] Davies, DL , Bouldin, D.W. "A cluster separat ionmeasure" . I E E E Transactions on Pattern Analys is andMachine Intelligence,Vol. 1, No2, 1979.
[5] Dun n, J . C .. "Well separated clusters and optimal
fuzzy pardtions ",J . Cybern.Vol.4, pp. 95-104, 1974.
[6] Gat h I . , Geva A.B. "Unsupervise d optimal fuzzyclustering", 1E EE Transactions on Pattern Ana ~sis andMachine Intdligence Vol. 11(7), 1989.
[7] Guha, S. , Rastogi , R., Shim K. (1998) . "CURE: AnEf f ic ien t Clus ter ing Algor i thm for LargeDatabases" , Publish ed in the Proceedings of the
ACM SIGMOD Conference .[8] Halkidi, M., Vazirgiannis, M., Badstakis, I .. "Quality
scheme assessment in the cluster ing process",Proceedings of P KD D, Lyon , France, 2000.
[9] Halkidi M, V azirgiannis M., " A da ta set orien tedapproach for cluster ing algor i thm selection",Proceedings ofP KD D, Freiburg, G ermany , 2001
[10] M. Halkidi, M. Vazirgiannis, "Clus tering ValidityAssessment: Finding the optimal par t i t ioning of a
26SI GM OD Record, Vol. 31, No. 3, Septe mber 2002
5/14/2018 2002 Hakidi Cluster Validity Methods Part II - slidepdf.com
http://slidepdf.com/reader/full/2002-hakidi-cluster-validity-methods-part-ii 9/9
data set'', to appear in the Proceedings of ICDM ,California, USA, November 2001.
[11] Krishnapuram, R., Frigui, H., Nasraoui. O."Quadratic shell clustering algorithms and thedetection of second-degree curves", Pattern
RecognitionLetters, Vol. 14(7), 1993[12] MaeQueen, J.B (1967). "Some Methods for
Classification and Analysis of MultivariateObservations", In Proceedings of 5th BerkleySymposium on Mathematical Statistics andProbability, Volume I: Statistics, pp281-297.
[13] Milligan, G.W. a nd Coo per, M.C.. "AnExamination of Procedures for Determining theNumber of Clusters in a Data Set", Pfychometrika,Vol.50, pp 159-179, 1985.
[14] Pal, N.R., Biswas, J.. "Clus ter Validation usinggraph theoretic concepts". Pa#em Recognition, Vol.30(6), 1997.
[15] Rezaee, R, Lelieveldt, B.P.F., Reiber, J.H .C. "Anew cluster validity index for the fuzzy c-mean",Pattern RecognitlbnLetters, 19, pp. 237-246, 1998.
[16] Sharma, S.C.. Applied Multivariate Techniques.JohnWillwy & Sons, 1996.
[17] Smyth, P. "Clustering using Mo nte Carlo Cross-Validation". Proceedingsof KD D Confirence,1996.
[18] Theodoridis, S., Ko utroubas , K.. Patternrecognition,Academic Press, 1999.
[19] Xie, X. L, Beni, G.. "A Validity measu re forFuzzy Clustering", IE E E Transactions on PatternAna~sis and machine ntelligence,Vol.13, No4, 1991.
S I G M O D R e c o r d , V o l . 3 1 , N o . 3 , S e p t e m b e r 2 0 0 2 27