2002 - u.s. geological survey publications warehouse · chemical analysis and modes of ......
TRANSCRIPT

Chemical analysis and modes of occurrence of selected trace elements in a coal sample from eastern Kentucky coal bed: White Creek Mine, Martin County, Kentucky
By, Curtis A. Palmer1 , Kristen O. Dennen1 , Allan Kolker1 , Robert B. Finkelman1 , and John H. Bullock, Jr.2
Open-File Report 02-311
2002
Final Technical ReportCRADA AgreementCRADA No. OT8562W with CQ Inc."Prediction of Trace Element Removal from Coal"
This report is preliminary and has not been reviewed for conformity with U.S. Geological Survey editorial standards and stratigraphic nomenclature. Any use of trade names is for descriptive purposes only, and does not imply endorsement by the U.S. Government
U.S. Department of the Interior
U.S. Geological Survey
'U.S. Geological Survey, 956 National Center, Reston, VA 201922U.S. Geological Survey, Denver Federal Center MS 973, Denver, CO 80225
Chemical analysis and modes of occurrence of selected trace elements in a coal sample from eastern Kentucky coal bed: White Creek Mine, Martin County, Kentucky
Curtis A. Palmer, Kris Dennen, Allan Kolker, Robert F. Finkelman, and John I 1 . Bullock, Jr.
"This report was prepared as an account of work sponsored by an agency of the United
States Government. Neither the United States Government nor any agency thereof, nor
any of their employees, makes any warranty, expressed or implied, or assumes any legal
liability or responsibility for the accuracy, completeness, or usefulness of any information,
apparatus, product, or process disclosed, or represents that its use would not infringe
upon privately owned rights. Reference herein to any specific commercial product,
process, or service by trade name, trademark, manufacturer, or otherwise do^s not
necessarily constitute or imply its endorsement, recommendation, or favoring by the
United States Government or any agency thereof. The views and opinions of authors
expressed herein do not necessarily state or reflect those of the United States
Government or any agency thereof."
Table of Contents
Abstract............................................................................................................................ 1Introduction....................................................................................................................... 1
Methods...........................................................................................................................^Sequential leaching .....................................................................................................2Scanning electron microscope (SEM) and electron microprobe analysis.................... 3
1 - Coal pellet casting and polishing......................................................................... 32-SEM analysis....................................................................................................... 33 - Electron microprobe analysis .............................................................................. 4
X-ray diffraction analysis.............................................................................................. 4Results and Discussion ....................................................................................................4
SEM and microprobe analysis.....................................................................................41 - SEM analysis of raw coal.................................................................................. 42 - SEM analysis of leached residue..................................................................... 53-Microprobedata............................................................................................... 5
Semi-quantitative mineralogy of low-temperature ash.................................................9Elemental analysis-quality control............................................................................. 10Leaching experiments................................................................................................ 12Semi-quantitative modes of occurrence..................................................................... 20
Conclusions.................................................................................................................... 20
References..................................................................................................................... 24
Appendices
1 Chemical Symbols, mineral names and abbreviations.............................................. 27
2. Quantitative microprobe analyses .............................................................................. 30
3. Data for individual splits.............................................................................................. 34
4. Quality control data..................................................................................................... 38

Abstract
This report provides semi-quantitative data on modes of occurrence of 20 elements in a sample collected from an eastern Kentucky coal from the White Creek Mine, Martin County, Kentucky. The data are in support of the project "Prediction of Trace Element Removal from Coal" -a Cooperative Research and Development Agreement (CRADA) with CQ Inc. The purpose of this CRADA is to apply modes of occurrence information to coal cleaning procedures, specifically a low sulfur central Appalachian coal for this study. Techniques used in this study include sequential selective leaching procedures, scanning electron microscopy, X-ray diffraction analysis, and electron microprobe analysis. Selective leaching results indicate that greate' than 50 percent of the elements Ca, Cd, Mn, Pb, and Zn are associated with HOI- or ammonium acetate-soluble carbonates, iron oxides, or monosulfides; greater than 40 percent of the Al, Be and Cr are associated with HF-soluble silicates; greater than 40 percent of the Co, Cu, Ni, Se, Sb, Th and U are associated with HCI, HF and HNO3 acid-insoluble phases and/or organic matter; and greater than 50 percent of the t- s and Hg is associated with HNCb-soluble pyrite. Due to the high clay content and relatively low pyrite content in this sample, 35 percent of the Fe was associated with th^ HF- soluble silicates while only 25 percent was associated with the pyrite. Thirty-five percent of the Ba is associated with the HF-soluble silicates whereas 40 percent of the B3 was associated with HCI-soluble (and ammonium acetate-soluble) barite. Thirty-five percent of the Mo was associated with the HF soluble clays. The major minerals present in this sample are quartz, kaolinite, and illite, as indicated by scanning electron microscopy and confirmed by X-ray diffraction analysis. The chalcophile elements As, Se, Cu, Ni, Zn, and Cd in most pyrite grains are at or below the detection limit of about 1C 0-200 ppm based on electron microprobe analysis, but two pyrite grains locally showed As concentrations of greater than one weight percent. One of these grains also had over a weight percent of each of the following elements: Co, Cu, Ni, and Se. Lead and Cu were also higher in this grain than in any other grains measured.
The results of this project should aid in the development of models for predicting the response of potentially toxic trace elements in commercial coal cleaning procedures.
Introduction
The United States Geological Survey (USGS) 1 is collaborating with CQ Inc. a coal research laboratory in Homer City Pennsylvania, to better understand how modes of occurrence of elements in coal affect partitioning of elements during physical cc^l cleaning. Previous work (Raleigh and others, 1998; Palmer and others, 1997, 19S3, 2000) describes semi-quantitative methods for determining modes of occurrence of elements in coal or coal-cleaning separates. The eventual goal of this collaborative project is to develop models for predicting the removal efficiency of potentially toxb trace elements from a variety of coals from different US coal basins during commercial coal cleaning operations. Herein, we report on the modes of occurrence of 20 elements in a sample collected from an eastern Kentucky coal bed from the Addington Energy Inc
1 A complete listing of the many abbreviations, chemical symbols, and mineral names used througt out this paper of the is given in Appendix 1.

(AEI)'s White Creek mine in Martin County, in the central Appalachian Basin. Th: "=? coal sample is believed to be a run of mine Broaz Seam coal shipped by barge and collected by personnel at Tennessee Valley Authority's Widow's Creek Fossil Plant barge unloading facilities.
The overall goal of this project is to assess the technical and economic potential for using the most promising advanced coal cleaning technologies to reduce emissions of mercury and other hazardous air pollutants (HAPs) when coal is burned. The objectives included: (1) obtaining semi-quantitative information on trace element modes of occurrence in the sample; and (2) assembling the information in a form that can be used by industry to enhance the potential of coal cleaning technologies for reduc:ng hazardous air pollutants (HAPs). Previous work funded by EPRI and DOE concentrated on understanding the effectiveness of removing Hg and other HAPs-forming elenents from bituminous coal feedstocks that are currently being cleaned (Northern Appalachian Basin, the Southern Appalachian basin, the Illinois basin) (Palmer and others, 1£97a) and the Powder River basin subbituminous coal that is not currently being cleaned. These previous studies included samples of feed stock coal, coal from various coal- cleaning streams and simulated cleaned coal.. This previous work indicated that the success of using physical coal cleaning techniques to reduce the potential HAP'? emissions was highly dependent on: 1) understanding the modes of occurrence of trace elements in coal including what minerals are present and what trace elements are associated with these minerals and applying appropriate cleaning procedures; 2) liberatation of discrete particles of trace element-bearing mineral matter includinp mineral size and associations; and 3) type, amount, and level of intensity of physical treatment. This paper provides data on the modes of occurrence of 20 element?, including all those considered as potential HAPs. This data will be used to develop models to determine the most effective coal cleaning procedures for specific
Methods
Sequential LeachingThe sequential selective leaching procedure used in this study is similar to that
described by Palmer and others (1993), which was modified from that of Finkelrr^n and others (1990). Duplicate 5 g samples were sequentially leached with 35 ml each of 1N ammonium acetate (CH3COONH4), 3N hydrochloric acid (HCI), concentrated hydrofluoric acid (HF; 48 percent), and 2N (1:7) nitric acid (HNOs). Ammonium rcetate removes elements bonded onto exchangeable sites, water-soluble compounds, and some carbonates. HCI dissolves carbonates, iron oxides, monosulfides and sorm chelated organic compounds. HF solublizes silicates, and nitric acid dissolves disulfides, especially pyrite. For the first three leaching stages (CH3COONH4, HCI, and HF), each sample was shaken in conical bottom 50 ml polypropylene tubes for 18 hours on a Burrell2 wrist action shaker. Because of gas formation during some of the leaching steps, it is necessary to enclose each tube in double polyethylene bags each
2Use of trade names and trademarks in this publication is for descriptive purposes only &nd does not constitute endorsement by the U. S. Geological Survey: !
' ' Vi< , ! ' ' ' (.-:
2
closed with plastic coated wire straps. The bags allow gas to escape, but prevent the release of liquid. The HNO3 leach was carried out in an Erlenmeyer flask similar to the method for the determination of pyritic sulfur (ASTM, 2001 a). We have found that this "flask method" is more effective at dissolving pyrite than shaking in tubes, because the partially demineralized coal resulting from the first three leaches has a very low density and forms a protective layer of sediment above the pyrite concentrated at the bottom of the conical tubes. Approximately 0.5 g of residual solid was removed from each t ibe for instrumental neutron activation analysis (INAA) and cold vapor atomic absorption analysis (CVAA) for mercury. Leachate solutions were saved for analyzed by inductively coupled argon plasma-atomic emission spectrometry (ICP-AES) and inductively coupled argon plasma-mass spectrometry (ICP-MS).
Scanning Electron Microscope (SEM) and Microprobe Analysis
1 - Coal pellet casting and polishing
The pellet formation procedure follows the ASTM D2797-85 (ASTM, 2001 b) technique for anthracite and bituminous coal, as modified by Pontolillo and Stanton (1994). The casting procedure impregnates, under pressure, approximately 7-8 g of 20 (850|xm) or 60 mesh (250|xm) crushed sample with Armstrong C4 epoxy. The resultant mold is cured overnight at 60E C. The 2.5 cm diameter circular pellet block is grc'ind and polished using ASTM D2797-85 procedure (ASTM, 2001 b) as modified by Pontolillo and Stanton (1994). The epoxy-coal pellet is first ground with a 15-jxm -diamond platen and then 600-grit SiC paper until flat and smooth. Rough polishing is done with 1 jam alumina and final polishing is completed with 0.06-jam-colloidal silica.
2 - SEM analysis.
A JEOL-840 scanning electron microscope (SEM) equipped with a Princetcn Gamma-Tech, energy-dispersive X-ray analytical system (EDX) and/or an ETEC Autoscan SEM with a Kevex EDX, was used for SEM examination of the coal. Mineral identifications inferred from morphology, and major-element composition of grains. Both secondary electron imaging (SEI) and backscattered electron imaging (BSE) modes were used in coal characterization. The BSE mode is especially sensitive to variation in mean atomic number and is useful for determining within-grain compositional variation. By optimizing the BSE image, the presence of trace phases containing elements with high-atomic number can be revealed. Samples were scanned initially to obtain an overall view of the phases present. This was followed by a series of overlapping traverses in which the relative abundance of the phases was assessed. EDX analysis provides information on elements having concentrations at roughly the tenth-of-percent level or greater. Typically, operating conditions for SEM analysis are: accelerating potential of 10-30 kV, magnifications of ~50-> 10,000 times and working distances ranging from 15 to 20 mm (ETEC Autoscan) and 15, 25, or 39 mm (JEC 1..- 840). The advantage of the conventional SEM methods over automated, computer- controlled SEM is that the operator can select appropriate phases for analysis by EDX

and can apply instantaneous interpretation of the textural relations of the phases being analyzed.
3 - Electron microprobe analysis.A fully-automated, 5 spectrometer microprobe instrument (JEOL JXA 8900R
Superprobe) was used to quantitatively determine element concentrations in pyrite by the wavelength-dispersive technique. In our preliminary microprobe analysis of pyrite the following elements were measured: Fe, S, As, Ni, Cu, Zn, Se, and Co. Natural and synthetic standards were used. A beam current used of 3.0 xlCT8 amps and a voltage of 20 KeV was used in the determinations. The probe diameter was set as a focused beam; the actual working diameter was about 3 micrometers. In this study, the minimum detection limit for microprobe analysis of trace elements was about 100 ppm, using counting times of 60 seconds for peak and 30 seconds for upper and lowe~ background. Counting statistics have a large uncertainty as the detection limit is approached. For Co (only), the detection limit is about 700 ppm (0.07 weight percent) due to an interference with Fe giving a constant background in pyrite of 700-800 ppm. Results for Co shown in Appendix 2 are background-corrected. Microprobe data are shown in Appendix 2.
X-Ray Diffraction AnalysisTo obtain semi-quantitative information on the minerals present in the coal a split
of the sample was low-temperature (<200° C) ashed. Duplicate samples of low- temperature ash were pressed into pellets and analyzed using an automated X-ray diffractometer. Diffraction of Cu Ka X-rays was measured over the interval from 4° to 60° 20. Counts were collected for 0.5 seconds per step (0.02 degrees). The dat^ were processed using a computer program for semi-quantitative mineral analysis by X-ray diffraction (Hosterman and Dulong, 1985).
Results and Discussion
SEM and Microprobe Analysis
1- SEM Analysis of Raw Coal
SEM analyses show that the major minerals in the eastern Kentucky coal (kaolinite, illrte, and quartz) were generally present as large quartz/clay intergrowths in some cases more than 100 microns in their largest dimension (Table 1). Subhedral and frambodial pyrite, including some particles larger than 10 microns and calcite were present, but not very abundant. A crandelrte group mineral (goyazite?; see appendix 1) was commonly observed, but Fe oxide and barite rare. In addition, rutile or anatese (grains analyzed as Ti only) was found in the raw coal as micron to several micron-sized particles commonly in quartz/clay intergrowths.

2- S
EM
Ana
lysi
s of
Lea
ched
Res
idue
Tw
o hu
ndre
d an
d si
x (2
06)
min
eral
gra
ins
wer
e an
alyz
ed b
y S
EM
. T
hese
gra
ins
rang
ed i
n si
ze fr
om l
ess
than
a
mic
ron
to 1
0 m
icro
ns in
the
lea
ched
res
idue
(m
ater
ial r
emai
ning
afte
r se
quen
tial l
each
ing)
. In
ord
er to
est
imat
e th
e pe
rcen
t of
resi
dual
min
eral
s pr
esen
t, th
e ar
ea o
f the
min
eral
gra
ins
wer
e es
timat
ed b
y as
sum
ing
eith
er a
rec
tang
ular
or
circ
ular
sha
pe.
Thi
s an
alys
is s
how
ed t
hat t
he c
ompo
sitio
n of
85
perc
ent
of th
e m
iner
al g
rain
s an
alyz
ed,
repr
esen
ting
abou
t tw
o th
irds
of th
e to
tal a
rea
of th
ese
min
eral
gra
ins,
wer
e Ti
C>2.
F
igur
e 1
show
s an
are
a of
unu
sual
ly h
igh
conc
entr
atio
n of
min
eral
mat
ter
in o
ne o
f the
lea
ched
res
idue
pel
lets
. E
xcep
t for
two
zirc
on g
rain
s, a
ll pa
rtic
les
on f
igur
e 1
b w
ere
TiO
2 gr
ains
. M
ost o
f the
se w
ere
elon
gate
d gr
ains
, ty
pica
l of
rut
ile.
Bot
h ru
tile
and
zirc
on a
re r
esis
tant
tot
the
leac
hing
pro
cess
. G
ener
ally
, as
can
be
seen
in f
igur
e 1a
the
re is
ver
y lit
tle m
iner
al m
atte
r pr
esen
t in
the
res
idua
l sam
ple.
Fou
r pe
rcen
t of t
he p
artic
les
exam
ined
, ra
ngin
g in
siz
e fr
om s
ub-m
icro
n to
10
mic
rons
(re
pres
entin
g 26
per
cent
of
the
area
) w
ere
pyrit
e co
mpl
etel
y en
caps
ulat
ed b
y or
gani
c m
ater
ial.
In a
dditi
on,
3 pe
rcen
t of t
he p
artic
les
foun
d in
coa
l af
ter
leac
hing
wer
e ch
alco
pyrit
e bu
t all
thes
e pa
rtic
les
wer
e le
ss t
han
2 m
icro
ns in
siz
e an
d re
pres
ente
d on
ly 2
per
cent
of
the
tota
l are
a.
Tra
ce a
mou
nts
of il
lite,
kao
linite
, qu
artz
and
goy
azite
wer
e al
so f
ound
to
be c
ompl
etel
y en
caps
ulat
ed i
n th
e co
al m
atrix
rep
rese
ntin
g th
e re
mai
ning
8
perc
ent o
f the
par
ticle
s an
d 5
perc
ent
of th
e to
tal
min
eral
are
a. E
xcep
t go
yazi
te,
thes
e m
iner
als
are
less
den
se t
han
pyrit
e an
d ru
tile
so th
at th
ey r
epre
sent
eve
n a
smal
ler
perc
enta
ge o
f the
tot
al
min
eral
mat
ter
by w
eigh
t tha
n th
eir
area
sug
gest
s.
3 -M
icro
prob
e D
ata
Mic
ropr
obe
data
for
26
pyrit
e gr
ains
in c
oal s
ampl
e ar
e gi
ven
in A
ppen
dix
2. T
wo
to s
ix d
iffer
ent
poin
ts o
n ea
ch
grai
n w
ere
anal
yzed
. T
he a
vera
ge c
once
ntra
tion
of F
e w
as 4
7 ±
1.4
wei
ght
perc
ent a
nd t
he a
vera
ge w
as 5
3 ±
1.2
wei
ght
perc
ent f
or S
; re
sults
exp
ress
ed o
n an
ato
mic
bas
is g
ive
acce
ptab
le s
oich
iom
etry
for
Fe$2
. C
d is
bel
ow th
e de
tect
ion
limit
for
all a
naly
ses
and
is n
ot s
how
n in
App
endi
x 2.
Zn
is c
onsi
sten
tly le
ss th
an 0
.02
wei
ght
perc
ent f
or a
ll an
alys
es.
The
ot
her
six
elem
ents
(A
s, C
o, C
u, N
i, P
b an
d S
e) s
how
mor
e va
riabi
lity
but
in g
ener
al a
re l
ess
than
0.1
wei
ght
perc
ent.
For
two
pyrit
e gr
ains
, A
s co
ncen
trat
ions
for
one
or m
ore
poin
ts w
ere
one
wei
ght
perc
ent
or h
ighe
r. G
rain
16
(App
endi
x 2)
was
sig
nific
antly
enr
iche
d in
sev
eral
trac
e el
emen
ts.
In a
dditi
on,
As,
Ni,
Se,
and
Co
wer
e al
l fou
nd t
o ha
ve
conc
entr
atio
ns o
f on
e w
eigh
t pe
rcen
t or
mor
e in
spo
t ana
lyse
s.
Pb
conc
entr
atio
ns w
ere
as h
igh
as 0
.48
perc
ent a
nd C
u co
ncen
trat
ions
wer
e 0.
15-0
.18
wei
ght
perc
ent.
Con
cent
ratio
n m
aps
of th
is g
rain
as
wel
l as
the
back
scat
tere
d el
ectr
on
imag
e ar
e sh
own
in f
igur
e 2.
In
bac
ksca
tter
mod
e (fi
g. 2
d) t
he g
rain
loo
ks li
ke a
hal
f of a
fra
mbo
id a
nd i
s cl
early
zon
ed.
Thi
s zo
ning
is a
lso
evid
ent
in t
he e
lem
enta
l m
aps
gene
rate
d fo
r S
e (fi
g. 2
a),
Ni (
fig.
2b)
and
As
(fig.
2c)
alth
ough
the
are
as
of h
ighe
st c
once
ntra
tion
are
diffe
rent
for
each
ele
men
t. H
owev
er,
the
elem
enta
l m
aps
show
the
entir
e fo
rm o
f the
fr
ambo
id,
indi
catin
g th
^st t
he r
emai
ning
por
tion
of th
e fr
srnb
oid
lies
just
be!
o»v
the
surf
ace.
T
hs w
sato
r ba
cksc
atto
r el
ectr
ons
cann
ot p
enet
rate
the
surf
ace
and
ther
efor
e do
not
pro
duce
an
imag
e.
The
str
onge
r x-
rays
use
d to
gen
erat
e th
e el
emen
tal
map
s pe
netr
ate
the
surf
ace
but
are
atte
nuat
ed p
rodu
cing
an
imag
e w
ith a
n ap
pare
nt lo
wer
con
cent
ratio
n fo
r

each of the elements in the upper right hand corner of figures 2a-c w
here the backscatter image of the fram
boid is m
issing.
Table 1. P
hases found in the coal sample and the leached residue using S
EM
analysis
Phases
Quartz
IlliteK
aoliniteFe oxide phase (hem
atite?)P
yriteC
halcopyriteC
alciteB
ariteTi oxide phase (rutile?)Z
irconC
randellite
Raw
Coal
-60 mesh
MMMmmmmmm
Residual
- 60 mesh
mmmmmMmm
M = M
ajor phase (estimated to be
greater than 10 percent of mineral grains
present in the sample)
m = M
inor or trace phase (estim
ated tobe less than 10 percent of the m
ineralgrains present in the sam
ple)blank =none detected

Figure 1. a) SEM micrograph of a coal particle with an unusually high concentration of sub- mircon mineral grains in a relatively small area, b) shows that most particles are elongated rutile (TiO2) grains. The rounded particles are either rutile grains in cross section or anatase (also TiO2 identified by XRD, Table 2) except for two rounded particles labeled as zircon.
Grain 22 (Appendix 2) also showed high As (1.72 weight percent) for one electron mcroprobe analysis point whereas a second point showed an As concentration of only 0.09 weight percent. For this grain, As showed a significant enrichment, so only its elemental map and the corresponding backscattered electron image are shown in figure 3. One area of the grain is clearly high in arsenic whereas the other areas are much lower in concentration. This As-rich zonation appears on the backscattered electron image as a brighter patch in the lower right portion of the grain.
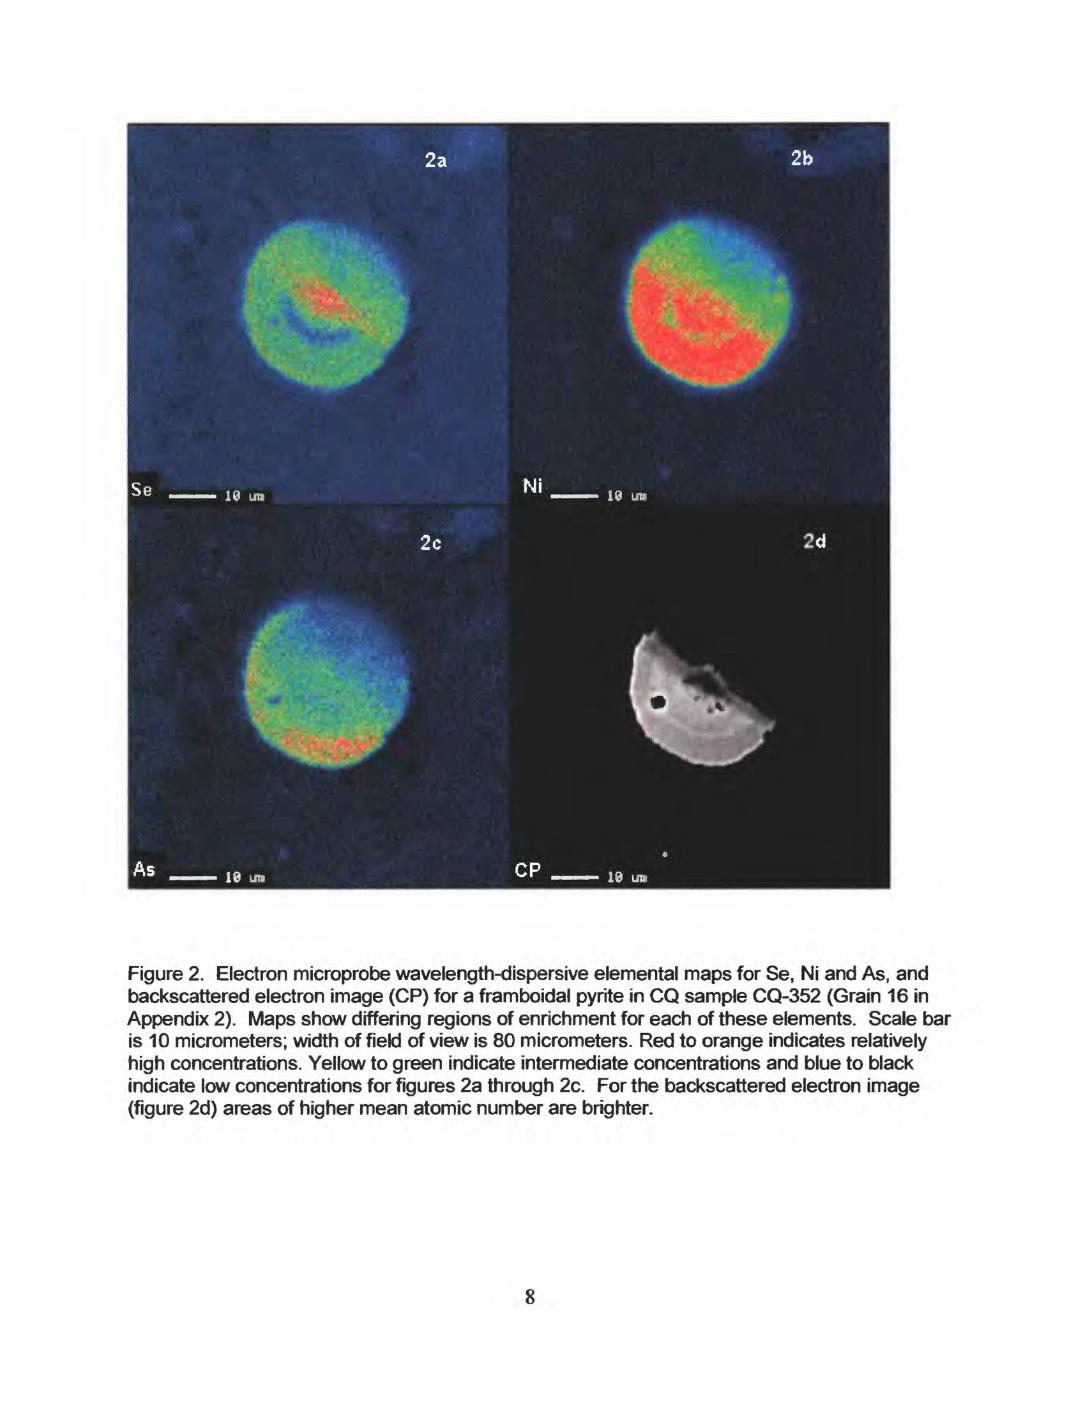
Figure 2. Electron microprobe wavelength-dispersive elemental maps for Se, Ni and As, and backscattered electron image (CP) for a framboidal pyrite in CQ sample CQ-352 (Grain 16 in Appendix 2). Maps show differing regions of enrichment for each of these elements. Scale bar is 10 micrometers; width of field of view is 80 micrometers. Red to orange indicates relatively high concentrations. Yellow to green indicate intermediate concentrations and blue to black indicate low concentrations for figures 2a through 2c. For the backscattered electron image (figure 2d) areas of higher mean atomic number are brighter.

Figure 3. Electron microprobe wavelength-dispersive elemental map for As (3a), and backscattered electron image (CP; 3b) for a subhedral pyrite in CQ sample CQ-352 (Grain 22 in Appendix 2). Arsenic-rich zone corresponds to brighter areas of the backscattered image. Scale bar is 10 micrometers; width of field of view is 100 micrometers.
Semi-Quantitative Mineralogy of Low-Temperature Ash
Table 2 gives semi-quantitative estimates of mineralogy based on X-ray diffraction analysis (XRD) of low-temperature ash (LTA) of duplicate samples of the eastern Kentucky coal sample. About 55 to 60 percent of each LTA sample consists of kaolinite, 15-20 percent of each sample is composed of illite and 15 percent, quartz. Bassanite (CaSO4 V2H2O), likely an artifact of the ashing process, constitutes < 5 percent of the LTA and may be formed from calcite (which was detected by SEM but not by XRD) reacting with organic sulfur in the sample. Siderite, hematite, sphalerite, and pyrite, were detected as trace phases (<5 percent) by XRD. Of these minerals, sphalerite, pyrite and an iron oxide (hematite?) were also detected by SEM. Both rutile and anatase (TiO2) were detected by XRD. Anatase was only detected in one of the duplicate samples, but was detected at the 5 to 10 percent level, whereas rutile was found to be less than 5 percent in both of the duplicate samples. The relatively high percentage of anatase found in one duplicate sample and the non detection of anatase in the other duplicate sample suggests that anatase is not homogeneously distributed in the original coal sample.

Table 2. Semi-quantitative determination of minerals by X-ray diffraction (XPD) of low-temperature ash (LTA; values in weight percent on an LTA basis)
Sample KOL ILL QTZ PY SIP RUT ANA HEM SPH BAS BOE CHL FLD APADuplicate analysis
CQ353A1 60 20 15 <5 <:5 <5 <5<5<5 ? <5 CQ352B2 55 15 15 < 5 < 5 <5 >5<10 <5 <5<5 ? <5<5 QTZ = quartz; KOL = kaolinite; ILL = illite; BAS = bassanite; SID = siderite; ANA= anatase; HEM = hematite; PY = pyrite; SPH = sphalerite; FLD= feldsbar; CHL= chlorite; BOE= boehmite. ? =Trace constituent (< 5 %) that could not be resolved with certainty. Blank entry = not detected. Weight percentages listed are on a low-temperature ash basis. Frank T. Dulong, analyst.
Elemental Analysis Quality Control
in addition to the eastern Kentucky coal sample, CQ, Inc. submitted five b'ind standards for quality control purposes. The Eastern Kentucky coal was chemicall analyzed by multiple techniques. Concentrations of 30 elements were determined by INAA, using techniques described by Palmer (1997) on duplicate sample splits. Results were also obtained by ICP-AES (sinter and acid dissolution procedures; Pnggs, 1997) ICP-MS (Meier, 1997), hydride generation AA (Se), cold vapor AA (Hg; O'Leary, 1997) and ion chromatography (1C; Gent and Wilson, 1985) on triplicate sample splits at the USGS laboratories in Denver, Colorado. Table 3 shows the average results for 53 elements in the Eastern Kentucky coal sample.
The elemental concentrations of a series of 5 "blind" samples were submitted by CQ, Inc. to various laboratories to determine the comparability of data among laboratories. These samples were determined only by INAA because the limited quantity of sample provided did not allow for our standard ICP-AES and ICP-MS analysis. The first two samples, labeled CQO11202 and CQO111208 appear to be duplicates. There was no significant difference between the samples for any of tt 3 30 elements determined by INAA. The next two samples CQO111211 and CQO111214 are probably different splits of the same sample. The only element that differs frcm the first two samples is Br. The average concentration of Br was determined to be 5^.9 ±1.3 ppm for CQO11202 and 54.6±1.3 ppm for CQO11208 compared to 21.1 ±0.53 for CQO111211 and 21.0±0.53 for CQO111214. All of these samples appear to be snlrts of the eastern Kentucky coal sample analyzed in this study. The Br concentration ir the sample used for this study was 21.0±0.53: the same as CQO111211 and CQO11214. The final blind sample CQO111218 is significantly different than the other four control samples. However, it is not significantly different than the 1632C control sample tvat was run with all of the samples in this study. Certified, recommended, and informational values are given in Appendix 4-2 for each reference sample.
10

Table 3. Average Values for 53 Elements in the Eastern Kentucky coal sample (CQ352)
Variables:units:CQ352
Variables:units:CQ352
Variables:units:CQ352
Variables:units:CQ352
Variables:units:CQ352
Variables:units:CQ352
Variables:units:CQ352wt.=weight
HgPpm0.15
BePpm
2.0
Alwt. %
2.4
LiPpm
31
SePpm
6.2
LaPpm
14
HfPpm
1.1
Aspprn6.4
Cdppm
0.058
CaWt. %0.095
Bppm
43
Brppm
21
Ceppm
26
Tappm0.32
Crppm
22
Cuppm
17
Fewt. %
0.48
Pppm
76
Rbppm
20
Ndppm<5
Wppm0.86
Pbppm
9.2
Moppm
1.8
Nawt. %0.023
Clppm610
Srppm
71
Smppm
2.8
Auppm
< 0.002
Coppm
9.8
Znppm
18
MgWt. %0.080
Scppm
5.2
Yppm
9.3
Euppm0.52
Tlppm0.07
Nippm
17
Sbppm0.63
Siwt. %
3.8
Vppm
35
Zrppm
31
Tbppm
0.075
Mnppm
14
Thppm
3.7
Kwt. %
0.31
Gappm
5.9
Snppm
1.5
Ybppm0.12
Bappm130
Uppm
1.3
TiWt. %
0.12
Geppm
2.1
Csppm
1.4
Luppm0.04
These values typically represent the average of values determined by all techniques for a given element. Individual determinations, average values for each technique, and the overall values (which may be weighted averages depending on the reliability of the different techniques for a given element) for each sample are given in Appendix 3, which is color-coded to show the type of analysis for each determina*ion.
11

Leaching Experiments
Leachate solutions were analyzed by ICP-AES and ICP-MS, and solid residues were analyzed by CVAA (Hg) and INAA. Chemical data for the leachates and the solid residues have been processed to derive the mean percentages of each element leached by each of the four solvents. The calculated percentages were then used as an indirect estimate of the mode of occurrence of individual trace elements in the cot»l sample. The analytical errors were estimated to be ± 2 to ± 25 percent for these data, but errors are generally within ±5 percent, absolute.
Results for the Kentucky coal sample were determined in duplicate leaching experiments. Reproducibility is generally within the expected analytical errors, and is generally better within a given technique than among techniques. Figure 4 shows an example of the duplicate analyses of Co, determined by INAA, ICP-AES, and ICP-MS. Cobalt was not determined by ICP-MS on the whole coal fractions, therefore, the percent leached by ICP-MS is compared to ICP-AES whole coal, which might explain some of the differences of ICP-AES and ICP-MS. The results for each leached fraction agree within 10 percent absolute, but the ICP-MS is consistently higher than the other two techniques. The total amount leached is about 15 percent higher (or the unleached Co is 15 percent lower) as determined by ICP-MS. By averaging the various data for the duplicate individual analysis and rounding to the nearest 5, percent b^st values for each technique are determined. These results are then combined into a single stacked bar by further averaging, giving more weight to more accurate numbers and rounding to the nearest 5 percent to give the "overall best values".
Figure 5 shows the overall values for Ca, Mn, Cd, Zn, Pb, Cu and Ba. Th^se results are grouped together because the combined amounts of each of these elements leached by ammonium acetate and HCI are greater than the amount leached by any other solvent. Palmer and others, (1998) have shown that calcite (found in this rample by SEM; table 1) is partially soluble in ammonium acetate as well as being soluble in HCI. They also suggest that other carbonates, especially siderite, may be soluble in ammonium acetate. Mn and Ca have been shown to be primarily associated with carbonates (Palmer and others, 1998). Mn is also associated with silicates, particularly clays, as 30 percent of the Mn is HF teachable. These results are consistent witr our previous leaching experiments (Palmer and others, 1998).Forty to fifty percent of the Cd, Zn and Pb are leached by HCI with small amount? of Cd and Zn leached by ammonium acetate. Generally, these elements are associate'! with the monosulfides (galena and sphalerite). We did not identify either of these minerals by SEM in this sample. However, the concentrations of Cd, Zn and Pb are very bw in this sample. Twenty to twenty-five percent of these elements are leached by HNO3 suggesting that these elements also have an association with pyrite. Thirty percent of the Zn was leached by HF; consistent with Zn concentrations in illite and kaolinite found in coal. (Palmer and Lyons, 1996).
12

100
ICP-AES individual
Best ICP-AES
ICP-MS individual
Best ICP-MS
INAA individual
CH3 COOI\IH4 HCI HF a H
Figure 4. Percent cobalt (rounded to ± 5 percent) leached by selected solvents for two "individual" sample splits and "Best" (average values rounded to ± 5 percent) for ICP-AES,ICP-MS and INAA as well as "Best Overall" (weighted average of all values for all techniques rounded to ± 5 percent.)
13

100
Orig
inal
Co
ncen
tratio
nCa
95
00 p
pmM
n 14
ppm
Cd
0.58
ppm
Zn
17.5
ppm
Pb
9.2
ppm
Cu
17 p
pmBa
9.
8 pp
m
CH
3CO
ON
H4
HC
IH
FH
N0
3
Figu
re 5
. Le
achi
ng r
esul
ts fo
r el
emen
ts le
ache
d pr
imar
ily w
ith a
mm
oniu
m a
ceta
te a
nd H
CI.
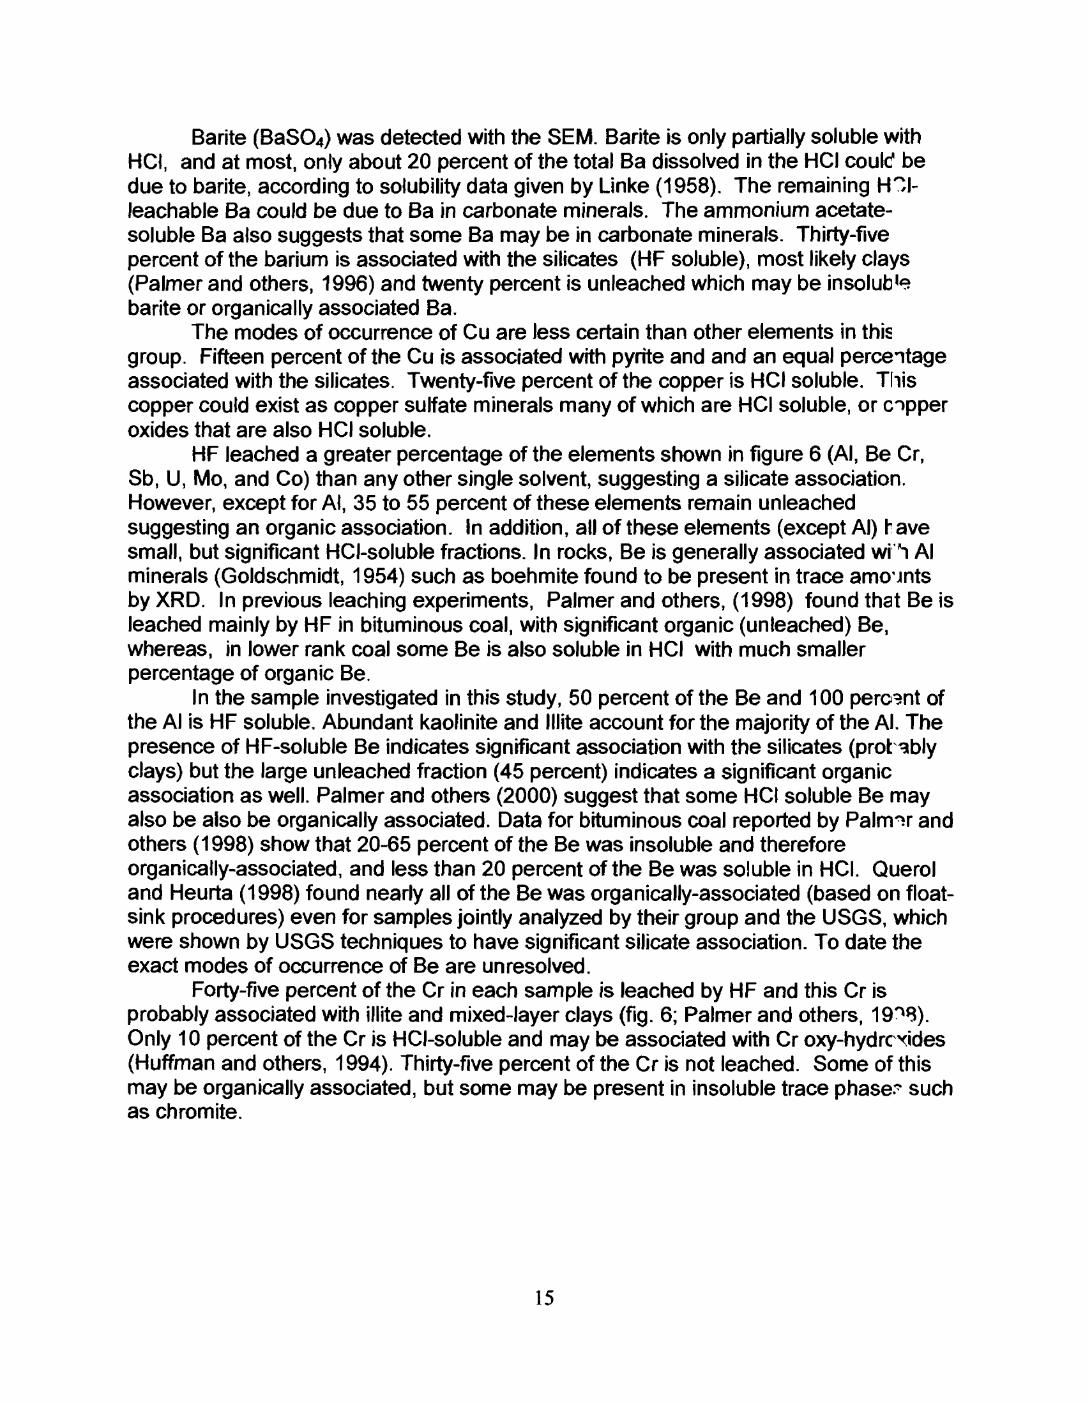
Barite (BaSO4) was detected with the SEM. Barite is only partially soluble with HCI, and at most, only about 20 percent of the total Ba dissolved in the HCI coulcf be due to barite, according to solubility data given by Linke (1958). The remaining H~l- leachable Ba could be due to Ba in carbonate minerals. The ammonium acetate- soluble Ba also suggests that some Ba may be in carbonate minerals. Thirty-five percent of the barium is associated with the silicates (HF soluble), most likely clays (Palmer and others, 1996) and twenty percent is unleached which may be insolub'e barite or organically associated Ba.
The modes of occurrence of Cu are less certain than other elements in this group. Fifteen percent of the Cu is associated with pyrite and and an equal percentage associated with the silicates. Twenty-five percent of the copper is HCI soluble. This copper could exist as copper sulfate minerals many of which are HCI soluble, or copper oxides that are also HCI soluble.
HF leached a greater percentage of the elements shown in figure 6 (Al, Be Cr, Sb, U, Mo, and Co) than any other single solvent, suggesting a silicate association. However, except for Al, 35 to 55 percent of these elements remain unleached suggesting an organic association. In addition, all of these elements (except Al) have small, but significant HCI-soluble fractions. In rocks, Be is generally associated wi "i Al minerals (Goldschmidt, 1954) such as boehmite found to be present in trace amounts by XRD. In previous leaching experiments, Palmer and others, (1998) found that Be is leached mainly by HF in bituminous coal, with significant organic (unleached) Be, whereas, in lower rank coal some Be is also soluble in HCI with much smaller percentage of organic Be.
In the sample investigated in this study, 50 percent of the Be and 100 percent of the Al is HF soluble. Abundant kaolinite and Illite account for the majority of the Al. The presence of HF-soluble Be indicates significant association with the silicates (prot ^bly clays) but the large unleached fraction (45 percent) indicates a significant organic association as well. Palmer and others (2000) suggest that some HCI soluble Be may also be also be organically associated. Data for bituminous coal reported by Palrmr and others (1998) show that 20-65 percent of the Be was insoluble and therefore organically-associated, and less than 20 percent of the Be was soluble in HCI. Querol and Heurta (1998) found nearly all of the Be was organically-associated (based on float- sink procedures) even for samples jointly analyzed by their group and the USGS, which were shown by USGS techniques to have significant silicate association. To date the exact modes of occurrence of Be are unresolved.
Forty-five percent of the Cr in each sample is leached by HF and this Cr is probably associated with illite and mixed-layer clays (fig. 6; Palmer and others, 19^8). Only 10 percent of the Cr is HCI-soluble and may be associated with Cr oxy-hydrcxides (Huffman and others, 1994). Thirty-five percent of the Cr is not leached. Some of this may be organically associated, but some may be present in insoluble trace phase." such as chromite.
15

100
Orig
inal
Co
ncen
tratio
nAl
2.
38 w
t. pe
tBe
2.
0 pp
mCr
21
.8 p
pmSb
0.
63 p
pmM
o 1.
8 pp
m
CH
3CO
ON
H4
HC
IH
F D
H
N0
3
Co
9.8
ppm
Figu
re 6
. Le
achi
ng r
esul
ts fo
r ele
men
ts le
ache
d pr
imar
ily w
ith H
F. E
xcep
t for
Al t
hese
ele
men
ts h
ave
sign
ifica
nt u
nlea
ched
por
tions
.
16

Thirty-five percent of the Sb and U in the eastern Kentucky coal sample is leached by HF indicating a silicate association (clay minerals and zircon). Fifty percent of the Sb and 55 percent of the U is unleached, suggesting that it is organically bound. The percentage of HF leached Sb is higher than in bituminous coal studied previously (10-20 percent), but the portion of unleached Sb is remarkably similar to results from previous studies (Palmer and others, 1998). The high percentage of organically-bound U is not surprising considering its uptake into the organic matrix in peat swamps (Zielinski and Meier, 1988), however some of the unleached U may be due to the presence of insoluble zircon in the sample (fig. 1)
Five percent of the Sb and U is HCI-soluble in both samples, perhaps due to Sb and U present in carbonates, iron oxides or chelates. Some of the HCI- soluble U may be in organic chelates increasing the total percentage of organically associated U.
Five percent of the U and 10 percent of the Sb is HNOs soluble. The HNOs soluble U may indicate dissolution of U-bearing phosphates, which may be exposed following HF dissolution of encapsulating silicates. The concentration of U in pyrite is very low (about 1 ppm; Palmer and others, 1996) and U has been found to be HCI soluble after the HF leach (see discussion of Th below). The total Sb concentration is very low, 0.63 ppm, and it is possible that even with the low pyrite concentration in this sample (less than 1 percent), 10 percent of the Sb could be in the pyrite.
Thirty-five percent of the Mo is in HF-soluble silicates, most likely clay minerals. The 35 percent of unleached Mo indicates a significant organic association. Twenty percent of the Mo has a pyrite association and 15 percent was leached by HCI.
Cobalt appears to have mixed modes of occurrence. Results for Co are included in figure 6 because the 20 percent of the Co leached by HF is greater than that leached by HCI (15 percent) or that leached by either HNO3 or Ammonium Acetate (5 percent each). The HF soluble Co is associated with the silicates, probably clay minerals, HCI- and ammonium acetate-soluble Co is probably associated with carbonates, Fe-oxides and/or HCI-soluble monosulfides and the nitric acid soluble Co is associated with pyrite. This leaves 55 percent of the Co unleached, presumably associated with organic matter.
At least 25 percent of each element in figure 7 ( Fe, As, Hg, Ni, Se, and Th) was leached by nitric acid indicating a pyrite association. However, pyrite is not the primary mode of occurrence of all of these elements. This is partly because the total concentration of pyrite is small (on the order of about 0.25 weight percent). Thirty-five percent of the Fe is leached by HF indicating a silicate association. Table 1 shows that illitic clays are abundant with large quartz/clay intergrowths in some cases over 100 mircons in their longest dimension. Energy dispersive analyses of illitic clay particles by SEM show Fe to be a major component of these clays.
17

Fe oxides identified in SEM pellets (table 1) account for the 20 percent fraction of the Fe dissolved by HCI. Some of this Fe oxide may be due to the oxidation of pyrite. In addition, about 20 percent of the Fe was unleached. SEM examination of the leached solid residue found eight pyrite grains of the 206 grains analyzed (4 submicron framboids, 2-1 micron framboids, 1 subhedral grain 3X5 micrometers in size and 1-10 micrometer framboid, always completely surrounded by organic material). In addition, four particles of chalcopyrite were found ranging from 0.3 microns to 2 microns in their longest dimension. If one assumes that all of the unleached Ti is due to rutile and or anatase then (based on the area of other unleached minerals and appropriate density corrections) approximately 25 percent of the unleached Fe is due to pyrite or 5 percent of the total Fe in the sample and the amount of Fe due to unleached chalcopyrite and kaolinite is much less than 1 percent of the total Fe.
A larger percentage of the As (50 percent) than Fe (25 percent) is leached by nitric acid, indicating that much of the As is in pyrite. About the same percentage of Arsenic as iron was dissolved by HCI. This is consistent with the observation above that some of the Fe oxide may be due to pyrite oxidation. About 15 percent of the original As is in the silicates as determined by the leaching of As by HF. This is consistent with As found in illite (2.35 ppm) and kaolinite (0.52 ppm) by Palmer and others, (1996). Fifteen percent of the As was unleached suggesting an organic association. However, we calculate that most of the unleached As is due to unleached pyrite or about 5 percent of the total As, so that the remaining unleached (organically associated As) is less than 5 percent.
Seventy percent of the Hg was leached by nitric acid suggesting a strong pyrite association in this coal. Assuming that Hg is homogeneously distributed throughout the pyrite and calculating the amount of unleached pyrite, we calculate that 17 percent of the unleached Hg or about 15 percent of the total Hg is due to unleached pyrite. The remaining 15 percent of the unleached Hg may be organically associated. The total concentration of Hg was 0.15 ppm (table 3).
Equal percentages (25 percent) of Ni were associated with silicates and pyrite. However, as silicates represent a much larger percentage of the whole coal, the average concentration of Ni in the pyrite is much larger than the concentration in the clays. Ten percent of the Ni is HCI-soluble and may be associated with the Fe-oxides, or associated with carbonates. About 5 percent of the Ni is due to unleached pyrite using the assumptions above, and the remaining 35 percent of the Ni is unleached and is likely organically bound.
Twenty-five percent of the Se was nitric acid soluble and therefore associated with pyrite. An additional 5 percent of the Se may be due to unleached pyrite but the remaining 50 percent of the unleached Se is probably organically associated. Ten percent of the Se was leached by HF (silicate associated; probably clays) and by HCI (may be due to oxidized pyrite).
Thirty percent of the Th is leached by HNC>3 suggesting a pyrite association. However, the HNC>3 leachable Th may be from phosphates shielded by silicates, rather than in pyrite, as the samples in this study have very little pyrite, and concentrations of Th in pyrite have been found to be less than 0.5 ppm (Palmer et al. 1996). Thorium-bearing minerals such as monazite are detrital, and
18

100
Orig
inal
C
once
ntra
tion
Fe
4800
ppm
As
6.4
ppm
Hg
0.15
ppm
Ni
17 p
pmSe
6.
2 pp
m
CH
3CO
ON
H4
EE
HC
I
HF
D
HN
03
Th
3.69
ppm
Figu
re 7
. Le
achi
ng r
esul
ts fo
r se
lect
ed e
lem
ents
leac
hed
to a
sig
nific
ant d
egre
e by
19

are commonly associated with silicates. Experiments on a high pyrite coal (Palmar et al., 1999) show that 40 percent of the Th was removed by HCI, whereas an addit:onal 20 percent was released by a second HCI leach, conducted following the HF step instead of leaching with nitric acid.
The result of the second HCI leaching for this coal is equal to the 20 percent Th leached by nitric acid using the standard leaching protocol, again suggesting tha* nitric acid leachable Th does not necessarily reside in pyrite. Similar results were found for U, but elements generally associated with pyrite such as As and Hg, were not found to be HCI-soluble after the HF leach. The 15 percent of the Th leached by HF, is probably associated with the clays, although some HF leachable Th may be from zircon (detected by SEM). HCI-soluble Th (15 percent) is probably derived from trace amounts of apatite or monazite. Forty percent of the Th remains unleached. Some of this unleached Th could reside in insoluble or partially soluble minerals such as zircon (table 1), or may be organically bound.
Semi-quantitative Modes of Occurrence
Semi-quantitative assessments of each trace-element's modes of occurrence have been determined by combining all of the information available. This include." leaching results, electron microprobe analysis, scanning electron microscopy, X-^ay diffraction analysis and chemical analyses, as well as knowledge of the geocherrical characteristics of each element. Table 4 shows the percentage of 20 elements in each of three or four major phases or minerals. In cases where there is supporting direct evidence for a particular mode of occurrence, the host form of the mineral is given, such as As in pyrite, Zn in sphalerite or Cr in illite. In cases where there is strong geochemical evidence and strong indirect evidence, classes of minerals are given, such as sulfides, silicates, oxides or arsenates. In the remaining cases a descriptor is used, such as HCI-soluble.
Conclusions
The sample of eastern Kentucky coal in this study is lower in pyrite than rrost eastern US bituminous coal. Most of the 14 percent ash yield is due to quartz and clay minerals particularly kaolinite and illite. This leads to higher percentages of elements that are normally chalcophilic associated with the silicates. Greater than 15 percent of 15 of the 20 elements presented in this study were associated with silicates. Only Hg and As were primarily (greater than 50 percent) associated with pyrite.
For 9 of the 20 elements, greater than 40 percent of the original material was unleached. Although some of the unleached material can be accounted for by unleached pyrite, chalcopyrite and other minerals, except for Cu and Ti (not included in this study), the residual minerals represented only a small amount of the unleached element and most of the unleached elements were assumed to be organically associated. Except for Al, all elements had multiple modes of occurrence, although Hg and Ca had only two modes of occurrence.
20

Table 4. Modes of Occurrence of Trace Elements the Eastern Kentucky Coal Sample
Calcium
CQ352AExchangeable/Carbonates Organics
55% 45%
CQ352A
CQ352A
ManganeseCarbonates
60%
Pyrite 25%
Silicates 30%
Cadmium
Sphalerite 40%
Organics 10%
Silicates 5%
Organics 30%
CQ352APyrite 20%
Zinc
Sphalerite 50%
Silicates 30%
Organics 5%
CQ352APyrite 20%
Lead
Galena 50%
Silicates 5%
Organics 25%
CQ352A
Copper
Chalcopyrite/pyrite Oxides/Carbonates Silicates 60% 25% 15%
Barium
CQ352ABarite 35%
Silicates HNO3- Soluble Organics 35% 5% 25%
Aluminum
CQ352ASilicates 100%
21
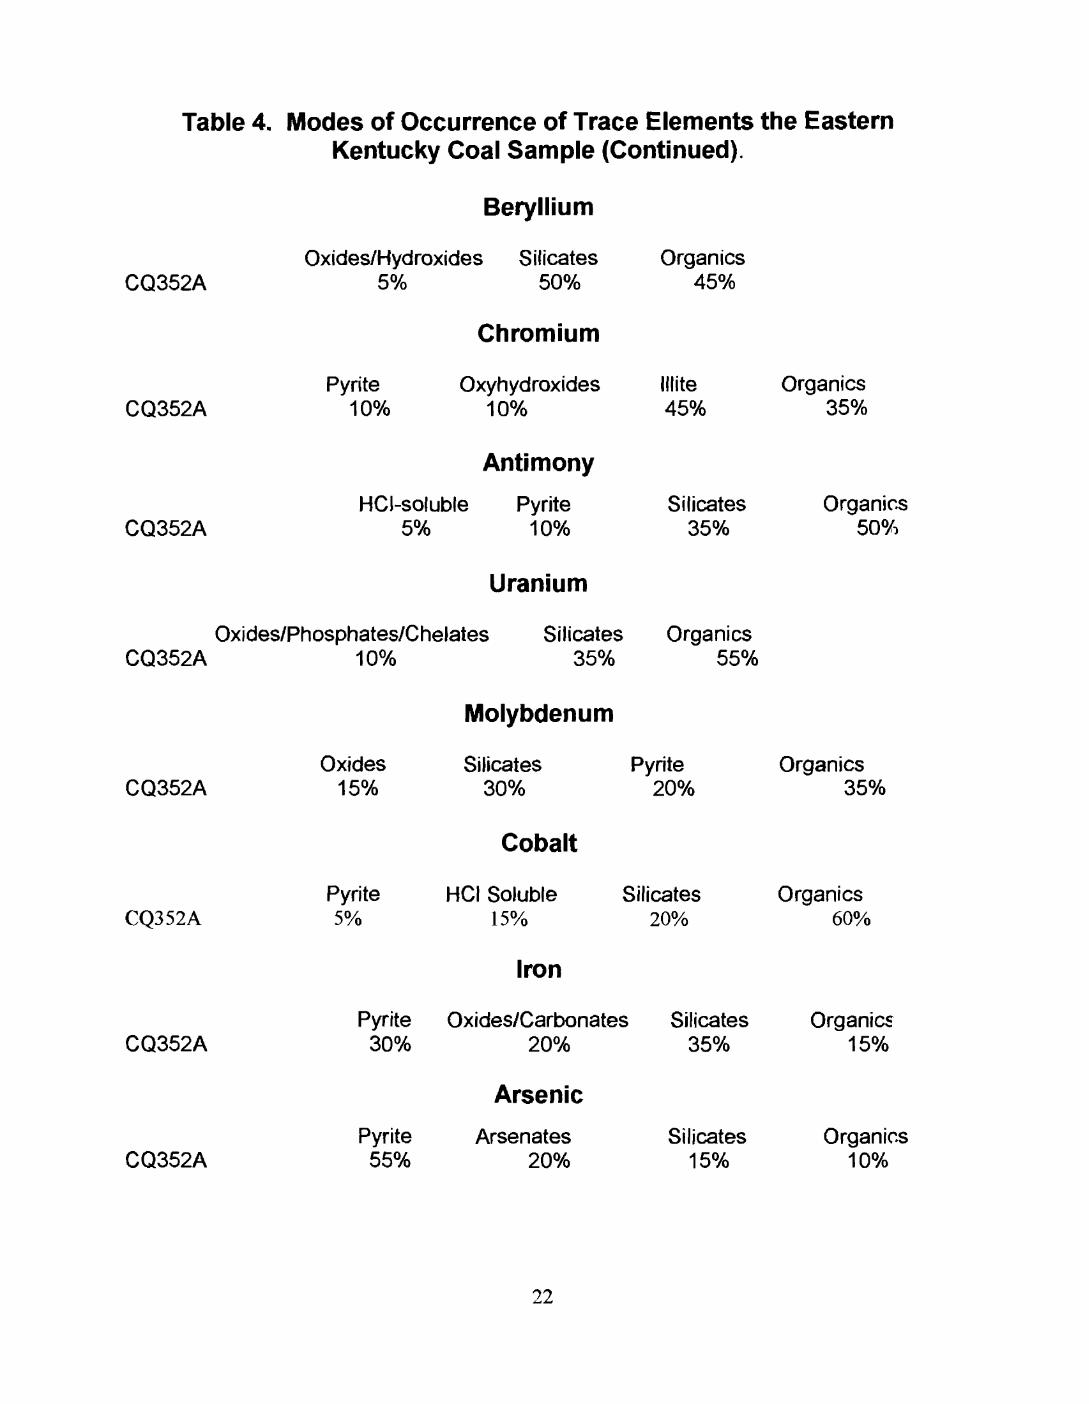
Table 4. Modes of Occurrence of Trace Elements the Eastern Kentucky Coal Sample (Continued).
CQ352A
Beryllium
Oxides/Hydroxides Silicates 5% 50%
Chromium
Organ ics 45%
CQ352APyrite Oxyhydroxides Illite Organics
10% 10% 45% 35%
CQ352AHCI-soluble
5%
Antimony
Pyrite 10%
Silicates 35%
Organics 50%
Uranium
Oxides/Phosphates/Chelates Silicates Organics CQ352A 10% 35% 55%
CQ352AOxides
15%
Molybdenum
Silicates 30%
Pyrite 20%
Organics 35%
CQ352A
Cobalt
Pyrite HCI Soluble 5% 15%
Iron
Silicates20%
Organics 60%
CQ352A
CQ352A
Pyrite Oxides/Carbonates Silicates Organics 30% 20% 35% 15%
Arsenic
Pyrite Arsenates Silicates Organics 55% 20% 15% 10%
22

Table 4. Modes of Occurrence of Trace Elements the Eastern Kentucky Coal Sample (Continued)
CQ352A
CQ352A
CQ352A
Mercury
CQ352A
Pyrite 80%
Sulfides 25%
Sulfides 25%
hosphates45%
Nickel
Ni oxides 10%
Selenium
HCI-Soluble 10%
Thorium
Silicates15%
Organic 20%
Silicates Orgarvcs 65% 40%
Silicates Organic.? 10% 55%
Insoluble40%
23

References
ASTM (American Society for Testing and Materials), 2001, D2492-90 Standard Test Method for Forms of Sulfur in Coal: in Annual book of ASTM standards. Vol. 5.05 Gaseous fuels, coal and coke. Philadelphia, , p. 262-267
ASTM (American Society for Testing and Minerals), 2001, D2797-95 Standard practice for preparing coal samples for microscopical analysis by reflected light: in Annual book of ASTM standards. Vol. 5.05 Gaseous fuels, coal and coke. Philad3lphia, Pennsylvania, p. 282-285.
Briggs, P.M.,1997 Determination of 25 elements in coal ash from 8 Argonne Prerrium Coal samples by inductively coupled argon plasma-atomic emission spectrometry, in Palmer, C.A. ed., The chemical analysis of Argonne Prerrrjm Coal samples. U.S. Geological Survey Bulletin 2144, p 39-44.
Finkelman, R.B. Palmer, C.A., Krasnow, M.R., Aruscavage, P.J. Sellers,G.A., anc1Dulong, FT., 1990, Combustion and leaching behavior of elements in Argonne Premium Coal samples: Energy and Fuels v. 4 no. 5, p. 755-766.
Gent, C.A., and Wilson, S.A., 1985, The determination of sulfur and chlorine in coalsand oil shales using Ion chromatography: Analytical Letters, v. 18 No. A6, p. 729- 740.
Goldschmidt, V.M.,1954, Geochemistry, Oxford Press, London, 730 p.
Hosterman, J.W., and Dulong, FT., 1985, A computer program for semi-quantitative mineral analysis by X-ray diffraction: In Pevear, D.R., and Mumpton, F.A., eds., Qualitative mineral analysis of clays: CMS Workshop, Lectures, vol. 1, The Clay Minerals Society, Evergreen Colorado, p. 38-50.
Huffman, G.P., Muggins, F.E., Shah, N.,Zhao, J.,1994, Speciation of arsenic and chromium in coal combustion ash by XAFS spectroscopy: Fuel Processing Technology v. 39 no. 1/3. p. 47-62.
Linke, W.F., 1958, Solubilities of Inorganic and Metal Organic Compounds. 4th edition. D. Van Nostrand Company, Inc. Princeton. 1487 pp.
Meier, A. L., 1997, Determination of 33 elements in coal ash from 8 Argonne Prenfum Coal samples by inductively coupled argon plasma-mass spectrometry, in Palmer, C.A. ed., The chemical analysis of Argonne Premium Coal samples: U.S. Geological Survey Bulletin 2144, p. 45-50.
O'Leary, R.M., 1997, Determination of mercury and selenium in eight Argonne Premium Coal samples by cold-vapor and hydride-generation atomic absorption
24

spectrometry, in Palmer, C.A. ed., The chemical analysis of Argonne Premium Coal samples: U.S. Geological Survey Bulletin 2144, p. 51-56.
Palmer, C.A., 1997, The determination of 29 elements in eight Argonne Premium Coal samples by instrumental neutron activation analysis, in Palmer, C.A. ed., The chemical analysis of Argonne Premium Coal samples: U.S. Geological Survey Bulletin 2144, p.25-32.
Palmer, C.A., Krasnow, M.R., Finkelman, R.B., and D'Angelo, W.M., 1993, An evaluation of leaching to determine modes of occurrence of selected toxic elements in coal: Journal of Coal Quality v. 12, no. 4, 135-141.
Palmer C.A., and Lyons P.C., 1996, Selected elements in major minerals from bituminous coal determined as by INAA: Implications for removal of environmentally sensitive elements from coal. International Journal of Coal Geology, v. 32, p. 151-166.
Palmer, C. A., Kolker, Allan, Finkelman, R. B., Kolb, K. C., Mroczkowski, S. J., C'owley, S. S., Belkin, H. E., Bullock, J. H., Jr., and Motooka, J. M., 1997a, U.S. Geological Survey report to CQ, Inc. on data related to HAP'sRx Project: A technical report by the U.S. Geological Survey for CQ, Inc.: [Published as a chapter in: Akers, D. J., Raleigh, C. E., Lebowitz, H. E., Ekechukwu, Kenneth, Aluko, M. E., Arnold, B. J., Palmer, C. A., Kolker, Allan, and Finkelman, R. B., 1997, HAPs-Rx : Precombustion removal of hazardous air pollutant precursors: Final Report, DOE Contract DE-AC22-95PC95153, U.S. Department of Energy]. 115+p.
Palmer, C.A., Kolker, Allan, Finkelman, R.B., Kolb, K.C., Mroczkowski, S.J., Crowley, S.S., Belkin, H.E., Bullock, J.H., Jr., and Motooka, J.M., 1997b, Modes of occurrence of trace elements from a coal cleaning plant: Final technical contract report to CQ, Inc, U.S. Geological Survey Open-File report 97-732, 97p.
Palmer, C.A., Mroczkowski, S.J., Finkelman, R.B., Crowley, S.S., and Bullock, J.H., Jr., 1998, The use of sequential leaching to quantify the modes of occurrence of elements in coal: Fifteenth Annual International Pittsburgh Coal Conference Proceedings, CD-ROM, PDF166, 28 p.
Palmer, C.A., Mroczkowski, S.J., Finkelman, R., Bullock, J.H., Jr., 1999, Quantifying the modes of occurrence of trace elements in coal: Proceedings of the 24th International Technical Conference on coal utilization and fuel systems, p. 369- 380.
Palmer, C. A., Mroczkowski, S. J., Kolker, Allan, Finkelman, R. B., and Bullock, Jr., J. H., 2000, Chemical analyis and modes of occurrence of selected trace elements in a Powder River Basin coal and its corresponding simulated cleaned coal. U.S. Geological Survey Open-File Report 00-323. 52 p.
25

Pontolillo, J. and Stanton, R.W., 1994, Coal petrographic laboratory procedures and safety manual II: U. S. Geological Survey Open-File Report 94-631, 69 p.
Querol, X. and Heurta, A., 1998, Determination of the occurrence and distribution of trace-elements in coal: An inter-laboratory comparison- Determination of trace element affinities by density fractionation of bulk coal samples: Internationa 1 Energy Agency, Interim Project Report, 16 p.
Querol, X., Finkelman, R. B., Alastuey, A., Palmer, C. A., Mroczkowski, S. J., and Kolker, A., 1998, Quantitative determination of modes of occurrence of major, minor, and trace elements in coal: A comparison of results from different methods: Proceedings of the Eighth Australian Coal Conference, December, 1998, p. 51-56.
Raleigh, C.E., Jr., Akers, D.J., and Arnold, B.J., 1998, Precombustion control of trace metals in coal: Empire State Electric Energy Research Report EP 96-07, 57 p.
Zielinski, R.A., Meier, A.L., 1988, The association of uranium with organic matter in Holocene peat: an experimental study. Applied Geochemistry v. 3, p.631-6^3.
26
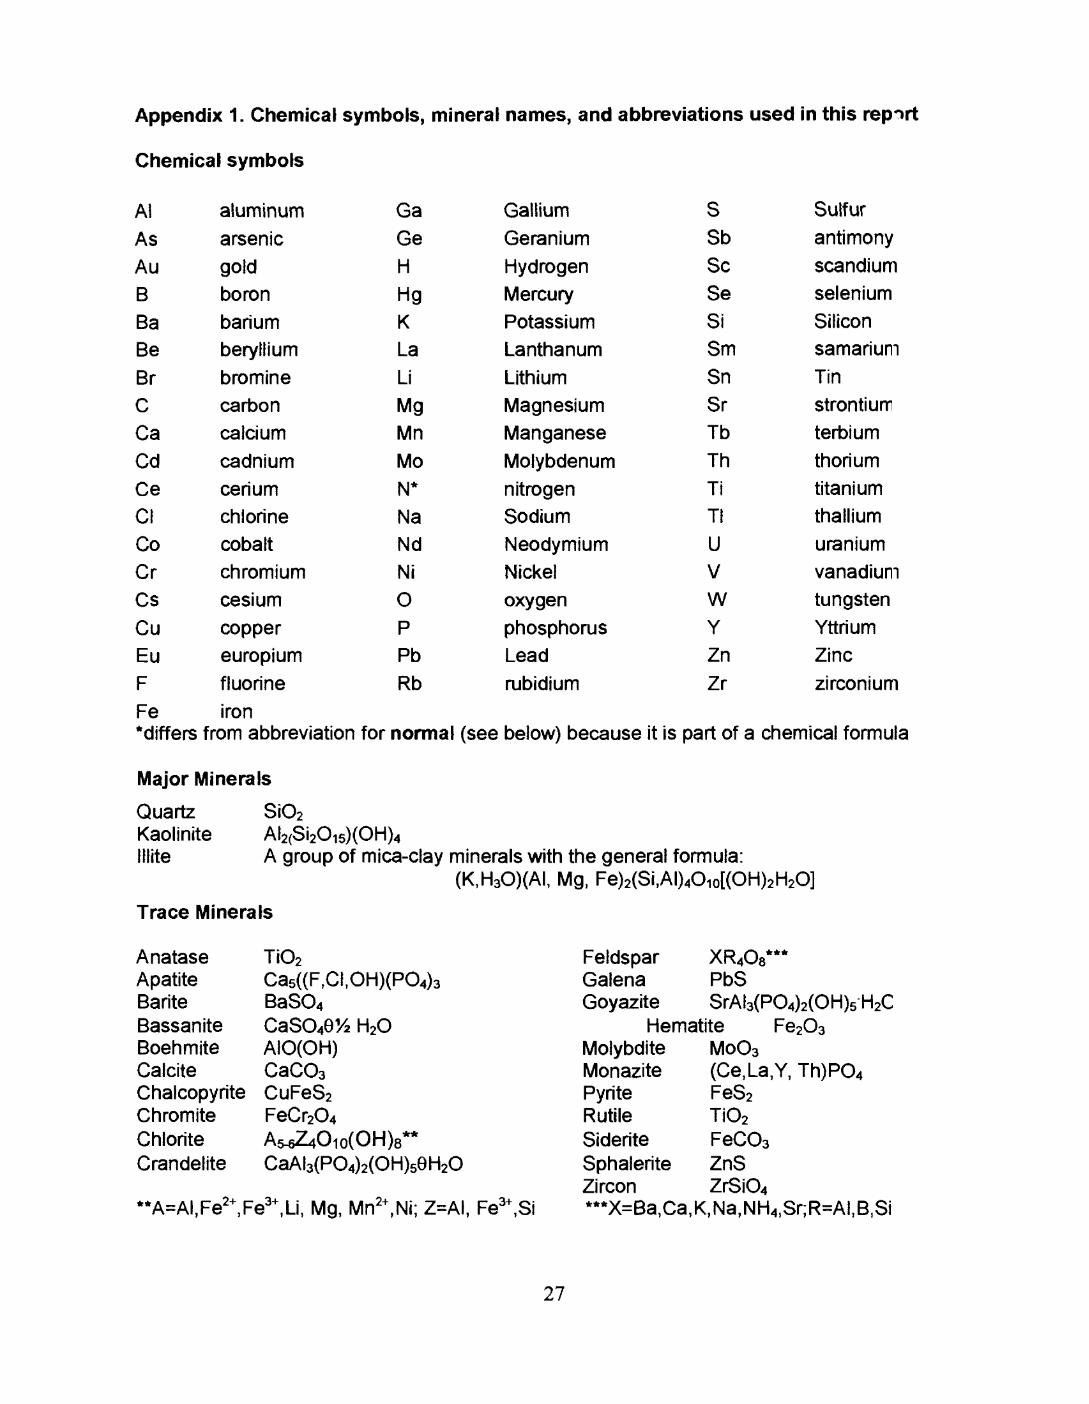
Appendix 1. Chemical symbols, mineral names, and abbreviations used in this report
Chemical symbols
AtAsAu BBaBe BrCCaCdCeClCoCrCs
Cu EuF
Fe *differs
aluminumarsenicgold boronbariumberyllium brominecarboncalciumcadniumceriumchlorinecobaltchromiumcesiumcopper europium fluorineiron
from abbreviation
GaGeHHgKLaLiMgMn
MoN*
NaNdNiOPPbRb
GalliumGeraniumHydrogenMercuryPotassiumLanthanumLithiumMagnesiumManganeseMolybdenumnitrogenSodiumNeodymiumNickeloxygenphosphorusLeadrubidium
sSbScSeSiSmSn
SrTbThTiTl
UVW
YZn
Zr
SulfurantimonyscandiumseleniumSiliconsamariumTinstrontiumterbiumthoriumtitaniumthalliumuraniumvanadiumtungstenYttriumZinc
zirconium
for normal (see below) because it is part of a chemical formula
Major Minerals
Quartz SiO2Kaolinite AI2(Si2O15)(OH)4Illite A group of mica-clay minerals with the general formula:
(K,H30)(AI, Mg, Fe)2(Si,AI)4O10[(OH)2 H2O]
Trace Minerals
AnataseApatiteBariteBassaniteBoehmiteCalciteChalcopyriteChromiteChloriteCrandelite
TiO2Ca5((F,CI,OH)(PO4)3BaSO4CaSO49 1/2 H2OAIO(OH)CaCO3CuFeS2FeCr2O4
CaAI3(PO4)2(OH)5eH2O
,2+i, Mg, Mn2+ ,Ni; Z=AI, Fe3+ ,Si
Feldspar XR4O8***Galena PbSGoyazite SrAI3(PO4)2(OH)5 H2C
Hematite Fe2O3 Molybdite MoO3 Monazite (Ce.La.Y, Th)PO4 Pyrite FeS2 Rutile TiO2 Siderite FeCO3 Sphalerite ZnS Zircon ZrSiO4 ***X=Ba,Ca,K,Na,NH4,Sr;R=AI,B,Si
27

Appendix 1. Chemical symbols, mineral names, and abbreviations used in this report
(continued)
Abbreviations
-60 KV urn <1:7°C o 22
AAampANAASTMBASBOEBSECVAACHLCRADACH3COONH4EDXETEC AutoscanFLD9HAPsHCIHEMHFHN031CICP-AESICP-MSILLINAAJEOL-840JEOL JXA 8900RKeVKOLmlMm
less than 60K alpha (line intensities for X-rays)micrometerless than(one part acid and 7 parts water)degrees Centigrade (refers to temperature)degrees 2 theta (measurement of angle of x-ray peaks in XRD)atomic absorptionampereanatase (See mineral list above)American Society for Testing Materialsbassanite (See mineral list above)boehmite (See mineral list above)backscattered electron imagingcold vapor atomic absorptionchlorite (See mineral list above)Cooperative research and development agreementammonium acetateEnergy Dispersive X-raymodel of a scanning electron microscope used in this studyfeldspar (See mineral list above)gramshazardous air pollutantshydrochloric acidhematite (See mineral list above)hydrofluoric acidnitric acidion chromotography: used to analyze for Clinductively coupled argon plasma- atomic emission spectrometryinductively coupled argon plasma- mass spectrometryillite (See mineral list above)instrumental neutron activation analysismodel number of a scanning electron microscope used in this stuc'vmodel number of microprobe used in this studykilo-electron volt (unit of energy)kaolinite (See mineral list above)millilitersmajor phaseminor or trace phase
28
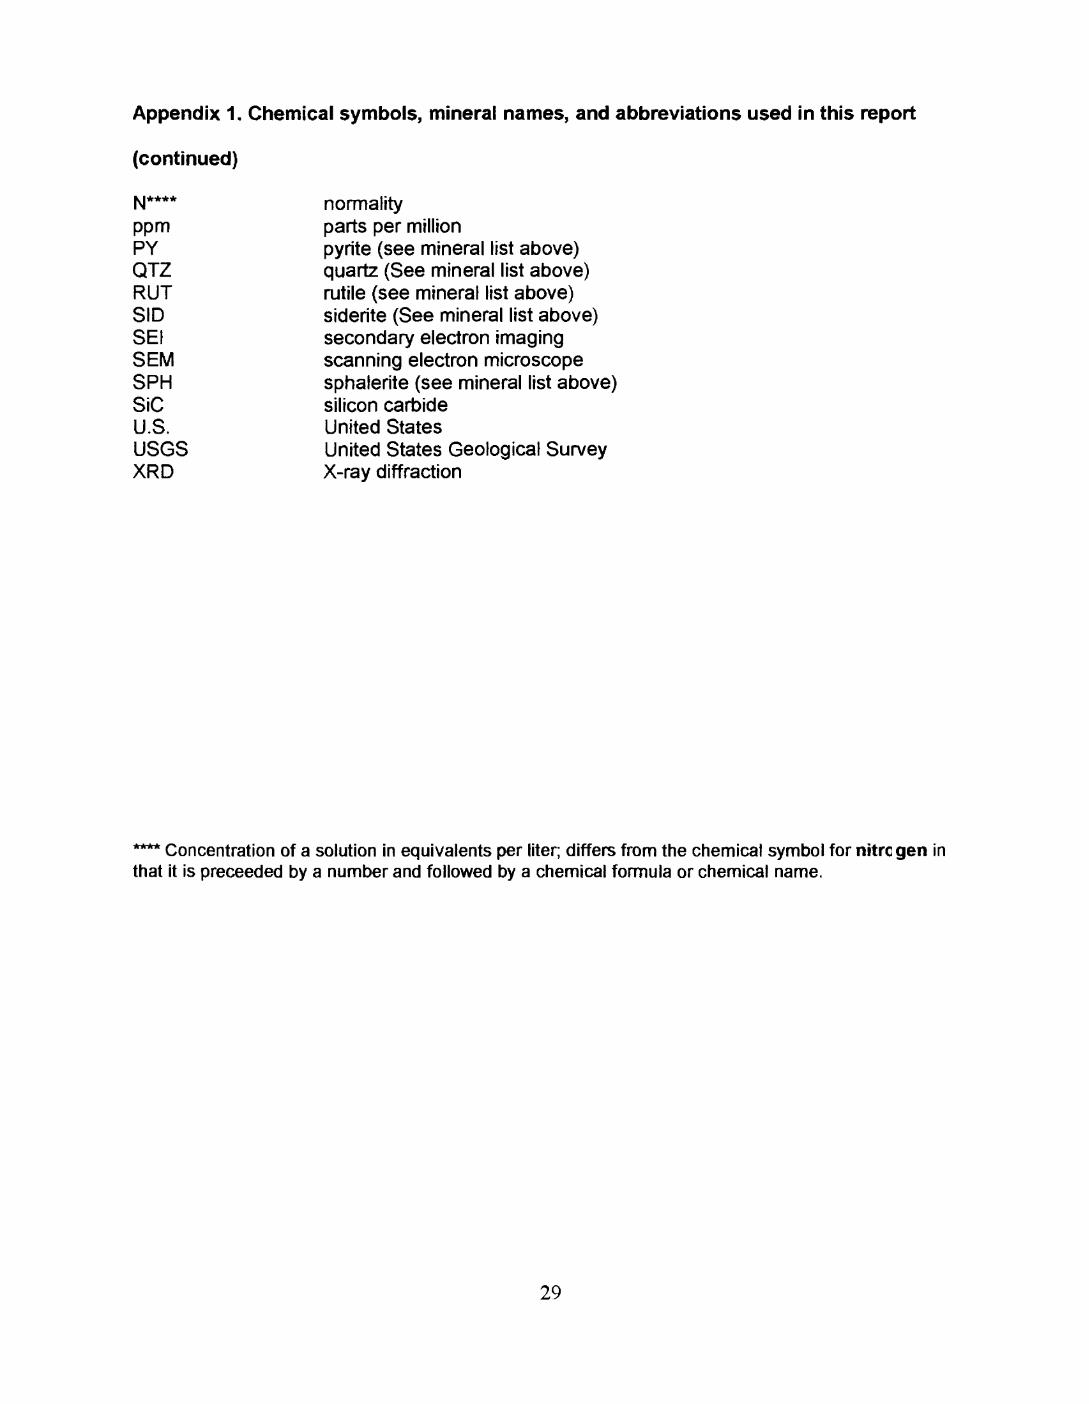
Appendix 1. Chemical symbols, mineral names, and abbreviations used in this report
(continued)
N****
ppmPYQTZRUTSIDSEISEMSPHSiCU.S.USGSXRD
normalityparts per millionpyrite (see mineral list above)quartz (See mineral list above)rutile (see mineral list above)siderite (See mineral list above)secondary electron imagingscanning electron microscopesphalerite (see mineral list above)silicon carbideUnited StatesUnited States Geological SurveyX-ray diffraction
' Concentration of a solution in equivalents per liter; differs from the chemical symbol for nitre gen in that it is proceeded by a number and followed by a chemical formula or chemical name.
29

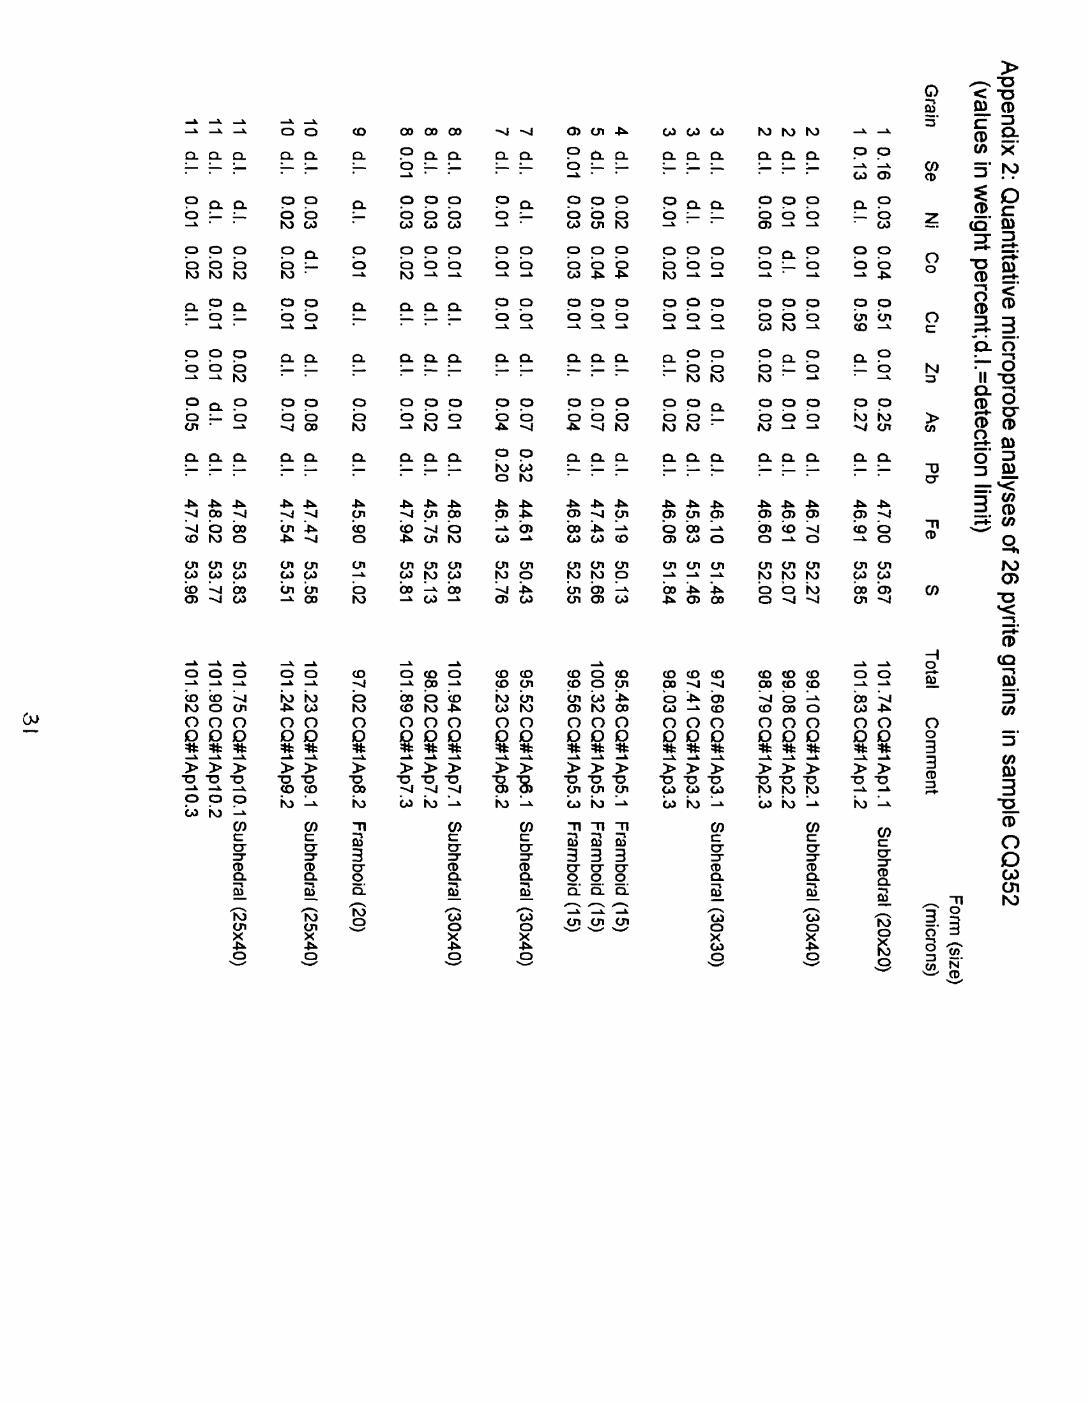
Appendix 2: Quantitative microprobe analyses of 26 pyrite grains
Where possible, pyrite classifications having genetic significance are used such as cleat or framboidal pyrite. In many cases, the genesis of the pyrite is uncertain and descriptive terms are used. These include: irregular- an irregular mass consisting of smaller, generally well-formed crystals. For individual crystals, descriptive terms include euhedral- referring to a complete crystal form defined by well-formed crystal facer; subhedra\ an approximate crystal form that may include some well-formed faces; and anhedral- a grain that lacks obvious crystal form. d.l.=detection limit.
30
Appendix 2: Q
uantitative microprobe analyses of 26 pyrite grains
in sample C
Q352
(values in weight percent;d.l.=detection lim
it)Form
(size) G
rain Se
Ni
Co
Cu
Zn A
s Pb
Fe S
Total C
omm
ent (m
icrons)
112223334567788891010111111
0.160.13
d.l.d.l.d.l.
d.l.d.l.d.l.
d.l.d.l.0.01
d.l.d.l.
d.l.d.l.
0.01
d.l.
d.l.d.l.
d.l.d.l.d.l.
0.03d.l.
0.010.010.06
d.l.d.l.0.01
0.020.050.03
d.l.0.01
0.030.03
0.03
d.l.
0.030.02
d.l.d.l.
0.01
0.040.01
0.01d.l.
0.01
0.010.010.02
0.040.040.03
0.01
0.01
0.010.010.02
0.01
d.l.0.02
0.02
0.020.02
0.510.59
0.010.020.03
0.010.010.01
0.010.010.01
0.010.01
d.l.d.l.d.l.
d.l.
0.010.01
d.l.0.01d.l.
0.d0.d0. 01.1.01.1.02
0.020.dddddddddddd
02.1..1..1..1..1..1..I.LI..1..1..I..1.
0.020.0. 0101
0.250.27
0.010.010.02
d.l.0.020.02
0.020.070.04
0.070.04
0.010.020.01
0.02
0.080.07
0.01d.l.
0.05
d.l.d.l.
d.l.d.l.d.l.
d.l.d.l.d.l.
d.l.d.l.d.l.
0.320.20
d.l.d.l.d.l.
d.l.
d.l.d.l.
d.l.d.l.d.l.
4746.00.91
46.7046464645464547464446484547454747474847
.91.60
.10.83.06
.19.43.83
.61.13
.02.75
.94
.90
.47.54
.80.02.79
53.6753.85
52.2752.0752.00
51.4851.4651.84
50.1352.6652.55
50.4352.76
53.8152.1353.81
51.02
53.5853.51
53.8353.7753.96
10
1.7
4C
Q#
1A
p1
.1
101.8
3C
Q#1A
p1.2
99
.10
CQ
#1
Ap
2.1
99.08 C
Q#1A
p2.2 98.79 C
Q#
1A
p2
.3
97.69 CQ
#1Ap3.1
97.41 CQ
#1
Ap
3.2
98.03 C
Q#
1A
p3
.3
Subhedral (20x20)
Subhedral (30x40)
Subhedral (30x30)
95.48 CQ
#1 Ap5.1 Fram
boid (15)100.32 C
Q#1A
p5.2 Fram
boid (15)99.56 C
Q#1A
p5.3 Fram
boid (15)
95.52 CQ
#1Ap6.1
Subhedral (30x40)
99.23 CQ
#1Ap6.2
101.94CQ
#1Ap7.1
Subhedral (30x40)
98.02 CQ
#1Ap7.2
101.8
9C
Q#1A
p7.3
97.02 CQ
#1Ap8.2
Fram
boid (20)
10
1.2
3C
Q#
1A
p9
.1
Subhedral (25x40)
101
.24C
Q#1A
p9.2
101.75CQ
#1Ap10.1 S
ubhedral (25x40)1
01
.90
CQ
#1
Ap
10
.2101.92 C
Q#1A
p10.3
31

App
endi
x 2
(con
tinue
d):
Qua
ntita
tive
mic
ropr
obe
anal
yses
of 2
6 py
rite
grai
ns f
or s
ampl
e C
Q35
2 (v
alue
s in
wei
ght
perc
ent;
d.l.=
det
ectio
n lim
it
No.
Se
Ni
Co
Cu
Zn
As
Pb
FeTo
tal
Com
men
t
12
0.01
12
d.l.
12
d.l.
13
0.01
13
0.03
13
0.02
14
d.l.
14
d.l.
15
d.l.
15
0.01
15
0.01
16
0.52
16
0.66
16
1.24
17
d.l.
17
d.l.
17
d.l.
17
d.l.
18
d.l.
18
d.l.
18
d.l.
19
0.02
19
0.02
0.05
0.03
0.05
0.04
0.03
0.03 d.l.
0.01 d.l.
d.l.
d.l.
1.52
1.54
1.25 d.l.
0.01 d.l.
d.l.
d.l.
0.01 d.l.
0.04
0.03
0.02
0.02
0.03
0.04
0.04
0.02
0.01
0.01
0.02
0.02
0.01
0.40
0.51
1.30
0.02 d.l.
0.01
0.01
0.02
0.03
0.03
0.02
0.01
0.02
0.01
0.02
0.03
0.05
0.03
0.02
0.01 d.l.
d.l.
d.l.
0.16
0.18
0.15 d.l.
d.l.
d.l.
d.l.
d.l.
d.l.
d.l.
0.06
0.06
0.02 d.l.
0.02
0.02 d.l.
0.01
0.01
0.01 d.l.
d.l.
d.l.
0.01 d.l.
0.01 d.l.
0.01 d.l.
0.01 d.l.
d.l.
d.l.
d.l.
d.l.
0.30
0.17
0.20
0.05
0.05
0.04
0.04
0.06
0.03
0.02
0.01
1.00
0.61
0.82
0.03
0.08
0.07
0.05
0.02 d.l.
0.02
0.08
0.06
0.01 d.l.
d.l.
d.l.
d.l.
d.l.
d.l.
d.l.
d.l.
d.l.
d.l.
d.l.
0.36
0.48 d.l.
d.l.
d.l.
d.l.
d.l.
d.l.
d.l.
d.l.
d.l.
46.2
647
.90
47.2
4
47.8
547
.64
47.7
4
46.4
246
.66
47.9
348
.21
48.0
8
43.3
843
.52
38.8
6
48.7
048
.29
48.1
348
.12
47.0
847
.00
46.8
6
46.6
146
.38
51.4
753
.27
52.5
4
53.8
052
.90
53.1
6
51.9
252
.26
53.2
354
.18
54.6
8
51.5
452
.04
46.8
3
53.8
253
.67
53.4
253
.26
52.3
751
.37
51.4
1
52.7
452
.33
98.
101
22 .47
100.
17
101
100
101
98.
99.
101
102
102
98.
99.
91.
102
102
101
101
99.
98.
98..9
0.8
0.1
2
48 09 .28
.51
.87
59 48 02 .65
.13
.70
.52
55 49 38
99.6
298
.97
CQ
#1A
p11.
1C
Q#1
Ap1
1.2
CQ
#1A
p11.
3
CQ
#1A
p12.
1C
Q#1
Ap1
2.2
CQ
#1A
p12.
3
CQ
#1A
p13.
1C
Q#1
Ap1
3.2
CQ
#1A
p14.
1C
Q#1
Ap1
4.2
CQ
#1A
p14.
3
CQ
#1A
p15.
1C
Q#1
Ap1
5.2
CQ
#1A
p15.
3
CQ
#1B
p1.1
CQ
#1B
p1.2
CQ
#1B
p1.3
CQ
#1B
p1.4
CQ
#1B
p2.1
CQ
#1B
p2.2
CQ
#1B
p2.3
CQ
#1B
p3.1
CQ
#1B
p3.2
Form
(si
ze)
(mic
rons
)
Fram
boid
(20
)
Fram
boid
(20
)
Sub
hedr
al (
20x2
0)
Sub
hedr
al (
30x5
0)
Hal
ffram
boid
(25)
Sub
hedr
al (
25x7
0)
Fram
boid
(25
)
32

Appendix 2 (continued): Q
uantitative microprobe analyses of 26 pyrite grains for sam
ple CQ
352 (values in w
eight percent; d.l.= detection limit)
No.20202020
202021212121222223232324242525252526262626
Se
0.02d.l.d.l.d.l.d.l.d.l.
d.l.0.01d.l.d.l.
0.010.01
0.02d.l.d.l.
d.l.d.l.
d.l.d.ld.l.d.l
d.l.d.l.d.l.
0.01
Ni
d.l.d.l.d.l.d.l.d.l.d.l.
d.l.d.l.
0.01d.l.
0.04d.l.
d.l.0.010.01
d.l.d.l.
d.l.dl
0.01rtl
0.01d.l.
0.01d.l.
Co
0.010.010.020.020.01d.l.
0.010.020.020.02
0.010.02
0.01d.l.
0.01
0.010.02
0.01dl
d.l.dl
0.020.020.010.01
Cu
d.l.0.01d.l.d.l.
0.010.01
d.l.d.l.d.l.d.l.
0.010.01
d.l.d.l.d.l.
d.l.d.l.
0.030040.01001
d.l.d.l.d.l.
0.01
Zn
d.l.0.01d.l.d.l.d.l.d.l.
d.l.0.01d.l.d.l.
d.l.d.l.
0.01d.l.d.l.
d.l.d.l.
d.l.d.l.d.l.d.l.
d.l.d.l.d.l.
0.01
Mb
0.270.200.120.040.110.12
0.110.070.100.08
0.091.72
0.01d.l.
0.04
0.090.03
0.010.020.030.03
0.310.270.480.32
Pb
d.l.d.l.d.l.d.l.d.l.d.l.
d.l.d.l.d.l.d.l.
d.l.d.l.
d.l.d.l.d.l.
d.l.d.l.
d.l.d.l.d.l.d.l.
d.l.d.l.d.l.d.l.
f-e
48.0348.3348.2647.5748.0047.85
47.4847.8747.4347.02
46.4547.55
47.3348.2147.75
47.2947.79
46.7546.8646.2946.44
47.3947.1446.8546.07
S54.0754.4553.9853.77
53.5352.90
53.4553.1353.0553.53
52.5452.94
53.6653.8553.62
52.8252.60
52.1852.2951.9752.01
53.6353.8853.1553.30
Total
102.47103.09102.45101.47101.74100.94
101.12101.17100.66100.73
99.22102.31
101.10102.15101.49
100.27100.50
99.0599.2898.3898.56
101.44101.38100.5799.79
Com
ment
CQ
#1Bp4.1
CQ
#1Bp4.2
CQ
#1Bp4.3
CQ
#1 Bp4.4
CQ
#1Bp4.5
CQ
#1Bp4.6
CQ
#1Bp5.1
CQ
#1
Bp
5.2
CQ
#1Bp5.3
CQ
#1Bp5.4
CQ
#2AP
1.1C
Q#2A
P1 .3
CQ
#2AP
2.2C
Q#2A
P2.3
CQ
#2AP
2.4
CQ
#2AP
3.1C
Q#
2A
P3
.2
CQ
#2AP
4.1C
Q#
2A
P4
.2C
Q#2A
P4.3
CQ
#2AP
4.4
CQ
#2AP
5.1C
Q#2A
P5.2
CQ
#2AP
5.3C
Q#2A
P5.4
Form (size)
(miu
lons)
Subhedral (60x80)
Subhedral (60x90)
Subhedral (35x50)
Subhedral (45x100)
Subhedral (40x70)
Subhedral (45x45)
Subhedral (20x40)
33

App
endi
x 3:
Dat
a fro
m in
divi
dual
spl
its
The
"be
st o
vera
ll va
lues
" in
App
endi
x 3
are
also
rep
orte
d in
Tab
le 3
. A
ppen
dix
3 al
so g
ives
sep
arat
e "b
est v
alue
s"
for
INA
A a
nd fo
r "o
ther
tech
niqu
es"
beca
use
som
e el
emen
ts d
eter
min
ed b
y IN
AA
wer
e al
so d
eter
min
ed b
y ot
her
tech
niqu
es b
ut th
ere
is n
o du
plic
atio
n of
resu
lts b
etw
een
the
othe
r te
chni
ques
.A
ll IN
AA
val
ues
wer
e de
term
ined
in th
e sa
me
irrad
iatio
n w
ith q
ualit
y co
ntro
l sam
ples
sub
mitt
ed b
y C
Q (
App
endi
x 4-
1) a
nd
qual
ity c
ontr
ol s
tand
ards
: U
SG
S s
tand
ard
refe
renc
e m
ater
ial C
LB-1
and
Nat
iona
l Ins
titut
e fo
r S
tand
ards
and
Tec
hnol
ogy
(NIS
T) c
ertif
ied
refe
renc
e m
ater
ial 1
632C
(A
ppen
dix
4-2)
. Th
e qu
ality
con
trol
sta
ndar
ds fo
r "o
ther
tech
niqu
es"
(App
endi
x 4-
2) w
ere
also
run
tog
ethe
r with
the
sam
ple
split
s in
App
endi
x 3.
Sam
ples
CQ
353A
and
CQ
352B
wer
e su
bmitt
ed a
s bl
ind
dupl
icat
es.
CQ
352B
A w
as a
lab
dupl
icat
e of
CQ
352B
.
34
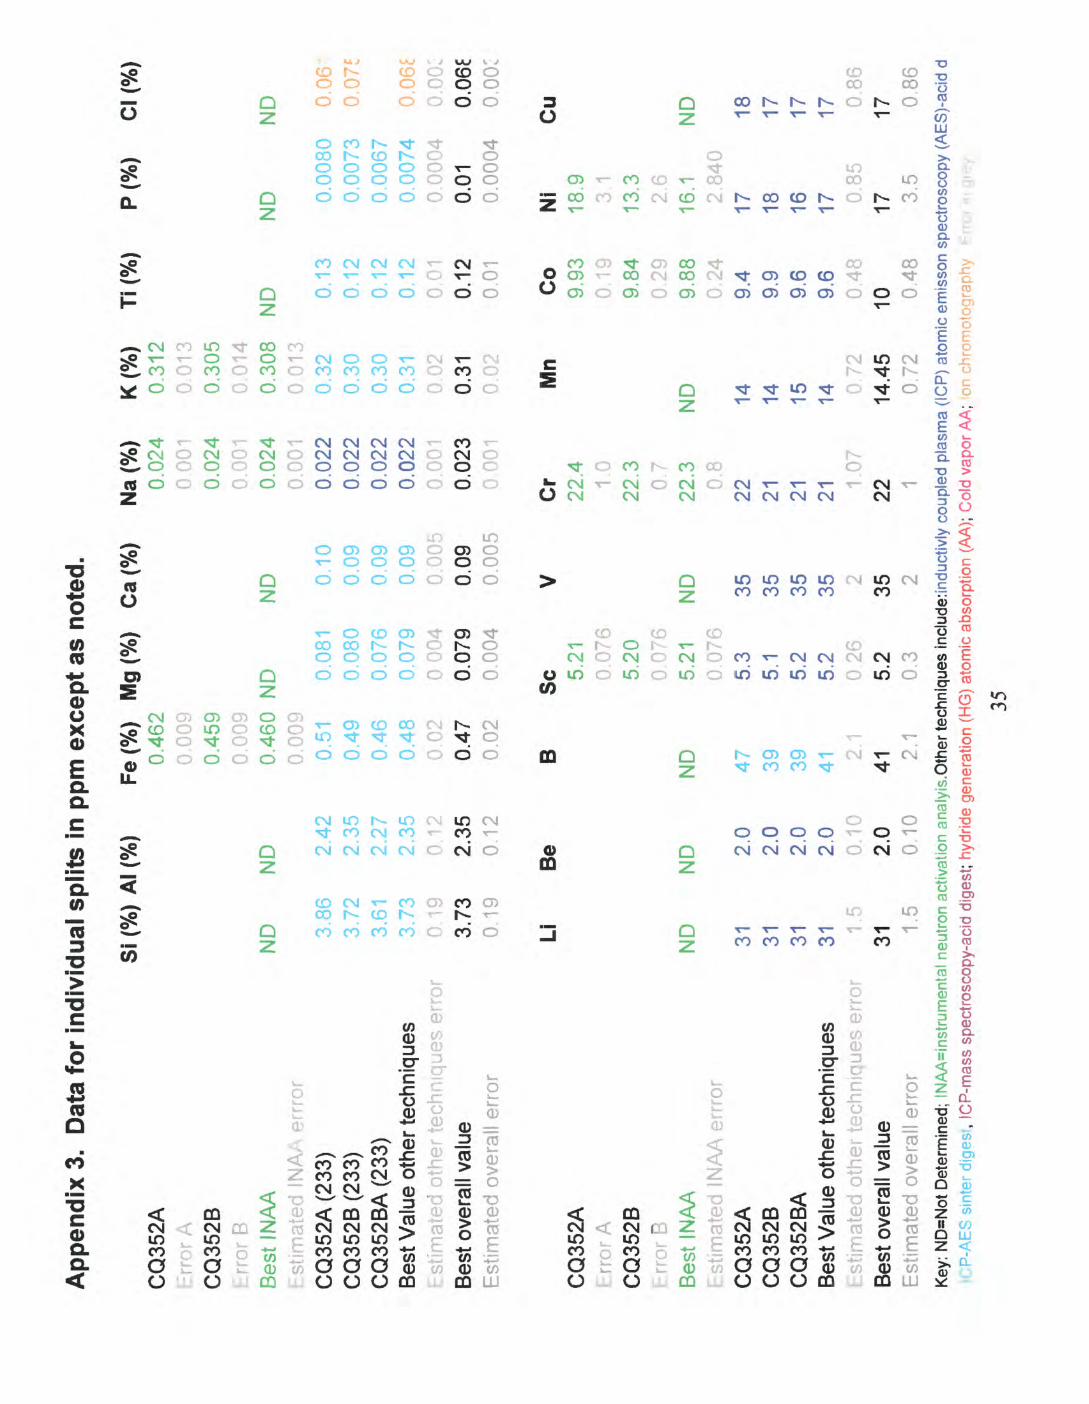
App
endi
x 3.
D
ata
for
indi
vidu
al s
plits
in
ppm
exc
ept a
s no
ted.
Si (
%)
Al
(%)
Fe (
%)
Mg
(%)
Ca
(%)
Na
(%)
K (
%)
Ti (
%)
P (%
) C
l (%
)C
Q35
2Arr
or A
C
Q35
2B
i_rr
or B
B
est
INA
AF
stim
ate^
IN
AA
err
ror
CQ
352A
(23
3)
CQ
352B
(23
3)
CQ
352B
A (
233)
B
est V
alue
oth
er te
chni
ques
F
chni
ques
err
or
Bes
t ove
rall
valu
e E
stim
ated
ove
rall
erro
r
CQ
352A
rroi
C
Q35
2Brr
or B
B
est
INA
Ast
imat
ed I
NA
A e
rrro
r C
Q35
2A
CQ
352B
C
Q35
2BA
B
est V
alue
oth
er te
chni
ques
.siii
,. ^u
oth
er te
chni
ques
err
or
Bes
t ov
eral
l val
ue
Est
imat
ed o
vera
ll er
ror
Key
: N
D=N
ot D
eter
min
ed;
INA
A=i
nstru
men
tal
neut
ron
activ
atio
n an
alyi
s.O
ther
tech
niqu
es in
clud
e:in
duct
ivly
cou
pled
pla
sma
(ICP
) at
omic
em
isso
n sp
ectro
scop
y (A
ES
)-ac
id d
IC
P-A
ES
sin
ter
dige
st,
ICP
-mas
s sp
ectro
scop
y-ac
id d
iges
t; hy
drid
e ge
nera
tion
(HG
) at
omic
abs
orpt
ion
(AA
); C
old
vapo
r A
A;
ion
chro
mot
ogra
phy
Err
or «
> gi
ey
35
ND 3.
863.
723.
613.
730.
193.
730.
19
Li ND 31 31 31 311.
531
1.5
ND 2.
422.
352.
272.
350.
122.
350.
12
Be
ND 2.
02.
02.
02.
00.
102.
00.
10
0.46
2 0.
009
0.45
90.
009
0.46
00.
009
0.51
0.49
0.46
0.48
0.02
0.47
0.02
B
ND 47 39 39 412.
141
2.1
ND 0.
081
0.08
00.
076
0.07
90004
0.07
90.
004
Sc 5.
210.
076
5.20
0.07
65.
210.
076
5.3
5.1
5.2
5.2
02
65.
20.
3
ND 0.
100.
090.
090.
090.
005
0.09
0.00
5
V
ND 35 35 35 35 2 35 2
0 0 0 0 0 0 0 0 0 0 0 0 0
Cr
221
22 0 22 0 22 21 21 211
221.0
24
.001
.0
24.0
01.0
24.0
01.0
22.0
22.0
22.0
22I
M
.023 001
.4 .0 .3 .7 .3 .8 .07
0.31
2 0.
013
0.30
50.
014
0.30
80013
0.32
0.30
0.30
0.31
0.02
0.31
0.02 Mn
ND 14 14 15 14 0.
7214
.45
0.72
ND 0.
130.
120.
120.
120.
010.
120.
01 Co
9.93
0.19
9.84
0.29
9.88
0.24
9.4
9.9
9.6
9.6
0.48
10 0.48
ND 0. 0. 0. 0. 0. 0. 0. Ni
18. 3 13. 2. 16. 2. 17 18 16 17 0. 17 3.
0080
0073
0067
0074
0004
01 0004
9 1 3 6 1 840
85 5
ND 0
.06'
0.07
J
0.06
EO.
OOG
0.06
£o.
oo:
Cu
ND 18 17 17 17 0.
8617 0.
86

App
endi
x 3.
D
ata
for
indi
vidu
al s
plits
in p
pm (
cont
inue
d)
Zn
Ga
Ge
As
Se
Br
Rb
Sr
CQ
352A
Eriu
, M
CQ
352B
Err
or B
Bes
t IN
AA
Est
imat
ed I
NA
Aer
rror
CQ
352A
CQ
352B
CQ
352B
AB
est V
alue
oth
er te
chni
ques
stim
ated
oth
er te
chni
ques
err
or
Bes
t ove
rall
valu
e E
stim
ated
ove
rall
erro
r
CQ
352A
Err
or A
C
Q35
2B
Err
or B
B
est
INA
Ast
imat
ed I
NA
Aer
rror
C
Q35
2A
CQ
352B
C
Q35
2BA
B
est V
alue
oth
er te
chni
ques
?d o
ther
tec
hniq
ues
erro
r B
est o
vera
ll va
lue
Est
imat
ed o
vera
ll er
ror
Key:
ND
=Not
Det
erm
ined
; IN
AA
=ins
trum
enta
l ne
utro
n ac
tivat
ion
anal
yis.
othe
r tec
hniq
ues
incl
ude:
indu
ctiv
ly c
oupl
ed p
lasm
a (IC
P) a
tom
ic e
mis
son
spec
trosc
opy
(AE
S)-
acid
d
ICP
-nE
S s
inte
r di
gest
, IC
P-m
ass
spec
trosc
opy-
acid
dig
est;
hydr
ide
gene
ratio
n (H
G)
atom
ic a
bsor
ptio
n (A
A);
Col
d va
por A
A; I
on c
hrom
otog
raph
y F
i n
grey
36
18 1 18 1 18 1 16 17 17 17 084
171 Zr
ND 33 30 28 30
1 5
30.3 1.5
ND 43 42 43 43 2
143
2.1
Nb
ND 3.
22.
72.
82.
90
142.
880.
14
ND 15 15 15 15 0
75
15 0.75
Mo 2.
50.
61.
30.
41.
90.
51.
61.
61.
61.
60
-.£
1.6
0.5
6.7
02
6.5
0.2
6.6
0.2
6.4
6.4
6.3
6.4
03
26.
50.
3 Cd
ND
0.06
20.
055
0.06
00.
059
0 0'
.0.
060.
003
6.2
05
5.9
04
6.1
05
6.0
6.8 ND
6.4
03
26.
30.
5
Sn
ND
1.7
1.2
1.4
1.5
L'07
1.45
0.07
20.9 0.5
21.3 0.5
21.1 0.5 N
D
21.1 0.5 S
b0.
612
0.02
30.
598
0.02
30.
605
0.02
30.
680.
640.
630.
650
03
0.61
0.05
20.9 1.6
21.0 1 6
21.0 1.6
20 19 20 20 0.96
20.5 1.5 Cs
1.43
0.07
1.42
00
51.
430.
061.
41.
31.
41.
40
07
1.4
0.07
72 13 77 12 74
ND
13 67
9.4
67
9.1
69
9.3
68
9.3
;9
0.46
69
9.28
7 0.
46
Ba
124 12 128 13
126 12
138
132
131
133 6
67
130 8

La 14.1 0.3
14.1 0.3
14.1
0342
Ce
26.1 0.6
25.7 0.8
25.9 0.71
0
Sm
2.76
0.07
2.76
00
72.
70.
066
Eu
0.52
50.
017
0.51
00.
016
0.51
80.
017
Tb 0.34
00
10.
350.
020.
344
00
15
Yb
1.28
00
71.
220.
081.
251
0.07
5
Lu 0.17
0.01
0.17
0.01
0.17
0.01
2
Hf
1.02
00
81.
01004
1.01
0.05
7
App
endi
x 3.
D
ata
for
indi
vidu
al s
plits
in p
pm (
cont
inue
d)
CQ
352A
A
CQ
352B
ror
B B
est
INA
Ast
imat
ed I
NA
A e
rrro
r C
Q35
2A
CQ
352B
C
Q35
2BA
Bes
t Val
ue o
ther
tech
niqu
es
ND
N
D
ND
N
D
ND
N
D
ND
N
D
r.stim
ateu
oth
er te
chni
ques
err
orB
est
over
all v
alue
14
.1
25.9
2.
8 0.
52
0.34
1.
25
0.17
1.
01
Est
imat
ed o
vera
ll er
ror
0.3
0.7
0.1
0.01
7 0.
015
,075
0.
012
06
Ta
W
Tl
Hg
Pb
Bi
Th
UC
Q352A
0.
32
1.0
3.75
1.
4E
rror
A
0.01
0.
1 0
08
0.
1C
Q35
2B
0.32
0.
73
3.63
1.
3rr
orB
0.
03
0.07
008
0.1
Bes
t IN
AA
0.
32
0.86
N
D
ND
N
D
ND
3.
69
1.35
2st
imat
ed I
NA
A e
rrro
r 0.
021
0.07
4 0.
080
0105
CQ
352A
0.
75
0.15
9.
4 0.
18
3.6
1.4
CQ
352B
0.
70
0.14
8.
8 0.
17
3.5
1.3
CQ
352B
A
0.71
0.
15
9.2
0.17
3.
4 1.
3B
est V
alue
oth
er te
chni
ques
N
D
ND
0.
72
0.15
9.
1 0.
17
3.5
1.3
isti'
;L
othe
r te
chni
ques
err
or
0.04
0.
008
0.46
0.
01
0.18
0.
07B
est o
vera
ll va
lue
0.32
0.
86
0.72
0.
15
9.14
0.
17
3.6
1.4
Est
imat
ed o
vera
ll er
ror
0.02
0.
07
0.04
0.
008
0.46
0.
01
0.18
0.
10K
ey:
ND
=Not
Det
erm
ined
; IN
AA
=ins
trum
enta
l ne
utro
n ac
tivat
ion
anal
yis.
othe
r te
chni
ques
incl
ude:
indu
ctiv
ly c
oupl
ed p
lasm
a (IC
P)
atom
ic e
mis
son
spec
trosc
opy
(AE
S)-
acid
d
iCP
-AE
S s
inte
r di
gest
, IC
P-m
ass
spec
trosc
opy-
acid
dig
est;
hydr
ide
gene
ratio
n (H
G)
atom
ic a
bsor
ptio
n (A
A);
Col
d va
por
AA
; Io
n ch
rom
otog
raph
y E
rror
in g
rey
37

Appendix 4. Quality Control Data
Control samples in Appendix 4-1 were submitted as blind samples. Due to limited sample size elemental concentrations in these samples were determined only by INAA. Elemental concentrations of standard reference material USGS CLEM and certified reference material NIST 1632C (Appendix 4-2) were determined with the samples in Appendix 3 for all techniques. Elemental concentrations of certified reference materials, NIST 1633b and NIST 1632b, were also determined for selected techniques (Appendix 4-2).
38

Tabl
e A
4-1.
C
Q "
Blin
d" q
ualit
y co
ntro
l sa
mpl
es. V
alue
s in
ppm
exc
ept
as n
oted
.
varia
bles
:C
Q01
1120
2Er
ror:
CQ
01 1
1202
Err
or:
Ave
rage
Aver
age
Erro
r
CQ
O11
1208
Erro
r:C
Q01
1120
8E
rror
:A
vera
geA
vera
ge E
rror
CQ
0111
211
Err
or:
CQ
0111
211
Erro
r:A
vera
geA
vera
ge E
rror
CQ
O11
1214
Erro
r:C
Q01
1121
4Er
ror:
Ave
rage
Ave
rage
Erro
r
CQ
O11
1218
Err
or:
CQ
0111
218
Err
or:
Ave
rage
Ave
rage
Erro
r
Sc
5.26
0.08
5.27
0.08
5.26
0.07
7
5.26
0.08
5.30
0.08
5.28
0.07
7
5.19
0.08
5.17
0.08
5.18
0.07
5
5.18
0.07
55.
120.
079
5.15
0.07
7
2.80
0.04
32.
790.
042
2.80
0.04
3
Se 5.
700.
576.
240.
325.
970.
445
5.67
0.88
6.02
0.56
5.84
10.
719
5.32
0.92
5.59
0.65
5.45
20.
788
5.89
50.
551
5.44
70.
838
5.67
10.
694
1.20
60.
143
1.08
50.
205
1.14
50.
174
Sr
82.8
11.7
96.1 9.67
89.5
10.7
89.8
17.1
82.3
10.9
86.0
14.0
78.4
10.9
82.4
13.0
80.4
12.0
66.9
10.0
73.2 8.6
70.1 9.3
68.8
11.0
65.3
10.9
67.0
10.9
Ta 0.
350.
010.
350.
020.
352
0.01
9
0.34
0.01
0.35
0.02
0.34
30.
016
0.34
0.02
0.32
0.01
0.32
70.
019
0.34
70.
015
0.32
90.
015
0.33
80.
015
0.14
20.
011
0.13
30.
009
0.13
70.
010
Th 3.89
0.08
3.95
0.10
3.92
0.09
1
3.96
0.08
3.88
0.08
3.92
0.08
3
3.74
0.08
3.74
0.08
3.74
0.07
9
3.73
60.
089
3.76
0.08
33.
750.
09
1.35
0.04
01.
350.
048
1.35
0.04
4
U 1.20
0.10
1.35
0.11
1.28
0.11
1.47
0.13
1.25
0.10
1.36
0.11
3
1.35
0.10
1.37
0.11
1.36
0.10
5
1.30
0.10
1.39
0.11
1.34
0.10
0.53
80.
071
0.47
40.
062
0.50
60.
066
W 0.73
0.06
0.80
0.07
0.76
50.
070
0.71
0.06
0.99
0.11
0.84
70.
088
0.83
0.09
0.86
0.08
0.84
40.
084
0.71
30.
064
0.83
60.
077
0.77
50.
070
0.42
10.
061
0.24
40.
047
0.33
30.
054
Zn 32.4 1.7
32.6 1.9
32.5 1.8
30.9 1.6
33.7 1.6
32.3 1.6
19.2 1.3
20.3 1.4
19.7 1.3
19.0 1.5
16.8 2.4
17.9 1.9
10.9
0.85
10.2
0.90
10.5
0.88
La 14.7 0.35
14.6 0.36
14.6
0.35
4
14.5 0.35
14.7 0.36
14.6 0.35
14.0 0.34
14.1 0.34
14.0 0.34
14.1 0.34
14.1 0.34
14.1 0.34
6.50
0.17
6.49
0.17
6.50
0.17
Ce
27.0 0.58
27.4 0.62
27.2 0.60
27.1 0.59
27.3 0.61
27.2 0.60
26.0 0.57
26.3 0.60
26.2 0.58
25.6 0.65
26.2 0.58
25.9 0.62
11.4 0.52
11.6 0.35
11.5 0.43
Sm 2.80
0.06
62.
800.
067
2.80
0.06
6
2.79
0.07
2.81
0.07
2.80
0.06
7
2.75
0.06
2.76
0.07
2.75
0.06
5
2.76
0.06
52.
770.
066
2.77
0.06
6
1.10
0.02
91.
090.
028
1.10
0.02
8
Eu 0.
510.
018
0.53
0.01
70.
522
0.01
8
0.53
0.02
0.55
0.02
0.54
00.
020
0.53
0.02
0.52
0.02
0.52
80.
017
0.54
60.
017
0.53
20.
017
0.53
90.
017
0.22
10.
011
0.20
80.
009
0.21
50.
010
Tb 0.
360.
013
0.36
0.01
40.
361
0.01
3
0.34
0.01
0.36
0.01
0.35
30.
013
0.36
0.01
0.35
0.01
0.35
60.
013
0.34
60.
020
0.36
10.
014
0.35
30.
017
0.13
50.
012
0.12
80.
007
0.13
10.
009
Yb 1.
320.
083
1.28
0.07
81.
300.
080
1.31
0.08
1.16
0.08
1 24
0.07
7
1.30
0.12
1.16
0.14
1.23
0.12
8
1.33
0.12
41.
280.
076
1.31
0.10
0
0.49
20.
056
0.55
20.
066
0.52
20.
061
40

1.20
1.17
0.09
8
1.61
1.65
40.
0034
231
23.0
20.
08
0.79
0.79
90.
021
0.91
0.91
50.
0013
7
15.1
15.0
50.
27
0.89
50
02
20.
860.
874
0.35
0.75
50
01
20.
740.
735
0.11
6.5
7.78
0.23
0.03
0.02
830.
0018
0.03
0.03
840.
0032
0.5
0.48
20.
008
015
0.16
0.00
71
0.14
0.14
50.
030
1.6
1.51
0.06
0.01
98O
.OO
OSf
0.02
390.
017
0.00
2
0.03
1O
.OO
OSf
!0.
0292
0.02
988
0.00
048
0.19
0.20
10.
003
0.06
40.
0040
0.06
0.06
30.
004
0.10
60.
0057
0.11
0.11
000.
0033
2 1.95
0.03
0.05
0.04
70.
0018
0.05
0.05
170.
0032
07
70.
791
0.01
4
0.03
0.03
10.
004
0.01
0.01
5
0.24
0.23
01
13
0.11
40.
1139
0.00
41
ND
ND
8 8 8 8
173
Tabl
e A
4-2
US
GS
Qua
lity
Con
trol
Sta
ndar
ds V
alue
s in
ppm
exc
ept a
s no
ted
Si(%
) A
l(%
) F
e(%
) M
g(%
) C
a (%
) N
a (%
) K
(%
) Ti
(%
) P
(%)
Cl (
%)
IC
LB-1
Err
orC
LB-1
Rec
omm
ende
d/In
form
atio
nE
rror
(R
ecom
men
ded
and
info
rmat
ion)
1632
-C
Err
or16
32-C
Cer
tifie
d/R
efer
ence
/lnfo
rmat
iona
l E
rror
(C
ertif
ied
and
Ref
eren
ce v
alue
s)
1633
-BC
ertif
ied/
Non
certi
fied
Err
or (
Cer
tifie
d va
lues
)
1632
-B
0.10
7 C
ertif
ied/
Non
certi
fied
0.12
6 Er
ror
(Cer
tifie
d va
lues
)
Be
B
Sc
V
Cr
Mn
Co
Ni
Cu
ZnC
LB-1
Err
orC
LB-1
Rec
omm
ende
d/I n
form
atio
nE
rror
(R
ecom
men
ded
and
info
rmat
ion)
1632
-C
Erro
r16
32-C
Cer
tifie
d/R
efer
ence
/Info
rmat
iona
l E
rror
(Cer
tifie
d an
d R
efer
ence
val
ues)
1633
-B (
233)
C
ertif
ied/
Non
certi
fied
Err
or (
Cer
tifie
d va
lues
) 3.
6 4.
7 1.
7 1.
8 2.
6 Ke
y:N
D=N
ot D
eter
min
ed;
INAA
=ins
trum
enta
l neu
tron
activ
atio
n an
alyi
s.ot
her t
echn
ique
s in
clud
e:in
duct
ivly
cou
pled
pla
sma
(ICP)
ato
mic
em
isso
n sp
ectro
scop
y (A
ES)-a
cid
dige
st;
ICP-
AES
sint
er d
iges
', IC
P-m
ass
spec
trosc
opy-
acid
dig
est;
hydr
ide
gene
ratio
n (H
G)
atom
ic a
bsor
ptio
n (A
A); C
old
vapo
r AA;
Ion
cnr
umot
ogra
phy.
41
1.17
1.17
1.01
1.0
12.6
441
2 0 2.04
.029
.12
2.0
61.72
62 2 61.9
0 2 0 2 2 0 41 41
.1 .83
.039
.86
.905
.036
.8
12 12 1 22.4
23.72
0.51
288
295.
7
10.2 0.41
10.5 9.7
1.2
13.9 0.79
14.4
13.73
0.2
182
198.2
8.95
8 13.0
13.04
0.53
129
131.8
6.97
0.14
6.74
7.0
0.7
3.43
0.18
3.79
3.48
0.20
50.0
50
13.6 3.4
19.0
18 2 10.7 2.9
10.1
09.
320.
51
108
120.6
11.1
10 5.93
6.01
0.25
108
112.8
5C 3.5
44.4
48.0
10.5 0.92
13.6
12.1 1.3
192
210
2 3 3 3 51
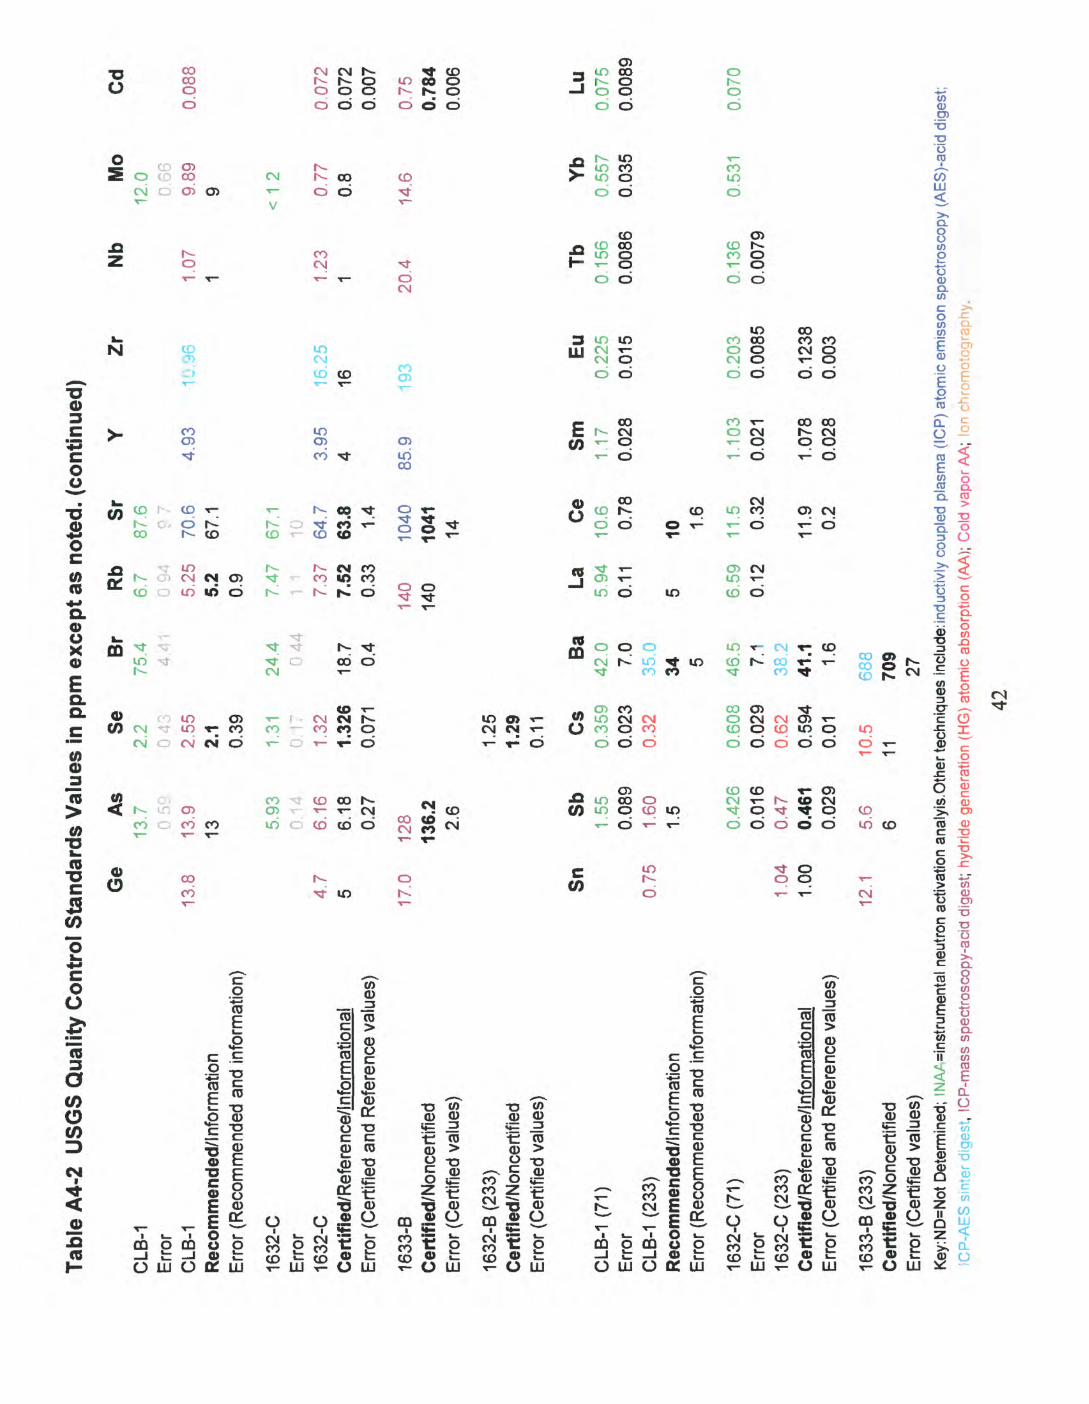
Tabl
e A
4-2
US
GS
Qua
lity
Con
trol
Sta
ndar
ds V
alue
s in
ppm
exc
ept a
s no
ted,
(co
ntin
ued)
CLB
-1E
rror
CLB
-1R
ecom
men
ded/
Info
rmat
ion
Err
or (
Rec
omm
ende
d an
d in
form
atio
n)
1632
-C
Err
or16
32-C
Cer
tifie
d/R
efer
ence
/Info
rmat
iona
l E
rror
(C
ertif
ied
and
Ref
eren
ce v
alue
s)
1633
-BC
ertif
ied/
Non
certi
fied
Err
or (C
ertif
ied
valu
es)
1632
-6(2
33)
Cer
tifie
d/N
once
rtifie
d E
rror
(C
ertif
ied
valu
es)
CLB
-1 (
71)
Err
orC
LB-1
(23
3)Re
com
men
ded/
Info
rmat
ion
Err
or (
Rec
omm
ende
d an
d in
form
atio
n)
1632
-C (
71)
Err
or16
32-C
(23
3)C
ertif
ied/
Ref
eren
ce/In
form
atio
nal
Err
or (C
ertif
ied
and
Ref
eren
ce v
alue
s)
1633
-6(2
33)
Cer
tifie
d/N
once
rtifie
d E
rror
(C
ertif
ied
valu
es)
27K
ey:N
D=N
ot D
eter
min
ed;
INA
A=i
nstru
men
tal n
eutro
n ac
tivat
ion
anal
yis.
Oth
er te
chni
ques
incl
ude:
indu
ctiv
ly c
oupl
ed p
lasm
a (IC
P) a
tom
ic e
mis
son
spec
trosc
opy
(AE
S)-
acid
dig
est;
iCP
-AE
S s
inte
r dig
est,
ICP
-mas
s sp
ectro
scop
y-ac
id d
iges
t; hy
drid
e ge
nera
tion
(HG
) aw
mic
abs
orpt
ion
(AA)
; C
old
vapo
r AA;
Ion
chr
omot
ogra
phy.
42
Ge
13.8
4.7
5 17.0 Sn
0.75
1.04
1.00
12.1
As
13.7 : 5°
13.9
13 5.93
0 1
4
6.16
6.18
0.27
128
136.
22.
6 Sb
1.55
0.08
91.
601.
5
0.42
60.
016
0.47
0.46
10.
029
5.6
6
Se
2.2
04
32.
552.
10.
39
1.31
0 1.32
1.32
60.
071
1.25
1.29
0.11 C
s0.
359
0.02
30.
32
0.60
80.
029
0.62
0.59
40.
01
10.5
11
Br
75.4 4.41
24.4 044
18.7 0.4 Ba
42.0 7.0
35.0
345
46.5 7.1
38.2
41.1 1.6
688
709
Rb
6.7
C:
5.25
5.2
0.9
7.47
1 '
7,37
7.52
0.33
140
140 La 5.94
0.11
5 6.59
0.12
Sr
Y
Zr
Nb
Mo
87.6
12
.0P
7
P^G
70.6
4.
93
10.9
6 1.
07
9.89
67.1
1
9
67.1
<
1 2
10 64.7
3.
95
16.2
5 1
23
0.77
63.8
4
16
1 0.
81.
4
1040
85
.9
193
20.4
14
.610
4114
Ce
Sm
E
u Tb
Y
b10
.6
1.17
0.
225
0.15
6 0.
557
0.78
0.
028
0.01
5 0.
0086
0.
035
101.
6
11.5
1.
103
0.20
3 0.
136
0.53
10.
32
0.02
1 0.
0085
0.
0079
11.9
1.
078
0.12
380.
2 0.
028
0.00
3
Cd
0.08
8
0.07
20.
072
0.00
7
0.75
0.78
40.
006
Lu0.
075
0.00
89
0.07
0

Tabl
e A
4-2
US
GS
Qua
lity
Con
trol
Sta
ndar
ds V
alue
s in
ppm
exc
ept
as n
oted
, (c
ontin
ued)
Hf
Ta
W
Tl
Hg
Pb
Bi
Th
UC
LB-1
(71
) 0.
445
0.10
6 0.
691
1.40
0.
580
Err
or
0055
0023
00
59
0
05
7
0.07
4C
LB-1
(23
3)
08
3
0.15
4 5.
25
0,09
1.
39
0.53
CLB
-1 (
248)
0.
163
Rec
omm
ende
d/In
form
atio
n 0.
2 5
1.4
0.55
E
rror
(R
ecom
men
ded
and
info
rmat
ion)
1632
-C(7
1)
Err
or
1632
-C (
233)
1632
-C (
248)
Cer
tifie
d/R
efer
ence
/Info
rmat
iona
l Er
ror (
Cer
tifie
d an
d R
efer
ence
val
ues)
1633
-B (
233)
16
33-B
(24
8)
Cer
tifie
d/N
once
rtifi
ed
Err
or (
Cer
tifie
d va
lues
)
1632
-B (
233)
1632
-B (
248)
C
ertif
ied/
Non
cert
ified
E
rror
(C
ertif
ied
valu
es)
0.49
50
04
0
0.58
50.
1
0.12
3 0.
418
00
17
0
04
50.
38
0.09
40.
087
0.4
0.09
380.
0037
6.3
0.13
10.
135
5.9
0.14
10.
019
0.07
5
0.06
9
3.83
3.79
0.07
64.0
68.2 1.1
1.40 1 0
590.
12
1.42
0.1
1.40
0.03
1.1
25.8
25.7 1.3
0.52
00
0 -
0.52
0.51
30.
012
9.5
8.79
0.36
Key:
ND
=Not
Det
erm
ined
; IN
AA=i
nstru
men
tal n
eutro
n ac
tivat
ion
anal
yis.
Oth
er te
chni
ques
incl
ude:
indu
ctiv
ly c
oupl
ed p
lasm
a (IC
P) a
tom
ic e
mis
son
spec
trosc
opy
(AES
)-aci
d di
gest
; iC
P-AE
S si
nter
dig
est,
ICP-
mas
s sp
ectro
scop
y-ac
id d
iges
t; hy
drid
e ge
nera
tion
(HG
) at
omic
abs
orpt
ion
(AA)
; C
oid
vapo
r AA;
Ion
rhr
omot
ogra
phv.
43