2003 methods for surveying marbled murrelets
TRANSCRIPT

METHODS FOR SURVEYING MARBLED MURRELETS IN FORESTS: A REVISED PROTOCOL FOR LAND MANAGEMENT AND RESEARCH
Compiled and edited by:
Diane Evans Mack William P. Ritchie
S. Kim Nelson Elena Kuo-Harrison
Peter Harrison Thomas E. Hamer
For the Pacific Seabird Group
Marbled Murrelet Technical Committee
6 January 2003

i
TABLE OF CONTENTS
ACKNOWLEDGEMENTS......................................................................................................... ii LIST OF FIGURES ..................................................................................................................... iv INTRODUCTION ....................................................................................................................... 1 PURPOSE AND OBJECTIVES.................................................................................................. 2 PLANNING AND CONDUCTING SURVEYS......................................................................... 2
Definitions........................................................................................................................ 2 Inland Limit for Surveys.................................................................................................. 3 Habitat Assessment.......................................................................................................... 4 Survey Types ................................................................................................................... 5 Defining Survey Area and Sites ...................................................................................... 6 Survey Stations and Their Placement ............................................................................. 8
A Simple Technique for Delineating Site Boundaries and Determining Station Location .................................................................................................12
Number of Survey Visits ................................................................................................12 When to Survey................................................................................................................16
INTERPRETING SURVEY RESULTS TO CLASSIFY SURVEY SITES AND AREAS.......20 Significance of Murrelet Behaviors .................................................................................20 Flight ....................................................................................................................20 Vocalizations........................................................................................................21 Classification of Sites ......................................................................................................22 Applying Site Classification ............................................................................................23 How Long Do Survey Results Apply?.............................................................................23
DATA COLLECTION ................................................................................................................24 Training............................................................................................................................24 Data Quality .....................................................................................................................24 Equipment Needed...........................................................................................................25 Reporting Observations ...................................................................................................25
LITERATURE CITED ................................................................................................................26 APPENDIX A Summary of Re-analysis for q and Number of Survey Visits ..........................38 APPENDIX B Description of Eggs ..........................................................................................45 APPENDIX C Observer Training Protocol ...............................................................................48 APPENDIX D Hearing Examination ........................................................................................54 APPENDIX E Forest Bird and Mammal Species Potentially Misidentified as Marbled
Murrelets, and Potential Predators...................................................................................56 APPENDIX F Marbled Murrelet Vocalizations ........................................................................58 APPENDIX G Data Form and Instructions ...............................................................................60 APPENDIX H Use of Radar for Marbled Murrelet Surveys.....................................................71

ii
ACKNOWLEDGEMENTS
In addition to the compilers/editors, the following members of the Pacific Seabird Group’s Marbled Murrelet Technical Committee contributed to writing this protocol:
Janet Anthony, WDFW Brian Cooper, ABR, Inc. Sharon Dechesne-Mansiere, U of Victoria Lee Folliard, USFWS Ron LeValley, Mad River Biologists, Inc.
Sherri Miller, USFS PSW Danielle Prenzlow Escene, WDNR C.J. Ralph, USFS PSW Steve Singer, Singer Environmental
Others who submitted comments and suggestions for the final product were:
Gayle Anderson, Boise Cascade Dave Buchholz, ODF Steven Courtney, SEI Eric Cummins, WDFW Kim Flotlin, USFWS Elizabeth Gayner, BLM John Grettenberger, USFWS Shelley Hall, NPS Scott Horton, WDNR Dave Huber, BLM John Hunter, USFWS
Paul Jones, Friends of Caren Linda Long, USFS PSW Sarah Madsen, USFS Douglas Meekins, Hamer Environmental Scott Osborn, CDFG Ken Ostrom, USFWS Phyllis Reed, USFS Lynn Roberts, USFWS Clint Smith, ODF Amanda Wilson, OSU Mike Wilson, ODF
The 2000-2002 Statistical Analysis Steering Committee, which directed the analyses of survey data and reviewed results, was comprised of:
Danielle Prenzlow Escene, Facilitator, WDNR Diane Evans Mack, USFS PNW Lee Folliard, USFWS Kim Flotlin, USFWS Tom Hamer, Hamer Environmental Scott Horton, WDNR Joe Lint, BLM
Kim Nelson, OSU Scott Osborn, CDFG Martin Raphael, USFS PNW William Ritchie, WDFW Lynn Roberts, USFWS Mike Wilson, ODF
Past (1996-2000) Statistical Analysis Steering Committee members who contributed to planning included:
Naomi Bentivglio, USFWS Steven Courtney, SEI Danny Grunbaum, UW Nancy Lee, USFWS Sarah Madsen, USFS Tami Matsumoto, USFS PSW Gary Miller, USFWS
Sherri Miller, USFWS PSW Martin Nugent, ODFW Bob Progulske, USFWS C. J. Ralph, USFS PSW Howard Stauffer, USFS PSW Lenny Young, WDNR

iii
Statistical tests used for this revision were designed and executed by:
TimMax, USFS PNW Jim Baldwin, USFS, PSW Karen Hyer, USFS, PNW
Bryan Manly, WEST, Inc. Chris Nations, WEST, Inc.
We gratefully acknowledge the original ideas and some of the text provided by authors of previous versions of the inland survey protocol, specifically the leadership of C. J. Ralph, Peter Paton, and S. Kim Nelson in establishing early protocols in 1989 and 1990. We thank Lisa Ballance, Alan Burger, Scott Hatch, Patrick Jodice, and Gary Kaiser for their thoughtful reviews. Technical external reviews were organized and compiled by Anne Harfenist, Coordinator, Pacific Seabird Group Marbled Murrelet Technical Committee.
This document was assembled by Diane Evans Mack, Coordinator, Pacific Seabird Group Inland Survey Protocol Subcommittee. Recommended interim citation (until publication): Evans Mack, D., W. P. Ritchie, S. K. Nelson, E. Kuo-Harrison, P. Harrison, and T. E. Hamer. 2003. Methods for surveying Marbled Murrelets in forests: a revised protocol for land management and research. Pacific Seabird Group unpublished document available at http://www.pacificseabirdgroup.org.
iv
LIST OF FIGURES
Figure 1. A 4-ha (10-acre) timber harvest area is located in the middle of a 122-ha (300-
acre) stand of potential habitat. The survey area (timber harvest area and potential habitat within one-quarter mile of the harvest boundary) includes 83 ha (206 acres). ..................................................................................................... 30
Figure 2. A 2-ha (5-acre) timber harvest area is located on the edge of a 101-ha (250-
acre) stand of potential habitat. A one-quarter mile boundary around the proposed harvest area includes 26 ha (65 acres) of potential habitat. This captures a small portion of the entire contiguous habitat. The additional contiguous habitat that extends beyond the one-quarter mile boundary should also be considered for surveys. ............................................................................ 31
Figure 3. A large survey area of 174 ha (430 acres) divided into three survey sites, with
an example of a naming convention to uniquely identify survey area, sites, and stations................................................................................................................... 32
Figure 4. The survey area (timber harvest area and potential habitat within 1/4 mile of
the sale boundary) includes 85 ha (210 acres). Eleven stations (approximately one station per 8 ha [20 acres]) are needed to survey this area because of limited visibility and steep and complex terrain. ................................................. 33
Figure 5. Two stations are needed to survey this 12-ha (30-acre) site that has a long and
narrow shape.......................................................................................................... 34 Figure 6. Less than 6 ha (15 acres) of this 12-ha (30-acre) site would be surveyed with
this survey station. At least one additional station would be needed to survey this site adequately. ............................................................................................... 34
Figure 7. Example of using one large brushed trail to access many survey stations............ 35 Figure 8. Decision tree to evaluate stands for occupancy by Marbled Murrelets................. 36 Figure 9. Proportion of visits with presence (top) and occupancy (bottom) at sites with at
least one visit of presence or occupancy, respectively. Data for occupancy were restricted to sites surveyed with binomial sampling (a set number of visits regardless of detections). Week 1 begins 15 April, week 12 begins 1 July, week 16 begins 29 July. ……………………………………………… ............... 37

1
METHODS FOR SURVEYING MARBLED MURRELETS IN FORESTS: A REVISED PROTOCOL FOR LAND MANAGEMENT AND RESEARCH
INTRODUCTION
The Marbled Murrelet (Brachyramphus marmoratus) occurs only in North America, from Alaska south to Santa Cruz, California (Nelson 1997), and wintering as far south as Baja California, Mexico (Erickson et al. 1995). The former Asian race of the Marbled Murrelet is now a separate species, the Long-billed Murrelet (Brachyramphus perdix). The Marbled Murrelet is closely associated with old-growth and mature forests for nesting (papers in Ralph et al. 1995), and population declines have been attributed in part to loss or modification of forest habitat (USFWS 1997). This species is state-listed as endangered in California and threatened in Oregon and Washington (Nelson and Sealy 1995). It is listed as nationally threatened in Canada, although it occurs only in British Columbia. In September 1992, the U.S. Fish and Wildlife Service listed Marbled Murrelets as federally threatened in Washington, Oregon, and California (USFWS 1997). The species is not listed in Alaska. Unlike most members of the family Alcidae, Marbled Murrelets most often nest in trees. Exceptions occur in southcentral and western Alaska and British Columbia, where a few nests have been found on the ground in forested and non-forested areas (e.g., Simons 1980, Bradley and Cooke 2001). As of 2002, at least 300 tree nests had been located (S. K. Nelson, pers. comm.). From these locations and additional data gathered over the past 15 years, it is apparent that murrelets nest in old-growth and mature coniferous forests throughout most of their range (Nelson and Sealy 1995, Ralph et al. 1995, Burger 2002). They also have been found in younger forests with structural elements similar to old growth, such as remnant old-growth trees or younger trees with platforms created by deformities or dwarf mistletoe infestations (Grenier and Nelson 1995, Nelson and Wilson 2001). To be effective in maintaining adequate nesting sites, forest land managers need to determine murrelet inland distributions and patterns of habitat use. Few murrelet surveys were conducted in forests before 1984. Methods for conducting surveys from a fixed location were initially evaluated and modified through research in Oregon and California (Paton and Ralph 1988, Nelson 1989). The Pacific Seabird Group (PSG), a professional scientific organization, has taken a lead role in coordinating and promoting research on murrelets. PSG ‘protocol surveys’ have been conducted since 1992 on federal, state, and private forest lands, following protocols put forth in Ralph and Nelson (1992) and Ralph et al. (1993, 1994). These protocols were designed to provide researchers and land managers with standardized techniques to detect murrelets in forests. Since 1994, continued inland surveys and research directed at various aspects of this species’ breeding ecology have generated new insights on nesting behavior, activity patterns, and habitat use. This document is a revised protocol. It compiles information from all previous protocols and provides new recommendations for survey visits based on analyses of murrelet surveys conducted during1989-1998. It provides supporting documentation for many of the recommendations, and clarifies some aspects of the protocol’s use and application. Most importantly, the recommended number of survey visits has changed from previous versions. Research continues to broaden our understanding of murrelet ecology, both inland and at sea, and we expect that this protocol will need modification again in the future. Thus, it is intended as a working document, based on the best available data currently in hand, to be revised as new information is learned.

2
PURPOSE AND OBJECTIVES The objectives of this protocol are to provide scientifically-based methods for biologists, managers, and researchers to: (1) document the occurrence or probable absence of murrelets in a forest at the time of surveys; (2) interpret the biological significance of behaviors observed during surveys to evaluate how murrelets are using forests (i.e., classify sites as ‘presence’, ‘occupied’, or ‘probable absence’; (3) identify the geographic distribution of the Marbled Murrelet; and (4) provide consistency in surveys among land managers. This protocol is based on analyses of 10 years of survey data to provide a statistically-reliable approach to classifying surveyed areas. Surveys are designed to achieve a high confidence that occupied sites are classified correctly. While applicable in Washington, Oregon, and California, the described methods may require modification for use in British Columbia and Alaska, and may not be applicable during years with abnormal climatic or oceanographic conditions. The guidelines were developed primarily for management purposes, but are generally applicable to research, with modifications to meet specific research objectives. It is critical to recognize that a protocol aimed at many different users for a variety of purposes cannot cover all possible scenarios. This protocol is to be used hand-in-hand with additional requirements attached by state, provincial, or federal agencies. These generally are distributed in letters accompanying the protocol, at survey training seminars, and in approved project- or site-specific management plans. Because regulatory agencies make the final determination on all aspects of surveys conducted for forest management purposes, the appropriate regulatory agency should be consulted prior to making decisions regarding habitat suitability or planning surveys to meet management objectives.
PLANNING AND CONDUCTING SURVEYS
Definitions For purposes of this protocol, the following definitions apply. Marbled Murrelet nests have been found primarily in mature and old-growth habitat and, in a few cases in Oregon, in younger (60-80 years) forests that have trees with dwarf mistletoe or other deformations or structures that provide a nest platform (Nelson 1997, Nelson and Wilson 2001). Douglas-fir, coast redwood, western hemlock, western red cedar, yellow cedar, mountain hemlock, and Sitka spruce predominate nest stands found to date (Hamer and Nelson 1995a, but see Bradley and Cooke 2001 for a tree nest in a large deciduous red alder and nests on cliffs). Therefore, potential habitat that should be surveyed for murrelets is defined as (1) mature (with or without an old-growth component) and old-growth coniferous forests; and (2) younger coniferous forests that have platforms. A platform is a relatively flat surface at least 10 cm (4 in) in diameter and 10 m (33 ft) high1 in the live crown of a coniferous tree. Platforms can be created by a wide bare branch, moss or lichen covering a branch, mistletoe, witches brooms, other deformities, or structures such as squirrel nests. It is important to note that murrelets have occupied small patches of habitat within larger areas of unsuitable habitat (Nelson and Wilson 2001). Some occupied sites also have included large, residual trees in low densities, sometimes
1 Based on the characteristics of most nests found to date, but note that four nests in Oregon have been found less than 15 meters above the ground (A. Wilson, pers. comm.).

3
less than one tree per acre (Grenier and Nelson 1995, Ralph et al. 1995). The presence of platforms appears to be the most important stand characteristic for predicting murrelet presence in an area (Hamer et al. 1994). Platform presence is more important than tree size, which alone is not a good indicator of platform abundance (Hamer 1995; S. K. Nelson, pers. comm.). Therefore, any forested area with a residual tree component, small patches of residual trees, or one or more platforms should be considered potential murrelet nesting habitat. Continuous potential habitat is that which contains no gaps in suitable forest cover wider than 100 m (328 ft). An audio-visual survey is the process of determining murrelet presence, probable absence, and occupancy of a site by visiting it on the ground and observing for murrelets. The survey area is the entire area that is under observation. For example, it could be an entire isolated stand of potential habitat or a portion of a stand of potential habitat. Large survey areas should be divided into survey sites, which contain one or more survey stations (see p. 7 for a more complete discussion of survey sites). A survey station is the location where the observer stands when conducting a survey visit. A survey visit is a single morning's survey. The survey period is the 2-hour period in which a survey visit is conducted; it begins 45 minutes before official sunrise and continues at least 75 minutes after sunrise, except in Alaska (see p. 18). The unit of measure for surveys is the detection of a single bird or group of birds, defined as the sighting or hearing of one or more birds acting in a similar manner and initially occurring at the same time. Sequential detections are distinguished by a break of five seconds or more. For example, a bird circling overhead for three minutes calling continuously would be counted as a single detection. If that bird stopped calling and was out of sight for more than five seconds and then started to call or was seen again in a different area, the observer should count it as two detections. This is because the observer would be uncertain if it was the same or a different bird. When a group is observed and then splits into two groups, the observation is treated as a single detection. If two groups are spotted separately and then coalesce, the surveyor should record the groups as two detections. The following definitions apply to sites that have been surveyed for murrelet activity. These definitions are detailed on p. 22, ‘Classification of Sites’. A site with murrelet presence is a site of potential habitat where there has been at least one murrelet detection. Presence sites include occupied sites. An occupied site is where murrelets have been observed exhibiting subcanopy behaviors, which are behaviors that occur at or below the forest canopy and that strongly indicate that the site has some importance for breeding. Occupied sites include nest sites. A nest site is a site with an active nest or evidence of a nest, including eggs, eggshell fragments, or a downy chick. Inland Limit for Surveys The data in Table 1 document the extent of the inland range as currently known. These data are provided as guidelines when planning surveys, particularly if the intent of inland surveys is to encompass all areas potentially used by Marbled Murrelets. They are not intended as strict limits by state. It is important to note that nest searches have been conducted in fewer areas than surveys, so the farthest inland detection (not necessarily nest) should be used as your guideline for planning surveys. Some regions within states might not support murrelet activity as far inland as the maximum distances in Table 1 suggest. For example, Marbled Murrelets have been detected 59 km (37 mi)

4
inland near Happy Camp, in Siskiyou County, CA, but 3,592 surveys at 449 sites ranging 37-72 km (23-45 mi) inland and south from Happy Camp to Mendocino County yielded no detections (Hunter et al. 1998, Schmidt et al. 2000). A study on the Rogue River and Siskiyou National Forests and Medford District BLM demonstrated that murrelet occurrence in the Siskiyou Mountains in Oregon was associated with the extent of the hemlock/ tanoak vegetation zone, which occurs 16-51 km (10-32 miles) inland (Dillingham et al.1995, Alegria et al. 2002). For consultation purposes, the U. S. Fish and Wildlife Service (2002) no longer requires surveys for Marbled Murrelets beyond this hemlock/tanoak zone (see map in Alegria et al. 2002). Thus, consult with your regulatory agency if you are unsure how far inland to survey in your region. Table 1. Known inland limits of Marbled Murrelet nests and detections.
Farthest Inland (km) State/Province Nest Occupied Site Detection Sourcesa Alaska <10 1,2 British Columbia 35b 3 Washington 35 84 Cowlitz Co. <32 s. Cascade Mtns 113 4,5 Oregon 49 65 129c 6,7,8,1 Siskiyou Mtns 51 9,10 N. California 28d 39 Siskiyou Co. 59e Humboldt Co. 40 Santa Cruz Mtns 16
a Sources: 1-Nelson 1997; 2-Whitworth et al. 2000; 3-Lougheed 1999; 4-Ritchie and Rodrick 2002; 5- D. Lynch, pers. comm.; 6-Witt 1998a; 7-Witt 1998b; 8-E. Gaynor, pers. comm.; 9-Dillingham et al. 1995; 10-Alegria et al. 2002. b A grounded fledgling with an egg tooth was reported 101 km inland (Rodway et al. 1992). c Nesting behaviors not observed. d Grounded fledglings and eggshell fragments have been found ~39 km inland. e Extensive surveys elsewhere in Siskiyou Co. yielded no detections (Hunter et al. 1998, Schmidt et al. 2000).
Habitat Assessment Identifying where murrelet surveys should be conducted is a critical first step in the process. A habitat assessment is an on-the-ground evaluation of the habitat within an area of proposed management activity. We are not attempting to define habitat here, given the large regional variation, but instead we describe the procedure in general terms. A habitat assessment cannot be completed from maps and aerial photos alone. It should include a ‘walk-though’ of the entire project area, looking specifically for the presence of platforms or, in younger-aged areas, for small patches of habitat or remnant large trees. By definition (p. 3), large-diameter trees do not have to be present for an area to contain potential habitat. Moss cover or deformities can create platforms on smaller-diameter limbs. Alternatively, moss does not have to be present within the

5
canopy, as murrelets can nest on duff platforms (Hamer and Nelson 1995a). Perceived lack of flight access for murrelets into an area should not eliminate that area for consideration. Stands on >20% slope often create natural access due to the layering of canopy trees, and streams create natural flyways (Hamer et al. 1994). Aspect has not been identified as a limiting factor for murrelet nests (Hamer and Nelson 1995a, Burger 2002). In summary, any area with a residual large tree component, small patches of potential habitat, or suitable nest platforms should be evaluated for the need for surveys. Failure to identify potential habitat, and thus ‘clear’ an area for management activities, could have a substantial negative impact on the population. Deciding what constitutes murrelet habitat may involve local or region-specific considerations. For example, in Mendocino and Santa Cruz counties of California, murrelets can occur in atypical redwood forest, where sparsely distributed single large trees occur in mixed redwood/Douglas-fir. To minimize uncertainty regarding habitat assessments, we recommend that you confer with the appropriate regulatory agency when planning surveys and identifying habitat that should (or should not) be evaluated. Survey Types Ralph et al. (1994) described two types of surveys, General and Intensive, which were designed to address different objectives. General Surveys are no longer recommended for timber surveys or for research, as they were not designed to document probable absence. This protocol adds Radar Surveys as an option for very specific and limited objectives. Please note that Radar Surveys may not be used in place of Intensive Surveys for determining occupancy. Radar Survey. Radar surveys employ a stationary marine radar system to detect and track murrelets in flight. Radar surveys cannot determine occupancy, but can often be used to identify presence of birds at stands (i.e., identify where occupancy is a possibility). Because it is likely that radar can reliably determine presence of birds in a shorter period than the current audio-visual protocol in some areas (Cooper and Blaha 2002), radar surveys can be used as a ‘coarse filter’ to quickly and accurately determine whether murrelets are present near, or adjacent to, a forest stand. For the purposes of this protocol, radar surveys can be applied to document probable presence and help identify where follow-up efforts of intensive surveys for determining occupancy would be most effective. To apply the radar technique in addition to the standard audio-visual ground survey technique, it is necessary to consult with the appropriate state and federal agencies. A rigorous sampling design will need to be approved by these agencies. The applications of, and limitations to, radar surveys are detailed in Appendix H. Intensive Survey. Intensive surveys are designed to determine probable absence or presence of murrelets at a specific site, document occupancy, monitor murrelet activity levels at specific sites (e.g., for a pre-harvest inspection), locate nests, and establish murrelet use patterns. When conducting an Intensive Survey, the observer visits only one station per morning. Intensive surveys are recommended for all proposed timber harvest and management activities. Intensive Surveys incorporate a three-step process: (1) Design the survey, including habitat assessment, defining the survey area, and establishing survey sites and stations. (2) Conduct survey visits in accordance with the protocol to determine if murrelets occur at the site. (3) Interpret the activity observed to classify the site as probable absence, presence, or occupied. Additional surveys could be conducted at occupied sites to locate nests or attempt to determine the birds’ spatial and temporal use patterns throughout the entire stand. This would

6
require extensive efforts with numerous people conducting simultaneous surveys. If biologists are interested in verifying nesting within the stand, PSG has developed a protocol that assists observers with nest verification: "Techniques for finding tree nests of the Marbled Murrelet" (Naslund and Hamer 1994). Defining Survey Area and Sites Survey Area. The minimum area surveyed should be the potential habitat that falls within the proposed project area and within one-quarter mile (402 m) of the project area boundary that is contiguous with the project area (Figure 1). The intent of the one-quarter mile guideline is to increase the likelihood that all of a continuous block of potential habitat is surveyed, not just that portion that lies within the project boundary. For example, a proposed project boundary might bisect a continuous block of potential habitat. By defining the survey area as one-quarter mile beyond the project boundary, more of the block of continuous habitat is likely to be included. The hypothesis that continuous habitat is important is based on the following observations on the nesting behavior of murrelets and alcids in general: (1) Although Marbled Murrelets nest solitarily, more than one pair of birds are usually found in a single, continuous forest (Nelson and Peck 1995). The interaction of murrelets in a single stand seems important for social and breeding purposes. (2) As two or more pairs of murrelets might nest asynchronously in a stand (or perhaps even renest), murrelets could be nesting at different times - and therefore different places - in the same stand in the same year. (3) Over several years, murrelets might use more than one nest tree or use different parts of a stand for nesting (Nelson 1997). Murrelets exhibit high nest site fidelity, with some stands supporting 20+ years of murrelet use (Divoky and Horton 1995). A few nest trees have been used in consecutive years (Singer et al. 1995, Nelson 1997, Manley 1999); however, most are not, suggesting that breeding birds may move elsewhere within a stand in successive years or may not nest every year. When a project is planned in a large expanse of potential habitat, surveying the entire continuous block will allow for a more thorough evaluation of the potential impacts to portions of the habitat that are greater than one-quarter mile from the project boundary. For example, in many situations the potential habitat occurs in a long, linear configuration. When the project area is at the edge of this large block, even a one-quarter mile boundary might not include the entire stand of potential habitat (Figure 2). This was the intent of the guideline in the previous protocol that the survey area should include contiguous habitat within one–quarter mile or 51 ha (125 acres), whichever was greater. This allowed for a larger portion of the potential habitat to be surveyed when a relatively small portion occurred within the one-quarter mile zone. It also provided a limit to the survey area when the continuous potential habitat extended over a large landscape. We recommend that the one-quarter mile zone define the minimum survey area. In conjunction with this zone, we recommend that topographic features, specifically ridgelines, be used to help define the survey area boundary. Ridgelines make a logical break between survey areas from both a survey station layout perspective and from a site classification perspective. The portion of a continuous stand that extends beyond the survey area boundary also should be considered for surveys, and some regulatory agencies may require surveys throughout continuous habitat under some conditions.

7
Other potential habitat within one-quarter mile, or greater, that is discontinuous with the project area may also need to be surveyed if disturbance is a concern. Disturbance is a regulatory issue; consult with your regulatory agency for guidance. Following are two examples of determining the survey area. The first involves a 122-ha (300-acre) stand of potential habitat, with a planned harvest of 4 ha (10 acres) located in the center of the stand (Figure 1). A 402-m (one-quarter mile) area around the edge of the 4-ha harvest would include 83 ha (206 acres). The second example involves a 101-ha (250-acre) stand of potential habitat, with a planned harvest of 2 ha (5 acres) located on the edge (Figure 2). A 402-m (one-quarter mile) area around the boundary of the 2-ha harvest would encompass 26 ha (65 acres) of potential habitat. The remaining continuous potential habitat could be surveyed to better evaluate potential impacts. The survey area should be defined by the occurrence of potential habitat. It should not include large expanses of unsuitable habitat, but this should be ascertained by visiting the area on the ground to determine the best way to delineate it. Potential habitat that is separated from other potential habitat by more than 100 m (i.e., surrounded by unsuitable habitat) should be delineated as its own survey area. This 100-m guideline should be applied when defining the area, not at the scale of scattered individual remnant trees or patches. In places where remnant trees are scattered equally throughout younger forest, the continuous potential habitat should be delineated by forest that contains this combination of young and remnant trees. If a large expanse of young forest without remnant trees is adjacent to the potential habitat, it should not be included in the survey area boundary. Survey Site. A survey site is the unit by which survey visits are designed and carried out, and the unit to which the requisite number of visits applies. We recommend limiting the size of the site to 61 ha (150 acres). The survey site boundary should not be confused with the management project or survey area boundaries. When the survey area is small (< ~61 ha), the site encompasses the entire survey area. In this case, the terms ‘survey site’ and ‘survey area’ are interchangeable, and the protocol applies equally. More typically, survey areas are large (>61 ha), and should be divided into sites (Figure 3). Some flexibility is allowed in exceeding the 61-ha (150-acre) site guideline, but experience has shown that sampling intensity and coverage are compromised when the site exceeds 69-71 ha (170-175 acres). A survey site contains >1 survey stations which are laid out together and which collectively are surveyed to determine the status of the site, which influences the ultimate status of the survey area. For the site, every station must be visited at least once and the requisite number of total survey visits to achieve the desired likelihood of classification must be planned per year to determine occupancy. For example, using the approach of at least 5, and up to 9, total survey visits per year to achieve 95% likelihood of correct classification, if a site contains less than 5 stations, more than one visit must be made to one or more of the stations (see ‘Distribution of Visits among Survey Stations’, p.16). If the site contains more than 5 stations, the site will receive more than the minimum 5 visits per year. Individual survey sites within the same survey area may be visited on the same or consecutive days, but survey visits within a survey site generally should be separated by a minimum of 6 and a maximum of 30 days (but see ‘Distribution of Visits Throughout the Season’, p. 17, for exceptions). It is critical that each site be identified by a unique name or number and legal description or UTM or lat/long location that will identify that particular site over the years. Furthermore, the boundary of the site must be clearly delineated on a topographic map or aerial photo. Stations within sites also must have unique identifiers, but in addition, all stations within a site must share the same site name. It must be unquestionably clear which stations belong to a site, as there is no
8
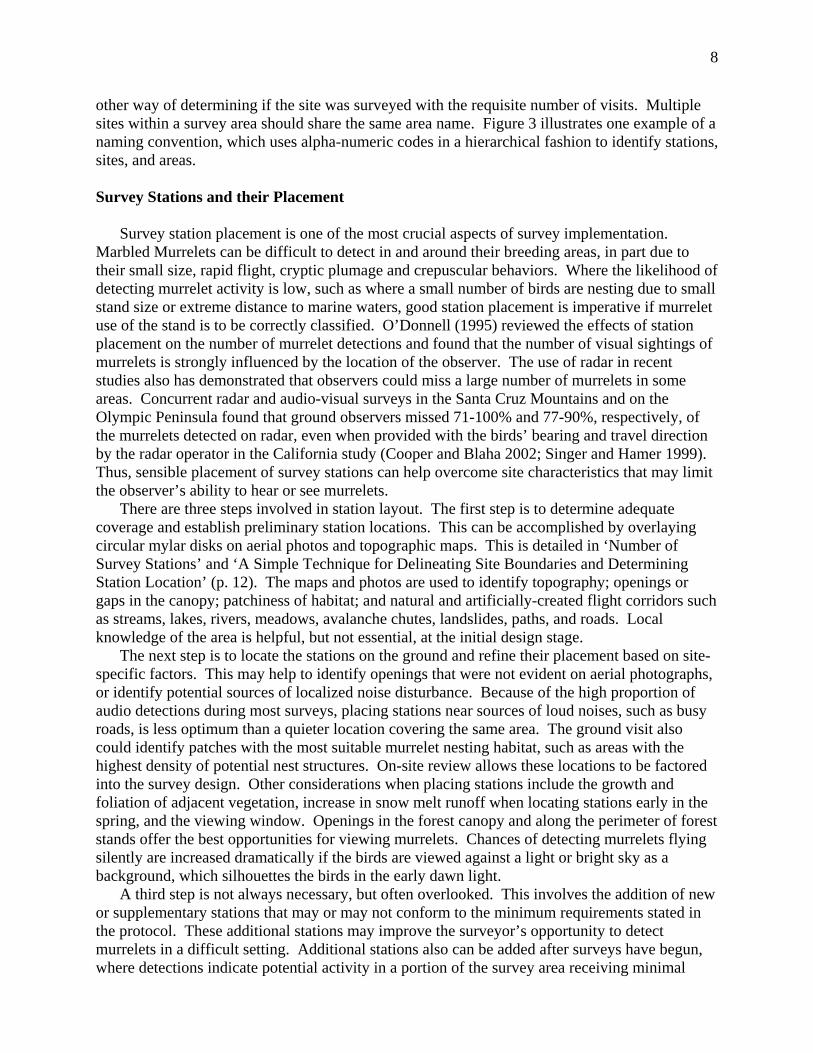
other way of determining if the site was surveyed with the requisite number of visits. Multiple sites within a survey area should share the same area name. Figure 3 illustrates one example of a naming convention, which uses alpha-numeric codes in a hierarchical fashion to identify stations, sites, and areas. Survey Stations and their Placement Survey station placement is one of the most crucial aspects of survey implementation. Marbled Murrelets can be difficult to detect in and around their breeding areas, in part due to their small size, rapid flight, cryptic plumage and crepuscular behaviors. Where the likelihood of detecting murrelet activity is low, such as where a small number of birds are nesting due to small stand size or extreme distance to marine waters, good station placement is imperative if murrelet use of the stand is to be correctly classified. O’Donnell (1995) reviewed the effects of station placement on the number of murrelet detections and found that the number of visual sightings of murrelets is strongly influenced by the location of the observer. The use of radar in recent studies also has demonstrated that observers could miss a large number of murrelets in some areas. Concurrent radar and audio-visual surveys in the Santa Cruz Mountains and on the Olympic Peninsula found that ground observers missed 71-100% and 77-90%, respectively, of the murrelets detected on radar, even when provided with the birds’ bearing and travel direction by the radar operator in the California study (Cooper and Blaha 2002; Singer and Hamer 1999). Thus, sensible placement of survey stations can help overcome site characteristics that may limit the observer’s ability to hear or see murrelets. There are three steps involved in station layout. The first step is to determine adequate coverage and establish preliminary station locations. This can be accomplished by overlaying circular mylar disks on aerial photos and topographic maps. This is detailed in ‘Number of Survey Stations’ and ‘A Simple Technique for Delineating Site Boundaries and Determining Station Location’ (p. 12). The maps and photos are used to identify topography; openings or gaps in the canopy; patchiness of habitat; and natural and artificially-created flight corridors such as streams, lakes, rivers, meadows, avalanche chutes, landslides, paths, and roads. Local knowledge of the area is helpful, but not essential, at the initial design stage. The next step is to locate the stations on the ground and refine their placement based on site-specific factors. This may help to identify openings that were not evident on aerial photographs, or identify potential sources of localized noise disturbance. Because of the high proportion of audio detections during most surveys, placing stations near sources of loud noises, such as busy roads, is less optimum than a quieter location covering the same area. The ground visit also could identify patches with the most suitable murrelet nesting habitat, such as areas with the highest density of potential nest structures. On-site review allows these locations to be factored into the survey design. Other considerations when placing stations include the growth and foliation of adjacent vegetation, increase in snow melt runoff when locating stations early in the spring, and the viewing window. Openings in the forest canopy and along the perimeter of forest stands offer the best opportunities for viewing murrelets. Chances of detecting murrelets flying silently are increased dramatically if the birds are viewed against a light or bright sky as a background, which silhouettes the birds in the early dawn light. A third step is not always necessary, but often overlooked. This involves the addition of new or supplementary stations that may or may not conform to the minimum requirements stated in the protocol. These additional stations may improve the surveyor’s opportunity to detect murrelets in a difficult setting. Additional stations also can be added after surveys have begun, where detections indicate potential activity in a portion of the survey area receiving minimal

9
coverage under the existing survey design. For example, once presence has been detected and the objective is to determine occupancy, supplementary stations can be added to augment the data previously collected. Such a station could be one that affords a good view of the target stand but is greater than 50 m from its edge. Stations could also be surveyed in tandem, with one observer placed adjacent to a stream that has good visibility but limited hearing, and a second observer at a station with quiet conditions. Note that two stations surveyed in tandem counts as only one protocol visit for the site. Guidelines on station placement are intended primarily for management scenarios. Surveys designed for research purposes may follow the general principles outlines herein, but likely would deviate somewhat to meet the research objectives. Station Effective Area. The distance at which observers conducting audio-visual surveys detect murrelets determines the effective area of a survey station, and thus the number of stations needed to cover the survey site. Previous data (Ralph et al. 1994) suggested that observers generally see birds only within 100 m (328 ft) or hear birds within 200 m (656 ft). Observers can detect birds at greater distances, but many are missed at these distances and classifying behavior is more difficult. At some locations, visibility is restricted and subcanopy behaviors can only be seen at distances less than 100 m. A study on the Olympic Peninsula used radar to measure detection distances and found a steep, steady drop in the number of murrelets detected beyond 100 m (even without accounting for the fact that sampling area increased with distance from observer): 36 (41.4%) occurred ≤100 m from the observers, 25 (28.7%) occurred 101–200 m from the observers, and detections continued to drop with distance from observer (Cooper and Blaha 2002). Until additional data and more complete analyses suggest otherwise, this protocol recommends that 200 meters be set as the maximum detection distance for audio-visual surveys, and thus defines station effective area as a 200-m radius circle centered on the survey station. Based on the defined station effective area, a maximum of 12 ha (30 acres; roughly equivalent to the area of a 200-m radius circle) can be surveyed from a single survey station under ideal circumstances. In many cases, each station will cover less area. For example, an area with closed canopy, limited visibility and/or steep terrain with many drainages will need many more survey stations than is expected based on acreage only. On the Olympic Experimental State Forest in Washington, average station density was 1 per 7 ha (17 acres) because of the presence of streams, ridges and steep slopes (Horton and Harrison 1996). Topography and Stand Shape. In a square stand on flat ground, one survey station will cover 12 ha. As the slope steepens, the number of stations required to effectively survey the area increases (Figure 4). This is because the 12-ha estimate of murrelet detectability is based on the horizontal distance one can see or hear a Marbled Murrelet (see above), and slope distance is not equivalent to horizontal distance. An estimate of average slope of a stand can be determined using stereoscopic analysis or from measurements on the ground; horizontal distance can then be determined from standard slope distance conversion tables. The best way to determine the number of stations needed in each stand is to use the ‘Simple Technique for Delineating Site Boundaries and Determining Station Placement’ (p. 12). Stand shape also will influence the number of survey stations. A rectangular or irregularly shaped stand will require more survey stations than a square or circular stand of similar area. For example, if you have a flat (no slope), 12-ha (30-acre) stand that is very long and narrow, one station will not adequately cover the entire stand (Figure 5). A general rule of thumb is that your stations should be located throughout the site. Station placement should incorporate topographic features and cover every hectare of a given site, no

10
matter the size. Stations that are located up-slope from the survey site, such as along a ridge with the survey site in a valley below, may offer a broad, sweeping view of the entire site but provide very limited chances to observe murrelets that are accessing the site from an elevation below the ridge top. The silhouette of a dark bird flying directly overhead against the light-colored sky is easier to see than a bird flying against a dark background when viewed from the top of a ridge or high point. If your site includes a ridgetop, mid-ridge and river bottom, you must make sure that your stations effectively survey (not necessarily be placed in) the ridgetop, mid-ridge, and river bottom. If your site is only 12 ha, but is long and narrow, you will need to place a station on each end of the site at a minimum (Figure 5). The additional number of stations required will depend on slope. Remember that if a station is placed on the edge of a site, you may be surveying less than 12 ha of that site (Figure 6). Location with Respect to Openings. Generally, murrelets remain unseen to the observer; 80% of detections from Washington Department of Natural Resources and Washington Department of Fish and Wildlife surveys (n = 8,376) were audio, compared with 13% visual and 7% both seen and heard (WDFW interagency database). Rates of audio detections were similar in California and Oregon (Paton and Ralph 1988, Nelson 1989). However, behaviors indicating occupancy are derived almost exclusively from visual observations. Therefore, stations should be located so that the observer has an unobstructed view of the sky. Whenever possible, stations should be placed in forest clearings, on quiet roads, at the edge of the site, or in or adjacent to rivers or streams. Murrelets often use stream or river corridors as flight paths to access nest sites. Streams create noise disturbance, but the increased opportunity to observe occupied behaviors might outweigh the negative aspects of noise. However, stations should be located no farther than 50 m (164 ft) from the edge of the site being surveyed (e.g., see Figure 6). A common error in survey design that could lead to missed detections and, thus, misclassification of the site, is inadequate survey coverage of interior portions of survey sites. In many cases survey stations are placed along roads or adjacent to the edge of the target site because of easy access and better visibility, but generally the entire site cannot be surveyed adequately if all stations are located around the perimeter. Stations must also be located within the site so that the entire site has survey coverage. Even if well-placed openings are not available in a site, station coverage should not be compromised. The number of stations in a site should not be decreased just because openings are not available or are not well-placed (the number may, however, need to be increased). Ultimately, some stations may need to be set in areas without a good view of the sky. When there are few clearings within a site, such as in areas with closed canopies or steep complex terrain, visibility will be restricted and the detection of subcanopy behaviors will be very limited. To make up for a lack in visibility and decreased likelihood of observing behaviors that could determine occupancy, we recommend that station coverage and density be increased in these sites. Surveyors should consult with their wildlife resource agency for direction in these cases. Location with Respect to Potential Habitat. In many younger-aged stands, potential nesting habitat often is located in small patches (micro-sites) separated by areas of unsuitable habitat. In some cases, patches containing the most likely nesting habitat may be ineffectively covered even though the site is being surveyed to the specifications of the protocol. Interpretations of what is potential (or likely) habitat differ, and the complete range of conditions murrelets use for nesting is still not known. In cases where habitat quality varies throughout the survey site (specifically, where larger residual trees containing suitable platforms are spaced at regular or irregular
11
intervals within a site that contains no other potential platforms), survey stations should be strategically placed to cover the most likely nesting habitat within a site, as long as stations remain distributed throughout all potential habitat within the site. As stated earlier, distinct portions of the forest that do not contain potential nesting habitat (i.e., no platforms) should not be included in the site boundary. If more than one survey visit is required to some of the stations within the site to meet protocol, the additional surveys should be conducted at those stations with the best habitat, or a combination of best habitat, visibility, and proximity to previous detection. Modifying Station Placement. To maximize the observer's chance of seeing birds, he/she may move up to 50 m (164 ft) from the station during the survey visit. The new location should be less than a one-minute walk away, and the observer should note time and direction of movement. In subsequent visits to an area, additional stations can be established to obtain visual observations. For example, if birds were heard in a nearby gully during a survey, the observer can set up one or more additional station(s) in the gully to increase the probability of observing subcanopy behavior. It is important to assign a unique identification to any new stations, including those that have been moved more than 50 m. If an observer thinks that there is a good chance of observing murrelets at a particular station, additional survey visits can be made to that station. However, all potential habitat within the survey site must be surveyed. Summary. The following bullets summarize the most important points about survey station placement: • The goal of station placement is to maximize the surveyor’s opportunity to observe
murrelets, and specifically murrelet behaviors indicative of nesting, if they occur. • You must have at least 1 station per 12 ha (30 acres); in almost all cases you will need more
than 1 per 12 ha. • Stations must be distributed throughout the site. If your site includes a ridgetop, mid-ridge
and river bottom, you must make sure that your stations are placed in a way to cover all of these areas. In most instances it will not be acceptable to survey from only one side of the site, and it is unacceptable to survey sites only from roads. If there is a river or creek in your site, make sure you have a station in or adjacent to the river or creek despite concerns about noise.
• Stations should be located in an opening if possible, but distribution of stations throughout the site is equally important; therefore, some stations may be located in areas without excellent viewing opportunities.
• When surveying a heterogeneous site, some stations should be placed within patches that contain the most suitable characteristics for nesting, while also maintaining appropriate station distribution.
Intensive surveys can be laborious. For areas that are difficult to access because they have steep slopes, cliffs, thick brush, or are long distances from roads, it may facilitate the survey effort if one or more wide trails are brushed through the stand (this should be done outside of the nesting season if power equipment is used). These trails can serve as access points to several stations (Figure 7). It may be necessary to camp out, hiking to the station before dark the evening before the survey visit.

12
A Simple Technique for Delineating Site Boundaries and Determining Station Location
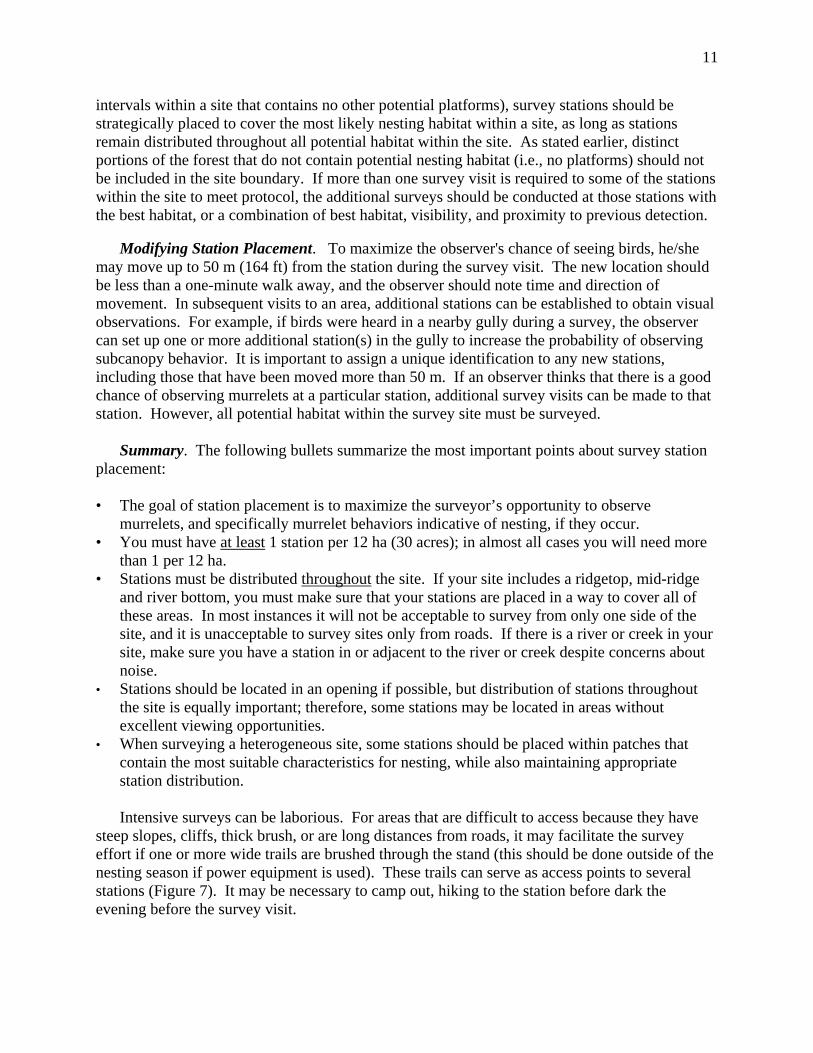
Aerial photos and a stereoscope can be used to delineate site boundaries and to locate canopy gaps, road landings, and other suitable locations from which to survey. The 3-D image you get from stereoscopic analysis of 1:12,000 (or other size) aerial photography is helpful for identifying topographic features and determining the appropriate number of stations. Once you have a pair of aerial photos set up under your stereoscope, locations for potential survey stations can be determined by looking for gaps and other open locations, and using a mylar measuring template with 30, 20 and 15 acre circular areas to estimate ground (horizontal) distance based on topography. Stations in gaps or open location should be placed first, and then determine the locations for other survey stations by using the mylar template. Your 12-ha (30-acre) template should be made to the scale of the aerial photo being used. Survey sites (< ~61 ha [150 acres]) can then be delineated by circumscribing the area covered by a set of adjoining stations. Station locations, site boundaries, and the number of stations per site should be finalized after field review. Remember to consider the growth and foliation of adjacent vegetation and increase in snow melt runoff when locating stations early in the spring. Stations should be marked with uniquely-numbered flagging and stakes. Station locations should then be marked on orthophotos or topo maps using photo interpretation and/or measured distances and azimuths from field notes, or using global positioning systems (GPS). UTM coordinates should then be determined for each survey station.
Outer ring: 12 ha (30 acres; 195-m radius) Middle ring: 8 ha (20 acres; 160-m radius) Inner ring : 6 ha (15 acres; 138-m radius)
Example of a mylar template with 6-, 8-, and 12-ha circles emanating from a survey station. Templates can be created to the scale of the user’s maps or aerial photographs.
x
Number of Survey Visits The overall objective of the survey design is to achieve a high confidence that occupied sites are classified correctly. Given that, a secondary goal is to achieve survey efficiency, i.e., optimize the number of surveys that are needed to classify occupancy. The design has two components: (1) the number of visits needed to achieve a desired level of reliability, and (2) the distribution of visits over time, both within a year and across years. 2-Year Protocol. Nelson (unpubl. data) found that murrelets occupied several stands in year one, were absent in year two, and occupied the stands again in year three. A subsequent analysis using pairs of years (1991-1992, 1992-1993, ….1997-1998) from the 1989-1998 three-state murrelet dataset, and using only those sites that were visited a set number of times regardless of
13
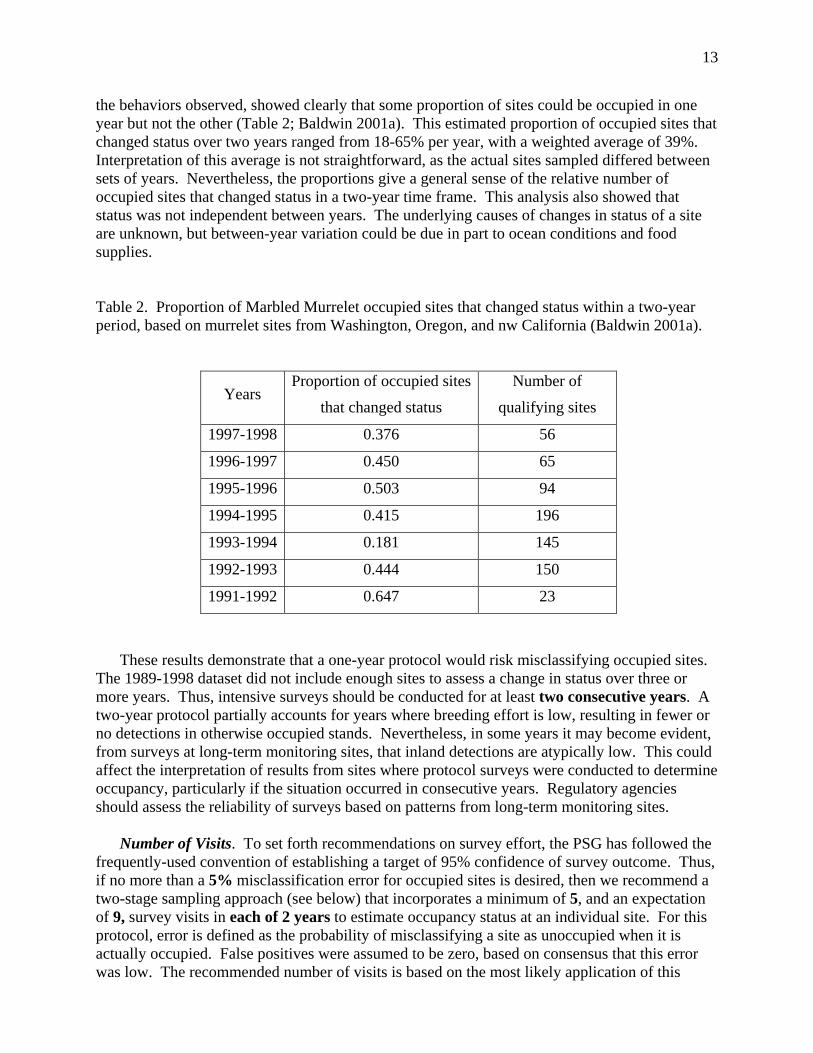
the behaviors observed, showed clearly that some proportion of sites could be occupied in one year but not the other (Table 2; Baldwin 2001a). This estimated proportion of occupied sites that changed status over two years ranged from 18-65% per year, with a weighted average of 39%. Interpretation of this average is not straightforward, as the actual sites sampled differed between sets of years. Nevertheless, the proportions give a general sense of the relative number of occupied sites that changed status in a two-year time frame. This analysis also showed that status was not independent between years. The underlying causes of changes in status of a site are unknown, but between-year variation could be due in part to ocean conditions and food supplies. Table 2. Proportion of Marbled Murrelet occupied sites that changed status within a two-year period, based on murrelet sites from Washington, Oregon, and nw California (Baldwin 2001a).
Years Proportion of occupied sites
that changed status
Number of
qualifying sites
1997-1998 0.376 56
1996-1997 0.450 65
1995-1996 0.503 94
1994-1995 0.415 196
1993-1994 0.181 145
1992-1993 0.444 150
1991-1992 0.647 23
These results demonstrate that a one-year protocol would risk misclassifying occupied sites. The 1989-1998 dataset did not include enough sites to assess a change in status over three or more years. Thus, intensive surveys should be conducted for at least two consecutive years. A two-year protocol partially accounts for years where breeding effort is low, resulting in fewer or no detections in otherwise occupied stands. Nevertheless, in some years it may become evident, from surveys at long-term monitoring sites, that inland detections are atypically low. This could affect the interpretation of results from sites where protocol surveys were conducted to determine occupancy, particularly if the situation occurred in consecutive years. Regulatory agencies should assess the reliability of surveys based on patterns from long-term monitoring sites. Number of Visits. To set forth recommendations on survey effort, the PSG has followed the frequently-used convention of establishing a target of 95% confidence of survey outcome. Thus, if no more than a 5% misclassification error for occupied sites is desired, then we recommend a two-stage sampling approach (see below) that incorporates a minimum of 5, and an expectation of 9, survey visits in each of 2 years to estimate occupancy status at an individual site. For this protocol, error is defined as the probability of misclassifying a site as unoccupied when it is actually occupied. False positives were assumed to be zero, based on consensus that this error was low. The recommended number of visits is based on the most likely application of this

14
protocol – conducting surveys at a site for which no specific knowledge exists regarding its status. This scenario operates under the following assumptions and objectives:
(1) the area to be surveyed has the same ‘average’ probability of detection as the sample of sites (the 1989-1998 three-state murrelet dataset) used to estimate q (defined below2);
(2) no additional information is available as to the site’s likelihood for being occupied or for having no murrelets;
(3) the objective is to detect occupancy if the site is occupied (not merely presence). Furthermore, the recommendation is based on the weighted average of ~40% of occupied sites changing status within a two-year time period. (The actual weighted average of 39% was rounded to 40%). As shown in Table 2, some occupied sites are not occupied in both years, but the true situation at a given site is unknown. To assume that all occupied sites are occupied in only one of two years is conservative, and to assume, without any other knowledge, that a site is occupied both years is not supported. Because the sample of sites from each pair of years differed, and sites varied by habitat type and geographic location, the sites themselves influenced the analysis and we could not assume a year-only effect. Thus, a weighted average was used for the calculated number of recommended visits. A different assumption on the extent of change of site status would lead to a different approach. The influence of variation on those assumptions is discussed in Appendix A. Finally, there is some chance that, if no detections are made on the first s* visits (see Table 3 and Appendix A for definitions of s and s*), no detections will be made on the remaining visits. This allows for a two-stage sampling approach, similar to the previous protocol which surveyed for presence first, then increased the number of visits for occupancy. The approach described here differs from previous protocols in that it does not calculate a probability for ‘presence’ separately, but rather incorporates a probability of no detections on a single visit given that the site is occupied. From the data analyzed, stopping surveys after a set number of visits with no detections (‘early stopping rule’) had little effect on the probability of detecting occupancy at occupied sites when at least four visits were made (because occupancy was detected early), but reduced the number of visits made to truly unoccupied sites (Baldwin 2002). The recommended survey approach for the average case includes a stopping rule of 5 visits. The average probabilities of observing occupancy under these parameters are displayed in Table 3. Recommended Approach. Assuming that the desired confidence target is 95% and that the assumptions described above are met, then surveys should be planned within a two-year time frame with a minimum of 5 survey visits, and an expectation of 9 survey visits, in each year to determine occupancy. The recommended approach is summarized below (refer to decision tree, Figure 8).
If, in year 1, detections are made within the first 5 visits but subcanopy behaviors are not observed, the full 9 visits are made in year 1 and year 2, for a two-year total of 18 visits (unless occupancy is established in fewer visits).
2 ‘q’ is the probability of not observing a detection on a single survey visit, given that birds are present, or not observing a subcanopy behavior, given that the site is occupied. ‘p’ is the opposite of ‘q’ (1-q), or the probability of detecting a bird on one visit given presence, or seeing a subcanopy behavior given occupancy.

15
If, in year 1, no detections have been made after 5 visits, surveys can cease for that year. In year 2, if presence-only detections are made within the first 5 visits, the full 9 visits are made for a two-year total of 14 visits. If, in year 1, no detections have been made after 5 visits, surveys can cease for that year. If, in year 2, no detections have been made after 5 visits, the survey can be stopped with 10 total survey visits and the site classified as probable absence.
By following this process, there is a 0.9546 probability of detecting occupancy, given that the site is occupied. If the assumptions do not apply to your area, specifically if there is reason to believe that (1) the probability of detection at your site(s) is less than the ‘average’ for the sample of sites used to estimate q, and/or (2) additional information on your site(s) suggests that occupancy is low, we recommend a greater number of survey visits in each of two years to increase the likelihood of having <5% error in correctly classifying the site, assuming 95% probability of detecting occupancy is the desired level. Consult your regulatory agency for help in determining the appropriate number of survey visits. In all cases, visits could be discontinued once subcanopy detections are confirmed, at which point the site is classified as occupied and no further survey visits are required. Depending on the objective of the surveys, you may choose to continue surveys at the site even after occupancy is confirmed. Caution: the first ‘presence’ detection near the end of either year might require additional years of surveys to determine if the site is occupied if the expected 9 visits cannot be completed in that year. See ‘Distribution of Visits Throughout the Season’, below, for potential scheduling problems that could require a third year of visits. Increased survey effort (within the prescribed survey window – see below) should begin immediately following the documentation of presence to avoid adding additional years to the survey effort. Table 3. Probabilities of detecting occupancy, given a site is occupied in at least one of two years, when, on average, 40% of occupied sites have a true annual status of occupancy in only one of two years. s = planned number of visits; s* = number of visits with no detections, after which surveys could be stopped for that year.
s s* = 4 s* = 5 s* = 6 4 0.7912 5 0.8484 0.8528 6 0.8874 0.8930 0.8947 7 0.9146 0.9209 0.9230 8 0.9337 0.9405 0.9431 9 0.9474 0.9546 0.9572 10 0.9573 0.9647 0.9676 11 0.9646 0.9721 0.9751 12 0.9700 0.9777 0.9807 13 0.9739 0.9817 0.9848 14 0.9770 0.9848 0.9879 15 0.9792 0.9871 0.9902 16 0.9810 0.9888 0.9920
16
As stated before, the recommended survey effort is based on averages calculated from data collected over a three-state area. It does not mean that, for any individual site, you can be assured of 95% probability if you make 9 survey visits in each of two years. Part of this uncertainty is the site’s unknown true probability of detection (uncertainty that has always been in the survey protocol), and part comes from not knowing if the site changes status from year to year. An individual site may require fewer or a greater number of survey visits to correctly determine its status. The recommendations herein can be enhanced to achieve a higher probability of correctly classifying an individual site. For example, one could choose to survey the planned number of visits each year (applying no stopping rule), regardless of detections. Another conservative approach could be to assume that an occupied site is occupied in only one of two years (rather than the average of 40% of sites are occupied in only one of two years, as used above). This results in 12 visits needed in each year to achieve 95% probability of detecting occupancy (see Tables A-2 and A-4, Appendix A). Conversely, if one assumed, based on prior knowledge, that occupied sites are occupied both years, only 6 visits in each of two years would be needed (Table A-5). This approach would require consultation with the appropriate regulatory agency. In summary, one could calculate average probabilities for a variety of situations by using (1) different probabilities for detecting probable absence, presence, or occupancy on a single visit, assuming the site is occupied that year; (2) a different number of planned visits; (3) a different stopping rule; and/or (4) a different assumption of the proportion of occupied sites that change status between years. The appropriate formulas for these calculations are detailed in Appendix A, Table A-3. These different values and assumptions might be derived from previously-collected survey data from a particular geographic area of interest (i.e., a collection of sites with higher or lower detection probabilities), or from models of habitat suitability that assess a site’s probability of being occupied. However, to use these parameters to design a different sampling protocol, one must get assistance from a qualified statistician to determine the sample size needed and to help with the derivations. Distribution of Visits Among Survey Stations. We recommend that each survey station be visited at least once per year or a minimum of 5 (with a planned number of 9) survey visits per year to each survey site, whichever is the greater number of visits. The number of visits per station will vary with the number of stations established at survey sites. If one to three stations are established, divide the number of visits among stations so the survey effort equals the requisite number of visits per year for two consecutive years (i.e., 1 station = at least 5 and possibly 9 visits per year to that station; 2 stations = at least 3 visits to 1 station and 2 visits to the other per year; 3 stations = at least 2 visits to 2 of the stations and 1 visit to the third station per year; etc.). Additional visits should be conducted at the station(s) of highest quality (i.e. those with the greatest number of detections, the best view of the sky or stand, and/or in habitat with the highest potential). If five or more stations are established, at least one visit per station per year for two consecutive years is needed. If murrelets are detected at a survey site but subcanopy behaviors have not been observed, at least 9 visits per year are needed to determine occupancy. When to Survey Time of year. Although nesting sites are used primarily during the breeding season, Marbled Murrelets have been observed at some inland sites during all months of the year (Carter and Erickson 1992, Cross 1992, Naslund 1993a, O’Donnell et al. 1995). Nevertheless, these areas are most effectively surveyed during the spring and summer, when activity levels are greater and

17
attendance is more consistent and longer in duration. Murrelet activity increases to moderate intensity during spring and reaches a peak level generally from early July to early August in California, Oregon, and Washington (O’Donnell et al. 1995; W. Ritchie, pers. comm.). This increase in activity in July might be associated with nesting birds, but also could be attributed to nonbreeders prospecting for future nest sites (O’Donnell et al. 1995, Nelson and Peck 1995, Jodice and Collopy 2000, Whitworth et al. 2000). The number of detections decreases markedly after this peak, presumably because many birds have completed their nesting activities and begun a flightless molt at sea. Based on past survey data and current knowledge, surveys for management applications should be conducted during the following periods: 15 April to 5 August in California (Carter and Erickson 1988, O’Donnell et al. 1995); 1 May to 5 August in Oregon, Washington, and British Columbia; and 15 May to 5 August in southeastern and southcentral Alaska (Kuletz et al. 1994, but see Brown et al. 1999 for a potentially earlier start in southeastern Alaska). These dates bracket a substantial portion of the incubation period and early nestling period, based on chronologies identified by Hamer and Nelson (1995b), but should not be confused with breeding seasons for these areas (see below). For the purposes of researching breeding ecology or monitoring nest sites, surveys could be initiated at least two weeks earlier and extended at least two to three weeks beyond the periods recommended above. The breeding season is defined by the earliest known nesting and latest known fledging dates, and is used by regulatory agencies to avoid adverse effects to the species. The breeding season extends 24 March – 15 September in California, and 1 April – 15 September in Oregon and Washington. Thus, the survey period misses some nesting activity, and potentially some opportunities to determine occupancy at a site. For example, 13 of 26 (50%) nests in California were active after, and 4 (15%) before, the survey season (Hamer and Nelson 1995b). Of 22 nests documented in Oregon, 7 (32%) were active after, and 1 before, the survey season (Nelson and Peck 1995; K. Nelson, unpubl. data). This trend is consistent with data from Washington, where 33% of 9 nests were active after the survey season, and a combined total of 44% were active during either the pre- or post-survey season (W. Ritchie unpubl. data). Occupied behaviors documented outside the survey season but within the breeding season should be considered valid observations. Presence-only observations and no detections outside the survey window are not appropriate for site classification. Murrelet visitation to nesting areas during the non-breeding season may be important in forming or maintaining pair bonds, retention of nest sites, and for selecting future nest sites (Naslund 1993a, Nelson 1997). At two sites in northern California, calling frequency (mean number of calls per detection) was greater during winter than spring and summer, although the duration of detections was shorter (O’Donnell et al. 1995). However, birds are also more likely to be absent during winter, leading to incorrect probable absence determinations (Brown et al. 1999). Therefore, while winter surveys may be helpful for determining site presence in some areas, they cannot be counted towards surveys required in a given year. Distribution of Visits Throughout the Season. Several studies have shown that detection levels can fluctuate greatly at the same survey area, or even the same station, throughout the breeding season (Manley et al. 1992, Rodway et al. 1993, Kuletz et al. 1995, Jodice and Collopy 2000). There usually is a peak in detections, but the timing varies year to year. For example, in Washington, peaks have occurred from 24 June to early August (W. Ritchie, pers. comm.). From analysis of the 1989-1998 three-state composite dataset, detection rates of murrelet presence and occupancy varied within the 16-week survey season (Baldwin 2001b). For presence, detection rates in a two-week period in the middle of July were higher than the rest of

18
the season (Figure 9). A five-week period from the beginning/middle of May to the beginning/middle of June had lower presence detection rates. For occupancy, detection rates were low through the season until about a one-week period in the middle of July (Figure 9). The magnitudes of the differences were not great, and factors other than season could have contributed to the variability observed, but the analysis generally supports the emphasis of increased survey effort when detection rates increase. Surveys should begin within the first two to three weeks of the survey season, and be scheduled at regular intervals throughout the season. To help maintain an even distribution, surveyors should aim for a minimum of 6 and a maximum of 30 days between survey visits to a site. Given that an objective of this protocol is to detect murrelets if they are present, survey visits should adequately cover the time of increased activity. Thus, we recommend at least 2 of the 5 minimum visits (using a 5-visit stopping rule) occur after 30 June but before July 18, with an effort to avoid clustering these two visits at the beginning of July. This increases the chances of surveying during the mid-July peak in detection rates. It also allows time to add 4 visits, if needed, and have at least some of those additional visits still within the peak detection period. When 9 visits are needed, survey visits should be spaced as evenly as possible throughout the breeding season, with at least 4 of the 9 visits for occupancy after June 30, and at least half of those within the first 3 weeks of July. When additional visits need to be added late in the survey season (i.e., after June 30), we recommend a minimum of 2 days between visits during this time. This spacing prevents surveys from being bunched at the very end of the survey period. For example, an initial survey schedule in California, with the expectation of 9 visits and a minimum of 5, could be: 1 visit in April, 1 in May, 1 in June, and 2 during 1-17 July. If presence is detected on the 5th visit in July, an adequate time remains to conduct an additional 4 visits over the next 2 ½ weeks, with at least 2 days between visits. In Oregon and Washington, the initial schedule could be similar, except the first 3 visits would occur between 1 May and 30 June. In Alaska, survey emphasis may need to be shifted to the last three weeks in July rather than the first two weeks, corresponding to a slightly later peak of activity. Adherence to these schedules, as closely as possible, will increase the quality of surveys and result in a more accurate determination of activity. Based on the composite data analyzed, it was uncommon for an occupied site to have no detections before the stopping rule threshold (Baldwin 2002). Thus, one should expect at least presence detections at a truly occupied site within the first few visits and then be able to adjust the survey schedule accordingly to accommodate 9 visits to detect occupied behaviors. However, the 2002 survey season was a good example of unusual conditions, with very low activity levels in Oregon and Washington until mid-late June (W. Ritchie, pers. comm.). If murrelets are not detected until July, particularly at a number of sites, there is a potential to run out of resources before the requisite 9 surveys can be completed. This could translate to an extra year of surveys. One needs to schedule carefully and have enough qualified surveyors to conduct another 4 visits if the first presence-only detection is made in mid-late July. Time of day. The survey period in California, Oregon, Washington, and British Columbia is defined as the two-hour period from 45 minutes before to 75 minutes after official sunrise or for 15 minutes after the last detection, whichever is longer. In southeastern Alaska, surveys should begin at least 60 minutes before sunrise (Brown et al. 1999), and surveys should begin 90 minutes before official sunrise in southcentral Alaska (Kuletz et al. 1994). Exceptions to this timing are detailed below under ‘Environmental Conditions Affecting Surveys’. By following these guidelines, some survey visits will last longer than 75 minutes after sunrise, especially on cloudy days or days with heavy fog when detections generally continue longer. However, if a

19
survey has unquestionably determined occupancy during the regular two-hour survey period, staying longer is not necessary, although it could yield additional supporting detections. Radar surveys in Washington and British Columbia consistently have detected murrelets in stands earlier than 45 minutes before sunrise. An average of 25% of radar detections occurred before the official survey start time at stands on the Olympic Peninsula (Cooper and Blaha 2002). However, because many of these targets were silent and would not have been detected on a PSG audio-visual survey in the near-dark conditions, surveys will continue to begin 45-90 minutes before sunrise depending on regional location (see above). It also should be recognized that opportunities to observe occupied behaviors can occur after the survey period, particularly during chick rearing. For example, while there appears to be an initial wave of fish deliveries to chicks right at sunrise (in low light conditions when an observer is less likely to detect them), second feedings occurred on average 54 minutes after sunrise (SE 9.6, n = 40 observations) and as late as 225 minutes post-sunrise (Nelson and Hamer 1995b). Similarly, at three nests in British Columbia observed in three different years, 63% of 104 feedings occurred more than one hour after sunrise (P. Jones, pers. comm.). Later arrival times generally were associated with cloudy mornings. Thus, additional opportunities to observe an occupied behavior (i.e., adults flying into a stand to deliver fish) occur after the end of the survey period, particularly during the height of chick rearing. Use the Nautical Almanac to determine sunrise times for your area. Do not rely on tide tables, local newspapers, or television stations because they can vary up to 15 minutes from official sunrise. Sunrise tables can be obtained from the U.S. Naval Observatory at web site http://aa.usno.navy.mil/AA/data, and at http://www.hia.nrc.ca/services/sunmoon/sunmoon.html for British Columbia. Marbled Murrelets also can be detected inland during the evening. Radar surveys generally find consistent but lower volume of inland evening flights compared with morning surveys (B. Cooper, pers. comm.). Evening audio-visual surveys could be useful in determining presence or occupied behavior, but are not recommended as part of this protocol because they would not count toward determining probable absence. Environmental Conditions Affecting Surveys. The effects of environmental conditions on murrelet surveys are twofold. They affect (1) the timing, duration, and intensity of murrelet activity; and (2) the ability of observers to detect the birds audibly and/or visually. Murrelet activity at inland sites begins later, lasts longer, and is often more intense on mornings with overcast conditions, fog, drizzle, or rain than on mornings with clear conditions (Hamer and Cummins 1990, Manley et al. 1992, Naslund 1993b, Rodway et al. 1993, Nelson and Peck 1995). If rainy, cloudy, or foggy conditions exist at the end of the regular two-hour survey period, observers who continue to survey for an additional 30 minutes might detect possible late activity. Cloudy conditions are defined as a continuous ceiling or significant cloud layer that reduces vertical viewing to <2 canopy heights. Foggy conditions are defined as a cloud ceiling lower than the height of the tallest trees at the site or by low fog which decreases horizontal visibility to less than 100 m. The conditions described above also potentially limit an observer’s ability to detect murrelets aurally or visually. Rain and wind can make it difficult to hear murrelets calling. Low cloud ceilings or thick fog make it difficult to see murrelets. We recommend that if conditions that limit murrelet detectability, including heavy rain, hail, strong wind, logging activity, vehicle traffic, or loud aircraft, exist for more than 10% (12 minutes) of the survey period, the survey be rescheduled and repeated again on another morning soon after, unless occupied behaviors are detected on that morning. These conditions also include a cloud ceiling lower than the height of
20
the tallest trees at the site or low fog that decreases horizontal visibility to less than 100 m. Because murrelets might still be detected during these conditions, if the surveyor is already at the station, the survey should not be terminated (even if it will be repeated), and the observer should remain for the duration of the two-hr period unless heavy rain or strong wind threaten his/her safety. Note that the 12-minute limitation refers to 12 minutes of interrupted observations (continuous or discontinuous) once the survey is underway, and does not allow for the survey to begin late or end early.
INTERPRETING SURVEY RESULTS TO CLASSIFY SURVEY SITES AND AREAS Significance of Murrelet Behaviors Murrelet nests are extremely difficult to find; therefore, a set of behavioral criteria has been established to determine if potential habitat is likely to be occupied by murrelets. These behaviors have been documented at active nest sites and can be observed during an audio-visual survey, providing the rationale to use them as indicators of occupancy. These behaviors also have been associated with purposes other than attending an active nest, suggesting that the stand has some importance for breeding. Flight. Marbled Murrelet flight is direct and involves rapid, often continuous wing beats. Flight speeds average 73-136 km/h (45-85 mi/h) and can reach maximum speeds of 158 km/h (98 mi/h) (Hamer et al. 1995; Burger 1997; Cooper and Blaha 2002). Murrelets generally fly at higher altitudes over land between nesting and foraging areas, and fly lower at or near nests. Murrelets often fly only a few meters above water, but such low-level flight is rarely seen inland except along roadways. SUBCANOPY FLIGHTS. Subcanopy flights include those below, through, into, or out of the forest canopy within or adjacent to potential habitat. Flight below the canopy is most commonly observed during the breeding season (O'Donnell et al. 1995). Adults flying to nests approach from below the forest canopy, often along a route of gaps among overstory trees or other natural ‘corridors’ (Nelson and Peck 1995, Singer et al. 1995). Nesting birds can consistently use the same flight path within a season, although each bird of a pair may have different paths, and arrival paths may differ from departure paths. Thus, birds flying along the same route on successive days could indicate nesting. In addition to direct flights to nests, murrelets can engage in ‘fly-bys’ before and after visits to the nest, where a nesting bird flies past the nest tree below the canopy at nest height. ‘Fly-bys’ occurred during the incubation and nestling periods in California (Singer et. al. 1995), but also have been observed at nests after nesting was completed (S. K. Nelson, pers. comm.). While an observer may not be aware of a nest, these flights lend support for the association of subcanopy flights with nesting. Subcanopy flights are often nonvocal, but can include wing-beat sounds. Observations of subcanopy behaviors usually consist of 1 to 2 birds. Some flights that are observed below the canopy, and thus technically ‘subcanopy’ behaviors, are not indications of occupancy. For example, murrelets en route to nesting areas in the Santa Cruz Mountains flew quite low (just above the top of riparian hardwood trees) when following stream channels inland, particularly on foggy or heavily overcast mornings (S. Singer pers. comm.). In addition, low-flying birds have been observed in steep canyons or crossing ridgelines in non-habitat areas (S. Singer, pers. comm.; C. Smith, pers. comm.). In general, if

21
subcanopy flights are seen in areas lacking potential habitat, they are not an indication of occupancy. If there is any question about the significance of subcanopy behaviors, please consult with your regulatory agency for advice. LANDINGS. In addition to landing at active nests, murrelets have been observed landing in trees near known nests throughout the breeding season, or in trees with nests that were active in a previous year (Nelson and Peck 1995). Murrelets also land in trees prior to egg laying, presumably to inspect potential nest sites (Nelson and Hamer 1995) and to copulate (D. Buchholz, pers. comm.). Landings also may indicate territorial behavior, resting or roosting (Naslund 1993b). CIRCLING AND ABOVE-CANOPY FLIGHTS. Circling and other above-canopy flights, such as dives, indicate possible occupancy of a site (reviewed by Nelson and Hamer 1995). These behaviors are a red flag that should prompt additional survey effort to observe subcanopy activity. Shallow or steep dives that originate above the canopy but terminate below canopy have been observed more frequently (67%) near known nest trees. These ‘jet dives’ may function to maintain pair bonds or be used in territorial defense (Nelson 1997). Circling is common over some nest sites (Nelson and Peck 1995; Hamer, Ralph, unpubl. data), but not all. Nesting birds at three active nests in the Caren Range of BC were not observed to circle before returning to the ocean (P. Jones, pers. comm.), nor was circling from other birds observed over this stand. Circling often includes >2 murrelets. Circles can be small (~10-20 m radius) or greater than 1 km-radius (0.62 mi). Murrelets might use large sweeping circles to gain altitude. Occasionally, observers note ‘partial circles,’ or birds following a curving flight path. In most cases, it is likely that the birds were circling, but limited visibility prevented the observer from seeing complete circles. Upon leaving a nest, such as after an incubation exchange or fish delivery, breeding birds may join with other murrelets over the nest site before departing for the ocean (Nelson 1997). Murrelets also have been seen circling over young or non-forest habitats. However, in most cases these areas have been near or adjacent to old-growth trees (T. Hamer, unpubl. data; S. K. Nelson, unpubl. data). When evaluating the significance of circling behavior, the height of the bird(s) above the canopy, frequency of circling, and distance from potential habitat should be considered. We recommend that in all cases where circling is observed, additional surveys be conducted to determine occupancy. Vocalizations. Murrelet vocalizations are described in Appendix F. Interpreting the association of calling (an audio detection) with the status of a site is difficult. The most audible call, the ‘Keer’ call, is heard at nest sites, while flying, and at sea (Nelson 1997). Vocalizations at the nest generally are soft and not readily audible from the ground, but are given frequently by both adults during incubation exchanges and chicks during feedings. Loud calls from the nest are rarer. Nevertheless, loud calls were heard from seven nests in Oregon while birds attended a chick or egg, or prior to egg laying (Nelson and Peck 1995; A. Wilson, pers. comm.). In the Caren Range of BC (P. Jones, pers. comm.) and in California (Singer et al. 1995), however, no loud calls were recorded during approaches or exits from active nests. Calls that emanate from one location within the survey site may be a less ambiguous indication of nesting activity than calling in general. Many ‘Keer’ calls are from birds heading to the local area, but some are from birds in flight traveling beyond the site being surveyed. As social interactions increase, calling also increases, and an increase in calling in late summer may be related to subadults and nonbreeders visiting forest stands (Nelson 1997).

22
Of the nonvocal sounds heard during surveys, wing sounds can be detected from murrelets flying nearby, and ‘jet sounds’ are associated with dives (described under Circling), which can be associated with nests. Classification of Sites The behaviors described above lead to three classifications of sites and, ultimately, survey areas (see ‘Applying Site Classification’, p. 23). During surveys, the behaviors observed should be clearly documented. When appropriate, narrative also should be provided to include additional detail and insight into reported detections. Probable Absence. A site of potential habitat where no murrelets were detected after the requisite number of surveys. Presence. A site of potential habitat where murrelets were detected, but subcanopy behaviors were not observed. Additional survey effort is required at areas with birds present to determine whether or not a site is occupied. Presence sites include those with: • non-stationary audio detections; • birds flying in small- or large-radius circles above the canopy; • above-canopy dives (that do not end below the canopy) or other above-canopy flight. Occupied Site. An occupied site is a site where at least one of the following subcanopy behaviors or conditions occurs: • discovery of an active nest, a recent nest as evidenced by a fecal ring or eggshell fragments
(see Appendix B) on structures in the forest canopy, or an old nest cup and landing pad; • discovery of a downy chick, an egg, or eggshell fragments on the forest floor; • birds flying below, through, into, or out of the forest canopy within or adjacent to a site of
potential habitat. This includes birds flying over or along roads, young stands, or recently-harvested areas adjacent to potential habitat. However, only the adjacent site of potential habitat, not the non-habitat, should be classified as occupied. If birds are observed along a road where there is more than one site that the birds could be using, additional surveys may be required in some cases to determine which is occupied, if these sites are not part of the same survey area. Some subcanopy flights, such as low-flying birds observed in steep canyons or crossing ridge lines in non-habitat areas, are not associated with the site of interest and should not be considered occupied behaviors. Questions about flight behavior and occupancy should be directed to your regulatory agency for resolution.
• birds perching, landing, or attempting to land on branches; • birds calling from a stationary location within the site. A detection should be considered
‘stationary’ when three or more calls are heard at less than 100 m (328 feet) from the observer, and the position of the bird does not appear to change. Detection of stationary calling is rare in most regions.
Occupied sites include nest sites, but an occupied site also can be used for purposes other than nesting that are essential for the complete life history of the bird (Nelson 1997). For example, courtship displays in other alcids can take place near, but not at, the breeding site. Murrelets have been observed landing in unsuitable trees in unsuitable habitat contiguous with or

23
near suitable habitat in Oregon and British Columbia (S. K. Nelson, pers. comm.). These landings generally involve more than one murrelet and the birds remain standing in these young trees for a period of time. Thus, the places where birds engage in courtship or other breeding-related activities might not be in the exact same area or stand as a nest, but these areas are just as important as nesting sites for the birds’ life history. Applying Site Classification Because the survey area, by definition, is continuous potential habitat, the highest classification of probable absence, presence, or occupancy among the sites within the survey area applies to the survey area. When one survey site encompasses the entire survey area, the outcome of surveys at that site applies to the survey area interchangeably. In contrast, when a survey area is divided into more than one site, the outcomes at the sites, collectively, determine the status of the survey area. For example, if a block of continuous potential habitat is divided into three contiguous survey sites, and one of those three sites yields subcanopy detections, the entire survey area is considered occupied, not just that one site, because all the sites form one large piece of continuous habitat (see ‘importance of continuous habitat’, p. 6). However, the application of status to the survey area does not, by default, mean that the status is applied to all continuous habitat beyond the survey area, although there could be situations where a regulatory agency decides that it does. For example, if only 40 ha (100 acres) of a large block of habitat (e.g., 405 ha [1000 acres]) was defined as a survey area and occupied detections were recorded, at a minimum the defined survey area would be classified as occupied. The status of the vast habitat beyond, but continuous with, the survey area boundary should be determined with the appropriate regulatory agency. This demonstrates the importance of delineating survey boundaries in a logical way, using topographic features in addition to other guidelines. For example, if an occupied detection was made at the edge of a survey area, and the survey area boundary did not include a ridgeline that was close by, it would make sense to include the unsurveyed area up to the ridgeline as part of the habitat considered occupied. If the ridgeline had been incorporated into the survey area boundary from the start, delineating occupied habitat would be more straightforward. How Long Do Survey Results Apply? The detection of occupied behaviors in forests implies that the area serves as a breeding location for murrelets. We have no data from which we can recommend how long after surveys are completed that the results of those surveys remain valid. Murrelet surveys reflect the breeding status of sites for the time period during which surveys were conducted. As a breeding area, murrelets may nest there every year, in alternate years, or once in several years (Manley 1999). The extent of use, re-use, or abandonment of nest areas, or establishment of new areas, is unknown. However, recent observations of murrelets in 70-100 year-old forests regenerated from heavy timber harvest in Mendocino County, CA, and in northwestern Oregon may indicate immigration as the habitat has matured to suitability (R. LeValley, pers. comm.; D. Buchholz, pers. comm.), although it is not known if birds merely moved from an adjacent contiguous site, moved from a greater distance away, or actually persisted in remnant old-growth trees. In addition, Marbled Murrelets are believed to have strong fidelity to an area previously used for nesting (DeSanto and Nelson 1995, Divoky and Horton 1995). Forest patches, nest trees, and nest cups have been reused in subsequent years (by the same or different birds), and murrelets have been observed landing in a previously-used nest tree in a year when it was not used for

24
nesting (Nelson and Peck 1995, Singer et al. 1995, Hamer and Meekins 1999, Manley 1999). Repeated use of forest stands suggests that these sites play a role in supporting reproduction. Although it is possible for murrelet presence/probable absence in forest stands to change through time, we recommend that occupied stands should be treated as occupied indefinitely. Some occupied sites monitored for a decade or more have remained occupied (W. Ritchie, pers. comm.). For probable absence sites, if a significant time lag (>5 years) occurs between the completion of protocol surveys and the implementation of activities that would modify suitable habitat, additional surveys may be appropriate to support the results of previous surveys, especially given that the number of survey visits needed to determine occupancy has increased from protocols used before 2003. Consult with regulatory or evaluating agencies regarding these issues.
DATA COLLECTION Training Training is recommended for observers conducting surveys on most forest birds (Kepler and Scott 1981), and Marbled Murrelets are no exception. Intensive training and annual review and evaluation in detecting and identifying Marbled Murrelets and their vocalizations is strongly recommended and often required, as most murrelets remain unseen to the observer. It is recommended that an intensive instructional period with a minimum of three training mornings, followed by a fourth morning of performance evaluation or field examination, be implemented. Training should be conducted at a site with high activity levels to expose trainees to a wide range of vocalizations and activity during the morning. Trainees should be provided a tape with the full range of vocalizations of known murrelet calls, and be able to compare them with similar calls of other species, such as American Robin, Northern Flicker, Osprey, and Red-shouldered Hawk. They must also become familiar with the common call groups, ‘Keer’ group, ‘Groan’ group, ‘Whistle’ group, described further in Nelson (1997) and Dechesne (1998). We recommend that all trainees have their hearing tested by a professional, and have adequate vision. See Emlen and DeJong (1981) and Ramsey and Scott (1981) for discussions on counting birds and variable hearing abilities. See Appendices C-F for more details on training, evaluations, hearing tests, confusing species, and vocalizations. Data Quality In addition to each agency or entity housing their own survey data, data also are voluntarily submitted to state or regional clearing houses. Thus, it is essential that the data be accurate. We recommend that data quality be assessed at several levels, beginning with the supervising field biologist of the field crews. Supervisors should have field experience with murrelet surveys, and should review all data sheets to help assure that the data meets the highest quality possible. This review should ensure that: correct and consistent site and station identifiers were used, the survey visit started on time, observations were not disrupted for more than 12 minutes total, detections were accurately recorded, and occupied detections were accurately defined. We also recommend that relatively inexperienced surveyors (i.e., with only 1-2 seasons conducting surveys) not be responsible for delineating survey sites and designing station layout.

25
Equipment Needed Equipment for surveying should include: a clipboard, pencil, data forms, digital wrist watch, a light source (i.e., a headlamp or a flashlight), binoculars, compass, and a permanent marker and colored flagging for marking the locations of survey stations. A tape recorder is strongly recommended for all surveys and is extremely useful in areas of high activity. Use of a tape recorder allows the observer to scan the survey area continuously while simultaneously recording detections, minimizing the possibility of murrelets going undetected. Reporting Observations We recommend that data collected during survey visits be recorded on the data sheet described in Appendix G. This data form was revised by the Washington Department of Fish and Wildlife. Detailed information on murrelet behavior needs to be recorded with each observation. Include in the notes section of the form information on the location of the bird's flight (over drainage, ridge, etc.), unusual behaviors or interactions, and details on subcanopy behaviors (e.g., ‘bird flew between two trees and then headed up the Drift Creek drainage’). Observations of birds landing in trees, and chicks or eggshells on the forest floor, should be reported immediately to interested scientists and responsible wildlife agencies in your area so that active nests can be searched for.
26
LITERATURE CITED Alegria, J., L. Folliard, J. Lint, S. Madsen, T. Max, and L. Webb. 2002. Southwest Oregon inland
survey assessment for Marbled Murrelets. Unpublished report to the U.S. Fish and Wildlife Service, 4 March 2002. Available from Rogue River/Siskiyou National Forests, Supervisor’s Office, 333 W. 8th St., Medford, OR 97501.
Baldwin, J. 2001a. Investigating the possibility of changes in status at a site. November 21, 2001. Unpublished document available at http://www.pacificseabirdgroup.org.
Baldwin, J. 2001b. Investigation of seasonal heterogeneity of detecting presence and occupancy status for Marbled Murrelets. September 10, 2001. Unpublished draft report available at http://www.pacificseabirdgroup.org.
Baldwin, J. 2002. Assessing the 2-year protocol for Marbled Murrelets. July 16, 2002. Unpublished report available at http://www.pacificseabirdgroup.org.
Bradley, R.W., and F. Cooke. 2001. Cliff and deciduous tree nests of Marbled Murrelets in southwestern British Columbia. Northwestern Naturalist 82:52-57.
Brown, M., J.G. Doerr, J. Fowler, A. Russell, and P.J. Walsh. 1999. Marbled Murrelet activity patterns and survey efficiency at inland sites in southeastern Alaska. Northwestern Naturalist 80:44-50.
Burger, A.E. 1997. Behavior and numbers of Marbled Murrelets measured with radar. Journal of Field Ornithology 68:208-223.
Burger, A.E. 2002. Conservation assessment of Marbled Murrelets in British Columbia: review of the biology, populations, habitat associations, and conservation of this threatened species. Technical Report Series No. 387, Canadian Wildlife Service, Delta, BC.
Carter, H.R. and R.A. Erickson. 1988. Population status and conservation problems of the Marbled Murrelet in California, 1892-1987. Report to the Nongame Bird and Mammal Section, California Department of Fish and Game, Sacramento, CA, Job II.B.2. 74 pp.
Carter, H.R. and R.A. Erickson. 1992. Status and conservation of the Marbled Murrelet in California, 1892-1987. Proceedings of Western Foundation of Vertebrate Zoology 5:92-108.
Cooper, B.A., and R.J. Blaha. 2002. Comparisons of radar and audio-visual counts of marbled murrelets during inland forest surveys. Wildlife Society Bulletin 30(4):xx-xxx.
Cross, J.A. 1992. Over winter surveys for the Marbled Murrelet east of Verlot, Washington, 1990-1991 and 1991-1992. Unpublished report to Washington Department of Wildlife, Olympia, WA. 10 p.
Dechesne, S.B.C. 1998. Vocalizations of the Marbled Murrelet (Brachyramphus marmoratus): vocal repertoire and individuality. M.S. Thesis. University of Victoria, Victoria, BC.
DeSanto, T.L. and S.K. Nelson. 1995. Comparative reproductive ecology of auks (family Alcidae) with emphasis on the Marbled Murrelet. Pp. 33-47 in Ralph, C.J., G.L. Hunt Jr., M.G. Raphael, and J.F. Piatt, tech. eds. Ecology and conservation of the Marbled Murrelet. USDA Forest Service General Technical Report PSW-GTR-152, Albany, CA.
Dillingham, C.P., R.C. Miller, and L.O. Webb. 1995. Marbled Murrelet distribution in the Siskiyou National Forest of southwestern Oregon. Northwestern Naturalist 76:33-39.
Divoky, G.J., and M. Horton. 1995. Breeding and natal dispersal, nest habitat loss, and implications for Marbled Murrelet populations. Pp. 83-87 in Ralph, C.J., G.L. Hunt, Jr., M.G. Raphael, and J.F. Piatt, tech. eds. Ecology and conservation of the Marbled Murrelet. USDA Forest Service General Technical Report PSW-GTR-152, Albany, CA.
Emlen, J.T. and M.J. DeJong. 1981. The application of song detection threshold distance to census operations. Studies in Avian Biology 6:364-352.

27
Erickson, R.A., R.A. Hamilton, S.N.G. Howell, P. Pyle, and M.A. Patten. 1995. First record of the Marbled Murrelet and third record of the Ancient Murrelet for Mexico. Western Birds 26:39-45.
Grenier, J.J., and S.K. Nelson. 1995. Marbled Murrelet habitat associations in Oregon. Pp. 191-201 in Ralph, C.J., G.L. Hunt, Jr., M.G. Raphael, and J.F. Piatt, tech. eds. Ecology and conservation of the Marbled Murrelet. USDA Forest Service General Technical Report PSW-GTR-152, Albany, CA.
Hamer, T.E. 1995. Inland habitat associations of Marbled Murrelets in western Washington. Pp. 163-175 in Ralph, C.J., G.L. Hunt, Jr., M.G. Raphael, and J.F. Piatt, tech. eds. Ecology and conservation of the Marbled Murrelet. USDA Forest Service General Technical Report PSW-GTR-152, Albany, CA.
Hamer, T.E. and E.B. Cummins. 1990. Forest habitat relationships of Marbled Murrelets in northwestern Washington. Unpublished report, Wildlife Management Division, Nongame Program, Washington Department of Wildlife, Olympia, WA. 57 pp.
Hamer T. E. and D.J. Meekins. 1999. Marbled Murrelet nest site selection in relation to habitat characteristics in western Washington. Unpublished report to the U.S. Fish and Wildlife Service, North Pacific Coast Ecoregion, Olympia, WA. 28 pp.
Hamer, T.E., and S.K. Nelson. 1995a. Characteristics of Marbled Murrelet nest trees and nesting stands. Pp. 69-82 in Ralph, C.J., G.L. Hunt, Jr., M.G. Raphael, and J.F. Piatt, tech. eds. Ecology and conservation of the Marbled Murrelet. USDA Forest Service General Technical Report PSW-GTR-152, Albany, CA.
Hamer, T.E., and S.K. Nelson. 1995b. Nesting chronology of the marbled murrelet. Pp. 49-56 in Ralph, C.J., G.L. Hunt, Jr., M.G. Raphael, and J.F. Piatt, tech. eds. Ecology and conservation of the Marbled Murrelet. USDA Forest Service General Technical Report PSW-GTR-152, Albany, CA.
Hamer, T.E., B.A. Cooper, and C.J. Ralph. 1995. Use of radar to study the movements of Marbled Murrelets at inland sites. Northwestern Naturalist 76:73-78.
Hamer, T.E., W.P. Ritchie, E.B. Cummins, and C.W. Turley. 1994. Forest habitat relationships of marbled murrelets in western Washington. Unpublished report, Wildlife Management Division, Nongame Program, Washington Department of Wildlife, Olympia, Washington. 51 pp.
Horton, S. and P. Harrison. 1996. Olympic Experimental Forest Marbled Murrelet surveys: 1996 Annual Report. Unpublished report, Washington Department of Natural Resources, Forks, WA.
Hunter, J.E., K.N. Schmidt, H.B. Stauffer, S.L. Miller, C.J. Ralph, and L. Roberts. 1998. Status of the Marbled Murrelet in the inner north coast ranges of California. Northwestern Naturalist 79:92-103.
Jodice, P.G.R., and M.W. Collopy. 2000. Activity patterns of Marbled Murrelets in Douglas-fir old growth forests of the Oregon Coast Range. Condor 102:275-285.
Kepler, C.B. and J.M. Scott. 1981. Reducing bird count variability by training observers. Studies in Avian Biology 6:366-371.
Kuletz, K.J., N.L. Naslund and D.K. Marks. 1994. Identification of Marbled Murrelet nesting habitat in the Exxon Valdez oil spill zone. Exxon Valdez Oil Spill Restoration Project Final Report (Restoration Project R15). U. S. Fish and Wildlife Service, Anchorage, AK. 70 pp.
Kuletz, K.J., D.K. Marks, N.L. Naslund, N.J. Goodson, and M.B. Cody. 1995. Inland habitat suitability for Marbled Murrelets in southeastern Alaska. Pp. 141-149 in Ralph, C.J., G.L. Hunt Jr., M.G. Raphael, and J.F. Piatt, tech. eds. Ecology and conservation of the Marbled Murrelet. USDA Forest Service General Technical Report PSW-GTR-152, Albany, CA.

28
Lougheed, L.W. 1999. The characteristics of 23 Marbled Murrelet nests in BC located by radio telemetry. Abstract. Pacific Seabirds 26(1):52.
Manley, I.A. 1999. Re-use of nest trees by Marbled Murrelets. Abstract. Pacific Seabirds 26(1): 39.
Manley, I.A., R. Shortt, and A.E. Burger. 1992. Marbled Murrelet activity patterns in the Carmanah Valley on the southwest coast of Vancouver Island. Pp. 71-75 in Vermeer, K., R. W. Butler, and K.H. Morgan, eds. The ecology, status and conservation of marine and shoreline birds on the west coast of Vancouver Island. Occasional Paper Number 75, Canadian Wildlife Service, Environment Canada, Ottawa, ON.
Naslund, N.L. 1993a. Why do Marbled Murrelets attend old-growth forest nesting areas year-round? Auk 110:594-602.
Naslund, N.L. 1993b. Breeding biology and seasonal activity patterns of Marbled Murrelets (Brachyramphus marmoratus) nesting in an old-growth forest. M.S. Thesis. University of California, Santa Cruz. 146 pp.
Naslund, N.L., and T.E. Hamer. 1994. Techniques for finding tree nests of the Marbled Murrelet. Unpublished report prepared for the Pacific Seabird Group Marbled Murrelet Technical Committee. Available from U.S. Fish and Wildlife Service, Migratory Bird Management, 1011 E. Tudor Road, Anchorage, Alaska 99503.
Nelson, S.K. 1989. Development of inventory techniques for surveying Marbled Murrelets (Brachyramphus marmoratus) in the central Oregon Coast Range. Unpublished report to the Nongame Program, Oregon Department Fish and Wildlife, P.O. Box 59, Portland, OR, Publ. No. 88-6-01.
Nelson, S.K. 1997. Marbled Murrelet (Brachyramphus marmoratus). In The Birds of North America, No. 276 (A. Poole and F. Gills, eds.). The Academy of Natural Sciences, Philadelphia, PA, and the American Ornithologists’ Union, Washington, D.C.
Nelson, S.K. and T.E. Hamer. 1995. Nesting biology and behavior of the Marbled Murrelet. Pp. 57-67 in Ralph, C.J., G.L. Hunt, Jr., M.G. Raphael, and J.F. Piatt, tech. eds. Ecology and conservation of the Marbled Murrelet. USDA Forest Service General Technical Report PSW-GTR-152, Albany, CA.
Nelson, S.K., and R.W. Peck. 1995. Behavior of Marbled Murrelets at nine nest sites in Oregon. Northwestern Naturalist 76:43-53.
Nelson, S.K., and S.G. Sealy, eds. 1995. Biology of the marbled murrelet: inland and at sea. Northwestern Naturalist 76.
Nelson, S.K. and A.K. Wilson. 2001. Marbled Murrelet habitat characteristics of state lands in western Oregon. Unpublished final report, OR Coop. Fish and Wildlife Research Unit, Oregon State Univ., Department of Fisheries and Wildlife, Corvallis, OR. 108 pp.
O’Donnell, B.P. 1995. A review of the effects of station placement and observer bias in detections of Marbled Murrelets in forest stands. Pp. 139-140 in Ralph, C.J., G.L. Hunt, Jr., M.G. Raphael, and J.F. Piatt, tech. eds. Ecology and conservation of the Marbled Murrelet. USDA Forest Service General Technical Report PSW-GTR-152, Albany, CA.
O’Donnell, B.P., N.L. Naslund, and C.J. Ralph. 1995. Patterns of seasonal variation of activity of Marbled Murrelets in forested stands. Pp. 117-128 in Ralph, C.J., G.L. Hunt, Jr., M.G. Raphael, and J.F. Piatt, tech. eds. Ecology and conservation of the Marbled Murrelet. USDA Forest Service General Technical Report PSW-GTR-152, Albany, CA.
Paton, P.W.C., and C.J. Ralph. 1988. Geographic distribution of the Marbled Murrelet in California at inland sites during the 1988 breeding season. Unpublished report, California Department of Fish and Game, Sacramento. 35 pp.

29
Paton, P.W.C., and C.J. Ralph. 1990. Distribution of the marbled murrelet at inland sites in California. Northwestern Naturalist 71:72-84.
Ralph, C.J., G.L. Hunt, Jr., M.G. Raphael, and J.F. Piatt, tech. eds. 1995. Ecology and conservation of the Marbled Murrelet. USDA Forest Service General Technical Report PSW-GTR-152, Albany, CA.
Ralph, C.J., and S.K. Nelson. 1992. Methods of surveying Marbled Murrelets at inland forest sites. Pacific Seabird Group, Marbled Murrelet Technical Committee. May 1992. 21 pp.
Ralph, C.J., S.K. Nelson, M.M. Shaughnessy, and S.L. Miller, compilers. 1993. Methods for surveying Marbled Murrelets in forests. Pacific Seabird Group, Marbled Murrelet Technical Committee, Technical Paper #1. March 1993. 47 pp.
Ralph, C.J., S.K. Nelson, M.M. Shaughnessy, S.L. Miller, and T.E. Hamer. 1994. Methods for surveying Marbled Murrelets in forests: a protocol for land management and research. Pacific Seabird Group, Marbled Murrelet Technical Committee. March 1994. 51 pp.
Ramsey, F.L. and J.M. Scott. 1981. Tests of hearing ability. Studies in Avian Biology 6:341-345. Ritchie, W.P., and E. Rodrick. 2002. Marbled Murrelet Brachyramphus marmoratus. Pp. 4.1-
4.23 in Priority Habitats and Species Recommendations, Vol. IV: Birds. Washington Department of Fish and Wildlife, Olympia, WA.
Rodway, M.S., H.R. Carter, S.G. Sealy, and R.W. Campbell. 1992. Status of the Marbled Murrelet in British Columbia. Proceedings of the Western Foundation of Vertebrate Zoology 5:17-41.
Rodway, M.S., H.M. Regehr, and J.-P.L. Savard. 1993. Activity patterns of Marbled Murrelets in old-growth forest in the Queen Charlotte Islands, British Columbia. Condor 95:831-848.
Schmidt, K.N., J.E. Hunter, H.B. Stauffer, S.L. Miller, C.J. Ralph, and L. Roberts. 2000. Status and distribution of the Marbled Murrelet in interior northwestern California: Final Report. Unpublished report on file at Six Rivers National Forest, 1330 Bayshore Way, Eureka, Ca. 28 pp.
Simons, T.R. 1980. Discovery of a ground-nesting Marbled Murrelet. Condor 82:1-9. Singer, S.W. and T.E. Hamer. 1999. Gazos Creek Marbled Murrelet monitoring program – 1999
Annual Report. Unpublished report for the Sempervirens Fund and the Apex Houston Trustee Council, prepared by Steven W. Singer Environmental and Ecological Services, Santa Cruz, CA.
Singer, S.W., D.L. Suddjian, and S.A. Singer. 1995. Fledging behavior, flight patterns, and forest characteristics at Marbled Murrelet tree nests in California. Northwestern Naturalist 76:54-62.
U.S. Fish and Wildlife Service. 1997. Recovery plan for the threatened Marbled Murrelet (Brachyramphus marmoratus) in Washington, Oregon, and California. USDI, Fish and Wildlife Service Region 1, Portland, OR.
U.S. Fish and Wildlife Service. 2002. Technical assistance on the final results of landscape level surveys for Marbled Murrelets in southwest Oregon. USFWS 1-7-02-TA-640. Oregon Fish and Wildlife Office, 2600 SE 98th Ave., Suite 100, Portland, OR 97266.
Whitworth, D.L., S.K. Nelson, S.H. Newman, G.B. van Vliet, and W.P. Smith. 2000. Foraging distances of radio-marked Marbled Murrelets from inland areas in southeast Alaska. Condor 102:452-456.
Witt J.W. 1998a. Distribution of the Marbled Murrelet in southwestern Oregon. Northwest Science 72:96-101.
Witt, J.W. 1998b. Notes on activity and characteristics of an inland Marbled Murrelet nest site in Douglas County, Oregon. Northwestern Naturalist 79:27-32.

30
122 ha(300 acres)
Timber Sale
1/4 mile (402 m)
79 ha (196 acres)
4 ha
Figure 1. A 4-ha (10-acre) timber harvest area is located in the middle of a 122-ha (300-acre) stand of potential habitat. The survey area (timber harvest area and potential habitat within one-quarter mile of the harvest boundary) includes 83 ha (206 acres).

31
1/4 mile (402 m)
Timber sale2 ha (5 acres)
Minimum area to be surveyed26 ha (65 acres)
Additional contiguous habitatto be surveyed, if possible
101 ha (250 acres)
Figure 2. A 2-ha (5-acre) timber harvest area is located on the edge of a 101-ha (250-acre) stand of potential habitat. A one-quarter mile boundary around the proposed harvest area includes 26 ha (65 acres) of potential habitat. This captures a small portion of the entire continuous habitat. The additional continuous habitat that extends beyond the one-quarter mile boundary should also be considered for surveys.

32
XX
X
X
X
X
X
X
X
X
XX
XX
Timber Sale
Site #1 ('LG01')61 ha (151 acres) Site #2 ('LG02')
60 ha (148 acres)
Site #3 ('LG03')53 ha (131 acres)
X = Survey Station
Survey Area, Lost Gulch ('LG')
LG01A
LG01B
LG01C
LG02A
LG02B
LG03A
LG03B
X
Figure 3. A large survey area of 174 ha (430 acres) divided into three survey sites, and an example of a naming convention to uniquely identify survey area, sites, and stations.

33
Figure 4. The survey area (timber harvest area and potential habitat within 1/4 mile of the sale boundary) includes 85 ha (210 acres). Eleven stations (approximately one station per 8 ha [20 acres]) are needed to survey this area because of limited visibility and steep and complex terrain.

34
X
X
Survey station
12-ha (30-acre) site
Approximate area surveyed from survey station
Figure 5. Two stations are needed to survey this 12-ha (30-acre) site that has a long and narrow shape.
X
Approximate area surveyed from station
Survey station
12-ha (30-acre) stand
Figure 6. Less than 6 ha (15 acres) of this 12-ha (30-acre) site would be surveyed with this survey station. At least one additional station would be needed to survey this site adequately.

35
Figure 7. Example of using one large brushed trail to access many survey stations.
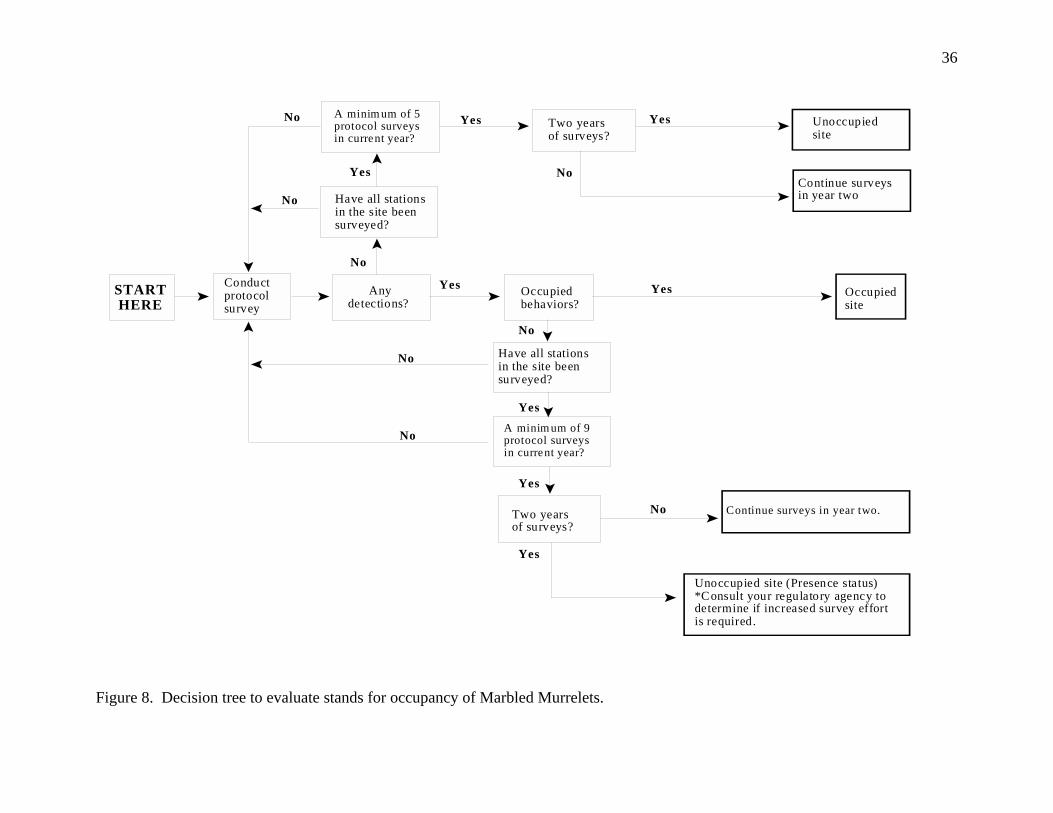
36
No
Have all stationsin the site beensurveyed?
STARTHERE
Conduct protocolsurvey
Anydetections?
No
Yes Two years of surveys?
Unoccupiedsite
Yes
NoContinue surveysin year two
Yes
Yes
Occupiedbehaviors?
Occupiedsite
Yes
No
Have all stationsin the site beensurveyed?
No
Two years of surveys?
Yes
Yes
No
No
Yes
Unoccupied site (Presence status)*Consult your regulatory agency todetermine if increased survey effortis required.
No
A minim um of 9protocol surveysin current year?
A minim um of 5protocol surveys in current year?
Continue surveys in year two.
Figure 8. Decision tree to evaluate stands for occupancy of Marbled Murrelets.

37
Figure 9. Proportion of visits with presence (top) and occupancy (bottom) at sites with at least one visit of presence or occupancy, respectively. Data for occupancy were restricted to sites surveyed with binomial sampling (a set number of visits regardless of detections). Week 1 begins 15 April, week 12 begins 1 July, week 16 begins 29 July. From Baldwin 2001b.
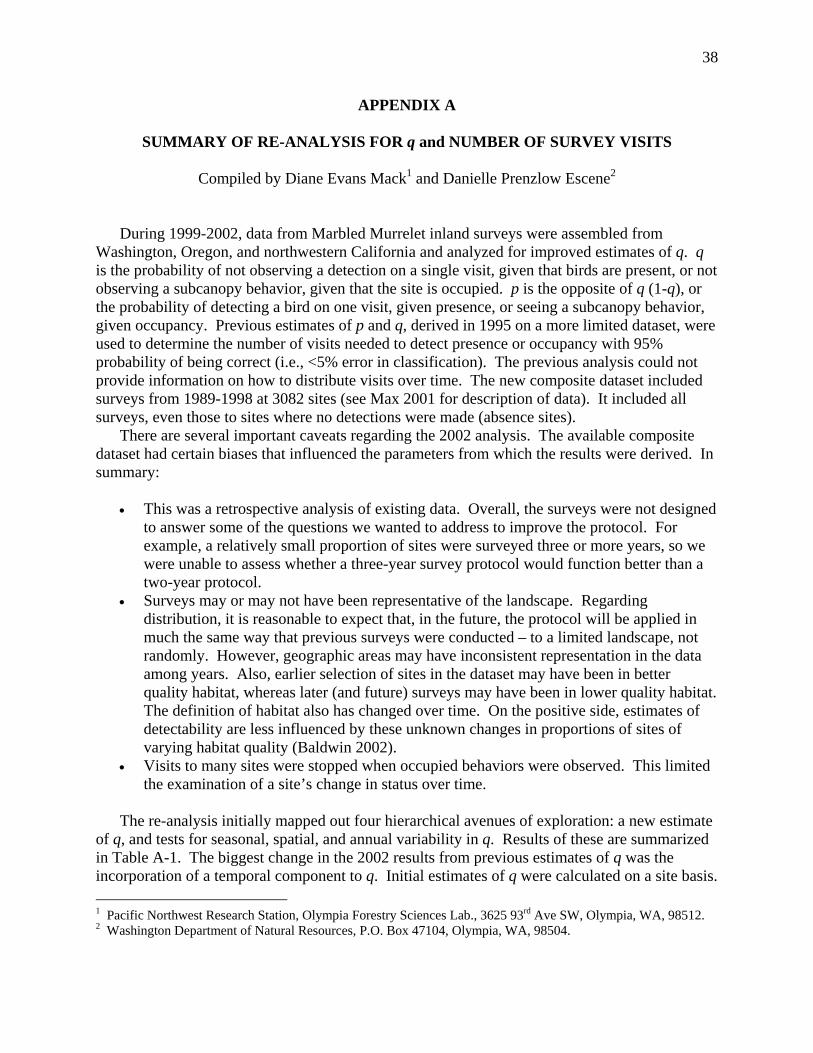
38
APPENDIX A
SUMMARY OF RE-ANALYSIS FOR q and NUMBER OF SURVEY VISITS
Compiled by Diane Evans Mack1 and Danielle Prenzlow Escene2 During 1999-2002, data from Marbled Murrelet inland surveys were assembled from Washington, Oregon, and northwestern California and analyzed for improved estimates of q. q is the probability of not observing a detection on a single visit, given that birds are present, or not observing a subcanopy behavior, given that the site is occupied. p is the opposite of q (1-q), or the probability of detecting a bird on one visit, given presence, or seeing a subcanopy behavior, given occupancy. Previous estimates of p and q, derived in 1995 on a more limited dataset, were used to determine the number of visits needed to detect presence or occupancy with 95% probability of being correct (i.e., <5% error in classification). The previous analysis could not provide information on how to distribute visits over time. The new composite dataset included surveys from 1989-1998 at 3082 sites (see Max 2001 for description of data). It included all surveys, even those to sites where no detections were made (absence sites). There are several important caveats regarding the 2002 analysis. The available composite dataset had certain biases that influenced the parameters from which the results were derived. In summary:
• This was a retrospective analysis of existing data. Overall, the surveys were not designed to answer some of the questions we wanted to address to improve the protocol. For example, a relatively small proportion of sites were surveyed three or more years, so we were unable to assess whether a three-year survey protocol would function better than a two-year protocol.
• Surveys may or may not have been representative of the landscape. Regarding distribution, it is reasonable to expect that, in the future, the protocol will be applied in much the same way that previous surveys were conducted – to a limited landscape, not randomly. However, geographic areas may have inconsistent representation in the data among years. Also, earlier selection of sites in the dataset may have been in better quality habitat, whereas later (and future) surveys may have been in lower quality habitat. The definition of habitat also has changed over time. On the positive side, estimates of detectability are less influenced by these unknown changes in proportions of sites of varying habitat quality (Baldwin 2002).
• Visits to many sites were stopped when occupied behaviors were observed. This limited the examination of a site’s change in status over time.
The re-analysis initially mapped out four hierarchical avenues of exploration: a new estimate of q, and tests for seasonal, spatial, and annual variability in q. Results of these are summarized in Table A-1. The biggest change in the 2002 results from previous estimates of q was the incorporation of a temporal component to q. Initial estimates of q were calculated on a site basis.
1 Pacific Northwest Research Station, Olympia Forestry Sciences Lab., 3625 93rd Ave SW, Olympia, WA, 98512. 2 Washington Department of Natural Resources, P.O. Box 47104, Olympia, WA, 98504.
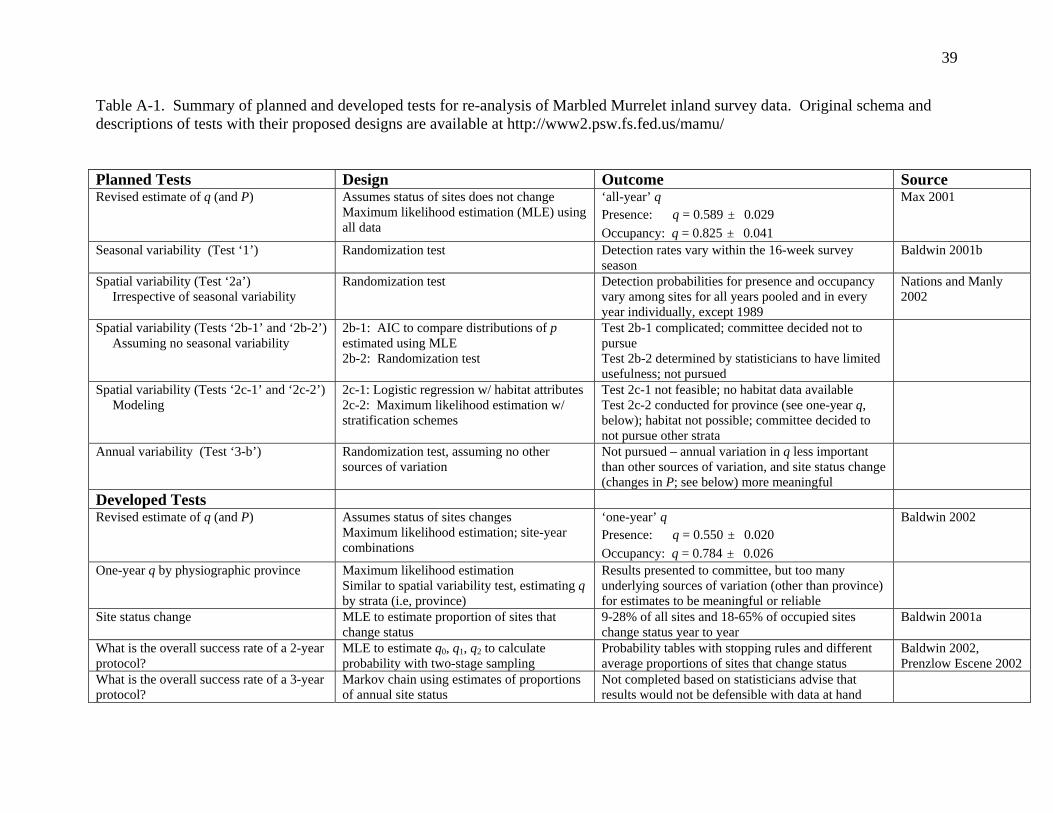
39
Table A-1. Summary of planned and developed tests for re-analysis of Marbled Murrelet inland survey data. Original schema and descriptions of tests with their proposed designs are available at http://www2.psw.fs.fed.us/mamu/ Planned Tests Design Outcome Source Revised estimate of q (and P)
Assumes status of sites does not change Maximum likelihood estimation (MLE) using all data
‘all-year’ q Presence: q = 0.589 " 0.029 Occupancy: q = 0.825 " 0.041
Max 2001
Seasonal variability (Test ‘1’) Randomization test Detection rates vary within the 16-week survey season
Baldwin 2001b
Spatial variability (Test ‘2a’) Irrespective of seasonal variability
Randomization test Detection probabilities for presence and occupancy vary among sites for all years pooled and in every year individually, except 1989
Nations and Manly 2002
Spatial variability (Tests ‘2b-1’ and ‘2b-2’) Assuming no seasonal variability
2b-1: AIC to compare distributions of p estimated using MLE 2b-2: Randomization test
Test 2b-1 complicated; committee decided not to pursue Test 2b-2 determined by statisticians to have limited usefulness; not pursued
Spatial variability (Tests ‘2c-1’ and ‘2c-2’) Modeling
2c-1: Logistic regression w/ habitat attributes 2c-2: Maximum likelihood estimation w/ stratification schemes
Test 2c-1 not feasible; no habitat data available Test 2c-2 conducted for province (see one-year q, below); habitat not possible; committee decided to not pursue other strata
Annual variability (Test ‘3-b’) Randomization test, assuming no other sources of variation
Not pursued – annual variation in q less important than other sources of variation, and site status change (changes in P; see below) more meaningful
Developed Tests Revised estimate of q (and P)
Assumes status of sites changes Maximum likelihood estimation; site-year combinations
‘one-year’ q Presence: q = 0.550 " 0.020 Occupancy: q = 0.784 " 0.026
Baldwin 2002
One-year q by physiographic province Maximum likelihood estimation Similar to spatial variability test, estimating q by strata (i.e, province)
Results presented to committee, but too many underlying sources of variation (other than province) for estimates to be meaningful or reliable
Site status change MLE to estimate proportion of sites that change status
9-28% of all sites and 18-65% of occupied sites change status year to year
Baldwin 2001a
What is the overall success rate of a 2-year protocol?
MLE to estimate q0, q1, q2 to calculate probability with two-stage sampling
Probability tables with stopping rules and different average proportions of sites that change status
Baldwin 2002, Prenzlow Escene 2002
What is the overall success rate of a 3-year protocol?
Markov chain using estimates of proportions of annual site status
Not completed based on statisticians advise that results would not be defensible with data at hand

40
In other words, q was based on the total visits to a site, regardless of whether visits occurred in only 1 year, 2 years, or 6+ years (Max 2001). This analysis (termed the ‘all-year’ q) assumed that the status of a site did not change from year to year. The exploration of status change (Baldwin 2001a) demonstrated the need to account for P (proportion of sites that are occupied) in the estimate of q. This led to a ‘one-year’ q for presence (0.5505) and for occupancy (0.7842), based on all site-year combinations in the dataset (Baldwin 2002). Because q is a conditional probability of not observing the behavior given that it does occur, q would not be expected to change from year to year. Years when the behavior truly doesn’t occur actually demonstrate a change in P, not q. The fact that a relatively high proportion of sites changed status confirmed the need for a survey protocol that encompasses more than one year. Because the existing data were inadequate to examine status change over three or more years, we accepted a two-year protocol. The associated numbers of visits for the ‘one-year’ q are summarized in Table A-2. For example, given that a site has presence in a year, the probability of not observing a presence behavior on a single visit during that year is 0.5505 (q for presence). Thus, within a one-year time frame, a site with a true annual status of presence would need to be visited 5 times (1!q5) to reach a 0.9494 probability of detecting presence during that year. Stated another way, a site with a true annual status of presence would need to be visited 5 times (q5) to have a 0.0506 probability of not detecting presence during that year. Given that a site is occupied in a year, the probability of not observing an occupied behavior on a single visit during that year is 0.7842 (q for occupancy). Thus, a site with a true annual status of occupancy would need to be visited 12 times (q12) to have a 0.0541 probability of not detecting occupancy during that year. Table A-2. Probability of detecting presence and occupancy based on a one-year definition of status and a one-year time frame, with q-values from Baldwin 2002. All data were used. Number
of visits Presence Occupancy
4 0.9082 0.6218 5 0.9494 0.7034 6 0.9722 0.7674 7 0.9847 0.8176 8 0.9916 0.8570 9 0.9954 0.8878 10 0.9974 0.9120 11 0.9986 0.9310 12 0.9992 0.9459 13 0.9996 0.9576 14 0.9998 0.9667 15 0.9999 0.9739 16 0.9999 0.9795
The data presented in Table A-2 could be used to design a simplified sampling scheme, but the 1989-1998 dataset allowed two other components to be considered: the effect of two-stage sampling (stopping early when no detections are made) and status changes at sites. These

41
components were used to address survey efficiency, while minimizing the risk of misclassifying a truly occupied site. In order to recommend two-stage sampling (i.e., incorporate a stopping rule), one needs to determine not only the probability of not observing an occupied behavior, but also the probability of not observing even presence behaviors on a single visit. Baldwin (2002) reports the appropriate detection probabilities from the dataset analyzed: given that a site is occupied in a year, the probability of observing no detections on a single visit during that year (q0) is 0.4244. Given that a site is occupied in a year, the probability of observing presence-only behaviors on a single visit during that year (q1) is 0.3416. Given that a site is occupied in a year, the probability of observing occupied behaviors on a single visit during that year (q2) is 0.2341. In addition, knowing that the status of a site could change over two years, one could assume several scenarios: (1) any site is occupied (or has presence status) in only 1 of 2 years, (2) any site is occupied (or has presence) in both years, or (3) on average, some proportion of sites is occupied in only 1 of 2 years. The formulas for calculating the probability of observing occupancy for these scenarios and with two-stage sampling are listed in Table A-3 (from Prenzlow Escene 2002). The table assigns Q and QN to the formulas for probability of observing occupancy for the case of occupied in 1 of 2 years and 2 of 2 years, respectively. The table also assigns the variables A, B, and C to the proportions of sites in the various combinations of true annual site status over two years, conditional on observing at least one observation of occupancy. Since at least one year must have a true annual site status of occupancy, A + B + C = 1. The formula to incorporate proportions of sites that change status into the final calculation (average probability of detecting occupancy) is: AQ + BQ + CQN which equals (A + B)Q + CQN which equals (1 ! C)Q + CQN. Table A-3. Formulas for calculating the probability of observing occupancy under different scenarios of true annual site status, incorporating a stopping rule in the sampling approach. The final formula for average probability of detecting occupancy is AQ + BQ + CQN, or (1 ! C)Q + CQN.
True Annual Site Status Year 1 Year 2 Probability of Observing Occupancy Proportion
Absence Absence 0 0 Absence Occupancy Q = 1 ! (q0 + q1)s ! q0
s*(1 ! (q0 + q1)s!s*) A Occupancy Absence Q = 1 ! (q0 + q1)s ! q0
s*(1 ! (q0 + q1)s!s*) B Occupancy Occupancy QN = 1 ! (q0 + q1)2s ! q0
s*(1 ! (q0 + q1)s!s*)( q0s* + (q0 + q1)s) C
This protocol recommends a sampling design based on 40% of occupied sites changing status over two years (from the weighted average of sites changing status over pairs of years from 1991-1998; Baldwin 2001a) and a stopping rule of 5 visits, assuming a desired 95% probability of correctly classifying occupied sites. This sampling design can be assessed against those using alternative proportions and numbers of visits by comparing Tables A-4 through A-8. Additional scenarios are displayed in Prenzlow Escene 2002.

42
Table A-4. Probabilities of detecting occupancy in one year, given that a site is occupied in only 1 of 2 years (equivalent to an average of 100% of occupied sites changing status). s = planned number of visits per year; s* = number of visits with no detections, after which surveys could be stopped for that year (‘stopping rule’ visits). From Baldwin 2002.
Occupied in 1 year, absence in the other (A=0.5, B=0.5, C=0) s
s* = 4
s* = 5
s* = 6
s* = s no two-stage
sampling 4 0.6557 --- --- 0.6557 5 0.7287 0.7363 --- 0.7363 6 0.7846 0.7948 0.7980 0.7980 7 0.8274 0.8396 0.8439 0.8453 8 0.8602 0.8739 0.8791 0.8815 9 0.8853 0.9002 0.9060 0.9092
10 0.9046 0.9203 0.9266 0.9305 11 0.9193 0.9357 0.9424 0.9467 12 0.9306 0.9476 0.9545 0.9592 13 0.9392 0.9566 0.9638 0.9687 14 0.9459 0.9635 0.9709 0.9761 15 0.9509 0.9688 0.9763 0.9817 16 0.9548 0.9729 0.9805 0.9860
Table A-5. Probabilities of detecting occupancy in one year, given that a site is occupied in both of 2 years (0% of occupied sites changing status). s = planned number of visits; s* = number of visits with no detections, after which surveys could be stopped for that year (‘stopping rule’ visits). From Prenzlow Escene 2002.
Occupied in both of 2 years (A=0, B=0, C=1.0)
s s* = 4 s* = 5 s* = 6 s* = s
no two-stage sampling
4 0.8815 0.8815 5 0.9282 0.9305 0.9305 6 0.9560 0.9585 0.9592 0.9592 7 0.9727 0.9751 0.9758 0.9761 8 0.9827 0.9849 0.9857 0.9860 9 0.9888 0.9908 0.9914 0.9918
10 0.9925 0.9943 0.9949 0.9952 11 0.9948 0.9964 0.9969 0.9972 12 0.9962 0.9977 0.9981 0.9983 13 0.9971 0.9985 0.9988 0.9990 14 0.9977 0.9990 0.9993 0.9994 15 0.9981 0.9993 0.9995 0.9997 16 0.9984 0.9994 0.9997 0.9998
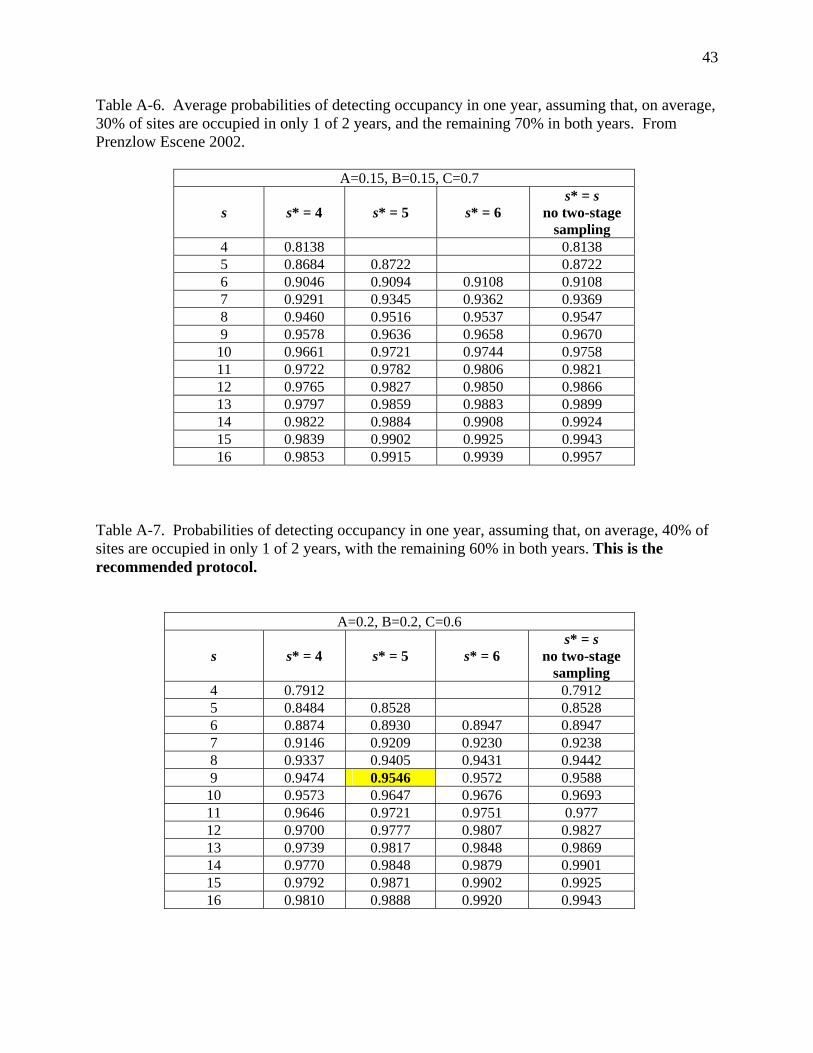
43
Table A-6. Average probabilities of detecting occupancy in one year, assuming that, on average, 30% of sites are occupied in only 1 of 2 years, and the remaining 70% in both years. From Prenzlow Escene 2002.
A=0.15, B=0.15, C=0.7
s s* = 4 s* = 5 s* = 6 s* = s
no two-stage sampling
4 0.8138 0.8138 5 0.8684 0.8722 0.8722 6 0.9046 0.9094 0.9108 0.9108 7 0.9291 0.9345 0.9362 0.9369 8 0.9460 0.9516 0.9537 0.9547 9 0.9578 0.9636 0.9658 0.9670
10 0.9661 0.9721 0.9744 0.9758 11 0.9722 0.9782 0.9806 0.9821 12 0.9765 0.9827 0.9850 0.9866 13 0.9797 0.9859 0.9883 0.9899 14 0.9822 0.9884 0.9908 0.9924 15 0.9839 0.9902 0.9925 0.9943 16 0.9853 0.9915 0.9939 0.9957
Table A-7. Probabilities of detecting occupancy in one year, assuming that, on average, 40% of sites are occupied in only 1 of 2 years, with the remaining 60% in both years. This is the recommended protocol.
A=0.2, B=0.2, C=0.6
s s* = 4 s* = 5 s* = 6 s* = s
no two-stage sampling
4 0.7912 0.7912 5 0.8484 0.8528 0.8528 6 0.8874 0.8930 0.8947 0.8947 7 0.9146 0.9209 0.9230 0.9238 8 0.9337 0.9405 0.9431 0.9442 9 0.9474 0.9546 0.9572 0.9588
10 0.9573 0.9647 0.9676 0.9693 11 0.9646 0.9721 0.9751 0.977 12 0.9700 0.9777 0.9807 0.9827 13 0.9739 0.9817 0.9848 0.9869 14 0.9770 0.9848 0.9879 0.9901 15 0.9792 0.9871 0.9902 0.9925 16 0.9810 0.9888 0.9920 0.9943

44
Table A-8. Probabilities of detecting occupancy in one year, assuming that 70% of sites are occupied in only 1 of 2 years, and the remaining 30% in both years. From Prenzlow Escene 2002. A=0.35, B=0.35, C=0.3
s s* = 4 s* = 5 s* = 6 s* = s
no two-stage sampling
4 0.7234 0.7234 5 0.7886 0.7946 0.7946 6 0.8360 0.8439 0.8464 0.8464 7 0.8710 0.8803 0.8835 0.8845 8 0.8970 0.9072 0.9111 0.9129 9 0.9164 0.9274 0.9316 0.9340
10 0.9310 0.9425 0.9471 0.9499 11 0.9420 0.9539 0.9588 0.9619 12 0.9503 0.9626 0.9676 0.9709 13 0.9566 0.9692 0.9743 0.9778 14 0.9614 0.9742 0.9794 0.9831 15 0.9651 0.9780 0.9833 0.9871 16 0.9679 0.9809 0.9863 0.9901
Acknowledgements The Statistical Analysis Steering Committee was facilitated by Danielle Prenzlow Escene. Jim Baldwin and Tim Max designed and conducted the tests summarized herein, with assistance from Karen Hyer, Chris Nations, and Brian Manly. Diane Evans Mack, Kim Flotlin, Lee Folliard, Tom Hamer, Scott Horton, Joe Lint, Kim Nelson, Scott Osborn, Bill Ritchie, Lynn Roberts, Marty Raphael, and Mike Wilson comprised the review committee.
References Baldwin, J. 2001a. Investigating the possibility of changes in status at a site. November 21, 2001.
Unpublished document available at http://www.pacificseabirdgroup.org. Baldwin, J. 2001b. Investigation of seasonal heterogeneity of detecting presence and occupancy
status for Marbled Murrelets. September 10, 2001. Unpublished draft report available at http://www.pacificseabirdgroup.org.
Baldwin, J. 2002. Assessing the 2-year protocol for Marbled Murrelets. July 16, 2002. Unpublished report available at http://www.pacificseabirdgroup.org.
Max, T. 2001. Summary of revised estimate of q. June 27, 2001. Unpublished document available at http://www.pacificseabirdgroup.org.
Nations, C., and B. Manly. 2002. Heterogeneity in probability of detecting Marbled Murrelet presence and occupancy among different sites. June 7, 2002. Unpublished report available at http://www.pacificseabirdgroup.org.
Prenzlow Escene, D. 2002. Final recommendations from the steering committee for the Marbled Murrelet Inland Survey Protocol statistical analyses. July 29, 2002. Unpublished report available at http://www.pacificseabirdgroup.org.

45
APPENDIX B
DESCRIPTION OF MURRELET EGGS AND EGGSHELL FRAGMENTS
Compiled by Steve Singer1
Size and Shape Marbled murrelet eggs are subelliptical in shape with sizes ranging from 57.0-63.0 mm in length, 35.0-39.5 mm in width, and 36-41 g in mass (Nelson 1997). One reported measurement of eggshell thickness was 0.21 mm at the waist (Kiff 1981). Surface texture is usually smooth and non-glossy. Color and Markings Egg background color is olive-green, lime green, or greenish-yellow, and more precisely corresponds to Munsell colors of 2.5 GY 8/3, 2.5 GY 8/4, 7.5 Y 8/4, 7.5 Y 8.5/4, and rarely, 6.5 GY 8/3 (see Table B-1). Eggs are variably marked with irregular spots and splotches that are brownish, blackish, grayish, purplish, or sepia-like in color (Figure B-1). Spots and splotches may be 8 mm in their longest dimension (Becking 1991), although most are smaller than 2 mm in diameter. It is not yet known if there is any geographic variation in egg color or markings. Some published descriptions have failed to match eggshell color with known color standards, thereby limiting their usefulness. Those that have done so have used Ridgway (1912), Smithe (1974, 1975, 1976), or the Munsell Book of Color (Anonymous 1976). Of these color standards, only the latter has enough described colors to provide an exact match for all egg colors based on unfaded color swatches. A comparison of different color standards used to describe Marbled Murrelet eggshell colors is provided in Table B-1.
Figure B-1. Nearly intact side of large Marbled Murrelet eggshell fragment, Big Basin Redwoods State Park, 1993. Photo by S. Singer. 1 Santa Cruz Mountain Murrelet Group, P.O. Box 7422, Santa Cruz, CA. 95061.

46
Table B-1. Background Marbled Murrelet egg color as defined by different color notation standards.
Ridgeway (1912) Smithe (1974, 1975, 1976) Munsell Book of Color (Anon. 1976)
“pale glass green”a No equivalent 2.5 GY 8/3 “pale chalcedony yellow” No equivalent 7.5 Y 8/4
7.5 Y 8.5/4 “pale dull green-yellow” No equivalent, but somewhat lighter that
#59 “lime green” and more yellow than #162 D “opaline green”
2.5 GY 8/4 2.5 GY 8.5/4
“pale turtle green”b #162 D “opaline green” 6.5 GY 8/3 a Sources: descriptive articles in References, also unpublished data. b Uncommon eggshell color described in Singer et al. 1991. Recommendations on Describing Eggshell Fragments Eggshell fragments are often found in murrelet nests or on the ground below. Their condition can be useful in determining the fate of the nest if not otherwise known. Researchers should collect the following information:
• Number, size, and shape of fragments and location where found • Background color based on Munsell Book of Color (but note that shell fragments weather
toward brown relatively quickly under acid conditions of coniferous forests) • Number, size, and shape of spots and splotches and color description based on Munsell
Book of Color. • Texture and thickness of the eggshell • Presence of any other egg or nestling materials associated with the eggshell fragments,
such as shell membrane, albumen, yolk, blood, feathers, or feather sheaths.
Eggshells should be donated to museums and scientists with the proper permits in your area. It is not permissible to keep eggshell fragments without the proper federal, state, or provincial permits. Copies of the Munsell Book of Color are available in the library of any college or university with an Arts Department or can be ordered from Gretag MacBeth, 617 Little Britain Road, New Windsor, New York, 12553. Their web site is at http://munsell.com.

47
References Anonymous 1976. Munsell book of color. Gretag MacBeth, New Windsor, NY. Becking, R.W. 1991. Eggshell fragments of the Marbled Murrelet (Brachyramphus marmoratus)
in San Mateo County, CA. Northwestern Naturalist 72(2):75-76. Day, R.H., K.L. Oakley, and D.R. Barnard. 1983. Nest sites and eggs of Kittlitz’s and Marbled
Murrelets. Condor 85: 265–273. Hirsch, K.V., D.A. Woodby, and L.B. Astheimer. 1981. Growth of a nestling Marbled Murrelet.
Condor 83:264-265. Kiff, L.F. 1981. Eggs of the Marbled Murrelet. Wilson Bulletin 93:400-403. Nelson, S.K. 1997. Marbled Murrelet (Brachyramphus marmoratus). In the Birds of North
America No. 276 (A. Poole and F. Gill, eds.). The Academy of Natural Sciences, Philadelphia, PA. and the American Ornithologist’s Union, Washington, D.C.
Pratt, H.D. and J.P. O’Neill. 1976. Naturalist’s color guide [Book Review]. Auk 93(2):404-406. Preston, F.W. 1953. Shapes of birds eggs. Auk 70(2):160-182. Reed, P. and C. Wood. 1991. Marbled Murrelet chick and eggshell fragments from inland
Washington. Northwestern Naturalist 72:77-78. Ridgway, R. 1912. Color standards and color nomenclature. Published by Author. Washington,
D.C. Sealy, S.G. 1975. Egg size of murrelets. Condor 77:500-501. Simons, T.R. 1980. Discovery of a ground-nesting Marbled Murrelet. Condor 82:1-9. Singer, S.W., N.L. Naslund, S.A. Singer, and C.J. Ralph. 1991. Discovery and observations of
two tree nests of the Marbled Murrelet. Condor 93:330-339. Singer, S.W., D.L. Suddjian, and S.A. Singer. 1995. Fledging behavior, flight patterns, and
habitat characteristics of Marbled Murrelet tree nests in California. Northwestern Naturalist 76:54-62.
Smithe, F.B. 1974. Naturalist’s Color Guide Supplement. American Museum of Natural History, New York, NY.
. 1975. Naturalist’s Color Guide. American Museum of Natural History, New York, NY.
. 1981. Naturalist’s Color Guide – Part III. American Museum of Natural History, New York, NY.
48
APPENDIX C
MARBLED MURRELET OBSERVER TRAINING PROTOCOL
Compiled by Sherri L. Miller1, C. John Ralph1, and Ron LeValley2 Introduction Presented here is a protocol to train and evaluate potential observers. The training program helps the trainees to develop their ability to see and hear murrelets in the forest and to accurately record observations on a data form. The evaluation process provides a standardized method for determining if an individual's abilities will yield reliable and dependable survey data. Training for first and second year murrelet surveyors should include all of the following steps: (1) a hearing test (see Appendix C); (2) a seminar on murrelet biology and forest survey protocol; (3) field training, with a minimum of three survey mornings, from a qualified instructor within or outside of your agency or organization; and (4) a field exam with a qualified evaluator in their geographic area. Trainees should take the field exam after they understand the protocol and are proficient in survey techniques. Once a trainee passes the field exam, they are qualified to conduct murrelet forest surveys. After two years of survey experience that includes murrelet detections on multiple surveys, training in subsequent years should include steps (1), (3) and (4) as listed above, except with two to three practice survey mornings in the field recommended prior to the field exam. Surveyors who do not perform murrelet surveys regularly should also include step (2) in their annual evaluation. It is important that surveyors refamiliarize themselves each year with the calls and techniques needed to conduct accurate murrelet surveys. We also recommend that to help maintain their skills, surveyors who do not encounter murrelets during the season should visit a site with moderate activity levels at least one time during the season. This mid-season refresher would best take place during late June or early July to prepare a surveyor for the increased activity levels documented in July. Observer Qualifications Our experience indicates that most individuals with adequate sight and hearing abilities are capable of being trained to recognize Marbled Murrelets following the PSG protocol. However, the quality and reliability of observations is greatly enhanced if surveyors possess basic bird identification skills, or, preferably, begin with the ability to identify by sight and sound the common birds of the survey areas. Surveys at sites with low or zero murrelet abundance require a higher degree of competence and documentation (Hunter and LeValley 1996). Given the expense of sorting out false positive detections, land managers should be willing to expend the effort to insure that the data gathered are of the highest quality possible. Seminar A seminar on the biology of the Marbled Murrelet should include the following: species description, breeding chronology, flight behavior, habits, habitat and nest site description, and a summary of potential threats to the bird. A slide show or video including pictures of adults, juveniles, chicks, eggs, eggshell fragments, and some habitats used by murrelets should be 1 Redwood Sciences Laboratory, U.S.D.A. Forest Service, 1700 Bayview Drive, Arcata, California, 95521. 2 Mad River Biologists, 1497 Central Ave., McKinleyville, California, 95519.

49
included. A video of murrelets in flight over forests should be incorporated if accessible. The seminar can provide information regarding the legal history and current status of the species. Questions from the audience should be answered regarding all aspects of the biology of the species. The importance of adequate training and preparation for the evaluation should be emphasized at the seminar. Proper training will not only help observers to pass the evaluation, but also will improve the quality of data collected throughout the season. The survey protocol should be reviewed and information presented on where to survey (potential habitat), when to survey (dates and times of survey), how to establish the survey site, and the number of survey stations required. Examples of how to establish survey stations should be presented with a discussion of where to place stations at the site. A complete description of how to record and interpret data and bird behavior should be included in all aspects of the training and reviewed annually. Field Training Field training should always be conducted at an area of high murrelet activity, preferably well in excess of 25 detections per morning. If this level of activity is not found in the local area, it is recommended that trainees be transported to an area of high murrelet activity. Before the first day of training, it will be helpful to the trainees to read and become familiar with the PSG survey protocol (Evans Mack et al. 2002) and to listen to a Marbled Murrelet vocalization cassette tape with accompanying descriptions. An outline of the daily objectives for the training and equipment for surveys should be obtained from the instructor prior to the training session. Equipment needed for the training includes: a tape recorder, at least one blank cassette tape, binoculars, a compass, a digital watch, and 5-10 blank survey data forms. Outline of field training schedule Day 1.--The first day of the field training begins 15 minutes before the survey time, at an area that will not disturb nesting murrelets. Trainees can listen to the murrelet vocalization tape while the instructor identifies the types of murrelet calls. The instructor should discuss calls from other species which may cause confusion. The training tape can include some of these calls of other species. At the survey training site, trainees observe and listen for murrelets while the instructor points out the birds and calls. The instructor can discuss (1) murrelet behaviors in the forest and the importance of behaviors in identifying occupied sites; (2) the data sheet, including the types of data taken and priorities when recording information; (3) observation and recording techniques; and (4) calls and flight patterns of other birds that can cause misidentification problems. The use of the Notes section on the data form should be encouraged. Interpretation of survey results will be enhanced by narrative notes that clarify the data. The instructor should discuss the importance of using binoculars to identify some species which can be confused with murrelets (e.g., swallows, swifts). It also should be noted that since the use of binoculars during a survey can cause the surveyor to miss murrelets, their use should be limited to species verification. The instructor should encourage trainees to ask questions throughout the session and during a discussion period following the survey. During the last portion of the survey period, the instructor can record a few detections to demonstrate recording methods. At the close of the session, trainees are asked to practice recording before the next day's session by observing birds of any species flying overhead. By
50
recording these birds, they will become more familiar with the data required and the order in which the information is recorded. A classroom session on this day can be used to explain details of recording observations on the data forms and mapping detections, and to show videos and/or slides. Day 2.--On this day, trainees practice identifying murrelet calls and observing behaviors during visual detections. The instructor should measure and mark distances and tree heights at the training site to help trainees sharpen their skills for estimating distance to, and height of, the birds. A 50-m or 100-m tape can be used after the session to further help with distance estimates. Considerations of station placement at a site can be covered in the field on this day. The instructor should record a few detections on a tape recorder, play back the recording, discuss the data with the trainees, and answer questions. Trainees can then record detections on their own while receiving assistance from the instructor. At the end of the morning's session, trainees should transcribe a portion of their data with the assistance of the instructor. This is an excellent way to see what data they are missing or recording incorrectly. Again, we suggest that trainees spend some time before the next session observing and recording birds of other species. Estimating height and distance also can be practiced on other birds. Day 3.--All trainees can conduct a complete survey on this day, as the instructor circulates between trainees, helping with comments on accuracy and technique. At the end of the survey, tapes are transcribed, and any questions on data are clarified by the instructor. Trainees should be familiar with the techniques for conducting and recording a murrelet survey by the end of this day. It is helpful for the trainer to record and transcribe a segment of the morning’s activity for comparison to the trainees transcriptions. Day 4.--A simultaneous survey, described below, will be conducted on this day of the training. Evaluation Survey (Field Exam) When training is completed, an evaluating agency or organization should be contacted and arrangements made for an evaluation survey. The evaluation survey can only be conducted by a qualified evaluator. See Qualified Instructors and Evaluators, below, for information on evaluator qualifications. Evaluation is based on the results of a simultaneous survey conducted by the trainees and an evaluator. The number of participants per evaluation will be determined in part by the size of the site. More importantly, the evaluator must be able to watch the participants and their reactions to birds to assess their ability. We recommend that group size be limited to 10 trainees per evaluator whenever possible, with a maximum of 12 trainees per evaluator. Participants should arrive at the site early enough to allow time for instructions and still begin the survey at the appropriate time. During the survey, trainees are positioned approximately 5-8 meters apart. This helps ensure that observers have essentially the same viewing field, such that similar numbers of birds can be detected by all observers, but reduces the likelihood that they will cue in on detections by watching the evaluator or other observers or be distracted by others speaking into their recorders. Watches should be synchronized or a time check recorded on the tape recorders at the beginning of the survey. The evaluator may call out a time check during the survey, at which time all surveyors record the time on their tape. In periods of low activity during the evaluation survey, the evaluator can record calls of other species, recording the same type of information as for a murrelet. These observations can then be checked against the trainees' recorded data to determine whether species are being correctly identified. The evaluator should record at least 10 to 20 observations of other species.
51
At the end of the survey, the data should be transcribed under the direct supervision of the evaluator. After transcription, all of the data sheets are turned into the evaluator, who tallies and evaluates the results for each participant. Evaluation of Survey Results To evaluate the results, we suggest that, for each 10-minute period of the survey, the number of detections of murrelets be tallied according to the following six categories: number heard, number seen, total number of detections, number of detections with occupied behaviors, number detected within 200 meters of the participant, and those detected at greater distances. If birds are both heard and seen, they are tallied once in each of the first two categories. Each surveyor's results for three categories -- number heard, number seen, and number of occupied detections and/or total detections -- are compared with the evaluator’s observations for each 10-minute period and for the entire survey. Two criteria of success are described below, one for sites with many birds, making it likely that some birds would be missed during peak activity, and another for sites with fewer detections. To ensure consistency with previous evaluations, it is best that the tallied data be reviewed again by another experienced person for interpretation and evaluation of the results. For example, in California, one instructor reviews all of the results obtained under each evaluator, and then these decisions are reviewed again by a representative of the California Division of Forestry and California Department of Fish and Game.
Sites with many birds At a site where the evaluator records 35 or more detections, reasonable measures of success for a surveyor are the following: if the participant records at least 60% of the number of observations in two of the three categories, and at least 50% in the remaining category, it can be considered that the participant has sufficient skill to determine the presence of murrelets in a forest stand. These figures are based on our experience in training people and comparing with expert surveyors. In these comparisons, the expert surveyors always detected in excess of 70% of the best observer. Further, we feel that any person detecting more than 60% of the birds in a stand with 35 or more detections would be unlikely to overlook so many birds that a nesting stand would be misclassified as "unoccupied". If a participant records more detections than the evaluator, their results should be reviewed carefully to determine if they counted non-murrelet targets (suggesting that they misidentified murrelets) or double-counted what should have been single detections. There should be some allowance for visual detections, because the evaluator can’t see everything. The number of audio detections should not exceed the evaluator’s total.
Sites with fewer birds If the survey site generally has fewer murrelet detections and the evaluator records less than 35 detections during the simultaneous survey, a different measure of success can be used. A participant should record at least 70% of the number of observations in two of the first three categories, and at least 60% in the remaining category. Activity during an evaluation should consist of a mix of both auditory and visual detections. Evaluation surveys with less than 25 detections during a one-day evaluation, or 18 detections in each of two consecutive days of evaluation, are not acceptable. Detections should include vocalizations and at least 6 visual observations each day.

52
At the discretion of the instructor and evaluator, the criteria listed above may be relaxed for trainees that meet one or more of the following conditions: (1) birds not heard by the trainees are usually in excess of 200 m from the evaluator; (2) occupied behaviors are in excess of 80% of the standard and agree with the evaluator; and (3) missed detections occur during very busy (greater than 10 detections) 10-minute periods when the presence of many birds may make individual detections difficult to define. The results of participants with more detections than the evaluator should be reviewed for misidentifications or double-counting, as stated above. Qualified Instructors and Evaluators Instructors and evaluators should be highly-qualified field ornithologists very familiar with not only murrelets, but also all other bird species (especially their calls and songs) at evaluation sites. Both evaluators and instructors should have a minimum of three years’ survey experience from a variety of survey situations (both high and low detection sites) and in a range of forest stand types. Instructors are responsible for the first three days of the training sessions as outlined above. Instructors should have a demonstrated ability to teach and interpret the survey protocol. As such, an instructor must be knowledgeable in the areas of murrelet ecology, general habitat associations, protocol interpretation, survey design, and regional management and regulatory requirements. Evaluators (who may also be instructors) are responsible for the evaluation survey on day 4 of the training. Evaluators must be knowledgeable in murrelet ecology, protocol interpretation, and have the ability to survey consistently within 10% of other evaluators. Evaluators must be listed on the official evaluator list (see below) in order to be qualified to conduct evaluation surveys. Instructors and evaluators should complete an extensive refamiliarization session annually, and a hearing test should be done at least every other year. The annual session should include a complete review of changes in survey protocol, new information suggesting alternative interpretation of survey data, and an update from local regulatory agency staff. It also should include simultaneous surveys with other instructor/evaluators. Consistent results (within 10%) between the evaluators during simultaneous surveys must be achieved before outside evaluations begin. A potential evaluator should spend at least 5 mornings conducting simultaneous surveys with a qualified and experienced evaluator and obtain the same 10% consistency. Lists of Qualified Surveyors, Instructors and Evaluators A list of current qualified surveyors, instructors and evaluators should be kept by each evaluating organization each year in case it is requested by regulatory agencies (e.g., the U.S. Fish and Wildlife (USFWS) State Office or the State Fish and Wildlife Office) or, in the case of contractors, by the contracting land managers. This list should include the names of participants who passed the evaluation survey and those who passed the more rigorous requirements (see above) to become an evaluator. The list should also include those individuals who are qualified to be an instructor according to the guidelines above. Follow-up Surveys Follow-up surveys should be conducted by crew leaders with the trainees at their assigned survey sites after the initial training and evaluation. These surveys help to identify deficiencies in survey technique which may develop once observers are conducting field work. Two types of follow-up surveys should be conducted: (1) at low-use sites, within 1-2 weeks after successful

53
evaluation; and (2) a mid-season survey at any site with detections, especially for those who have not seen or heard murrelets during the early part of the survey season. Follow-up surveys at low-use sites are important to verify that observers are (1) identifying single murrelets in areas with few observations; and (2) not confusing murrelet calls with the calls of other forest birds in their survey areas. Because most training and evaluation are done at high-use sites, it is imperative that crew leaders verify that observers know how to accurately conduct surveys at low-use sites. It is recommended that these follow-up surveys take place for 1-2 days at sites with an average of 10-20 detections per morning. The crew leader should conduct a simultaneous survey, similar to the initial evaluation, to identify how the observers would benefit from additional instruction. If no low-use sites are available in your area, high-use sites can be used. In this case, the survey period could be split between the periods of peak murrelet activity and the non-peak times. The crew leader could then focus on the non-peak times and compare the numbers and types of observations recorded by the observers. Mid-season training should occur during late June or very early July, and should include 1-2 days of surveys at low- or high-use sites. Crew leaders should review the survey protocols and reevaluate the observers’ survey skills. This also is an important time to answer questions that have developed over the survey season and to revitalize crew morale.
Reference Hunter, J.E., and R. LeValley. 1996. Improving the reliability of marbled murrelet surveys in low abundance areas. Pacific Seabirds 23(1): 3-4.

54
APPENDIX D
HEARING EXAMINATION for MARBLED MURRELET FOREST SURVEYS
Compiled by William Ritchie1 and S. Kim Nelson2 Introduction Given that a larger proportion of Marbled Murrelet detections are audible rather than visual, normal levels of hearing are required of all Marbled Murrelet survey personnel. Surveyors should have their hearing tested by a certified audiologist or physician prior to conducting protocol surveys. These standard tests are available at a reasonable price and offered at any clinic with an audiologist on staff. Most employers will reimburse employees for the cost of testing. Some large firms and agencies employ their own audiologist. In addition to having normal hearing, or corrected hearing that meets the test criteria, a prospective murrelet surveyor must attend a recognized training program and demonstrate a proficiency in their ability to conduct protocol Marbled Murrelet surveys under the guidelines set forth by the Pacific Seabird Group. Individuals also should have normal or corrected vision. Examination Procedure Prior to testing, the patient will be asked to answer questions pertaining to their medical background and exposure to sources of loud noise. Audiologists use specialized equipment calibrated to provide diagnostic pure-tone audiometric testing. An audiometer provides a measure of a person’s ability to hear sounds of different frequencies and intensities. These tests are typically performed in sound-treated examination rooms in order to obtain accurate results. The results of the testing should report the patient’s hearing thresholds at sound frequencies within the normal range of human hearing, between 250 Hz and 8,000 Hz. Upon completion, the audiologist or physician should provide the patient with an audiogram and confirmation of normal hearing ability. An audiogram represents the hearing thresholds in decibels (dB), and can be displayed graphically or as a list of values. It is recommended that a hearing test be conducted prior to hiring individuals for murrelet survey work. Producing the results of an acceptable hearing test should be a condition of hire for everyone expected to conduct protocol murrelet forest surveys. Results of the hearing test must also be reviewed by the training evaluator before a surveyor can qualify as proficient. A person’s hearing should be tested at a minimum of once every two years, or more frequently if they have been exposed to any loud noise. The Occupational Safety and Health Association (OSHA) defines loud noise to be of an intensity >85 dB for >8 hours in duration (e.g., small aircraft flights, chainsaw, gunshots, loud music, etc.). This is roughly equivalent to a situation where a normal level of conversation within three feet begins to become difficult to discern due to the intensity of the noise. When assessing previous exposure to loud noise, one should consider that as noise intensity levels increase, the duration time of exposure before reaching the critical threshold will decrease. OSHA recommends annual testing whenever an individual is exposed to these conditions.
1 Washington Department of Fish and Wildlife, Olympia, WA 98501 2 Oregon Cooperative Wildlife Research Unit, Oregon State University, Department of Fisheries and Wildlife, 104 Nash Hall, Corvallis, OR 97331-3803.

55
Evaluating Test Results A review of the audiogram is necessary to determine if an individual has an acceptable level of hearing to conduct murrelet surveys. Marbled Murrelet vocalizations and sounds associated with flight range between 2,000 Hz and 5,000 Hz. In order for a person to have an acceptable hearing test, they should have good hearing at all frequencies, but especially in this range. The American Medical Association and OSHA define good hearing as 0 to 25 dB in both ears. This means that at all frequencies within the normal range of human hearing, an individual’s hearing thresholds should be 25 dB or less. Individuals with good hearing, or corrected hearing that meets the definition of ‘good’ hearing, are qualified to conduct protocol murrelet forest surveys upon successful completion of an approved survey training program. Marginal hearing is defined as 0 to 25 dB in one ear, and a level not to exceed 60 dB in the other ear. If an individual with marginal hearing can demonstrate proficiency in their ability to detect Marbled Murrelets during the survey evaluation, given their impaired hearing, they can conduct protocol murrelet forest surveys. This determination is made at the discretion of the training evaluator. Evaluators must be assured of the surveyor’s ability to identify murrelet vocalizations at distances greater than 200 meters (600 ft), and their ability to discern correct detection and flight directions. Poor hearing is defined as greater than 25 dB in both ears. Individuals with poor hearing, including those who meet the definition of poor hearing with corrective devices, are not qualified to conduct protocol murrelet forest surveys.
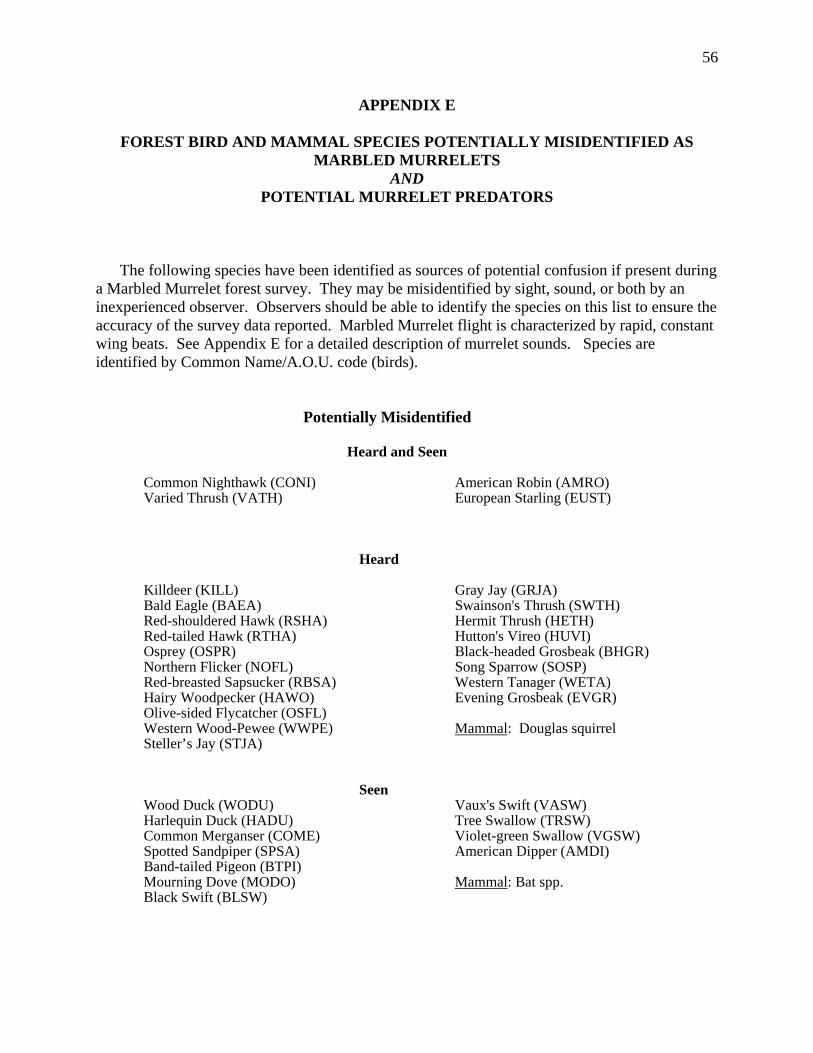
56
APPENDIX E
FOREST BIRD AND MAMMAL SPECIES POTENTIALLY MISIDENTIFIED AS MARBLED MURRELETS
AND POTENTIAL MURRELET PREDATORS
The following species have been identified as sources of potential confusion if present during a Marbled Murrelet forest survey. They may be misidentified by sight, sound, or both by an inexperienced observer. Observers should be able to identify the species on this list to ensure the accuracy of the survey data reported. Marbled Murrelet flight is characterized by rapid, constant wing beats. See Appendix E for a detailed description of murrelet sounds. Species are identified by Common Name/A.O.U. code (birds).
Potentially Misidentified
Heard and Seen Common Nighthawk (CONI) Varied Thrush (VATH)
American Robin (AMRO) European Starling (EUST)
Heard Killdeer (KILL) Bald Eagle (BAEA) Red-shouldered Hawk (RSHA) Red-tailed Hawk (RTHA) Osprey (OSPR) Northern Flicker (NOFL) Red-breasted Sapsucker (RBSA) Hairy Woodpecker (HAWO) Olive-sided Flycatcher (OSFL) Western Wood-Pewee (WWPE) Steller’s Jay (STJA)
Gray Jay (GRJA) Swainson's Thrush (SWTH) Hermit Thrush (HETH) Hutton's Vireo (HUVI) Black-headed Grosbeak (BHGR) Song Sparrow (SOSP) Western Tanager (WETA) Evening Grosbeak (EVGR) Mammal: Douglas squirrel
Seen Wood Duck (WODU) Harlequin Duck (HADU) Common Merganser (COME) Spotted Sandpiper (SPSA) Band-tailed Pigeon (BTPI) Mourning Dove (MODO) Black Swift (BLSW)
Vaux's Swift (VASW) Tree Swallow (TRSW) Violet-green Swallow (VGSW) American Dipper (AMDI) Mammal: Bat spp.

57
Potential Marbled Murrelet Predators
The following is a list of potential predators of adult Marbled Murrelets or their nests (eggs or young). The presence of these predators during the survey should be noted at the bottom of the last page on the Survey Activity Table form.
Bald Eagle (BAEA) Sharp-shinned Hawk (SSHA) Cooper's Hawk (COHA) Northern Goshawk (NOGO) Red-shouldered Hawk (RSHA) Peregrine Falcon (PEFA) Great Horned Owl (GHOW)
Barred Owl (BAOW) Northern Spotted Owl (SPOW) Steller's Jay (STJA) Gray Jay (GRJA) American Crow (AMCR) Northwestern Crow (NWCR) Common Raven (CORA)
Douglas squirrel Red squirrel Deer mouse Keen’s mouse
Northern flying squirrel Townsend’s chipmunk Bushy-tailed woodrat
58
APPENDIX F
MARBLED MURRELET VOCALIZATIONS
Reviewed by William Ritchie1
Familiarity with murrelet vocalizations is essential for anyone planning to conduct a protocol survey. The majority of murrelet detections are auditory (Paton and Ralph 1988, Hamer and Cummins 1990, Nelson 1990), especially at interior forest survey stations with limited visibility. Marbled Murrelet vocalization recordings are currently being collected and analyzed to characterize the different calls. Presently there are four recognized vocalization categories: (1) "Keer" calls, (2) Whistle calls, (3) Groan/grunt calls (formally known as alternate calls), and (4) Fledgling begging calls (Nelson and Peck 1995, Nelson 1997, Dechesne 1998). These categories of vocalizations can include a variety of variable call combinations. To date there have been no identified sexual differences, call functions, or geographic variability in murrelet vocalizations. However, in time we may be able to associate vocalizations with behavior. The most distinctive and commonly heard vocalization is the "Keer" call. The frequency range for this call is 2,000 to 5,000 Hz, with a mean frequency of about 3,500 Hz. There are typically 2 or 3 elements to the "Keer" call, with the initial note of the call reaching a maximum at 5,000 Hz (see sonagrams in Nelson 1997 and Dechesne 1998). "Keer" calls are intermediate in length at about 300-350 milliseconds. This call can be described as a piercing, high pitched "gull-like" call that phonetically sounds like "Keer-Keer". Whistle calls generally consist of a short broadband initial segment followed by a narrow-band mid-frequency note of longer duration than the "Keer", and without the repeating series of calls. This type includes the whistle-like "Kee", single note calls similar to the initial segment of a "Keer" call, and the "soft-que" call, a long plaintive sounding ("eeeh-eeeh") whistle. Groan/grunt (alternate) calls can be heard frequently at inland sites, at sea, or while the adults are present at the nest during feeding visits. These vocalizations are similar to the raspy, nasal-sounding calls given by other alcids at breeding colonies. Many times a groan call is part of a "Keer" call sequence, or given in reply to another vocalizing murrelet. Long series of calls given by the same bird sometimes grade from “Keer” to groans without an abrupt change (Dechesne 1998). Adults bringing fish to the nestling often give a muted grunt call sounding like "rrUH-rrUH". The fledgling food begging call is a continuous series of soft, high-pitched "peep"s, sometimes heard when an adult arrives at or near the nest to feed the chick. In most cases vocalizations at the nest are not audible from the ground. There are two additional auditory detections that may be heard at inland sites. These are not vocalizations, but sounds produced by air passing over the feathers of a murrelet in flight. The first is a jet sound, which can be heard when a murrelet is in a steep descent or when it is ascending following such a dive. This loud, slightly wavering, whooshing sound is a bit like a jet plane rapidly passing overhead. It is rarely heard and often occurs near or above nesting areas. The second, the sound of the murrelet’s wing beat, has a wide frequency range, resulting in a rapidly alternating sound. These sounds have been described as similar to that of a rope being twirled rapidly in the air or a hand saw blade being shaken (Nelson 1997). Though the
1 Washington Department of Fish and Wildlife, Olympia, WA 98501

59
detection of murrelet wing sounds is often associated with below canopy flight, it also originates from murrelets flying above the canopy. If wing-beat sounds are detected during a survey without any visual sighting, additional surveys are necessary to determine if the site is occupied. Once a surveyor learns the basic calls, they should develop their ability to identify similar-sounding vocalizations from other forest birds. This will help identify murrelet calls at sites with background noise and differentiate distant murrelet calls from other similar-sounding calls.
References
Dechesne, S.B.C. 1998. Vocalizations of the Marbled Murrelet (Brachyramphus marmoratus):
vocal repertoire and individuality. M.S. Thesis. University of Victoria, Victoria, BC. Hamer, T.E. and E.B. Cummins. 1990. Forest habitat relationships of Marbled Murrelets in
northwestern Washington. Unpublished report, Wildlife Management Division, Nongame Program, Washington Department of Wildlife, Olympia, WA. 57 pp.
Nelson, S.K. 1990. Distribution of the Marbled Murrelet in western Oregon. Report to the Nongame Program, Oregon Department of Fish and Wildlife, P.O. Box 59, Portland, OR, Publ. No. 89-9-02.
Nelson, S.K. 1997. Marbled Murrelet (Brachyramphus marmoratus). In The Birds of North America, No. 276 (A. Poole and F. Gills, eds.). The Academy of Natural Sciences, Philadelphia, PA, and the American Ornithologists’ Union, Washington, D.C.
Nelson, S.K., and R.W. Peck. 1995. Behavior of Marbled Murrelets at nine nest sites in Oregon. Northwestern Naturalist 76:43-53.
Paton, P.W.C., and C.J. Ralph. 1988. Geographic distribution of the Marbled Murrelet in California at inland sites during the 1988 breeding season. Unpublished report, California Department of Fish and Game, Sacramento. 35 pp.

60
APPENDIX G
DATA FORM1 AND INSTRUCTIONS FOR ITS COMPLETION
Cover Page (page 1)
Item # 1 Page Number of the total number of pages of data for the survey. This includes Cover Page,
Survey Activity Table page(s), and Map page(s). 2 Survey Visit to Protocol: Circle Y (Yes) or N (No) to indicate if the survey was conducted
following the guidelines of the Pacific Seabird Group protocol. Include the initials of the person who is making this statement, often the crew or project leader. To answer this question will involve a review of the survey visit by someone affiliated with the survey effort, who should check the survey form for compliance with the protocol, and possibly speak with the observer. The review is not to be done by the observer. An affirmative response does not necessarily imply that the entire survey effort was acceptable or that regulating or evaluating agencies will find the survey to be valid.
3 Total Detections: Total number of murrelet detections recorded during a survey visit. All
detections should be assigned a detection number (Detect. #), including un-mappable detections. No other species observations should be included in this count.
4 Other Species of Concern: Circle Y (Yes) or N (No) to indicate if other species of concern were
observed; refer to your state or provincial Fish and Wildlife agency Species of Concern list. Record details of observation(s) at the end of the last page of the Survey Activity Table.
5 Month, Day, Year: Date of survey visit. Use 2 digits for Month and Day, and four digits for
Year (e.g., May 10, 2000 = 05/ 10/ 2000). 6 Area Name: Name of survey area being surveyed. 7 Site Name and Number: Site name and number from which survey visit is conducted. Each
survey site should have a unique number or alphanumeric identifier. 8 Station Number: Station number from which survey visit is conducted. Each survey station
should have a unique numeric identifier relative to a survey site. 9 Station Location: Location of station where survey visit was conducted. Several mapping
coordinate systems are in use throughout the range of the murrelet. Township, Range, Section is used in much of WA and OR. UTM is available anywhere, with a GPS unit.
T,R,S - Record township, range, meridian [circle either E (east) or W (west)], section, sixteenth
section ("Q, Q"), of quarter section ("Q"). Use 2 digits for each T,R,S value (e.g., T 09 N, R 06 W, S 10, NW QQ of SE Q).
1 Data forms specific to each state and province should be obtained from the PSG web page at www.pacificseabirdgroup.org.

61
UTM - Enter the UTM zone and coordinates from a USGS or equivalent (for BC) topographic map if the T, R, S system is not used in your area, or if a GPS is used. Indicate the source used to determine the station location (e.g., type of map or GPS). If a GPS is used, indicate whether the coordinates are differentially corrected or what the error value (FOM) was when the position was taken, and what map datum (e.g., NAD 27 CONUS, WGS 84, etc.) the unit was set for.
10 Observer Name(s): First name, middle initial, and last name of the observer(s). 11 Initials: Initials of observers’ full name. 12 Affiliation: Agency, tribe, or company name. 13 Phone: Agency, tribe, or company telephone number including area code. This should be a
contact who can be reached during and after the survey season in the event that questions arise regarding the survey data.
14 Station Elevation: Using a USGS 7.5 minute or 15 minute topographic map, or a properly
calibrated altimeter or GPS, record the station elevation. An equivalent topographic map may be used for BC. Indicate whether the value is in feet or meters.
15 Position on Slope: Select the code that best describes the station's position on slope. Codes: B =
Canyon bottom or coastal plain, L = Lower 1/3, M = Middle 1/3, U = Upper 1/3, R = Ridgetop.
! To determine position on slope, use a topographic map to identify the ridgetop and valley bottom elevation at 90 degrees (perpendicular) from the contour where the station is located. Then subtract the lower value from the higher, and divide by 3 to determine the position based on the station's elevation.
16 Station Placement: Circle whether survey station is located Inside or Outside the survey site.
Stations on the survey site boundary are considered Inside.
! One station may adequately cover an area of approximately 30 acres (12 ha). Station placement in dense forest, with abundant understory and high overhead cover, limit visibility and mask sounds, thereby affecting the observer's ability to see and hear murrelet activity. Topography is also a factor to consider when establishing stations because rugged, steep terrain will affect the observer’s range of detectability. In these situations, station density should be increased as needed to provide adequate survey coverage of the site being surveyed.
17 Distance from Survey Site Boundary: This measurement applies only to Outside stations.
Indicate distance from the survey station to the survey site boundary. Stations are generally located <50 meters (164 feet) from the edge of the survey site boundary.
18 Units of Measure for All Horizontal Distances: Indicate the units used for all horizontal distances reported on the survey form (e.g., meters, feet, yards, etc.). This will include distances to survey site boundary for stations outside of the site and for closest distances to birds. The recorded units must be consistent throughout the survey visit.
19 Station Canopy Cover: Select the canopy cover class code that best describes overhead canopy cover at the survey station. Codes: 1 = 0 -25%, 2 = 26 -50%, 3 = 51 -75%, 4 = 76 -100%. This can be derived as an ocular estimate of the area immediately adjacent (approx. 25 m radius) to the

62
survey station, or an actual measurement using a densiometer or other device. This data can be useful in determining the viewability from a station.
! It’s often easier to estimate openings in the canopy, whether making an ocular estimate or using a densiometer. The inverse value represents the amount of canopy cover. The value recorded must represent canopy cover, so remember to translate openings to cover (%cover = 100% - %opening).
ENVIRONMENTAL CONDITIONS: Record conditions as observed at the survey station at the beginning and end of the survey visit; note other significant changes in conditions as they occur throughout the survey visit.
! Also record any conditions that may impair vertical visibility to 2 canopy heights, horizontal visibility to 100 m (328 ft), and audibility to 200 m (656 ft). If these conditions exist for a cumulative total of greater than 12 minutes during the survey visit, the visit should be rescheduled.
20 Sunrise Time: Official sunrise time derived from The Nautical Almanac tables based on the date
of the survey visit and geographic area. Add 1 hour for daylight-saving time! Use 4-digit "24 Hour Time"( e.g., 5:18 A.M. = 0518, or 6:30 P.M. = 1830). Copies of these tables may be available for your specific geographic area from your regulatory agency or Marbled Murrelet Survey Training Instructor.
e.g., Geographic Area of Survey (WA) Table
King, Island, Snohomish Co. Seattle, WA Skagit, Whatcom Co. Vancouver, BC Kitsap, Mason, Pierce Co. Tacoma, WA eastern Jefferson, eastern Clallam Co. (E of R09) Port Angeles, WA San Juan Co. Friday Harbor, WA western Clallam, western Jefferson Co. Tatoosh Island, WA Grays Harbor, Lewis, Thurston Co. Olympia, WA Pacific, Wahkiakum Co. Astoria, OR Clark, Cowlitz, Skamania Co. Portland, OR Kitattitas, northern Yakima Co. Stampede Pass, WA
21 Source or Table: Indicate the Sunrise/Sunset table or source reference used to determine the
survey times OR enter the appropriate code indicated by bold type above, if applicable.
22 Begin Survey Time: Actual time survey visit is started using "24 Hour Time" described above. A morning visit should begin at least 45 minutes before official sunrise. If a survey visit actually begins later, also note number of minutes late (e.g., "5 min. late").
23 End Survey Time: Actual time survey visit is completed using "24 Hour Time" described above. A morning visit generally ends 75 minute after official sunrise; more time is added depending on whether murrelet detections occur at the end of a visit and/or if overcast conditions with rain and fog are present at the end of the standard survey period.
24 Temperature at Sunrise: Record temperature at official sunrise time. Indicate whether Celsius (C) or Fahrenheit (F). Be sure the thermometer is placed above the ground when taking the temperature.

63
25 Temperature at End of Survey: Record temperature at the end of the survey visit. Indicate whether Celsius (C) or Fahrenheit (F). Be sure the thermometer is placed above the ground out of the sun when taking the temperature.
26 Time: Record times in 4-digit "24 Hour Time". Enter time when survey visit began and ended and indicate "Begin Survey " and "End Survey " in the Notes column. Also enter the time when significant weather or environmental conditions occur that affect murrelet detectability from the station.
27 Vertical Viewing:
a Ceiling: This is the height of the primary cloud/fog layer relative to the canopy of the survey site as viewed from the station. Record the appropriate code: UL = Unlimited (clear); HI = > 2.0 canopy height; MID = > 1.25 to < 2.0 canopy height; LO = < 1.25 canopy height; U = Unknown; cannot see adequately to describe due to station placement.
! There may be several layers of clouds visible simultaneously during a survey visit. For this protocol, the ceiling is the continuous primary cloud layer most closely associated, and in proximity to, the forest canopy. Patchy ground fog may develop as the air temperature warms above water bodies or forests. These types of conditions should be reported as fog in the Precipitation column of the survey form. A very low ceiling, or fog bank, would be reported as a low ceiling and heavy fog.
b Cloud Cover: Select the class code that best describes the amount of overhead cloud
cover visible from the station. This is an ocular estimate. Codes: 0 = 0% (clear sky; no cloud cover); 1 = about 33% of sky covered; 2 = about 66% of sky covered; 3 = 100% of sky covered; U = Unknown; cannot see adequately to describe conditions due to station placement.
c Visibility to 2 Canopy: From the survey station, note whether vertical visibility is unimpaired to 2 canopy heights. Codes: Y = Yes; N = No; U = Unknown; cannot see adequately to describe conditions due to station placement.
! Environmental conditions that impair vertical visibility are moderate to thick fog, or moderate to heavy rain, hail, and snow.
28 Horizontal Visibility to 100 m: From the survey station, note whether horizontal visibility is
unimpaired within 100 m (328 ft). Codes: Y =Yes; N = No; U = Unknown; cannot see adequately to describe conditions due to station placement.
! Environmental conditions that impair horizontal visibility are moderate to thick fog, or moderate to heavy rain, hail, and snow.
29 Audibility to 200 m: From the survey station, note whether audibility is unimpaired within a 200
m (656 ft) radius. Codes: Y = Yes; N = No
! Moderate to loud noise will impair ability to hear murrelet calls at distances less than 200 meters.

64
30 Precipitation: Select the appropriate codes to indicate precipitation intensity at the survey site as observed from the station. List only one code per column. Use the following codes in each of the type columns:
Rain: N = None; L = Light (mist, drizzle, soft rain); M = Moderate (obscuring rain); H = Heavy (intense rain). Fog: N = None; L = Light (translucent haze, thin fog); M = Moderate (obscuring fog); H = Heavy (dense fog). Other: For other precipitation conditions use the following type and intensity codes: N = None; HL = Light Hail, HM = Obscuring hail, HH = Intense hail; SL = Snow flurry, SM = Obscuring snows, SH = Intense snow storms, Blizzard.
31 Wind: Record the wind speed based on the Beaufort Wind Scale. Observe the effects of wind
conditions on trees and vegetation visible at ground level at the station and record the appropriate code (0= <1 mph, calm; 1= 1-3 mph, leaves barely move; 2= 4-7 mph, leaves rustle and small twigs move; 3= 8-12 mph, leaves and small twigs in constant motion; 4= 13-18 mph, small branches move; 5= 19-24 mph, large branches and small trees start to sway; 6= 25-31 mph, large branches in constant motion; 7= 32-38 mph, whole trees move; 8= 39-46 mph, twigs and small branches break).
! Moderate to high winds of Beaufort 4 (13-18 mph) and above generally affect audibility.
32 Noise: Record the appropriate code(s) to indicate noise conditions that affect ability to hear
clearly within a 200 m (656 ft) radius: N = None; A = Airplane; B = Bird song/calls; C = Creek or other water drainage; M = Machinery (logging, mining, road construction, etc.); P = Precipitation (rain/hail); T = Tree drip; V = Vehicle (trucks, cars, etc.); W = Wind; O = Other (explain in Notes column). List more than one if applicable.
33 Notes: Record "Begin Survey" and "End Survey" to correspond to appropriate times recorded. Note any other pertinent information that can help to better describe or explain the conditions during the survey visit.
SHADED AREA AT BOTTOM OF PAGE FOR STATE OR PROVINCIAL FISH AND WILDLIFE AGENCY USE ONLY

65
Survey Activity Data Page
Item # 1 Detections - Page Total: Enter the total number of murrelet detections; every detection should
have a detection number (detect. #), including un-mappable detections. This is the total number of detections per single-sided page.
2 Page Number of the total number of pages. 3 Initials: Initials of observers’ full name. 4 Month, Day, Year: Date of survey visit. Use 2 digits for Month, Day, and four digits for Year
(e.g., May 10, 2000 = 05/ 10/ 2000). 5 Area Name: Name of survey area being surveyed. 6 Site Name or Number: Site name or number from which survey visit is conducted. Each survey
site should have a unique number or alphanumeric identifier. 7 Station Number: Station number from which survey visit is conducted. Each survey station
should have a unique numeric identifier relative to a survey site. 8 Data Reference Number: State or provincial Fish and Wildlife agency use only. Used for
identifying and tracking individual survey visits. 9 Units of Measure: Indicate measurement used for Closest Distance to Bird. Circle either U.S. or
Metric. SURVEY ACTIVITY: Record details of murrelet detections in this table. A detection is defined as the visual or auditory observation of one or more murrelets acting together in a similar manner and initially occurring at the same time.
! A "5 Second Rule" is applied to distinguish between separate detections. It may be helpful to count "1 one thousand, 2 one thousand, etc."
# If a murrelet detection is auditory, 5 seconds of silence must pass in order to classify the next auditory sound as a new detection. # If a visual detection of a murrelet is lost from view for more than 5 seconds, the next sighting is a new detection.
! If two or more groups of murrelets coalesce into one larger group, record data on a separate line for each group and write, e.g., "detect. # 10 and detect. # 11 joined", in the Notes column. Assign each detection its own unique detection number. Refer to the definition of a detection above.
! If one group of murrelets split into two or more separate groups of birds, each new subgroup is still considered part of the original detection, but each is recorded on a separate line as follows. Prioritize the subgroup with the lowest canopy height first. If all subgroups are at the same canopy height, then prioritize circling behavior over non circling. Write, e.g., "detect. # 5 split", in the Notes column to link birds associated with the same detection. Assign a detection number only to the highest priority subgroup, since all the birds were initially part of the same group, and thus only constitute one detection. Each subgroup will have the same Time, and Initial

66
Detection and Flight Directions, but likely will have differing Heights, Closest Distances, and Depart and Final Directions. Thus each subgroup will need a separate line to record all the relevant data.
10 Status and I/O: State or provincial Fish and Wildlife agency use only. Used for detection status
coding and identifying bird location relative to survey site boundary. 11 Detection #: Each separate murrelet detection is sequentially numbered one per line as it
occurred throughout the survey visit. When mapping the detections, use the detection numbers to cross reference the corresponding line entry. Number only the prioritized subgroup if a group of birds split, because the whole occurrence is considered one detection. Line out the Detect. # column for all associated subgroups. See the Survey Activity section above.
12 Detection Time: Record the time in 4-digit "24 Hour Time" when a murrelet detection occurred.
Be sure to record time when survey visit began and ended, and indicate "Begin Survey" and "Ended Survey" in the Notes column on the corresponding lines.
! U (unknown) is entered if detection time was not recorded.
13 Initial Detection Direction: Record the direction where the murrelet is first detected relative to
the observer. The direction is recorded at a minimum of 45 degree increments (e.g., N = North; SW = Southwest; E = East).
! U (unknown) is entered if initial detection direction was not identified. Without this information, the detection cannot be mapped. ! If a bird is seen landing, perching, or flying into or out of a tree or stand of trees, a stationary detection is heard, or an area of concentrated activity is detected, try to obtain an azimuth compass bearing for that location (e.g., "145" = 145 degrees).
14 Type: Record the detection type using the following codes: H = Heard only (auditory sound(s)
with no visual observation); S = Seen only (visual observation with no auditory sounds); B = Both Seen and Heard (visual observation with accompanying auditory sounds).
15 Auditory Information: Call types have been assembled into call groups based on their sounds.
Review cassette tapes of Marbled Murrelet vocalizations and other auditory sounds to assist with identification. Tapes of other forest bird calls/songs that may have similar sounding notes should also be reviewed periodically.
Vocal Series (vocalizations): Record auditory sounds using the codes listed below. Record the call type heard at the start and end of the detection. The detection may consist of one call type, or a vocal series that grades between two groups. Should the calls grade between two groups, identify the start and end points of the gradient, e.g., “K-G”. “K” = Keer group (keers, keheers, and quacks); “G” = Groan group (longer, variable groans formerly known as alternate calls); and the “O” = Whistle group (longer, variable whistle). Birds most often grade their calls between two of these groups within a series or bout of calling.

67
Record the number of calls heard from 1-5. When more than 5 calls are heard in the same detection, record “M” for multiple. Indicate Yes or No to record if overlapping calls (OL) are heard as part of the detection.
Other (non vocal sounds): In addition to the vocal sounds described above, there are two other auditory sounds attributed to marbled murrelets. These non vocal sounds are Wing sounds or wingbeats = “W” and Jet sounds associated with aerial or power dives = “J”. Record all types heard for each detection.
! A solid line ("---") for "not applicable" is entered in columns that do not apply. Seen only detections are obviously not auditory, i.e., a visual detection with no vocalization or other auditory sounds.
16 # of Birds Seen: Enter the number of birds visually observed.
! If 2 or more groups of murrelets join into 1 group, record data on a separate line for each group and write, e.g., "Detect. #X and Detect. #X1 joined", in the Notes column. Assign each detection its own unique detection number. ! If one group splits into a separate group of birds, then each subgroup is part of the original detection, and each is recorded on a separate line observing the prioritization procedures outlined above under the SURVEY ACTIVITY heading. Each subgroup will have the same Time and Initial Detection Direction. Assign a detection number only to the prioritized subgroup. ! A solid line ("---") for "not applicable" is entered for heard only detections.
17 Behavior: Record the behavior type of the bird(s) according to the following codes:
C = Bird(s) seen circling over the forest at > 1.0 canopy height. This behavior includes flight paths that deviate from a straight line, such as full, quarter, and half circles, angular turns, etc. B = Bird(s) seen circling at or below the forest canopy, i.e., < 1.0 canopy height. This behavior includes flight paths that deviate from a straight line, such as full, quarter and half circles, angular turns, etc. F = Bird(s) seen flying in a straight flight path over the forest at > 1.0 canopy height. T = Bird(s) seen flying through in a straight flight path at or below the forest canopy, i.e., < 1.0 canopy height. L = Bird(s) seen landing in, perching, or departing from a tree. This is a rare event. S = Bird(s) heard emitting > 3 calls from a fixed point in a tree within 100 m (328 ft) of observer. This is a very rare and unusual event. U = Bird(s) behavior unknown, i.e., bird(s) seen but behavior not identified, or canopy height not quantified, or detection was heard only and was not stationary.
18 Initial Flight Direction: This is the direction that the murrelets are seen heading when initially detected, i.e., the direction the birds are traveling when first detected. This information allows
68
for accurate mapping of visual detections, and compliments the Bird Depart Direction data. Enter direction in a minimum of 45 degree increments (e.g., N = North; SW = Southwest, etc.).
! U (unknown) is entered for any auditory detections because flight directions are often difficult to correctly identify.
19 Bird Height: This is determined from visual observations only. Enter an estimate of bird height
in decimal units based on bird location relative to the height of the forest canopy, i.e., the tallest trees observable from the survey station. The height of the tallest observable tree is equivalent to a unit of 1.0 canopy height. If a bird was seen flying halfway beneath the height of the tallest observable tree, the bird height is "0.5 canopy heights." A bird seen flying over the canopy at one quarter the height of the tallest tree observed is at "1.25 canopy heights."
! If a detection is seen "at or below" canopy height, but an actual height was not determined, enter < 1.0 canopy heights in the Notes column. ! If a bird is only seen flying straight or circling over a clear-cut or water adjacent to the survey site, project the height of the tallest tree observable to determine the bird's height. Indicate in Notes if bird only seen over these substrates. ! U (unknown) is entered if the bird(s) were seen but the height was not quantified. ! A solid line ("---") for "not applicable" is entered for heard only detections.
20 Closest Distance to Bird(s) Seen: Record the closest horizontal distance from observer to the
murrelet(s). A bird flying directly overhead is equivalent to a horizontal distance of zero. Distances are recorded only for visual detections. Most visual detections are within 100 meters (328 feet). Indicate units of measurement at top of the column.
! For heard only detections, a solid line "----" is entered in the Closest Distance to Bird(s) Seen column, and an estimated distance, based on the intensity of the sound, is recorded in the Notes column using the following codes: L = Loud; M = Moderately loud; F = Faint/distant. ! Unless the observer has information to the contrary, for the purpose of mapping, "loud" detections will be mapped at 75 m (246 ft) from the observer; "moderately loud" detections will be mapped at 150 m (492 ft) from the observer; and "faint" detections will be mapped at 200 m (656 ft). Most detections are audible only within 200 m (656 ft). The observer should provide, in the Notes column, any additional information that helps interpret distance. E.g., a faint call directly overhead should not be mapped at 200 m. ! U (unknown) is entered if the distance is seen but not quantified.
21 Bird Depart Direction: The direction the murrelet was last detected heading, i.e., the direction
the bird(s) was traveling when last detected. Enter direction in a minimum of 45 degree increments (e.g., N = North; SW = Southwest, etc.).
! U (unknown) is entered for any auditory detections because flight directions are often difficult to correctly identify.
22 Final Detection Direction: The final direction the murrelet was detected relative to the observer.
The direction is recorded at a minimum of 45 degree increments (e.g., S = South; NE =

69
Northeast; W = West).
! U (unknown) is entered if the final direction is not identified. 23 Notes: Additional information which can help to concisely describe and map a detection is
entered here. For example: groups of birds that split or join other birds; unusual observed behavior; flight path directional information ("circled clockwise" or "counter clockwise").
$ At the bottom of the last page of the survey activity table, note the presence of all ravens, crows, and
jay species. Also document any other species of concern that were observed by including the species name, number, detection time, behavior, and additional pertinent information. Refer to your state or provincial Fish and Wildlife agency Species of Concern list.
DRAFT – NOT FOR CITATION 70
MAPPING MURRELET DETECTIONS
To each survey form, attach a copy of a registered aerial photo, orthophoto (1:12,000), or a USGS or equivalent (for BC) topographic map showing the area/site surveyed. Be certain to indicate the corrected scale if the original scale was enlarged or reduced on a photocopier. Delineate the area/site boundary and identify the observer station location using a circle with a dot in the center (u), and. If plotting detections on aerial or orthophoto maps, use a topographic map to aid in determining the correct location to plot the detections with respect to the terrain. Plot the murrelet detections using the directional information, Behavior, and Closest Distance to Bird(s) data from the Survey Activity Table. Indicate the murrelet flight path and behavior (circling, straight flight path, stationary, etc.) relative to the station location using the symbols below. On 1:12,000 scale orthophoto maps, 1 mm = 12 m (39 ft); on 7.5 minute topographic maps the scale is 1:24,000, so 1 mm = 24 m (79 ft). Audible detection: A dashed line with arrow head (– – – – ! ) indicates an audibly tracked flight path. Visual detection: A solid line with arrow head (––––! ) indicates a visually observed flight path. Stationary or Unknown Bird Depart/Final Direction: A triangle with a dot in the center ( ª ) indicates a stationary detection, or a visual or audible detection without a Bird Depart or Final Direction.
! In the upper right-hand corner of each map page write the: (1) Page # of Total Page #; (2) the TRS
or UTM coordinates; (3) survey site name; (4) station number; (5) observer’s initials; and (6) date of the visit.
! Label each separate mapped detection with the corresponding Detection # from the first column on
the Survey Activity page. At high activity areas, more than one map may be necessary. Indicate the Page # of Total Page # on each map.
! If you have multiple detections with the same behavior type in the same location, record all
applicable detection numbers in sequential order at that location. Use additional maps as needed to record all detections. Detections without an Initial Detection Direction may be un-mappable. All occupied behaviors may be mapped together and other detections separately if desired.
! Under good environmental conditions, the following distance conventions can be generally applied
to "heard only " detections: Loud, "close" vocalizations/auditory sounds are usually detectable within 0 to 150 meters (500 feet); "medium range" distinguishable calls/sounds are usually >150 to 200 meters (>500 feet to 660 feet); "distant/faint"calls/sounds usually range from >200 to 400 meters+ (>660 feet to 1300 feet+). Most audible detections are within 200 meters.
! A mylar page may be overlaid on a map to plot detections. A permanent (non-water based), extra
fine tip, black marker should be used. An ordinary pencil eraser can be used to make corrections. Indicate all 4 section corners so the map can be "registered" in the correct location because data points may be digitized into a GIS database. Draw the survey site boundary on the mylar, or attach a copy of the orthophoto with the survey site boundary delineated on it. Indicate the station location and flight path using the symbols above.
DRAFT – NOT FOR CITATION 71
APPENDIX H
USE OF RADAR FOR MARBLED MURRELET SURVEYS
Compiled by Brian A. Cooper1 and Tom E. Hamer2 Introduction The current ground-based Inland Forest Survey Protocol for Marbled Murrelets depends on the use of audio-visual cues to detect birds in flight. Collecting biological information on murrelets this way is difficult, because of the low light conditions during their dawn and dusk peaks in inland activity and their small size, cryptic coloration, and rapid flight speed (Hamer et al. 1995). Further, because ~85% of murrelet detections are auditory (Paton et al. 1990), it is difficult to determine with accuracy the number of birds that actually are flying over a particular area. Ornithological radar, which does not have this auditory bias, has been used successfully to study Marbled Murrelets in both the Pacific Northwest and Alaska (Hamer et al. 1995; Burger 1997, 2001, 2002; Cooper et al. 2001; Cooper and Blaha 2002; Raphael et al. 2002). Radar techniques also have been used to study other avian species for nearly five decades (Eastwood 1967), and marine radar recently has been used to study other nocturnally-active seabirds (Day and Cooper 1995, Cooper and Day 1998, Bertram et al. 1999). The intent of this appendix is to provide information on the uses and limitations of ornithological radar for Marbled Murrelet surveys. This document is not meant to be an exhaustive discussion or set of survey protocol guidelines, but rather a starting point to inform others of its potential uses. If one does wish to apply this technique, it first will be necessary to get approval of your study plans from the appropriate state and federal agencies. Uses of Radar for Marbled Murrelet Surveys and Research The major uses of radar for murrelet surveys and research include: (1) determining if murrelets are present in an area; (2) locating “hotspots” of activity over an area; (3) providing an index of abundance for a drainage or a stand; (4) determining daily activity patterns of murrelets; and (5) for population monitoring. Radar studies indicate that audio-visual observers detect an average of 10–23% of all Marbled Murrelets within 200 m during intensive murrelet surveys, although the percent detected varied widely among sites and among days within a station (Cooper and Blaha 2002). Further, approximately 14% of the murrelets that are detected on intensive surveys are birds passing over the stand of interest on their way to another area. Although radar will not work at all stands because certain terrain types preclude its use, results of Hamer et al. (1995) and Cooper and Blaha (2002) suggest that radar could be used as a 'coarse filter' to quickly and accurately determine whether murrelets are present near, or in the area adjacent to, a forest stand. Cooper and Blaha (2002) found that the number of days to detect murrelets using radar methods was low (Mean = 1.0 day to detect presence). Because most birds during ground surveys are detected by auditory means, only limited information can be collected on bird flight behavior, flight direction, and flight path, and no information can be collected on relative abundance. Further, the distance of birds from the audio-visual observer is estimated. Radar can supply information on the murrelets' flight path
1 ABR, Inc. Environmental Research and Services, P.O. Box 249, Forest Grove, OR, 97116 2 Hamer Environmental, 19997 Hwy. 9, Mount Vernon, WA, 98274

DRAFT – NOT FOR CITATION 72
and flight behavior, flight direction of targets to the nearest degree, number of targets, and the distance from the radar to the target to the nearest meter (Hamer et al. 1995). All of this information is critical in determining where birds are headed, which forest stands are likely being used, and the relative abundance of birds in the area. Thus, the quality and usefulness of the survey information collected by radar is much higher than data produced by the ground survey protocol. Radar also might improve survey efficiency because it reliably samples a much larger area (up to a 1400 m radius) than audio-visual observers (up to 200 m radius). The available data suggest that radar has great potential for quickly determining presence and probable absence of murrelets in a suitable area, but we cannot yet recommend the number of visits or years that would be required to determine presence or probable absence with statistical certainty. If birds were found, however, audio-visual surveys still would be necessary to determine if the stand was 'occupied' by nesting murrelets. Because radar energy cannot penetrate forest vegetation, it generally cannot be used to determine whether a stand is occupied by murrelets. Forest vegetation, hills, and ridges show up as ground clutter or solid echoes on the radar screen, preventing detection of birds in these areas. Given suitable survey locations, however, radar can reliably determine presence in a shorter period than the current audio-visual protocol (Cooper and Blaha 2002). Information from radar surveys also can be used to locate 'hotspots' over a larger stand in which to focus audio-visual observations. Further, the radar method could improve the accuracy of the protocol by detecting presence of birds at low-use sites where murrelets might be missed completely by audio-visual observers. Survey accuracy also can be improved because radar often can help determine whether murrelets that are flying over the survey area actually are in transit to another area. In addition to surveying Marbled Murrelets at the stand level, ornithological radar can be used to obtain an index of abundance for Marbled Murrelets on a drainage scale (Burger 1997, 2001; Cooper et al. 2001; Raphael et al. 2002). Conservation biologists can use this type of landscape information to compare numbers of murrelets with landscape-level habitat characteristics or prioritize lands for potential habitat acquisition efforts. Careful selection of sampling locations in appropriate drainages and adequate sampling intensity during the breeding season is essential for this type of application, to ensure that a large proportion of the birds using a particular drainage are detected. Because radar-based counts have low among-day variability, radar sampling also may be well suited for long-term population monitoring. Statistical power analyses suggest that radar-based sampling can produce results in a timely fashion (Cooper et al. 2001). Limitations of Radar The major limitations of the radar technique are: (1) it cannot determine occupancy (and sometimes presence) because birds flying near or within the canopy are shielded from the radar and missed; (2) it cannot be used at all sites because of topographic and physiographic constraints; (3) species identification errors are possible; and (4) X-band radar cannot be used during rain (but can be used during drizzle or foggy conditions). Fortunately, there are methods that will minimize the impact of many of these limitations. Perhaps the greatest limitation of radar is that it cannot be used at all locations. For instance, radar cannot be used in areas closely surrounded by tall trees that block the radar beam. Use of a lift-equipped radar can help minimize this problem. With a 10.5-m lift-equipped radar, it was possible to use radar at 56% of 50 randomly chosen murrelet stands in an area of the Olympic Peninsula, Washington, with an

DRAFT – NOT FOR CITATION 73
extensive road network and large numbers of manmade openings (Cooper and Blaha 2002). Radar observations would only have been possible at 15% of these sites without the lift. In most cases, radar needs road access to transport the system to the site, although radar systems have been transported by helicopter or boat to some rugged coastal sites in British Columbia, where the radar unit was placed on a platform near the beach for monitoring at watershed mouths (Burger 1997, 2001). In addition, a boat-mounted radar has been successfully used to observed murrelets at coastal areas in Alaska and British Columbia (Cooper 1993, Cullen 2002). In general, areas with good access and relatively flat topography, with large numbers of openings in the forest, tend to be the best areas for radar sampling of murrelets at forest stands. At watershed mouths where the radar scans over a lake or sea, narrow inlets that constrict the flight paths of murrelets provide the most reliable counts. Thus, some topographic situations are not conducive to use of radar. Whenever energy is reflected from the ground, surrounding vegetation, or other objects around the radar unit, a ground-clutter echo appears on the display screen. Because ground clutter can obscure bird targets, it should be minimized by tilting the forward edge of the antenna upwards and/or by using a ground-clutter reduction screen (described in Cooper et al. 1991). The antennae of the radar also can be hinged so that it can be raised or lowered at will to reduce ground clutter (Singer and Hamer 1999). Ground clutter also can be reduced by positioning radar in locations that are surrounded closely by trees, low hills, or even large logs. These objects act as radar fences that shield the radar from low-lying objects farther away from the lab. Using radar fences, only a small amount of ground clutter appears in the center of the display screen, creating ideal conditions for detecting avian targets. For further discussion of radar fences, see Eastwood (1967), Williams et al. (1972), and Skolnik (1980). Radar works as line-of-sight, such that birds flying in 'radar shadows' (ground clutter) behind trees or hills will not be detected. The impact of 'shadow zones' can be reduced by selecting sites that minimize the size, location, and orientation of shadow zones. Another limitation of radar is that one does not know exactly how many murrelets are associated with a particular radar target. One or more birds that are flying close together on the same flight path can appear as one echo on the radar monitor. Observing the radar images closely for several scans can often resolve the minimum number of birds involved, or one can apply a correction factor to the total number of targets by using the average flock size of targets observed visually. It is possible that Marbled Murrelets observed entering one watershed could nest in an adjacent watershed (Rodway et al. 1993, Burger 2002). For some types of studies, this bias would not be a concern, but for studies that require an index of abundance for a particular drainage, it may be necessary to monitor both drainages. To determine whether Marbled Murrelets were flying between drainages, it might be possible to conduct telemetry studies, or radar surveys on ridges or passes between drainages (Singer and Hamer 1999). Murrelets primarily are identified by their flight speed, which tends to be greater than most other species. There are individual sites, however, that have large numbers of problematic species, like Band-tailed Pigeons or waterfowl, that can fly at speeds similar to those of murrelets. We stress that concurrent audio-visual observations (at the radar lab) and radar observations be made, at least initially at each site (and preferably each day), to assess the relative abundance of potentially confounding species and to help filter out non-murrelets from the radar database (Hamer et al. 1995, Cooper et al. 2001, Burger 2001). For radar studies with the objective of determining presence or probable absence, even one error in identification can

DRAFT – NOT FOR CITATION 74
be critical, so it may be necessary to always make concurrent audio-visual and radar observations in those instances. Data Collection Radar observations should be made only by trained observers, skilled in use of radar, interpretation of radar signals, and in locating appropriate sampling sites. The location of appropriate sampling sites requires the most expertise and is most important. If a poor sampling location is chosen, it will decrease the chances of detecting murrelets at that site. Each radar site should be analyzed for its ability to detect murrelets within the drainage. This can be accomplished by making a map of the radar screen with location of ground clutter, shadow zones, streams, and stand boundaries (if applicable). The amount and location of effective sampling area can then be quantified. Preparation of this map involves photographing or tracing the radar screen at a site and adding layers delineating ground clutter and shadow zones where low-flying birds would not be detected. The shadow zones are drawn based on a visual assessment of all clutter-free zones on the screen. Mapping exercises should be completed for each site so that data collected from these sites can be properly interpreted and assessed at a later date. Recommendations If radar-based sampling is to be used for survey, inventory, or monitoring purposes, we make the following recommendations, based on the results of several radar studies to date (Hamer et al. 1995; Burger 1997, 2001, 2002; Cooper et al. 2001; Cooper and Blaha 2002; Raphael et al. 2002):
• conduct concurrent radar and visual observations to check for the presence of species other than Marbled Murrelets, at least initially when commencing radar studies at a new site;
• record species likely to be confused with murrelets that are observed at the site during non-survey times;
• begin sampling during the period from 75 min (for California) or 105 min (for Oregon, Washington, and British Columbia) before official sunrise to 75 min after sunrise (or 15 min after the last audio-visual detection of a Marbled Murrelet, whichever is later) and then determine the most appropriate period to sample (e.g., it may be possible to start sampling later at sites that are farther inland);
• use a combination of flight speed (>50-64 km/hr [>31-40 mi/hr], depending on location), flight behavior (usually fairly direct flight unless circling over a forest stand), and flight path (e.g., from sea to land) to separate targets of Marbled Murrelets from other birds or bats flying within radar range;
• only sample when average wind speeds are <25 km/hr (15 mi/hr), so that slowly flying birds with tailwinds would not be counted as murrelet targets.
For inventory and monitoring purposes, one also should:
• examine landward counts, seaward counts, and total counts to determine which subset of data has the lowest among-day variation in counts and also has an acceptable species identification error rate, and use that subset for the index of abundance;
DRAFT – NOT FOR CITATION 75
• examine your data for evidence of a second peak of landward movements after sunrise during the chick-feeding season that might result from adults making a second feeding trip. These data should be eliminated if counts are to be used for inventory purposes.
• conduct surveys during the same time period each year to minimize seasonal variability in radar counts of murrelets.
For inventory purposes, sample at locations that funnel birds into a small, discrete area or plan on deploying more than one radar so that the entire width of a watershed is sampled. The use of radar is slightly less restrictive for monitoring purposes than it is for inventory purposes, because population monitoring measures temporal trends of consistently-collected data and, thus, it is possible to use sites where one does not sample an entire drainage. Radar Equipment All of the radar surveys of Marbled Murrelets to date have used an X-band marine radar system. We recommend using a 10–12 kW radar system with a magnetron in good working order. Over time, the magnetron wears out, which makes the unit less sensitive and thus less useful for detecting murrelets. Full descriptions of mobile radar systems can be found in Gauthreaux (1985a, 1985b) and Cooper et al. (1991).
References
Bertram, D.F., L. Cowen, and A.E. Burger. 1999. Use of radar for monitoring colonial burrow-
nesting seabirds. Journal of Field Ornithology 70:145–157. Burger, A.E. 1997. Behavior and numbers of Marbled Murrelets measured with radar. Journal of
Field Ornithology 68:208-223. Burger, A.E. 2001. Using radar to estimate populations and assess habitat associations of
marbled murrelets. Journal of Wildlife Management 65(4):696–715. Burger, A.E. 2002. Radar inventory and watershed-level habitat associations of Marbled
Murrelets in Clayoquot Sound, 1996-1998. Pp. 35-56 in Burger, A.E., and T.A. Chatwin, eds. Multi-scale studies of populations, distribution and habitat associations of Marbled Murrelets in Clayoquot Sound, British Columbia. Ministry of Water, Land and Air Protection, Victoria, BC.
Cooper, B.A. 1993. Feasibility of using boat-based marine radar to study Marbled Murrelets in Kenai Fjords National Park, Alaska, 1993. Unpublished report prepared for U.S. Fish and Wildlife Service, Anchorage, AK, by Alaska Biological Research, Inc., Fairbanks, AK. 19 pp.
Cooper, B.A., and R.J. Blaha. 2002. Comparisons of radar and audio-visual counts of Marbled Murrelets during inland forest surveys. Wildlife Society Bulletin 30(4):xx-xxx.
Cooper, B.A., and R.H. Day. 1998. Summer behavior and mortality of Dark-rumped Petrels and Newell's Shearwaters at power lines on Kauai. Colonial Waterbirds 21:11-19.
Cooper, B.A., R.H. Day, R.J. Ritchie, and C.L. Cranor. 1991. An improved marine radar system for studies of bird migration. Journal of Field Ornithology 62:367-377.

DRAFT – NOT FOR CITATION
76
Cooper, B.A., M.G. Raphael, and D. Evans Mack. 2001. Radar-based monitoring of Marbled Murrelets. Condor 103:219-229.
Cullen, S.A. 2002. Using radar to monitor populations and assess habitat associations of Marbled Murrelets within the Sunshine Coast Forest District. Unpublished report, Ministry of Water, Land and Air Protection, Surrey, BC.
Day, R.H., and B.A. Cooper. 1995. Patterns of movement of Dark-rumped Petrels and Newell's Shearwaters on Kauai. Condor 97:1011-1027.
Eastwood, E. 1967. Radar ornithology. Methuen and Co., Ltd., London, United Kingdom. 278 pp.
Gauthreaux, S.A., Jr. 1985a. Radar, electro-optical, and visual methods of studying bird flight near transmission lines. Unpublished final report prepared for Electric Power Research Institute, Palo Alto, CA, by Clemson University, Clemson, SC. 76 pp.
Gauthreaux, S.A., Jr. 1985b. An avian mobile research laboratory: hawk migration studies. Pp. 339-346 in M. Harwood, ed. Proceedings of Hawk Migration Conference IV. Hawk Migration Association of North America, Washington, CT.
Hamer, T.E., B.A. Cooper, and C.J. Ralph. 1995. Use of radar to study the movements of Marbled Murrelets at inland sites. Northwestern Naturalist 76:73-78.
Paton, P.W.C., C.J. Ralph, H.R. Carter, and S.K. Nelson. 1990. Surveying marbled murrelets at inland forested sites: a guide. USDA Forest Service General Technical Report PSW-120. 9 pp.
Raphael, M.G., D. Evans Mack, and B.A. Cooper. 2002. Landscape-scale relationships between abundance of Marbled Murrelets and distribution of nesting habitat. Condor 104:331-342.
Rodway, M.S., H.M. Regehr, and J.L Savard. 1993. Activity levels of Marbled Murrelets in different inland habitats in the Queen Charlotte Islands, British Columbia. Canadian Journal of Zoology 71:977-984.
Singer, S.W., and T.E. Hamer. 1999. Use of radar to monitor Marbled Murrelets in the Santa Cruz mountains, California. Abstract. Pacific Seabirds 26(1):45.
Skolnik, M.I. 1980. Introduction to radar systems. McGraw-Hill, New York, NY. 581 pp. Williams, T.C., J. Settel, P. O'Mahoney, and J.M. Williams. 1972. An ornithological radar.
American Birds 26:555-557.