2004 comprehensive annual financial report
TRANSCRIPT

WISCONSIN COMPREHENSIVE ANNUAL
FINANCIAL REPORT
For the fiscal year ended June 30, 2004
STATE OF
WISCONSINCOMPREHENSIVE ANNUAL
FINANCIAL REPORT
For the fiscal year ended June 30, 2004
Jim Doyle, Governor
Department of AdministrationMarc J. Marotta, Secretary
William J. Raftery, State Controller
Prepared by the State Controller’s Office
This document is available on the Department of Administration homepageon the World Wide Web: http://www.doa.state.wi.us/debf
DOA-6082P (R12/04)
State of WisconsinComprehensive Annual Financial Report For the Fiscal Year Ended June 30, 2004
Table of ContentsPage
INTRODUCTORY SECTIONLetter of Transmittal ……………………………………………………………………………………………………………………………… 2GFOA Certificate of Achievement ……………………………………………………………………………………………………………… 11Organizational Chart ……………………………………………………………………………………………………………………………… 12Principal State Officials …………………………………………………………………………………………………………………………… 13
FINANCIAL SECTIONAuditor's Report .................................................................................................................................................................................. 16Management's Discussion and Analysis ……………………………………………………………………………………………………… 19Basic Financial Statements:
Government-wide Financial Statements: Statement of Net Assets ………………………………………………………………………………………………………………… 37Statement of Activities …………………………………………………………………………………………………………………… 38
Fund Financial Statements: Governmental Funds
Balance Sheet ………………………………………………………………………………………………………………………… 40Statement of Revenues, Expenditures, and Changes in Fund Balances ……………………………………………………… 42
Proprietary Funds: Balance Sheet ………………………………………………………………………………………………………………………… 44Statement of Revenues, Expenses, and Changes in Fund Equity …………………………………………………………… 46Statement of Cash Flows …………………………………………………………………………………………………………… 48
Fiduciary Funds: Statement of Fiduciary Net Assets ………………………………………………………………………………………………… 52Statement of Changes in Fiduciary Net Assets …………………………………………………………………………………… 53
Notes to the Financial Statements Index ……………………………………………………………………………………………… 54Notes to the Financial Statements ……………………………………………………………………………………………………… 56
Required Supplementary Information: Infrastructure Assets Reported Using the Modified Approach …………………………………………………………………………… 138Budgetary Comparison Schedule - General Fund ………………………………………………………………………………………… 140Budgetary Comparison Schedule - Transportation Fund ………………………………………………………………………………… 141Notes to Required Supplementary Information - Budgetary Information ……………………………………………………………… 143
Supplementary Information: Nonmajor Governmental Funds:
Combining Balance Sheet ...................................................................................................................................................... 150Combining Statement of Revenues, Expenditures, and Changes in Fund Balances ............................................................. 158Budgetary Comparison Schedule Nonmajor Budgeted Governmental Funds …………………………………......................... 166
Nonmajor Enterprise Funds: Combining Balance Sheet ...................................................................................................................................................... 176Combining Statement of Revenues, Expenses, and Changes in Fund Equity ....................................................................... 180Combining Statement of Cash Flows ...................................................................................................................................... 184
Internal Service Funds: Combining Balance Sheet ...................................................................................................................................................... 194Combining Statement of Revenues, Expenses, and Changes in Fund Equity ....................................................................... 196Combining Statement of Cash Flows ...................................................................................................................................... 198
Fiduciary Funds: Combining Statement of Fiduciary Net Assets - Pension and Other Employee Benefit Trust Funds ..................................... 206Combining Statement of Changes in Fiduciary Net Assets - Pension and Other Employee Benefit Trust Funds …………… 208Combining Statement of Fiduciary Net Assets - Investment Trust Funds .............................................................................. 210Combining Statement of Changes in Fiduciary Net Assets - Investment Trust Funds ........................................................... 211Combining Statement of Fiduciary Net Assets - Private-Purpose Trust Funds ...................................................................... 212Combining Statement of Changes in Fiduciary Net Assets - Private-Purpose Trust Funds ................................................... 213Combining Statement of Fiduciary Net Assets - Agency Funds ............................................................................................. 214Combining Statement of Changes in Assets and Liabilities - Agency Funds ......................................................................... 215
ii
Comprehensive Annual Financial Report For the Fiscal Year Ended June 30, 2004
PageSTATISTICAL SECTION:
Revenues by Source and Expenditures by Function - All Governmental Fund Types .......................................................................... 218Assessed and Equalized Value of Taxable Property ............................................................................................................................ 220State Forestation Tax ............................................................................................…………………………………………………………… 220Legal Debt Margin............................................................................................................................................................................…… 221Ratio of Net General Obligation Bonded Debt and Notes to Assessed Value and Net General Obligation Bonded Debt and Notes Per Capita ................................……................................................................................................................................ 222Ratio of Annual Debt Service for General Bonded Debt to Total Governmental Expenditures ............................................................. 222Department of Transportation Revenue Bond Coverage ...................................................................................................................... 223Wisconsin Housing and Economic Development Authority Revenue Bonds - Home Ownership Revenue Bonds ............................. 224Wisconsin Housing and Economic Development Authority Revenue Bonds - Housing Revenue Bonds ............................................ 224Wisconsin Housing and Economic Development Authority Revenue Bonds - Housing Rehabilitation and Home
Improvement Revenue Bonds ......................................................................................................................................................... 225Wisconsin Housing and Economic Development Authority Revenue Bonds - Business Development Revenue Bonds .................... 225Wisconsin Housing and Economic Development Authority Revenue Bonds - Single Family Drawdown Revenue Bonds ……………… 226Environmental Improvement Fund Bonds ………………………………………………………………………………………………………… 226Petroleum Inspection Fee Revenue Obligations Debt Service Coverage ............................................................................................. 227Local Government Property Insurance Fund Ten-Year Claims Development Information ................................................................... 228Health Insurance Risk Pool Ten-Year Claims Development Information .............................................................................................. 230Income Continuation Insurance Risk Pool Ten-Year Claims Development Information ....................................................................... 231Duty Disability Insurance Risk Pool Ten-Year Claims Development Information ................................................................................. 232Long-term Disability Insurance Risk Pool Ten-Year Claims Development Information ........................................................................ 233Bank Deposits ....................................................................................................................................................................................... 234Unemployment Data .............................................................................................................................................................................. 234Personal Income .................................................................................................................................................................................... 235Disposable Personal Income ................................................................................................................................................................. 235Kindergarten through Grade 12 Enrollment Statistics ........................................................................................................................... 236Total New Housing Units Authorized in Permit-Issuing Places ............................................................................................................. 236State of Wisconsin's Largest Employers .....................………………………………………………………………………………………… 237Employment Trends in Wisconsin ......................................................................................................................................................... 238Estimated Employees in Wisconsin on Nonagricultural Payrolls .......................................................................................................... 239How Wisconsin Ranks Among the States in Agriculture ....................................................................................................................... 240Miscellaneous Data ............................................................................................................................................................................... 241
Acknowledgments ...................................................................................................................................................................................... 242
printed on recycled paper
iii

iv

INTRODUCTORY SECTION
1
JIM DOYLEGOVERNORMARC J. MAROTTASECRETARY
Office of the SecretaryPost Office Box 7864Madison, WI 53707-7864Voice (608) 266-1741Fax (608) 267-3842TTY (608) 267-9629
2
December 21, 2004
The Honorable Jim Doyle The Honorable Members of the LegislatureCitizens of the State of Wisconsin
We are pleased to submit the Comprehensive Annual Financial Report (CAFR) for the State of Wisconsinfor the fiscal year ended June 30, 2004. This report is prepared by the Department of Administration,Division of Executive Budget and Finance, State Controller's Office, which is responsible for both theaccuracy of the data and the completeness and fairness of its presentation, including disclosures. Webelieve that the information presented is accurate in all material respects and reported in a manner designedto show the financial position and operating results of the State.
This report has been prepared in accordance with generally accepted accounting principles (GAAP) forgovernments as promulgated by the Governmental Accounting Standards Board (GASB). To report theState's financial activity, the State's budgetary funds are grouped into the fund types required by GAAP.The State's 60 budgetary funds are expanded and have been displayed into the 92 individual GAAP funds,and five discrete component units. The major change has been to reclassify certain activities from thebudgetary General Fund and present them in proprietary and fiduciary fund types more appropriate for thefinancial reporting of transactions related to commercial and trust activities. Note 1-C to the financialstatements includes a more detailed discussion of the generic GAAP fund types.
Wisconsin's 2004 Comprehensive Annual Financial Report is presented in three sections: Introductory,Financial, and Statistical. The Introductory Section, which provides information on the general contents ofthe report, contains this letter of transmittal, a list of State officials and an organizational chart of Stategovernment. The Financial Section is composed of the auditor's report, Management Discussion andAnalysis, the basic financial statements, required supplementary information and the combining financialstatements. The Statistical Section provides various financial, economic and demographic data about theState, generally on a multi-year basis.
GAAP requires that management provide a narrative introduction, overview, and analysis to accompanythe basic financial statements in the form of Management’s Discussion and Analysis (MD&A). This letterof transmittal is designed to complement MD&A and should be read in conjunction with it. The State’sMD&A can be found immediately following the auditor’s report.
PROFILE OF GOVERNMENT
The financial statements present information on the financial position and operations of State governmentas a single comprehensive reporting entity. The various agencies, departments, boards, commissions and
3
accounts of the State that constitute the State reporting entity are included in this report in accordance withcriteria established by the GASB. The reporting entity consists of all the funds of the primary government(the State of Wisconsin), as well as its component units which are legally separate organizations for whichthe State is financially accountable or receives a substantial benefit. Discretely presented component unitsinclude the Wisconsin Housing and Economic Development Authority, the Wisconsin Health CareLiability Insurance Plan, the University of Wisconsin Hospitals and Clinics Authority, the State Fair ParkExposition Center, Inc., and the University of Wisconsin Foundation. Blended component units, which arelegally separate from the State, but have a higher degree of interconnectedness with the State, include theWisconsin Public Broadcasting Foundation, Inc. and the Badger Tobacco Asset Securitization Corporation.
The State provides a full range of services that include education, health and social services, transportation,law, justice, public safety, recreation and resources development, public improvements and generaladministrative services. The costs associated with these services are presented within the financialstatements in detail and summary form.
Internal Controls
The State's internal accounting controls provide reasonable assurance regarding the safeguarding of assetsagainst loss from unauthorized use or disposal and the reliability of financial records for preparingfinancial statements. The concept of reasonable assurance recognizes that the cost of a control should notexceed the benefits likely to be derived, and that evaluation of costs and benefits requires estimates andjudgments by management.
Budgetary Controls
The State's biennial budget is prepared on a mixture of cash and modified accrual bases of accounting andrepresents departmental appropriations based on agency requests reviewed by the Department ofAdministration and recommended by the Governor. The Governor's budget is submitted to the StateLegislature for approval. Following debate, amendment and approval by the Senate and Assembly, thebudget bill is returned to the Governor for his signature or veto in entirety or in part.
The State Constitution provides that no money shall be paid out of the Treasury except as appropriated bylaw. The Statutes require that the Secretary of Administration must approve all payments, and thenforward such requests to the State Treasurer for signature. The Department of Administration exercisesdetail allotment control over all agency appropriations and approval authority over all encumbrances.
The budgetary basis of accounting required by State law differs materially from the basis used to reportrevenues and expenditures in accordance with GAAP. In addition, the State's biennial budget is developedaccording to the statutorily required fund structure that differs extensively from the fund structure used inthe financial statements.
Cash Management
The State of Wisconsin Investment Board is responsible for investing in cash resources of the State. On adaily basis, excess cash from all funds is pooled and invested through a variety of investment vehicles.Interest income earned on these investments is allocated to the various funds based on their average dailycash balances. The total amount of investments in the State Investment Fund at June 30, 2004 was $5.5billion.
4
Risk Management
The State's risk management program, encompassing all State agencies, began in 1974 within theDepartment of Administration. Statutory responsibilities and authority include, but are not limited to:
• Protecting the State's assets from catastrophic loss;• Emphasizing loss reduction;• Identifying and evaluating exposures to loss;• Recommending changes in procedures and programs to eliminate or reduce existing exposures;• Arranging appropriate insurance for the transfer of risk of loss; and• Approving all insurance purchases.
Currently, the State is essentially self-insured, through its risk management program, against major lossesto which it is exposed. The Risk Management Fund, an internal service fund, services most claims for riskof loss, including damage to State owned property, liability for property damages and injuries to thirdparties, and worker's compensation. Additional disclosures on the State's risk management activities areprovided in Note 17.
Pension Trust Funds
The Wisconsin Retirement System (WRS), consisting of the fixed retirement investment trust, the variableretirement investment trust, and the police and firefighters trust is administered by the Department ofEmployee Trust Funds. The WRS provides coverage to all eligible employees of the State of Wisconsinand other participating local units of government.
The most current actuarial valuations of the pension plan indicated that the WRS was funded at 99.2percent of liabilities for the 535,068 participants of the WRS. During Fiscal Year 2004, the State paid offits pension-related debt of approximately $705 million, through the issuance of General Fund AnnualAppropriation Bonds; in a more typical year the State’s contribution to WRS would representapproximately 30 percent of total contributions required of all participating entities.
ECONOMIC CONDITION AND OUTLOOK
In calendar year 2003, the Wisconsin economy stabilized and moved into position for a sustainablerecovery.
Wisconsin employment declined slightly in 2003 in Wisconsin by 0.3 percent. Wisconsin employmentwas largely unchanged in 2002, up only 0.1 percent and down substantially in 2001, –2 percent.Wisconsin fared better than the nation in 2002 and 2003. Nationally, employment declined –1.1 percent in2002 and –0.3 percent in 2003.
The differences in employment performance were realized in differences in income growth. Wisconsinpersonal income increased 2.8 percent in 2002 and 3.1 percent in 2003. Nationally, income growth was1.8 percent in 2002 and 3.3 percent in 2003. On a per capita basis, Wisconsin’s performance was strongerthan the nation’s. Per capita income in Wisconsin increased 2.2 percent in 2002 and 2.5 percent in 2003compared to 0.7 percent and 2.2 percent nationally. Since 2000, Wisconsin’s per capita income has movedcloser to the national average from 95.7 percent in 2000 to 97.7 percent in 2003.
5
Wisconsin’s employment is expanding once again. Through October 2004, Wisconsin non-farmemployment is up 2.1 percent compared to a year ago. Nationally, employment was up 1.6 percent overthe same period. Wisconsin’s unemployment rate in October was 5.0 percent compared to 5.5 percentnationally.
Wisconsin’s property values reflect an expanding economy. Real property values increased significantlyin 2002 and 2003, up 7.5 percent in each year. In 2004, values increased 8.7 percent. Commercial,manufacturing and residential real estate have all increased significantly in these years.
Wisconsin has matched or exceeded the nation’s economic performance in recent years.• Wisconsin’s unemployment rate remains well below the national rate.• Since the 2000 census, the State’s population growth ranks second in the Midwest states as more
people relocate to Wisconsin. • With 91.5 percent of its population covered, Wisconsin has the fourth highest health insurance
coverage rate in the country.• Wisconsin has the eighth lowest poverty rate at 8.8 percent of population compared to 12.1 percent
nationally.• Wisconsin’s median household income, $46,782, is the fourteenth highest in the country, 7.5 percent
above the national average.
Looking ahead, Wisconsin’s recovery should match the national recovery. With recovery inmanufacturing adding to the expansion in services, finance and utilities, total nonfarm employment shouldincrease by 1.6 percent in 2004 and by 1.8 percent in 2005. Nationally, nonfarm employment shouldincrease by 1.0 percent in 2004 and by 1.7 percent in 2005.
The expansion of employment should strengthen Wisconsin’s personal income growth. Total personalincome should grow by 4.5 percent in 2004 and by 5.5 percent in 2005. This is comparable to nationalgrowth over the two-year period of 5.2 percent in 2004 and 4.9 percent in 2005.
MAJOR INITIATIVES
Economic Development. In 2004, the Governor signed major legislation designed to encourage investorsto devote capital to start-up companies by providing a total of $65 million in tax credits to individuals thatmake angel and venture capital investments in early stage companies and manufacturers. This legislationalso provides $5.2 million over the course of a biennium to help businesses attract federal and venturecapital assistance to commercialize technologies or processes.
Several additional tax relief measures and regulatory changes were enacted in Fiscal Year 2004. Theenactment of the single-factor sales apportionment of income for corporate and franchise taxes is projectedto reduce corporate tax burdens by $45 million, when it is fully implemented in 2008. Manufacturerscurrently receive tax credits equal to the amount of sales and use tax paid for fuel and electricity used inmanufacturing. Beginning on January 1, 2006, fuel and electricity used in manufacturing will be exemptfrom sales and use tax. Manufacturers will still be able to claim any unused tax credits accumulated priorto 2006. In addition, a new tax credit for dairy modernization offers support for capital investment ondairy farms and is estimated to provide up to $5.7 million annually to dairy farmers through 2009. Also, toposition Wisconsin's economy for future growth, the utility siting permit processes were streamlined toencourage siting of new facilities and improve electric reliability for business, industry, agriculture and thepublic.
6
In addition, the State has continued its efforts to expand existing businesses, attract new companies toWisconsin and provide support to entrepreneurs looking to start a business in this State. Major tools usedin these efforts are the Wisconsin Development Fund, the development zone programs and the CertifiedCapital Companies program (CAPCO). The State awarded $7.9 million during Fiscal Year 2004 from theWisconsin Development Fund, primarily through the major economic development program, customizedlabor training grants and technology development grants and loans. The State also earmarked $275,000 infunds to provide entrepreneurial training grants to assist in small business development. To date, 456businesses have been designated under the Community and Enterprise Development Zone programs,resulting in over 68,000 jobs created or retained and leveraging more than $2.3 billion in privateinvestment. The Technology Development Zones program certified 46 high-technology businesses aseligible to receive $9.2 million in tax credits. These credits leveraged over $278 million in privateinvestment, and the firms involved created and retained over 9,000 jobs in Wisconsin. The AgriculturalDevelopment Zone program certified 18 businesses as eligible to receive $2.5 million in tax credits. Thesecredits leveraged over $37 million in private investment, and the firms involved created and retained over1,500 jobs in Wisconsin. Since its establishment in 1999, three CAPCOs have invested almost $20 millionin 14 Wisconsin companies.
The State also offers a variety of programs that target minority and rural business development as well ascommunity-based economic development. In Fiscal Year 2004, the State awarded $2.4 million, whichleveraged additional investments of $11.3 million. Also in 2004, the Governor signed legislation toprovide an additional $750,000 per year to manufacturing extension programs, allowing theseorganizations to help manufacturers modernize, remain competitive and create new jobs in Wisconsin.State investment in the manufacturing extension programs illustrates Wisconsin's continued commitmentto help manufacturers grow and remain a driving force in Wisconsin's economy.
Wisconsin has always enjoyed a strong tourism economy and in Fiscal Year 2004 travelers spent over$11.7 billion on recreation, leisure, meetings, conventions and sports events in the State. This spendingsupported over 311,000 full time jobs paying $6.6 billion in wages and salaries. The State invested $8.5million to increase awareness of Wisconsin as a premier travel destination, mostly on television, radio andpublications in metropolitan Chicago and Minneapolis/St. Paul, which are primary sources of out-of-statetravelers.
During the year, the State hosted several high profile national sports and cultural events which confirmedthe State's reputation as a top tourism destination. The Grand Excursion along the Mississippi River,ESPN Television's Great Outdoor Games, the PGA Golf Championship and a national tour of Egyptianantiquities all attracted attendance from throughout the Midwest.
Transportation. The State continued to make significant investments in transportation infrastructurethrough expansion in highway capacity and reconstruction of existing highways and bridges. In 2004,almost 714 miles of State Trunk Highway (STH) and local highways were improved and 151 deficientstate and local bridges were rehabilitated or replaced. Also, in 2004 the State contributed $43.3 million tocontinue work on the Marquette Interchange reconstruction project. In all, more than $662 million inconstruction projects on STH and local road systems was contracted through the Wisconsin Department ofTransportation.
Wisconsin also distributes State transportation user fee revenues to local governments for transportationinfrastructure improvements and transit operating assistance. In Fiscal Year 2004, $536.6 million wastransferred to local governments for these purposes.
7
Environment. Wisconsin took significant steps to streamline its regulatory processes while maintainingenvironmental protections. The regulatory reform act, 2003 Wisconsin Act 118, changed the regulation ofnavigable waters, air pollution regulation and administrative rule process. The Wisconsin Constitutionplaces Wisconsin's navigable waters in trust for use by all residents and visitors of the State. To protectthe public's rights, the Department of Natural Resources regulates modifications to Wisconsin's navigablewaters, such as the installation of piers and dredging. Act 118 exempts many activities from navigablewaters regulation and subjects certain activities to general permits. Activities that may cause significantenvironmental harm remain subject to an individual permit process. Act 118 also changed air pollutionregulation by exempting minor sources, directing the department to establish general permits for similarstationary sources and requiring the department to provide additional documentation for its findings on airpermits. Finally, Act 118 requires the preparation of an economic impact report for administrative rulesthat meet certain criteria including having an estimated annual cost of over $20 million.
Wisconsin's Warren Knowles-Gaylord Nelson Stewardship Program and its successor, the WarrenKnowles-Gaylord Nelson Stewardship 2000 Program, underscore the State's role as a national leader inenvironmental preservation and enhancement. The original Stewardship Program committed $250 millionthrough the sale of general obligation bonds and the use of federal grant monies for various resourcedevelopment and land protection activities, including acquisition of State park lands, protection of urbanrivers and assistance to local parks. The Stewardship 2000 Program commits $572 million over 10 yearsthrough the sale of general obligation bonds to continue the State's efforts to protect and enhanceWisconsin's abundant natural resources. Expenditures for environmental preservation and improvement ofrecreational opportunities under the Stewardship and Stewardship 2000 programs totaled $53.9 million inFiscal Year 2004. During Fiscal Year 2004, the State used Stewardship 2000 Program financing toacquire over 5,800 acres of land and 63 miles of shoreline on the Rainbow Flowage and Pickerel Lake inthe Northern Highland America Legion State Forest in Oneida and Vilas Counties. The purchase assuresthat nearly all the flowage's shoreline will remain undeveloped, which will preserve a highly productivefishery and terrestrial habitat for eagles, osprey and many species of waterfowl.
In addition to land acquisition through the Stewardship programs, Wisconsin's efforts to protect andenhance its natural resources include partnerships with individual landowners. In November 2001, theState entered into an agreement with the U.S. Department of Agriculture for the authority to enroll up to100,000 acres of Wisconsin farmland in the Conservation Reserve Enhancement Program. The federalgovernment will provide up to $200 million for the program, which will be matched by the State with upto $40 million from the sale of general obligation bonds. Landowners participating in the program receivean up-front payment from the State and annual payments from the federal government to install andmaintain riparian buffers, wetlands and other practices that reduce polluted runoff or, in certain areas,improve habitat for grassland birds. Landowners may receive a larger up-front payment if they transfer tothe State an easement to permanently maintain the practices. Through Fiscal Year 2004, Wisconsin hasenrolled over 2,000 participants and over 38,000 acres and has made payments of $8.6 million. Thefederal government has paid landowners over $57 million.
The first instance of chronic wasting disease in Wisconsin’s deer herd was discovered in February 2002.Since then, the State has spent $18.9 million to support disease management efforts, including testing anddisposal costs, public outreach efforts, law enforcement costs, and a radio telemetry study of deermovement in the chronic wasting disease management area. The department has mapped the State intovarious regions and has identified testing target areas in order to map the disease, stop its spread, andmanage the deer herd to ensure successful deer hunts for generations to come. The State continues tomonitor the extent and prevalence of the disease.
8
In addition, the State took steps to safeguard the health of livestock and wild animal populations fromdiseases, such as chronic wasting disease and foot and mouth disease, by establishing a livestock premisesidentification program. Under 2003 Wisconsin Act 229, individuals are required to register all livestockpremises with the Department of Agriculture, Trade and Consumer Protection. The program is one of thefirst in the U.S. and is part of a national program to allow the tracking of diseased animals from birth toslaughter.
Wisconsin's Environmental Improvement Fund program provides financial assistance to municipalities forthe planning, design and construction of wastewater treatment and drinking water treatment facilities. Theprogram also provides assistance for brownfields remediation projects. Most communities applying forassistance receive subsidized loans, although some wastewater projects are eligible for partial grantsthrough a hardship component of the program. Funding is provided from a State-matched federalcapitalization grant and through State revenue and general obligation bonds. In Fiscal Year 2004, theEnvironmental Improvement Fund made awards to municipalities amounting to $109 million, bringing thetotal amount of loans and grants awarded by the program to $2.1 billion since its inception in 1991.
The Petroleum Environmental Cleanup Fund Award program (PECFA) assists owners of leakingpetroleum storage tanks with environmental remediation costs and has provided $1.402 billion forcleanups at 11,732 locations since 1988. Efforts to minimize claim payment backlogs and improve siteclosure methodologies have streamlined the program while protecting the environment and public health.
In addition to the PECFA program, Wisconsin has made a strong effort to reclaim contaminated properties,or brownfields. In Fiscal Year 2004, the brownfields site assessment grant program provided $1.7 millionto 35 local governments to jump-start investigation and redevelopment of brownfield sites. After fourrounds of applications, 207 grants totaling $6.6 million have been awarded. Since June of 1998, thebrownfields grant program has awarded $36.9 million to 89 projects for the redevelopment of brownfieldswhere clean up will have a significant economic as well as environmental impact. The completion of theseprojects will return 1,090 acres of abandoned or under-used environmentally contaminated sites toproductive use, increase taxable property values by over $607 million and create over 4,000 new jobs.
Wisconsin has historically been a national leader in recycling. Since its inception as one of the nation'sfirst and foremost programs in support of community recycling, over $348.8 million has been provided tomunicipalities to help defray the cost of operating effective recycling programs. In addition, the State hasprovided funds for innovative recycling and waste reduction projects, including $1.9 million annually forthe Recycling Efficiency Incentive Grants program. The program rewards municipalities for efficienciesachieved through consolidation of and cooperative agreements between local recycling services.
Human Resources. Several major new programs were implemented by the Department of Health andFamily Services shortly before or during the Fiscal Year 2002-04 period, resulting in significant increasesin expenditures. The SeniorCare program, created in 2001 Act 16 (the 2001-03 Biennial Budget Act), wasimplemented September 1, 2002. The program provides assistance for the purchase of prescription drugsto approximately 90,000 individuals age 65 years or older. The Family Care program, created in 1999Act 9 (the 1999-2001 Biennial Budget Act), began operation in February 2000. The program providescomprehensive and flexible long-term managed care to approximately 9,000 persons who are elderly orwho have a developmental disability or physical disability. The BadgerCare program, created in 1997 Act27 (the 1997-99 Biennial Budget Act), was implemented beginning in July 1999. The program provideshealth insurance to over 100,000 children and parents in low income working families whose employersdo not offer health insurance or who do not contribute enough to make it affordable.

9
Another change which affected the department's expenditure trends beginning in Fiscal Year 2002 was thecreation of the Medical Assistance Trust Fund by 2001 Act 16 (2001-03 Biennial Budget Act). TheMedical Assistance (MA) Trust Fund was created in response to the State’s efforts to maximize federalMA revenue. Additional federal revenue was generated through a number of mechanisms, including anintergovernmental transfer program between the state and local government owned nursing homes. Theproceeds from these federal maximization initiatives were deposited in the Medical Assistance Trust Fundand are appropriated as segregated funding. These segregated funds are used to pay a portion of the non-federal share of medical assistance benefits, which results in an increase in SEG expenditures and adecrease in GPR expenditures.
In Fiscal Year 2004, the Department of Health and Family Services facilitated over 1,120 adoptions ofspecial needs children. The Special Needs Adoption program finds adoptive homes for children withunique needs. These children may be sibling groups of 3 or more placed together, children age 10-18 orchildren with emotional, behavior and developmental disabilities.
Criminal penalty statutory changes went into effect in Fiscal Year 2003. These changes revise felonyclassifications to more accurately reflect the crime committed. The changes will improve the criminaljustice system and help reduce incarceration costs because the additional classifications will provide betterguidance for imposing penalties.
Education. State aids and tax credits applied to support 2003-2004 school year costs for elementary andsecondary education totaled $5.3 billion. As part of this state aid commitment, funding for theequalization aid, which provides general funding to school districts to help offset property tax increases,increased by $72.2 million in Fiscal Year 2004, an increase of 1.7 percent. The 2003-05 biennial budgetbill also increased the low revenue ceiling by $500 (7.2 percent) per pupil in 2003-04, from $6,900 perpupil to $7,400, the largest increase in the ten-year history of revenue limits. This increase provided over50 of the State's lowest spending school districts with more flexibility to ensure that their students cancontinue to receive a quality education.
Fiscal Year 2004 also provided the largest increase in State financial aid for University of Wisconsinstudents in the history of the Wisconsin Higher Education Grants, Lawton and Advanced Opportunityprograms. The combined $6.9 million (23.3 percent) increase will provide much-needed increases ingrants to help keep the University of Wisconsin affordable for low-income students.
The Governor's Task Force on Educational Excellence completed its work in 2004. The Task Forcereport, which addressed school finance, student achievement, teacher recruitment and retention and specialeducation, will provide an important resource to help policymakers chart the future of public education inWisconsin.
OTHER INFORMATION
Independent Audit
In compliance with Wis. Stat. Sec. 13.94 (1)(c), the State Legislative Audit Bureau has performed anexamination of the State's basic financial statements. The examination was made in accordance withgenerally accepted auditing standards. Their report is contained in the Financial Section which follows.

10
Award
The Government Finance Officers Association of the United States and Canada (GFOA) awarded a“Certificate of Achievement for Excellence in Financial Reporting” to the State of Wisconsin for itsComprehensive Annual Financial Report for the fiscal year ended June 30, 2003. The Certificate ofAchievement is a prestigious national award recognizing conformance with the highest standards forpreparation of state and local government financial reports.
In order to be awarded a Certificate of Achievement, a government unit must publish an easily readableand efficiently organized comprehensive annual financial report whose contents conform to programstandards. Such reports must satisfy both generally accepted accounting principles and applicable legalrequirements.
A Certificate of Achievement is valid for a period of one year only. This is the eighth year the State ofWisconsin has received this award. We believe our current report continues to conform to the Certificateof Achievement Program requirements, and we are submitting it to the GFOA.
ACKNOWLEDGMENTS
We wish to express our appreciation to the many individuals whose dedicated efforts have made this reportpossible. The preparation of this report could not have been accomplished without the professionalism anddedication demonstrated by the financial managers and accountants of the State agencies and componentunits, along with staff within the State Controller's Office.
Sincerely,
Marc J. Marotta William J. Raftery, CPASecretary State Controller

11
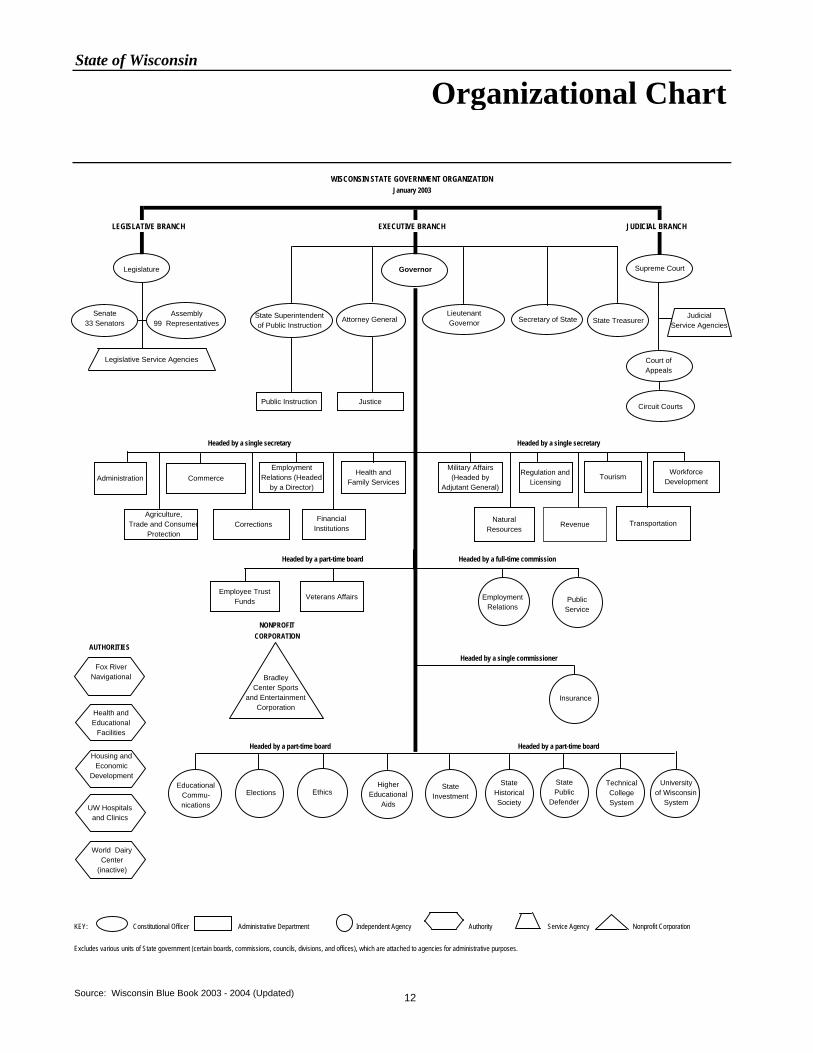
State of Wisconsin
Organizational Chart
WISCONSIN STATE GOVERNMENT ORGANIZATIONJanuary 2003
LEGISLATIVE BRANCH EXECUTIVE BRANCH JUDICIAL BRANCH
Headed by a single secretary Headed by a single secretary
Headed by a part-time board Headed by a full-time commission
NONPROFIT CORPORATION
AUTHORITIES Headed by a single commissioner
Headed by a part-time board Headed by a part-time board
KEY: Constitutional Officer Administrative Department Independent Agency Authority Service Agency Nonprofit Corporation
Excludes various units of State government (certain boards, commissions, councils, divisions, and offices), which are attached to agencies for administrative purposes.
Source: Wisconsin Blue Book 2003 - 2004 (Updated)
Universityof Wisconsin
System
Supreme CourtGovernorLegislature
JudicialService AgenciesState TreasurerSecretary of StateAttorney GeneralState Superintendent
of Public InstructionAssembly
99 Representatives
Legislative Service Agencies Court ofAppeals
Circuit CourtsJusticePublic Instruction
FinancialInstitutionsCorrections
World DairyCenter
(inactive)
Housing and Economic
Development
Health and Educational
Facilities
Health and Family Services
Veterans AffairsEmployee Trust
Funds
Administration Tourism WorkforceDevelopmentCommerce
NaturalResources Revenue Transportation
StatePublic
Defender
Regulation andLicensing
UW Hospitalsand Clinics
Insurance
PublicService
Military Affairs(Headed by
Adjutant General)
EmploymentRelations
TechnicalCollegeSystem
EthicsElectionsEducational
Commu-nications
Agriculture,Trade and Consumer
Protection
Senate33 Senators
BradleyCenter Sports
and EntertainmentCorporation
LieutenantGovernor
StateHistoricalSociety
HigherEducational
Aids
State Investment
Employment Relations (Headed
by a Director)
Fox River Navigational
12

State of Wisconsin
Principal State Officials
13
As of June 30, 2004:
EXECUTIVE
Jim DoyleGovernor
Barbara LawtonLieutenant Governor
Douglas J. La FolletteSecretary of State
Jack C. VoightState Treasurer
Peggy A. LautenschlagerAttorney General
Elizabeth BurmasterState Superintendent of Public Instruction
LEGISLATIVE
Alan J. Lasee President of the State Senate
John GardSpeaker of the Assembly
JUDICIAL
Shirley S. AbrahamsonChief Justice of the Supreme Court

14

FINANCIAL SECTION
15
16
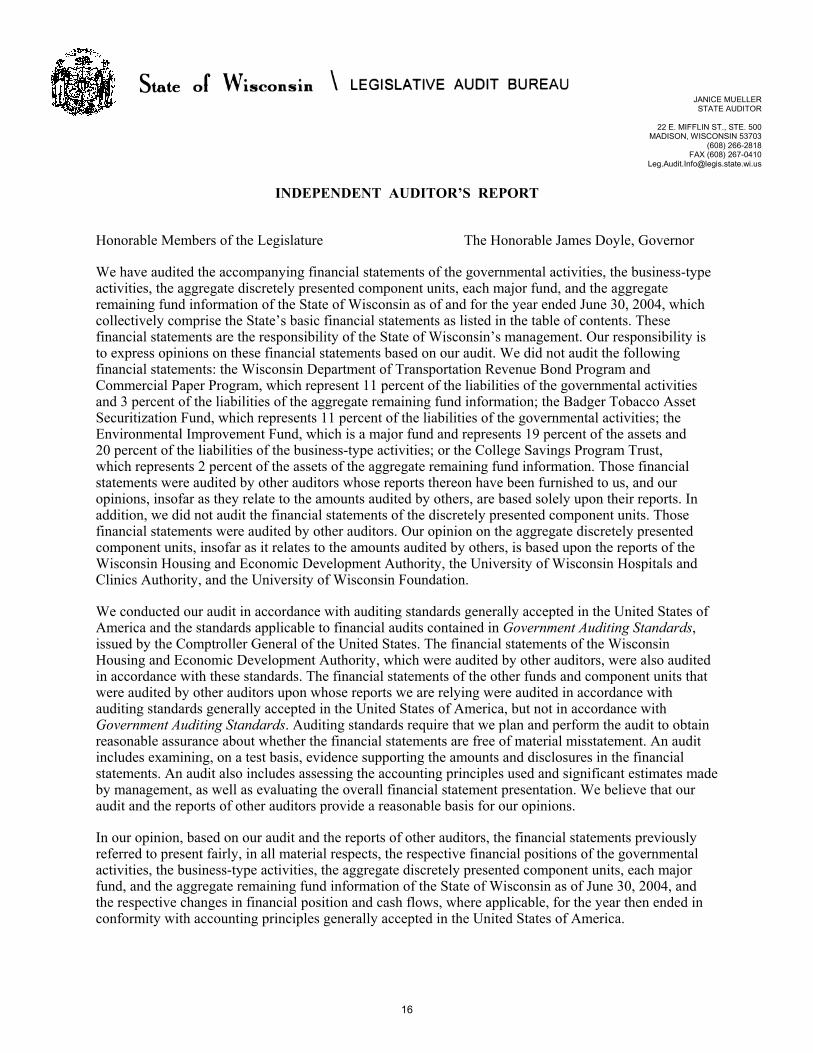
INDEPENDENT AUDITOR’S REPORT Honorable Members of the Legislature The Honorable James Doyle, Governor We have audited the accompanying financial statements of the governmental activities, the business-type activities, the aggregate discretely presented component units, each major fund, and the aggregate remaining fund information of the State of Wisconsin as of and for the year ended June 30, 2004, which collectively comprise the State’s basic financial statements as listed in the table of contents. These financial statements are the responsibility of the State of Wisconsin’s management. Our responsibility is to express opinions on these financial statements based on our audit. We did not audit the following financial statements: the Wisconsin Department of Transportation Revenue Bond Program and Commercial Paper Program, which represent 11 percent of the liabilities of the governmental activities and 3 percent of the liabilities of the aggregate remaining fund information; the Badger Tobacco Asset Securitization Fund, which represents 11 percent of the liabilities of the governmental activities; the Environmental Improvement Fund, which is a major fund and represents 19 percent of the assets and 20 percent of the liabilities of the business-type activities; or the College Savings Program Trust, which represents 2 percent of the assets of the aggregate remaining fund information. Those financial statements were audited by other auditors whose reports thereon have been furnished to us, and our opinions, insofar as they relate to the amounts audited by others, are based solely upon their reports. In addition, we did not audit the financial statements of the discretely presented component units. Those financial statements were audited by other auditors. Our opinion on the aggregate discretely presented component units, insofar as it relates to the amounts audited by others, is based upon the reports of the Wisconsin Housing and Economic Development Authority, the University of Wisconsin Hospitals and Clinics Authority, and the University of Wisconsin Foundation. We conducted our audit in accordance with auditing standards generally accepted in the United States of America and the standards applicable to financial audits contained in Government Auditing Standards, issued by the Comptroller General of the United States. The financial statements of the Wisconsin Housing and Economic Development Authority, which were audited by other auditors, were also audited in accordance with these standards. The financial statements of the other funds and component units that were audited by other auditors upon whose reports we are relying were audited in accordance with auditing standards generally accepted in the United States of America, but not in accordance with Government Auditing Standards. Auditing standards require that we plan and perform the audit to obtain reasonable assurance about whether the financial statements are free of material misstatement. An audit includes examining, on a test basis, evidence supporting the amounts and disclosures in the financial statements. An audit also includes assessing the accounting principles used and significant estimates made by management, as well as evaluating the overall financial statement presentation. We believe that our audit and the reports of other auditors provide a reasonable basis for our opinions. In our opinion, based on our audit and the reports of other auditors, the financial statements previously referred to present fairly, in all material respects, the respective financial positions of the governmental activities, the business-type activities, the aggregate discretely presented component units, each major fund, and the aggregate remaining fund information of the State of Wisconsin as of June 30, 2004, and the respective changes in financial position and cash flows, where applicable, for the year then ended in conformity with accounting principles generally accepted in the United States of America.
JANICE MUELLERSTATE AUDITOR
22 E. MIFFLIN ST., STE. 500MADISON, WISCONSIN 53703
(608) 266-2818FAX (608) 267-0410
17
As discussed in Note 1 to the financial statements, the State implemented two accounting changes during fiscal year 2003-04. Governmental Accounting Standards Board (GASB) Statement Number 39, Determining Whether Certain Organizations Are Component Units—an amendment of GASB Statement No. 14—broadened the definition of component units and as a result, required the inclusion of the financial statements of the University of Wisconsin Foundation as a discretely presented component unit in the State’s Comprehensive Annual Financial Report. GASB Technical Bulletin Number 2004-1, Tobacco Settlement Recognition and Financial Reporting Entity Issues, required the State to report the Badger Tobacco Asset Securitization Corporation as a blended component unit. As discussed in Note 18C to the financial statements, the Injured Patients and Families Compensation Fund’s projected ultimate loss liability is an estimate based on recommendations of a consulting actuary. The Injured Patients and Families Compensation Fund Board of Governors believes that the estimated loss liability is reasonable and adequate to cover the cost of claims incurred to date. However, uncertainties inherent in projecting the frequency and severity of large medical malpractice claims because of the Injured Patients and Families Compensation Fund’s unlimited liability coverage and extended reporting and settlement periods make it likely that amounts paid will ultimately differ from the recorded estimated liabilities. These differences cannot be quantified. Management’s discussion and analysis, the infrastructure narrative, and the budgetary comparison schedule with related notes as listed in the table of contents are not required parts of the basic financial statements of the State of Wisconsin but are supplementary information required by the Governmental Accounting Standards Board. We have applied certain limited procedures, which consisted principally of inquiries of management regarding the methods of measurement and presentation of the required supplementary information. However, we did not audit the information and express no opinion on it. Our audit was conducted for the purpose of forming opinions on the financial statements that collectively comprise the State’s basic financial statements. The combining statements and schedules in the supplementary information section as listed in the table of contents are presented for purposes of additional analysis and are not a required part of the basic financial statements of the State of Wisconsin. The combining statements and schedules have been subjected to the auditing procedures applied in the audit of the basic financial statements and, in our opinion, based on our audit and the reports of other auditors, are fairly presented in all material respects in relation to the basic financial statements taken as a whole. The introductory section and the statistical section listed in the table of contents have not been subjected to the auditing procedures applied within the audit of the basic financial statements and, accordingly, we express no opinion on them. In accordance with Government Auditing Standards, we have prepared a report dated December 21, 2004, on our consideration of the State of Wisconsin’s internal control over financial reporting and on our tests of its compliance with certain provisions of laws, regulations, contracts, and grant agreements and other matters. The purpose of that report is to describe the scope of our testing of internal control over financial reporting and compliance and the results of that testing, and not to provide an opinion on the internal control over financial reporting or on compliance. A more detailed version of that report will be included in the State’s single audit report. The report on internal control and compliance is an integral part of an audit performed in accordance with Government Auditing Standards and should be considered in assessing the results of our audit. LEGISLATIVE AUDIT BUREAU December 21, 2004 by Janice Mueller State Auditor

18

19
MANAGEMENT’S DISCUSSION AND ANALYSIS
The Management's Discussion and Analysis of the State of Wisconsin’s Comprehensive Annual Financial Report (CAFR)presents a discussion and analysis of the State’s financial performance during the fiscal year that ended June 30, 2004. Itshould be read in conjunction with the transmittal letter located at the front of this CAFR, and the State’s financial statements,which follow this part of the CAFR.
FINANCIAL HIGHLIGHTS -- PRIMARY GOVERNMENT
Government-wide (Tables 2 and 3 on Pages 23 and 24)
• Net Assets. The assets of the State of Wisconsin exceeded its liabilities at the close of Fiscal Year 2004 by $10.9 billion(reported as "net assets"). Of this amount, $(7.3) billion was reported as "unrestricted net assets". A positive balance inunrestricted net assets would represent the amount available to be used to meet a government's ongoing obligations tocitizens and creditors.
• Changes in Net Assets. The State's total net assets decreased by $0.9 billion in Fiscal Year 2004. Net assets ofgovernmental activities decreased by $956.1 million or 16.9 percent, while net assets of the business-type activitiesshowed an increase of $16.9 million or 0.3 percent.
• Excess of Revenues over (under) Expenses -- Governmental Activities. During Fiscal Year 2004, the State’s totalrevenues for governmental activities of $19.91 billion were $29.2 million more than total expenses (excluding transfers) forgovernmental activities of $19.88 billion. Of these expenses, $7.5 billion were covered by program revenues. Generalrevenues, generated primarily from various taxes, totaled $12.4 billion.
Fund
• Governmental Funds -- Fund Balances. As of the close of Fiscal Year 2004, the State's governmental funds reportedcombined ending fund balances of $(741.3) million, an increase of $316.5 million in comparison with the prior year. Of thistotal amount, $(2.6) billion represents the "unreserved fund balances".
• General Fund -- Fund Balance. At the end of the current fiscal year, the unreserved fund deficit for the General Fund was$(2.3) billion, or (13.4) percent of total General Fund expenditures.
Long-term Debt
• The State's total long-term debt obligations (bonds and notes payable) increased by $2,534.8 million during the currentfiscal year which represents the net difference between new issuances, payments and refundings of outstanding debt. Akey factor contributing to the increase is the issuance of $1,794.9 million of General Fund annual appropriation bonds,which were issued to pay off the State’s unfunded accrued prior service (pension) liability and the unfunded accrued liabilityfor sick leave conversion credits. Additionally the issuance during the fiscal year of $1,305.1 million of general obligationbonds and $507.3 million of revenue bond obligations, and early redemptions and refundings of general obligation andrevenue bonds contributed to this increase. Additional detail regarding these activities begins on Page 31.
OVERVIEW OF THE FINANCIAL STATEMENTS
The Financial Section of this CAFR consists of four parts: (1) management's discussion and analysis (this section), (2)basic financial statements, (3) additional required supplementary information, and (4) optional other supplementaryinformation. Parts (2), (3), and (4) are briefly described on the following page:
20
Basic Financial Statements
The basic financial statements include two sets of statements that present different views of the State -- the government-widefinancial statements and the fund financial statements. These financial statements also include notes that explain some ofthe information in the financial statements and provide more detail.
Government-wide Financial Statements
The government-wide financial statements provide a broad view of the State’s operations. The statements provide both short-term and long-term information about the State’s financial status, which assists in assessing the State’s financial condition atthe end of the fiscal year. The government-wide financial statements include two statements:
• The statement of net assets presents all of the government's assets and liabilities, with the difference between the tworeported as "net assets". Over time, increases or decreases in the state's net assets are an indicator of whether itsfinancial health is improving or weakening, respectively.
• The statement of activities presents a comparison between direct expenses and program revenues for each function of theState’s governmental activities and for different identifiable business-type activities of the State.
These government-wide financial statements are divided into three categories:
• Governmental Activities – Most services generally associated with State government fall into this category, includingcommerce, education, transportation, environmental resources, human relations and resources, general executive, judicialand legislative.
• Business-Type Activities – Those operations for which a fee is charged to external users for goods and services arereported in this category.
• Discretely Presented Component Units – These are operations for which the State has financial accountability but thathave certain independent qualities as well. The State’s discretely presented component units (all business-type activities)are:
– Wisconsin Housing and Economic Development Authority,– Wisconsin Health Care Liability Insurance Plan,– University of Wisconsin Hospitals and Clinics Authority, – State Fair Park Exposition Center, Inc., and– University of Wisconsin Foundation.
Complete financial statements of the individual component units can be obtained from their respective administrativeoffices. Addresses and other additional information about the State’s component units are presented in Note 1-B to thefinancial statements.
The government-wide financial statements are prepared using the flow of economic resources measurement focus and theaccrual basis of accounting. The accrual basis of accounting, which is similar to the methods used by most businesses, takesinto account all revenues and expenses connected with the fiscal year even if cash involved has not been received or paid.
Fund Financial Statements
The fund financial statements focus on individual parts of the State government, reporting the State's operations in more detailthan the government-wide statements. The basic fund financial statements provide more detailed information on the State'smost significant funds.
The State has three kinds of fund categories. It is important to note that these fund categories use different accountingapproaches and should be interpreted differently.
21
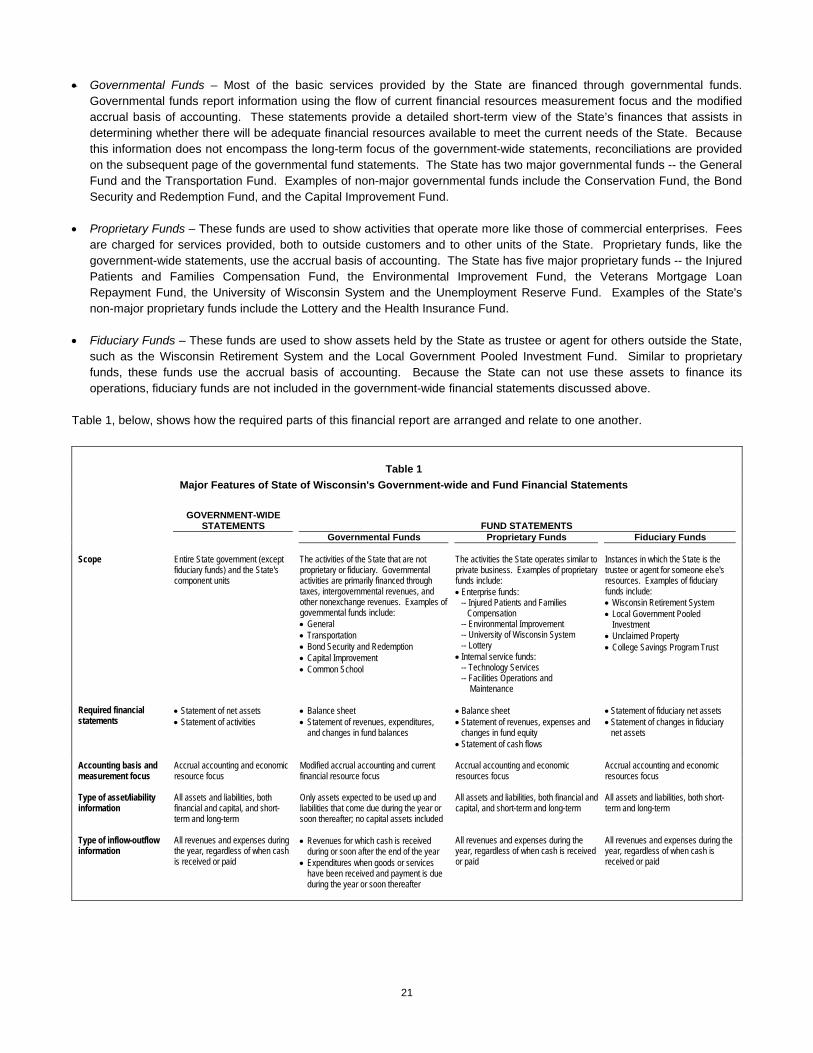
• Governmental Funds – Most of the basic services provided by the State are financed through governmental funds.Governmental funds report information using the flow of current financial resources measurement focus and the modifiedaccrual basis of accounting. These statements provide a detailed short-term view of the State’s finances that assists indetermining whether there will be adequate financial resources available to meet the current needs of the State. Becausethis information does not encompass the long-term focus of the government-wide statements, reconciliations are providedon the subsequent page of the governmental fund statements. The State has two major governmental funds -- the GeneralFund and the Transportation Fund. Examples of non-major governmental funds include the Conservation Fund, the BondSecurity and Redemption Fund, and the Capital Improvement Fund.
• Proprietary Funds – These funds are used to show activities that operate more like those of commercial enterprises. Feesare charged for services provided, both to outside customers and to other units of the State. Proprietary funds, like thegovernment-wide statements, use the accrual basis of accounting. The State has five major proprietary funds -- the InjuredPatients and Families Compensation Fund, the Environmental Improvement Fund, the Veterans Mortgage LoanRepayment Fund, the University of Wisconsin System and the Unemployment Reserve Fund. Examples of the State'snon-major proprietary funds include the Lottery and the Health Insurance Fund.
• Fiduciary Funds – These funds are used to show assets held by the State as trustee or agent for others outside the State,such as the Wisconsin Retirement System and the Local Government Pooled Investment Fund. Similar to proprietaryfunds, these funds use the accrual basis of accounting. Because the State can not use these assets to finance itsoperations, fiduciary funds are not included in the government-wide financial statements discussed above.
Table 1, below, shows how the required parts of this financial report are arranged and relate to one another.
Table 1Major Features of State of Wisconsin's Government-wide and Fund Financial Statements
GOVERNMENT-WIDESTATEMENTS FUND STATEMENTS
Governmental Funds Proprietary Funds Fiduciary Funds
Scope Entire State government (exceptfiduciary funds) and the State'scomponent units
The activities of the State that are notproprietary or fiduciary. Governmentalactivities are primarily financed throughtaxes, intergovernmental revenues, andother nonexchange revenues. Examples ofgovernmental funds include:• General • Transportation • Bond Security and Redemption • Capital Improvement • Common School
The activities the State operates similar toprivate business. Examples of proprietaryfunds include:• Enterprise funds:
-- Injured Patients and FamiliesCompensation
-- Environmental Improvement -- University of Wisconsin System-- Lottery
• Internal service funds:-- Technology Services -- Facilities Operations and
Maintenance
Instances in which the State is thetrustee or agent for someone else'sresources. Examples of fiduciaryfunds include:• Wisconsin Retirement System • Local Government Pooled
Investment • Unclaimed Property • College Savings Program Trust
Required financialstatements
• Statement of net assets• Statement of activities
• Balance sheet• Statement of revenues, expenditures,
and changes in fund balances
• Balance sheet• Statement of revenues, expenses and
changes in fund equity• Statement of cash flows
• Statement of fiduciary net assets• Statement of changes in fiduciary
net assets
Accounting basis andmeasurement focus
Accrual accounting and economicresource focus
Modified accrual accounting and currentfinancial resource focus
Accrual accounting and economicresources focus
Accrual accounting and economicresources focus
Type of asset/liabilityinformation
All assets and liabilities, bothfinancial and capital, and short-term and long-term
Only assets expected to be used up andliabilities that come due during the year orsoon thereafter; no capital assets included
All assets and liabilities, both financial andcapital, and short-term and long-term
All assets and liabilities, both short-term and long-term
Type of inflow-outflowinformation
All revenues and expenses duringthe year, regardless of when cashis received or paid
• Revenues for which cash is receivedduring or soon after the end of the year
• Expenditures when goods or serviceshave been received and payment is dueduring the year or soon thereafter
All revenues and expenses during theyear, regardless of when cash is receivedor paid
All revenues and expenses during theyear, regardless of when cash isreceived or paid
22
Additional Required Supplementary Information
In addition to this Management’s Discussion and Analysis, which is required supplementary information, the basic financialstatements are followed by a section of required supplemental information that further explains and supports the information inthe financial statements. The required supplementary information includes (1) condition and maintenance data regarding theState's infrastructure, and (2) a budgetary comparison schedule of the General and the Transportation funds, includingreconciliations between the statutory and GAAP fund balances at fiscal year-end.
Other Supplementary Information
The Other Supplementary Information includes combining financial statements for nonmajor governmental funds, nonmajorenterprise funds, internal service funds and fiduciary funds, each of which are added together and presented in single columnsin the basic financial statements.

23
FINANCIAL ANALYSIS OF THE STATE AS A WHOLE
Tables 2 and 3, below, present summary information of the State’s net assets and changes in net assets.
Net Assets
As presented in Table 2, total assets of the State on June 30, 2004 were $28.5 billion, while total liabilities were $17.7 billion,resulting in combined net assets (government and business-type activities) of $10.9 billion. The largest component of theState’s total net assets, $14.0 billion or approximately 129.1 percent, reflects its investment in capital assets (i.e., land,buildings, equipment, infrastructure, and others), less any related debt outstanding that was needed to acquire or construct theassets. Approximately $4.2 billion of net assets were restricted by external sources or the State Constitution, and were notavailable to finance the day-to-day operations of the State.
The unrestricted net assets, which, if positive, could be used at the State’s discretion, showed a negative balance of $(7.3)billion. Therefore, based on this measurement, no funds were available for discretionary purposes. A contributing factor to thenegative balance is that governments recognize a liability on the government-wide statement of net assets as soon as anobligation is incurred. While financing focuses on when a liability will be paid, accounting is primarily concerned with when aliability is incurred. Accordingly, the State recognizes long-term liabilities (such as general obligation debt, compensatedabsences, and future benefits and loss liabilities – listed In Note 10 to the financial statements) on the statement of net assets.In addition to the effect of reporting long-term liabilities when incurred, the General Fund’s total deficit fund balance of $(1.9)billion at year-end, as discussed on Page 27, also contributed to the deficit unrestricted net assets reported in the statement ofnet assets.
During Fiscal Year 2004, the State issued $1.8 billion of General Fund annual appropriation bonds to pay the unfundedaccrued prior service (pension) liability and the unfunded accrued liability for sick leave conversion credits. Further, the Stateissued $1.3 billion of general obligation bonds and global certificates, primarily for the acquisition or improvement of land.General Obligation Bonds outstanding at June 30, 2004 totaled $4.4 billion. Outstanding revenue bonds, which are notconsidered general obligation debt of the State, were $3.8 billion at June 30, 2004.
Table 2Net Assets(in millions)
TotalGovernmental Business-type Percentage
Activities Activities Total Change2004 2003 2004 2003 2004 2003 2004-2003
Current and Other Assets $ 5,040.5 $ 4,658.3 $ 6,408.3 $ 6,473.3 $ 11,448.8 $ 11,131.6 2.8 %Capital Assets 13,756.7 13,316.0 3,326.3 3,132.8 17,082.9 16,448.9 3.9 Total Assets 18,797.2 17,974.3 9,734.5 9,606.2 28,531.7 27,580.4 3.4
Long-term Liabilities 8,749.0 6,975.6 2,910.8 2,830.8 11,659.8 9,806.4 18.9Other Liabilities 5,356.4 5,350.8 661.6 630.1 6,018.0 5,980.9 0.6 Total Liabilities 14,105.4 12,326.4 3,572.4 3,460.9 17,677.8 15,787.3 12.0
Net Assets: Invested in Capital Assets Net of Related Debt 11,146.1 11,084.9 2,870.4 2,830.7 14,016.5 13,915.6 0.7 Restricted 1,321.9 (652.4) 2,852.4 3,012.9 4,174.3 2,360.5 76.8 Unrestricted (deficit) (7,776.2) (4,784.6) 439.3 301.7 (7,336.9) (4,482.9) 63.7 Total Net Assets $ 4,691.8 $ 5,647.9 $ 6,162.2 $ 6,145.3 $ 10,853.9 $ 11,793.2 (8.0)
24
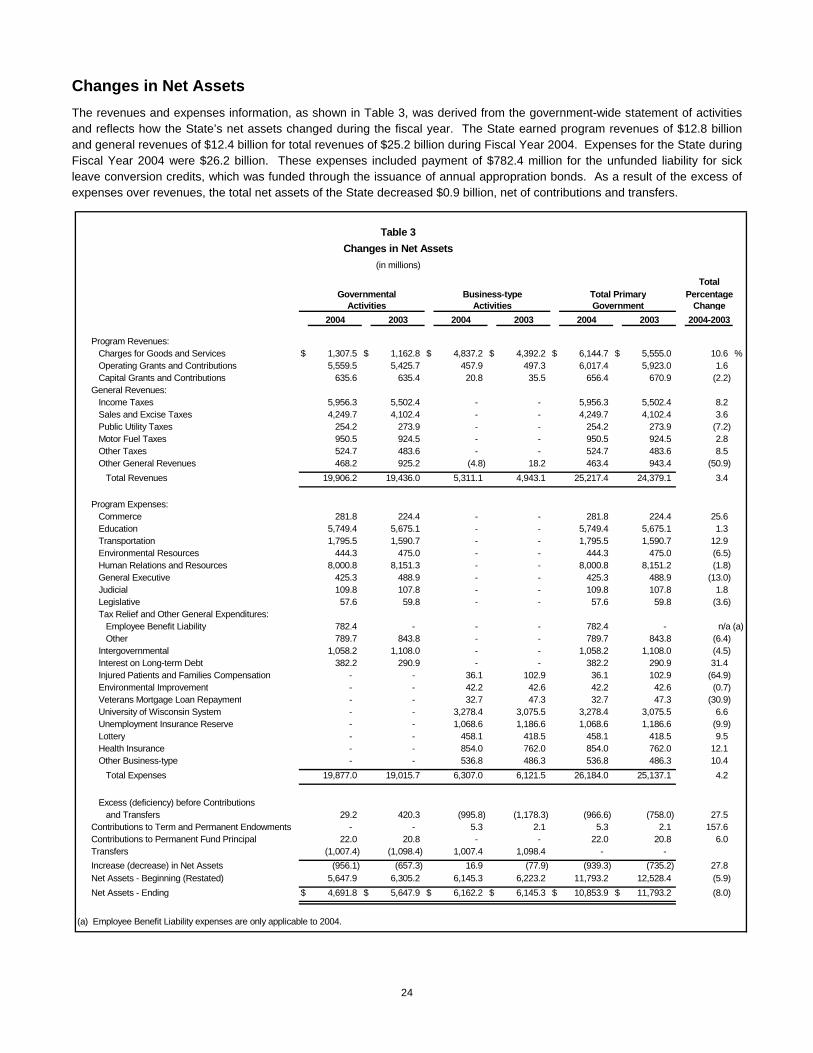
Changes in Net AssetsThe revenues and expenses information, as shown in Table 3, was derived from the government-wide statement of activitiesand reflects how the State’s net assets changed during the fiscal year. The State earned program revenues of $12.8 billionand general revenues of $12.4 billion for total revenues of $25.2 billion during Fiscal Year 2004. Expenses for the State duringFiscal Year 2004 were $26.2 billion. These expenses included payment of $782.4 million for the unfunded liability for sickleave conversion credits, which was funded through the issuance of annual appropration bonds. As a result of the excess ofexpenses over revenues, the total net assets of the State decreased $0.9 billion, net of contributions and transfers.
Table 3Changes in Net Assets
(in millions)
TotalGovernmental Business-type Total Primary Percentage
Activities Activities Government Change2004 2003 2004 2003 2004 2003 2004-2003
Program Revenues: Charges for Goods and Services $ 1,307.5 $ 1,162.8 $ 4,837.2 $ 4,392.2 $ 6,144.7 $ 5,555.0 10.6 % Operating Grants and Contributions 5,559.5 5,425.7 457.9 497.3 6,017.4 5,923.0 1.6 Capital Grants and Contributions 635.6 635.4 20.8 35.5 656.4 670.9 (2.2)General Revenues: Income Taxes 5,956.3 5,502.4 - - 5,956.3 5,502.4 8.2 Sales and Excise Taxes 4,249.7 4,102.4 - - 4,249.7 4,102.4 3.6 Public Utility Taxes 254.2 273.9 - - 254.2 273.9 (7.2) Motor Fuel Taxes 950.5 924.5 - - 950.5 924.5 2.8 Other Taxes 524.7 483.6 - - 524.7 483.6 8.5 Other General Revenues 468.2 925.2 (4.8) 18.2 463.4 943.4 (50.9) Total Revenues 19,906.2 19,436.0 5,311.1 4,943.1 25,217.4 24,379.1 3.4
Program Expenses: Commerce 281.8 224.4 - - 281.8 224.4 25.6 Education 5,749.4 5,675.1 - - 5,749.4 5,675.1 1.3 Transportation 1,795.5 1,590.7 - - 1,795.5 1,590.7 12.9 Environmental Resources 444.3 475.0 - - 444.3 475.0 (6.5) Human Relations and Resources 8,000.8 8,151.3 - - 8,000.8 8,151.2 (1.8) General Executive 425.3 488.9 - - 425.3 488.9 (13.0) Judicial 109.8 107.8 - - 109.8 107.8 1.8 Legislative 57.6 59.8 - - 57.6 59.8 (3.6) Tax Relief and Other General Expenditures: Employee Benefit Liability 782.4 - - - 782.4 - n/a (a) Other 789.7 843.8 - - 789.7 843.8 (6.4) Intergovernmental 1,058.2 1,108.0 - - 1,058.2 1,108.0 (4.5) Interest on Long-term Debt 382.2 290.9 - - 382.2 290.9 31.4 Injured Patients and Families Compensation - - 36.1 102.9 36.1 102.9 (64.9) Environmental Improvement - - 42.2 42.6 42.2 42.6 (0.7) Veterans Mortgage Loan Repayment - - 32.7 47.3 32.7 47.3 (30.9) University of Wisconsin System - - 3,278.4 3,075.5 3,278.4 3,075.5 6.6 Unemployment Insurance Reserve - - 1,068.6 1,186.6 1,068.6 1,186.6 (9.9) Lottery - - 458.1 418.5 458.1 418.5 9.5 Health Insurance - - 854.0 762.0 854.0 762.0 12.1 Other Business-type - - 536.8 486.3 536.8 486.3 10.4 Total Expenses 19,877.0 19,015.7 6,307.0 6,121.5 26,184.0 25,137.1 4.2
Excess (deficiency) before Contributions and Transfers 29.2 420.3 (995.8) (1,178.3) (966.6) (758.0) 27.5Contributions to Term and Permanent Endowments - - 5.3 2.1 5.3 2.1 157.6Contributions to Permanent Fund Principal 22.0 20.8 - - 22.0 20.8 6.0Transfers (1,007.4) (1,098.4) 1,007.4 1,098.4 - - Increase (decrease) in Net Assets (956.1) (657.3) 16.9 (77.9) (939.3) (735.2) 27.8Net Assets - Beginning (Restated) 5,647.9 6,305.2 6,145.3 6,223.2 11,793.2 12,528.4 (5.9)Net Assets - Ending $ 4,691.8 $ 5,647.9 $ 6,162.2 $ 6,145.3 $ 10,853.9 $ 11,793.2 (8.0)
(a) Employee Benefit Liability expenses are only applicable to 2004.
25
Governmental ActivitiesThe net assets of governmental activities decreased $1.0 billion in Fiscal Year 2004. Revenues for the governmental activities(including Contributions to Permanent Fund Principal) totaled $19.9 billion, while expenses and net transfers totaled $20.9billion in 2004.
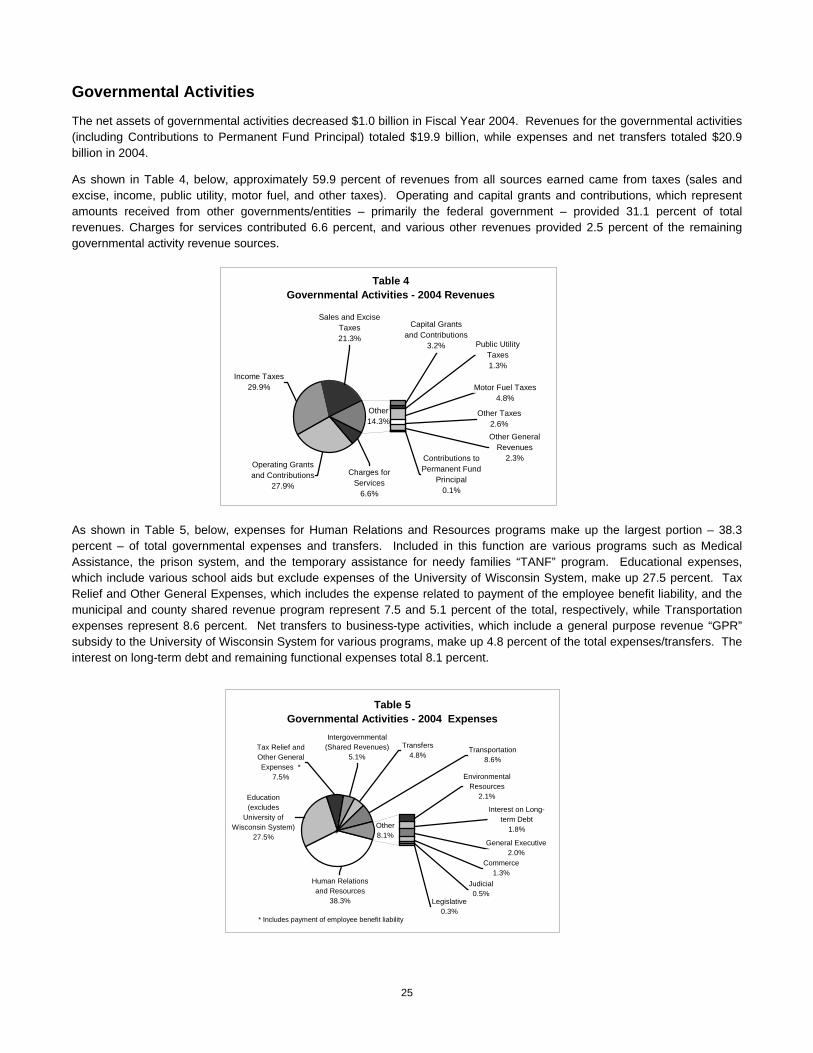
As shown in Table 4, below, approximately 59.9 percent of revenues from all sources earned came from taxes (sales andexcise, income, public utility, motor fuel, and other taxes). Operating and capital grants and contributions, which representamounts received from other governments/entities – primarily the federal government – provided 31.1 percent of totalrevenues. Charges for services contributed 6.6 percent, and various other revenues provided 2.5 percent of the remaininggovernmental activity revenue sources.
As shown in Table 5, below, expenses for Human Relations and Resources programs make up the largest portion – 38.3percent – of total governmental expenses and transfers. Included in this function are various programs such as MedicalAssistance, the prison system, and the temporary assistance for needy families “TANF” program. Educational expenses,which include various school aids but exclude expenses of the University of Wisconsin System, make up 27.5 percent. TaxRelief and Other General Expenses, which includes the expense related to payment of the employee benefit liability, and themunicipal and county shared revenue program represent 7.5 and 5.1 percent of the total, respectively, while Transportationexpenses represent 8.6 percent. Net transfers to business-type activities, which include a general purpose revenue “GPR”subsidy to the University of Wisconsin System for various programs, make up 4.8 percent of the total expenses/transfers. Theinterest on long-term debt and remaining functional expenses total 8.1 percent.
Table 4Governmental Activities - 2004 Revenues
Other14.3%
Charges for Services
6.6%
Operating Grants and Contributions
27.9%
Capital Grants and Contributions
3.2%
Income Taxes29.9%
Sales and Excise Taxes21.3%
Motor Fuel Taxes4.8%
Public Utility Taxes1.3%
Other Taxes2.6%Other General
Revenues2.3%Contributions to
Permanent Fund Principal
0.1%
Table 5 Governmental Activities - 2004 Expenses
Other8.1%
Tax Relief and Other General Expenses *
7.5%
Intergovernmental (Shared Revenues)
5.1%Transfers
4.8%
Human Relations and Resources
38.3%
Education (excludes
University of Wisconsin System)
27.5%General Executive
2.0%Commerce
1.3%
Interest on Long-term Debt
1.8%
Judicial0.5%
Environmental Resources
2.1%
Transportation8.6%
Legislative0.3%
* Includes payment of employee benefit liability
26
Business-Type Activities
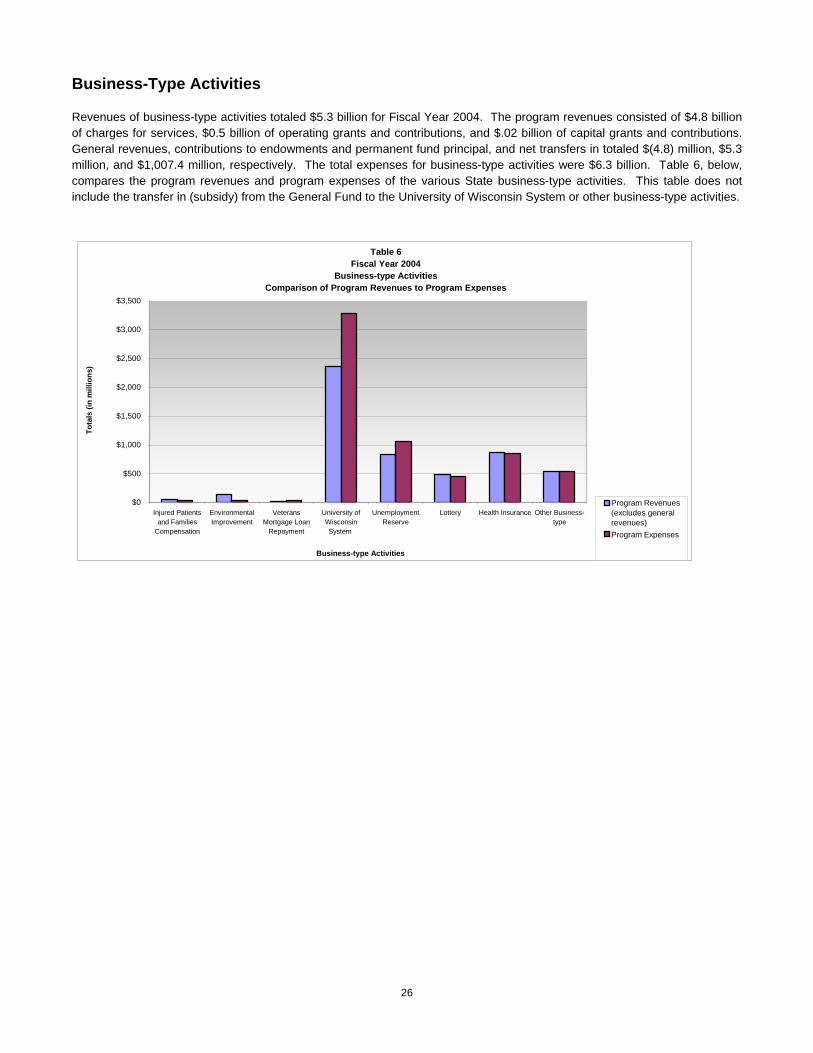
Revenues of business-type activities totaled $5.3 billion for Fiscal Year 2004. The program revenues consisted of $4.8 billionof charges for services, $0.5 billion of operating grants and contributions, and $.02 billion of capital grants and contributions.General revenues, contributions to endowments and permanent fund principal, and net transfers in totaled $(4.8) million, $5.3million, and $1,007.4 million, respectively. The total expenses for business-type activities were $6.3 billion. Table 6, below,compares the program revenues and program expenses of the various State business-type activities. This table does notinclude the transfer in (subsidy) from the General Fund to the University of Wisconsin System or other business-type activities.
Table 6Fiscal Year 2004
Business-type ActivitiesComparison of Program Revenues to Program Expenses
$0
$500
$1,000
$1,500
$2,000
$2,500
$3,000
$3,500
Injured Patientsand Families
Compensation
EnvironmentalImprovement
VeteransMortgage Loan
Repayment
University ofWisconsinSystem
UnemploymentReserve
Lottery Health Insurance Other Business-type
Business-type Activities
Tota
ls (i
n m
illio
ns)
Program Revenues(excludes generalrevenues)Program Expenses

27
FINANCIAL ANALYSIS OF THE STATE'S INDIVIDUAL FUNDS
Governmental Funds
At the end of Fiscal Year 2004, the State's governmental funds reported a combined fund balance of $(741.3) million. Fundswith significant changes in fund balance are discussed below:
General Fund
The General Fund is the chief operating fund of the State. At June 30 2004, the State's General Fund reported a total funddeficit of $(1,931.1) million. The net change in fund balance during Fiscal Year 2004 was $307.7 million, in contrast to$(753.1) million in Fiscal Year 2003. Major revenue, expenditure and other sources/uses contributing to the change in fundbalance are as follows:
Revenues
Revenues of the General Fund totaled $16,794.6 million in Fiscal Year 2004, an increase of $95.2 million from Fiscal Year2003. Factors contributing to the increase included the following:
• Revenues from taxes increased $609.3 million from Fiscal Year 2003 to Fiscal Year 2004. The most significantincrease related to individual income tax withholdings, which increased $179.8 million or 3.5 percent. This increasewas due to the growth in employment and wages in the State during that period.
• Intergovernmental revenues (e.g., federal assistance) increased $105.6 million in Fiscal Year 2004, primarily due toan increase in expenditures that were eligible for Federal reimbursement. These items included an increase inbenefits paid related to Medical Assistance and the Waiver Program.
• Intergovernmental transfers in the General Fund decreased $598.6 million during Fiscal Year 2004. This decreasereflects two changes related to intergovernmental transfers. Starting in Fiscal Year 2004, these transfers areaccounted for in the Medical Assistance Trust Fund, a special revenue fund, rather than the General Fund. (Thisspecial revenue fund reported a fund deficit of $(176.3) million at June 30, 2004.) Further, intergovernmentaltransfers declined significantly between fiscal years 2003 and 2004 due to a decrease in the supplementary nursinghome Medical Assistance payments that could have been received from the federal government as a result ofintergovernmental transfers between the State and certain counties. These transfers declined from $598.6 million inFiscal Year 2003 to $95.0 million in Fiscal Year 2004.
• In Fiscal Year 2003, Tobacco Settlement revenues of $153.9 million were reported in the General Fund. In FiscalYear 2004, tobacco settlement revenues are directed to the Badger Tobacco Asset Securitization Corporation, toprovide debt service for the bonds issued in 2002 to securitize future revenue.
• Other revenues, such as charges for goods and services, and gifts and grants increased $132.9 million.
Expenditures
Expenditures of the General Fund totaled $17,152.6 million in Fiscal Year 2004, an increase of $957.0 million from FiscalYear 2003. The factors contributing to the increase included the following:
• An increase in Tax Relief and Other General expenditures of $1,487.6 million relating to the payment of employeebenefits for the unfunded accrued prior service (pension) liability and the unfunded accrued liability for sick leaveconversion credits. This was funded by the issuance of General Fund annual appropriation bonds discussed below.
• A decrease in human relations and resources expenditures of $546.1 million primarily resulted from the shift of aportion of medical assistance payments to the Medical Assistance Trust fund.
• Other functional expenditures increased $15.5 million.
28
Other Financing Sources and Uses
Other financing sources/uses and increases/decreases totaled a net $665.7 million in Fiscal Year 2004, a change of$1,922.6 million from the prior year. The components of this change included the following:
• In Fiscal Year 2004, the State issued annual appropriation bonds to pay the unfunded accrued prior service (pension)liability and the unfunded accrued liability for sick leave conversion credits. Net proceeds of the $1,506.3 million wererecorded in the General Fund.
• The State transferred to the General Fund $230.0 million from the Transportation Fund and $17.6 million from theUtility Public Benefits Fund in this fiscal year. These moneys were used to fund a portion of the Fiscal Year 2004shared revenue payments to local governments.
• The transfer of $287.1 million in Fiscal Year 2003 from the Tobacco Settlement Endowment Fund was the finalportion of the proceeds from the sale of the State’s right to the Attorneys General Master Settlement Agreement of1998. Therefore, similar transfers were not reported in Fiscal Year 2004.
• During Fiscal Year 2004, transfers from various funds to the General Fund, relating to the reduction in expendituresexperienced from the issuance of the annual appropriation bonds, totaled $48.0 million. This is in contrast to the$38.6 million transferred from various funds to the General Fund in Fiscal Year 2003 for contributions initiallyintended to be paid to the accumulated sick leave program.
• Transfers out of the General Fund totaled $1,347.6 million, a decrease of $399.2 million from the prior year. Themajority of this decrease relates to a reduction in transfers out to the Medical Assistance Trust and Bond Security andRedemption Funds of $146.2 million and $169.3 million, respectively.
• Other financing sources/uses and other increases/decreases resulted in a net increase of $47.2 million from the priorfiscal year.
As of June 30, 2004, the General Fund reported a deficit of $(2,296.8) million in its “Unreserved” Fund Balance. Thiscompares to a General Fund Unreserved Fund Deficit of $(2,638.2) million as of June 30, 2003. A deficit unreserved fundbalance represents the excess of the liabilities of the General Fund over its assets and reserved fund balance accounts.Reservations of fund balances of governmental funds represent amounts that are not available for appropriation. Examples offund balance reservations reported in the General Fund include reserves for encumbrances, inventories and prepaid items.
General Fund Budgetary Highlights
Differences between the original budget and the final amended budget were significant (a $2.8 billion increase inappropriations). This was due primarily to the fact that several of the State’s programs (including annual appropriation bondproceeds for the unfunded prior service (pension) liability and accumulated sick leave program, the transfer to the MedicalAssistance Trust Fund, Food Stamps and certain Local Aids - see the items denoted with *, below) are not included in theoriginal budget. In addition, numerous adjustments to spending estimates were needed as the year progressed because ofchanging circumstances (spending needs can change dramatically over a one-year period). The largest variances incurred inthe following programs (in millions):
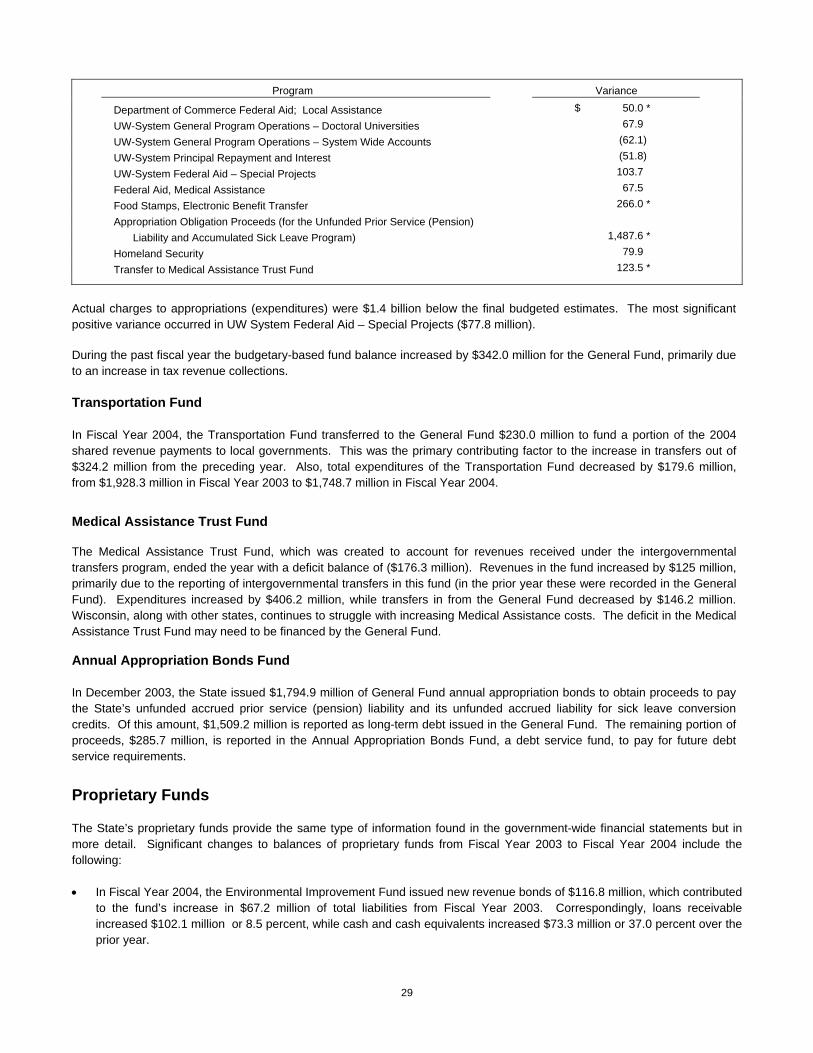
29
Program Variance
Department of Commerce Federal Aid; Local Assistance $ 50.0 *UW-System General Program Operations – Doctoral Universities 67.9UW-System General Program Operations – System Wide Accounts (62.1)UW-System Principal Repayment and Interest (51.8)UW-System Federal Aid – Special Projects 103.7Federal Aid, Medical Assistance 67.5Food Stamps, Electronic Benefit Transfer 266.0 *Appropriation Obligation Proceeds (for the Unfunded Prior Service (Pension)
Liability and Accumulated Sick Leave Program) 1,487.6 *Homeland Security 79.9Transfer to Medical Assistance Trust Fund 123.5 *
Actual charges to appropriations (expenditures) were $1.4 billion below the final budgeted estimates. The most significantpositive variance occurred in UW System Federal Aid – Special Projects ($77.8 million).
During the past fiscal year the budgetary-based fund balance increased by $342.0 million for the General Fund, primarily dueto an increase in tax revenue collections.
Transportation Fund
In Fiscal Year 2004, the Transportation Fund transferred to the General Fund $230.0 million to fund a portion of the 2004shared revenue payments to local governments. This was the primary contributing factor to the increase in transfers out of$324.2 million from the preceding year. Also, total expenditures of the Transportation Fund decreased by $179.6 million,from $1,928.3 million in Fiscal Year 2003 to $1,748.7 million in Fiscal Year 2004.
Medical Assistance Trust Fund
The Medical Assistance Trust Fund, which was created to account for revenues received under the intergovernmentaltransfers program, ended the year with a deficit balance of ($176.3 million). Revenues in the fund increased by $125 million,primarily due to the reporting of intergovernmental transfers in this fund (in the prior year these were recorded in the GeneralFund). Expenditures increased by $406.2 million, while transfers in from the General Fund decreased by $146.2 million.Wisconsin, along with other states, continues to struggle with increasing Medical Assistance costs. The deficit in the MedicalAssistance Trust Fund may need to be financed by the General Fund.
Annual Appropriation Bonds Fund
In December 2003, the State issued $1,794.9 million of General Fund annual appropriation bonds to obtain proceeds to paythe State’s unfunded accrued prior service (pension) liability and its unfunded accrued liability for sick leave conversioncredits. Of this amount, $1,509.2 million is reported as long-term debt issued in the General Fund. The remaining portion ofproceeds, $285.7 million, is reported in the Annual Appropriation Bonds Fund, a debt service fund, to pay for future debtservice requirements.
Proprietary Funds
The State’s proprietary funds provide the same type of information found in the government-wide financial statements but inmore detail. Significant changes to balances of proprietary funds from Fiscal Year 2003 to Fiscal Year 2004 include thefollowing:
• In Fiscal Year 2004, the Environmental Improvement Fund issued new revenue bonds of $116.8 million, which contributedto the fund’s increase in $67.2 million of total liabilities from Fiscal Year 2003. Correspondingly, loans receivableincreased $102.1 million or 8.5 percent, while cash and cash equivalents increased $73.3 million or 37.0 percent over theprior year.
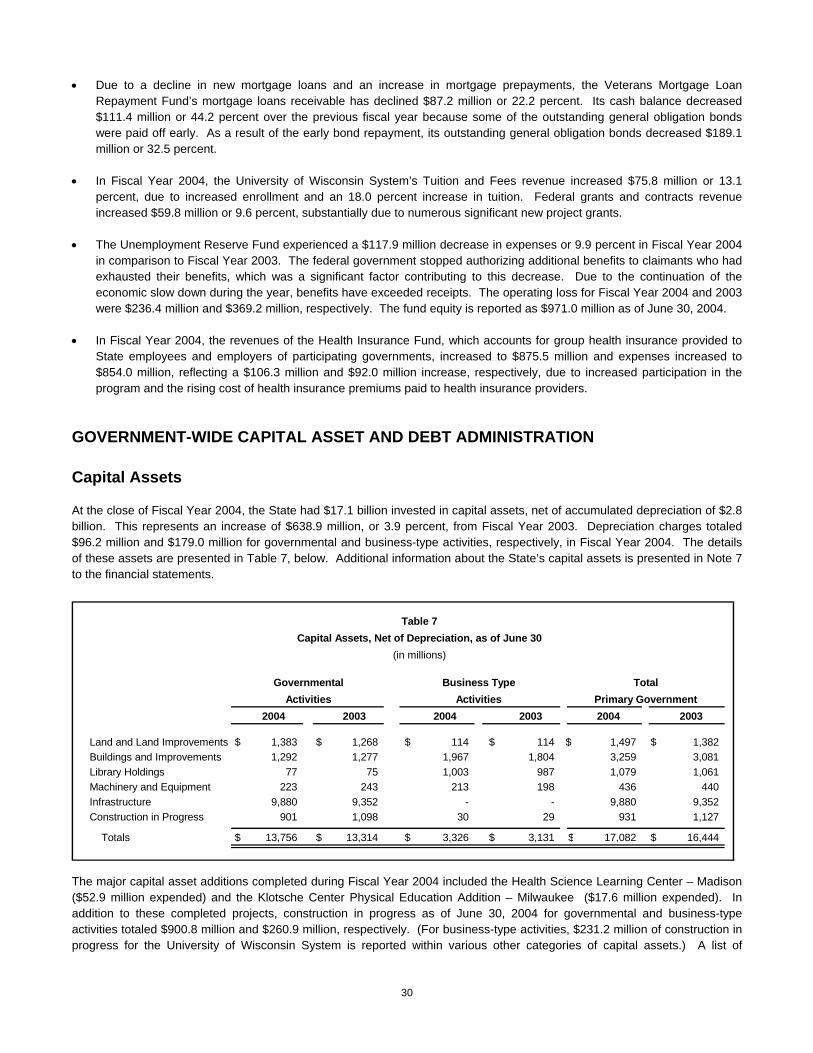
30
• Due to a decline in new mortgage loans and an increase in mortgage prepayments, the Veterans Mortgage LoanRepayment Fund’s mortgage loans receivable has declined $87.2 million or 22.2 percent. Its cash balance decreased$111.4 million or 44.2 percent over the previous fiscal year because some of the outstanding general obligation bondswere paid off early. As a result of the early bond repayment, its outstanding general obligation bonds decreased $189.1million or 32.5 percent.
• In Fiscal Year 2004, the University of Wisconsin System’s Tuition and Fees revenue increased $75.8 million or 13.1percent, due to increased enrollment and an 18.0 percent increase in tuition. Federal grants and contracts revenueincreased $59.8 million or 9.6 percent, substantially due to numerous significant new project grants.
• The Unemployment Reserve Fund experienced a $117.9 million decrease in expenses or 9.9 percent in Fiscal Year 2004in comparison to Fiscal Year 2003. The federal government stopped authorizing additional benefits to claimants who hadexhausted their benefits, which was a significant factor contributing to this decrease. Due to the continuation of theeconomic slow down during the year, benefits have exceeded receipts. The operating loss for Fiscal Year 2004 and 2003were $236.4 million and $369.2 million, respectively. The fund equity is reported as $971.0 million as of June 30, 2004.
• In Fiscal Year 2004, the revenues of the Health Insurance Fund, which accounts for group health insurance provided toState employees and employers of participating governments, increased to $875.5 million and expenses increased to$854.0 million, reflecting a $106.3 million and $92.0 million increase, respectively, due to increased participation in theprogram and the rising cost of health insurance premiums paid to health insurance providers.
GOVERNMENT-WIDE CAPITAL ASSET AND DEBT ADMINISTRATION
Capital Assets
At the close of Fiscal Year 2004, the State had $17.1 billion invested in capital assets, net of accumulated depreciation of $2.8billion. This represents an increase of $638.9 million, or 3.9 percent, from Fiscal Year 2003. Depreciation charges totaled$96.2 million and $179.0 million for governmental and business-type activities, respectively, in Fiscal Year 2004. The detailsof these assets are presented in Table 7, below. Additional information about the State’s capital assets is presented in Note 7to the financial statements.
The major capital asset additions completed during Fiscal Year 2004 included the Health Science Learning Center – Madison($52.9 million expended) and the Klotsche Center Physical Education Addition – Milwaukee ($17.6 million expended). Inaddition to these completed projects, construction in progress as of June 30, 2004 for governmental and business-typeactivities totaled $900.8 million and $260.9 million, respectively. (For business-type activities, $231.2 million of construction inprogress for the University of Wisconsin System is reported within various other categories of capital assets.) A list of
Table 7 Capital Assets, Net of Depreciation, as of June 30
(in millions)
Governmental Business Type TotalActivities Activities Primary Government
2004 2003 2004 2003 2004 2003
Land and Land Improvements $ 1,383 $ 1,268 $ 114 $ 114 $ 1,497 $ 1,382 Buildings and Improvements 1,292 1,277 1,967 1,804 3,259 3,081 Library Holdings 77 75 1,003 987 1,079 1,061 Machinery and Equipment 223 243 213 198 436 440 Infrastructure 9,880 9,352 - - 9,880 9,352 Construction in Progress 901 1,098 30 29 931 1,127
Totals $ 13,756 $ 13,314 $ 3,326 $ 3,131 $ 17,082 $ 16,444

31
construction in progress projects is provided in Note 7. The State’s continuing or proposed major capital projects for FiscalYear 2005 include the Camp Randall Stadium Renovation – Madison (estimated budget of $107.4 million, the MicrobiologicalScience Building – Madison (estimated budget of $108.7 million), and the Interdisciplinary Research Center – Madison(estimated budget of $133.9 million).
Debt Administration
The State of Wisconsin Building Commission, an agency of the State, is empowered by law to consider, act upon, authorize,issue and sell all debt obligations of the State. The total general obligation debt outstanding for the State as of June 30, 2004was $4.4 billion, as shown in Table 8.
During Fiscal Year 2004, $1,305.1 million of these general obligation bonds were issued to provide for the acquisition orimprovement of land, water, property, highways, buildings, equipment, or facilities for public purposes and refund currentoutstanding bonds.
In addition, the State issued $1,794.9 million of annual appropriation bonds to obtain proceeds to pay the State’s unfundedaccrued prior service (pension) liability under Wis. Stat. Section 40.05(2)(b) and its unfunded accrued liability for sick leaveconversion credits under Wis. Stat. Section 40.05 (4)(b), (bc) and (bw).
Chapter 18 of the Wisconsin Statutes authorizes the State to issue revenue obligations. These obligations, which are notgeneral obligation debt of the State, are secured by a pledge of revenues or property derived from the operations of a programfunded by the issuance of the obligations. Revenue bonds of the primary government totaled $3.8 billion outstanding at June30, 2004, as shown in Table 8. These bonds included $1,359.8 million of Transportation Revenue Bonds, $224.7 million ofPetroleum Inspection Revenue Bonds, $692.1 million of Environmental Improvement Revenue Bonds, and $1,567.0 million ofBadger Tobacco Asset Securitization Corporation bonds.
Based on the application of the criteria contained in GASB Statement No. 14, as amended by GASB Statement No. 39 andclarified by GASB Technical Bulletin No. 2004-1, the Badger Tobacco Asset Securitization Corporation (BTASC), previouslyreported as a discretely presented component unit, is reported as a blended component unit in a debt service fund. Thebylaws of BTASC require that the corporation hold itself apart and separate from the State of Wisconsin. Bonds issued by theBTASC are the sole obligation of the BTASC. The State is not legally liable for payment of principal and interest on thesebonds nor is the debt dependent upon any dedicated stream of revenue generated by the State.
Table 8Outstanding Debt as of June 30, 2004 and 2003
(in millions)
Governmental Business-TypeActivities Activities Total
2004 2003 2004 2003 2004 2003
General obligation bonds and notes $ 3,560.2 $ 3,090.9 $ 859.3 $ 913.5 $ 4,419.5 $ 4,004.4Annual appropriation bonds 1,792.1 -- -- -- 1,792.1 --Revenue bonds and notes 3,151.5 2,892.6 692.1 623.4 3,843.6 3,516.0
Totals $ 8,503.8 $ 5,983.5 $ 1,551.4 $ 1,536.9 $ 10,055.2 $ 7,520.4
Article VIII of the Wisconsin Constitution and Wis. Stat. Sec. 18.05 limits the amount of general obligation bond debt the Statecan contract in total and in any calendar year. In total, debt cannot exceed five percent of the value of all taxable property inthe State. The amount of debt contracted in any calendar year is limited to the lesser of three-quarters of one percent ofaggregate value of taxable property or five percent of aggregate value of taxable property less net indebtedness at January 1.

32
At June 30, 2004, State of Wisconsin fixed bonds had a rating of Aa3 from Moody's Investors Services, AA- from Standard andPoor's Corporation, and AA- from Fitch Investors Service, L.P. Variable bonds had a rating of P-1 from Moody’s, A-1+ fromStandard and Poor’s Corporation, and F-1+ from Fitch Investors Services, L.P.
Detailed information about the State’s long-term debt activity is presented in Note 11 to the financial statements.
INFRASTRUCTURE -- MODIFIED APPROACH
The State reports infrastructure (i.e., roads, bridges, and buildings considered an ancillary part of roads) as capital assets.The State has elected to report its infrastructure assets (11,200 centerline miles of roads and 4,900 bridges with a combinedvalue of $9.9 billion), using the modified approach. Under this method, infrastructure assets are not required to be depreciatedif the State manages its eligible infrastructure assets using an asset management system designed to maintain and preservethese assets at a condition level established and disclosed by the State.
All infrastructure assets constructed prior to July 1, 2000 have been recorded at estimated historical cost. Historical cost wasdetermined by calculating current costs of a similar asset and deflating that cost, using a price-index, to the estimated averageconstruction date. Infrastructure costs, which exclude right of way, are expressed in 2000 dollars and deflated back to theaverage construction date using the Federal Highway Administration’s composite index for federal-aid highway construction.
In order to adequately serve the traveling public and support the State economy, it is the State’s policy to ensure at least 85percent of the state-owned roads and bridges are in good or fair condition. As of June 30, 2004, 93.9 percent of the roads and94.6 percent of bridges were in good or fair condition, consistent with State policies.
For the fiscal year ended June 30, 2004, actual maintenance and preservation costs for the State’s road network were $341.1million, or $109.7 million less than the estimated amount. On that same date, actual maintenance and preservation costs forthe State’s bridge network were $52.3 million, or $4.5 million more than the estimated amount. In developing estimated costsat the beginning of the fiscal year it is difficult to predict the types of projects that will actually incur costs during the year.Actual maintenance and preservation costs for the road network reflect an unanticipated shift from maintenance/preservationprojects to capital construction projects during the Fiscal Year 2004. In addition, the State of Wisconsin, Department ofTransportation’s multi-year budgeting process, allowing encumbrances to carry forward, makes a comparison of actual toestimated amounts difficult since expenditures for the current year may have been budgeted and committed to a project inprior years.
ECONOMIC FACTORS
In calendar year 2003, the Wisconsin economy stabilized and moved into a sustainable recovery during 2004.
Employment declined slightly in 2003 in Wisconsin, down 0.3 percent. Wisconsin’s employment has been expanding sinceJanuary 2004. Through October 2004, Wisconsin non-farm employment is up 2.1 percent compared to a year ago.Employment losses suffered in the 2000-01 recession have been fully recovered. All private sectors of the economy areadding employment. Unemployment has declined from 5.5 percent in 2003 to 5.0 percent by October 2004.
Personal income growth has improved with the gains in employment. Wisconsin personal income increased 2.8 percent in2002 and 3.1 percent in 2003. Nationally, income growth was 1.8 percent in 2002 and 3.3 percent in 2003. On a per capitabasis, Wisconsin income increased 2.2 percent in 2002 and 2.5 percent in 2003 compared to 0.7 percent and 2.2 percentnationally. Since 2000, Wisconsin’s per capita income has moved closer to the national average from 95.7 percent in 2000 to97.7 percent in 2003. Through the first half of 2004, income growth is averaging 4.0 percent.
Wisconsin’s property values reflect an expanding economy. Real property values increased significantly in 2002 and 2003, up7.5 percent in each year. In 2004, values increased 8.7 percent. Commercial, manufacturing and residential real estate haveall increased significantly in these years.
Inflation in Wisconsin has been modest. As measured by the Milwaukee-Racine CSA consumer price index, inflation in 2003was 2.1 percent. In the first half of 2004, inflation was a moderate 1.1 percent.
33
CONTACTING THE STATE'S FINANCIAL MANAGEMENT
This financial report is designed to provide Wisconsin's citizens, taxpayers, customers, investors and creditors with a generaloverview of the State's finances and to demonstrate the State's accountability for the money it receives. Questions about thisreport or requests for additional financial information should be addressed to: State of Wisconsin, State Controller's Office,101 E. Wilson Street, 5th Floor, Madison, WI 53707.
The State’s component units issue their own separate audited financial statements. These statements may be obtained bydirectly contacting the component unit. You may contact the individual component units through their administrative officesidentified in Note 1-B.
* * * *

34

Basic Financial Statements
35

36
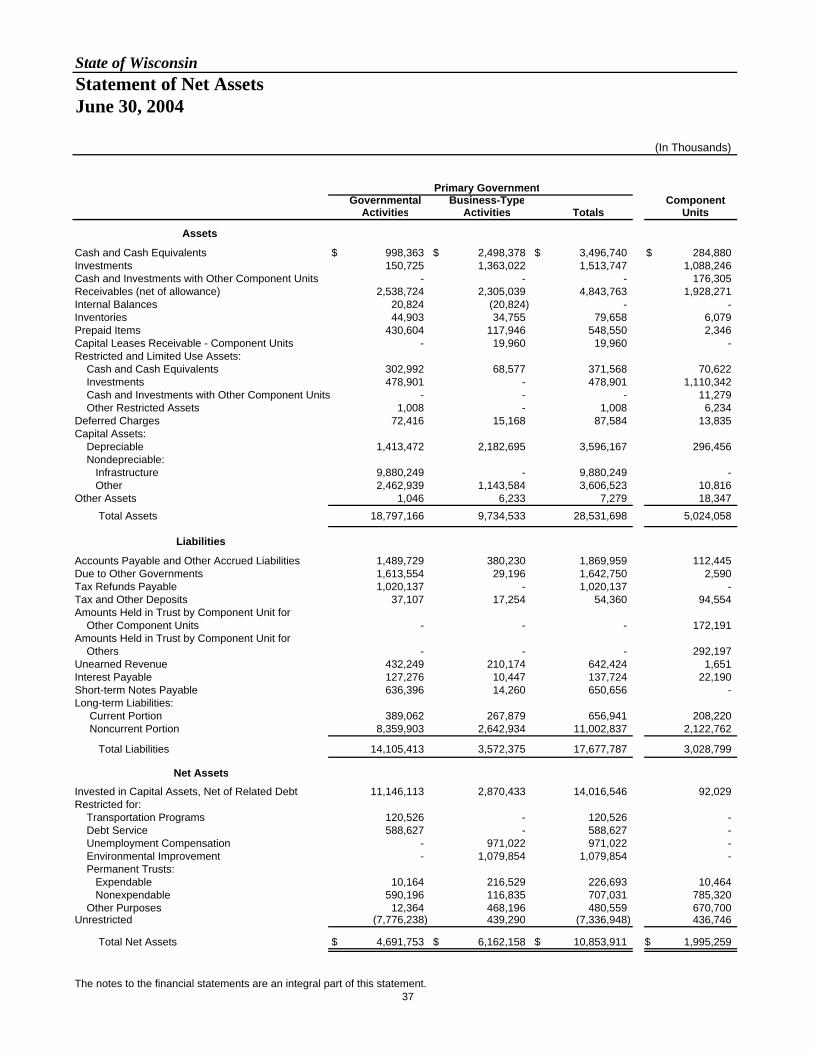
State of WisconsinStatement of Net Assets June 30, 2004
(In Thousands)
Primary GovernmentGovernmental Business-Type Component
Activities Activities Totals Units
Assets
Cash and Cash Equivalents $ 998,363 $ 2,498,378 $ 3,496,740 $ 284,880 Investments 150,725 1,363,022 1,513,747 1,088,246 Cash and Investments with Other Component Units - - - 176,305 Receivables (net of allowance) 2,538,724 2,305,039 4,843,763 1,928,271 Internal Balances 20,824 (20,824) - - Inventories 44,903 34,755 79,658 6,079 Prepaid Items 430,604 117,946 548,550 2,346 Capital Leases Receivable - Component Units - 19,960 19,960 - Restricted and Limited Use Assets: Cash and Cash Equivalents 302,992 68,577 371,568 70,622 Investments 478,901 - 478,901 1,110,342 Cash and Investments with Other Component Units - - - 11,279 Other Restricted Assets 1,008 - 1,008 6,234 Deferred Charges 72,416 15,168 87,584 13,835 Capital Assets: Depreciable 1,413,472 2,182,695 3,596,167 296,456 Nondepreciable: Infrastructure 9,880,249 - 9,880,249 - Other 2,462,939 1,143,584 3,606,523 10,816 Other Assets 1,046 6,233 7,279 18,347 Total Assets 18,797,166 9,734,533 28,531,698 5,024,058
Liabilities
Accounts Payable and Other Accrued Liabilities 1,489,729 380,230 1,869,959 112,445 Due to Other Governments 1,613,554 29,196 1,642,750 2,590 Tax Refunds Payable 1,020,137 - 1,020,137 - Tax and Other Deposits 37,107 17,254 54,360 94,554 Amounts Held in Trust by Component Unit for Other Component Units - - - 172,191 Amounts Held in Trust by Component Unit for Others - - - 292,197 Unearned Revenue 432,249 210,174 642,424 1,651 Interest Payable 127,276 10,447 137,724 22,190 Short-term Notes Payable 636,396 14,260 650,656 - Long-term Liabilities: Current Portion 389,062 267,879 656,941 208,220 Noncurrent Portion 8,359,903 2,642,934 11,002,837 2,122,762
Total Liabilities 14,105,413 3,572,375 17,677,787 3,028,799
Net AssetsInvested in Capital Assets, Net of Related Debt 11,146,113 2,870,433 14,016,546 92,029 Restricted for: Transportation Programs 120,526 - 120,526 - Debt Service 588,627 - 588,627 - Unemployment Compensation - 971,022 971,022 - Environmental Improvement - 1,079,854 1,079,854 - Permanent Trusts: Expendable 10,164 216,529 226,693 10,464 Nonexpendable 590,196 116,835 707,031 785,320 Other Purposes 12,364 468,196 480,559 670,700 Unrestricted (7,776,238) 439,290 (7,336,948) 436,746
Total Net Assets $ 4,691,753 $ 6,162,158 $ 10,853,911 $ 1,995,259
The notes to the financial statements are an integral part of this statement. 37
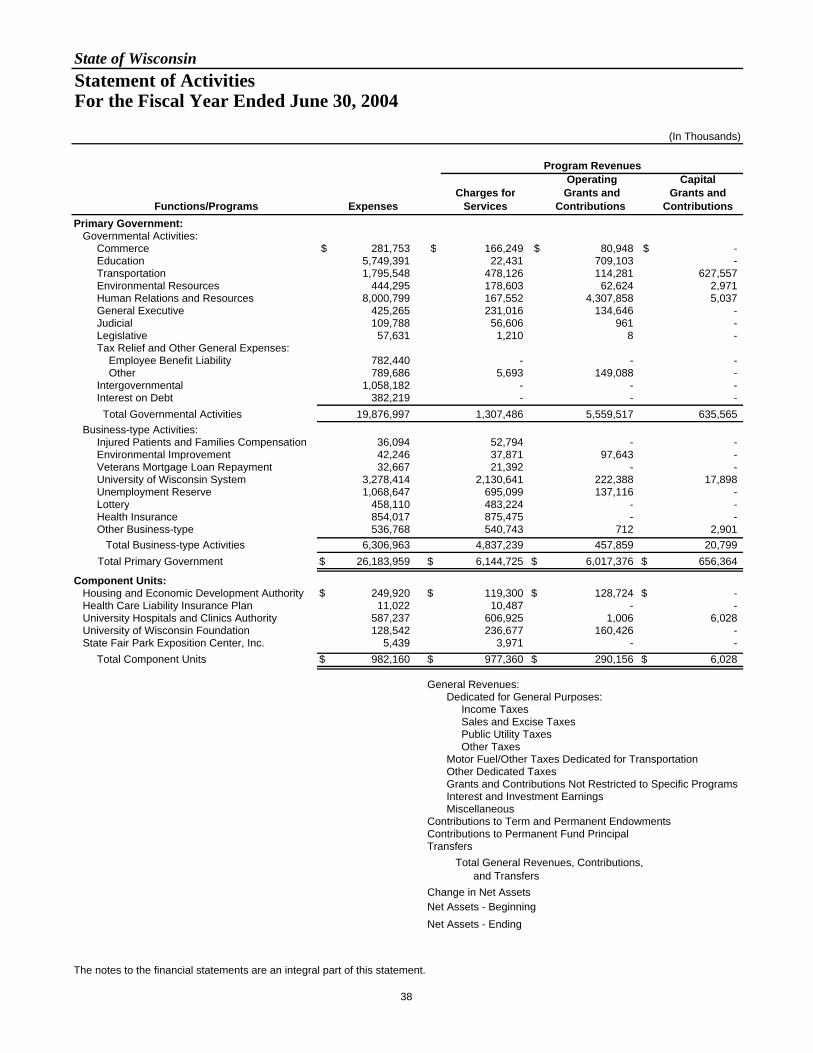
State of WisconsinStatement of Activities For the Fiscal Year Ended June 30, 2004
(In Thousands)
Operating CapitalCharges for Grants and Grants and
Functions/Programs Expenses Services Contributions ContributionsPrimary Government: Governmental Activities:
Commerce $ 281,753 $ 166,249 $ 80,948 $ - Education 5,749,391 22,431 709,103 - Transportation 1,795,548 478,126 114,281 627,557 Environmental Resources 444,295 178,603 62,624 2,971 Human Relations and Resources 8,000,799 167,552 4,307,858 5,037 General Executive 425,265 231,016 134,646 - Judicial 109,788 56,606 961 - Legislative 57,631 1,210 8 - Tax Relief and Other General Expenses: Employee Benefit Liability 782,440 - - - Other 789,686 5,693 149,088 - Intergovernmental 1,058,182 - - - Interest on Debt 382,219 - - - Total Governmental Activities 19,876,997 1,307,486 5,559,517 635,565
Business-type Activities:Injured Patients and Families Compensation 36,094 52,794 - - Environmental Improvement 42,246 37,871 97,643 - Veterans Mortgage Loan Repayment 32,667 21,392 - - University of Wisconsin System 3,278,414 2,130,641 222,388 17,898 Unemployment Reserve 1,068,647 695,099 137,116 - Lottery 458,110 483,224 - - Health Insurance 854,017 875,475 - - Other Business-type 536,768 540,743 712 2,901 Total Business-type Activities 6,306,963 4,837,239 457,859 20,799
Total Primary Government $ 26,183,959 $ 6,144,725 $ 6,017,376 $ 656,364
Component Units: Housing and Economic Development Authority $ 249,920 $ 119,300 $ 128,724 $ - Health Care Liability Insurance Plan 11,022 10,487 - - University Hospitals and Clinics Authority 587,237 606,925 1,006 6,028 University of Wisconsin Foundation 128,542 236,677 160,426 - State Fair Park Exposition Center, Inc. 5,439 3,971 - -
Total Component Units $ 982,160 $ 977,360 $ 290,156 $ 6,028
General Revenues:Dedicated for General Purposes: Income Taxes Sales and Excise Taxes Public Utility Taxes Other TaxesMotor Fuel/Other Taxes Dedicated for TransportationOther Dedicated TaxesGrants and Contributions Not Restricted to Specific ProgramsInterest and Investment EarningsMiscellaneous
Contributions to Term and Permanent EndowmentsContributions to Permanent Fund PrincipalTransfers
Total General Revenues, Contributions, and Transfers
Change in Net AssetsNet Assets - BeginningNet Assets - Ending
The notes to the financial statements are an integral part of this statement.
Program Revenues
38
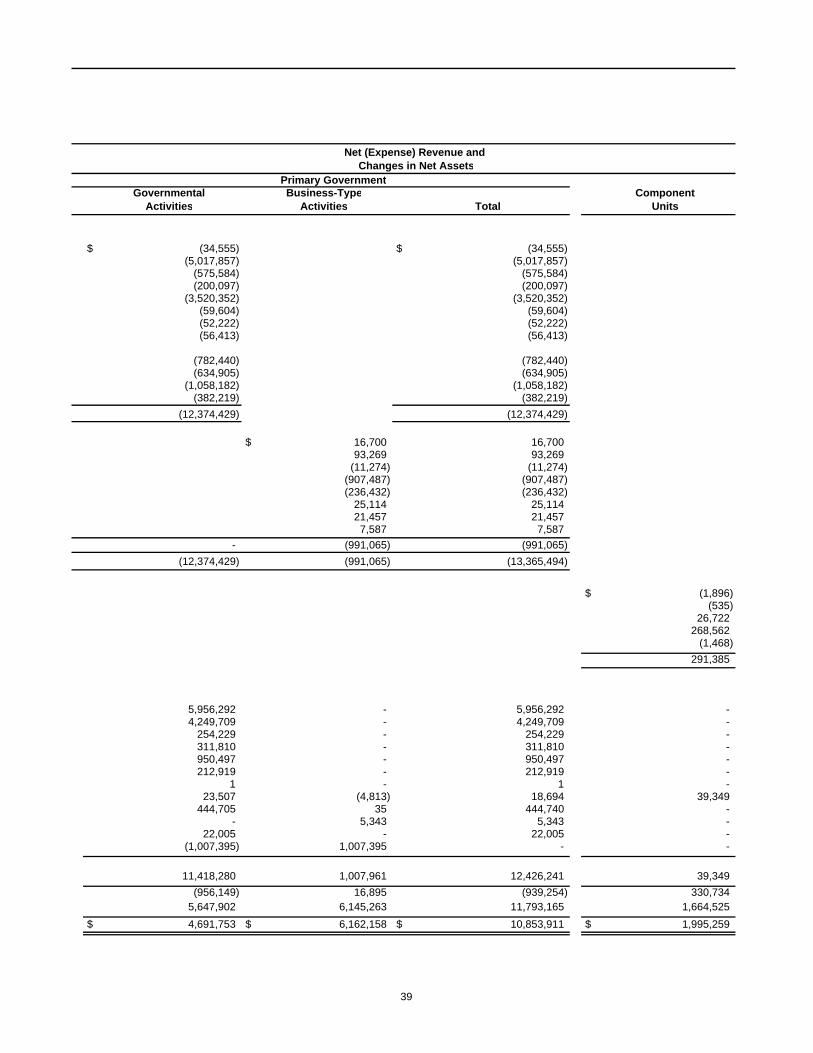
Governmental Business-Type ComponentActivities Activities Total Units
$ (34,555) $ (34,555) (5,017,857) (5,017,857)
(575,584) (575,584) (200,097) (200,097)
(3,520,352) (3,520,352) (59,604) (59,604) (52,222) (52,222) (56,413) (56,413)
(782,440) (782,440) (634,905) (634,905)
(1,058,182) (1,058,182) (382,219) (382,219)
(12,374,429) (12,374,429)
$ 16,700 16,700 93,269 93,269
(11,274) (11,274) (907,487) (907,487) (236,432) (236,432)
25,114 25,114 21,457 21,457 7,587 7,587
- (991,065) (991,065) (12,374,429) (991,065) (13,365,494)
$ (1,896) (535)
26,722 268,562
(1,468) 291,385
5,956,292 - 5,956,292 - 4,249,709 - 4,249,709 -
254,229 - 254,229 - 311,810 - 311,810 - 950,497 - 950,497 - 212,919 - 212,919 -
1 - 1 - 23,507 (4,813) 18,694 39,349
444,705 35 444,740 - - 5,343 5,343 -
22,005 - 22,005 - (1,007,395) 1,007,395 - -
11,418,280 1,007,961 12,426,241 39,349 (956,149) 16,895 (939,254) 330,734
5,647,902 6,145,263 11,793,165 1,664,525 $ 4,691,753 $ 6,162,158 $ 10,853,911 $ 1,995,259
Primary Government
Net (Expense) Revenue and Changes in Net Assets
39
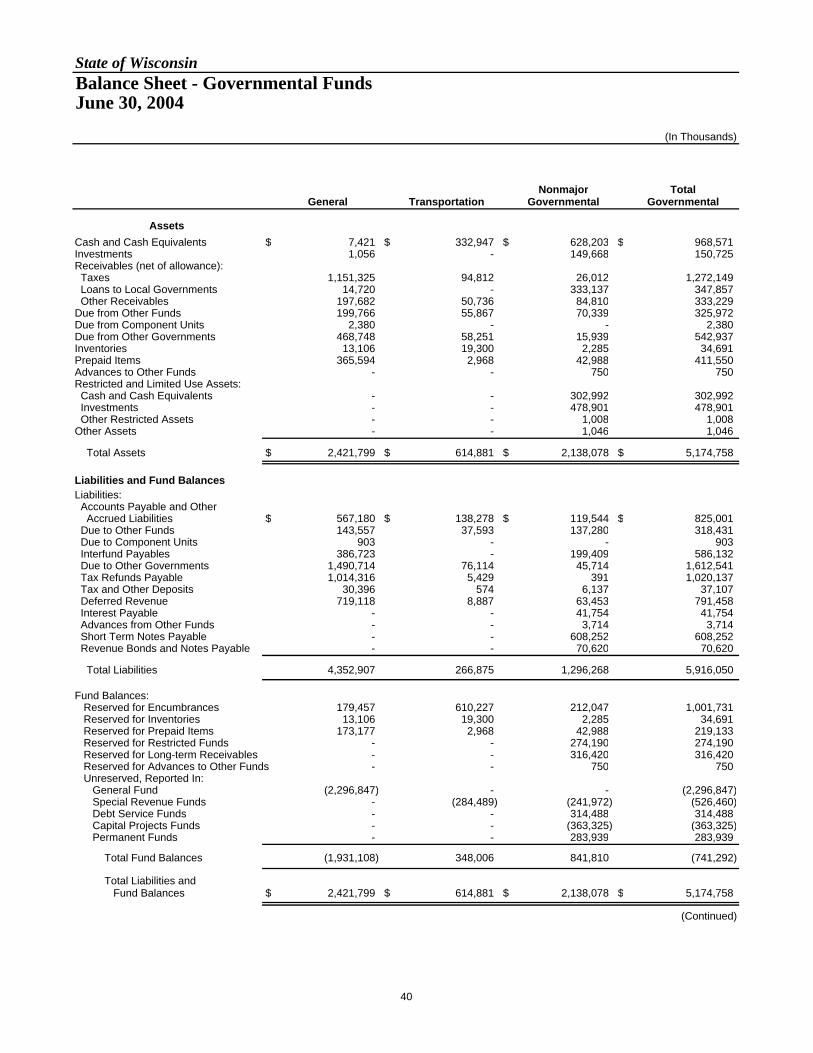
State of WisconsinBalance Sheet - Governmental Funds June 30, 2004
(In Thousands)
Nonmajor TotalGeneral Transportation Governmental Governmental
Assets Cash and Cash Equivalents $ 7,421 $ 332,947 $ 628,203 $ 968,571 Investments 1,056 - 149,668 150,725 Receivables (net of allowance): Taxes 1,151,325 94,812 26,012 1,272,149 Loans to Local Governments 14,720 - 333,137 347,857 Other Receivables 197,682 50,736 84,810 333,229 Due from Other Funds 199,766 55,867 70,339 325,972 Due from Component Units 2,380 - - 2,380 Due from Other Governments 468,748 58,251 15,939 542,937 Inventories 13,106 19,300 2,285 34,691 Prepaid Items 365,594 2,968 42,988 411,550 Advances to Other Funds - - 750 750 Restricted and Limited Use Assets: Cash and Cash Equivalents - - 302,992 302,992 Investments - - 478,901 478,901 Other Restricted Assets - - 1,008 1,008 Other Assets - - 1,046 1,046
Total Assets $ 2,421,799 $ 614,881 $ 2,138,078 $ 5,174,758
Liabilities and Fund BalancesLiabilities: Accounts Payable and Other Accrued Liabilities $ 567,180 $ 138,278 $ 119,544 $ 825,001 Due to Other Funds 143,557 37,593 137,280 318,431 Due to Component Units 903 - - 903 Interfund Payables 386,723 - 199,409 586,132 Due to Other Governments 1,490,714 76,114 45,714 1,612,541 Tax Refunds Payable 1,014,316 5,429 391 1,020,137 Tax and Other Deposits 30,396 574 6,137 37,107 Deferred Revenue 719,118 8,887 63,453 791,458 Interest Payable - - 41,754 41,754 Advances from Other Funds - - 3,714 3,714 Short Term Notes Payable - - 608,252 608,252 Revenue Bonds and Notes Payable - - 70,620 70,620
Total Liabilities 4,352,907 266,875 1,296,268 5,916,050
Fund Balances: Reserved for Encumbrances 179,457 610,227 212,047 1,001,731 Reserved for Inventories 13,106 19,300 2,285 34,691 Reserved for Prepaid Items 173,177 2,968 42,988 219,133 Reserved for Restricted Funds - - 274,190 274,190 Reserved for Long-term Receivables - - 316,420 316,420 Reserved for Advances to Other Funds - - 750 750 Unreserved, Reported In: General Fund (2,296,847) - - (2,296,847) Special Revenue Funds - (284,489) (241,972) (526,460) Debt Service Funds - - 314,488 314,488 Capital Projects Funds - - (363,325) (363,325) Permanent Funds - - 283,939 283,939
Total Fund Balances (1,931,108) 348,006 841,810 (741,292)
Total Liabilities and Fund Balances $ 2,421,799 $ 614,881 $ 2,138,078 $ 5,174,758
(Continued)
40

State of WisconsinBalance Sheet - Governmental Funds June 30, 2004
(Continued)
TotalGovernmental
Reconciliation to the Statement of Net Assets:
Total Fund Balances from previous page $ (741,292)
Capital assets used in governmental activities are not financialresources and, therefore, are not reported in the funds: Infrastructure 9,880,249 Other Capital Assets 4,216,755 Accumulated Depreciation (640,509)
Other long-term assets that are not available to pay for current period expenditures and, therefore, are deferred in the funds. 77,625
Some of the State's revenues will be collected after year-end but are not available soon enough to pay for the current period's expendituresand, therefore, are deferred in the funds. 364,467
Internal service funds are used by management to charge the costs ofcertain activities, such as insurance and telecommunications, to individualfunds. The assets and liabilities of the internal service funds are includedin governmental activities in the Statement of Net Assets. 12,615
Long-term liabilities, including bonds payable, are not due and payable inthe current period and, therefore, are not reported in the funds. Revenue Bonds Payable (3,080,880) Appropriation Bonds Payable (1,792,092) General Obligation Bonds Payable (3,389,177) Accrued Interest on Bonds (85,523) Capital Leases (19,783) Installment Contracts (2,299) Compensated Absences (106,368) Claims and Judgments (2,037)
Net Assets of Governmental Activities as reported on the Statement of Net Assets (See page 37) $ 4,691,753
The notes to the financial statements are an integral part of this statement.
41
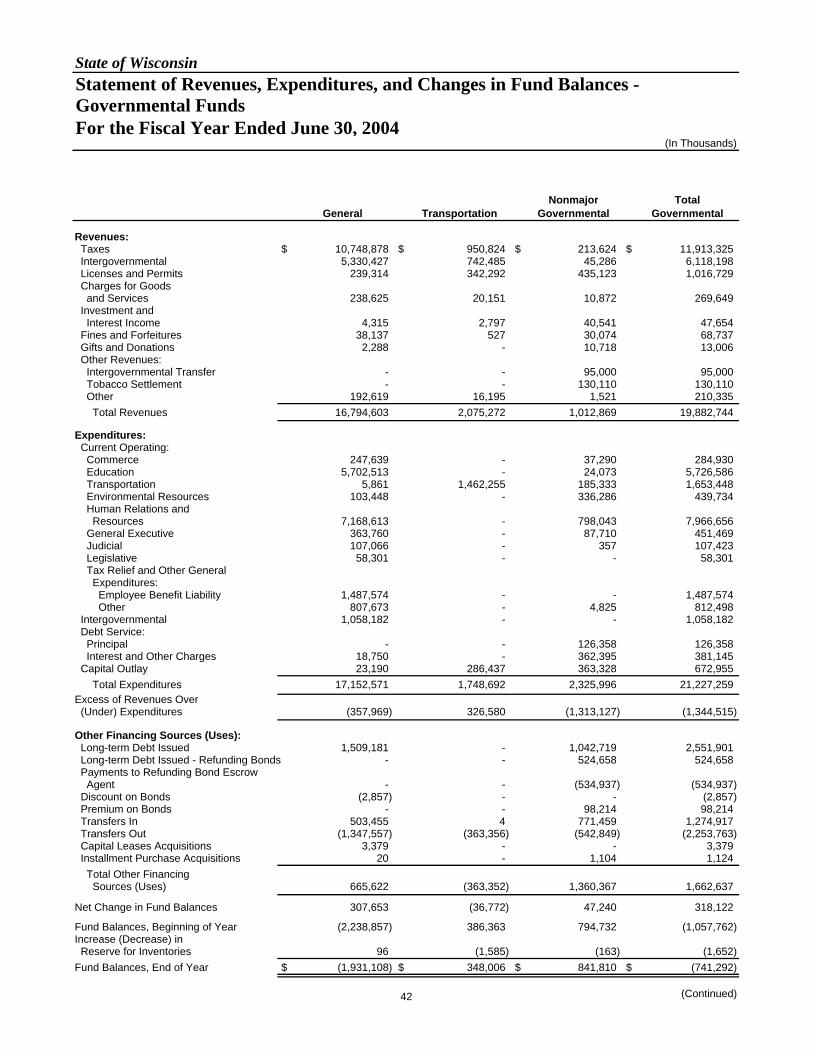
State of WisconsinStatement of Revenues, Expenditures, and Changes in Fund Balances - Governmental Funds For the Fiscal Year Ended June 30, 2004
(In Thousands)
Nonmajor TotalGeneral Transportation Governmental Governmental
Revenues: Taxes $ 10,748,878 $ 950,824 $ 213,624 $ 11,913,325 Intergovernmental 5,330,427 742,485 45,286 6,118,198 Licenses and Permits 239,314 342,292 435,123 1,016,729 Charges for Goods and Services 238,625 20,151 10,872 269,649 Investment and Interest Income 4,315 2,797 40,541 47,654 Fines and Forfeitures 38,137 527 30,074 68,737 Gifts and Donations 2,288 - 10,718 13,006 Other Revenues: Intergovernmental Transfer - - 95,000 95,000 Tobacco Settlement - - 130,110 130,110 Other 192,619 16,195 1,521 210,335 Total Revenues 16,794,603 2,075,272 1,012,869 19,882,744
Expenditures: Current Operating: Commerce 247,639 - 37,290 284,930 Education 5,702,513 - 24,073 5,726,586 Transportation 5,861 1,462,255 185,333 1,653,448 Environmental Resources 103,448 - 336,286 439,734 Human Relations and Resources 7,168,613 - 798,043 7,966,656 General Executive 363,760 - 87,710 451,469 Judicial 107,066 - 357 107,423 Legislative 58,301 - - 58,301 Tax Relief and Other General Expenditures: Employee Benefit Liability 1,487,574 - - 1,487,574 Other 807,673 - 4,825 812,498 Intergovernmental 1,058,182 - - 1,058,182 Debt Service: Principal - - 126,358 126,358 Interest and Other Charges 18,750 - 362,395 381,145 Capital Outlay 23,190 286,437 363,328 672,955 Total Expenditures 17,152,571 1,748,692 2,325,996 21,227,259 Excess of Revenues Over (Under) Expenditures (357,969) 326,580 (1,313,127) (1,344,515)
Other Financing Sources (Uses): Long-term Debt Issued 1,509,181 - 1,042,719 2,551,901 Long-term Debt Issued - Refunding Bonds - - 524,658 524,658 Payments to Refunding Bond Escrow Agent - - (534,937) (534,937) Discount on Bonds (2,857) - - (2,857) Premium on Bonds - - 98,214 98,214 Transfers In 503,455 4 771,459 1,274,917 Transfers Out (1,347,557) (363,356) (542,849) (2,253,763) Capital Leases Acquisitions 3,379 - - 3,379 Installment Purchase Acquisitions 20 - 1,104 1,124 Total Other Financing Sources (Uses) 665,622 (363,352) 1,360,367 1,662,637
Net Change in Fund Balances 307,653 (36,772) 47,240 318,122
Fund Balances, Beginning of Year (2,238,857) 386,363 794,732 (1,057,762) Increase (Decrease) in Reserve for Inventories 96 (1,585) (163) (1,652) Fund Balances, End of Year $ (1,931,108) $ 348,006 $ 841,810 $ (741,292)
(Continued)42
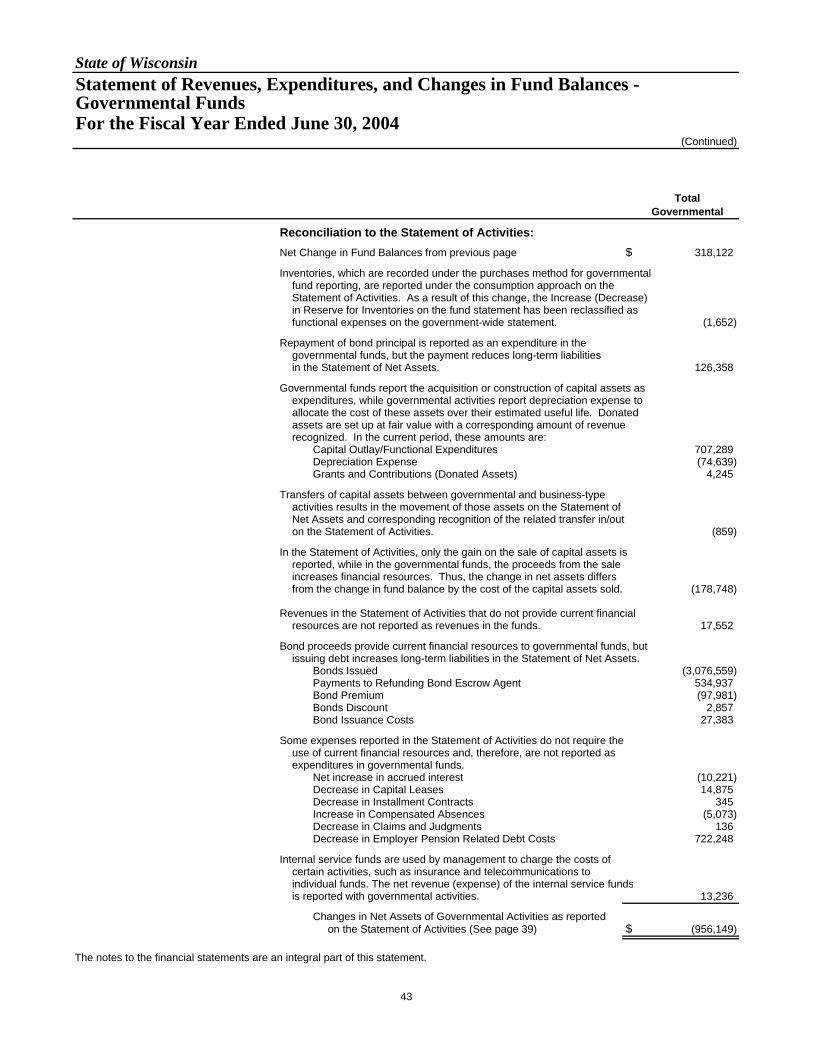
State of WisconsinStatement of Revenues, Expenditures, and Changes in Fund Balances - Governmental Funds For the Fiscal Year Ended June 30, 2004
(Continued)
TotalGovernmental
Reconciliation to the Statement of Activities:Net Change in Fund Balances from previous page $ 318,122
Inventories, which are recorded under the purchases method for governmental fund reporting, are reported under the consumption approach on theStatement of Activities. As a result of this change, the Increase (Decrease)in Reserve for Inventories on the fund statement has been reclassified asfunctional expenses on the government-wide statement. (1,652)
Repayment of bond principal is reported as an expenditure in the governmental funds, but the payment reduces long-term liabilities in the Statement of Net Assets. 126,358
Governmental funds report the acquisition or construction of capital assets as expenditures, while governmental activities report depreciation expense to allocate the cost of these assets over their estimated useful life. Donatedassets are set up at fair value with a corresponding amount of revenuerecognized. In the current period, these amounts are: Capital Outlay/Functional Expenditures 707,289 Depreciation Expense (74,639) Grants and Contributions (Donated Assets) 4,245
Transfers of capital assets between governmental and business-typeactivities results in the movement of those assets on the Statement ofNet Assets and corresponding recognition of the related transfer in/out on the Statement of Activities. (859)
In the Statement of Activities, only the gain on the sale of capital assets is reported, while in the governmental funds, the proceeds from the saleincreases financial resources. Thus, the change in net assets differsfrom the change in fund balance by the cost of the capital assets sold. (178,748)
Revenues in the Statement of Activities that do not provide current financial resources are not reported as revenues in the funds. 17,552
Bond proceeds provide current financial resources to governmental funds, butissuing debt increases long-term liabilities in the Statement of Net Assets. Bonds Issued (3,076,559) Payments to Refunding Bond Escrow Agent 534,937 Bond Premium (97,981) Bonds Discount 2,857 Bond Issuance Costs 27,383
Some expenses reported in the Statement of Activities do not require the use of current financial resources and, therefore, are not reported asexpenditures in governmental funds. Net increase in accrued interest (10,221) Decrease in Capital Leases 14,875 Decrease in Installment Contracts 345 Increase in Compensated Absences (5,073) Decrease in Claims and Judgments 136 Decrease in Employer Pension Related Debt Costs 722,248
Internal service funds are used by management to charge the costs of certain activities, such as insurance and telecommunications toindividual funds. The net revenue (expense) of the internal service fundsis reported with governmental activities. 13,236
Changes in Net Assets of Governmental Activities as reported on the Statement of Activities (See page 39) $ (956,149)
The notes to the financial statements are an integral part of this statement.
43
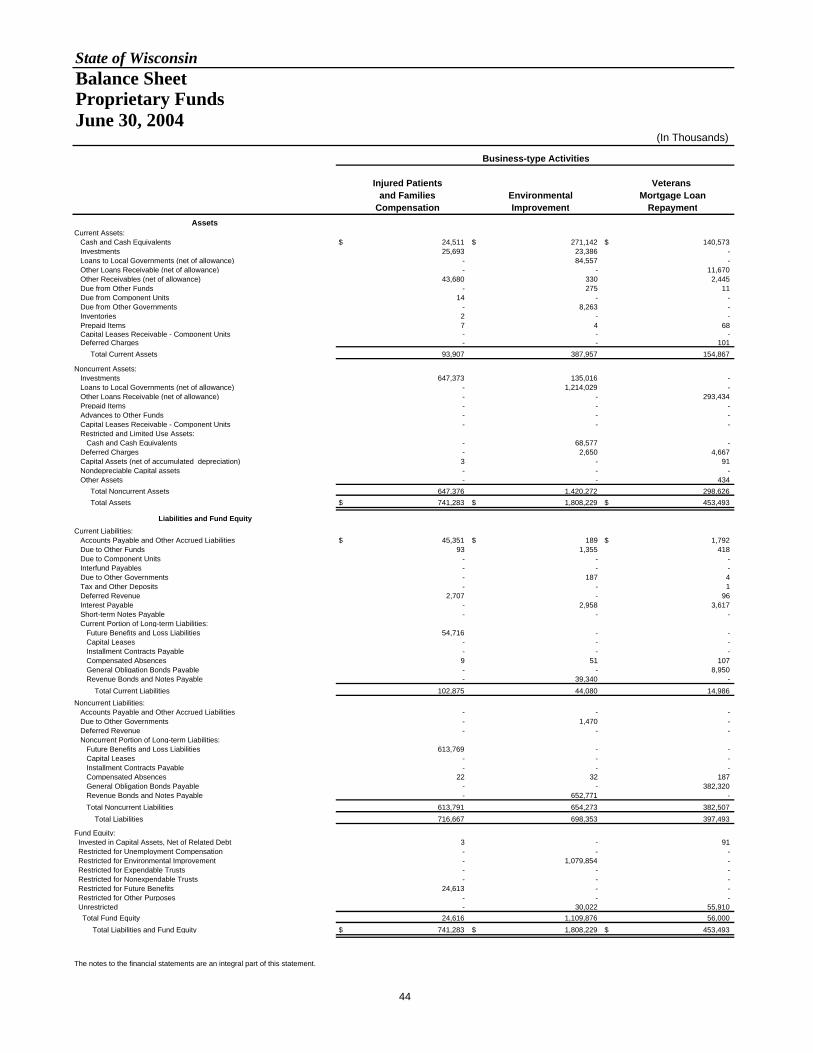
State of WisconsinBalance Sheet Proprietary Funds June 30, 2004
(In Thousands)
Business-type Activities
Injured Patients Veterans and Families Environmental Mortgage Loan
Compensation Improvement RepaymentAssets
Current Assets: Cash and Cash Equivalents $ 24,511 $ 271,142 $ 140,573 Investments 25,693 23,386 - Loans to Local Governments (net of allowance) - 84,557 - Other Loans Receivable (net of allowance) - - 11,670 Other Receivables (net of allowance) 43,680 330 2,445 Due from Other Funds - 275 11 Due from Component Units 14 - - Due from Other Governments - 8,263 - Inventories 2 - - Prepaid Items 7 4 68 Capital Leases Receivable - Component Units - - - Deferred Charges - - 101 Total Current Assets 93,907 387,957 154,867
Noncurrent Assets: Investments 647,373 135,016 - Loans to Local Governments (net of allowance) - 1,214,029 - Other Loans Receivable (net of allowance) - - 293,434 Prepaid Items - - - Advances to Other Funds - - - Capital Leases Receivable - Component Units - - - Restricted and Limited Use Assets: Cash and Cash Equivalents - 68,577 - Deferred Charges - 2,650 4,667 Capital Assets (net of accumulated depreciation) 3 - 91 Nondepreciable Capital assets - - - Other Assets - - 434 Total Noncurrent Assets 647,376 1,420,272 298,626 Total Assets $ 741,283 $ 1,808,229 $ 453,493
Liabilities and Fund EquityCurrent Liabilities: Accounts Payable and Other Accrued Liabilities $ 45,351 $ 189 $ 1,792 Due to Other Funds 93 1,355 418 Due to Component Units - - - Interfund Payables - - - Due to Other Governments - 187 4 Tax and Other Deposits - - 1 Deferred Revenue 2,707 - 96 Interest Payable - 2,958 3,617 Short-term Notes Payable - - - Current Portion of Long-term Liabilities: Future Benefits and Loss Liabilities 54,716 - - Capital Leases - - - Installment Contracts Payable - - - Compensated Absences 9 51 107 General Obligation Bonds Payable - - 8,950 Revenue Bonds and Notes Payable - 39,340 - Total Current Liabilities 102,875 44,080 14,986 Noncurrent Liabilities: Accounts Payable and Other Accrued Liabilities - - - Due to Other Governments - 1,470 - Deferred Revenue - - - Noncurrent Portion of Long-term Liabilities: Future Benefits and Loss Liabilities 613,769 - - Capital Leases - - - Installment Contracts Payable - - - Compensated Absences 22 32 187 General Obligation Bonds Payable - - 382,320 Revenue Bonds and Notes Payable - 652,771 - Total Noncurrent Liabilities 613,791 654,273 382,507 Total Liabilities 716,667 698,353 397,493
Fund Equity: Invested in Capital Assets, Net of Related Debt 3 - 91 Restricted for Unemployment Compensation - - - Restricted for Environmental Improvement - 1,079,854 - Restricted for Expendable Trusts - - - Restricted for Nonexpendable Trusts - - - Restricted for Future Benefits 24,613 - - Restricted for Other Purposes - - - Unrestricted - 30,022 55,910 Total Fund Equity 24,616 1,109,876 56,000 Total Liabilities and Fund Equity $ 741,283 $ 1,808,229 $ 453,493
The notes to the financial statements are an integral part of this statement.
44
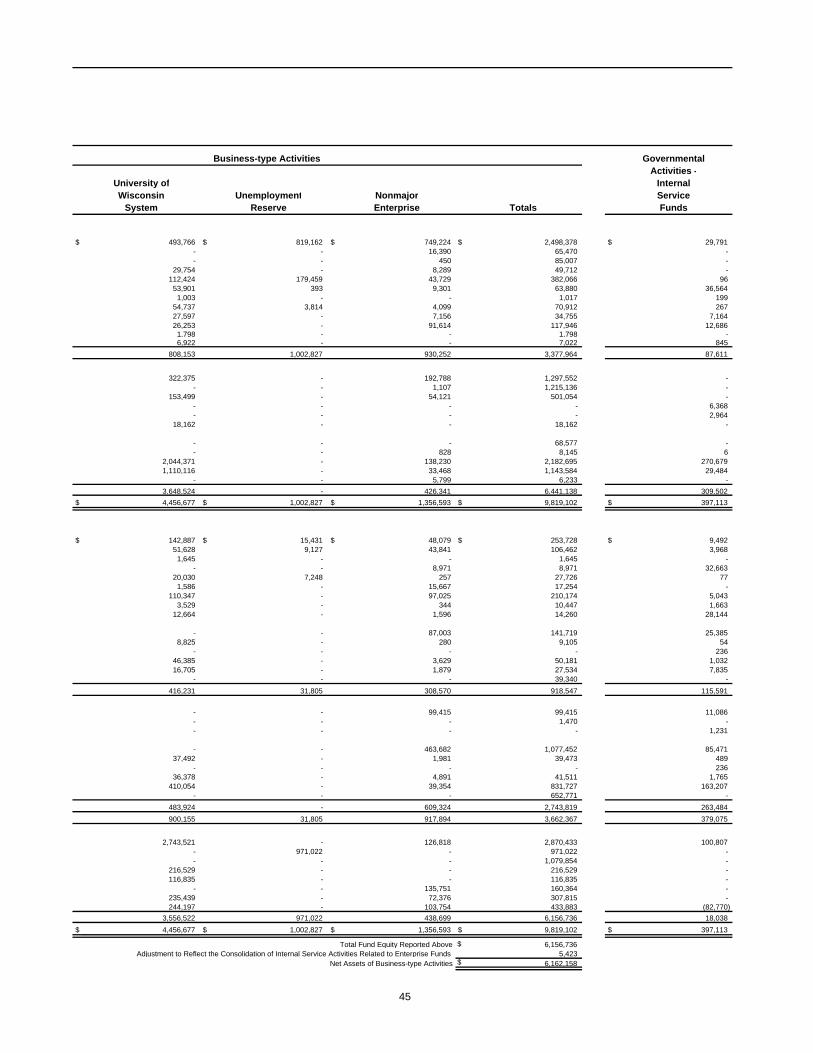
Business-type Activities GovernmentalActivities -
University of InternalWisconsin Unemployment Nonmajor Service
System Reserve Enterprise Totals Funds
$ 493,766 $ 819,162 $ 749,224 $ 2,498,378 $ 29,791 - - 16,390 65,470 - - - 450 85,007 -
29,754 - 8,289 49,712 - 112,424 179,459 43,729 382,066 96
53,901 393 9,301 63,880 36,564 1,003 - - 1,017 199
54,737 3,814 4,099 70,912 267 27,597 - 7,156 34,755 7,164 26,253 - 91,614 117,946 12,686
1,798 - - 1,798 - 6,922 - - 7,022 845
808,153 1,002,827 930,252 3,377,964 87,611
322,375 - 192,788 1,297,552 - - - 1,107 1,215,136 -
153,499 - 54,121 501,054 - - - - - 6,368 - - - - 2,964
18,162 - - 18,162 -
- - - 68,577 - - - 828 8,145 6
2,044,371 - 138,230 2,182,695 270,679 1,110,116 - 33,468 1,143,584 29,484
- - 5,799 6,233 - 3,648,524 - 426,341 6,441,138 309,502
$ 4,456,677 $ 1,002,827 $ 1,356,593 $ 9,819,102 $ 397,113
$ 142,887 $ 15,431 $ 48,079 $ 253,728 $ 9,492 51,628 9,127 43,841 106,462 3,968
1,645 - - 1,645 - - - 8,971 8,971 32,663
20,030 7,248 257 27,726 77 1,586 - 15,667 17,254 -
110,347 - 97,025 210,174 5,043 3,529 - 344 10,447 1,663
12,664 - 1,596 14,260 28,144
- - 87,003 141,719 25,385 8,825 - 280 9,105 54
- - - - 236 46,385 - 3,629 50,181 1,032 16,705 - 1,879 27,534 7,835
- - - 39,340 - 416,231 31,805 308,570 918,547 115,591
- - 99,415 99,415 11,086 - - - 1,470 - - - - - 1,231
- - 463,682 1,077,452 85,471 37,492 - 1,981 39,473 489
- - - - 236 36,378 - 4,891 41,511 1,765
410,054 - 39,354 831,727 163,207 - - - 652,771 -
483,924 - 609,324 2,743,819 263,484 900,155 31,805 917,894 3,662,367 379,075
2,743,521 - 126,818 2,870,433 100,807 - 971,022 - 971,022 - - - - 1,079,854 -
216,529 - - 216,529 - 116,835 - - 116,835 -
- - 135,751 160,364 - 235,439 - 72,376 307,815 - 244,197 - 103,754 433,883 (82,770)
3,556,522 971,022 438,699 6,156,736 18,038 $ 4,456,677 $ 1,002,827 $ 1,356,593 $ 9,819,102 $ 397,113
Total Fund Equity Reported Above $ 6,156,736 Adjustment to Reflect the Consolidation of Internal Service Activities Related to Enterprise Funds 5,423
Net Assets of Business-type Activities $ 6,162,158
45
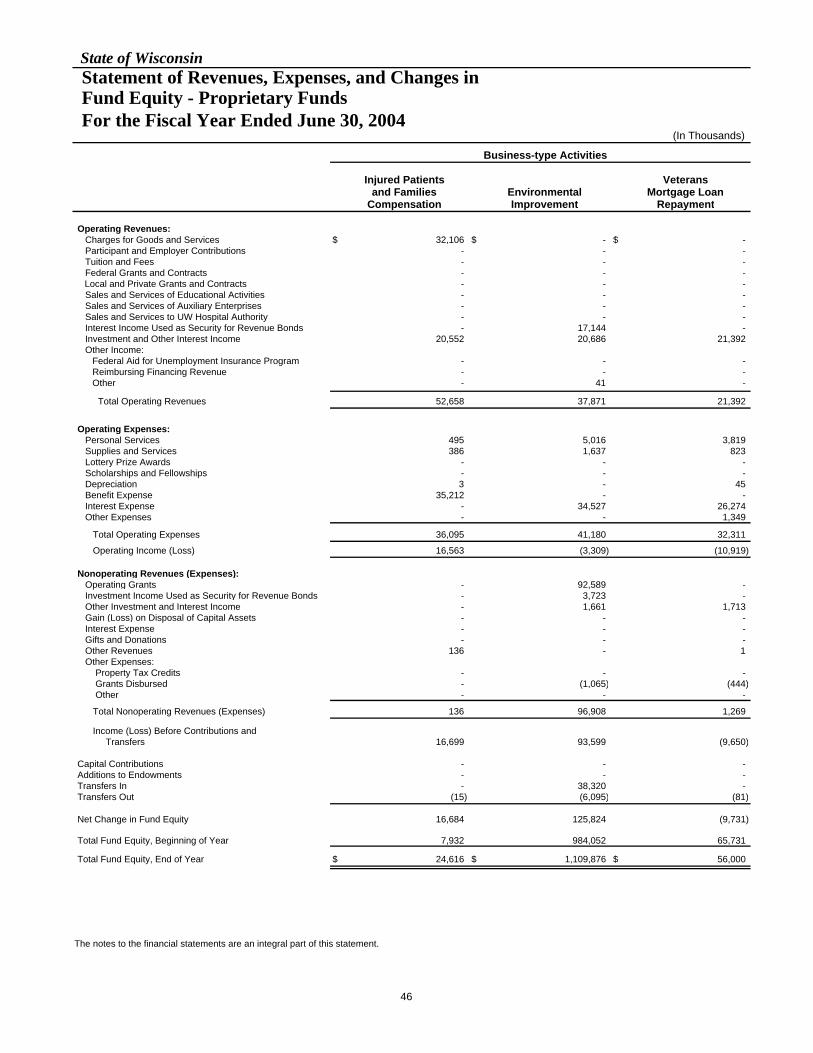
State of WisconsinStatement of Revenues, Expenses, and Changes in Fund Equity - Proprietary Funds For the Fiscal Year Ended June 30, 2004
(In Thousands)
Business-type Activities
Injured Patients Veteransand Families Environmental Mortgage Loan
Compensation Improvement Repayment
Operating Revenues: Charges for Goods and Services $ 32,106 $ - $ - Participant and Employer Contributions - - - Tuition and Fees - - - Federal Grants and Contracts - - -
Local and Private Grants and Contracts - - - Sales and Services of Educational Activities - - - Sales and Services of Auxiliary Enterprises - - - Sales and Services to UW Hospital Authority - - - Interest Income Used as Security for Revenue Bonds - 17,144 - Investment and Other Interest Income 20,552 20,686 21,392 Other Income:
Federal Aid for Unemployment Insurance Program - - - Reimbursing Financing Revenue - - - Other - 41 -
Total Operating Revenues 52,658 37,871 21,392
Operating Expenses: Personal Services 495 5,016 3,819 Supplies and Services 386 1,637 823 Lottery Prize Awards - - - Scholarships and Fellowships - - - Depreciation 3 - 45 Benefit Expense 35,212 - - Interest Expense - 34,527 26,274 Other Expenses - - 1,349
Total Operating Expenses 36,095 41,180 32,311
Operating Income (Loss) 16,563 (3,309) (10,919)
Nonoperating Revenues (Expenses): Operating Grants - 92,589 - Investment Income Used as Security for Revenue Bonds - 3,723 - Other Investment and Interest Income - 1,661 1,713 Gain (Loss) on Disposal of Capital Assets - - - Interest Expense - - - Gifts and Donations - - - Other Revenues 136 - 1 Other Expenses: Property Tax Credits - - - Grants Disbursed - (1,065) (444) Other - - -
Total Nonoperating Revenues (Expenses) 136 96,908 1,269
Income (Loss) Before Contributions and Transfers 16,699 93,599 (9,650)
Capital Contributions - - - Additions to Endowments - - - Transfers In - 38,320 - Transfers Out (15) (6,095) (81)
Net Change in Fund Equity 16,684 125,824 (9,731)
Total Fund Equity, Beginning of Year 7,932 984,052 65,731
Total Fund Equity, End of Year $ 24,616 $ 1,109,876 $ 56,000
The notes to the financial statements are an integral part of this statement.
46
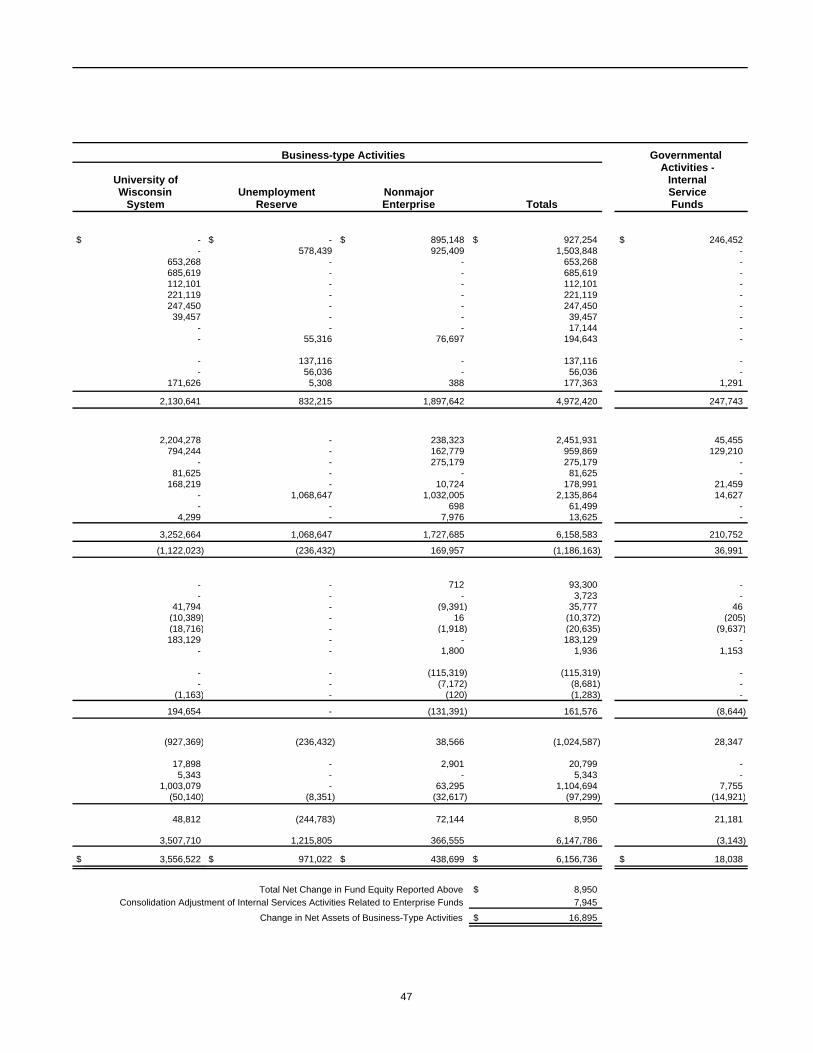
Business-type Activities Governmental Activities -
University of InternalWisconsin Unemployment Nonmajor Service
System Reserve Enterprise Totals Funds
$ - $ - $ 895,148 $ 927,254 $ 246,452 - 578,439 925,409 1,503,848 -
653,268 - - 653,268 - 685,619 - - 685,619 - 112,101 - - 112,101 - 221,119 - - 221,119 - 247,450 - - 247,450 - 39,457 - - 39,457 -
- - - 17,144 - - 55,316 76,697 194,643 -
- 137,116 - 137,116 - - 56,036 - 56,036 -
171,626 5,308 388 177,363 1,291
2,130,641 832,215 1,897,642 4,972,420 247,743
2,204,278 - 238,323 2,451,931 45,455 794,244 - 162,779 959,869 129,210
- - 275,179 275,179 - 81,625 - - 81,625 -
168,219 - 10,724 178,991 21,459 - 1,068,647 1,032,005 2,135,864 14,627 - - 698 61,499 -
4,299 - 7,976 13,625 -
3,252,664 1,068,647 1,727,685 6,158,583 210,752
(1,122,023) (236,432) 169,957 (1,186,163) 36,991
- - 712 93,300 - - - - 3,723 -
41,794 - (9,391) 35,777 46 (10,389) - 16 (10,372) (205) (18,716) - (1,918) (20,635) (9,637) 183,129 - - 183,129 -
- - 1,800 1,936 1,153
- - (115,319) (115,319) - - - (7,172) (8,681) -
(1,163) - (120) (1,283) -
194,654 - (131,391) 161,576 (8,644)
(927,369) (236,432) 38,566 (1,024,587) 28,347
17,898 - 2,901 20,799 - 5,343 - - 5,343 -
1,003,079 - 63,295 1,104,694 7,755 (50,140) (8,351) (32,617) (97,299) (14,921)
48,812 (244,783) 72,144 8,950 21,181
3,507,710 1,215,805 366,555 6,147,786 (3,143)
$ 3,556,522 $ 971,022 $ 438,699 $ 6,156,736 $ 18,038
Total Net Change in Fund Equity Reported Above $ 8,950 Consolidation Adjustment of Internal Services Activities Related to Enterprise Funds 7,945
Change in Net Assets of Business-Type Activities $ 16,895
47
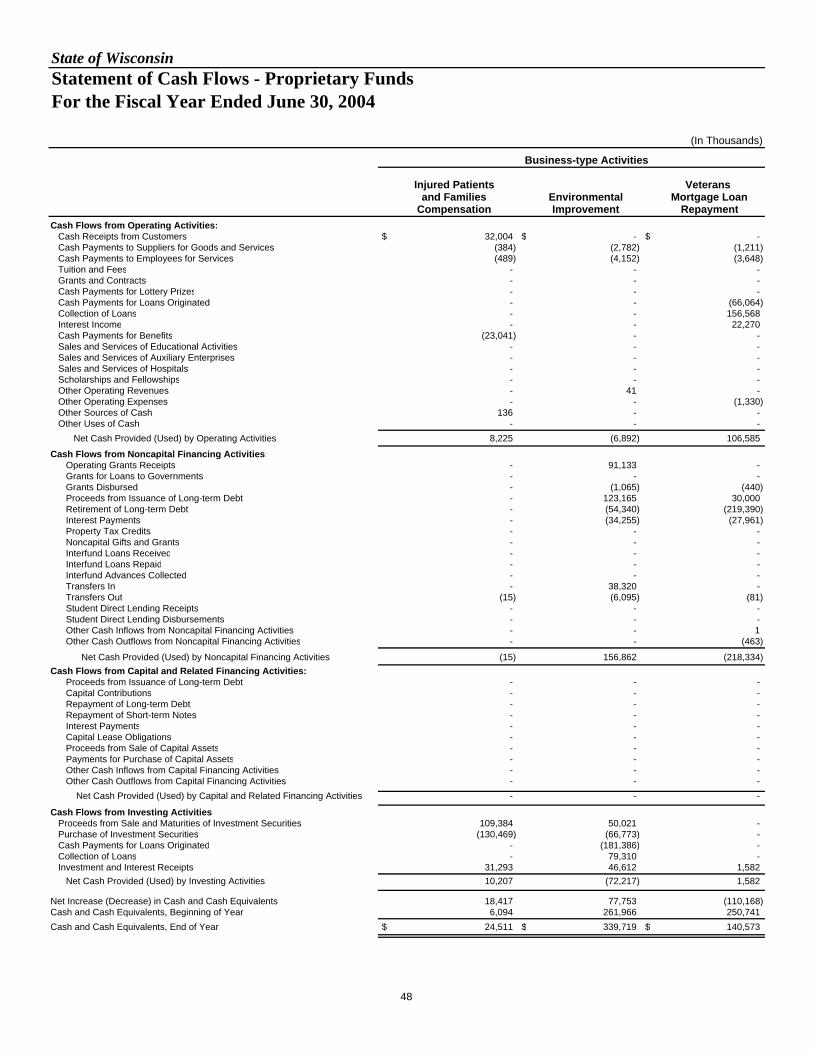
State of WisconsinStatement of Cash Flows - Proprietary Funds For the Fiscal Year Ended June 30, 2004
(In Thousands)
Business-type Activities
Injured Patients Veterans and Families Environmental Mortgage Loan
Compensation Improvement Repayment Cash Flows from Operating Activities: Cash Receipts from Customers $ 32,004 $ - $ - Cash Payments to Suppliers for Goods and Services (384) (2,782) (1,211) Cash Payments to Employees for Services (489) (4,152) (3,648) Tuition and Fees - - - Grants and Contracts - - - Cash Payments for Lottery Prizes - - - Cash Payments for Loans Originated - - (66,064) Collection of Loans - - 156,568 Interest Income - - 22,270 Cash Payments for Benefits (23,041) - - Sales and Services of Educational Activities - - - Sales and Services of Auxiliary Enterprises - - - Sales and Services of Hospitals - - - Scholarships and Fellowships - - - Other Operating Revenues - 41 - Other Operating Expenses - - (1,330) Other Sources of Cash 136 - - Other Uses of Cash - - - Net Cash Provided (Used) by Operating Activities 8,225 (6,892) 106,585
Cash Flows from Noncapital Financing Activities: Operating Grants Receipts - 91,133 - Grants for Loans to Governments - - - Grants Disbursed - (1,065) (440) Proceeds from Issuance of Long-term Debt - 123,165 30,000 Retirement of Long-term Debt - (54,340) (219,390) Interest Payments - (34,255) (27,961) Property Tax Credits - - - Noncapital Gifts and Grants - - - Interfund Loans Received - - - Interfund Loans Repaid - - - Interfund Advances Collected - - - Transfers In - 38,320 - Transfers Out (15) (6,095) (81) Student Direct Lending Receipts - - - Student Direct Lending Disbursements - - - Other Cash Inflows from Noncapital Financing Activities - - 1 Other Cash Outflows from Noncapital Financing Activities - - (463)
Net Cash Provided (Used) by Noncapital Financing Activities (15) 156,862 (218,334) Cash Flows from Capital and Related Financing Activities: Proceeds from Issuance of Long-term Debt - - - Capital Contributions - - - Repayment of Long-term Debt - - - Repayment of Short-term Notes - - - Interest Payments - - - Capital Lease Obligations - - - Proceeds from Sale of Capital Assets - - - Payments for Purchase of Capital Assets - - - Other Cash Inflows from Capital Financing Activities - - - Other Cash Outflows from Capital Financing Activities - - - Net Cash Provided (Used) by Capital and Related Financing Activities - - -
Cash Flows from Investing Activities: Proceeds from Sale and Maturities of Investment Securities 109,384 50,021 - Purchase of Investment Securities (130,469) (66,773) - Cash Payments for Loans Originated - (181,386) - Collection of Loans - 79,310 - Investment and Interest Receipts 31,293 46,612 1,582 Net Cash Provided (Used) by Investing Activities 10,207 (72,217) 1,582
Net Increase (Decrease) in Cash and Cash Equivalents 18,417 77,753 (110,168) Cash and Cash Equivalents, Beginning of Year 6,094 261,966 250,741 Cash and Cash Equivalents, End of Year $ 24,511 $ 339,719 $ 140,573
48
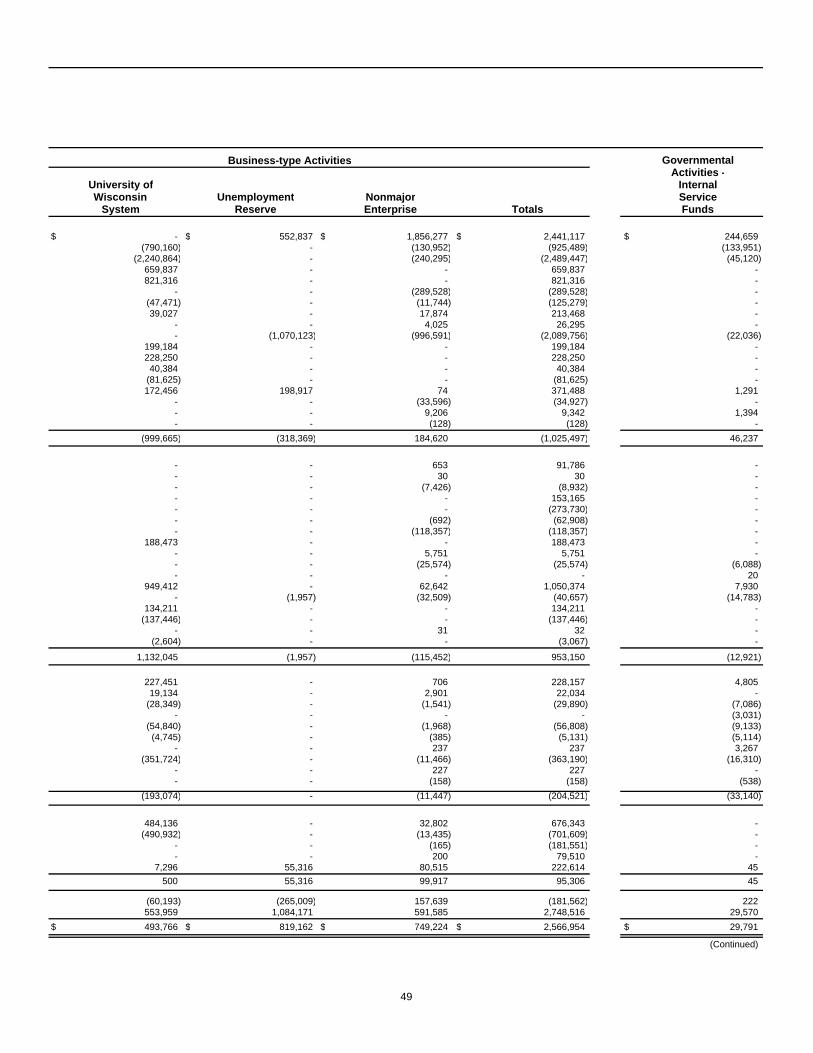
GovernmentalActivities -
University of InternalWisconsin Unemployment Nonmajor Service
System Reserve Enterprise Totals Funds
$ - $ 552,837 $ 1,856,277 $ 2,441,117 $ 244,659 (790,160) - (130,952) (925,489) (133,951)
(2,240,864) - (240,295) (2,489,447) (45,120) 659,837 - - 659,837 - 821,316 - - 821,316 -
- - (289,528) (289,528) - (47,471) - (11,744) (125,279) - 39,027 - 17,874 213,468 -
- - 4,025 26,295 - - (1,070,123) (996,591) (2,089,756) (22,036)
199,184 - - 199,184 - 228,250 - - 228,250 - 40,384 - - 40,384 -
(81,625) - - (81,625) - 172,456 198,917 74 371,488 1,291
- - (33,596) (34,927) - - - 9,206 9,342 1,394 - - (128) (128) -
(999,665) (318,369) 184,620 (1,025,497) 46,237
- - 653 91,786 - - - 30 30 - - - (7,426) (8,932) - - - - 153,165 - - - - (273,730) - - - (692) (62,908) - - - (118,357) (118,357) -
188,473 - - 188,473 - - - 5,751 5,751 - - - (25,574) (25,574) (6,088) - - - - 20
949,412 - 62,642 1,050,374 7,930 - (1,957) (32,509) (40,657) (14,783)
134,211 - - 134,211 - (137,446) - - (137,446) -
- - 31 32 - (2,604) - - (3,067) -
1,132,045 (1,957) (115,452) 953,150 (12,921)
227,451 - 706 228,157 4,805 19,134 - 2,901 22,034 -
(28,349) - (1,541) (29,890) (7,086) - - - - (3,031)
(54,840) - (1,968) (56,808) (9,133) (4,745) - (385) (5,131) (5,114)
- - 237 237 3,267 (351,724) - (11,466) (363,190) (16,310)
- - 227 227 - - - (158) (158) (538)
(193,074) - (11,447) (204,521) (33,140)
484,136 - 32,802 676,343 - (490,932) - (13,435) (701,609) -
- - (165) (181,551) - - - 200 79,510 -
7,296 55,316 80,515 222,614 45 500 55,316 99,917 95,306 45
(60,193) (265,009) 157,639 (181,562) 222 553,959 1,084,171 591,585 2,748,516 29,570
$ 493,766 $ 819,162 $ 749,224 $ 2,566,954 $ 29,791
(Continued)
Business-type Activities
49
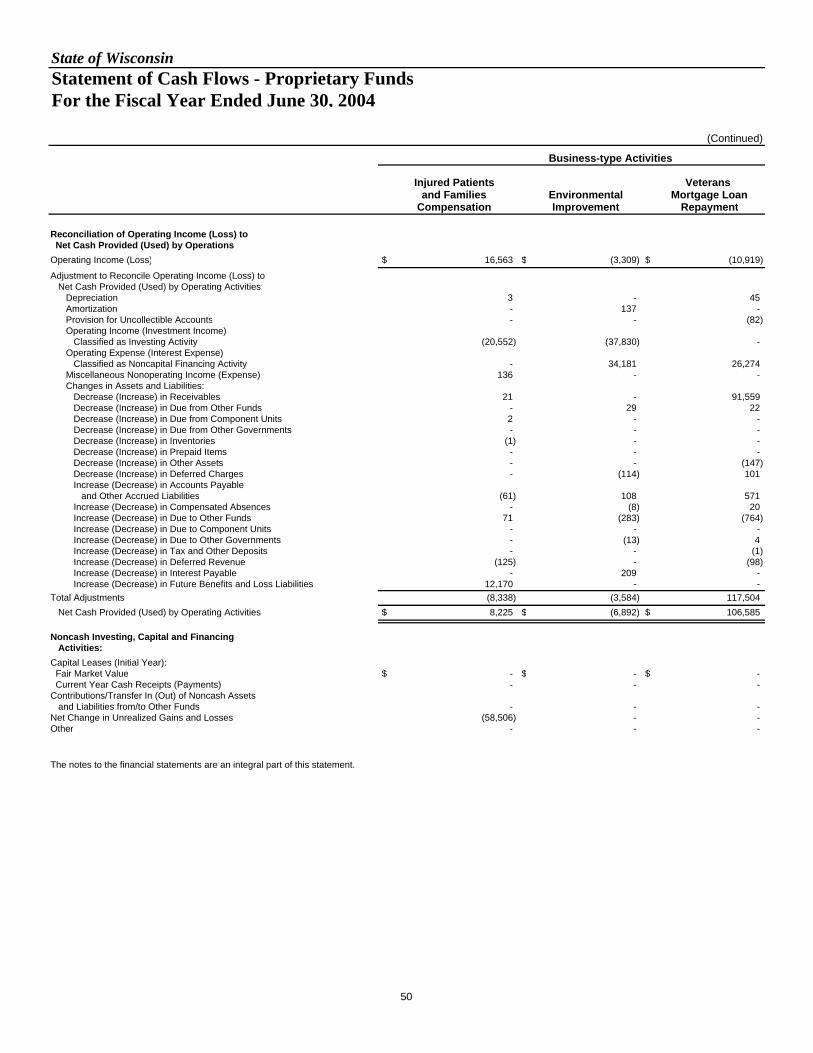
State of WisconsinStatement of Cash Flows - Proprietary Funds For the Fiscal Year Ended June 30, 2004
(Continued)
Injured Patients Veterans and Families Environmental Mortgage Loan
Compensation Improvement Repayment
Reconciliation of Operating Income (Loss) to Net Cash Provided (Used) by Operations:Operating Income (Loss) $ 16,563 $ (3,309) $ (10,919)
Adjustment to Reconcile Operating Income (Loss) to Net Cash Provided (Used) by Operating Activities: Depreciation 3 - 45 Amortization - 137 - Provision for Uncollectible Accounts - - (82) Operating Income (Investment Income) Classified as Investing Activity (20,552) (37,830) - Operating Expense (Interest Expense) Classified as Noncapital Financing Activity - 34,181 26,274 Miscellaneous Nonoperating Income (Expense) 136 - - Changes in Assets and Liabilities: Decrease (Increase) in Receivables 21 - 91,559 Decrease (Increase) in Due from Other Funds - 29 22 Decrease (Increase) in Due from Component Units 2 - - Decrease (Increase) in Due from Other Governments - - - Decrease (Increase) in Inventories (1) - - Decrease (Increase) in Prepaid Items - - - Decrease (Increase) in Other Assets - - (147) Decrease (Increase) in Deferred Charges - (114) 101 Increase (Decrease) in Accounts Payable and Other Accrued Liabilities (61) 108 571 Increase (Decrease) in Compensated Absences - (8) 20 Increase (Decrease) in Due to Other Funds 71 (283) (764) Increase (Decrease) in Due to Component Units - - - Increase (Decrease) in Due to Other Governments - (13) 4 Increase (Decrease) in Tax and Other Deposits - - (1) Increase (Decrease) in Deferred Revenue (125) - (98) Increase (Decrease) in Interest Payable - 209 - Increase (Decrease) in Future Benefits and Loss Liabilities 12,170 - - Total Adjustments (8,338) (3,584) 117,504 Net Cash Provided (Used) by Operating Activities $ 8,225 $ (6,892) $ 106,585
Noncash Investing, Capital and Financing Activities:Capital Leases (Initial Year): Fair Market Value $ - $ - $ - Current Year Cash Receipts (Payments) - - - Contributions/Transfer In (Out) of Noncash Assets and Liabilities from/to Other Funds - - - Net Change in Unrealized Gains and Losses (58,506) - - Other - - -
The notes to the financial statements are an integral part of this statement.
Business-type Activities
50
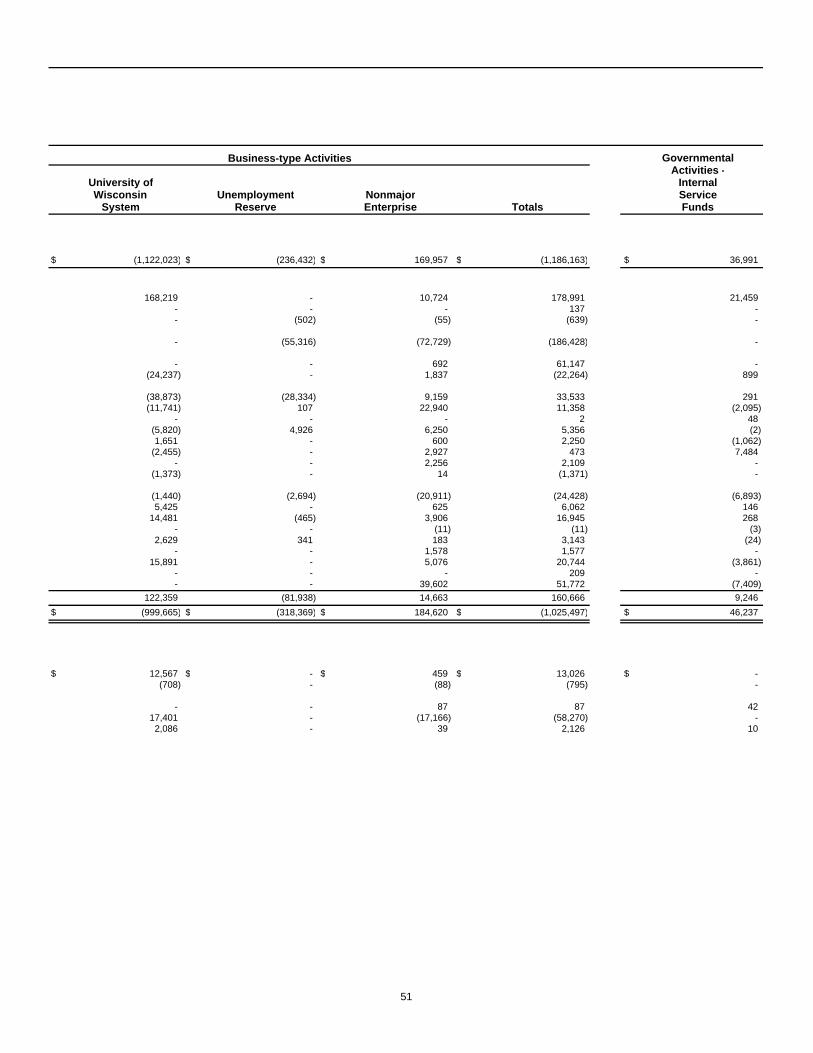
GovernmentalActivities -
University of InternalWisconsin Unemployment Nonmajor Service
System Reserve Enterprise Totals Funds
$ (1,122,023) $ (236,432) $ 169,957 $ (1,186,163) $ 36,991
168,219 - 10,724 178,991 21,459 - - - 137 - - (502) (55) (639) -
- (55,316) (72,729) (186,428) -
- - 692 61,147 - (24,237) - 1,837 (22,264) 899
(38,873) (28,334) 9,159 33,533 291 (11,741) 107 22,940 11,358 (2,095)
- - - 2 48 (5,820) 4,926 6,250 5,356 (2) 1,651 - 600 2,250 (1,062)
(2,455) - 2,927 473 7,484 - - 2,256 2,109 -
(1,373) - 14 (1,371) -
(1,440) (2,694) (20,911) (24,428) (6,893) 5,425 - 625 6,062 146
14,481 (465) 3,906 16,945 268 - - (11) (11) (3)
2,629 341 183 3,143 (24) - - 1,578 1,577 -
15,891 - 5,076 20,744 (3,861) - - - 209 - - - 39,602 51,772 (7,409)
122,359 (81,938) 14,663 160,666 9,246 $ (999,665) $ (318,369) $ 184,620 $ (1,025,497) $ 46,237
$ 12,567 $ - $ 459 $ 13,026 $ - (708) - (88) (795) -
- - 87 87 42 17,401 - (17,166) (58,270) - 2,086 - 39 2,126 10
Business-type Activities
51

State of WisconsinStatement of Fiduciary Net Assets June 30, 2004
(In Thousands)
Pensionand Other Private-Employee Investment Purpose
Benefit Trust Trust Trust Agency
Assets
Cash and Cash Equivalents $ 1,128,473 $ 2,573,261 $ 33,042 $ 75,711
Securities Lending Collateral 5,053,059 - - -
Prepaid Items 5,042 - 7 -
Receivables (net of allowance):
Prior Service Contributions Receivable 469,306 - - - Benefits Overpayment Receivable 2,312 - - - Due from Other Funds 38,843 - - 606 Due from Component Units 2,276 - - - Interfund Receivables 489,329 627,765 - - Due from Other Governments 90,563 - - - Interest and Dividends Receivable 183,001 - - - Investment Sales Receivable 368,437 - - - Other Receivables 2,584 - 181 5,231
Total Receivables 1,646,649 627,765 181 5,837
Investments: Fixed Income 16,500,477 - - - Stocks 43,081,043 - - - Limited Partnerships 2,529,989 - - - Mortgages 593,064 - - - Real Estate 417,080 - - - Investments of Private Purpose Funds - - 1,197,790 - Investments of Agency Funds - - - 743 Financial Futures Contracts 88 - - - Multi-asset Investments 1,767,683 - - -
Total Investments 64,889,426 - 1,197,790 743
Capital Assets 9 - - -
Other Assets - - 37,315 279,836
Total Assets 72,722,658 3,201,026 1,268,335 $ 362,126
LiabilitiesAccounts Payable and Other Accrued Liabilities 41,509 - 122 $ 65,488 Securities Lending Collateral Liability 5,053,059 - - - Annuities Payable 197,142 - - - Advance Contributions 289 - - - Due to Other Funds 31,272 16 15 5,701 Interfund Payables 489,329 - - - Due to Other Governments 24,023 - - - Tax and Other Deposits - - - 290,937 Investment Payable 744,480 - - - Deferred Revenue 2,177 - - - Compensated Absences Payable 1,624,942 - - -
Total Liabilities 8,208,222 16 137 $ 362,126
Net Assets
Held in Trust for Pension Benefits, Pool Participants and Other Purposes $ 64,514,436 $ 3,201,010 $ 1,268,198
The notes to the financial statements are an integral part of this statement.52

State of WisconsinStatement of Changes in Fiduciary Net Assets For the Fiscal Year Ended June 30, 2004
(In Thousands)
Pensionand Other Private-Employee Investment Purpose
Benefit Trust Trust Trust
AdditionsContributions: Employer Contributions $ 1,333,728 $ - $ - Employee Contributions 758,694 - - Total Contributions 2,092,422 - -
Deposits - 11,244,730 351,020
Investment Income: Net Appreciation (Depreciation) in Fair Value of Investments 8,498,783 - - Interest 548,335 - - Dividends 304,237 - - Securities Lending Income 46,074 - - Other 97,994 - - Investment Income of Investment, Private Purpose, and Other Employee Benefit Trust Funds 416,130 48,379 138,343 Less: - Investment Expense (146,551) (1,290) (6,468) Securities Lending Rebates and Fees (37,329) - - Investment Income Distributed to Other Funds (306,119) - - Net Investment Income 9,421,555 47,089 131,875
Interest on Prior Service Receivable 36,119 - -
Miscellaneous Income Escheat Additions - - 81,026 Other 2,380 - -
Total Miscellaneous Income 2,380 - 81,026
Total Additions 11,552,476 11,291,819 563,921
DeductionsBenefits and Refunds: Retirement, Disability, and Beneficiary 2,744,709 - - Separations 23,777 - - Total Benefits and Refunds 2,768,486 - -
Distributions 74,533 11,650,770 158,918
Insurance Premiums 421,240 - -
Unusual Write-off of Receivable (159) - -
Administrative Expense 18,415 218 10,646
Miscellaneous Expense 5 - -
Transfers Out 488 - 20,036
Total Deductions 3,283,007 11,650,987 189,601
Net Increase (Decrease) 8,269,469 (359,168) 374,320 Net Assets - Beginning of Year 56,244,967 3,560,178 893,878
Net Assets - End of Year $ 64,514,436 $ 3,201,010 $ 1,268,198
The notes to the financial statements are an integral part of this statement.53
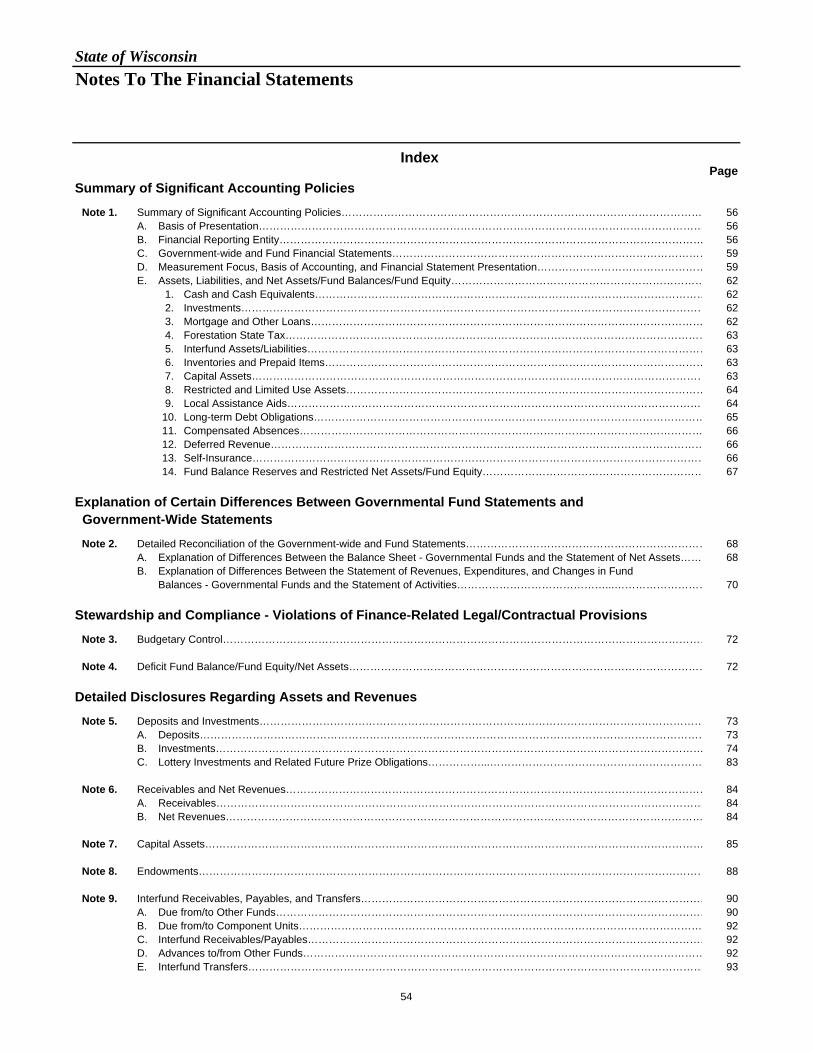
State of WisconsinNotes To The Financial Statements
PageSummary of Significant Accounting Policies
Note 1. Summary of Significant Accounting Policies………………………………………………………………………………………… 56A. Basis of Presentation……………………………………………………………………………………………………………… 56B. Financial Reporting Entity………………………………………………………………………………………………………… 56C. Government-wide and Fund Financial Statements……………………………………………………………………………… 59D. Measurement Focus, Basis of Accounting, and Financial Statement Presentation………………………………………… 59E. Assets, Liabilities, and Net Assets/Fund Balances/Fund Equity……………………………………………………………… 62
1. Cash and Cash Equivalents………………………………………………………………………………………………… 622. Investments…………………………………………………………………………………………………………………… 623. Mortgage and Other Loans………………………………………………………………………………………………… 624. Forestation State Tax………………………………………………………………………………………………………… 635. Interfund Assets/Liabilities…………………………………………………………………………………………………… 636. Inventories and Prepaid Items……………………………………………………………………………………………… 637. Capital Assets………………………………………………………………………………………………………………… 638. Restricted and Limited Use Assets………………………………………………………………………………………… 649. Local Assistance Aids………………………………………………………………………………………………………… 64
10. Long-term Debt Obligations………………………………………………………………………………………………… 6511. Compensated Absences…………………………………………………………………………………………………… 6612. Deferred Revenue…………………………………………………………………………………………………………… 6613. Self-Insurance………………………………………………………………………………………………………………… 6614. Fund Balance Reserves and Restricted Net Assets/Fund Equity……………………………………………………… 67
Explanation of Certain Differences Between Governmental Fund Statements and Government-Wide Statements
Note 2. Detailed Reconciliation of the Government-wide and Fund Statements…………………………………………………………… 68A. Explanation of Differences Between the Balance Sheet - Governmental Funds and the Statement of Net Assets…… 68B. Explanation of Differences Between the Statement of Revenues, Expenditures, and Changes in Fund
Balances - Governmental Funds and the Statement of Activities……………………………………...……………………… 70
Stewardship and Compliance - Violations of Finance-Related Legal/Contractual ProvisionsNote 3. Budgetary Control………………………………………………………………………………………………………………………… 72
Note 4. Deficit Fund Balance/Fund Equity/Net Assets………………………………………………………………………………………… 72
Detailed Disclosures Regarding Assets and RevenuesNote 5. Deposits and Investments……………………………………………………………………………………………………………… 73
A. Deposits……………………………………………………………………………………………………………………………… 73B. Investments………………………………………………………………………………………………………………………… 74C. Lottery Investments and Related Future Prize Obligations……………...…………………………………………………… 83
Note 6. Receivables and Net Revenues………………………………………………………………………………………………………… 84A. Receivables………………………………………………………………………………………………………………………… 84B. Net Revenues……………………………………………………………………………………………………………………… 84
Note 7. Capital Assets…………………………………………………………………………………………………………………………… 85
Note 8. Endowments……………………………………………………………………………………………………………………………… 88
Note 9. Interfund Receivables, Payables, and Transfers……………………………………………………………………………………… 90A. Due from/to Other Funds…………………………………………………………………………………………………………… 90B. Due from/to Component Units…………………………………………………………………………………………………… 92C. Interfund Receivables/Payables…………………………………………………………………………………………………… 92D. Advances to/from Other Funds…………………………………………………………………………………………………… 92E. Interfund Transfers………………………………………………………………………………………………………………… 93
Index
54

PageDetailed Disclosures Regarding Liabilities and Expenses/Expenditures
Note 10. Changes in Long-term Liabilities……………………………………………………………………………………………………… 94
Note 11. Bonds, Notes and Other Debt Obligations…………………………………………………………………………………………… 96A. General Obligation Bonds………………………………………………………………………………………………………… 96B. Annual Appropriation Bonds……………………………………………………………………………………………………… 99C. Revenue Bonds……………………………………………………………………………………………………………………… 101D. Refundings, Exchanges and Early Extinguishments…………………………………………………………………………… 108E. Short-term Financing……………………………………………………………………………………………………………… 110F. Certificates of Participation………………………………………………………………………………………………………… 111G. Arbitrage Rebate…………………………………………………………………………………………………………………… 112H. Moral Obligation Debt……………………………………………………………………………………………………………… 112I. Credit Agreements………………………………………………………………………………………………………………… 112
Note 12. Lease Commitments and Installment Purchases…………………………………………………………………………………… 113A. Capital Leases……………………………………………………………………………………………………………………… 113B. Operating Leases………………….……………………………………………………………………………………………… 114C. Installment Purchases……………………………………………………………………………………………………………… 114
Note 13. Retirement Plan………………………………………………………………………………………………………………………… 115
Note 14. Milwaukee Retirement System………………………………………………………………………………………………………… 116
Note 15. Other Employment Benefits…………………………………………………………………………………………………………… 120
Note 16. Public Entity Risk Pools Administered by the Department of Employee Trust Funds…………………………………………… 121A. Description of Funds……………………………………………………………………………………………………………… 121B. Accounting Policies for Risk Pools………………………………………………………………………………………………… 121C. Unpaid Claims Liabilities…………………………………………………………………………………………………………… 122D. Trend Information…………………………………………………………………………………………………………………… 122
Note 17. Self-Insurance…………………………………………………………………………………………………………………………… 123
Note 18. Insurance Funds………………………………………………………………………………………………………………………… 124A. Local Government Property Insurance Fund…………………………………………………………………………………… 124B. State Life Insurance Fund………………………………………………………………………………………………………… 125C. Injured Patients and Families Compensation Fund…………………………………………………………………………… 126D. Health Insurance Risk Sharing Plan……………………………………………………………………………………………… 127E. Wisconsin Health Care Liability Insurance Plan………………………………………………………………………………… 128
Other Note Disclosures
Note 19. Segment Information and Condensed Financial Data……………………………………………………………………………… 129
Note 20. Component Units - Condensed Financial Information............................................................................................................ 130
Note 21. Restatements of Beginning Fund Balances/Fund Equity/Net Assets and Other Changes……………………………………… 131A. Fund Statements - Governmental Funds……………………………………………………..………………………………… 131B. Fund Statements - Proprietary Funds…………………………………………………………………………………………… 131C. Fund Statements - Fiduciary Funds……………………………………………………………………………………………… 132D. Government-wide Statements…………………………………………………………………………………………………… 132
Note 22. Litigation, Contingencies and Commitments………………………………………………………………………………………… 133A. Litigation and Contingencies ……………………………………………………………………………………………………… 133B. Commitments………………………………………………………………………………………………………………………… 134
Note 23. Subsequent Events ……………………………………………………………….…………………………………………………… 135
55

State of Wisconsin
Notes To The Financial Statements
56
NOTE 1. SUMMARY OF SIGNIFICANTACCOUNTING POLICIES
A. Basis of Presentation
The accompanying basic financial statements have beenprepared in conformity with generally accepted accountingprinciples (GAAP) for governments as prescribed by theGovernmental Accounting Standards Board (GASB).
B. Financial Reporting Entity
For GAAP purposes, the State of Wisconsin includes all funds,elected offices, departments and agencies of the State, as well asboards, commissions, authorities and universities. The State hasalso considered all potential "component units" for which it isfinancially accountable, and other affiliated organizations forwhich the nature and significance of their relationship, includingtheir ongoing financial support, with the State are such thatexclusion would cause the State's financial statements to bemisleading or incomplete.
The decision to include a potential component unit in the State’sreporting entity is based on the criteria set forth in GASBStatement No. 14, The Financial Reporting Entity, and GASBStatement No. 39, Determining Whether Certain OrganizationsAre Component Units, an amendment of GASB Statement No. 14(effective beginning with Fiscal Year 2004). GASB Statement No.14 criteria include the ability to appoint a voting majority of anorganization's governing body and (1) the ability of the State toimpose its will on that organization or (2) the potential for theorganization to provide specific financial benefits to, or imposespecific financial burdens on, the State. GASB Statement No. 39provisions relate to separately legal, tax-exempt organizationsand include: (1) the economic resources received or held areentirely or almost entirely for the direct benefit of the State, (2) theState is entitled to, or has the ability to otherwise access, amajority of the economic resources received or held by theseparate organization, and (3) the economic resources receivedor held by an individual organization that the State is entitled to, orhas the ability to otherwise access, are significant to the State.
In addition, GASB Technical Bulletin No. 2004-1 (TB), TobaccoSettlement Recognition and Financial Reporting Entity Issues,became effective beginning with Fiscal Year 2004. The TBclarified guidance on whether a Tobacco Settlement Authority(TSA) that is created to obtain the rights to all or a portion offuture tobacco settlement resources is a component unit of thegovernment that created it. This guidance resulted in the BadgerTobacco Asset Securitization Corporation (BATSC), previously
reported as a discretely presented component unit, to be ablended component unit in the primary government and reportedas a debt service fund. The State has no legal liability for theobligations of BTASC.
Based upon the application of the criteria contained in GASBStatement No. 14, as amended by GASB Statement No. 39 andclarified by GASB Technical Bulletin No. 2004-1, the WisconsinPublic Broadcasting Foundation, Inc. and the Badger TobaccoAsset Securitization Corporation are reported as blendedcomponent units; and the Wisconsin Housing and EconomicDevelopment Authority, the Wisconsin Health Care LiabilityInsurance Plan, the University of Wisconsin Hospitals and ClinicsAuthority, the University of Wisconsin Foundation and the StateFair Park Exposition Center, Inc., are presented as discretecomponent units, as discussed below.
Complete financial statements of the individual component unitsthat issue separate statements can be obtained from theirrespective administrative offices:
Wisconsin Public Broadcasting Foundation Inc.Wisconsin Educational Communications Board3319 West Beltline HighwayMadison, WI 53702
Badger Tobacco Asset Securitization Corporation10 East Doty Street, Suite 800Madison, WI 53703
Wisconsin Housing and Economic Development Authority201 West Washington Avenue, Suite 700Madison, WI 53702
Wisconsin Health Care Liability Insurance PlanOffice of the Commissioner of Insurance125 South Webster StreetMadison, WI 53702
University of Wisconsin Hospitals and Clinics Authority635 Science Drive, Room 310Madison, WI 53711
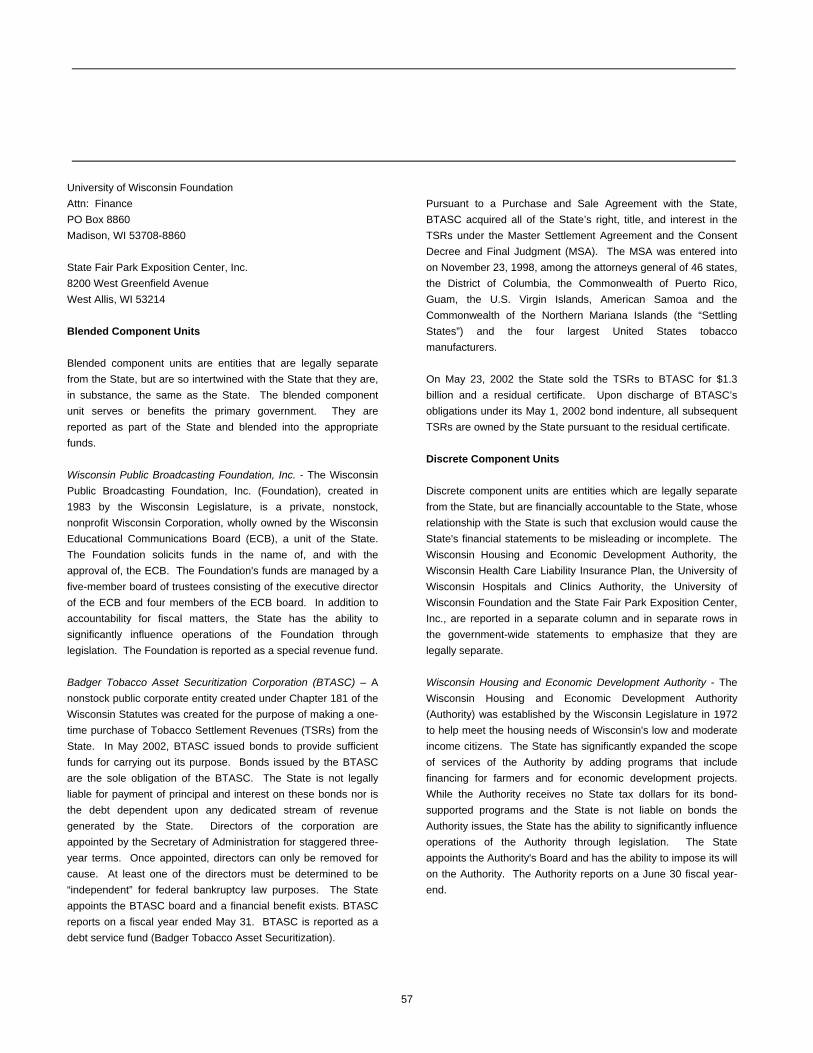
57
University of Wisconsin FoundationAttn: FinancePO Box 8860Madison, WI 53708-8860
State Fair Park Exposition Center, Inc.8200 West Greenfield AvenueWest Allis, WI 53214
Blended Component Units
Blended component units are entities that are legally separatefrom the State, but are so intertwined with the State that they are,in substance, the same as the State. The blended componentunit serves or benefits the primary government. They arereported as part of the State and blended into the appropriatefunds.
Wisconsin Public Broadcasting Foundation, Inc. - The WisconsinPublic Broadcasting Foundation, Inc. (Foundation), created in1983 by the Wisconsin Legislature, is a private, nonstock,nonprofit Wisconsin Corporation, wholly owned by the WisconsinEducational Communications Board (ECB), a unit of the State.The Foundation solicits funds in the name of, and with theapproval of, the ECB. The Foundation's funds are managed by afive-member board of trustees consisting of the executive directorof the ECB and four members of the ECB board. In addition toaccountability for fiscal matters, the State has the ability tosignificantly influence operations of the Foundation throughlegislation. The Foundation is reported as a special revenue fund.
Badger Tobacco Asset Securitization Corporation (BTASC) – Anonstock public corporate entity created under Chapter 181 of theWisconsin Statutes was created for the purpose of making a one-time purchase of Tobacco Settlement Revenues (TSRs) from theState. In May 2002, BTASC issued bonds to provide sufficientfunds for carrying out its purpose. Bonds issued by the BTASCare the sole obligation of the BTASC. The State is not legallyliable for payment of principal and interest on these bonds nor isthe debt dependent upon any dedicated stream of revenuegenerated by the State. Directors of the corporation areappointed by the Secretary of Administration for staggered three-year terms. Once appointed, directors can only be removed forcause. At least one of the directors must be determined to be“independent” for federal bankruptcy law purposes. The Stateappoints the BTASC board and a financial benefit exists. BTASCreports on a fiscal year ended May 31. BTASC is reported as adebt service fund (Badger Tobacco Asset Securitization).
Pursuant to a Purchase and Sale Agreement with the State,BTASC acquired all of the State’s right, title, and interest in theTSRs under the Master Settlement Agreement and the ConsentDecree and Final Judgment (MSA). The MSA was entered intoon November 23, 1998, among the attorneys general of 46 states,the District of Columbia, the Commonwealth of Puerto Rico,Guam, the U.S. Virgin Islands, American Samoa and theCommonwealth of the Northern Mariana Islands (the “SettlingStates”) and the four largest United States tobaccomanufacturers.
On May 23, 2002 the State sold the TSRs to BTASC for $1.3billion and a residual certificate. Upon discharge of BTASC’sobligations under its May 1, 2002 bond indenture, all subsequentTSRs are owned by the State pursuant to the residual certificate.
Discrete Component Units
Discrete component units are entities which are legally separatefrom the State, but are financially accountable to the State, whoserelationship with the State is such that exclusion would cause theState's financial statements to be misleading or incomplete. TheWisconsin Housing and Economic Development Authority, theWisconsin Health Care Liability Insurance Plan, the University ofWisconsin Hospitals and Clinics Authority, the University ofWisconsin Foundation and the State Fair Park Exposition Center,Inc., are reported in a separate column and in separate rows inthe government-wide statements to emphasize that they arelegally separate.
Wisconsin Housing and Economic Development Authority - TheWisconsin Housing and Economic Development Authority(Authority) was established by the Wisconsin Legislature in 1972to help meet the housing needs of Wisconsin's low and moderateincome citizens. The State has significantly expanded the scopeof services of the Authority by adding programs that includefinancing for farmers and for economic development projects.While the Authority receives no State tax dollars for its bond-supported programs and the State is not liable on bonds theAuthority issues, the State has the ability to significantly influenceoperations of the Authority through legislation. The Stateappoints the Authority's Board and has the ability to impose its willon the Authority. The Authority reports on a June 30 fiscal year-end.
State of Wisconsin Notes to The Financial Statements
58
Wisconsin Health Care Liability Insurance Plan - The WisconsinHealth Care Liability Insurance Plan (Plan) was established byrule of the Commissioner of Insurance of the State of Wisconsinto provide health care liability insurance and liability coveragenormally incidental to health care liability insurance to eligiblehealth care providers in the State. Eight out of 13 members of theBoard of Directors are appointed by the Governor, and the Statehas the ability to impose its will upon the Plan. The Plan reportson a fiscal year ended December 31.
University of Wisconsin Hospitals and Clinics Authority – TheUniversity of Wisconsin Hospitals and Clinics Authority (Hospital)is a not-for-profit academic medical center. The Hospital operatesan acute-care hospital with approximately 480 available beds,numerous specialty clinics, and seven ambulatory facilitiesproviding comprehensive health care to patients, educationprograms, research and community service to residents ofsouthern Wisconsin. Prior to June 1996, the Hospital was a unitof the University of Wisconsin-Madison. In June 1996, inaccordance with legislation enacted by the State Legislature, theHospital was restructured as a Public Authority, a public bodycorporate and politic created by State statutes. The Stateappoints a majority of the Hospital’s Board of Directors and afinancial benefit/burden relationship exists between the Hospitaland the State. The Hospital reports on a June 30 fiscal year-end.
The legislation that created the Hospital Authority also provided,among other things, for the Board of Regents of the University ofWisconsin System to execute various agreements with theHospital. These agreements include an Affiliation Agreement, aLease Agreement, a Conveyance Agreement and a ContractualServices Agreement and Operating and Service Agreement.
The Affiliation Agreement requires the Hospital to continue tosupport the educational, research and clinical activities of theUniversity of Wisconsin-Madison, which are administered by theHospital. Under the terms of a Lease Agreement, the Hospitalleases facilities, which were occupied by the Hospital as of June29, 1996 (see Note 12A to the financial statements). Under aConveyance Agreement, certain assets and liabilities related tothe Hospital were identified and transferred to the Hospitaleffective July 1, 1996. Subject to the Contractual ServicesAgreement and Operating and Service Agreement between theBoard of Regents and the Hospital, the two parties have enteredinto contracts for the continuation of services in support ofprograms and operations.
University of Wisconsin Foundation – The University of WisconsinFoundation (the Foundation) is a legally separate, tax-exemptcomponent unit of the State. The Foundation acts primarily as afund-raising organization to supplement the resources that areavailable to the University of Wisconsin-Madison and severalother units of the University of Wisconsin System (a fund of theState) in support of its programs. These include scientific, literary,athletic and educational program purposes. Although the Statedoes not control the timing or amount of receipts from theFoundation, the majority of resources, or income thereon, that theFoundation holds and invests are restricted to the activities of theUniversity of Wisconsin-Madison and other units of the Universityof Wisconsin System by the donors. Because these restrictedresources held by the Foundation can only be used by, or for thebenefit of, the University of Wisconsin-Madison and several otherunits of the University of Wisconsin System, the Foundation isconsidered a component unit of the State. The Foundationreports on a fiscal year ended December 31.
State Fair Park Exposition Center, Inc. – In October 2000, theState Fair Park Exposition Center, Inc. (the Center) wasorganized by the State of Wisconsin State Fair Park as anonstock, not-for-profit corporation under the Internal RevenueCode 501(c)(3). Authorization for the Center’s organization isfound under Chapter 42, Wis. Stats. The Center has broadgeneral powers that include approving the sale, lease, orpurchase of any real estate and obtaining financing through loansor other methods. The board of the Center includes thechairperson of the State Fair Park Board, and three membersappointed by the Center’s Board. In addition to the Stateappointing a voting majority of the Center, the State is able toimpose its will on the Center, and a financial benefit relationshipexists. The Center reports on a fiscal year ended December 31.

State of Wisconsin Notes to The Financial Statements
59
Related Organizations
These related organizations are excluded from the reporting entitybecause the State's accountability does not extend beyondappointing a voting majority of the organization's board members.Financial statements are available from the respectiveorganizations.
Wisconsin Health and Educational Facilities Authority - a publicbody politic and corporate that provides financing for capitalexpenditures and refinancing of indebtedness for Wisconsinhealth care and educational institutions.
Bradley Center Sports and Entertainment Corporation - a publicbody politic and corporate that operates the Bradley Center.
World Dairy Center Authority - an authority created to establish acenter for the development of dairying in the United States andthe world; to analyze worldwide trends in the dairy industry andrecommend actions to be taken by the State; promote dairy cattle,technology, products and services; and develop new markets fordairy and dairy-related products.
Wisconsin Advanced Telecommunications Foundation -organized as a nonstock corporation, administers an endowmentfund to support advanced telecommunications technologyapplication projects and efforts to educate telecommunicationsusers about advanced services.
C. Government-wide and Fund FinancialStatements
The government-wide financial statements consist of thestatement of net assets and the statement of activities.
These statements report information on all activities, except forfiduciary activities, of the primary government and its componentunits. The statement of net assets and the statement of activitiesdistinguish between the governmental and business-typeactivities of the State. Governmental activities are generallyfinanced through taxes, intergovernmental revenues and othernonexchange revenues. Business-type activities are generallyfinanced in whole or in part by fees charged to external parties forgoods and services. The focus of the government-widestatements is the primary government. A separate column on thestatement of net assets and the statement of activities reportsactivities for all discretely presented component units.
The fund financial statements provide detailed information on allgovernmental, proprietary and fiduciary funds. Separate columnsare presented for all major governmental and enterprise funds.Nonmajor governmental and enterprise funds are aggregated andpresented as a single column on the respective governmental orproprietary statements. Internal service funds are exempt from
the major fund reporting requirements and are aggregated andultimately reported as a single column on the proprietarystatement. Fiduciary funds are also exempt from major fundreporting and are aggregated by fund type and ultimately reportedas single columns on the fiduciary statements.
D. Measurement Focus, Basis of Accounting,and Financial Statement Presentation
The government-wide statement of net assets and statement ofactivities, as well as the proprietary and fiduciary fund statements,are reported using the economic resources measurement focusand the accrual basis of accounting. With this measurementfocus, all assets and liabilities associated with the operation ofthese funds are included on the balance sheet. Under the accrualbasis, revenues are recorded when earned and expenses arerecorded when the related liability is incurred.
In the University of Wisconsin System's enterprise fund, revenuesand expenses of an academic term that spans two fiscal years arerecognized in two years based on a proration of summer schooldays.
In reporting the financial activity of its proprietary funds, except forthe State Life Insurance Fund, the State applies all applicableGASB pronouncements as well as the following pronouncementsissued on or before November 30, 1989, unless thesepronouncements conflict with or contradict GASBpronouncements: Financial Accounting Standards Board (FASB)Statements and Interpretations, Accounting Principles BoardOpinions, and Accounting Research Bulletins of the Committeeon Accounting Procedure. The State Life Insurance Fund isreported as an insurance enterprise fund and, accordingly,applies the provisions of relevant pronouncements of FASB,including those issued after November 30, 1989.
The Wisconsin Health Care Liability Insurance Plan (Plan) andthe State Fair Park Exposition Center, Inc. (the Center) arereported as component units, and in applying GAAP, haveelected to apply the provisions of relevant pronouncements ofFASB including those issued after November 30, 1989.
The University of Wisconsin Foundation, a discretely presentedcomponent unit, prepares its separately issued financialstatements on the basis of cash receipts and disbursements. Thefinancial information presented in the State’s government-widefinancial statements and the accompanying footnote disclosureshas been adjusted to an accrual basis in conformity with GAAP.Certain accrual adjustments not reported are not consideredmaterial.
State of Wisconsin Notes to The Financial Statements
60
Governmental fund financial statements are accounted for usingthe current financial resources measurement focus. With thismeasurement focus, only current assets and current liabilitiesgenerally are included on the balance sheet. Operatingstatements of these funds present increases (i.e., revenues andother financing sources) and decreases (i.e., expenditures andother financing uses) in net available financial resources.
Governmental funds are reported on the modified accrual basis ofaccounting. This basis of accounting recognizes revenuesgenerally when they become measurable and available to paycurrent reporting period liabilities. For this purpose, the Stateconsiders tax revenues to be available if they are collected within60 days of the end of the current fiscal year end. Other revenuesare considered to be available if received within one year after thefiscal year end. Material revenue sources susceptible to accrualinclude individual and corporate income taxes, sales taxes, publicutility taxes, motor fuel taxes and federal revenues.
Expenditures and related liabilities are recognized whenobligations are incurred as a result of the receipt of goods andservices. However, expenditures related to debt service,compensated absences, and claims and judgments, are recordedonly when payment is due.
The State reports the following major funds:
Major Governmental Funds
• General Fund - the primary operating fund of the State,accounts for all financial transactions except those required tobe accounted for in another fund.
• Transportation Fund - accounts for the proceeds from motorfuel taxes, vehicle registrations, licensing fees, and federal andlocal governments which are used to supply and support safe,efficient and effective transportation in Wisconsin.
Major Enterprise Funds
• Injured Patients and Families Compensation Fund – accountsfor the program to provide excess medical malpracticeinsurance for Wisconsin health care providers. The revenuesto finance this insurance are primarily derived fromassessments against health care providers.
• Environmental Improvement Fund – accounts for financialresources generated and used for clean water projects.Federal capitalization grants, interest earnings, revenue bondproceeds, and general obligation bond proceeds are its primaryrevenue sources.
• Veterans Mortgage Loan Repayment Fund – accounts for theissuance and administration of veterans’ first mortgage loans.Revenues are primarily derived from bond proceeds, mortgagepayments, and investment income.
• University of Wisconsin System Fund – accounts for the 13universities, 13 two-year colleges, the University of WisconsinExtension and System Administration.
• Unemployment Reserve Fund – accounts for unemploymentcontributions made by employers, federal program receipts,benefit payment recoveries and unemployment benefits paid tolaid off workers in the State.
In addition, the State reports the following fund types:
Governmental Funds
• Special Revenue Funds – account for the proceeds of specificrevenue sources (other than for major capital projects) that arelegally restricted to expenditure for specified purposes.Examples include the Conservation Fund and the PetroleumInspection Fund.
• Debt Service Funds – account for the accumulation ofresources for, and the payment of, general long-term debtprincipal and interest.
• Capital Projects Funds – account for financial resources to beused for the acquisition or construction of major capital facilities(other than those financed by proprietary funds).
• Permanent Funds – account for resources that are legallyrestricted to the extent that only earnings and not principal, maybe used for purposes that support the State’s programs.
Proprietary Funds
• Enterprise Funds – account for the activities for which fees arecharged to external users for goods or services. Examplesinclude the Lottery Fund and the Veterans Trust Fund.
• Internal Service Funds – account for the operations of Stateagencies which provide goods or services to other State unitsor other governments on a cost-reimbursement basis. Theseservices include technology, fleet management, financial,facilities management, and risk management. Additional goodsand services are provided by the inmate work experienceprogram, Badger State Industries.

State of Wisconsin Notes to The Financial Statements
61
Fiduciary Funds
• Pension and Other Employee Benefit Trust Funds – account forthe Wisconsin Retirement System as well as other employeebenefit programs including accumulated sick leave, employeereimbursement accounts, life insurance and deferredcompensation.
• Investment Trust Funds – account for the local governmentinvestment pool managed by the State Treasurer and theMilwaukee Retirement System.
• Private-purpose Trust Funds – account for escheated propertyheld by the State for private individuals and the State-sponsored college savings programs.
• Agency Funds – account for assets held by the State forinmates and residents of state facilities, deposits of bank andinsurance companies doing business in the state, assets ofliquidated insurance companies to insure payments toclaimants, and the collection and disbursement of court-ordered support payments.
Amounts reported as program revenues on the government-widestatement of activities include (a) charges for services – amountsreceived from customers or applicants who purchase, use ordirectly benefit from the goods, services or privileges provided bythe State; or investment and interest earnings from various loanand insurance funds/component units, (b) program-specificoperating grants and contributions, and (c) program-specificcapital grants and contributions. General revenues consist oftaxes and all other revenues that do not meet the definition ofprogram revenues. Special items, if any, are significanttransactions or events within the control of management that areeither unusual in nature or infrequent in occurrence.
As a general rule, the effect of interfund activity has beeneliminated from the government-wide financial statements. Thisincludes all internal service fund activity, as well as, other internalallocations. Exceptions to this general rule are certain chargesbetween various functions of the government, whose eliminationwould distort the direct costs and program revenues reported forthe various functions concerned.
The revenues and expenses shown on the proprietary fundstatements are identified as either operating or nonoperating.Operating revenues and expenses generally result from providinggoods and services in connection with a proprietary fund’s primarymission. The State’s enterprise funds are involved in manydiverse fields including patient care, insurance programs, loanprograms, the University of Wisconsin System, employee benefitplans, and the lottery. The internal service funds provide servicesand goods to other State agencies and departments.
A significant portion of operating revenues for the proprietaryfunds are recorded under charges for goods and services. In thecase of the State’s insurance and loan enterprise funds,investment and interest income is an important component ofoperating revenue. Operating revenues of the University ofWisconsin include tuition and fees, certain grants and contractsresulting from exchange transactions, and sales and services ofeducational activities and auxiliary enterprises. In regards to theemployee benefit plans, the primary operating revenue source isparticipant and employer contributions. Operating expenses forthe proprietary funds include the costs of sales and services,benefit expenses, administration expenses and depreciation oncapital assets. All revenues and expenses not related to a fund’sprimary purpose are reported as nonoperating.
When both restricted and unrestricted resources are available foruse, it is the State’s policy to use restricted resources first, thenunrestricted resources as they are needed.

State of Wisconsin Notes to The Financial Statements
62
E. Assets, Liabilities, and Net Assets/FundBalances/Fund Equity
1. Cash and Cash Equivalents
Cash balances of most funds are deposited with the StateTreasurer where the available balances beyond immediate needsare pooled in the State Investment Fund for short-term investmentpurposes. Balances pooled are restricted to legally stipulatedinvestments valued consistent with GASB Statement No. 31,Accounting and Financial Reporting for Certain Investments andfor External Investment Pools. Cash balances not controlled bythe State Treasurer may be invested where permitted by statute.
Cash and cash equivalents, reported on the balance sheet andstatement of cash flows, include bank accounts, petty cash, cashin transit, short-term investments with an original maturity of threemonths or less such as certificates of deposit, money marketcertificates and repurchase agreements and individual funds'shares in the State Investment Fund.
2. Investments
Primary Government
The State may invest in direct obligations of the United States andCanada, securities guaranteed by the United States, certificatesof deposit issued by banks in the United States and solventfinancial institutions in the State, commercial paper andnonsecured corporate notes and bonds, bankers acceptances,participation agreements, privately placed bonds and mortgages,common and preferred stock and other securities approved byapplicable sections of the Wisconsin Statutes, bond resolutions,and various trust indentures (see Note 5 to the financialstatements).
Generally, investments of the primary government are reported atfair value consistent with the provisions of GASB Statement No.31, Accounting and Financial Reporting for Certain Investmentsand for External Investment Pools. Typically, fair valueinformation is determined using quoted market prices. However,when quoted market prices are not available for certain securities,fair values are estimated through techniques such as discountedfuture cash flows, matrix pricing and multi-tiers.
There are a certain number of securities carried at cost. Certainnon-public or closely held stock are carried at cost since noindependent quotation is available to price these securities.Further, certain investment agreements are reported on a costbasis because the State cannot readily determine whether theseagreements meet the definition of interest-earning investmentcontracts as defined by GASB Statement No. 31. However, theimpact on the financial statements is immaterial.
Under Wisconsin Statutes, the investment earnings of certainPermanent Funds are assigned to other funds. The followingtable shows the funds earning the investment income and theultimate recipients of that income:
Fund Generating Fund Receiving Investment Income Investment Income
Agricultural College University of Wisconsin SystemNormal School GeneralUniversity University of Wisconsin SystemBenevolent General
Component Units
Except for forward delivery agreements, investments of theBadger Tobacco Asset Securitization Corporation, a blendedcomponent unit, are reported at fair value. Forward deliveryagreements are securities with maturities of one year or less andare reported at cost.
Investments of the Wisconsin Housing and EconomicDevelopment Authority (the Authority) are reported at fair valuebased on quoted market prices. Collateralized anduncollateralized investment agreements are not transferable andare considered nonparticipating contracts. As such, both types ofinvestment agreements are reported at contract value.
Investments of the University of Wisconsin Hospitals and ClinicsAuthority (the Hospital) in equity securities with readilydeterminable fair values and all investments in debt securities arereported at fair value based on quoted market prices.
Certain investments of the Wisconsin Health Care LiabilityInsurance Plan are reported on a cost basis; however, the impacton the financial statements is not material.
Investments of the University of Wisconsin Foundation areprimarily reported at fair value.
3. Mortgage and Other Loans
Mortgage loans of the Wisconsin Housing and EconomicDevelopment Authority, a component unit, are carried at theirunpaid principal balance, less allowance for possible loan losses.Loan origination fees and associated costs are deferred andrecognized as income or expenses over the projected life of theloan.
Mortgage loans of the Veterans Mortgage Loan Repayment Fundand the Veterans Trust Fund programs, business-type activities,are stated at the outstanding loan balance with origination feesand associated costs deferred and recognized over a fifteen yearperiod using the straight-line method.
State of Wisconsin Notes to The Financial Statements
63
4. Forestation State Tax
The State levies an annual tax of two-tenths of one mill for eachdollar of the assessed valuation of the property in the State, asdescribed in Wis. Stat. Sec. 70.58. This tax is levied for thepurpose of acquiring, preserving and developing the forests of thestate; for forest crop law and county forest law administration andaid payments; and for the acquisition, purchase and developmentof forests. The proceeds of the tax are paid to the ConservationFund.
This tax, the only property tax levied by the State, is levied toeach county on or before the fourth Monday in August of eachyear on assessed valuation as of January 1 of that year. The taxis due and payable January 31 or on the due dates establishedthrough an installment option permitted under Wis. Stat. Sec.74.12.
Consistent with the requirements of GASB Interpretation No. 5,Property Tax Revenue Recognition in Governmental Funds,collections received July 1 through August 31 that were due butunpaid at June 30 are accrued.
5. Interfund Assets/Liabilities
During the course of operations, numerous transactions occurbetween individual funds for goods provided or services rendered.The balance sheet classifies these receivables and payables as"Due from Other Funds" or "Due to Other Funds." Short-terminterfund loans are classified as "Interfund Receivables" or"Interfund Payables."
Long-term interfund loans are classified as "Advances to OtherFunds" and "Advances from Other Funds." Advances to OtherFunds, as reported in the governmental fund financial statements,are offset with a fund balance reserve to indicate that they areneither available for appropriation nor expendable availablefinancial resources.
Balances that exist between the primary government andcomponent units are classified as “Due to/from PrimaryGovernment” and, correspondingly, “Due to/from ComponentUnits”. Further, cash and investments invested by onecomponent unit with another component unit are reported on thestatement of net assets as “Cash and Investments with OtherComponent Units” and “Amounts Held in Trust by ComponentUnits for Other Component Units”.
Amounts reported in the funds as interfund assets/liabilities areeliminated in the governmental and business-type columns of theStatement of Net Assets, except for the net residual amount duebetween governmental and business-type activities which isshown as internal balances.
6. Inventories and Prepaid Items
Inventories of governmental and proprietary funds are valued atcost, which approximates market, using the first-in/first-out, lastin/first out, or weighted-average method. The costs ofgovernmental fund-type inventories are recorded as expenditureswhen purchased rather than when consumed.
Inventories of the University of Wisconsin System held by centralstores are valued at average cost, fuels are valued at market, andother inventories held by individual institutional cost centers arevalued using a variety of cost flow assumptions that, for each typeof inventory, are consistently applied from year to year.
Prepaid items reflect payments for costs applicable to futureaccounting periods.
The fund balances of governmental funds are reserved forinventories and prepaid items, except in cases where prepaiditems are offset by deferred revenues, to indicate that theseaccounts do not represent expendable available financialresources.
7. Capital Assets
Capital assets, which include property, plant, equipment, land andinfrastructure assets (roads, bridges, and buildings considered anancillary part of roads), are reported in the applicablegovernmental or business-type activities columns in thegovernment-wide financial statements. Assets of the primarygovernment, other than infrastructure and land purchased for theconstruction of infrastructure assets, are capitalized when theyhave a unit cost of $5,000 or more (except for a collection oflibrary resources that must have a cumulative value equal to orgreater than $5.0 million) and a useful life of two or more years.Assets of the discretely presented component units arecapitalized when they have a unit cost of $5,000 or more, exceptfor the University of Wisconsin Foundation, which capitalizesassets greater than $2,500, and the State Fair Park ExpositionCenter, Inc., which capitalizes assets greater than $500.
Purchased or constructed capital assets are valued at cost orestimated historical cost if actual historical cost is not practicablydeterminable. Donated capital assets are recorded at their fairvalue at the time received.

State of Wisconsin Notes to The Financial Statements
64
The State has elected to report infrastructure assets (roads,bridges and buildings considered an ancillary part of roads) usingthe modified approach. Under this method infrastructure assetsare not required to be depreciated if the State manages its eligibleinfrastructure assets using an asset management systemdesigned to maintain and preserve its infrastructure assets at acondition level established and disclosed by the State. Allinfrastructure assets constructed prior to July 1, 2000 have beenrecorded at estimated historical cost. The estimated historicalcost was determined by calculating current cost of a similar assetand deflating that cost through the use of a price-index to theestimated average construction date. Costs, which exclude rightof way, are expressed in 2000 dollars and deflated back to theaverage construction date using the Federal HighwayAdministration’s composite index for federal-aid highwayconstruction. The costs of maintenance and preservation that donot add to the asset’s capacity or efficiency are not capitalized.Interest incurred during construction is not capitalized.
Exhaustible capital assets of the primary government and thecomponent units generally are depreciated on the straight-linemethod over the asset’s useful life. Select buildings of theUniversity of Wisconsin System are depreciated using thecomponentized method over the estimated useful life of therelated assets. Depreciation expense is recorded in thegovernment-wide financial statements, as well as the proprietaryfunds and component units. There is no depreciation recordedfor land, construction in process, infrastructure and other capitalassets defined as inexhaustible (except for construction inprogress reported by the University of Wisconsin System, which isincluded in the applicable major capital assets categories).Generally, estimated useful lives are as follows:
Buildings and improvements 2 - 40 yearsEquipment, machinery and furnishings 2 - 27 years
Collections of works of art, historical treasures, and similar assets,which are on public display, used in furtherance of historicaleducation, or involved in advancement of artistic or historicalresearch, are not capitalized unless these collections werealready capitalized at June 30, 1999. Collections range frommemorabilia on display in the Wisconsin Veterans Museum, theWisconsin Historical Society Museum and other museums tobuildings such as the Villa Louis Mansion and the Fur TradeMuseum located at the Villa Louis historical site. In addition,works of art or historical treasures on display in the various Stateoffice buildings, as well as statues on display outside the StateCapitol, also are not capitalized.
8. Restricted and Limited Use Assets
Governmental fund and proprietary fund assets required to beheld and/or used as specified in bond indentures, bondresolutions, trustee agreements, board resolutions, and donorspecifications have been reported as Restricted and Limited UseAssets. Likewise, assets of the Wisconsin Housing andEconomic Development Authority, the University of WisconsinHospitals and Clinics Authority, and the University of WisconsinFoundation (discretely presented component units) that meetsimilar criteria have been reported as Restricted and Limited UseAssets. These assets are classified into four categories: Cashand Cash Equivalents, Investments, Cash and Investments withOther Component Units, and Other Restricted Assets. 9. Local Assistance Aids
Municipal and County Shared Revenue Program
Through the Municipal and County Shared Revenue Program, theState distributes general revenues collected from general Statetax sources to municipal and county governments to be used forproviding local government services. State statutes require thatpayment to local governments be made during July andNovember. Through Wis. Stat. Sec. 20.835(1)(t) and (u), theState transferred moneys from the Transportation Fund and theUtility Public Benefits Fund in the amounts of $230.0 million and$17.6 million, respectively, in order to fund the Fiscal Year 2004payment to the local governments.
At June 30, 2004, the State was liable to various localgovernments for unpaid shared revenue aid. To measure theamount of the program allocable to the State's fiscal year, theamount is prorated over portions of recipient local governments’calendar fiscal years that are within the State's fiscal year. Theresult is that a liability of $474.9 million representing one-half ofthe total appropriated amount is reported at June 30, 2004 as DueTo Other Governments.
State Property Tax Credit Program
At June 30, 2004, the State was liable to various taxingjurisdictions for property tax credits paid through the StateProperty Tax Credit Program. Under the program, payments tolocal taxing jurisdictions provide property tax relief directly totaxpayers in the form of State credits on individual property taxbills. State statutes require that payment to local taxingjurisdictions be made during July. Although the property tax creditis calculated on the property tax levy for school purposes, theState's July payment is paid to an administering municipality whotreats the payment the same as other tax collections anddistributes the collections to the various tax levying jurisdictions(e.g., cities; towns; villages; school districts; technical colleges).
State of Wisconsin Notes to The Financial Statements
65
The school portion of the property tax credit liability represents theamount of the July payment earned over the school districts'previous fiscal year ended June 30. Since the entire schooldistricts' portion of the July payment occurs within the State'sfiscal year, 100 percent of the July payment relating to the schooltaxing jurisdictions' levy is reported as a liability at June 30, 2004.
The general government portion of the property tax credit liabilityrepresents the amount of the July payment prorated over theportion of the local governments' calendar year which is within theState's fiscal year. The result is that 50 percent of the Julypayment based on the general government taxing jurisdictions'levy is reported as a liability at June 30, 2004.
The aggregated State Property Tax Credit Program liability of$354.7 million is reported in the General Fund as Due to OtherGovernments.
Lottery Property Tax Credit Program
The Lottery Property Tax Credit provides direct property tax reliefto taxpayers in the form of State Credits on property tax bills.Under the program, owners of property used as a primaryresidence receive a tax credit equal to the school property tax ona portion of the dwelling’s value.
The State pays municipal treasurers for lottery credits whodistribute the moneys to the various taxing jurisdictions. Forcredits reducing the calendar year 2004 property tax bills, theState made this payment in March 2004.
The Lottery Tax Credit Program is accounted for in the LotteryFund, an enterprise fund, that records revenues and expenses onthe accrual basis. A portion of the State’s March paymentdistributed to the general government taxing jurisdictions appliesto their fiscal year that ends on December 31. Therefore, part ofthe March distribution represents an expense of the State inFiscal Year 2004, while the remaining portion represents aprepaid item. The resulting Prepaid Item reported within theLottery Fund totals $29.2 million at June 30, 2004.
State Aid for Exempt Computers
The Aid for Exempt Computers compensates local governmentsfor tax base lost due to the property tax exemption for computers,software and related equipment. Aid payments are calculatedusing a procedure that results in an aid amount equal to theamount of taxes that would be paid if the property were taxable.Payments to local governments are made on the first Monday inMay.
A portion of the May payment distributed to the generalgovernment taxing jurisdictions, Tax Incremental Districts, andspecial districts applies to their fiscal period ending December 31.Therefore, part of the May distribution represents an expense tothe State in Fiscal Year 2004, while the remaining portionrepresents a prepaid item. The resulting Prepaid Item within theGeneral Fund totals $21.0 million at June 30, 2004.
10. Long-term Debt Obligations
In the government-wide financial statements, and proprietary fundtypes in the fund financial statements, long-term debt is reportedas a liability. Bond premiums and discounts, as well as issuancecosts, are deferred and amortized using the effective interest ratemethod on a prospective basis beginning in Fiscal Year 2002,except for the annual appropriation bonds that are amortizedratably over the life of the obligations to which they relate. Bondspayable are reported net of the applicable bond premium ordiscount. Bond issuance costs are reported as deferred charges.
In the fund financial statements, governmental fund typesrecognize bond premiums and discounts, as well as bondissuance costs, during the current period. The face amount ofdebt issued is reported as other financing sources. Premiumsand discounts on debt issuances are reported as other financingsources and other financing uses, respectively.
Debt issuance costs, as well as bond premiums and discounts,relating to revenue obligations of the Environmental ImprovementFund, an enterprise fund, were deferred and are being amortizedusing the effective interest rate method.
Debt issuance costs relating to general obligation bonds of theVeterans Mortgage Loan Repayment Fund and the University ofWisconsin System Fund, both enterprise funds, are amortizedratably over the life of the obligations to which they relate. On thegovernment-wide financial statements, bond premiums anddiscounts, as well as issuance costs, related to the TransportationRevenue Bonds and the Petroleum Inspection Fee ObligationRevenue Bonds (which finance programs in a capital projectsfund and a special revenue fund, respectively) are also amortizedratably over the life of the obligations to which they relate.Results from the use of this method do not vary materially fromthose that would be obtained by use of the effective interest ratemethod.
Debt issuance costs, and bond premiums and discounts, of theWisconsin Housing and Economic Development Authority and theUniversity of Wisconsin Hospitals and Clinics Authority, bothdiscretely presented component units, are amortized ratably overthe life of the obligations to which they relate.

State of Wisconsin Notes to The Financial Statements
66
Debt issuance costs, bond premiums and discounts of the BadgerTobacco Asset Securitization Corporation, a blended componentunit, are capitalized and amortized over the lives of the relateddebt using the interest method.
Debt issuance costs of the State Fair Park Exposition Center,Inc., a component unit, are being amortized using the effective-interest method over the life of the related bonds.
11. Compensated Absences
Consistent with the compensated absences reporting standardsof GASB Statement No. 16, Accounting for CompensatedAbsences, an accrual for certain salary-related paymentsassociated with annual leave and an accrual for sick leave isincluded in the compensated absences liability at year end.
Annual Leave
Full-time employees' annual leave days are credited on January 1of each calendar year at a minimum of 10 days per year. There isno requirement to use annual leave. However, unused leave islost unless approval to carry over the unused portion is obtainedfrom the employing agency. Compensatory time accumulates foreligible employees for hours worked in excess of forty hours perweek. Each full-time employee is eligible for three and one-halfpersonal holidays each calendar year, provided the employee is inpay status for at least one day in the year. If a holiday occurs ona Saturday, employees receive leave time proportional to theirworking status to use at their discretion.
The State's compensated absence liability at June 30 consists ofaccumulated unpaid annual leave, compensatory time, personalholiday hours, and Saturday/legal hours earned and vested duringJanuary through June. The liability is reported in the government-wide, proprietary fund types and fiduciary funds.
Sick Leave
Full-time employees earn sick leave at a rate of five hours per payperiod. Unused sick leave is accumulated from year to yearwithout limit until termination or retirement. Accumulated sickleave is not paid. However, at employee retirement theaccumulated sick leave may be converted to pay for the retiree'shealth insurance premiums. The State accumulates resources topay for the expected health insurance premiums of retiredemployees. That portion of the total health insurance obligationfor which the State has already accumulated resources ispresented in the Accumulated Sick Leave Fund, a pension andother employee benefit trust fund.
12. Deferred Revenue
In the government-wide statements and proprietary fund financialstatements deferred revenue represents amounts for which assetrecognition criteria have been met, but for which revenuerecognition criteria have not been met. Deferred revenues arisewhen resources are received by the State before it has a legalclaim to them, as when grant moneys are received prior to theincurrence of qualifying expenditures. In subsequent periods,when both revenue recognition criteria are met, or when the Statehas a legal claim to the resources, the liability for deferredrevenue is removed and revenue is recognized. In thegovernmental fund statements revenues are also deferred foramounts that are unearned or unavailable.
Deferred revenues of the University of Wisconsin System consistof payments received but not earned at June 30, 2004, primarilyfor summer session tuition, tuition and room deposits for the nextfall term, advance ticket sales for upcoming intercollegiate athleticevents, and amounts received from grant and contract sponsorsthat have not yet been earned under the terms of the agreement.
13. Self-Insurance
Consistent with the requirements of GASB Statement No. 10,Accounting and Financial Reporting for Risk Financing andRelated Insurance Issues, the State’s risk management activitiesare reported in an internal service fund, and the claims liabilitiesassociated with that fund are reported therein.
The State's policy is generally not to purchase commercialinsurance for the risk of losses to which it is exposed. Instead,State management believes it is more economical to manage itsown risks internally. The Risk Management Fund, an internalservice fund, is used to pay for losses incurred by any Stateagency and for administrative costs incurred to manage a state-wide risk management program. These losses include damage toproperty owned by the agencies, personal injury or propertydamage liabilities incurred by a State officer, agent or employee,and worker's compensation costs for State employees. A limitedamount of insurance is purchased to limit the exposure tocatastrophic losses. Annually, a charge is allocated to eachagency for its proportionate share of the estimated costattributable to the program per Wis. Stat. Sec. 16.865(8).
State of Wisconsin Notes to The Financial Statements
67
14. Fund Balance Reserves and Restricted Net Assets/FundEquity
Fund Balance Reserves
Reservations of fund balances of governmental funds representamounts that are not available for appropriation. Examples offund balance reservations include reserves for encumbrances,inventories and prepaid items.
Restricted Net Assets/Fund Equity
Restricted Net Assets (presented in the government-widestatement of net assets) and Restricted Fund Equity (presented inthe balance sheet of proprietary funds) are reported whenconstraints placed on net assets or fund equity use are either (1)externally imposed by creditors (such as through debt covenants,grantors, contributors, or laws or regulation of othergovernments), or (2) imposed by law through constitutionalprovisions. Unrestricted net assets or fund equity may be used atthe State’s discretion but often have limitations on use based onState statutes.
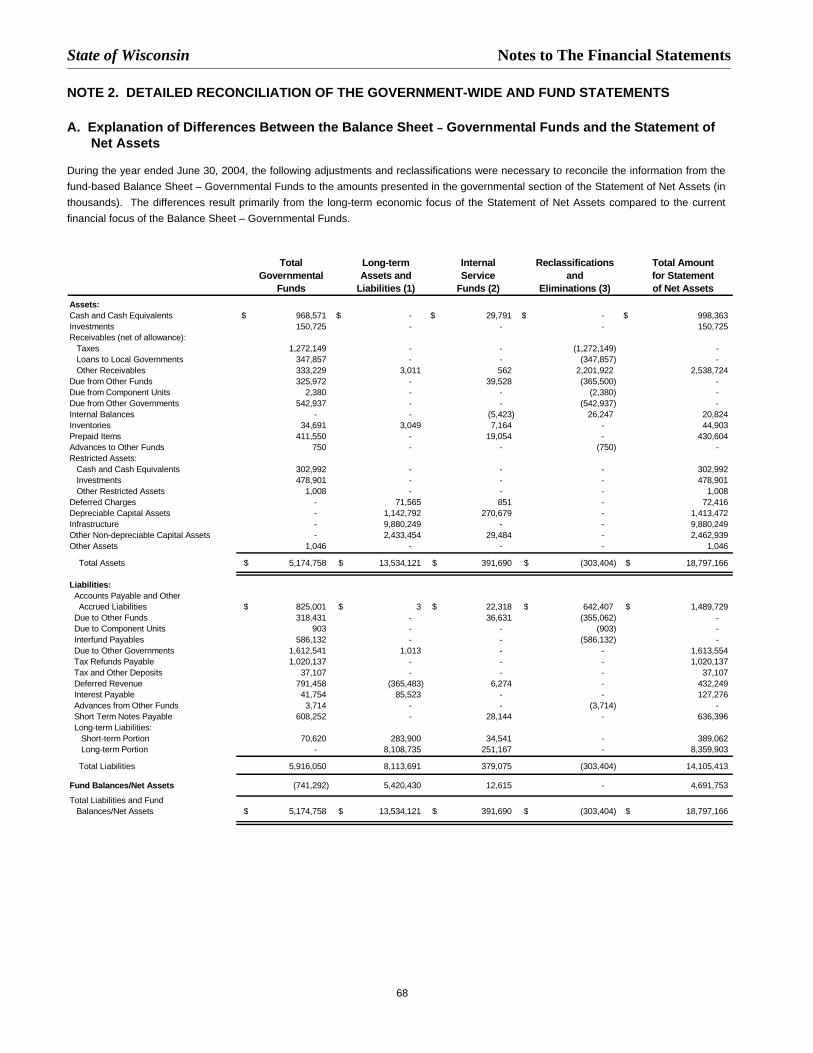
State of Wisconsin Notes to The Financial Statements
68
NOTE 2. DETAILED RECONCILIATION OF THE GOVERNMENT-WIDE AND FUND STATEMENTS
A. Explanation of Differences Between the Balance Sheet – Governmental Funds and the Statement ofNet Assets
During the year ended June 30, 2004, the following adjustments and reclassifications were necessary to reconcile the information from thefund-based Balance Sheet – Governmental Funds to the amounts presented in the governmental section of the Statement of Net Assets (inthousands). The differences result primarily from the long-term economic focus of the Statement of Net Assets compared to the currentfinancial focus of the Balance Sheet – Governmental Funds.
Total Long-term Internal Reclassifications Total AmountGovernmental Assets and Service and for Statement
Funds Liabilities (1) Funds (2) Eliminations (3) of Net AssetsAssets: Cash and Cash Equivalents $ 968,571 $ - $ 29,791 $ - $ 998,363 Investments 150,725 - - - 150,725 Receivables (net of allowance): Taxes 1,272,149 - - (1,272,149) - Loans to Local Governments 347,857 - - (347,857) - Other Receivables 333,229 3,011 562 2,201,922 2,538,724 Due from Other Funds 325,972 - 39,528 (365,500) - Due from Component Units 2,380 - - (2,380) - Due from Other Governments 542,937 - - (542,937) - Internal Balances - - (5,423) 26,247 20,824 Inventories 34,691 3,049 7,164 - 44,903 Prepaid Items 411,550 - 19,054 - 430,604 Advances to Other Funds 750 - - (750) - Restricted Assets: Cash and Cash Equivalents 302,992 - - - 302,992 Investments 478,901 - - - 478,901 Other Restricted Assets 1,008 - - - 1,008 Deferred Charges - 71,565 851 - 72,416 Depreciable Capital Assets - 1,142,792 270,679 - 1,413,472 Infrastructure - 9,880,249 - - 9,880,249 Other Non-depreciable Capital Assets - 2,433,454 29,484 - 2,462,939 Other Assets 1,046 - - - 1,046
Total Assets $ 5,174,758 $ 13,534,121 $ 391,690 $ (303,404) $ 18,797,166
Liabilities: Accounts Payable and Other Accrued Liabilities $ 825,001 $ 3 $ 22,318 $ 642,407 $ 1,489,729 Due to Other Funds 318,431 - 36,631 (355,062) - Due to Component Units 903 - - (903) - Interfund Payables 586,132 - - (586,132) - Due to Other Governments 1,612,541 1,013 - - 1,613,554 Tax Refunds Payable 1,020,137 - - - 1,020,137 Tax and Other Deposits 37,107 - - - 37,107 Deferred Revenue 791,458 (365,483) 6,274 - 432,249 Interest Payable 41,754 85,523 - - 127,276 Advances from Other Funds 3,714 - - (3,714) - Short Term Notes Payable 608,252 - 28,144 - 636,396 Long-term Liabilities: Short-term Portion 70,620 283,900 34,541 - 389,062 Long-term Portion - 8,108,735 251,167 - 8,359,903
Total Liabilities 5,916,050 8,113,691 379,075 (303,404) 14,105,413
Fund Balances/Net Assets (741,292) 5,420,430 12,615 - 4,691,753
Total Liabilities and Fund Balances/Net Assets $ 5,174,758 $ 13,534,121 $ 391,690 $ (303,404) $ 18,797,166

State of Wisconsin Notes to The Financial Statements
69
(1) Long-term asset and liability differences arise because governmental funds focus only on short-term financing (that is, resourcesthat will be available to pay for current period expenditures). In contrast, the Statement of Net Assets has a long-term economicfocus and reports on all capital and financial resources.
(2) The adjustment for internal service funds reflects the reclassification of these funds for the government-wide statement. The assetsand liabilities of these funds are reported as proprietary activities on the fund statements, but are included as governmental activitieson the Statement of Net Assets
(3) Various reclassifications are necessary due to the differing level of detail needed on each of the statements. Eliminations are doneon the Statement of Net Assets to minimize the grossing-up effect on assets and liabilities within the governmental and business-type activities columns of the primary government. The net residual amounts due between governmental and business-typeactivities are shown as internal balances.

State of Wisconsin Notes to The Financial Statements
70
B. Explanation of Differences Between the Statement of Revenues, Expenditures, and Changes in FundBalances – Governmental Funds and the Statement of Activities
During the year ended June 30, 2004, the following adjustments and reclassifications were necessary to reconcile the information from thefund-based Statement of Revenues, Expenditures, and Changes in Fund Balances – Governmental Funds to the amounts presented in thegovernmental section of the Statement of Activities (in thousands). The differences result primarily from the long-term economic focus of theStatement of Activities compared to the current financial focus of the Statement of Revenues, Expenditures, Changes in Fund Balance –Governmental Funds.
(1) Long-term revenue differences arise because governmental funds report revenues only when they are considered “available,” while government-widestatements report revenues when earned. Long-term expense differences arise because governmental funds report operating expenses (includinginterest) using the modified accrual basis of accounting, while government-wide statements report using the accrual basis of accounting.
(2) Capital-related adjustments consist of the difference between proceeds for the sales of capital assets and the gain or loss from the sales of capital assets,and from the difference between capital outlay expenditures recorded in the governmental funds and depreciation expense recorded in the government-wide statements.
(3) The adjustment for internal service funds reflects the elimination of these funds from the government-wide statement, which is accomplished bycharging/refunding additional amounts to participating governmental activities to completely offset the internal service funds’ cost for the year.
Total Governmental Long-term Revenues Capital-RelatedFunds and Expenses (1) Items (2)
Revenues: Taxes $ 11,913,325 $ - $ - Income Taxes - 20,365 - Sales & Excise Taxes - 3,128 - Public Utility Taxes - - - Other Taxes - (330) - Motor Fuel (Transportation) Taxes - (327) - Other Dedicated Taxes - (688) - Intergovernmental 6,118,198 - - Operating Grants - - 1,275 Capital Grants - - 2,970 Unrestricted Grants - - - Licenses and Permits 1,016,729 - - Charges for Goods and Services 269,649 2,085 - Investment and Interest Income 47,654 - - Fines and Forfeitures/Contributions to Permanent Fund 68,737 - - Gifts and Donations 13,006 - - Other Revenues: (6,681) (4,339) Intergovernmental Transfer 95,000 - - Tobacco Settlement 130,110 - - Other 210,335 - - Total Revenues 19,882,744 17,552 (94)
Expenditures: Current Operating: Commerce 284,930 503 1,698 Education 5,726,586 2 2,569 Transportation 1,653,448 (379) 145,518 Environmental Resources 439,734 (1,116) 8,575 Human Relations and Resources 7,966,656 (12,367) 48,683 General Executive 451,469 (2,149) 4,665 Judicial 107,423 31 2,563 Legislative 58,301 (740) 443 Tax Relief and Other General Expenditures: Employee Benefit Liability 1,487,574 (705,134) - Other 812,498 (17,114) - Intergovernmental 1,058,182 - - Debt Service: Principal 126,358 - - Interest and Other Charges 381,145 1,513 - Capital Outlay 672,955 - (672,955) Total Expenditures 21,227,259 (736,950) (458,241) Excess of Revenues Over (Under) Expenditures (1,344,515) 754,502 458,147
Other Financing Sources (Uses): Net Transfers (978,845) - (859) Long-term Debt Issued 3,076,559 - - Premium/Discount on Bonds 95,357 - - Payments to Refunding Bond Escrow Agent (534,937) - - Capital Leases Acquisitions 3,379 (3,379) - Installment Purchase Acquisitions 1,124 (1,124) - Total Other Financing Sources (Uses) 1,662,637 (4,504) (859) Net Change in Fund Balance 318,122 $ 749,998 $ 457,288 Change in Reserve for Inventories (1,652) Net Change for the Year $ 316,470
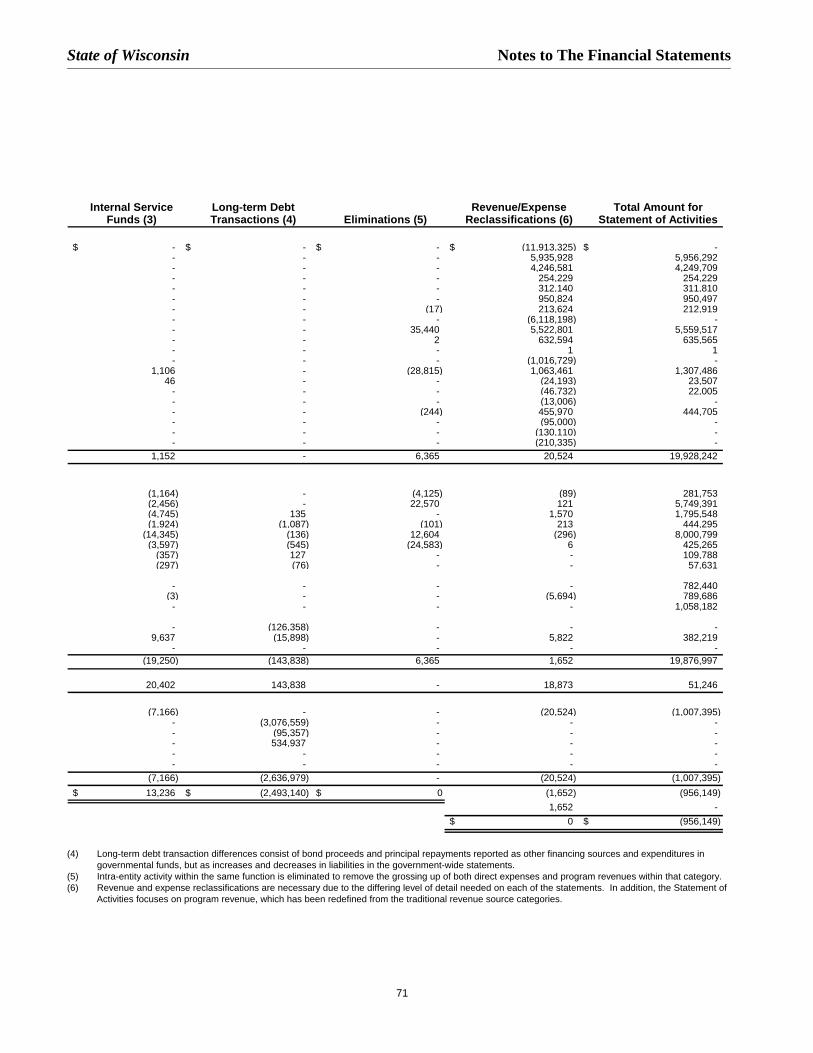
State of Wisconsin Notes to The Financial Statements
71
(4) Long-term debt transaction differences consist of bond proceeds and principal repayments reported as other financing sources and expenditures ingovernmental funds, but as increases and decreases in liabilities in the government-wide statements.
(5) Intra-entity activity within the same function is eliminated to remove the grossing up of both direct expenses and program revenues within that category. (6) Revenue and expense reclassifications are necessary due to the differing level of detail needed on each of the statements. In addition, the Statement of
Activities focuses on program revenue, which has been redefined from the traditional revenue source categories.
Internal Service Long-term Debt Revenue/Expense Total Amount forFunds (3) Transactions (4) Eliminations (5) Reclassifications (6) Statement of Activities
$ - $ - $ - $ (11,913,325) $ - - - - 5,935,928 5,956,292 - - - 4,246,581 4,249,709 - - - 254,229 254,229 - - - 312,140 311,810 - - - 950,824 950,497 - - (17) 213,624 212,919 - - - (6,118,198) - - - 35,440 5,522,801 5,559,517 - - 2 632,594 635,565 - - - 1 1 - - - (1,016,729) -
1,106 - (28,815) 1,063,461 1,307,486 46 - - (24,193) 23,507
- - - (46,732) 22,005 - - - (13,006) - - - (244) 455,970 444,705 - - - (95,000) - - - - (130,110) - - - - (210,335) -
1,152 - 6,365 20,524 19,928,242
(1,164) - (4,125) (89) 281,753 (2,456) - 22,570 121 5,749,391 (4,745) 135 - 1,570 1,795,548 (1,924) (1,087) (101) 213 444,295
(14,345) (136) 12,604 (296) 8,000,799 (3,597) (545) (24,583) 6 425,265
(357) 127 - - 109,788 (297) (76) - - 57,631
- - - - 782,440 (3) - - (5,694) 789,686
- - - - 1,058,182
- (126,358) - - - 9,637 (15,898) - 5,822 382,219
- - - - - (19,250) (143,838) 6,365 1,652 19,876,997
20,402 143,838 - 18,873 51,246
(7,166) - - (20,524) (1,007,395) - (3,076,559) - - - - (95,357) - - - - 534,937 - - - - - - - - - - - - -
(7,166) (2,636,979) - (20,524) (1,007,395) $ 13,236 $ (2,493,140) $ 0 (1,652) (956,149)
1,652 - $ 0 $ (956,149)
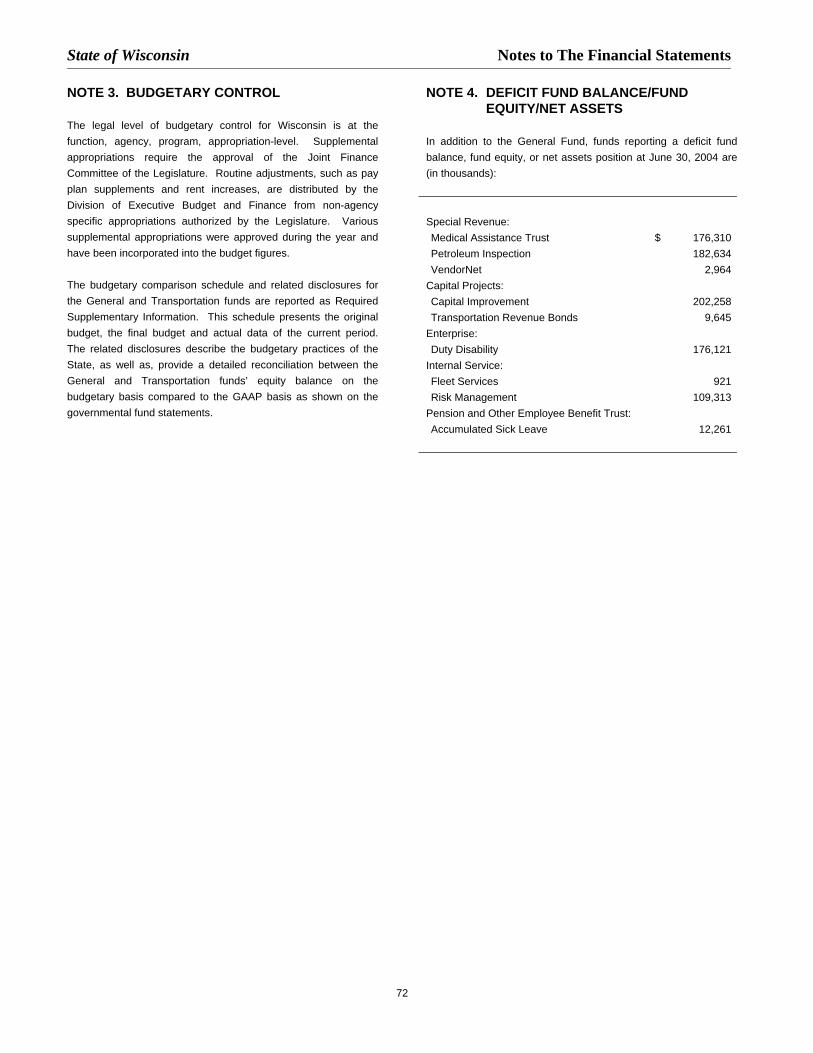
State of Wisconsin Notes to The Financial Statements
72
NOTE 3. BUDGETARY CONTROL
The legal level of budgetary control for Wisconsin is at thefunction, agency, program, appropriation-level. Supplementalappropriations require the approval of the Joint FinanceCommittee of the Legislature. Routine adjustments, such as payplan supplements and rent increases, are distributed by theDivision of Executive Budget and Finance from non-agencyspecific appropriations authorized by the Legislature. Varioussupplemental appropriations were approved during the year andhave been incorporated into the budget figures.
The budgetary comparison schedule and related disclosures forthe General and Transportation funds are reported as RequiredSupplementary Information. This schedule presents the originalbudget, the final budget and actual data of the current period.The related disclosures describe the budgetary practices of theState, as well as, provide a detailed reconciliation between theGeneral and Transportation funds’ equity balance on thebudgetary basis compared to the GAAP basis as shown on thegovernmental fund statements.
NOTE 4. DEFICIT FUND BALANCE/FUNDEQUITY/NET ASSETS
In addition to the General Fund, funds reporting a deficit fundbalance, fund equity, or net assets position at June 30, 2004 are(in thousands):
Special Revenue:Medical Assistance Trust $ 176,310Petroleum Inspection 182,634VendorNet 2,964
Capital Projects:Capital Improvement 202,258Transportation Revenue Bonds 9,645
Enterprise:Duty Disability 176,121
Internal Service:Fleet Services 921Risk Management 109,313
Pension and Other Employee Benefit Trust:Accumulated Sick Leave 12,261

State of Wisconsin Notes to The Financial Statements
73
NOTE 5. DEPOSITS AND INVESTMENTS
The State maintains a short-term investment "pool", the StateInvestment Fund, for the State, its agencies and departments,and certain other public institutions which elect to participate. Theinvestment "pool" is managed by the State of WisconsinInvestment Board (the Board) which is further authorized to carryout investment activities for certain enterprise, trust and agencyfunds. A small number of State agencies and the University ofWisconsin System also carry out investment activities separatefrom the Board. Disclosures of the State's investment activitiesare presented in the following categories: State Investment Fund,Other Funds Managed by the Board, Other State Agencies andFunds, and Component Units.
A. Deposits
Primary Government
Deposits include cash and cash equivalents on deposit in banksor other financial institutions, and nonnegotiable certificates ofdeposit. The majority of the State's deposits are under the controlof the State Treasurer. The State Treasurer maintains multipleaccounts with an agreement with the bank that allows an overdraftin one account if the overdraft is offset by balances in otheraccounts.
The State's insured deposits are covered by the Federal DepositInsurance Corporation (FDIC) and an appropriation for losses onpublic deposits. The State, as required by Wis. Stat. Sec. 34.08,is to make payments to public depositors for proofs of loss up to$400 thousand per depositor above the amount of federalinsurance. Payments are made, until the funds available in theappropriation are exhausted, in the order in which satisfactoryproofs of loss are received by the State's Department of FinancialInstitutions.
At June 30, 2004, the carrying amount of the primary governmentdeposits reported as cash was $(167.6) million and the bankbalance was $332.9 million. Further, $525 thousand of depositsof the Bank and Insurance Company agency fund are reported as“Other Assets”. Of the bank amount, excluding a bank overdraftof $38.2 million in two bank accounts that are covered bycompensating balances in other accounts,
• $9.5 million was covered by federal depository insurance,the State Public Deposit Guarantee Fund or collateralizedwith securities held by the State or its agent in the State'sname, and
• $361.6 million was uncollateralized and uninsured.
The State’s Unemployment Reserve Fund had $832.7 million ondeposit with the U.S. Treasury. This amount is presented asCash and Cash Equivalents and is not included in the carryingamount of deposits nor is it categorized according to risk becauseit is neither a deposit with a financial institution nor an investment.
Petty cash and contingent accounts authorized under Wis. Stat.Sec 20.920, which are held by agencies and reported as Cashand Cash Equivalents in the amount of $133.1 thousand, are notincluded in the carrying amount nor bank balance of deposits inthis note because these are neither deposits nor investments.
Component Units
The carrying amount of deposits of the Wisconsin Housing andEconomic Development Authority at June 30, 2004, theWisconsin Health Care Liability Insurance Plan at December 31,2003, the University of Wisconsin Hospitals and Clinics Authorityat June 30, 2004, the University of Wisconsin Foundation atDecember 31, 2003, and the State Fair Park Exposition Center,Inc. at December 31, 2003 was $29.3 million and the bankbalance was $29.2 million. Of the bank amount, $2.1 million wascovered by federal depository insurance, the State Public DepositGuarantee Fund or collateralized with securities held by the Stateor its agent in the State's name and $27.1 million wasuncollateralized and uninsured.
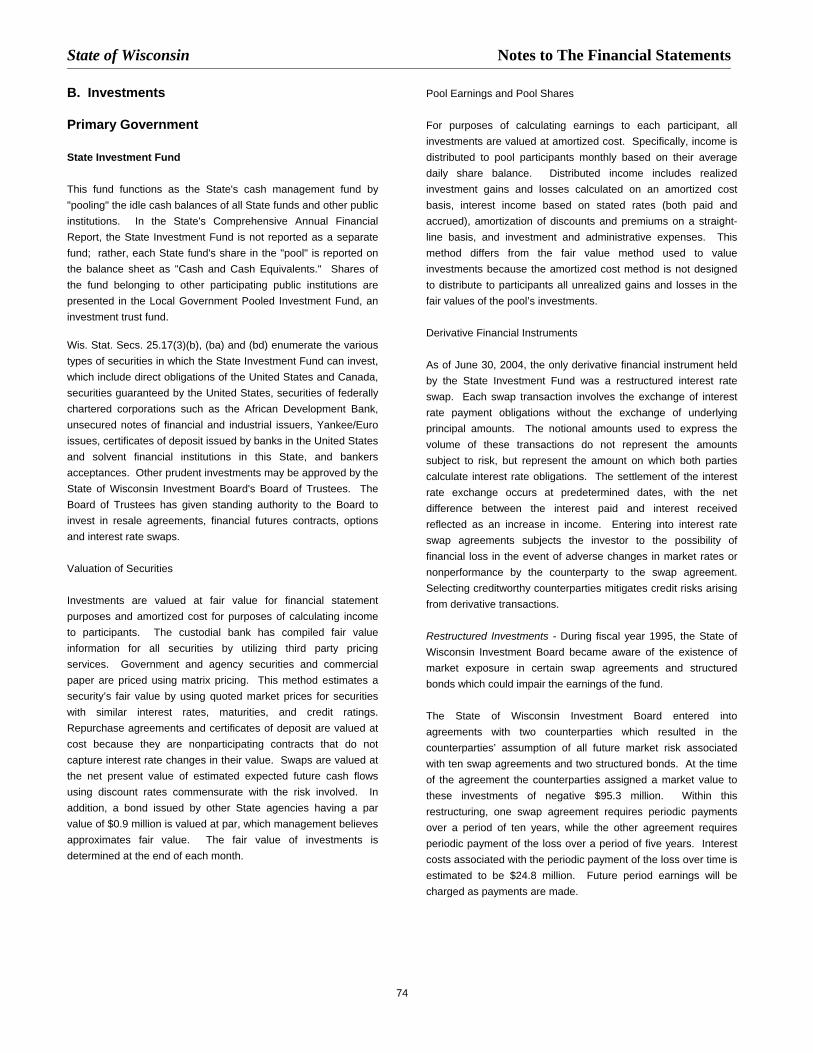
State of Wisconsin Notes to The Financial Statements
74
B. Investments
Primary Government
State Investment Fund
This fund functions as the State's cash management fund by"pooling" the idle cash balances of all State funds and other publicinstitutions. In the State's Comprehensive Annual FinancialReport, the State Investment Fund is not reported as a separatefund; rather, each State fund's share in the "pool" is reported onthe balance sheet as "Cash and Cash Equivalents." Shares ofthe fund belonging to other participating public institutions arepresented in the Local Government Pooled Investment Fund, aninvestment trust fund.
Wis. Stat. Secs. 25.17(3)(b), (ba) and (bd) enumerate the varioustypes of securities in which the State Investment Fund can invest,which include direct obligations of the United States and Canada,securities guaranteed by the United States, securities of federallychartered corporations such as the African Development Bank,unsecured notes of financial and industrial issuers, Yankee/Euroissues, certificates of deposit issued by banks in the United Statesand solvent financial institutions in this State, and bankersacceptances. Other prudent investments may be approved by theState of Wisconsin Investment Board's Board of Trustees. TheBoard of Trustees has given standing authority to the Board toinvest in resale agreements, financial futures contracts, optionsand interest rate swaps.
Valuation of Securities
Investments are valued at fair value for financial statementpurposes and amortized cost for purposes of calculating incometo participants. The custodial bank has compiled fair valueinformation for all securities by utilizing third party pricingservices. Government and agency securities and commercialpaper are priced using matrix pricing. This method estimates asecurity’s fair value by using quoted market prices for securitieswith similar interest rates, maturities, and credit ratings.Repurchase agreements and certificates of deposit are valued atcost because they are nonparticipating contracts that do notcapture interest rate changes in their value. Swaps are valued atthe net present value of estimated expected future cash flowsusing discount rates commensurate with the risk involved. Inaddition, a bond issued by other State agencies having a parvalue of $0.9 million is valued at par, which management believesapproximates fair value. The fair value of investments isdetermined at the end of each month.
Pool Earnings and Pool Shares
For purposes of calculating earnings to each participant, allinvestments are valued at amortized cost. Specifically, income isdistributed to pool participants monthly based on their averagedaily share balance. Distributed income includes realizedinvestment gains and losses calculated on an amortized costbasis, interest income based on stated rates (both paid andaccrued), amortization of discounts and premiums on a straight-line basis, and investment and administrative expenses. Thismethod differs from the fair value method used to valueinvestments because the amortized cost method is not designedto distribute to participants all unrealized gains and losses in thefair values of the pool’s investments.
Derivative Financial Instruments
As of June 30, 2004, the only derivative financial instrument heldby the State Investment Fund was a restructured interest rateswap. Each swap transaction involves the exchange of interestrate payment obligations without the exchange of underlyingprincipal amounts. The notional amounts used to express thevolume of these transactions do not represent the amountssubject to risk, but represent the amount on which both partiescalculate interest rate obligations. The settlement of the interestrate exchange occurs at predetermined dates, with the netdifference between the interest paid and interest receivedreflected as an increase in income. Entering into interest rateswap agreements subjects the investor to the possibility offinancial loss in the event of adverse changes in market rates ornonperformance by the counterparty to the swap agreement.Selecting creditworthy counterparties mitigates credit risks arisingfrom derivative transactions.
Restructured Investments - During fiscal year 1995, the State ofWisconsin Investment Board became aware of the existence ofmarket exposure in certain swap agreements and structuredbonds which could impair the earnings of the fund.
The State of Wisconsin Investment Board entered intoagreements with two counterparties which resulted in thecounterparties’ assumption of all future market risk associatedwith ten swap agreements and two structured bonds. At the timeof the agreement the counterparties assigned a market value tothese investments of negative $95.3 million. Within thisrestructuring, one swap agreement requires periodic paymentsover a period of ten years, while the other agreement requiresperiodic payment of the loss over a period of five years. Interestcosts associated with the periodic payment of the loss over time isestimated to be $24.8 million. Future period earnings will becharged as payments are made.
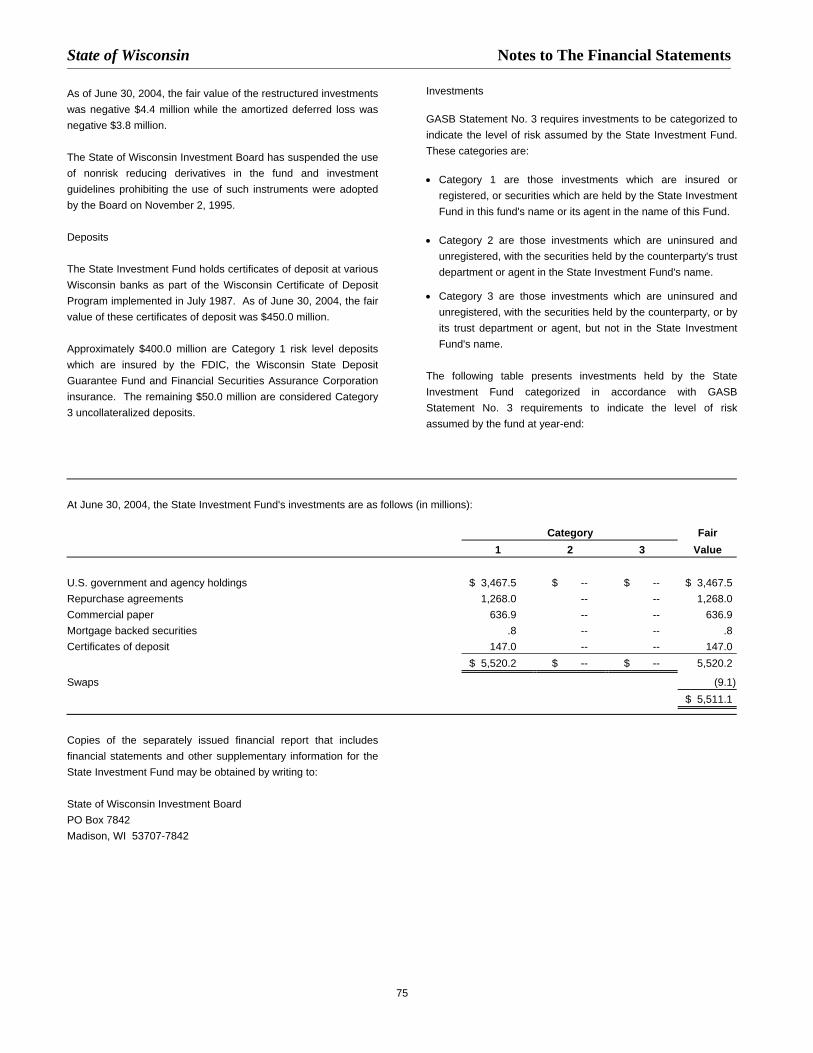
State of Wisconsin Notes to The Financial Statements
75
As of June 30, 2004, the fair value of the restructured investmentswas negative $4.4 million while the amortized deferred loss wasnegative $3.8 million.
The State of Wisconsin Investment Board has suspended the useof nonrisk reducing derivatives in the fund and investmentguidelines prohibiting the use of such instruments were adoptedby the Board on November 2, 1995.
Deposits
The State Investment Fund holds certificates of deposit at variousWisconsin banks as part of the Wisconsin Certificate of DepositProgram implemented in July 1987. As of June 30, 2004, the fairvalue of these certificates of deposit was $450.0 million.
Approximately $400.0 million are Category 1 risk level depositswhich are insured by the FDIC, the Wisconsin State DepositGuarantee Fund and Financial Securities Assurance Corporationinsurance. The remaining $50.0 million are considered Category3 uncollateralized deposits.
Investments
GASB Statement No. 3 requires investments to be categorized toindicate the level of risk assumed by the State Investment Fund.These categories are:
• Category 1 are those investments which are insured orregistered, or securities which are held by the State InvestmentFund in this fund's name or its agent in the name of this Fund.
• Category 2 are those investments which are uninsured andunregistered, with the securities held by the counterparty's trustdepartment or agent in the State Investment Fund's name.
• Category 3 are those investments which are uninsured andunregistered, with the securities held by the counterparty, or byits trust department or agent, but not in the State InvestmentFund's name.
The following table presents investments held by the StateInvestment Fund categorized in accordance with GASBStatement No. 3 requirements to indicate the level of riskassumed by the fund at year-end:
At June 30, 2004, the State Investment Fund's investments are as follows (in millions):
Category Fair1 2 3 Value
U.S. government and agency holdings $ 3,467.5 $ -- $ -- $ 3,467.5Repurchase agreements 1,268.0 -- -- 1,268.0Commercial paper 636.9 -- -- 636.9Mortgage backed securities .8 -- -- .8Certificates of deposit 147.0 -- -- 147.0
$ 5,520.2 $ -- $ -- 5,520.2
Swaps (9.1)$ 5,511.1
Copies of the separately issued financial report that includesfinancial statements and other supplementary information for theState Investment Fund may be obtained by writing to:
State of Wisconsin Investment BoardPO Box 7842Madison, WI 53707-7842
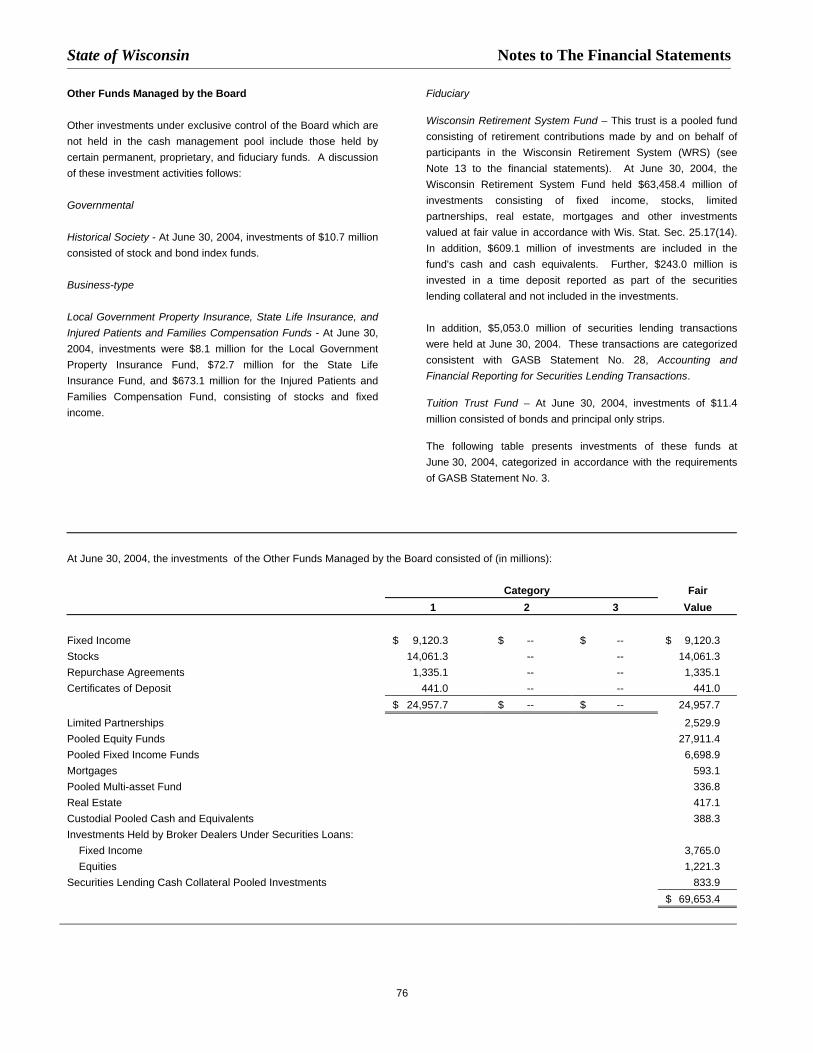
State of Wisconsin Notes to The Financial Statements
76
Other Funds Managed by the Board
Other investments under exclusive control of the Board which arenot held in the cash management pool include those held bycertain permanent, proprietary, and fiduciary funds. A discussionof these investment activities follows:
Governmental
Historical Society - At June 30, 2004, investments of $10.7 millionconsisted of stock and bond index funds.
Business-type
Local Government Property Insurance, State Life Insurance, andInjured Patients and Families Compensation Funds - At June 30,2004, investments were $8.1 million for the Local GovernmentProperty Insurance Fund, $72.7 million for the State LifeInsurance Fund, and $673.1 million for the Injured Patients andFamilies Compensation Fund, consisting of stocks and fixedincome.
Fiduciary
Wisconsin Retirement System Fund – This trust is a pooled fundconsisting of retirement contributions made by and on behalf ofparticipants in the Wisconsin Retirement System (WRS) (seeNote 13 to the financial statements). At June 30, 2004, theWisconsin Retirement System Fund held $63,458.4 million ofinvestments consisting of fixed income, stocks, limitedpartnerships, real estate, mortgages and other investmentsvalued at fair value in accordance with Wis. Stat. Sec. 25.17(14).In addition, $609.1 million of investments are included in thefund's cash and cash equivalents. Further, $243.0 million isinvested in a time deposit reported as part of the securitieslending collateral and not included in the investments.
In addition, $5,053.0 million of securities lending transactionswere held at June 30, 2004. These transactions are categorizedconsistent with GASB Statement No. 28, Accounting andFinancial Reporting for Securities Lending Transactions.
Tuition Trust Fund – At June 30, 2004, investments of $11.4million consisted of bonds and principal only strips.
The following table presents investments of these funds atJune 30, 2004, categorized in accordance with the requirementsof GASB Statement No. 3.
At June 30, 2004, the investments of the Other Funds Managed by the Board consisted of (in millions):
Category Fair1 2 3 Value
Fixed Income $ 9,120.3 $ -- $ -- $ 9,120.3Stocks 14,061.3 -- -- 14,061.3Repurchase Agreements 1,335.1 -- -- 1,335.1Certificates of Deposit 441.0 -- -- 441.0
$ 24,957.7 $ -- $ -- 24,957.7Limited Partnerships 2,529.9Pooled Equity Funds 27,911.4Pooled Fixed Income Funds 6,698.9Mortgages 593.1Pooled Multi-asset Fund 336.8Real Estate 417.1Custodial Pooled Cash and Equivalents 388.3Investments Held by Broker Dealers Under Securities Loans: Fixed Income 3,765.0 Equities 1,221.3Securities Lending Cash Collateral Pooled Investments 833.9
$ 69,653.4
State of Wisconsin Notes to The Financial Statements
77
Securities Lending Transactions – State statutes and State ofWisconsin Investment Board (SWIB) policies permit the use ofinvestments to enter into securities lending transactions. Thesetransactions involve the lending of securities to broker-dealersand other entities for collateral, in the form of cash or securities,with the simultaneous agreement to return the collateral for thesame securities in the future. The securities custodian is anagent in lending the domestic and international securities forcollateral of 102 percent and 105 percent, respectively, of theloaned securities' market value. The cash collateral is reinvestedby the lending agent in accordance with contractual investmentguidelines which are designed to insure the safety of principal andobtain a moderate rate of return. The investment guidelinesinclude very high credit quality standards and also allow for aportion of the collateral investments to be invested with short-termsecurities. The earnings generated from the collateralinvestments, less the amount of rebates paid to the dealers,results in the gross earnings from lending activities, which is thensplit on a percentage basis with the lending agent.
Securities on loan at June 30, 2004 are presented as unclassifiedin the preceding schedule of custodial risk. At year end, no creditrisk exposure to borrowers existed because the amounts owedthe borrowers exceeded the amounts the borrowers owed. Thecontract with the lending agent requires them to indemnify if theborrowers fail to return the loaned securities and the collateral isinadequate to replace the securities lent.
The majority of securities loans can be terminated on demand,although the average term of the loans is approximately oneweek. The term to maturity of the securities loans is matched withthe term to maturity of the investments of the cash collateral byinvesting in a variety of short term investments with a weightedaverage maturity of 24 days.
The ability to pledge or sell collateral securities cannot be madewithout a borrower default. In addition, no restrictions on theamount of the loans exist.
Derivative Financial Instruments
Foreign Currency Forwards and Options - The State of WisconsinInvestment Board’s derivative trading activities primarily involveforward contracts and foreign currency options. Generally, foreigncurrency forwards and options are held to hedge foreignexchange risk. Market risk is generally controlled by holdingsubstantially offsetting purchase and sell positions. At June 30,2004 the fair value of foreign currency forward contracts assetstotaled $1.7 billion, while the liabilities totaled $1.7 billion.
Futures Contracts – A financial futures contract is an exchangetraded agreement to buy or sell a financial instrument at anagreed upon price and time in the future. Upon entering into afutures contract, collateral is deposited with the broker inaccordance with the initial margin requirements of the broker.Futures contracts are marked to market daily by the board oftrade or exchange on which they are traded. The resultinggain/loss is received/paid the following day until the contractexpires. Futures contracts involve, to varying degrees, risk of lossin excess of the variation margin. Losses may arise from futurechanges in the value of the underlying instrument, or if thecounterparties do not perform under the terms of the contract.
Investment guidelines allow external portfolio managers tomanage interest rate exposure only through the use of exchange-traded interest rate instruments. As of June 30, 2004, SWIB wasinvested in exchange-traded interest rate futures contracts with anet exposure totaling negative $379.7 million.
Internally managed fixed income portfolios are allowed to invest infinancial futures, options, and swaps for the purposes of adjustingduration and to invest anticipated cash flows, subject to review bythe SWIB Risk and Investment Committee. During the periodpresented, these portfolios held no futures, options or swaps.
In addition, investment guidelines allow internally managed activeU.S. equity managers to use index futures, index options, andoptions on index futures up to 20 percent of the aggregate valueof all SWIB U.S. equity portfolios, subject to review by the SWIBRisk and Investment Committee when entered into for thepurpose of equitizing cash holdings. During the period presentedin these financial statements, no index futures, index options, oroptions on index futures were held.
One outside equity manager is permitted by the investmentguidelines to use exchange-traded Standard and Poor’s EquityIndex futures contracts to manage its exposure to the stockmarket during the fiscal year presented. This manager isauthorized to utilize futures up to 5 percent of the fair value of theportfolio although it held no futures during the fiscal yearpresented.
State of Wisconsin Notes to The Financial Statements
78
Collateralized Mortgage Obligations (CMOs) – Bonds that arecollateralized by whole loan mortgages, mortgage pass-throughsecurities or stripped mortgage-backed securities. Income isderived from payments and prepayments of principal and interestgenerated from collateral mortgages. Cash flows are distributedto different investment classes or traunches in accordance witheach CMOs established payment order. Some CMO trauncheshave more stable cash flows relative to changes in interest rateswhile others are significantly more sensitive to interest ratefluctuations. In a declining interest rate environment, some CMOsmay be subject to a reduction in interest payments as a result ofprepayments of mortgages which make up the collateral pool. Areduction in interest payments causes a decline in cash flows andthus a decline in the fair value of the security. Rising interestrates may cause an increase in interest payments, thus anincrease in fair value of the security. CMOs are held to maximizeyields and in part to hedge against a rise in interest rates. AtJune 30, 2004, CMOs valued at $8.2 million were held.
Principal Only Strips – Securities that derive cash flow from thepayment of principal on underlying debt securities. SWIB holdsseveral principal only strips for yield enhancing purposes. Theunderlying securities are United States Treasury obligations,therefore the credit risk is low. On the other hand, principal onlystrips are more volatile in terms of pricing, and thus the marketrisk is higher than traditional United States Treasury obligations.As of June 30, 2004, no principal only strips were held.
Credit-linked Trust Certificates
SWIB has allowed one external manager credit exposuremanagement through the use of credit-linked trust certificates,provided the counter-party is a recognized exchange or is a bankor broker dealer with an actual credit rating of at least: (1) ‘B/C’ orbetter from Thomson Bankwatch (Keefe); (2) “A1/P1” or better on
short term debt from Standard and Poor’s or Moody’s; or (3) “A” orbetter on long-term debt from Standard and Poor’s or Moody’s.Credit-linked trust certificates are exchange-traded securities,created through a Special Purpose Company, or trust. Proceedsfrom the sale of the certificates are invested in AAA ratedsecurities, then lent out under a securities lending agreement.The trust also enters into a credit default swap that references100 high yield corporate bonds. The trust pays a variable couponand receives a fixed coupon on the notional value during the lifeof the note. If the issuer of one of more of the 100 high yieldcorporate bonds defaults, the trust will receive the current marketvalue of the defaulted asset and the notional value will bereduced, lessening future interest earnings.
By investing in credit-linked trust certificates, SWIB gainsimmediate, diversified exposure to the high yield fixed incomemarket. For taking on the risk associated with the 100 high yieldcorporate bonds, SWIB earns a premium rate of return.Investment in these certificates involves risk of loss from creditdowngrades, illiquidity and counterparty risk. Valuation of thissecurity is calculated by the party marketing the security. At June30, 2004, SWIB was invested in credit-linked trust certificatestotaling $20.00 million.
Unfunded Capital Commitments
Partnership agreements generally set a limit on the total dollaramount that limited partners must commit to funding whenentering the partnership. Over the life of the partnership, thegeneral partner will request capital contributions totaling theagreed upon limit. As of June 30, 2004, unfunded capitalcommitments totaled $1.3 billion.
State of Wisconsin Notes to The Financial Statements
79
Other State Agencies and Funds
The following funds also make investments following pertinentState statutes and policy provisions as set out by the appropriategoverning boards or bond resolutions:
Governmental
General Fund – At June 30, 2004, investments of $0.9 million ofwhich $0.5 million are considered deposits and included in Note5A.
Transportation Revenue Bond Funds – At June 30, 2004, theTransportation Revenue Bond Capital Projects Fund and theTransportation Revenue Bond Debt Service Fund hadinvestments totaling $246.6 million, of which $153.4 million arereported as cash equivalents. Investments of $93.2 million satisfyrisk category No. 1, while the remaining investments areuncategorized.
Annual Appropriation Bonds – At June 30, 2004 investmentstotaling $248.6 million were held of which $240.3 million meet riskCategory 1 and the remaining $8.3 million are uncategorized.
Common School Fund – At June 30, 2004, investments totaling$130.7 million meet risk Category 1.
Petroleum Inspection Revenue Bonds Fund – At June 30, 2004,investments of $4.1 million consisting of government and agencyinvestments which meet Category 1 risk criteria.
Wisconsin Public Broadcasting Foundation Fund – The fund'sinvestments at June 30, 2004 were $6.7 million, which consists of$4.2 million of various investments and $2.5 million of moneymarket funds which are reported as cash equivalents. Allinvestments meet Category 1 risk criteria.
Badger Tobacco Asset Securitization Corporation -- Investmentsof $274.5 million of which $137.4 million are reported as cashequivalents. Investments of $137.1 million meet the Category 1risk level.
Business-type
Environmental Improvement Fund – The fund's aggregateinvestments at June 30, 2004 were $194.0 million, of which $35.7million are reported as cash equivalents consisting of arepurchase agreement which is a Category 2 level of risk.Investments of $158.3 million consist of government and agencyholdings and satisfy Category 1 risk criteria.
Lottery Fund – Investments are all in the form of U.S. Treasuryzero coupon bonds. At June 30, 2004, investments of $128.4million which meet Category 1 risk criteria were held.
The University of Wisconsin System – The fund’s aggregateinvestments at June 30, 2004 were $344.1 million of which $21.8million are reported as cash equivalents. Of the remaining $322.4million, $254.8 million meet Category 1 risk criteria while theremaining investments are uncategorized.
Fiduciary
Inmate and Resident Fund – At June 30, 2004, investmentstotaling $0.7 million of which $0.5 million are reported as cashequivalents and $0.2 million meet risk Category 3.
College Savings Program Trust – At June 30, 2004, investmentstotaling $1,186.4 million, which consist of $3.4 million of short-term securities which meet risk Category 1 and the remaininginvestments are uncategorized.
At June 30, 2004, the State has approximately $279.3 million ofsecurities which it holds for banks and insurance companies.These assets are held for the period of time specified by statuteand then returned to their owner. The assets are presented in theBank and Insurance Company Deposits Fund as "Other Assets".All investments meet risk Category 1.
Unclaimed property, usually in the form of stocks, bank accounts,insurance proceeds, utility deposits and uncashed checks, aretransferred periodically to the Unclaimed Property Program Fund.The $37.3 million securities, presented as "Other Assets" on thefinancial statements meet risk Category 1.
The State's Section 457 Deferred Compensation Plan Fundinvestments, totaling $1,430.8 million at June 30, 2004, are in theform of equity, bond and money market mutual funds, insuredsavings accounts and investment contracts with insurancecompanies.

State of Wisconsin Notes to The Financial Statements
80
The following table presents investments of the Other StateAgencies and Funds at June 30, 2004, categorized in accordancewith the requirements of GASB Statement No. 3.
At June 30, 2004, the Other State Agencies and Funds’ investments consisted of (in millions):
Category Reported Fair1 2 3 Amount Value
Government and agency holdings $ 924.9 $ -- $ .2 $ 925.2 $ 925.2Municipal bonds 105.1 -- -- 105.1 105.1Commercial paper and nonsecured corporate notes and bonds 238.9 -- -- 238.9 238.9Repurchase agreements 3.4 35.7 -- 39.1 39.1Forward delivery agreements 137.1 -- -- 137.1 140.4Negotiable certificates of deposit 5.9 -- -- 5.9 5.9Mortgaged backed securities 10.4 10.4 10.4Fixed Income 50.8 -- -- 50.8 50.8
$ 1,476.5 $ 35.7 $ .2 1,512.4 1,515.8Mutual funds 1,223.9 1,223.9Money market funds 310.0 310.0Limited partnerships 2.9 2.9Deferred compensation investments 1,430.9 1,430.9Other 32.4 32.4
$ 4,512.6 $ 4,515.9
State of Wisconsin Notes to The Financial Statements
81
Component Units
Wisconsin Housing and Economic Development Authority(Authority) – The Authority is required by statute to invest at least50 percent of its General Fund funds in obligations of the State, ofthe United States, or of agencies or instrumentalities of the UnitedStates, or obligations the principal and interest of which areguaranteed by the United States, or agencies or instrumentalitiesof the United States. Each bond resolution specifies whatconstitutes a permitted investment and such investments mayinclude obligations of the U.S. Treasury, agencies andinstrumentalities; commercial paper; bankers acceptances; andrepurchase agreements and investment agreements.
The Authority's aggregate investments at June 30, 2004 were$677.9 million of which $132.7 million are reported as cashequivalents consisting of money market funds. The Authority'sinvestments except for uncollateralized investment agreements of$137.2 million are a Category 1 level of risk. The Authority’sinvestments in uncollateralized investment agreements are aCategory 3 level of risk.
The Authority enters into collateralized investment contracts withvarious financial institutions. The investment contracts aregenerally collateralized by obligations of the United Statesgovernment.
The Authority is also authorized to invest its funds in the StateInvestment Fund. The Authority has established a MasterRepurchase Agreement with its banking institutions to govern thepurchase of repurchase agreements. This agreement requiresthe institution to take possession of collateral having a marketvalue of at least 103 percent of the cost of the repurchaseagreement. The underlying collateral must be maintained at thislevel at all times.
The Authority’s Finance committee approved the use of asecurity-lending program with the trust department of a bankacting as an agent. As of June 30, 2004 the Authority had $69.7million of securities on loan to broker-dealers for a fee. Thetransactions are categorized consistently with GASB StatementNo. 28, Accounting and Financial Reporting for Securities LendingTransactions.
Security lending transactions involve the lending of securities tobroker-dealers and other entities for collateral, in the form of cashor securities, with the simultaneous agreement to return thecollateral for the same securities in the future. The securitiescustodian is an agent in lending the domestic and internationalsecurities for collateral of 102 percent and 105 percent,
respectively, of the loaned securities’ market value. The lendingagent in accordance with contractual investment guidelines, whichare designed to insure the safety of principal and obtain amoderate rate of return, reinvests the collateral. The investmentguidelines include very high credit quality standards and alsoallow for a portion of the collateral investments to be invested withshort-term securities. The Authority has the following types ofsecurities on loan: U.S. agency securities, U.S. governmentsecurities and corporate notes. The Authority has received thefollowing types of collateral for the securities lent: cash,government securities or irrevocable letters of credit. The fairvalue of the investment securities loaned was $69.7 million as ofJune 30, 2004, and the fair value of the collateral received was$70.8 million. The Authority may request the bank to terminateany loan of securities for any reason at any time.
As of June 30, 2004, no credit risk exposure to borrowers existedbecause the amounts owed the borrowers exceeded the amountsthe borrowers owed. The contract with the lending agent statesthat in the event that a borrower fails to return the lent security,the bank will indemnify the Authority for the following amounts: a)The difference between the closing market value of security onthe date it should have been returned to the account and the cashcollateral substituted for the lent securities, or b) In the case ofcollateral received in kind, the difference between the closingmarket value of the security on the date it should have beenreturned to the account and the closing market value of thecollateral in kind on the same date.
The Authority assumes all risk of loss arising out of collateralinvestment loss and any resulting collateral deficiencies. Thebank expressly assumes the risk of loss arising from negligent orfraudulent operations of its securities lending program. The bankoperates the securities lending program as a business trustinvestment pool with open and matched components. In thematched portion of the investment pool, the maturities of thesecurities lent and collateral are the same. The open portions ofthe pool maintains a weighted average maturity of the portfolio atapproximately 15 days, with a range from 1 day to 25 days. Theopen portions of the pool generally have a 15-day mismatchbetween the portfolio coverage maturity and the open loans. Asof June 30, 2004, approximately 50.0% of the securities lent werein the matched portion and approximately 50.0% in the openportion of the investment pool. No restrictions on the amount ofthe loans exist or can be made. The earnings generated from thesecurities lending program is reported as other income. Duringthe year ended June 30, 2004 the Authority received $94thousand of income related to security lending transactions.
State of Wisconsin Notes to The Financial Statements
82
Wisconsin Health Care Liability Insurance Plan – The investmentsof the Wisconsin Health Care Liability Insurance Plan atDecember 31, 2003 were $88.0 million, of which $7.1 million arereported as cash equivalents. Investments of $2.0 million inbonds meet the Category 1 risk level, while all remaininginvestments meet the Category 2 risk level.
University of Wisconsin Hospital and Clinics Authority – TheUniversity of Wisconsin Hospitals and Clinics Authority (theHospital) aggregate investments of $226.8 million consist of $39.0million of repurchase agreements which meet Category 2 riskcriteria and $0.2 million of money market funds which areuncategorized. In addition, $187.6 million of investments reportedas “Cash and Investments with Other Component Units” areuncategorized as ownership does not depend on control ofindividual securities.
University of Wisconsin Foundation – Aggregate investments ofthe University of Wisconsin Foundation are $1,716.5 million ofwhich $183.2 million are money market funds reported as cashequivalents. The remaining $1,533.3 million consist of variousinvestments of which $720.6 million meet Category 1 risk criteriaand the remaining $812.7 million are uncategorized.
State Fair Park Exposition Center, Inc. – Investments, consistingof $3.1 million of money market funds reported as cashequivalents, are not categorized.
The following table presents investments of the WisconsinHousing And Economic Development Authority, the WisconsinHealth Care Liability Insurance Plan, the University of WisconsinHospital and Clinics Authority, the University of WisconsinFoundation, and the State Fair Park Exposition Center, Inc.,categorized in accordance with the requirements of GASBStatement No. 3.
The investments of the Wisconsin Housing and Economic Development Authority at June 30, 2004, the Wisconsin Health Care LiabilityInsurance Plan at December 31, 2003, the University of Wisconsin Hospitals and Clinics Authority at June 30, 2004, the University ofWisconsin Foundation at December 31, 2003, and the State Fair Park Exposition Center, Inc. at December 31, 2003 consisted of (in millions):
Category Reported Fair1 2 3 Amount Value
Government and agency holdings $ 222.5 $ 21.2 $ -- $ 243.7 $ 245.8Bonds 484.0 -- -- 484.0 484.0Corporate notes and bonds 161.2 33.3 -- 194.5 194.5Negotiable certificates of deposit 15.7 -- -- 15.7 15.7Mortgage-backed securities 8.1 -- -- 8.1 8.1Repurchase agreements -- 39.0 -- 39.0 39.0Collateralized investment contracts 239.0 26.4 -- 265.4 265.4Investment agreements -- 137.2 -- 137.2 137.2
$ 1,130.5 $ 257.1 $ -- 1,387.6 1,389.7Money market funds 325.2 325.2Limited partnerships 137.9 137.9Mutual funds 538.1 538.1International equities 135.9 135.9
$ 2,524.7 $ 2,526.8
State of Wisconsin Notes to The Financial Statements
83
The following schedule summarizes investments of the reportingentity presented in the above investment note discussions (inmillions):
Other Funds Managed by the Board $ 69,653.4Other State Agencies and Funds 4,512.7Component Units 2,524.7Total Investments $ 76,690.8
C. Lottery Investments and Related Future PrizeObligations
Investments of the State Lottery Fund totaling $128.4 million areheld to finance grand prizes payable over a 20-year or 25-yearperiod. The investments in prize annuities are debt obligations ofthe U.S. government and backed by its full faith and credit as toboth principal and interest. Liabilities related to the future prizeobligations are presented at their present value and included asAccounts Payable and Other Accrued Liabilities. The following isa schedule of future prize obligations (in thousands):
Fiscal Year Amount
2005 $ 16,5162006 16,6432007 16,7742008 16,9092009 16,900Thereafter 87,490Total future value 171,232Less: Present value adjustment (55,694)Present value of payments $ 115,538
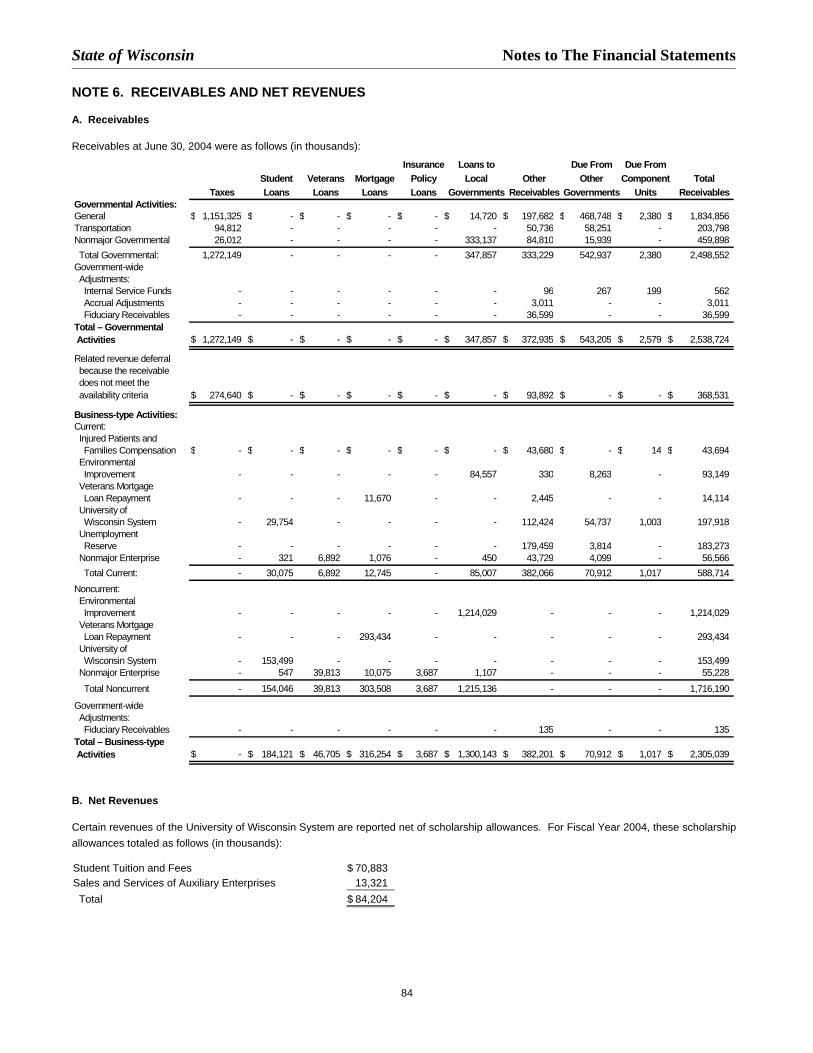
State of Wisconsin Notes to The Financial Statements
84
NOTE 6. RECEIVABLES AND NET REVENUES
A. Receivables
Receivables at June 30, 2004 were as follows (in thousands):
B. Net Revenues
Certain revenues of the University of Wisconsin System are reported net of scholarship allowances. For Fiscal Year 2004, these scholarshipallowances totaled as follows (in thousands):
Student Tuition and Fees $ 70,883Sales and Services of Auxiliary Enterprises 13,321 Total $ 84,204
Insurance Loans to Due From Due FromStudent Veterans Mortgage Policy Local Other Other Component Total
Taxes Loans Loans Loans Loans Governments Receivables Governments Units ReceivablesGovernmental Activities:General $ 1,151,325 $ - $ - $ - $ - $ 14,720 $ 197,682 $ 468,748 $ 2,380 $ 1,834,856 Transportation 94,812 - - - - - 50,736 58,251 - 203,798 Nonmajor Governmental 26,012 - - - - 333,137 84,810 15,939 - 459,898 Total Governmental: 1,272,149 - - - - 347,857 333,229 542,937 2,380 2,498,552 Government-wide Adjustments: Internal Service Funds - - - - - - 96 267 199 562 Accrual Adjustments - - - - - - 3,011 - - 3,011 Fiduciary Receivables - - - - - - 36,599 - - 36,599 Total – Governmental Activities $ 1,272,149 $ - $ - $ - $ - $ 347,857 $ 372,935 $ 543,205 $ 2,579 $ 2,538,724
Related revenue deferral because the receivable does not meet the availability criteria $ 274,640 $ - $ - $ - $ - $ - $ 93,892 $ - $ - $ 368,531
Business-type Activities:Current: Injured Patients and Families Compensation $ - $ - $ - $ - $ - $ - $ 43,680 $ - $ 14 $ 43,694 Environmental Improvement - - - - - 84,557 330 8,263 - 93,149 Veterans Mortgage Loan Repayment - - - 11,670 - - 2,445 - - 14,114 University of Wisconsin System - 29,754 - - - - 112,424 54,737 1,003 197,918 Unemployment Reserve - - - - - - 179,459 3,814 - 183,273 Nonmajor Enterprise - 321 6,892 1,076 - 450 43,729 4,099 - 56,566 Total Current: - 30,075 6,892 12,745 - 85,007 382,066 70,912 1,017 588,714 Noncurrent: Environmental Improvement - - - - - 1,214,029 - - - 1,214,029 Veterans Mortgage Loan Repayment - - - 293,434 - - - - - 293,434 University of Wisconsin System - 153,499 - - - - - - - 153,499 Nonmajor Enterprise - 547 39,813 10,075 3,687 1,107 - - - 55,228 Total Noncurrent - 154,046 39,813 303,508 3,687 1,215,136 - - - 1,716,190
Government-wide Adjustments: Fiduciary Receivables - - - - - - 135 - - 135 Total – Business-type Activities $ - $ 184,121 $ 46,705 $ 316,254 $ 3,687 $ 1,300,143 $ 382,201 $ 70,912 $ 1,017 $ 2,305,039
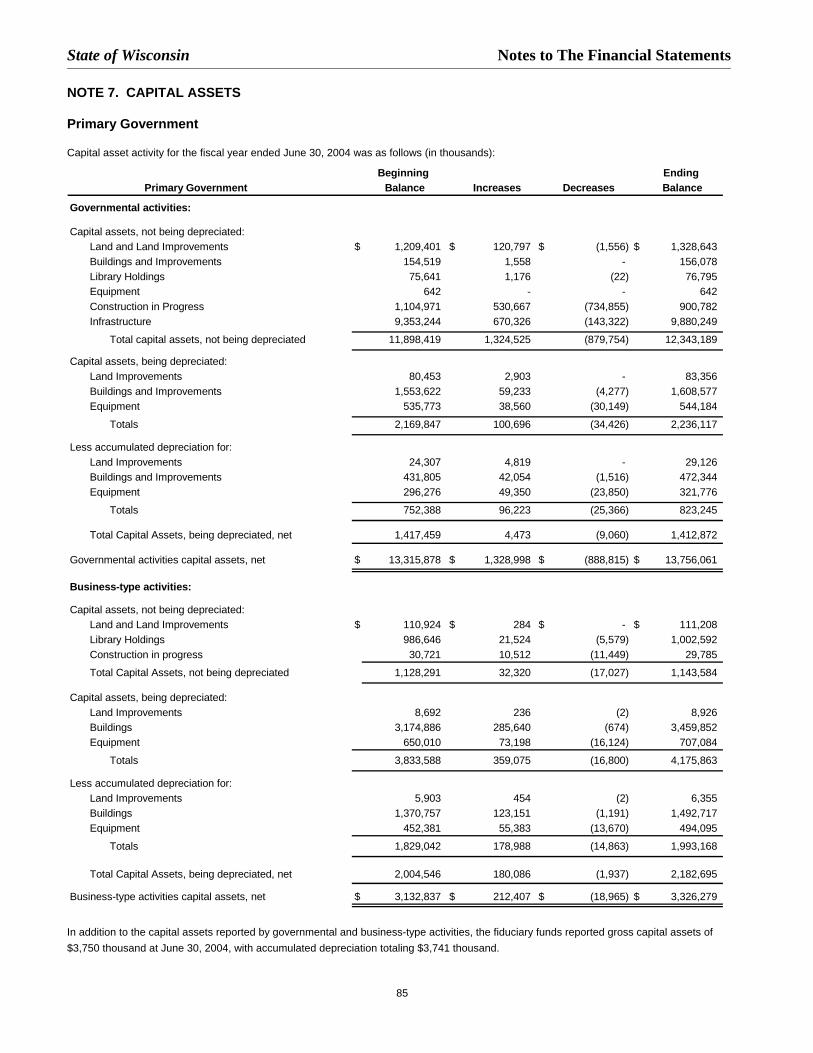
State of Wisconsin Notes to The Financial Statements
85
NOTE 7. CAPITAL ASSETS
Primary Government
Capital asset activity for the fiscal year ended June 30, 2004 was as follows (in thousands):
In addition to the capital assets reported by governmental and business-type activities, the fiduciary funds reported gross capital assets of$3,750 thousand at June 30, 2004, with accumulated depreciation totaling $3,741 thousand.
Beginning Ending Primary Government Balance Increases Decreases Balance
Governmental activities:
Capital assets, not being depreciated:Land and Land Improvements $ 1,209,401 $ 120,797 $ (1,556) $ 1,328,643 Buildings and Improvements 154,519 1,558 - 156,078 Library Holdings 75,641 1,176 (22) 76,795 Equipment 642 - - 642 Construction in Progress 1,104,971 530,667 (734,855) 900,782 Infrastructure 9,353,244 670,326 (143,322) 9,880,249
Total capital assets, not being depreciated 11,898,419 1,324,525 (879,754) 12,343,189
Capital assets, being depreciated:Land Improvements 80,453 2,903 - 83,356 Buildings and Improvements 1,553,622 59,233 (4,277) 1,608,577 Equipment 535,773 38,560 (30,149) 544,184
Totals 2,169,847 100,696 (34,426) 2,236,117
Less accumulated depreciation for:Land Improvements 24,307 4,819 - 29,126 Buildings and Improvements 431,805 42,054 (1,516) 472,344 Equipment 296,276 49,350 (23,850) 321,776
Totals 752,388 96,223 (25,366) 823,245
Total Capital Assets, being depreciated, net 1,417,459 4,473 (9,060) 1,412,872
Governmental activities capital assets, net $ 13,315,878 $ 1,328,998 $ (888,815) $ 13,756,061
Business-type activities:
Capital assets, not being depreciated:Land and Land Improvements $ 110,924 $ 284 $ - $ 111,208 Library Holdings 986,646 21,524 (5,579) 1,002,592 Construction in progress 30,721 10,512 (11,449) 29,785 Total Capital Assets, not being depreciated 1,128,291 32,320 (17,027) 1,143,584
Capital assets, being depreciated:Land Improvements 8,692 236 (2) 8,926 Buildings 3,174,886 285,640 (674) 3,459,852 Equipment 650,010 73,198 (16,124) 707,084
Totals 3,833,588 359,075 (16,800) 4,175,863
Less accumulated depreciation for:Land Improvements 5,903 454 (2) 6,355 Buildings 1,370,757 123,151 (1,191) 1,492,717 Equipment 452,381 55,383 (13,670) 494,095
Totals 1,829,042 178,988 (14,863) 1,993,168
Total Capital Assets, being depreciated, net 2,004,546 180,086 (1,937) 2,182,695
Business-type activities capital assets, net $ 3,132,837 $ 212,407 $ (18,965) $ 3,326,279

State of Wisconsin Notes to The Financial Statements
86
Depreciation Expense
Depreciation expense was charged to functions of the primary government as follows (in thousands):
Commerce $ 1,544 Injured Patients and Families Compensation $ 3 Education 2,548 Veterans Mortgage Loan Repayment 45 Transportation 9,252 University of Wisconsin System 168,219 Environmental Resources 9,448 Lottery 63 Human Relations and Resources 44,395 Other Business-Type 10,659 General Executive 4,403 Total depreciation expense -Judicial 2,563 business-type activities $ 178,988 Legislative 395 Depreciation on capital assets held by the internal service funds 21,675
Total depreciation expense - governmental activities $ 96,223
Governmental Activities Business-type Activities
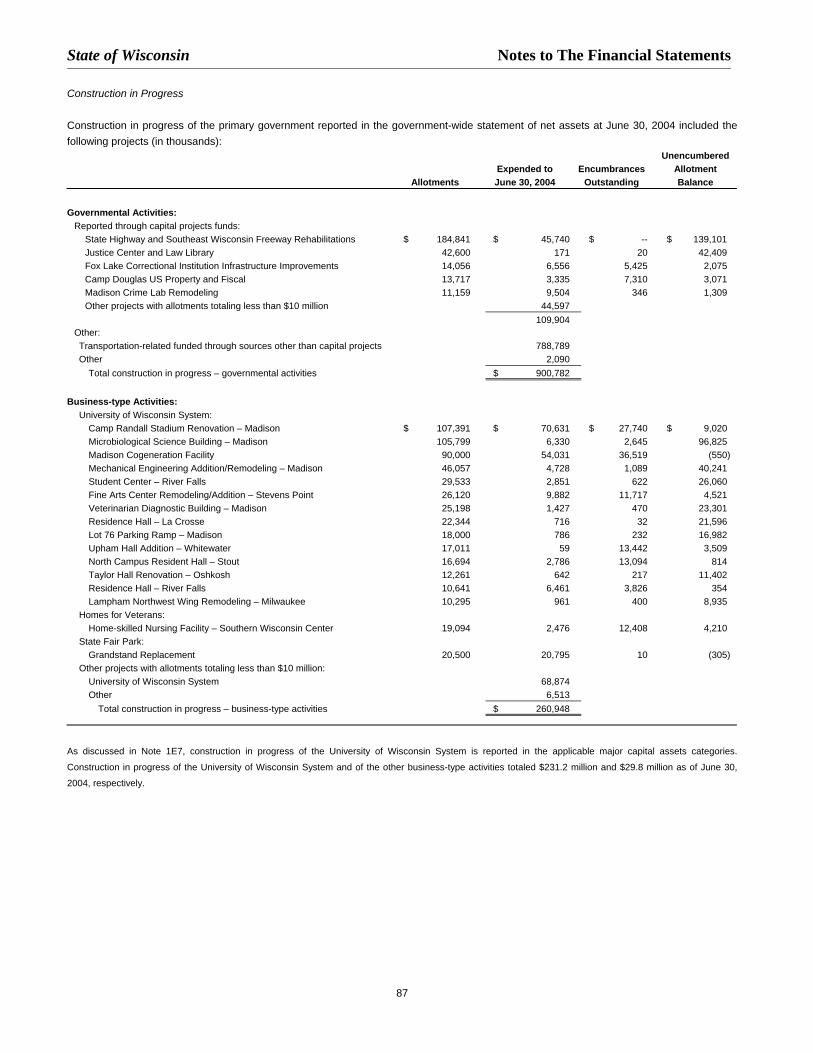
State of Wisconsin Notes to The Financial Statements
87
Construction in Progress
Construction in progress of the primary government reported in the government-wide statement of net assets at June 30, 2004 included thefollowing projects (in thousands):
UnencumberedExpended to Encumbrances Allotment
Allotments June 30, 2004 Outstanding Balance
Governmental Activities:Reported through capital projects funds:
State Highway and Southeast Wisconsin Freeway Rehabilitations $ 184,841 $ 45,740 $ -- $ 139,101Justice Center and Law Library 42,600 171 20 42,409Fox Lake Correctional Institution Infrastructure Improvements 14,056 6,556 5,425 2,075Camp Douglas US Property and Fiscal 13,717 3,335 7,310 3,071Madison Crime Lab Remodeling 11,159 9,504 346 1,309Other projects with allotments totaling less than $10 million 44,597
109,904Other:Transportation-related funded through sources other than capital projects 788,789Other 2,090
Total construction in progress – governmental activities $ 900,782
Business-type Activities:University of Wisconsin System:
Camp Randall Stadium Renovation – Madison $ 107,391 $ 70,631 $ 27,740 $ 9,020Microbiological Science Building – Madison 105,799 6,330 2,645 96,825Madison Cogeneration Facility 90,000 54,031 36,519 (550)Mechanical Engineering Addition/Remodeling – Madison 46,057 4,728 1,089 40,241Student Center – River Falls 29,533 2,851 622 26,060Fine Arts Center Remodeling/Addition – Stevens Point 26,120 9,882 11,717 4,521Veterinarian Diagnostic Building – Madison 25,198 1,427 470 23,301Residence Hall – La Crosse 22,344 716 32 21,596Lot 76 Parking Ramp – Madison 18,000 786 232 16,982Upham Hall Addition – Whitewater 17,011 59 13,442 3,509North Campus Resident Hall – Stout 16,694 2,786 13,094 814Taylor Hall Renovation – Oshkosh 12,261 642 217 11,402Residence Hall – River Falls 10,641 6,461 3,826 354Lampham Northwest Wing Remodeling – Milwaukee 10,295 961 400 8,935
Homes for Veterans:Home-skilled Nursing Facility – Southern Wisconsin Center 19,094 2,476 12,408 4,210
State Fair Park:Grandstand Replacement 20,500 20,795 10 (305)
Other projects with allotments totaling less than $10 million:University of Wisconsin System 68,874 Other 6,513
Total construction in progress – business-type activities $ 260,948
As discussed in Note 1E7, construction in progress of the University of Wisconsin System is reported in the applicable major capital assets categories.
Construction in progress of the University of Wisconsin System and of the other business-type activities totaled $231.2 million and $29.8 million as of June 30,
2004, respectively.
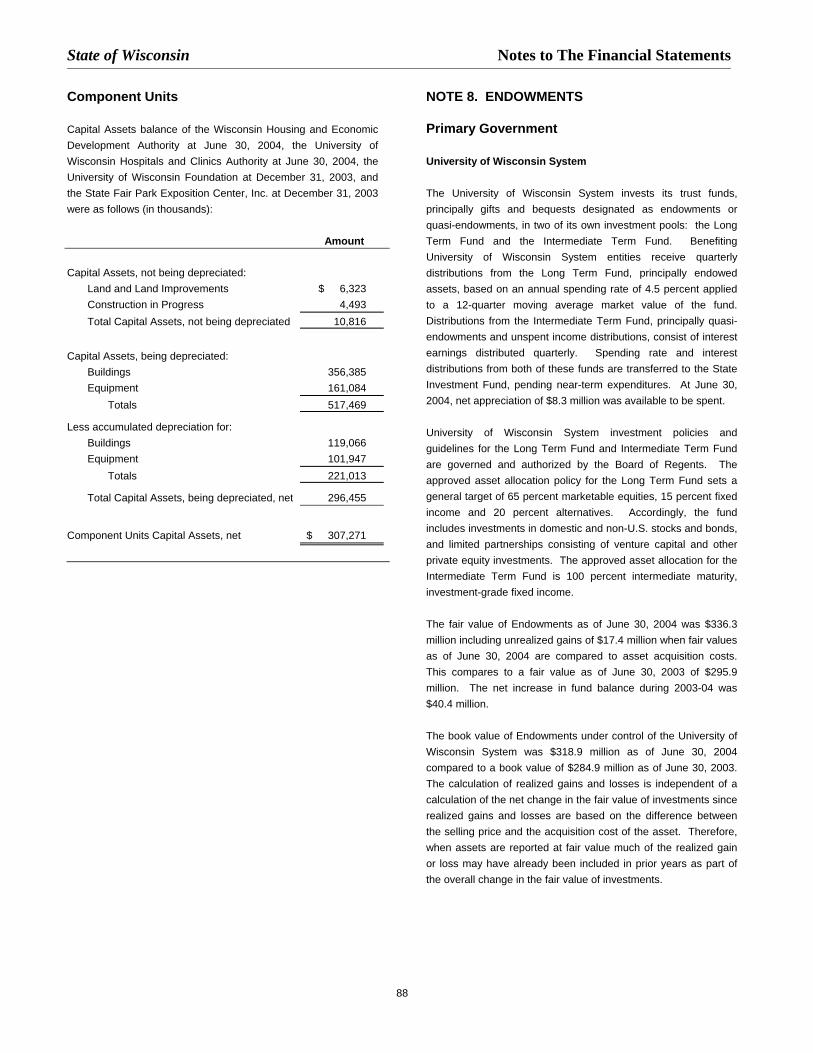
State of Wisconsin Notes to The Financial Statements
88
Component Units
Capital Assets balance of the Wisconsin Housing and EconomicDevelopment Authority at June 30, 2004, the University ofWisconsin Hospitals and Clinics Authority at June 30, 2004, theUniversity of Wisconsin Foundation at December 31, 2003, andthe State Fair Park Exposition Center, Inc. at December 31, 2003were as follows (in thousands):
Amount
Capital Assets, not being depreciated:Land and Land Improvements $ 6,323Construction in Progress 4,493Total Capital Assets, not being depreciated 10,816
Capital Assets, being depreciated:Buildings 356,385Equipment 161,084
Totals 517,469
Less accumulated depreciation for:Buildings 119,066Equipment 101,947
Totals 221,013
Total Capital Assets, being depreciated, net 296,455
Component Units Capital Assets, net $ 307,271
NOTE 8. ENDOWMENTS
Primary Government
University of Wisconsin System
The University of Wisconsin System invests its trust funds,principally gifts and bequests designated as endowments orquasi-endowments, in two of its own investment pools: the LongTerm Fund and the Intermediate Term Fund. BenefitingUniversity of Wisconsin System entities receive quarterlydistributions from the Long Term Fund, principally endowedassets, based on an annual spending rate of 4.5 percent appliedto a 12-quarter moving average market value of the fund.Distributions from the Intermediate Term Fund, principally quasi-endowments and unspent income distributions, consist of interestearnings distributed quarterly. Spending rate and interestdistributions from both of these funds are transferred to the StateInvestment Fund, pending near-term expenditures. At June 30,2004, net appreciation of $8.3 million was available to be spent.
University of Wisconsin System investment policies andguidelines for the Long Term Fund and Intermediate Term Fundare governed and authorized by the Board of Regents. Theapproved asset allocation policy for the Long Term Fund sets ageneral target of 65 percent marketable equities, 15 percent fixedincome and 20 percent alternatives. Accordingly, the fundincludes investments in domestic and non-U.S. stocks and bonds,and limited partnerships consisting of venture capital and otherprivate equity investments. The approved asset allocation for theIntermediate Term Fund is 100 percent intermediate maturity,investment-grade fixed income.
The fair value of Endowments as of June 30, 2004 was $336.3million including unrealized gains of $17.4 million when fair valuesas of June 30, 2004 are compared to asset acquisition costs.This compares to a fair value as of June 30, 2003 of $295.9million. The net increase in fund balance during 2003-04 was$40.4 million.
The book value of Endowments under control of the University ofWisconsin System was $318.9 million as of June 30, 2004compared to a book value of $284.9 million as of June 30, 2003.The calculation of realized gains and losses is independent of acalculation of the net change in the fair value of investments sincerealized gains and losses are based on the difference betweenthe selling price and the acquisition cost of the asset. Therefore,when assets are reported at fair value much of the realized gainor loss may have already been included in prior years as part ofthe overall change in the fair value of investments.

State of Wisconsin Notes to The Financial Statements
89
At June 30, 2004, the book value and fair value of principal fundsunder control of the University of Wisconsin System was (inmillions):
Original Contributions and Distributed Net Gains $ 133.3Realized Gains – Undistributed 185.6Book Value 318.9Unrealized Net Gains/Losses - Undistributed 17.4Fair Value $ 336.3
On June 30, 2004, the portfolio at market contained 73.7 percentin stocks, 23.2 percent in fixed income obligations, 1.0 percent inalternative assets, and 2.1 percent in short-term investments.The total return on the principal Long Term Fund including capitalappreciation was 17.0 percent. The total return on the principalIntermediate Fund including capital appreciation was 0.9 percent.External investment counsel was furnished for funds representing97.0 percent of market-value principal.
Component Unit
University of Wisconsin Foundation
At December 31, 2003, there were 3,066 funds pooled in anendowment fund for investment purposes. Generally, principal ofthe funds is to be kept intact with income from investments beingdistributed according to the wishes of the donor. For certainfunds, principal is also available for distribution.
The University of Wisconsin Foundation’s investment policies andguidelines are governed and authorized by the University ofWisconsin Foundation’s Board of Directors. The Board does notlimit the types of investments allowed.
For the fiscal year ended December 31, 2003, the endowmentfund accounts reported cash and money market funds of $68.6million and investments with a fair value of $754.3 million. Thiscompares to a fair value for investments as of December 31, 2002of $614.2 million. The asset allocation for endowment assets atDecember 31, 2003 is 49.9 percent in domestic equities, 14.5percent in international equities, 32.7 percent in alternativeinvestment managers and 2.9 percent in cash.

State of Wisconsin Notes to The Financial Statements
90
NOTE 9. INTERFUND RECEIVABLES, PAYABLES AND TRANSFERS
Interfund balances as of or for the year ended June 30, 2004 consist of the following (in thousands):
A. Due from/to Other Funds:
Due from Other Funds and the Due to Other Funds represent short-term interfund accounts receivable and payable. The balances in theseaccounts at June 30, 2004 were as follows (in thousands):
The balances in the Due from Other Funds and Due to Other Funds accounts typically result from the time lag between the dates that (1) interfund goods and services were provided and when the payments occurred, and(2) interfund transfers were accrued and when the liquidations occurred.
Due to Other Funds:InjuredPatients
Nonmajor and FamiliesGeneral Transportation Governmental Compensation
Due from Other Funds:General $ - $ 15,220 $ 62,126 $ 11 Transportation 1,116 - 54,687 - Nonmajor Governmental 44,937 17,599 5,047 73 Environmental Improvement 53 - 222 - Veterans Mortgage Loan Repayment - - - - University of Wisconsin System 51,529 442 1,843 - Unemployment Reserve 393 - - - Nonmajor Enterprise 8,302 - 22 - Internal Service 18,164 3,145 11,347 4 Fiduciary 19,064 1,186 1,986 6 Total $ 143,557 $ 37,593 $ 137,280 $ 93

State of Wisconsin Notes to The Financial Statements
91
VeteransMortgage University of
Environmental Loan Wisconsin Unemployment Nonmajor Internal Improvement Repayment System Reserve Enterprise Service Fiduciary Total
$ 339 $ 49 $ 35,066 $ 9,127 $ 39,917 $ 2,690 $ 35,222 $ 199,766 - - 65 - - - - 55,867
989 - 189 - 1,025 478 - 70,339 - - - - - - - 275 - - - - 11 - - 11
17 - - - 2 67 - 53,901 - - - - - - - 393 - 309 - - 517 16 135 9,301 1 19 1,581 - 681 245 1,377 36,564 9 41 14,727 - 1,687 472 270 39,449
$ 1,355 $ 418 $ 51,628 $ 9,127 $ 43,841 $ 3,968 $ 37,005 $ 465,866
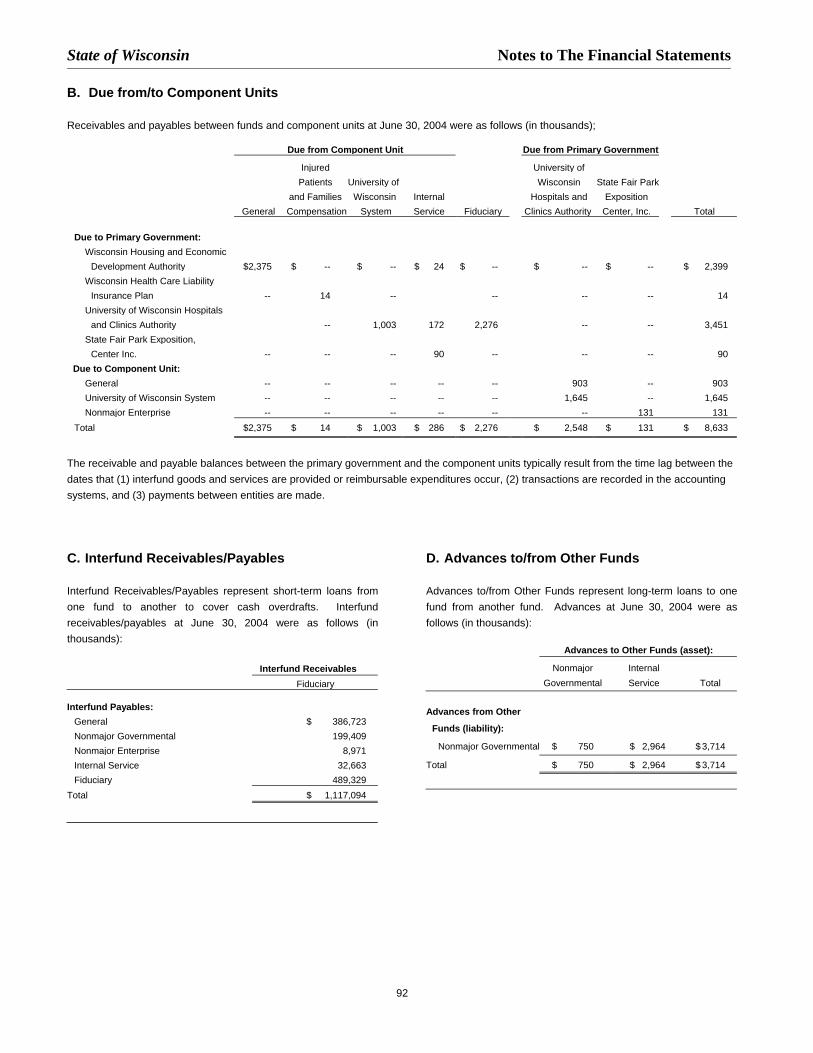
State of Wisconsin Notes to The Financial Statements
92
B. Due from/to Component Units
Receivables and payables between funds and component units at June 30, 2004 were as follows (in thousands);
Due from Component Unit Due from Primary Government
Injured University ofPatients University of Wisconsin State Fair Park
and Families Wisconsin Internal Hospitals and Exposition General Compensation System Service Fiduciary Clinics Authority Center, Inc. Total
Due to Primary Government:Wisconsin Housing and Economic
Development Authority $2,375 $ -- $ -- $ 24 $ -- $ -- $ -- $ 2,399Wisconsin Health Care Liability
Insurance Plan -- 14 -- -- -- -- 14University of Wisconsin Hospitals
and Clinics Authority -- 1,003 172 2,276 -- -- 3,451State Fair Park Exposition,
Center Inc. -- -- -- 90 -- -- -- 90Due to Component Unit:
General -- -- -- -- -- 903 -- 903University of Wisconsin System -- -- -- -- -- 1,645 -- 1,645Nonmajor Enterprise -- -- -- -- -- -- 131 131
Total $2,375 $ 14 $ 1,003 $ 286 $ 2,276 $ 2,548 $ 131 $ 8,633
The receivable and payable balances between the primary government and the component units typically result from the time lag between thedates that (1) interfund goods and services are provided or reimbursable expenditures occur, (2) transactions are recorded in the accountingsystems, and (3) payments between entities are made.
C. Interfund Receivables/Payables
Interfund Receivables/Payables represent short-term loans fromone fund to another to cover cash overdrafts. Interfundreceivables/payables at June 30, 2004 were as follows (inthousands):
Interfund ReceivablesFiduciary
Interfund Payables:General $ 386,723Nonmajor Governmental 199,409Nonmajor Enterprise 8,971Internal Service 32,663Fiduciary 489,329
Total $ 1,117,094
D. Advances to/from Other Funds
Advances to/from Other Funds represent long-term loans to onefund from another fund. Advances at June 30, 2004 were asfollows (in thousands):
Advances to Other Funds (asset):
Nonmajor InternalGovernmental Service Total
Advances from Other
Funds (liability):
Nonmajor Governmental $ 750 $ 2,964 $ 3,714
Total $ 750 $ 2,964 $ 3,714
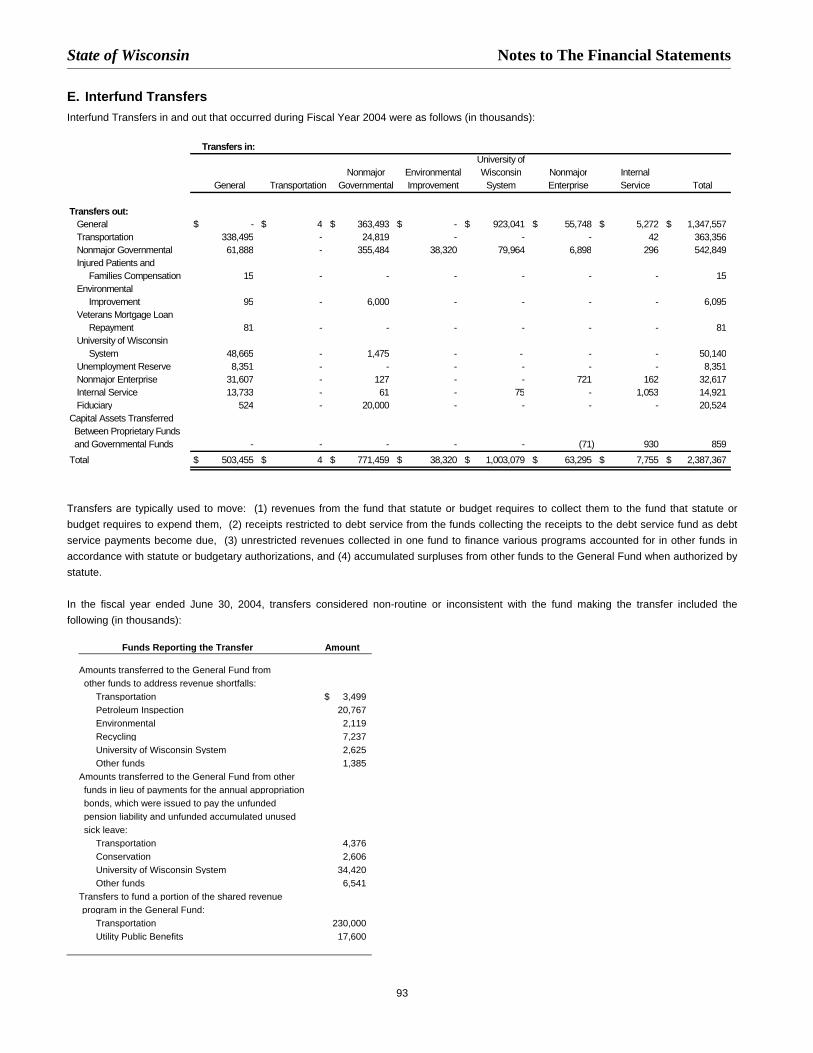
State of Wisconsin Notes to The Financial Statements
93
E. Interfund TransfersInterfund Transfers in and out that occurred during Fiscal Year 2004 were as follows (in thousands):
Transfers are typically used to move: (1) revenues from the fund that statute or budget requires to collect them to the fund that statute orbudget requires to expend them, (2) receipts restricted to debt service from the funds collecting the receipts to the debt service fund as debtservice payments become due, (3) unrestricted revenues collected in one fund to finance various programs accounted for in other funds inaccordance with statute or budgetary authorizations, and (4) accumulated surpluses from other funds to the General Fund when authorized bystatute.
In the fiscal year ended June 30, 2004, transfers considered non-routine or inconsistent with the fund making the transfer included thefollowing (in thousands):
Funds Reporting the Transfer Amount
Amounts transferred to the General Fund from other funds to address revenue shortfalls:
Transportation $ 3,499Petroleum Inspection 20,767Environmental 2,119Recycling 7,237University of Wisconsin System 2,625Other funds 1,385
Amounts transferred to the General Fund from otherfunds in lieu of payments for the annual appropriationbonds, which were issued to pay the unfunded pension liability and unfunded accumulated unusedsick leave:
Transportation 4,376Conservation 2,606University of Wisconsin System 34,420Other funds 6,541
Transfers to fund a portion of the shared revenueprogram in the General Fund:
Transportation 230,000Utility Public Benefits 17,600
Transfers in:University of
Nonmajor Environmental Wisconsin Nonmajor InternalGeneral Transportation Governmental Improvement System Enterprise Service Total
Transfers out: General $ - $ 4 $ 363,493 $ - $ 923,041 $ 55,748 $ 5,272 $ 1,347,557 Transportation 338,495 - 24,819 - - - 42 363,356 Nonmajor Governmental 61,888 - 355,484 38,320 79,964 6,898 296 542,849 Injured Patients and Families Compensation 15 - - - - - - 15 Environmental Improvement 95 - 6,000 - - - - 6,095 Veterans Mortgage Loan Repayment 81 - - - - - - 81 University of Wisconsin System 48,665 - 1,475 - - - - 50,140 Unemployment Reserve 8,351 - - - - - - 8,351 Nonmajor Enterprise 31,607 - 127 - - 721 162 32,617 Internal Service 13,733 - 61 - 75 - 1,053 14,921 Fiduciary 524 - 20,000 - - - - 20,524 Capital Assets Transferred Between Proprietary Funds and Governmental Funds - - - - - (71) 930 859 Total $ 503,455 $ 4 $ 771,459 $ 38,320 $ 1,003,079 $ 63,295 $ 7,755 $ 2,387,367

State of Wisconsin Notes to The Financial Statements
94
NOTE 10. CHANGES IN LONG-TERM LIABILITIES
During the year ended June 30, 2004, the following changes occurred in long-term liabilities (in thousands):
Primary Government
Repayment of the general obligation bonds is made from theBond Security and Redemption Fund. The amount presented inthis fund represents the liability to be paid from resourcesaccumulated to provide debt service payments in Fiscal Year2004. Repayment of the revenue bonds principal and interest ismade from the appropriate debt service fund with paymentssecured by registration and inspection fees collected by theappropriate program. The compensated absences liability will beliquidated by the State's governmental and internal service funds.Long-term liabilities for claims, judgments and commitments aregenerally liquidated with resources of the governmental activities.
In July 2003, Wisconsin Act 33 was enacted and authorized theissuance of appropriation obligations to obtain proceeds to paythe State’s anticipated unfunded accrued prior service (pension)liability under Wis. Stat. Sec. 40.05(2)(b) and its unfundedaccrued liability for sick leave conversion credits under Wis. Stat.Sec. 40.05(4)(b), (bc), and (bw) and Subchapter IX of Chapter 40.In December 2003, the State issued $1.8 billion of these bonds.A portion of the proceeds was used to pay the State’s unfundedprior service (pension) liability, which was reported as “EmployerPension Related Debt Costs.”
AmountsBalance Balance Due Within
Governmental Activities July 1, 2003 Additions Reductions June 30, 2004 One Year
Bonds and Notes Payable:General Obligation Bonds $ 3,090,875 $ 1,073,030 $ 603,686 $ 3,560,219 $ 237,513 Annual Appropriation Bonds - 1,792,092 - 1,792,092 - Revenue Bonds 2,892,579 417,548 158,627 3,151,500 74,611
Total Bonds and Notes Payable 5,983,454 3,282,670 762,313 8,503,811 312,124 Other Liabilities:
Future Benefits and Loss Liability 118,265 14,819 22,228 110,856 25,385 Capital Leases 40,315 3,379 23,368 20,326 5,450 Installment Contracts 3,653 1,124 2,008 2,770 1,470 Compensated Absences 103,945 48,877 43,657 109,164 44,633 Employer Pension Related Debt Costs 722,248 - 722,248 - - Claims, Judgments and Commitments 2,174 - 137 2,037 -
Total Governmental Activities Long-term Liabilities $ 6,974,054 $ 3,350,869 $ 1,575,959 $ 8,748,965 $ 389,062
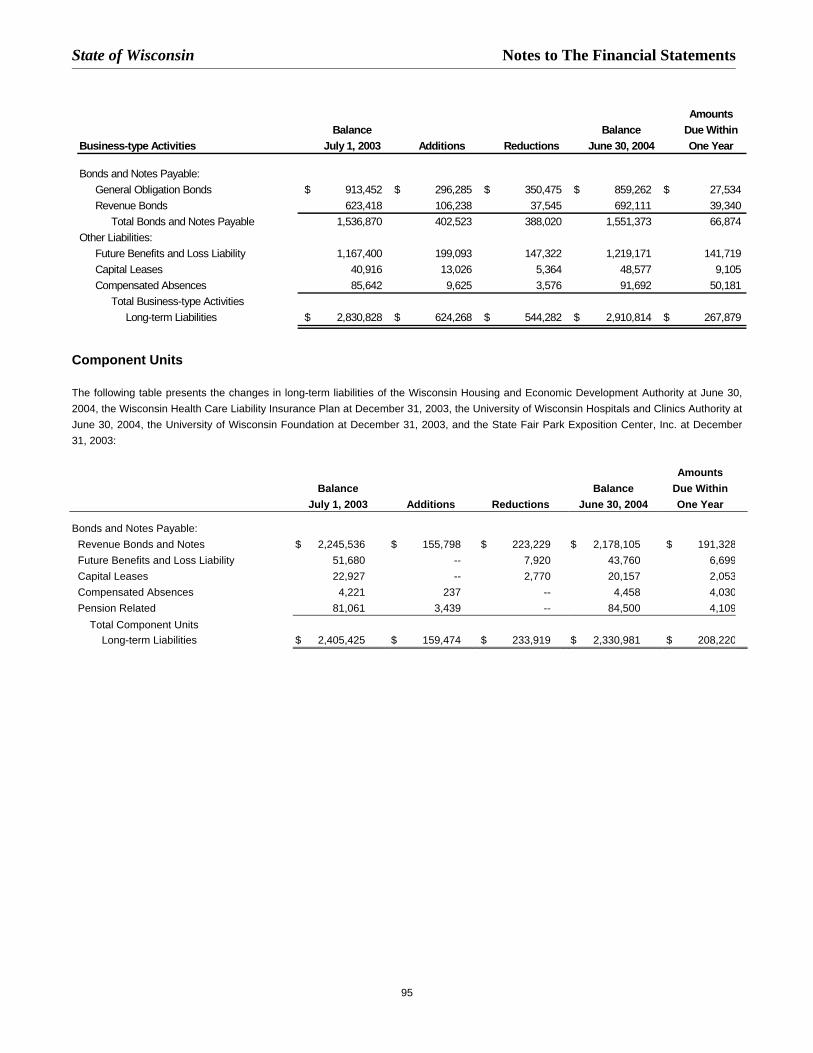
State of Wisconsin Notes to The Financial Statements
95
Component Units
The following table presents the changes in long-term liabilities of the Wisconsin Housing and Economic Development Authority at June 30,2004, the Wisconsin Health Care Liability Insurance Plan at December 31, 2003, the University of Wisconsin Hospitals and Clinics Authority atJune 30, 2004, the University of Wisconsin Foundation at December 31, 2003, and the State Fair Park Exposition Center, Inc. at December31, 2003:
AmountsBalance Balance Due Within
July 1, 2003 Additions Reductions June 30, 2004 One Year
Bonds and Notes Payable:Revenue Bonds and Notes $ 2,245,536 $ 155,798 $ 223,229 $ 2,178,105 $ 191,328Future Benefits and Loss Liability 51,680 -- 7,920 43,760 6,699Capital Leases 22,927 -- 2,770 20,157 2,053Compensated Absences 4,221 237 -- 4,458 4,030Pension Related 81,061 3,439 -- 84,500 4,109
Total Component Units Long-term Liabilities $ 2,405,425 $ 159,474 $ 233,919 $ 2,330,981 $ 208,220
AmountsBalance Balance Due Within
Business-type Activities July 1, 2003 Additions Reductions June 30, 2004 One Year
Bonds and Notes Payable:General Obligation Bonds $ 913,452 $ 296,285 $ 350,475 $ 859,262 $ 27,534 Revenue Bonds 623,418 106,238 37,545 692,111 39,340
Total Bonds and Notes Payable 1,536,870 402,523 388,020 1,551,373 66,874 Other Liabilities:
Future Benefits and Loss Liability 1,167,400 199,093 147,322 1,219,171 141,719 Capital Leases 40,916 13,026 5,364 48,577 9,105 Compensated Absences 85,642 9,625 3,576 91,692 50,181
Total Business-type Activities Long-term Liabilities $ 2,830,828 $ 624,268 $ 544,282 $ 2,910,814 $ 267,879
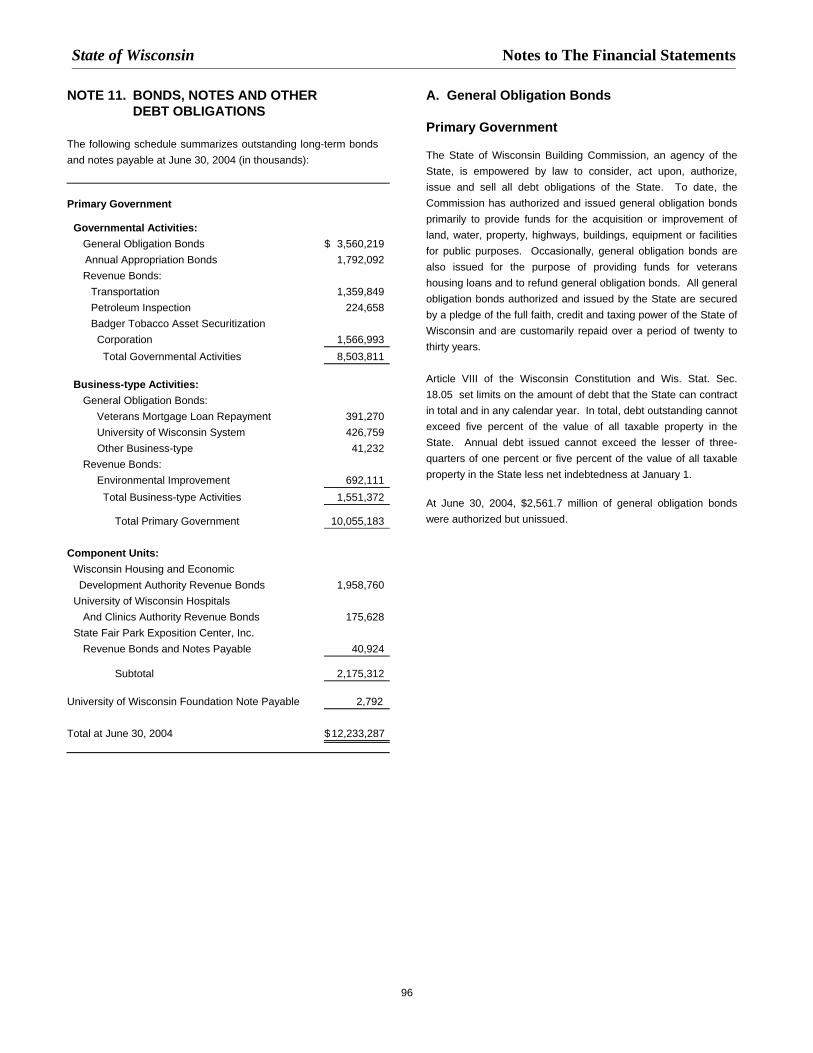
State of Wisconsin Notes to The Financial Statements
96
NOTE 11. BONDS, NOTES AND OTHERDEBT OBLIGATIONS
The following schedule summarizes outstanding long-term bondsand notes payable at June 30, 2004 (in thousands):
Primary Government
Governmental Activities:General Obligation Bonds $ 3,560,219Annual Appropriation Bonds 1,792,092Revenue Bonds:
Transportation 1,359,849Petroleum Inspection 224,658Badger Tobacco Asset Securitization
Corporation 1,566,993Total Governmental Activities 8,503,811
Business-type Activities:General Obligation Bonds:
Veterans Mortgage Loan Repayment 391,270University of Wisconsin System 426,759Other Business-type 41,232
Revenue Bonds:Environmental Improvement 692,111
Total Business-type Activities 1,551,372
Total Primary Government 10,055,183
Component Units:Wisconsin Housing and EconomicDevelopment Authority Revenue Bonds 1,958,760
University of Wisconsin HospitalsAnd Clinics Authority Revenue Bonds 175,628
State Fair Park Exposition Center, Inc.Revenue Bonds and Notes Payable 40,924
Subtotal 2,175,312
University of Wisconsin Foundation Note Payable 2,792
Total at June 30, 2004 $12,233,287
A. General Obligation Bonds
Primary Government
The State of Wisconsin Building Commission, an agency of theState, is empowered by law to consider, act upon, authorize,issue and sell all debt obligations of the State. To date, theCommission has authorized and issued general obligation bondsprimarily to provide funds for the acquisition or improvement ofland, water, property, highways, buildings, equipment or facilitiesfor public purposes. Occasionally, general obligation bonds arealso issued for the purpose of providing funds for veteranshousing loans and to refund general obligation bonds. All generalobligation bonds authorized and issued by the State are securedby a pledge of the full faith, credit and taxing power of the State ofWisconsin and are customarily repaid over a period of twenty tothirty years.
Article VIII of the Wisconsin Constitution and Wis. Stat. Sec.18.05 set limits on the amount of debt that the State can contractin total and in any calendar year. In total, debt outstanding cannotexceed five percent of the value of all taxable property in theState. Annual debt issued cannot exceed the lesser of three-quarters of one percent or five percent of the value of all taxableproperty in the State less net indebtedness at January 1.
At June 30, 2004, $2,561.7 million of general obligation bondswere authorized but unissued.

State of Wisconsin Notes to The Financial Statements
97
General obligation bonds issued and outstanding as of June 30, 2004 were as follows (in thousands):
FiscalYear Maturity Amount AmountIssued Series Dates Interest Rates Through Issued Outstanding
1990 1990 Series D 5/90 6.95 to 7.0 5/10 $ 65,859 $ 21,094
1991 1991 Series B 5/91 6.65 to 6.85 5/11 117,136 40,009
1992 1992 Refunding Issue 3/92 6.35 to 6.55 5/15 448,935 145,250
1993 1992 2; 10/92 4.6 to 7.75 5/15 423,565 261,530
1993 1, 2 1/93; 3/93
1994 1993 Refunding Issues 3, 5, 6; 8/93; 12/93; 4.65 to 6.2 5/24 515,830 229,675
1994 Refunding Issue 2 10/93; 3/94;
1995 1994 Series 3 and C; 9/94; 9/94; 2/95 5.5 to 7.0 5/25 331,715 21,355
1995 Series A & B, and 1 1/95; 2/95
1996 1995 Series 2 and C; 10/95; 9/95; 4.4 to 7.3 11/25 448,537 153,609
1996 Series 1, A, B 2/96; 1/96; 5/96
and Note 995B and 7/95
1997 1996 C and D; 9/96; 10/96; 5.75 to 6.25 5/28 190,230 29,815
1997 1 and A 3/97; 3/97
1998 1997 B, C and D; 7/97; 9/97 4.5 to 7.25 11/28 411,765 195,090
1998 A, B and C 9/97; 3/98; 5/98; 5/98
1999 1998 Series 1, 2, D, E and F; 8/98; 9/98; 9/98; 10/98 4.0 to 7.25 11/30 590,675 382,810
1999 Series 1, A and B 10/98; 5/99; 2/99; 5/99
2000 1999 C and D; 2000 A; 10/99; 11/99; 3/00 5.0 to 7.7 11/30 315,000 101,970
2001 2000 Series B, C, D, E; and 7/00;7/00;11/00;11/00 4.0 to 8.05 11/31 546,710 330,770
2001 Series A, B, C and D 2/01; 4/01; 6/01; 6/01
2002 2001 Series 1, E, F and F1; and 10/01; 10/01; 10/01 3.0 to 6.96 5/33 819,545 713,495
2002 Series 1, A, B, C, D 3/02; 3/02; 3/02; 6/02; 6/02
2003 2002 Series E, F, G and H; 9/02; 9/02; 10/02; 12/02 2.45 to 6.00 5/33 415,190 391,755
2003 Series 1, 2, and A 4/03; 4/03; 5/03
2004 2003 B, C, and 3; 7/03; 10/03;10/03; 0 to 17.785 5/34 1,305,096 1,305,096
2004 1, 2, A, 3 and CWGBC 1/04; 1/04, 3/04; 6/04; 4/04
Total 6,945,788 4,323,323
Premiums/Discounts -- 133,275
Deferred Amount on Refunding -- (37,117)
Total General Obligation Bonds and Notes $ 6,945,788 $ 4,419,481
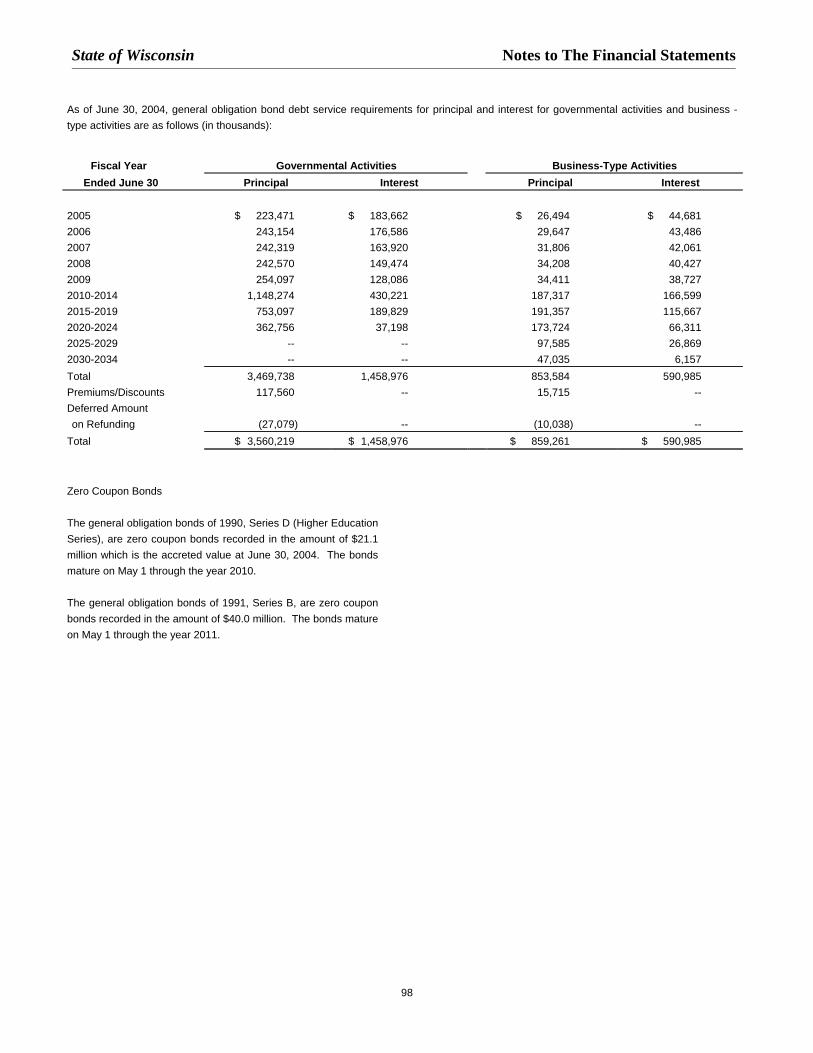
State of Wisconsin Notes to The Financial Statements
98
As of June 30, 2004, general obligation bond debt service requirements for principal and interest for governmental activities and business -type activities are as follows (in thousands):
Fiscal Year Governmental Activities Business-Type ActivitiesEnded June 30 Principal Interest Principal Interest
2005 $ 223,471 $ 183,662 $ 26,494 $ 44,6812006 243,154 176,586 29,647 43,4862007 242,319 163,920 31,806 42,0612008 242,570 149,474 34,208 40,4272009 254,097 128,086 34,411 38,7272010-2014 1,148,274 430,221 187,317 166,5992015-2019 753,097 189,829 191,357 115,6672020-2024 362,756 37,198 173,724 66,3112025-2029 -- -- 97,585 26,8692030-2034 -- -- 47,035 6,157Total 3,469,738 1,458,976 853,584 590,985Premiums/Discounts 117,560 -- 15,715 --Deferred Amounton Refunding (27,079) -- (10,038) --
Total $ 3,560,219 $ 1,458,976 $ 859,261 $ 590,985
Zero Coupon Bonds
The general obligation bonds of 1990, Series D (Higher EducationSeries), are zero coupon bonds recorded in the amount of $21.1million which is the accreted value at June 30, 2004. The bondsmature on May 1 through the year 2010.
The general obligation bonds of 1991, Series B, are zero couponbonds recorded in the amount of $40.0 million. The bonds matureon May 1 through the year 2011.
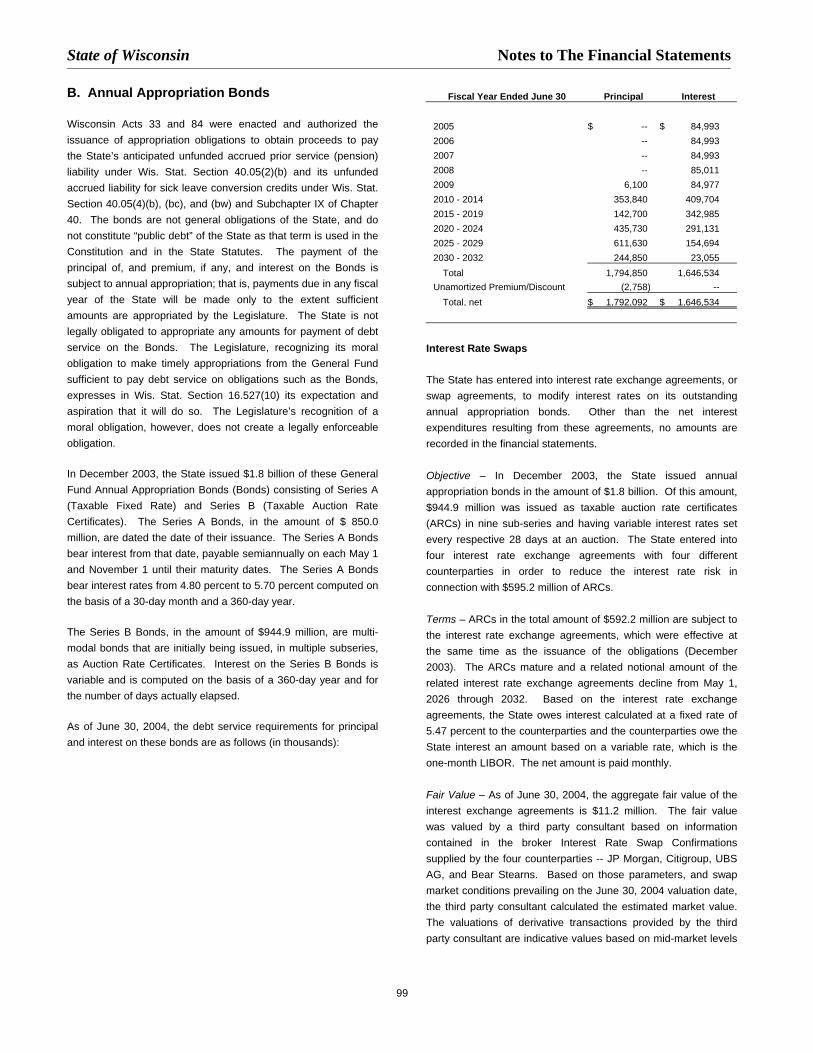
State of Wisconsin Notes to The Financial Statements
99
B. Annual Appropriation Bonds
Wisconsin Acts 33 and 84 were enacted and authorized theissuance of appropriation obligations to obtain proceeds to paythe State’s anticipated unfunded accrued prior service (pension)liability under Wis. Stat. Section 40.05(2)(b) and its unfundedaccrued liability for sick leave conversion credits under Wis. Stat.Section 40.05(4)(b), (bc), and (bw) and Subchapter IX of Chapter40. The bonds are not general obligations of the State, and donot constitute “public debt” of the State as that term is used in theConstitution and in the State Statutes. The payment of theprincipal of, and premium, if any, and interest on the Bonds issubject to annual appropriation; that is, payments due in any fiscalyear of the State will be made only to the extent sufficientamounts are appropriated by the Legislature. The State is notlegally obligated to appropriate any amounts for payment of debtservice on the Bonds. The Legislature, recognizing its moralobligation to make timely appropriations from the General Fundsufficient to pay debt service on obligations such as the Bonds,expresses in Wis. Stat. Section 16.527(10) its expectation andaspiration that it will do so. The Legislature’s recognition of amoral obligation, however, does not create a legally enforceableobligation.
In December 2003, the State issued $1.8 billion of these GeneralFund Annual Appropriation Bonds (Bonds) consisting of Series A(Taxable Fixed Rate) and Series B (Taxable Auction RateCertificates). The Series A Bonds, in the amount of $ 850.0million, are dated the date of their issuance. The Series A Bondsbear interest from that date, payable semiannually on each May 1and November 1 until their maturity dates. The Series A Bondsbear interest rates from 4.80 percent to 5.70 percent computed onthe basis of a 30-day month and a 360-day year.
The Series B Bonds, in the amount of $944.9 million, are multi-modal bonds that are initially being issued, in multiple subseries,as Auction Rate Certificates. Interest on the Series B Bonds isvariable and is computed on the basis of a 360-day year and forthe number of days actually elapsed.
As of June 30, 2004, the debt service requirements for principaland interest on these bonds are as follows (in thousands):
Fiscal Year Ended June 30 Principal Interest
2005 $ -- $ 84,9932006 -- 84,9932007 -- 84,9932008 -- 85,0112009 6,100 84,9772010 - 2014 353,840 409,7042015 - 2019 142,700 342,9852020 - 2024 435,730 291,1312025 - 2029 611,630 154,6942030 - 2032 244,850 23,055
Total 1,794,850 1,646,534Unamortized Premium/Discount (2,758) --
Total, net $ 1,792,092 $ 1,646,534
Interest Rate Swaps
The State has entered into interest rate exchange agreements, orswap agreements, to modify interest rates on its outstandingannual appropriation bonds. Other than the net interestexpenditures resulting from these agreements, no amounts arerecorded in the financial statements.
Objective – In December 2003, the State issued annualappropriation bonds in the amount of $1.8 billion. Of this amount,$944.9 million was issued as taxable auction rate certificates(ARCs) in nine sub-series and having variable interest rates setevery respective 28 days at an auction. The State entered intofour interest rate exchange agreements with four differentcounterparties in order to reduce the interest rate risk inconnection with $595.2 million of ARCs.
Terms – ARCs in the total amount of $592.2 million are subject tothe interest rate exchange agreements, which were effective atthe same time as the issuance of the obligations (December2003). The ARCs mature and a related notional amount of therelated interest rate exchange agreements decline from May 1,2026 through 2032. Based on the interest rate exchangeagreements, the State owes interest calculated at a fixed rate of5.47 percent to the counterparties and the counterparties owe theState interest an amount based on a variable rate, which is theone-month LIBOR. The net amount is paid monthly.
Fair Value – As of June 30, 2004, the aggregate fair value of theinterest exchange agreements is $11.2 million. The fair valuewas valued by a third party consultant based on informationcontained in the broker Interest Rate Swap Confirmationssupplied by the four counterparties -- JP Morgan, Citigroup, UBSAG, and Bear Stearns. Based on those parameters, and swapmarket conditions prevailing on the June 30, 2004 valuation date,the third party consultant calculated the estimated market value.The valuations of derivative transactions provided by the thirdparty consultant are indicative values based on mid-market levels
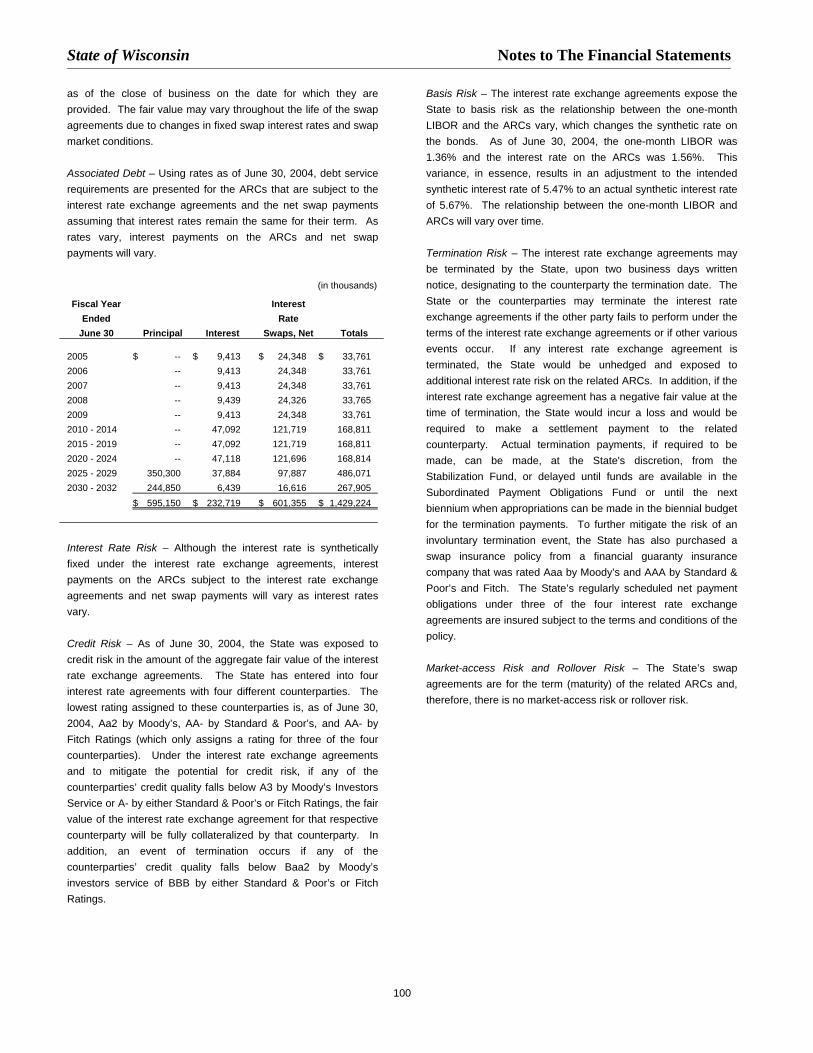
State of Wisconsin Notes to The Financial Statements
100
as of the close of business on the date for which they areprovided. The fair value may vary throughout the life of the swapagreements due to changes in fixed swap interest rates and swapmarket conditions.
Associated Debt – Using rates as of June 30, 2004, debt servicerequirements are presented for the ARCs that are subject to theinterest rate exchange agreements and the net swap paymentsassuming that interest rates remain the same for their term. Asrates vary, interest payments on the ARCs and net swappayments will vary.
(in thousands)
Fiscal Year InterestEnded Rate
June 30 Principal Interest Swaps, Net Totals
2005 $ -- $ 9,413 $ 24,348 $ 33,7612006 -- 9,413 24,348 33,7612007 -- 9,413 24,348 33,7612008 -- 9,439 24,326 33,7652009 -- 9,413 24,348 33,7612010 - 2014 -- 47,092 121,719 168,8112015 - 2019 -- 47,092 121,719 168,8112020 - 2024 -- 47,118 121,696 168,8142025 - 2029 350,300 37,884 97,887 486,0712030 - 2032 244,850 6,439 16,616 267,905
$ 595,150 $ 232,719 $ 601,355 $ 1,429,224
Interest Rate Risk – Although the interest rate is syntheticallyfixed under the interest rate exchange agreements, interestpayments on the ARCs subject to the interest rate exchangeagreements and net swap payments will vary as interest ratesvary.
Credit Risk – As of June 30, 2004, the State was exposed tocredit risk in the amount of the aggregate fair value of the interestrate exchange agreements. The State has entered into fourinterest rate agreements with four different counterparties. Thelowest rating assigned to these counterparties is, as of June 30,2004, Aa2 by Moody’s, AA- by Standard & Poor’s, and AA- byFitch Ratings (which only assigns a rating for three of the fourcounterparties). Under the interest rate exchange agreementsand to mitigate the potential for credit risk, if any of thecounterparties’ credit quality falls below A3 by Moody’s InvestorsService or A- by either Standard & Poor’s or Fitch Ratings, the fairvalue of the interest rate exchange agreement for that respectivecounterparty will be fully collateralized by that counterparty. Inaddition, an event of termination occurs if any of thecounterparties’ credit quality falls below Baa2 by Moody’sinvestors service of BBB by either Standard & Poor’s or FitchRatings.
Basis Risk – The interest rate exchange agreements expose theState to basis risk as the relationship between the one-monthLIBOR and the ARCs vary, which changes the synthetic rate onthe bonds. As of June 30, 2004, the one-month LIBOR was1.36% and the interest rate on the ARCs was 1.56%. Thisvariance, in essence, results in an adjustment to the intendedsynthetic interest rate of 5.47% to an actual synthetic interest rateof 5.67%. The relationship between the one-month LIBOR andARCs will vary over time.
Termination Risk – The interest rate exchange agreements maybe terminated by the State, upon two business days writtennotice, designating to the counterparty the termination date. TheState or the counterparties may terminate the interest rateexchange agreements if the other party fails to perform under theterms of the interest rate exchange agreements or if other variousevents occur. If any interest rate exchange agreement isterminated, the State would be unhedged and exposed toadditional interest rate risk on the related ARCs. In addition, if theinterest rate exchange agreement has a negative fair value at thetime of termination, the State would incur a loss and would berequired to make a settlement payment to the relatedcounterparty. Actual termination payments, if required to bemade, can be made, at the State's discretion, from theStabilization Fund, or delayed until funds are available in theSubordinated Payment Obligations Fund or until the nextbiennium when appropriations can be made in the biennial budgetfor the termination payments. To further mitigate the risk of aninvoluntary termination event, the State has also purchased aswap insurance policy from a financial guaranty insurancecompany that was rated Aaa by Moody’s and AAA by Standard &Poor’s and Fitch. The State’s regularly scheduled net paymentobligations under three of the four interest rate exchangeagreements are insured subject to the terms and conditions of thepolicy.
Market-access Risk and Rollover Risk – The State’s swapagreements are for the term (maturity) of the related ARCs and,therefore, there is no market-access risk or rollover risk.

State of Wisconsin Notes to The Financial Statements
101
C. Revenue Bonds
Primary Government
Chapter 18, Wisconsin Statutes, authorizes the State to issuerevenue obligations secured by a pledge of revenues or propertyderived from the operation of a program funded by the issuance ofthese obligations. The resulting bond obligations are not generalobligations of the State.
Transportation Revenue Bonds
Transportation Revenue Bonds are issued to finance part of thecosts of certain transportation facilities and major highwayprojects. Chapter 18, Subchapter II of the Wisconsin Statutes asamended, Wis. Stat. Sec. 84.59 and a general bond resolutionand series resolutions authorize the issuance of these bonds.
The Department of Transportation is authorized to issue a total of$2,095.6 million of revenue bonds. Presently, there are twelveissues of Transportation Revenue Bonds totaling $1,316.3 million.Debt service payments are secured by driver and vehicleregistration fees and also a reserve fund, which will be used in theevent that a deficiency exists in the redemption fund.
The Transportation Revenue Bonds issued and outstanding as ofJune 30, 2004 were as follows (in thousands):
Issue Interest MaturityIssue Date Rates Through Issued Outstanding
2003A 11/03 2.5 to 5.25 7/24 $ 250,000 $ 250,000
2002A 10/02 3.0 to 5.0 7/23 200,000 200,000
20022 4/02 3.0 to 5.5 7/22 68,930 68,930
20021 4/02 5.0 to 5.75 7/19 241,865 227,805
2001A 11/01 3.0 to 5.0 7/22 140,000 130,580
2000A 9/00 5.3 to 5.5 7/21 93,100 93,100
1998A&B 8&10/98 4.125 to 5.5 7/19 229,545 208,140
1996A 5/96 5.0 to 6.0 7/08 54,630 26,545
1995A 9/95 4.8 to 6.25 7/07 49,495 19,750
1994A 7/94 5.3 to 7.5 7/05 41,845 9,395
1993A 9/93 4.5 to 5.0 7/12 116,450 82,005
1,485,860 1,316,250
Unamortized Premium 43,599
Total $ 1,485,860 $ 1,359,849
Petroleum Inspection Fee Revenue Bonds
Petroleum Inspection Fee (PIF) Revenue Bonds are issued tofinance claims made under the Petroleum Environmental CleanupFund Award (PECFA) Program for reimbursement of cleanupcosts to soil and groundwater contamination. The programreimburses owners for 75 percent to 99 percent of cleanup costsassociated with soil and groundwater contamination.
Presently, there are four issues of PIF Bonds outstanding totaling$224.7 million. Debt service payments are secured by petroleuminspection fees.
The PIF revenue bonds issued and outstanding as of June 30,2004 were as follows (in thousands):
Issue Interest MaturityIssue Date Rates Through Issued Outstanding
2004-1 5/04 3.0 to 5.0 7/12 $ 95,470 $ 95,470
2004A 2/04 3.0 to 5.0 7/12 45,000 45,000
2001A 12/01 5.0 7/08 30,000 30,000
2000A 3/00 5.25 to 6.0 7/12 170,250 48,420
340,720 218,890
Unamortized Premium -- 11,043
Deferred Amount on Refunding -- (5,275)
Total $ 340,720 $ 224,658
Clean Water Revenue Bonds
The Environmental Improvement Fund (the Fund) provides loansand grants to local municipalities to finance wastewater treatmentplanning and construction. The Fund is authorized to issue up to$1,616.0 million in Revenue Bonds. At June 30, 2004, there wereeleven issues of Revenue Bonds outstanding totaling $692.1million. These bonds are secured by payments on program loansand earnings of investments.
Bonds issued and outstanding for the Fund as of June 30, 2004were as follows (in thousands):
Issue Interest MaturityIssue Date Rates Through Issued Outstanding
2004-1 3/04 4.0 to 5.0 6/24 $ 116,795 $ 116,795
2002-2 8/02 3.0 to 5.5 6/26 85,575 84,340
2002-1 5/01 4.0 to 5.25 6/23 100,000 94,295
2001-1 4/01 4.5 to 5.25 6/21 70,000 62,825
1999-1 9/99 5.0 to 5.75 6/20 80,000 50,740
1998-2 8/99 4.0 to 5.5 6/17 104,360 90,400
1998-1 1/98 4.0 to 5.0 6/18 90,000 65,780
1997-1 2/97 4.5 to 6.0 6/17 80,000 10,915
1995-1 7/95 4.0 to 6.25 6/15 80,000 4,365
1993-2 9/93 2.75 to 6.125 6/08 81,950 45,035
1993-1 9/93 3.6 to 5.3 6/13 84,345 --
1991-1 4/91 5.4 to 6.9 6/11 225,000 57,445
1,198,025 682,935
Unamortized Premium 19,388
Less: Unamortized discount
and charge (10,212)
Total, net of discount, charge and
premium $ 1,198,025 $ 692,111
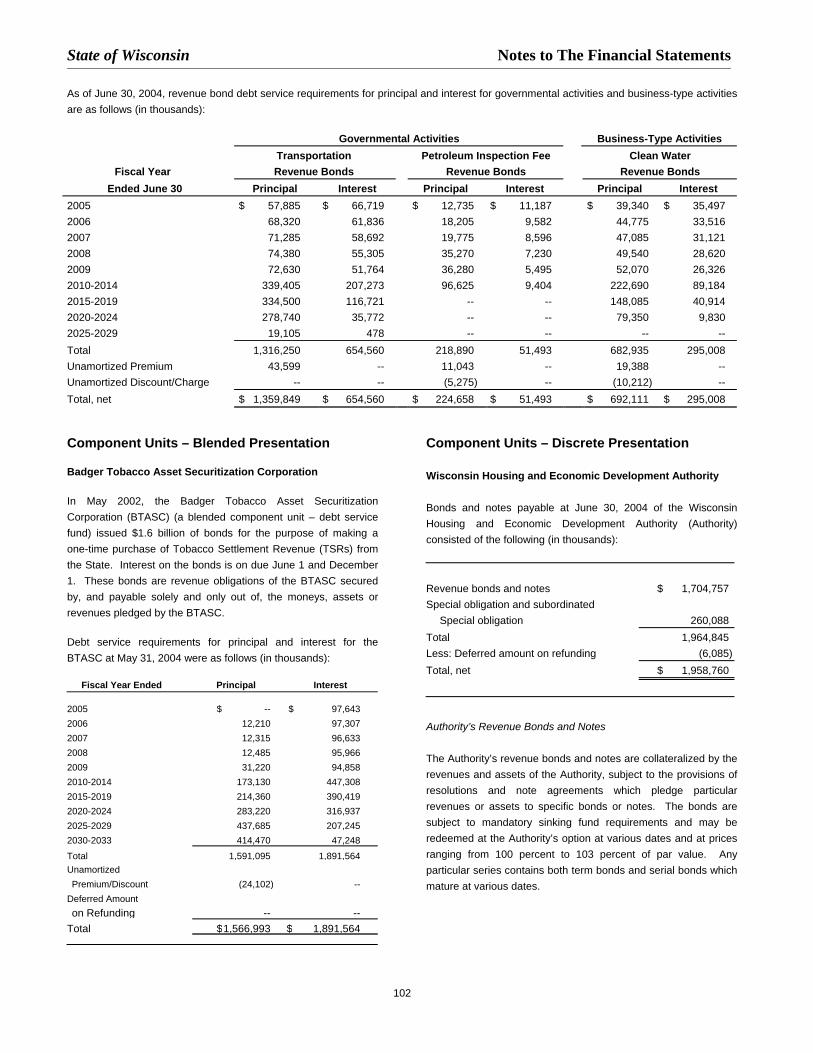
State of Wisconsin Notes to The Financial Statements
102
As of June 30, 2004, revenue bond debt service requirements for principal and interest for governmental activities and business-type activitiesare as follows (in thousands):
Governmental Activities Business-Type ActivitiesTransportation Petroleum Inspection Fee Clean Water
Fiscal Year Revenue Bonds Revenue Bonds Revenue BondsEnded June 30 Principal Interest Principal Interest Principal Interest
2005 $ 57,885 $ 66,719 $ 12,735 $ 11,187 $ 39,340 $ 35,4972006 68,320 61,836 18,205 9,582 44,775 33,5162007 71,285 58,692 19,775 8,596 47,085 31,1212008 74,380 55,305 35,270 7,230 49,540 28,6202009 72,630 51,764 36,280 5,495 52,070 26,3262010-2014 339,405 207,273 96,625 9,404 222,690 89,1842015-2019 334,500 116,721 -- -- 148,085 40,9142020-2024 278,740 35,772 -- -- 79,350 9,8302025-2029 19,105 478 -- -- -- --Total 1,316,250 654,560 218,890 51,493 682,935 295,008Unamortized Premium 43,599 -- 11,043 -- 19,388 --Unamortized Discount/Charge -- -- (5,275) -- (10,212) --Total, net $ 1,359,849 $ 654,560 $ 224,658 $ 51,493 $ 692,111 $ 295,008
Component Units – Blended Presentation
Badger Tobacco Asset Securitization Corporation
In May 2002, the Badger Tobacco Asset SecuritizationCorporation (BTASC) (a blended component unit – debt servicefund) issued $1.6 billion of bonds for the purpose of making aone-time purchase of Tobacco Settlement Revenue (TSRs) fromthe State. Interest on the bonds is on due June 1 and December1. These bonds are revenue obligations of the BTASC securedby, and payable solely and only out of, the moneys, assets orrevenues pledged by the BTASC.
Debt service requirements for principal and interest for theBTASC at May 31, 2004 were as follows (in thousands):
Fiscal Year Ended Principal Interest
2005 $ -- $ 97,6432006 12,210 97,3072007 12,315 96,6332008 12,485 95,9662009 31,220 94,8582010-2014 173,130 447,3082015-2019 214,360 390,4192020-2024 283,220 316,9372025-2029 437,685 207,2452030-2033 414,470 47,248Total 1,591,095 1,891,564UnamortizedPremium/Discount (24,102) --
Deferred Amounton Refunding -- --
Total $1,566,993 $ 1,891,564
Component Units – Discrete Presentation
Wisconsin Housing and Economic Development Authority
Bonds and notes payable at June 30, 2004 of the WisconsinHousing and Economic Development Authority (Authority)consisted of the following (in thousands):
Revenue bonds and notes $ 1,704,757Special obligation and subordinated
Special obligation 260,088Total 1,964,845Less: Deferred amount on refunding (6,085)Total, net $ 1,958,760
Authority’s Revenue Bonds and Notes
The Authority’s revenue bonds and notes are collateralized by therevenues and assets of the Authority, subject to the provisions ofresolutions and note agreements which pledge particularrevenues or assets to specific bonds or notes. The bonds aresubject to mandatory sinking fund requirements and may beredeemed at the Authority’s option at various dates and at pricesranging from 100 percent to 103 percent of par value. Anyparticular series contains both term bonds and serial bonds whichmature at various dates.

State of Wisconsin Notes to The Financial Statements
103
The Authority’s revenue bonds and notes outstanding at June 30,2004 consisted of the following (in thousands):
Series/ MaturityIssue Date Rates Through Outstanding
Housing Revenue Bonds:
1992 A 1/92 6.85 2012 $ 3,370
1993 A&B 10/93 5.0 to 5.65 2023 43,690
1993 C 12/93 5.2 to 5.875 2019 96,040
1995 A&B 7/95 5.3 to 6.5 2026 36,730
1998 A,B&C 2/98 4.4 to 6.88 2032 35,170
1999 A&B 10/99 4.75 to 6.18 2031 37,960
2000 A&B 9/00 Variable 2032 10,440
2002 A, B&C 5/02 3.2 to 5.6 2033 105,015
2002 D, E&G 5/02 Variable 2034 15,620
2002 F 5/02 Variable 2033 10,280
2002 H 5/02 4.68 2033 25,520
2002 I 5/02 Variable 2033 6,900
2003 A&B 12/03 Variable 2034 6,460
2003 C 12/03 1.4 to 5.25 2043 15,000
2003 D& E 12/03 Variable 2044 20,515
468,710
Home Ownership Revenue Bonds:
1995 A&B 1/95 6.3 2025 100
1995 C,D&E 5/95 5.55 to 7.45 2026 16,465
1995 F,G&H 9/95 5.25 to 7.2 2017 6,960
1996 A&B 3/96 5.3 to 6.15 2027 17,240
1996 C&D 7/96 5.5 to 6.35 2027 14,580
1996 E&F 11/96 5.0 to 6.1 2026 12,280
1997 A,B&C 4/97 5.2 to 6.1 2028 17,095
1997 D&E 6/97 4.85 to 6.0 2028 27,410
1997 G,H&I 11/97 4.85 to 5.55 2028 17,110
1998 A,B&C 4/98 4.75 to 5.375 2028 62,375
1998 D&E 6/98 4.55 to 5.45 2028 37,930
1999 C,D&E 4/99 4.15 to 7.29 2029 30,120
1999 A&B 8/99 5.3 to 5.5 2021 11,240
1999 F,G&H 7/99 4.55 to 7.07 2030 27,280
2000 A,B&C 3/00 5.2 to 8.57 2030 17,770
2000 D,E&F 6/00 5.75 to 7.91 2031 17,760
2000 F 7/00 Variable 2015 6,690
2000 G 11/00 7.21 2031 9,390
2000 H 11/00 Variable 2024 12,920
2001 A,B&C 5/01 3.95 to 6.4 2032 31,330
2002 A&C 2/02 2.6 to 5.5 2032 66,790
2002 B 2/02 5.88 2032 17,740
2002 C 2/02 3.69 2016 14,945
2002 D 2/02 2.91 2022 6,570
2002 E,G&H 3/03 2.2 to 5.25 2022 108,865
2002 I 10/02 Variable 2032 82,740
2002 F 7/02 Variable 2032 21,180
2002 J 10/02 Variable 2032 8,640
(Continued)
Series/ MaturityIssue Date Rates Through Outstanding
2003 A 4/03 1.3 to 4.95 2033 108,310
2003 B 7/03 3.935 2034 109,395
2003 C 11/03 1.25 to 4.95 2034 89,920
2003 D 11/03 Variable 2028 19,830
2004 A 4/04 4.47 2034 130,000
2004 B 4/04 Variable 2034 6,295
1,185,265
Business Development Bonds:
1989 3 Various 4.5 to 5.0 2014 955
1991 4,6 Various 3.75 to 5.5 2006 1,460
1995 1-2,4-9 Various Variable 2015 9,800
12,215
Notes Payable Various Variable 2021 38,567
Authority’s Total Revenue Bonds and Notes $ 1,704,757
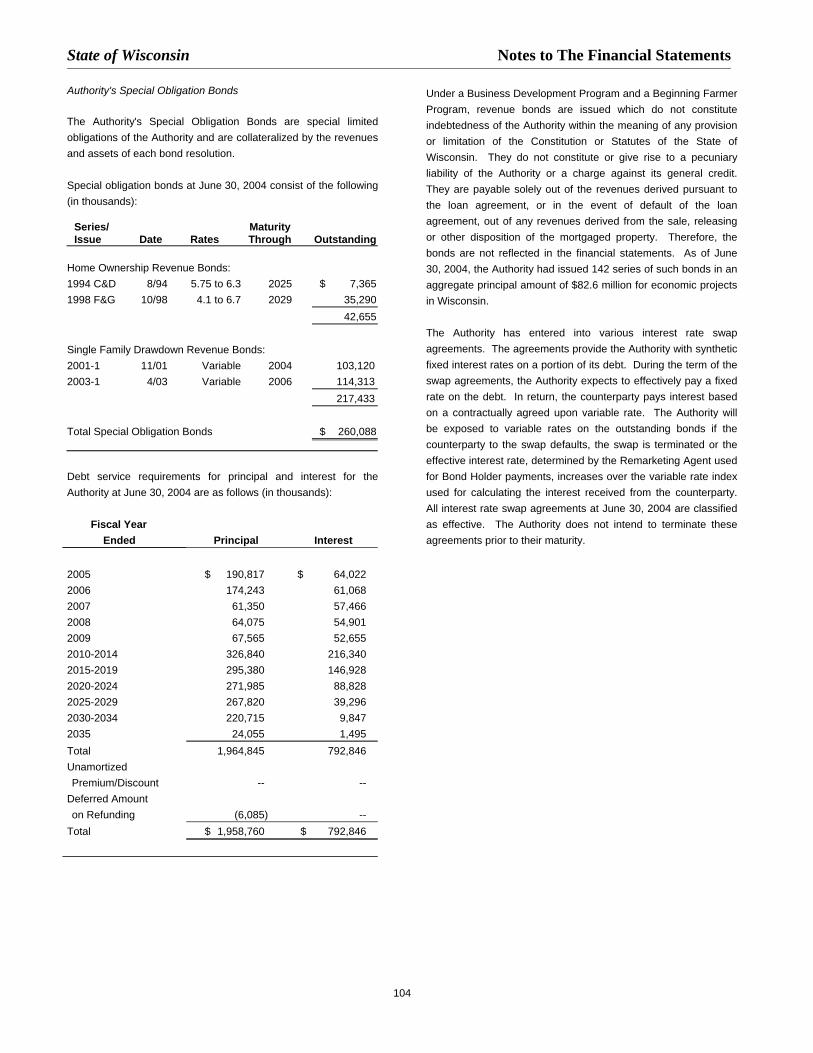
State of Wisconsin Notes to The Financial Statements
104
Authority's Special Obligation Bonds
The Authority's Special Obligation Bonds are special limitedobligations of the Authority and are collateralized by the revenuesand assets of each bond resolution.
Special obligation bonds at June 30, 2004 consist of the following(in thousands):
Series/ MaturityIssue Date Rates Through Outstanding
Home Ownership Revenue Bonds:1994 C&D 8/94 5.75 to 6.3 2025 $ 7,3651998 F&G 10/98 4.1 to 6.7 2029 35,290
42,655
Single Family Drawdown Revenue Bonds:2001-1 11/01 Variable 2004 103,1202003-1 4/03 Variable 2006 114,313
217,433
Total Special Obligation Bonds $ 260,088
Debt service requirements for principal and interest for theAuthority at June 30, 2004 are as follows (in thousands):
Fiscal YearEnded Principal Interest
2005 $ 190,817 $ 64,0222006 174,243 61,0682007 61,350 57,4662008 64,075 54,9012009 67,565 52,6552010-2014 326,840 216,3402015-2019 295,380 146,9282020-2024 271,985 88,8282025-2029 267,820 39,2962030-2034 220,715 9,8472035 24,055 1,495Total 1,964,845 792,846UnamortizedPremium/Discount -- --
Deferred Amounton Refunding (6,085) --
Total $ 1,958,760 $ 792,846
Under a Business Development Program and a Beginning FarmerProgram, revenue bonds are issued which do not constituteindebtedness of the Authority within the meaning of any provisionor limitation of the Constitution or Statutes of the State ofWisconsin. They do not constitute or give rise to a pecuniaryliability of the Authority or a charge against its general credit.They are payable solely out of the revenues derived pursuant tothe loan agreement, or in the event of default of the loanagreement, out of any revenues derived from the sale, releasingor other disposition of the mortgaged property. Therefore, thebonds are not reflected in the financial statements. As of June30, 2004, the Authority had issued 142 series of such bonds in anaggregate principal amount of $82.6 million for economic projectsin Wisconsin.
The Authority has entered into various interest rate swapagreements. The agreements provide the Authority with syntheticfixed interest rates on a portion of its debt. During the term of theswap agreements, the Authority expects to effectively pay a fixedrate on the debt. In return, the counterparty pays interest basedon a contractually agreed upon variable rate. The Authority willbe exposed to variable rates on the outstanding bonds if thecounterparty to the swap defaults, the swap is terminated or theeffective interest rate, determined by the Remarketing Agent usedfor Bond Holder payments, increases over the variable rate indexused for calculating the interest received from the counterparty.All interest rate swap agreements at June 30, 2004 are classifiedas effective. The Authority does not intend to terminate theseagreements prior to their maturity.
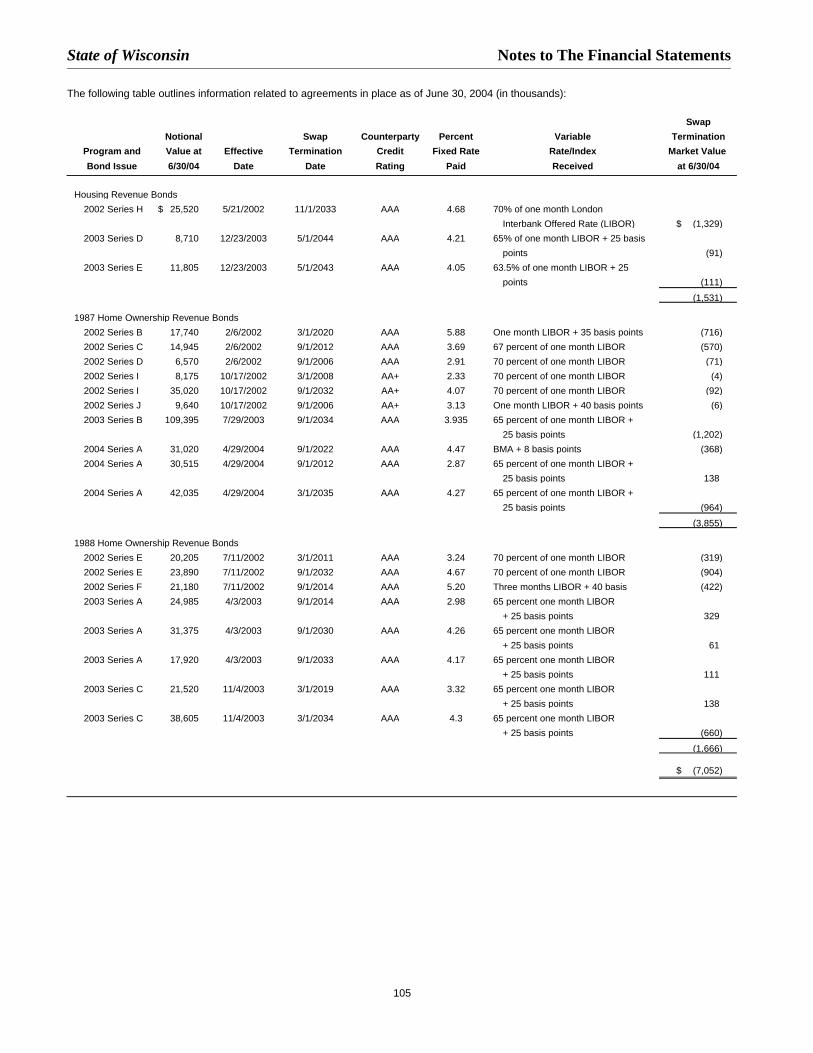
State of Wisconsin Notes to The Financial Statements
105
The following table outlines information related to agreements in place as of June 30, 2004 (in thousands):
SwapNotional Swap Counterparty Percent Variable Termination
Program and Value at Effective Termination Credit Fixed Rate Rate/Index Market Value Bond Issue 6/30/04 Date Date Rating Paid Received at 6/30/04
Housing Revenue Bonds2002 Series H $ 25,520 5/21/2002 11/1/2033 AAA 4.68 70% of one month London
Interbank Offered Rate (LIBOR) $ (1,329)2003 Series D 8,710 12/23/2003 5/1/2044 AAA 4.21 65% of one month LIBOR + 25 basis
points (91)2003 Series E 11,805 12/23/2003 5/1/2043 AAA 4.05 63.5% of one month LIBOR + 25
points (111)(1,531)
1987 Home Ownership Revenue Bonds2002 Series B 17,740 2/6/2002 3/1/2020 AAA 5.88 One month LIBOR + 35 basis points (716)2002 Series C 14,945 2/6/2002 9/1/2012 AAA 3.69 67 percent of one month LIBOR (570)2002 Series D 6,570 2/6/2002 9/1/2006 AAA 2.91 70 percent of one month LIBOR (71)2002 Series I 8,175 10/17/2002 3/1/2008 AA+ 2.33 70 percent of one month LIBOR (4)2002 Series I 35,020 10/17/2002 9/1/2032 AA+ 4.07 70 percent of one month LIBOR (92)2002 Series J 9,640 10/17/2002 9/1/2006 AA+ 3.13 One month LIBOR + 40 basis points (6)2003 Series B 109,395 7/29/2003 9/1/2034 AAA 3.935 65 percent of one month LIBOR +
25 basis points (1,202)2004 Series A 31,020 4/29/2004 9/1/2022 AAA 4.47 BMA + 8 basis points (368)2004 Series A 30,515 4/29/2004 9/1/2012 AAA 2.87 65 percent of one month LIBOR +
25 basis points 1382004 Series A 42,035 4/29/2004 3/1/2035 AAA 4.27 65 percent of one month LIBOR +
25 basis points (964)(3,855)
1988 Home Ownership Revenue Bonds2002 Series E 20,205 7/11/2002 3/1/2011 AAA 3.24 70 percent of one month LIBOR (319)2002 Series E 23,890 7/11/2002 9/1/2032 AAA 4.67 70 percent of one month LIBOR (904)2002 Series F 21,180 7/11/2002 9/1/2014 AAA 5.20 Three months LIBOR + 40 basis (422)2003 Series A 24,985 4/3/2003 9/1/2014 AAA 2.98 65 percent one month LIBOR
+ 25 basis points 3292003 Series A 31,375 4/3/2003 9/1/2030 AAA 4.26 65 percent one month LIBOR
+ 25 basis points 612003 Series A 17,920 4/3/2003 9/1/2033 AAA 4.17 65 percent one month LIBOR
+ 25 basis points 1112003 Series C 21,520 11/4/2003 3/1/2019 AAA 3.32 65 percent one month LIBOR
+ 25 basis points 1382003 Series C 38,605 11/4/2003 3/1/2034 AAA 4.3 65 percent one month LIBOR
+ 25 basis points (660)(1,666)
$ (7,052)

State of Wisconsin Notes to The Financial Statements
106
The commercial paper obligations are issued for terms of one to270 days. These obligations bear interest at various rates, whichranged from 1.15 percent to 1.25 percent and 0.95 percent to 1.3percent at June 30, 2004 and June 30, 2003 respectively. Theobligations are backed by a line of credit agreement which isrenewable annually and bears interest at variable rates, based onan index defined in the agreement. The line of credit agreementsused for temporary mortgage financing, one of which is renewableannually, bear interest based on the 30 day LIBOR rate. Thethree agreements bear interest at the rates of 1.875 percent, 1.99percent and 1.59 percent at June 30, 2004.
University of Wisconsin Hospitals and Clinics Authority
In April 1997, the University of Wisconsin Hospitals and ClinicsAuthority (the Hospital) issued $50.0 million of Variable RateDemand Hospital Revenue Bonds, Series 1997. The bondproceeds are designated to finance qualified capital projects.Principal payments on the Series 1997 Bonds are due annuallycommencing in April 2010 through April 2026. Interest is payablemonthly. The effective annual estimated interest rate was 1.0percent in 2004.
In March 2000, the Hospital issued $56.5 million of HospitalRevenue Bonds Series 2000. The bond proceeds are designatedto finance qualified capital projects. Principal payments are dueannually commencing in April 2007 through April 2029. Interestrates range from 5.35 percent to 6.20 percent and interest ispayable semiannually on April 1 and October 1 each yearbeginning October 1, 2000. The effective annual interest rate was6.1 percent in 2004.
The Series 1997 Bonds, Series 2000 Bonds and Series 2002Bonds are collateralized by a security interest in substantially all ofthe Hospital’s revenue. The borrowing agreements containvarious covenants and restrictions including compliance with theterms and conditions of the lease agreement (Note 1-B) andprovisions limiting the amount of additional indebtedness whichmay be incurred. The borrowing agreements also require theestablishment and maintenance of certain funds under the controlof a trustee.
In October 2002, the Hospital issued $68.5 million of HospitalRevenue Bonds, Series 2002 (Series 2002 Bonds) consisting of$55.6 million Series 2002A Short-term Adjustable Securities and$12.9 million Series 2002B Fixed Interest Rate Bonds. The bondproceeds are designated to finance qualified capital projects.Principal payments on the Series 2002A Bonds range from $500thousand to $3.9 million due annually commencing in April 2013through 2032. The interest rates and the interest payment datesfor the Series 2002A Bonds vary depending on if the bonds are inauction mode, daily mode, weekly mode, or in flexible modebeginning November 29, 2002. Principal payments on the Series2002B Bonds range from $1.4 million to $1.9 million due annuallycommencing in April 2006 through April 2013. Interest rates forthe Series 2002B Bonds range from 5.25 percent to 5.50 percentand interest is payable semiannually on April 1 and October 1 ofeach year beginning April 1, 2003. The effective annual interestrate of the Series 2002 A Bonds was 2.2 percent in 2004. Theeffective annual interest rate of the Series 2002B Bonds was 5.4percent in 2004.
In October 2002, the Hospital entered into an interest rate swap inorder to convert a portion of the Series 2002A Short-termAdjustable Rate Securities to fixed rates. The notional amount ofthis swap agreement was $21.4 million at June 30, 2004, whichmatures on April 1, 2022. The terms of the swap agreement arefor the Hospital to pay the counterparty a fixed rate of 3.85 percentper annum, payable semiannually, and the Hospital to receive afloating rate of 70 percent of one-month LIBOR per annum,payable monthly. As of June 30, 2004, the interest rate receivedby the Hospital was 1.1 percent. The Hospital will be exposed tovariable rates if the counterparty to the swap defaults or if theswap is terminated. The swap exposes the Hospital to basis riskshould the relationship between LIBOR and auction rate converge,changing the synthetic rate on the bonds. The Hospital does notintend to terminate this agreement. As of June 30, 2004, theHospital was not exposed to credit risk because the swap had anegative fair value. However, should interest rates change andthe fair value of the swap becomes positive, the Hospital would beexposed to credit risk in the amount of the swap’s fair value. Thefair value of the swap is $(375,361) at June 30, 2004.
Scheduled principal and interest repayments on all of theHospital’s long-term debt, including the effect of the swap, are asfollows (in thousands):
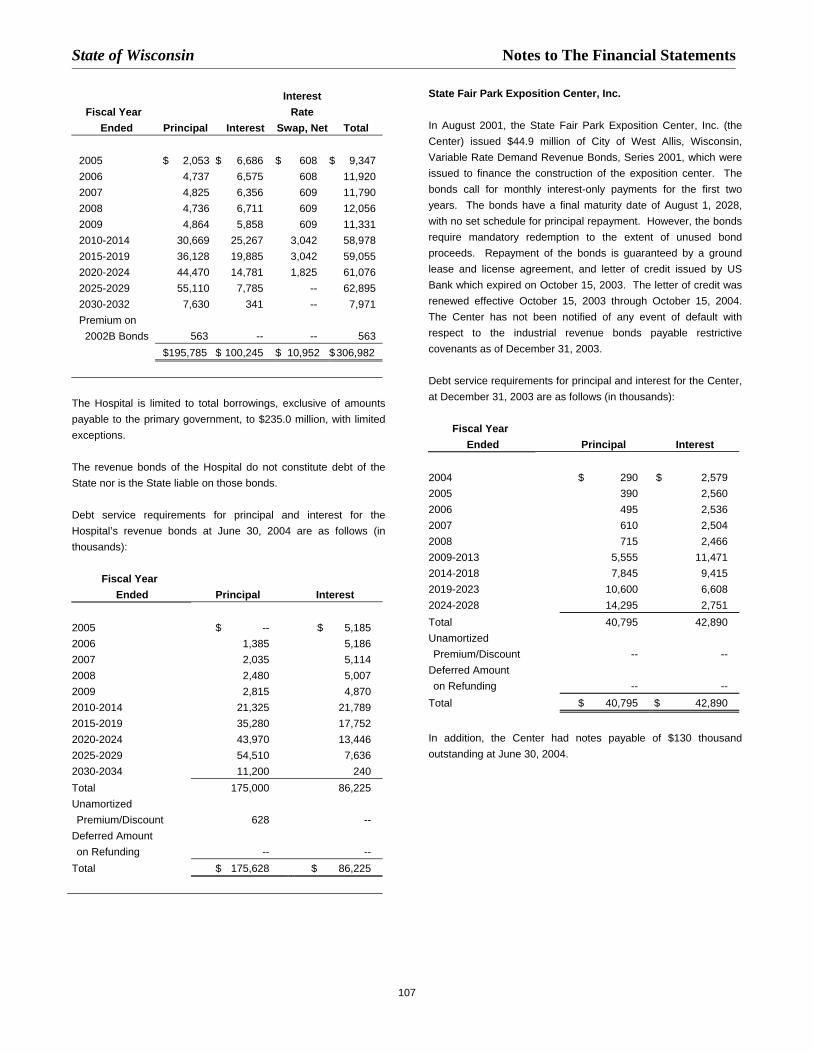
State of Wisconsin Notes to The Financial Statements
107
InterestFiscal Year Rate
Ended Principal Interest Swap, Net Total
2005 $ 2,053 $ 6,686 $ 608 $ 9,3472006 4,737 6,575 608 11,9202007 4,825 6,356 609 11,7902008 4,736 6,711 609 12,0562009 4,864 5,858 609 11,3312010-2014 30,669 25,267 3,042 58,9782015-2019 36,128 19,885 3,042 59,0552020-2024 44,470 14,781 1,825 61,0762025-2029 55,110 7,785 -- 62,8952030-2032 7,630 341 -- 7,971Premium on 2002B Bonds 563 -- -- 563
$195,785 $ 100,245 $ 10,952 $306,982
The Hospital is limited to total borrowings, exclusive of amountspayable to the primary government, to $235.0 million, with limitedexceptions.
The revenue bonds of the Hospital do not constitute debt of theState nor is the State liable on those bonds.
Debt service requirements for principal and interest for theHospital’s revenue bonds at June 30, 2004 are as follows (inthousands):
Fiscal YearEnded Principal Interest
2005 $ -- $ 5,1852006 1,385 5,1862007 2,035 5,1142008 2,480 5,0072009 2,815 4,8702010-2014 21,325 21,7892015-2019 35,280 17,7522020-2024 43,970 13,4462025-2029 54,510 7,6362030-2034 11,200 240Total 175,000 86,225UnamortizedPremium/Discount 628 --
Deferred Amounton Refunding -- --
Total $ 175,628 $ 86,225
State Fair Park Exposition Center, Inc.
In August 2001, the State Fair Park Exposition Center, Inc. (theCenter) issued $44.9 million of City of West Allis, Wisconsin,Variable Rate Demand Revenue Bonds, Series 2001, which wereissued to finance the construction of the exposition center. Thebonds call for monthly interest-only payments for the first twoyears. The bonds have a final maturity date of August 1, 2028,with no set schedule for principal repayment. However, the bondsrequire mandatory redemption to the extent of unused bondproceeds. Repayment of the bonds is guaranteed by a groundlease and license agreement, and letter of credit issued by USBank which expired on October 15, 2003. The letter of credit wasrenewed effective October 15, 2003 through October 15, 2004.The Center has not been notified of any event of default withrespect to the industrial revenue bonds payable restrictivecovenants as of December 31, 2003.
Debt service requirements for principal and interest for the Center,at December 31, 2003 are as follows (in thousands):
Fiscal YearEnded Principal Interest
2004 $ 290 $ 2,5792005 390 2,5602006 495 2,5362007 610 2,5042008 715 2,4662009-2013 5,555 11,4712014-2018 7,845 9,4152019-2023 10,600 6,6082024-2028 14,295 2,751Total 40,795 42,890UnamortizedPremium/Discount -- --
Deferred Amounton Refunding -- --
Total $ 40,795 $ 42,890
In addition, the Center had notes payable of $130 thousandoutstanding at June 30, 2004.

State of Wisconsin Notes to The Financial Statements
108
University of Wisconsin Foundation
Long-term debt consists of a note payable to U.S. Bank, N.A. Thenote was refinanced effective March 1, 2003. The note is payablein accreting monthly principal installments beginning with $10.6thousand, with a balloon payment due February 2010. The note iscollateralized by certain investments equal to the outstanding loanbalance. The outstanding balance as of December 31, 2003 was$2.8 million.
Future maturities of long-term debt as of December 31, 2003 areas follows (in thousands):
Year endedDecember 31 Total Principal
2004 $ 1372005 1442006 1522007 1602008 168
Later years 2,032$ 2,792
D. Refundings, Exchanges and EarlyExtinguishments
Refunding Provisions of GASB Statement No. 23
The State implemented the provisions of GASB Statement No. 23.Accounting and Financial Reporting for Refunding of DebtReported by Proprietary Activities beginning with Fiscal Year1996. This Statement requires proprietary activities to adoptcertain accounting and reporting changes for both currentrefunding and advance refunding resulting in defeasance of debt.GASB Statement No. 23 permits, but does not require, retroactiveapplication of its provisions. The State has chosen not to applythe provisions retroactively to previously issued financialstatements.
In February 1996, the State participated in a refunding (1996Series 1) of general obligation debt that fell within the provisions ofGASB Statement No. 23. The State is amortizing these deferredamounts over a period of approximately 19 years, using thestraight-line method.
Current Year Refundings/General Obligation Bonds
In October 2003, the State issued $67.9 million of generalobligation refunding bonds (2003 Series 3), the proceeds of whichwere used to current refund the May 1, 2004 through November 1,2006 maturities of the 1993 Series 5 bonds. The refundingresulted in an increase in total debt service payments by $50.7million with an economic loss of $9.0 million
In January 2004, the State issued $147.0 million of generalobligation refunding bonds (2004 Series 1), the proceeds of whichwere deposited in an escrow account to provide for future debtservice payments and redemption of $145.1 million of variousgeneral obligation bonds outstanding at the time of the refunding.As a result of the refunding, the bonds are considered defeasedand the associated liability removed from the financial statements.The refunding resulted in a decrease in total debt servicepayments by $5.8 million and an economic gain of $5.7 million.
In January 2004, the State issued $175.8 million of generalobligation refunding bonds (2004 Series 2), the proceeds of whichwere deposited in an escrow account to provide for future debtservice payments and redemption of $177.5 million of variousgeneral obligation bonds outstanding at the time of the refunding.As a result of the refunding, the bonds are considered defeasedand the associated liability removed from the financial statements.The refunding resulted in a decrease in total debt servicepayments by $8.3 million and an economic gain of $8.1 million.
In March 2004, the State issued $175.0 million of generalobligation refunding notes (2004 Series 1), the proceeds of whichwere used to current refund on May 1, 2004 principal of various
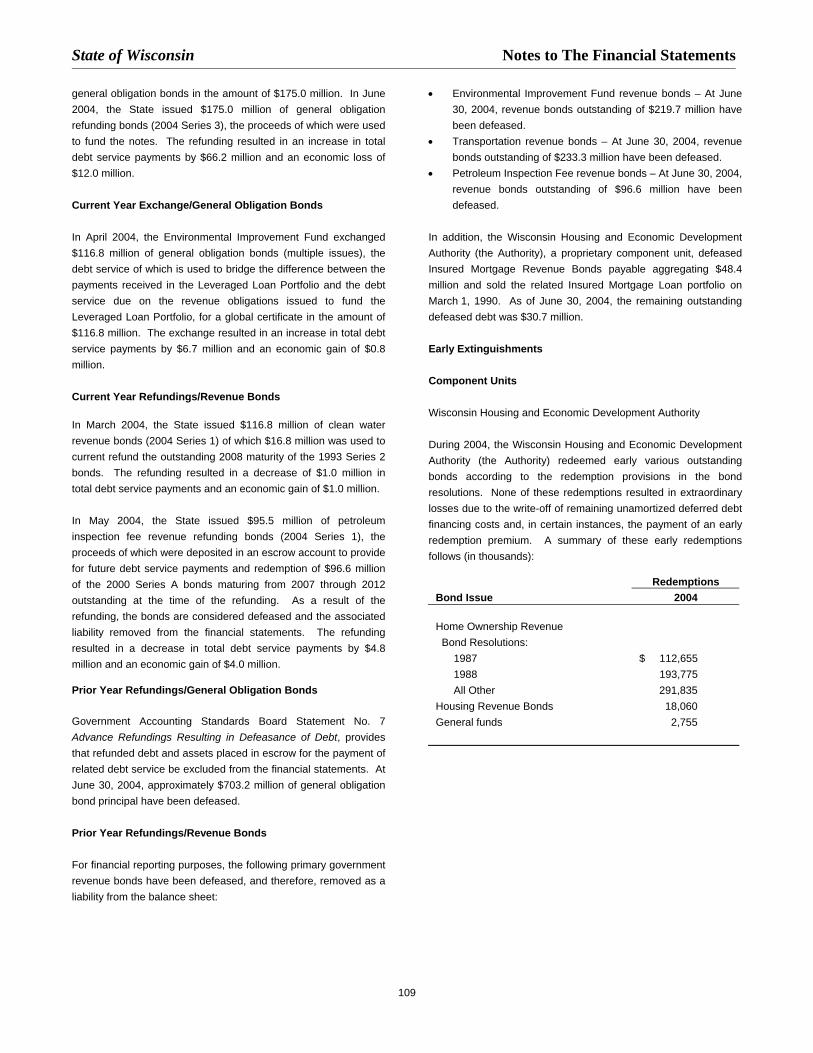
State of Wisconsin Notes to The Financial Statements
109
general obligation bonds in the amount of $175.0 million. In June2004, the State issued $175.0 million of general obligationrefunding bonds (2004 Series 3), the proceeds of which were usedto fund the notes. The refunding resulted in an increase in totaldebt service payments by $66.2 million and an economic loss of$12.0 million.
Current Year Exchange/General Obligation Bonds
In April 2004, the Environmental Improvement Fund exchanged$116.8 million of general obligation bonds (multiple issues), thedebt service of which is used to bridge the difference between thepayments received in the Leveraged Loan Portfolio and the debtservice due on the revenue obligations issued to fund theLeveraged Loan Portfolio, for a global certificate in the amount of$116.8 million. The exchange resulted in an increase in total debtservice payments by $6.7 million and an economic gain of $0.8million.
Current Year Refundings/Revenue Bonds
In March 2004, the State issued $116.8 million of clean waterrevenue bonds (2004 Series 1) of which $16.8 million was used tocurrent refund the outstanding 2008 maturity of the 1993 Series 2bonds. The refunding resulted in a decrease of $1.0 million intotal debt service payments and an economic gain of $1.0 million.
In May 2004, the State issued $95.5 million of petroleuminspection fee revenue refunding bonds (2004 Series 1), theproceeds of which were deposited in an escrow account to providefor future debt service payments and redemption of $96.6 millionof the 2000 Series A bonds maturing from 2007 through 2012outstanding at the time of the refunding. As a result of therefunding, the bonds are considered defeased and the associatedliability removed from the financial statements. The refundingresulted in a decrease in total debt service payments by $4.8million and an economic gain of $4.0 million.
Prior Year Refundings/General Obligation Bonds
Government Accounting Standards Board Statement No. 7Advance Refundings Resulting in Defeasance of Debt, providesthat refunded debt and assets placed in escrow for the payment ofrelated debt service be excluded from the financial statements. AtJune 30, 2004, approximately $703.2 million of general obligationbond principal have been defeased.
Prior Year Refundings/Revenue Bonds
For financial reporting purposes, the following primary governmentrevenue bonds have been defeased, and therefore, removed as aliability from the balance sheet:
• Environmental Improvement Fund revenue bonds – At June30, 2004, revenue bonds outstanding of $219.7 million havebeen defeased.
• Transportation revenue bonds – At June 30, 2004, revenuebonds outstanding of $233.3 million have been defeased.
• Petroleum Inspection Fee revenue bonds – At June 30, 2004,revenue bonds outstanding of $96.6 million have beendefeased.
In addition, the Wisconsin Housing and Economic DevelopmentAuthority (the Authority), a proprietary component unit, defeasedInsured Mortgage Revenue Bonds payable aggregating $48.4million and sold the related Insured Mortgage Loan portfolio onMarch 1, 1990. As of June 30, 2004, the remaining outstandingdefeased debt was $30.7 million.
Early Extinguishments
Component Units
Wisconsin Housing and Economic Development Authority
During 2004, the Wisconsin Housing and Economic DevelopmentAuthority (the Authority) redeemed early various outstandingbonds according to the redemption provisions in the bondresolutions. None of these redemptions resulted in extraordinarylosses due to the write-off of remaining unamortized deferred debtfinancing costs and, in certain instances, the payment of an earlyredemption premium. A summary of these early redemptionsfollows (in thousands):
RedemptionsBond Issue 2004
Home Ownership RevenueBond Resolutions:
1987 $ 112,6551988 193,775All Other 291,835
Housing Revenue Bonds 18,060General funds 2,755

State of Wisconsin Notes to The Financial Statements
110
E. Short-term Financing
The State of Wisconsin Building Commission, an agency of theState, is empowered by law to consider, authorize, issue, and selldebt obligations of the State. To date, the Commission hasauthorized the issuance of notes in anticipation of revenue or bondfinancing. When this short-term debt does not meet long-termfinancing criteria, it is classified among fund liabilities.
General Obligation Commercial Paper Notes
The State has authorized General Obligation Commercial PaperNotes for the acquisition, construction, development, extension,enlargement, or improvement of land, waters, property, highway,buildings, equipment or facilities. As of June 30, 2004, the Stateissued $166.7 million of general obligation commercial papernotes. Periodically, additional commercial paper notes are issuedto pay for maturing commercial paper notes.
The State intends to make annual May 1 payments on theoutstanding commercial paper notes that reflect principalamortization of the notes. The State also intends to make regularpayments to the issuing and paying agent that will be equal to theinterest due on maturing notes. At June 30, 2004, the amount ofcommercial paper notes outstanding was $68.6 million which hadinterest rates ranging from 0.92 percent to 1.11 percent andmaturities ranging from July 6, 2004 to August 16, 2004.
Short-term debt activity for the year ended June 30, 2004 for thegeneral obligation commercial paper notes was as follows (inmillions):
Balance BalanceJuly 1, 2003 Additions Reductions June 30, 2004
$ 77.1 $ -- $ 8.5 $ 68.6
General Obligation Extendible Municipal Commercial Paper
The State has authorized general obligation extendible municipalcommercial paper for the acquisition, construction, development,extension, enlargement, or improvement of land, waters, property,highway, buildings, equipment or facilities. As of June 30, 2004,the State issued $440.5 million of general obligation extendiblemunicipal commercial paper. Periodically, additional extendiblemunicipal commercial papers are issued to pay for maturingextendible municipal commercial paper. The State intends tomake annual May 1 payments on the outstanding extendiblecommercial paper that reflect principal amortization of the paper.The State also intends to make regular payments to the issuingand paying agent that will be equal to the upcoming interest dueon maturing notes. At June 30, 2004, the amount of extendiblemunicipal commercial paper outstanding was $313.9 million which
had interest rates ranging from 0.98 percent to 1.14 percent andmaturities ranging from July 6, 2004, to September 8, 2004.
Short-term debt activity for the year ended June 30, 2004 for thegeneral obligation extendible municipal commercial paper was asfollows (in millions):
Balance Balance July 1, 2003 Additions Reductions June 30, 2004
$ 239.9 $ 100.0 $ 26.0 $ 313.9
Petroleum Inspection Fee Revenue Extendible MunicipalCommercial Paper
The State has authorized petroleum inspection fee revenueextendible municipal commercial paper to pay the costs of claimsunder the Petroleum Environmental Cleanup Fund Award(PECFA) Program. As of June 30, 2004, the State issued $142.3million of petroleum inspection fee revenue extendible municipalcommercial paper. Periodically, additional extendible municipalcommercial paper is issued to pay for maturing paper. The Statemay periodically deposit money into the Junior SubordinatePrincipal Account, which represents principal payments to bemade on the extendible municipal commercial paper. The Statealso intends to make regular payments to the issuing and payingagent that will be equal to the upcoming interest due on maturingpaper. At June 30, 2004, the amount of extendible commercialpaper outstanding was $142.3 million which had interest ratesranging from 1.06 percent to 1.13 percent and maturities rangingfrom August 10, 2004 to September 8, 2004.
Short-term debt activity for the year ended June 30, 2004 for thepetroleum inspection fee revenue extendible municipalcommercial paper was as follows (in millions):
Balance Balance July 1, 2003 Additions Reductions June 30, 2004
$ 142.3 $ -- $ -- $ 142.3
Transportation Revenue Commercial Paper Notes
The State authorized transportation revenue commercial papernotes to pay the costs of major highway projects and certain Statetransportation facilities. As of June 30, 2004, the State issued$157.8 million of transportation revenue commercial paper notes.Periodically, additional commercial paper notes are issued to payfor maturing commercial paper notes. The State intends to makeannual July 1 payments on the commercial paper notes that reflectprincipal amortization of the notes. The State also intends tomake regular payments to the issuing and paying agent that will
State of Wisconsin Notes to The Financial Statements
111
be equal to the upcoming interest due on maturing notes. At June30, 2004, the amount of commercial paper notes outstanding was$125.8 million which had interest rates ranging from 1.05 percentto 1.20 percent and maturities ranging from July 6, 2004 toJanuary 12, 2005.
Short-term debt activity for the year ended June 30, 2004 for thetransportation revenue commercial paper notes was as follows (inmillions):
Balance Balance July 1, 2003 Additions Reductions June 30, 2004
$ 131.4 $ -- $ 5.6 $ 125.8
F. Certificates of Participation
The State established a facility in 1992 that provides leasepurchase financing for property and certain service items acquiredby State agencies. This facility is the Third Amended andRestated Master Lease 1992-1. Pursuant to the terms andconditions of this agreement, the trustee for the facility issuesparity Master Lease certificates of participation that evidenceproportionate interest of the owners thereof in lease payments. Acommon pool of collateral ratably secures all Master Leasecertificates. Title in the property and service items purchasedunder the facility remains with the State and the State grants to theTrustee, for the benefit of all Master Lease certificate holders, afirst security interest in the leased items. At June 30, 2004, thefollowing parity Master Lease certificates were outstanding:
• Master Lease Certificates of Participation of 1999, Series A,in the amount of $0.6 million. This series of Master Leasecertificates have interest rates ranging from 3.8 percent to 3.9percent and mature semi-annually through March 1, 2005.
• Master Lease Certificates of Participation of 1999, Series B(Taxable), in the amount of $3.5 million. This series ofMaster Lease certificates have interest rates of 5.6 percentand mature semi-annually through September 1, 2005.
• Master Lease Certificates of Participation of 2000, Series A,in the amount of $7.4 million. This series of Master Leasecertificates have interest rates ranging from 4.5 percent to4.75 percent and mature semi-annually through September1, 2007.
• Master Lease Certificates of Participation of 2000, Series B(Taxable), in the amount of $3.8 million. This series ofMaster Lease certificates have interest rates ranging from 6.9percent to 7.0 percent and mature semi-annually throughSeptember 1, 2005.
• Master Lease Certificates of Participation of 2002, Series A,in the amount of $26.2 million. This series of Master Leasecertificates have interest rates ranging from 3.00 percent to3.75 percent and mature semi-annually through September1, 2007.
• Master Lease Certificates of Participation of 2002, Series Cand Master Lease Certificates of Participation of 2003, SeriesB (Revolving Credit Agreement – Tax Exempt) in the amountof $14.3 million. These Master Lease certificates evidencethe State’s obligation to repay tax-exempt revolving loansunder a Revolving Credit Agreement, dated July 1, 2002, asamended, between U.S. Bank National Association (Trustee)and the Bank of America Leasing & Capital LLC. TheseMaster Lease certificates shall bear interest at the ratesprovided for in the Revolving Credit Agreement and bothmature on March 1, 2013. The balance of these certificatesof participation may include some accrued interest that will bepayable at the next semi-annual interest payment date.
• Master Lease Certificates of Participation of 2002, Series D,in the amount of $23.1 million. This series of Master LeaseCertificates have interest rates ranging from 2.0 percent to5.0 percent and mature semi-annually through September 1,2007.
• Master Lease Certificates of Participation of 2003, Series A(Revolving Credit Agreement – Taxable). This Master Leasecertificate evidences the State's obligation to repay revolvingloans under a Revolving Credit Agreement, dated July 1,2002, as amended, between U.S. Bank National Association(Trustee) and the Bank of America Leasing & Capital LLC.The Commitment date under the Revolving Credit Agreementis June 30, 2005. This Master Lease certificate shall bearinterest at the rates provided for in the Revolving CreditAgreement and matures on March 1, 2022. The balance ofthis certificate of participation may include some accruedinterest that will be payable at the next semi-annual interestpayment date.
The Third Amended and Restated Master Lease 1992-1 providesthat certain lease schedules to the facility can be terminated if theState deposits with the Trustee an amount that is equal to theoutstanding amount of the lease schedule, or in amounts that aresufficient to purchase investments that mature on dates and inamounts to make the lease payments when due. At June 30,2004, the State has deposited with the Trustee amounts, thatwhen invested, will terminate lease schedules having anaggregate outstanding amount of $8.4 million. As a result ofterminating these lease schedules, the associated liability isremoved from the financial statements.

State of Wisconsin Notes to The Financial Statements
112
G. Arbitrage Rebate
The Tax Reform Act of 1986 requires that governmental entitiesissuing tax-exempt debt subsequent to August 1986, calculate andrebate arbitrage earnings to the federal government. Specifically,the excess of the aggregated amount earned on investmentspurchased with bond proceeds over the amount that would havebeen earned if the proceeds were invested at a rate equal to thebond yield, is to be rebated to the federal government. As of June30, 2004, no material arbitrage rebate liabilities existed.
H. Moral Obligation Debt
Through legislation enacted in 1994, the State authorized thecreation of local exposition districts. These districts (WisconsinCenter District, Southeast Wisconsin Professional Baseball ParkDistrict, and the Green Bay/Brown County Professional FootballStadium District) are authorized to issue bonds for costs related toan exposition center, and if the State determines that certainconditions are satisfied, the State may have a moral obligation toappropriate moneys to make up deficiencies in the districts'reserve funds that secure up to $200 million principal amount ofbonds. To date, the Wisconsin Center District has issued $125.8million of bonds that are subject to the moral obligation. The twoother local exposition districts each have authority to issue $160.0million of revenue obligations that, subject to the Secretary ofAdministration’s determination that certain conditions have beenmet, could carry a moral obligation of the State. Each of thesedistricts have issued revenue obligations that do not carry themoral obligation of the State.
Through legislation enacted in 1999, the State authorized theissuance of up to $170.0 million principal amount of bonds tofinance the development or redevelopment of sites and facilities tobe used for public schools. If certain conditions are satisfied, andif a special debt service reserve fund is created for the bonds, theState will provide a moral obligation pledge, which would restorethe special debt reserve fund established for the bonds to anamount not to exceed the maximum annual debt service on thebonds. Two bond issues of $112.0 million have been issued thathave a special debt service reserve fund secured by the State’smoral obligation.
I. Credit Agreements
Primary Government
The State has, as part of the working bank contract, a letter ofcredit agreement with the US Bank National Association underwhich the Bank has agreed to provide to the State an open line ofcredit in the amount of $50.0 million. The agreement provides foradvances in anticipation of bond issuance proceeds. As of June30, 2004, $50.0 million was unused and available.
The State has previously entered into a credit agreement toprovide a line of credit for liquidity support for up to $80.0 million ofgeneral obligation commercial paper notes. The line of creditexpires in March, 2005, but is subject to annual renewal asprovided for in the credit agreement. The cost of this line of creditis 0.125 percent per year.
Also, the State has entered into a credit agreement with two banksto provide a line of credit for liquidity support for its transportationrevenue commercial paper program. The amount of the line ofcredit is $135.0 million. This line of credit expires in May, 2005,but is subject to renewal as provided for in the credit agreement.The cost of this line of credit is 0.170 percent per year.

State of Wisconsin Notes to The Financial Statements
113
NOTE 12. LEASE COMMITMENTS ANDINSTALLMENT PURCHASES
The State leases office buildings, space, and equipment under avariety of agreements that vary in lease term, many of which aresubject to appropriation from the State Legislature to continue thelease commitment. If such funding, i.e., through legislativeappropriation, is judged to be assured, and the likelihood ofcancellation through exercise of the fiscal funding clause isremote, leases are considered noncancelable and reported aseither a capital lease or an operating lease.
A. Capital Leases
Primary Government
Capital lease commitments in the government-wide andproprietary funds statements are reported as liabilities at leaseinception. The related assets along with the depreciation are alsoreported at that time. Lease payments are reported as areduction of the liability.
For capital leases in governmental funds, “Other FinancingSources - Capital Lease Acquisitions" and expenditures arerecorded at lease inception. Lease payments are recorded asexpenditures.
The following is an analysis of the gross minimum leasepayments along with the present value of the minimum leasepayments as of June 30, 2004 for capital leases (in thousands):
Governmental Business-typeFiscal Year Activities Activities
2005 $ 6,440 $ 7,1222006 5,512 6,4542007 4,160 5,7442008 4,696 25,9312009 1,279 1,8872010 – 2014 1,242 8,8902015 – 2019 142 2,051Total minimum
future payments 23,470 58,079Less: Executory costs (3) --Less: Interest (3,141) (9,502)Present value of
net minimumlease payments $ 20,326 $ 48,577
Assets acquired through capital leases are valued at the lower offair market value or the present value of minimum lease paymentsat the inception of the lease. The following is an analysis ofcapital assets recorded under capital leases as of June 30, 2004(in thousands):
Governmental Business-typeActivities Activities
Land and LandImprovements $ 376 $ 209
Buildings andImprovements 963 59,378
Machinery and Equipment 56,275 10,327
Less: AccumulatedDepreciation (13,428) (11,732)
Carrying Amount $ 44,186 $ 58,182
Master Lease Program
The State established a facility in 1992 that provides leasepurchase financing for property and certain service items acquiredby state agencies. This facility is the Third Amended andRestated Master Lease between the State acting by and throughthe Department of Administration and U.S. Bank NationalAssociation. Lease purchase obligations under the Master Leaseare not general obligations of the State, but are payable fromappropriations of State agencies participating in the Master LeaseProgram, subject to annual appropriation. The interestcomponent of each lease/purchase payment is subject to aseparate determination. Pursuant to terms of the Master Lease,the Trustee for the facility issues parity Master Lease Certificatesof Participation that evidence proportionate interest of the ownersthereof in lease payments. The outstanding balance as of June30, 2004 was as follows:
Average LifeBalance Due (Weighted Term)
$85,014,923 3.5793 Years

State of Wisconsin Notes to The Financial Statements
114
Component Unit
Under the terms of a lease agreement, the University ofWisconsin Hospitals and Clinics Authority (the Hospital) leasesfacilities which were occupied by the Hospital as of June, 1996(see Note 1B to the financial statements). The initial term of thelease is 30 years to be renewed annually with automaticextensions of one additional year on each July 1 until action istaken to stop the extensions. Included in the consideration for thelease is an amount equal to the debt service during the term ofthe lease agreement on all outstanding bonds issued by the Statefor the purpose of financing the acquisition, construction orimprovement of the leased facilities. Interest rates on the relatedbonds range from 4.0 percent to 6.26 percent, with final maturitiesdue beginning in April 2000 through April 2022. Scheduledprincipal and interest payments through April 2022 are $20.2million.
B. Operating Leases
Operating leases, those leases not recorded as capital leases asrequired by FASB Statement No. 13, are not recorded in thestatement of net assets. These leases contain various renewaloptions, the effect of which are reflected in the minimum leasepayments only if it is considered that the option will be exercised.Certain other operating leases contain escalation clauses andcontingent rentals which are not included in the calculation of thefuture minimum lease payments. The State has adopted theoperating lease scheduled rent increase provisions of FASBStatement No. 13. Operating lease expenditures/expenses arerecognized as incurred or paid over the lease term.
Governmental and business-type activities and fiduciary fundsrental expenses under operating leases for Fiscal Year 2004 were$66.2 million. Of this amount, $65.4 million relates to minimumrental payments stipulated in lease agreements, $303 thousandrelates to contingent rentals, and $510 thousand relates tosublease rental payments.
The following is an analysis of the future minimum rentalpayments due under operating leases (in thousands):
Business-Fiscal Governmental type FiduciaryYear Activities Activities Funds Units
2005 $ 39,622 $ 11,757 $ 97 $ 6,5182006 31,454 8,042 63 6,2412007 24,966 4,748 31 5,6352008 22,243 3,827 25 4,4762009 15,349 2,901 1 3,2382010 – 2014 29,960 10,582 -- 7,6782015 – 2019 4,848 578 -- --2020 – 2024 673 269 -- --2025 – 2029 632 61 -- --2030 – 2034 473 45 -- --Thereafter 412 -- -- --Minimum lease
payments $ 170,633 $ 42,811 $ 217 $ 33,787
C. Installment Purchases
The State has entered into installment purchase agreements.The following is an analysis of the gross minimum installmentpayments, along with the present value of the minimuminstallment payments, as of June 30, 2004 for installmentpurchases (in thousands):
GovernmentalFiscal Year Activities
2005 $ 1,5562006 9112007 4022008 39Total minimum future payments 2,907Less: Interest (138)Present value of net minimum
installment payments $ 2,770
State of Wisconsin Notes to The Financial Statements
115
NOTE 13. RETIREMENT PLAN
The Wisconsin Retirement System (WRS) was established and isadministered by the State of Wisconsin to provide pensionbenefits for State and local government public employees. TheWRS consists of the fixed retirement investment trust, the variableretirement investment trust, and the police and firefighters trust.Although separated for accounting purposes, the assets of thesetrust funds can be used to pay benefits for any member of theWRS, and are reported as one pension plan.
The WRS is considered part of the State of Wisconsin’s financialreporting entity. Copies of the separately issued financial reportthat includes financial statements and required supplementaryinformation for the year ending December 31, 2002, may beobtained by writing to:
Department of Employee Trust Funds801 West Badger RoadP.O. Box 7931Madison, WI 53707-7931.
The separately issued financial reports for the year endedDecember 31, 2003 will be available in early Calendar Year2005.
Plan Description
The WRS, governed by Chapter 40 of the Wisconsin Statutes, isa cost-sharing multiple-employer defined benefit pension plan. Itprovides coverage to all eligible State of Wisconsin, localgovernment and other public employees. Any employee of aparticipating employer who is expected to work at least 600 hoursper year for at least one year must be covered by the WRS. As ofDecember 31, 2003, the number of participating employers was:
State Agencies 61Cities 153Counties 714th Class Cities 34Villages 227Towns 203School Districts 426Wisconsin Technical College System Board Districts 16Cooperative Educational Service Agencies 12Other 177 Total Employers 1,380
For employees beginning participation on or after January 1, 1990and no longer actively employed on or after April 24, 1998,creditable service in each of five years is required for eligibility fora retirement annuity. Participants employed prior to 1990 and onor after April 24, 1998 are immediately vested. Employees who
retire at or after age 65 (55 for protective occupation employees,62 for elected officials and State executive participants) areentitled to receive an unreduced retirement benefit. The factorsinfluencing the benefit are: (1) final average earnings, (2) years ofcreditable service, and (3) a formula factor.
Final average earnings is the average of the participant's threehighest years' earnings. Creditable service is the creditablecurrent and prior service expressed in years or decimalequivalents of partial years for which a participant receivesearnings and makes contributions as required. The formula factoris a standard percentage based on employment category.
Employees may retire at age 55 (50 for protective occupationemployees) and receive reduced benefits. Employees terminatingcovered employment before becoming eligible for a retirementbenefit may withdraw their contributions and forfeit all rights to anysubsequent benefits. The WRS also provides death and disabilitybenefits for employees.
Accounting Policies and Plan Asset Matters
The financial statements of the WRS have been prepared inaccordance with generally accepted accounting principles, usingthe flow of economic resources measurement focus and a fullaccrual basis of accounting. Under the accrual basis ofaccounting, revenues are recorded when earned and expensesare recorded at the time the liabilities are incurred. Plan membercontributions are recognized in the period in which contributionsare due. Employer contributions to the plan are recognized whendue and the employer has made a formal commitment to providecontributions. Benefits and refunds are recognized when due andpayable in accordance with the terms of the plan.
All assets of the WRS are invested by the State of WisconsinInvestment Board. The retirement fund assets consist of sharesin the variable retirement investment trust and the fixed retirementinvestment trust. The variable retirement investment trustconsists primarily of equity securities. The fixed retirementinvestment trust is a balanced investment fund made up of fixedincome securities and equity securities. Shares in the fixedretirement investment trust are purchased as funds are madeavailable from retirement contributions and investment income,and sold when funds for benefit payments and other expenses areneeded.
The assets of the fixed and variable retirement investment trustsare carried at fair value with all market value adjustmentsrecognized in current operations. Investments are revaluedmonthly to current market value. The resulting valuation gains orlosses are recognized as income, although revenue has not beenrealized through a market-place transaction.
State of Wisconsin Notes to The Financial Statements
116
The WRS does not have any investments (other than thoseissued or guaranteed by the U.S. Government) in any oneorganization that represent 5.0 percent or more of plan netassets.
State Contributions Required and Contributions Made
Covered State employees in the General/Teacher category arerequired by statute to contribute 5.0 percent of their salary (2.6percent for Executives and Elected Officials, 4.5 percent forProtective Occupations with Social Security, and 3.2 percent forProtective Occupations without Social Security) to the plan as ofJune 30, 2004. Employers may make these contributions to theplan on behalf of employees.
Employers are required to contribute an actuarially determinedamount necessary to fund the remaining projected cost of futurebenefits; however, State legislation in 1999 prescribed a $200million contribution holiday for employers for the first time in theplan's history. State contributions made for the years endedDecember 31, 2003, 2002 and 2001 were as follows (in millions):
2003 2002 2001
Employer current service $ 140.4 $ 127.2 $ 122.9Percent of payroll 4.5% 4.3% 4.2%
Employer prior service $ 706.8 $ 38.3 $ 15.5Percent of payroll 22.4% 1.3% 0.5%
Employee required $ 154.1 $ 145.7 $ 140.9Percent of payroll 4.9% 4.9% 4.9%
Benefit adjustment contrib. $ 11.1 $ 5.3 $ 5.1Percent of payroll 0.4% 0.2% 0.2%
Percent of Required Contributions 100% 100% 100%
The WRS uses the “Entry Age Normal with Frozen Initial Liability”actuarial method in establishing employer contribution rates.Under this method, the unfunded actuarial accrued liability(UAAL) is generally affected only by the monthly amortizationpayments, compound interest, the added liability created by newemployer units, and any liabilities caused by changes in benefitprovisions. The UAAL is being amortized over a 40 year periodbeginning January 1, 1990. However, periodically, the EmployeeTrust Funds Board has reviewed and, when appropriate, adjustedthe actuarial assumptions used to determine this liability.Changes in the assumptions may affect the UAAL, and theresulting actuarial gains or losses are credited or charged toemployers’ unfunded liability accounts.
All actuarial gains or losses arising from the difference betweenactual and assumed experience are reflected in the determinationof the normal cost.
As of June 30, 2004 and 2003, the WRS’s unfunded actuarialaccrued liability was $0.5 billion and $1.7 billion, respectively.These amounts are presented as Prior Service ContributionsReceivable on the financial statements. New prior serviceliabilities resulting from employers entering the WRS or increasingtheir prior service coverage are recognized as contributions in theyear service is granted and are added to the Prior ServiceContributions Receivable. Employer contributions for priorservice reduce the receivable. The receivable is increased as ofcalendar year end with interest at the assumed interest rate of 7.8percent.
NOTE 14. MILWAUKEE RETIREMENT SYSTEM
The Milwaukee Retirement System (MRS), with participation bythe City of Milwaukee Retirement System and the MilwaukeePublic Schools Retirement System, is reported as an InvestmentTrust Fund. MRS participants provide assets to the State ofWisconsin, Department of Employee Trust Funds (DETF) forinvesting in its Fixed Retirement Investment Trust (FRIT) and theVariable Retirement Investment Trust (VRIT), funds of theWisconsin Retirement System (WRS). Participation of the MRSin the FRIT and VRIT is described in the DETF AdministrativeCode, Chapter 10.12. The State of Wisconsin Investment Board(SWIB) manages the FRIT and VRIT with oversight by a Board ofTrustees as authorized in Wis. Stat. 25.14 and 25.17. SWIB isnot registered with the Securities and Exchange Commission asan investment company.
The investments of the FRIT and VRIT consist of a highlydiversified portfolio of securities. Wis. Stat. 25.17(3)(a) allowinvestments in loans, securities and any other investments asauthorized by Wis. Stat. 620.22. Permitted classes ofinvestments include bonds of governmental units or of privatecorporations, loans secured by mortgages, preferred or commonstock, real property and other investments not specificallyprohibited by statute.
Investments are revalued monthly to fair value, with unrealizedgains and losses reflected in income.
Monthly, the DETF distributes a pro-rata share of the total FRITand VRIT earnings less administrative expenses to the MRSaccounts. The MRS accounts are adjusted to fair value andgains/losses are recorded directly in the accounts per DETFAdministrative Code, Chapter 10.12(2).

State of Wisconsin Notes to The Financial Statements
117
Neither State statute, a legal provision nor a legally bindingguarantee exists to support the value of shares.
At June 30, 2004, the FRIT and VRIT held $68,877.7 million ofinvestments of which includes $5,053.0 million of securitieslending collateral and $388.3 million of pooled cash and cash
equivalents. The following tables present investments of the FRITand VRIT at June 30, 2004, categorized in accordance with thelevel of risk requirements of GASB Statement No. 3 (in millions):
Fixed Retirement Investment Trust:Category Fair
1 2 3 Value
Fixed Income $ 8,365.3 $ -- $ -- $ 8,365.3Stocks 11,719.5 -- -- 11,719.5Repurchase Agreements 1,281.4 -- -- 1,281.4Certificates of Deposit 426.5 -- -- 426.5
Total $ 21,792.7 $ -- $ -- 21,792.7
Limited Partnerships 2,530.0Pooled Multi-Asset Fund 336.8Pooled Equities 24,591.4Pooled Bonds 6,699.0Mortgages 593.1Real Estate Owned 417.1Custodial Pooled Cash and Equivalents 370.3Investments Held by Broker Dealers under Securities Loans: Fixed Income 3,765.0 Equities 1,022.4Securities Lending Cash Collateral Pooled Investments 800.4
$ 62,918.2
Variable Retirement Investment Trust:Category Fair
1 2 3 Value
Fixed Income $ 92.2 $ -- $ -- $ 92.2Stocks 2,228.8 -- -- 2,228.8Repurchase Agreements 53.6 -- -- 53.6Certificates of Deposit 14.4 -- -- 14.4
Total $ 2,389.0 $ -- $ -- 2,389.0
Pooled Equities 3,320.1Pooled Cash and Equivalents 18.0Investments Held by Broker Dealers under Securities Loans: Equities 198.9Securities Lending Cash Collateral Pooled Investments 33.5
$ 5,959.5
State of Wisconsin Notes to The Financial Statements
118
The following schedule provides summary information by investment classification for the FRIT at June 30, 2004 (in thousands):
Interest/Coupon MaturityClassification Rates Dates Cost Fair Value
Fixed Income Variable and 0.3 to 28.7 7/04 to 11/49 $ 15,665,998 $ 16,500,477Common and Preferred Stock N/A N/A 31,115,940 37,333,313Limited Partnerships N/A N/A 2,741,924 2,529,989Mortgages 6.77 to 12.25 8/04 to 6/22 539,949 593,064Real Estate Owned N/A N/A 318,807 417,080Multi-Asset N/A N/A 250,000 336,814 Total Investments $ 50,632,619 $ 57,710,738
The following schedule provides summary information by investment classification for the VRIT at June 30, 2004 (in thousands):
Interest/Coupon MaturityClassification Rates Dates Cost Fair Value
Common and Preferred Stock N/A N/A $ 4,926,422 $ 5,747,730 Total Investments $ 4,926,422 $ 5,747,730
Significant financial data for the FRIT and VRIT for the year ended June 30, 2004 is presented below (in thousands):
Fixed Retirement Investment TrustCondensed Statement of Net Assets
As of June 30, 2004
Assets: Cash and Cash Equivalents $ 1,643,140
Securities Lending Collateral 4,850,013Investment Receivables 439,800Investments, at Fair Value 57,710,738Other Assets 2,442
Total Assets 64,646,133
Liabilities:Securities Lending Collateral Liability 4,850,013Investment Payables 655,479
Total Liabilities 5,505,492
Net Assets Held in Trust of:Internal Investment Pool Participants 59,084,812Milwaukee Retirement System 55,830
$ 59,140,642
Fixed Retirement Investment TrustCondensed Statement of Changes in Net Assets
For the Year Ended June 30, 2004
Additions:Net Increase (Decrease ) in
Fair Value of Investments $ 7,396,289Interest 547,506Dividends 263,790Securities Lending Income 44,422Other 97,995
Total Additions 8,350,002
Deductions:Investment Expense 139,135Securities Lending Rebates and Fees 36,256Net Withdrawals by Pool Participants (694,261)
Total Deductions (518,870)
Net Increase (Decrease) 8,868,872
Net Assets Held in Trust for Pool ParticipantsBeginning of Year 50,271,770End of Year $ 59,140,642
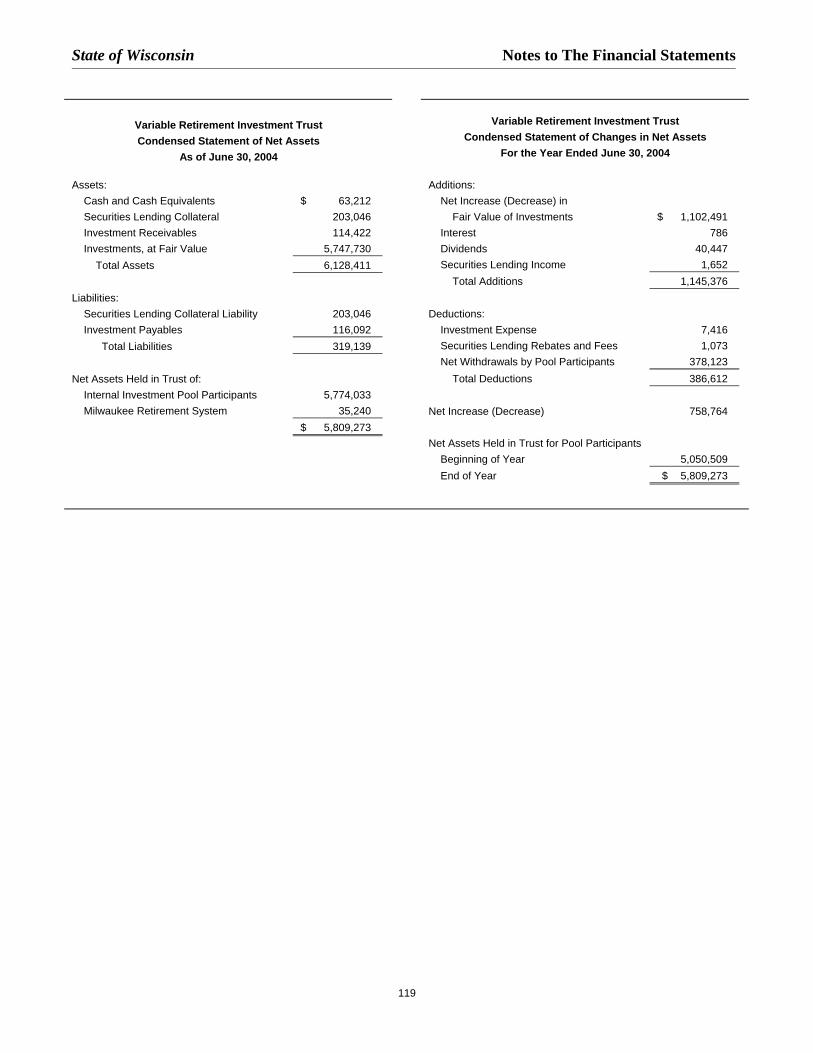
State of Wisconsin Notes to The Financial Statements
119
Variable Retirement Investment TrustCondensed Statement of Net Assets
As of June 30, 2004
Assets: Cash and Cash Equivalents $ 63,212
Securities Lending Collateral 203,046Investment Receivables 114,422Investments, at Fair Value 5,747,730
Total Assets 6,128,411
Liabilities:Securities Lending Collateral Liability 203,046Investment Payables 116,092
Total Liabilities 319,139
Net Assets Held in Trust of:Internal Investment Pool Participants 5,774,033Milwaukee Retirement System 35,240
$ 5,809,273
Variable Retirement Investment TrustCondensed Statement of Changes in Net Assets
For the Year Ended June 30, 2004
Additions:Net Increase (Decrease) in
Fair Value of Investments $ 1,102,491Interest 786Dividends 40,447Securities Lending Income 1,652
Total Additions 1,145,376
Deductions:Investment Expense 7,416Securities Lending Rebates and Fees 1,073Net Withdrawals by Pool Participants 378,123
Total Deductions 386,612
Net Increase (Decrease) 758,764
Net Assets Held in Trust for Pool ParticipantsBeginning of Year 5,050,509End of Year $ 5,809,273

State of Wisconsin Notes to The Financial Statements
120
NOTE 15. OTHER EMPLOYMENT BENEFITS
In addition to providing pension benefits, the State participates inthe Department of Employee Trust Funds administered postretirement life insurance and health insurance benefit programs.The State provides life and health insurance benefits for retiredemployees in accordance with Chapter 40 of the WisconsinStatutes.
Post retirement life insurance is provided to employees retiringbefore age 65 if they (1) have 20 years of creditable service, and(2) are eligible for a retirement annuity. This coverage is at theemployee's expense (employee must pay the full premium) untilage 65 when reduced coverage is provided at no cost. Employeesretiring at or after age 65 are immediately eligible for reducedcoverage at no cost. Beginning in the month in which an insuredannuitant reaches age 65, premiums are no longer collected andcoverage is continued for life. Approximately 13,112 Stateannuitants currently qualify for coverage without premium. Postretirement life insurance is fully insured by an independentinsurance carrier. Premiums are prefunded with employer paidpremiums during the employee's active career. The amount ofpremiums is determined by the insurer. The accrued liability andassets specifically related to post employment benefits could notbe determined.
In accordance with Chapter 40, Wisconsin Statutes, the State alsoprovides that employees retiring and beginning an immediateannuity are eligible for conversion of unused sick leave to postretirement health insurance. At the time of eligibility for animmediate annuity or employee's death, that employee'saccumulated unused sick leave balance may be converted at theemployee's current rate of pay to credits for the payment of healthinsurance premiums for the employee or the employee's survivingdependents. The program also provides partial matching of sickleave accumulation depending on years of service andemployment category. Health insurance premiums are paid on theemployee, or employee's dependents behalf, until the sick leaveconversion credits are exhausted. At that time, the employee hasthe option to continue coverage by paying the total cost of thepremiums. Approximately 9,044 annuitants are currently receivinghealth insurance coverage through sick leave conversion credits.Accumulated sick leave conversion is prefunded based on anactuarially determined percentage of payroll. The actuarialvaluation is based on the frozen initial liability cost method.
Significant actuarial assumptions include an 7.8 percent assumedinterest rate, 4.1 percent assumed annual salary growth, and anaverage sick leave accumulation of 6.4 days per year for non-University employees and 7.4 days per year for Universityemployees. The assets and reserves of the sick leave conversionprogram are accounted for in a fiduciary fund. The accruedliability for the post retirement health insurance benefits atDecember 31, 2003, determined through an actuarial valuation
performed on that date, was $1,625.0 million. The program'sassets on that date were $1,605.0 million. The unfunded liabilitywas $20.0 million.
Assets of the life insurance and health insurance benefit programsare valued at fair value.
The State's postemployment life insurance required and actualcontributions totaled $4.6 million during the calendar year endedDecember 31, 2003.
For that same time period, the State paid required and excesscontributions totaling $813.1 million to fund health insurance andto pay the State’s unfunded actuarially accrued liability for healthbenefits to be paid in the future.
State of Wisconsin Notes to The Financial Statements
121
NOTE 16. PUBLIC ENTITY RISK POOLS ADMINISTERED BY THEDEPARTMENT OF EMPLOYEETRUST FUNDS
The Department of Employee Trust Funds operates four publicentity risk pools: group health insurance, group incomecontinuation insurance, protective occupation duty disabilityinsurance and long-term disability insurance. The informationprovided in this note applies to the period ending December 31,2003.
A. Description of Funds
The Health Insurance Fund offers group health insurance forcurrent and retired employees of the State government and ofparticipating local public employers. All public employers in theState are eligible to participate. Approximately 305 localemployers plus the State currently participate. The State and localgovernment portions of the fund are accounted for separately andhave separate contribution rates, benefits, and actuarialvaluations. The fund includes both a self-insured, fee-for-serviceplan as well as various prepaid plans, primarily HealthMaintenance Organizations (HMO's). Also, starting January 1,2004, a self-insured plan began that provides for pharmacybenefits of covered members.
The Income Continuation Insurance Fund offers disability wagecontinuation insurance for current employees of the Stategovernment and of participating local public employers. All publicemployers in the State are eligible to participate. Approximately147 local employers plus the State currently participate. The Stateand local government portions of the fund are accounted forseparately and have separate contribution rates, benefits, andactuarial valuations. The plan is self-insured.
The Duty Disability Fund offers special disability insurance forState and local Wisconsin Retirement System participants inprotective occupations. Participation in the program is mandatoryfor all Wisconsin Retirement System employers with protectiveoccupation employees. Approximately 476 local employers plusthe State currently participate. The plan is self-insured and risk isshared between the State and local portions of the plan.
The Long-term Disability Insurance Fund offers long-term disabilitybenefits to participants in the Wisconsin Retirement System(WRS). The long-term disability benefits provided by this programare an alternative coverage to that currently provided by the WRS.All new WRS participants on or after October 15, 1992, are eligibleonly for the long-term disability insurance coverage, whileparticipating employees active prior to October 15, 1992, mayelect coverage through WRS or the long-term disability insuranceprogram.
B. Accounting Policies for Risk Pools
Basis of Accounting - All Public Entity Risk Pools are accountedfor in enterprise funds using the full accrual basis of accountingand the flow of economic resources measurement focus.
Valuation of Investments - Assets of the Health Insurance Fundare invested in the State Investment Fund. Assets of the IncomeContinuation Insurance, Duty Disability and Long-term DisabilityInsurance funds are invested in the fixed retirement investmenttrust. Investments are valued at fair value.
Unpaid Claims Liabilities - Claims liabilities are based onestimates of the ultimate cost of claims that have been reportedbut not settled, and of claims that have been incurred but notreported. The estimate includes the effects of inflation and othersocietal and economic factors. Adjustments to claims liabilitiesare charged or credited to expense in the periods in which theyare made. Unpaid claims liability is presented at face value and isnot discounted for health insurance. It is discounted using aninterest rate of 8 percent for income continuation, long-termdisability, and duty disability insurance. The liabilities for incomecontinuation, long-term disability, health insurance and dutydisability insurance were determined by actuarial methods. TheDuty Disability Fund’s accounting deficit is being amortized over atwenty-three year period beginning January 1, 2000. Face valuesare not available.
Administrative Expenses - All maintenance expenses areexpensed in the period in which they are incurred. Acquisitioncosts are immaterial and are treated as maintenance expenses.Premium deficiencies are not calculated because acquisition costsare immaterial. Claim adjustment expenses are also immaterial.
Reinsurance - Health insurance plans provided by HMO's andhealth insurance for local government annuitants are fully insuredby outside insurers. All remaining risk is self-insured with noreinsurance coverage.
Risk Transfer - Participating employers are not subject tosupplemental assessments in the event of deficiencies. If theassets of the fund were exhausted, participating employers wouldnot be responsible for the fund's liabilities.
Premium Setting - Premiums are established by the GroupInsurance Board (Health, Income Continuation Insurance andLong-term Disability Insurance) and the Employee Trust FundsBoard (Duty Disability) in consultation with actuaries.
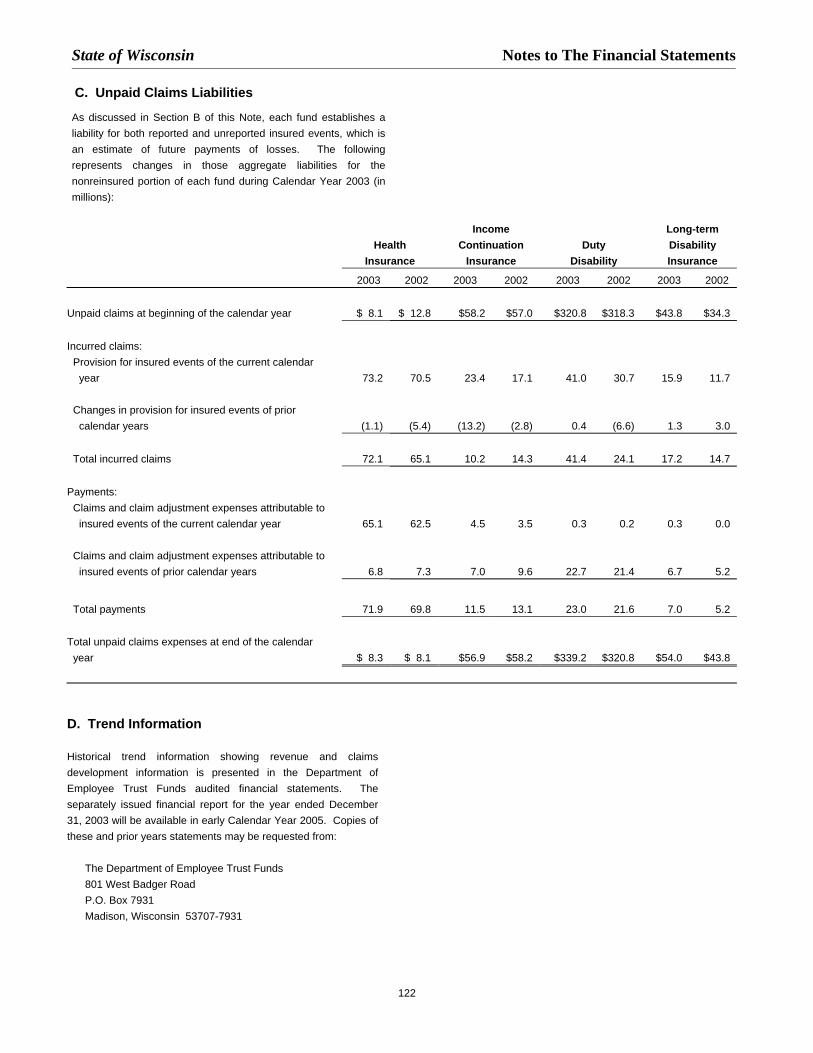
State of Wisconsin Notes to The Financial Statements
122
C. Unpaid Claims Liabilities
As discussed in Section B of this Note, each fund establishes aliability for both reported and unreported insured events, which isan estimate of future payments of losses. The followingrepresents changes in those aggregate liabilities for thenonreinsured portion of each fund during Calendar Year 2003 (inmillions):
Income Long-term
Health Continuation Duty DisabilityInsurance Insurance Disability Insurance
2003 2002 2003 2002 2003 2002 2003 2002
Unpaid claims at beginning of the calendar year $ 8.1 $ 12.8 $58.2 $57.0 $320.8 $318.3 $43.8 $34.3
Incurred claims:Provision for insured events of the current calendar
year 73.2 70.5 23.4 17.1 41.0 30.7 15.9 11.7
Changes in provision for insured events of priorcalendar years (1.1) (5.4) (13.2) (2.8) 0.4 (6.6) 1.3 3.0
Total incurred claims 72.1 65.1 10.2 14.3 41.4 24.1 17.2 14.7
Payments:Claims and claim adjustment expenses attributable to
insured events of the current calendar year 65.1 62.5 4.5 3.5 0.3 0.2 0.3 0.0
Claims and claim adjustment expenses attributable toinsured events of prior calendar years 6.8 7.3 7.0 9.6 22.7 21.4 6.7 5.2
Total payments 71.9 69.8 11.5 13.1 23.0 21.6 7.0 5.2
Total unpaid claims expenses at end of the calendaryear $ 8.3 $ 8.1 $56.9 $58.2 $339.2 $320.8 $54.0 $43.8
D. Trend Information
Historical trend information showing revenue and claimsdevelopment information is presented in the Department ofEmployee Trust Funds audited financial statements. Theseparately issued financial report for the year ended December31, 2003 will be available in early Calendar Year 2005. Copies ofthese and prior years statements may be requested from:
The Department of Employee Trust Funds801 West Badger RoadP.O. Box 7931Madison, Wisconsin 53707-7931

State of Wisconsin Notes to The Financial Statements
123
NOTE 17. SELF-INSURANCE
It is the general policy of the State not to purchase commercialinsurance for the risks of losses to which it is exposed. Instead,the State believes it is more economical to manage its risksinternally and set aside assets for claim settlement in its internalservice fund, the Risk Management Fund. The fund servicesmost claims for risk of loss to which the State is exposed,including damage to State owned property, liability for propertydamages and injuries to third parties, and worker's compensation.All funds and agencies of the State participate in the RiskManagement Fund.
State Property Damage
Property damages to State-owned properties are covered by theState's self-funded property program up to $2.5 million peroccurrence and $2.7 million annual aggregate. When claims,which exceed $25,000 per occurrence, total $2.7 million, theState's private insurance becomes available. Losses to propertyoccurring after the threshold are first subject to a $25,000deductible. The amount of loss in excess of $25,000 is coveredby the State's private insurance company. During Fiscal Year2004, the excess insurance limits were written to $300 million.
The liabilities for State property damage are reported when it isprobable that a loss has occurred and the amount of that loss canbe reasonably estimated. The estimate for future benefits andloss liabilities is based on the reserves on open claims and paidclaims. Losses incurred but not reported are expected to beimmaterial. Claims incurred but not paid as of June 30, 2004 areestimated to total $3.5 million.
Property Damages and Bodily Injuries to Third Parties
The State is self-funded for third party liability to a level of $3million per occurrence and purchases insurance in excess of thisself-funded retention. The policy limit during Fiscal Year 2004was $50 million.
The liabilities for property damages and injuries to third partiesare reported when it is probable that a loss has occurred and theamount of that loss can be reasonably estimated. The estimatefor future benefits and loss liabilities for the prior fiscal year wasthe reserves on open claims. The estimate for future benefits andloss liabilities is calculated by an actuary based on the reserveson open claims and prior experience. No liability is reported forenvironmental impairment liability claims either incurred orincurred but not reported because existing case law makes itunlikely the State would be held liable for material amounts.Because actual claims liabilities depend upon complex factorssuch as inflation, changes in legal doctrines, and damage awards,the process used in computing claims liability does not
necessarily result in an exact amount. Claims incurred but notpaid as of June 30, 2004 are estimated to total $44.7 million.
Worker's Compensation
The Worker's Compensation Program was created by WisconsinStatutes Chapter 102 to provide benefits to workers injured on thejob. All employees of the State are included in the program. Aninjury is covered under worker's compensation if it is caused byan accident that arose out of and in the course of employment.
The responsibility for claiming compensation is on the employee.A claim must be filed with the program within two years from thedate of injury, otherwise the claim is not allowable.
The worker's compensation liability has been determined by anactuary using paid claims and current claims reserves. Liabilitiesinclude an amount for claims that have been incurred but notreported. Because actual claims liabilities are affected byexternal factors, the process used in computing claims liabilitiesdoes not necessarily result in an exact amount. Claims incurredbut not paid as of June 30, 2004 are estimated to total $62.7million.
Changes in the balances of claims liability for the RiskManagement Fund during the current and prior fiscal years are asfollows (in thousands):
2004 2003
Beginning of fiscal year liability $ 118,265 $ 111,821Current year claims and changes
in estimates 14,819 30,509Claim payments (22,228) (24,065)Balance at fiscal year-end $ 110,856 $ 118,265
Annuity Contracts
The Risk Management Fund purchased annuity contracts invarious claimants’ names to satisfy claim liabilities. The likelihoodthat the fund will be required to make future payments on thoseclaims is remote and, therefore, the fund is considered to havesatisfied its primary liability to the claimants. Accordingly, theannuity contracts are not reported in, and the related liabilities areremoved from, the fund’s balance sheet. The aggregateoutstanding amount of liabilities removed from the financialstatements at June 30, 2004 is $4.9 million.
State of Wisconsin Notes to The Financial Statements
124
NOTE 18. INSURANCE FUNDS
Primary Government
A. Local Government Property Insurance Fund
Created by the Legislature in 1911, the purpose of the LocalGovernment Property Insurance Fund is to provide propertyinsurance coverage to tax-supported local government units suchas counties, towns, villages, cities, school districts and libraryboards. Property insured includes government buildings, schools,libraries and motor vehicles. Coverage is available on an optionalbasis. As of June 30, 2004, the Local Government PropertyInsurance Fund insured 1,203 local governmental units. The totalamount of insurance in force as of June 30, 2004 was $35.9billion.
Valuation of Cash Equivalents and Investments - All investmentsof the Local Government Property Insurance Fund are managedby the State of Wisconsin Investment Board, as discussed in Note5-B to the financial statements. At June 30, 2004, the fund had$24.1 million of shares in the State Investment Fund which areconsidered cash equivalents and $8.1 million of high grade, long-term, fixed income obligations.
Premium - Unearned premium reported as deferred revenuerepresents the daily pro rata portion of premium written which isapplicable to the unexpired terms of the insurance policies inforce. Policies are generally written for annual terms.
Unpaid Claims Liabilities - The Local Government PropertyInsurance Fund establishes future benefits and loss liabilitiesbased on estimates of the ultimate cost of claims (including futureclaim adjustment expenses) that have been reported but notsettled, and of claims that have been incurred but not reported.Estimated amounts of reinsurance recoverable on unpaid claimsare deducted from the liability for unpaid claims. Claims liabilitiesare recomputed periodically to produce current estimates thatreflect recent settlements, claim frequency, and other economicfactors. Adjustments to future benefits and loss liabilities arecharged or credited to expense in the periods in which they aremade.
Policy Acquisition Costs - Since the Local Government PropertyInsurance Fund has no marketing staff and incurs no salescommissions, acquisition costs are minimal and charged tooperations as incurred.
Premium Deficiency – Investment income is considered indetermining whether a premium deficiency exists. No premiumdeficiency existed at June 30, 2004.
Reinsurance - The Local Government Property Insurance Funduses reinsurance agreements to reduce its exposure to largelosses on all types of insured events. Reinsurance permits
recovery of a portion of losses from reinsurers, although it doesnot discharge the primary liability of the fund as direct insurer ofthe risks reinsured. The fund does not report reinsured risks asliabilities unless it is probable that those risks will not be coveredby reinsurers. As of June 30, 2004 the fund had $240 million ofper occurrence excess of loss reinsurance in force with a $2.0million combined single limit retention for each occurrence, andan annual aggregate reinsurance contract with a $18.0 millionannual aggregate retention plus a per claim retention of $5thousand once the aggregate is met, as respects occurrences forthe term of the agreement. Premium ceded to reinsurers duringthe fiscal year amounted to $5.7 million. Reinsurance loss andadjusting expense recoveries earned for the year amounted to$87 thousand.
Unpaid Claims Liabilities
As discussed above, the Local Government Property InsuranceFund establishes a liability for both reported and unreportedinsured events, which includes estimates of both future paymentsof losses and related claim adjustment expenses. The followingrepresents changes in those aggregate liabilities for the fundduring the past two fiscal years (in thousands):

State of Wisconsin Notes to The Financial Statements
125
2004 2003
Unpaid claims and claim adjustmentexpenses at beginning of the year $12,178 $11,773Less: Reinsurance recoverable (6,468) (4,706) Net unpaid loss liability at beginning
of year 5,710 7,067
Incurred claims and claim adjustmentexpenses:
Provision for insured events of the current year 11,118 14,406Increase (decrease) in provision for insured events of prior years (595) 446
Total incurred claims and claim adjustment expenses 10,523 14,852
Payments:Claims and claim adjustment
expenses attributable to insuredevents of the current year 7,139 9,040
Claims and claim adjustmentexpenses attributable to insuredevents prior years 4,740 7,169
Total payments 11,879 16,209
Net unpaid claims and claim adjustmentexpenses at end of year 4,354 5,710
Reinsurance recoverable 3,652 6,468
Total unpaid claims and claimadjustment expenses $8,006 $12,178
Trend Information
Historical trend information showing revenue and claimsdevelopment information is presented in the Office of theCommissioner of Insurance June 30, 2004 financial statements.Copies of these statements may be requested from:
Office of the Commissioner of Insurance125 South Webster StreetMadison, Wisconsin 53702
B. State Life Insurance Fund
The State Life Insurance Fund was created under Chapter 607,Wisconsin Statutes, to offer life insurance to residents ofWisconsin in a manner similar to private insurers. This fundfunctions much like a mutual life insurance company and issubject to the same regulatory requirements as any life insurancecompany licensed to operate in Wisconsin.
Premiums are reported as earned when due. Benefits andexpenses are associated with earned premiums so as to result inrecognition of profits over the life of the contracts. Thisassociation is accomplished by means of the provision forliabilities for future benefits and the amortization of acquisitioncosts.
The costs of policy issuance and underwriting, all of which varywith, and are primarily related to, the production of new business,have been deferred. These deferred acquisition costs areamortized over a forty year period, considered representative ofthe life of the contract. The amortization is in proportion to theratio of annual in-force business to the amount of businessissued. Such anticipated in-force business was estimated usingsimilar assumptions to those used for computing liabilities forfuture policy benefits.
Deferred Acquisition Cost Assumptions
Issue Interest LapseYears Rate Rate Mortality
1913-1966 3.0% 2.0% None1967-1976 3.0 2.0 None1977-1985 4.0 2.0 None1986-1994 5.0 2.0 None1995+ 4.0 2.0 None
The State Life Insurance Fund does not pay commissions nordoes it incur agent expenses.
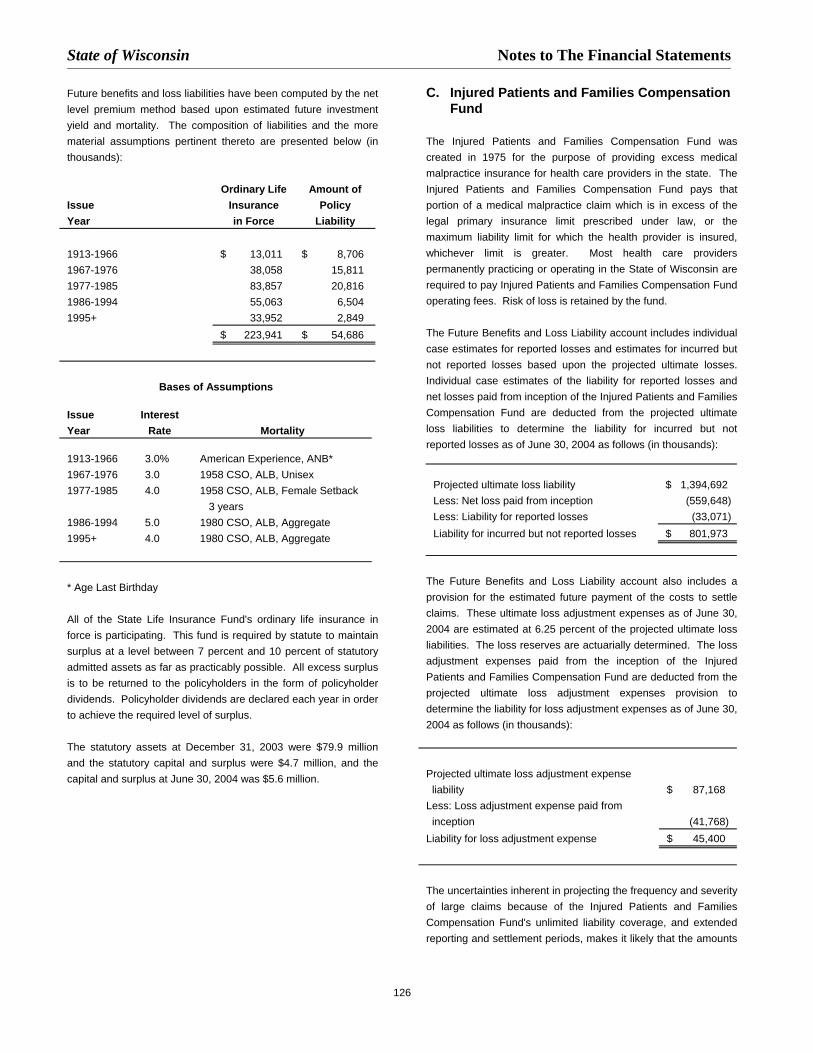
State of Wisconsin Notes to The Financial Statements
126
Future benefits and loss liabilities have been computed by the netlevel premium method based upon estimated future investmentyield and mortality. The composition of liabilities and the morematerial assumptions pertinent thereto are presented below (inthousands):
Ordinary Life Amount ofIssue Insurance PolicyYear in Force Liability
1913-1966 $ 13,011 $ 8,7061967-1976 38,058 15,8111977-1985 83,857 20,8161986-1994 55,063 6,5041995+ 33,952 2,849
$ 223,941 $ 54,686
Bases of Assumptions
Issue InterestYear Rate Mortality
1913-1966 3.0% American Experience, ANB*1967-1976 3.0 1958 CSO, ALB, Unisex1977-1985 4.0 1958 CSO, ALB, Female Setback
3 years1986-1994 5.0 1980 CSO, ALB, Aggregate1995+ 4.0 1980 CSO, ALB, Aggregate
* Age Last Birthday
All of the State Life Insurance Fund's ordinary life insurance inforce is participating. This fund is required by statute to maintainsurplus at a level between 7 percent and 10 percent of statutoryadmitted assets as far as practicably possible. All excess surplusis to be returned to the policyholders in the form of policyholderdividends. Policyholder dividends are declared each year in orderto achieve the required level of surplus.
The statutory assets at December 31, 2003 were $79.9 millionand the statutory capital and surplus were $4.7 million, and thecapital and surplus at June 30, 2004 was $5.6 million.
C. Injured Patients and Families CompensationFund
The Injured Patients and Families Compensation Fund wascreated in 1975 for the purpose of providing excess medicalmalpractice insurance for health care providers in the state. TheInjured Patients and Families Compensation Fund pays thatportion of a medical malpractice claim which is in excess of thelegal primary insurance limit prescribed under law, or themaximum liability limit for which the health provider is insured,whichever limit is greater. Most health care providerspermanently practicing or operating in the State of Wisconsin arerequired to pay Injured Patients and Families Compensation Fundoperating fees. Risk of loss is retained by the fund.
The Future Benefits and Loss Liability account includes individualcase estimates for reported losses and estimates for incurred butnot reported losses based upon the projected ultimate losses.Individual case estimates of the liability for reported losses andnet losses paid from inception of the Injured Patients and FamiliesCompensation Fund are deducted from the projected ultimateloss liabilities to determine the liability for incurred but notreported losses as of June 30, 2004 as follows (in thousands):
Projected ultimate loss liability $ 1,394,692Less: Net loss paid from inception (559,648)Less: Liability for reported losses (33,071)Liability for incurred but not reported losses $ 801,973
The Future Benefits and Loss Liability account also includes aprovision for the estimated future payment of the costs to settleclaims. These ultimate loss adjustment expenses as of June 30,2004 are estimated at 6.25 percent of the projected ultimate lossliabilities. The loss reserves are actuarially determined. The lossadjustment expenses paid from the inception of the InjuredPatients and Families Compensation Fund are deducted from theprojected ultimate loss adjustment expenses provision todetermine the liability for loss adjustment expenses as of June 30,2004 as follows (in thousands):
Projected ultimate loss adjustment expense liability $ 87,168Less: Loss adjustment expense paid from inception (41,768)Liability for loss adjustment expense $ 45,400
The uncertainties inherent in projecting the frequency and severityof large claims because of the Injured Patients and FamiliesCompensation Fund's unlimited liability coverage, and extendedreporting and settlement periods, makes it likely that the amounts
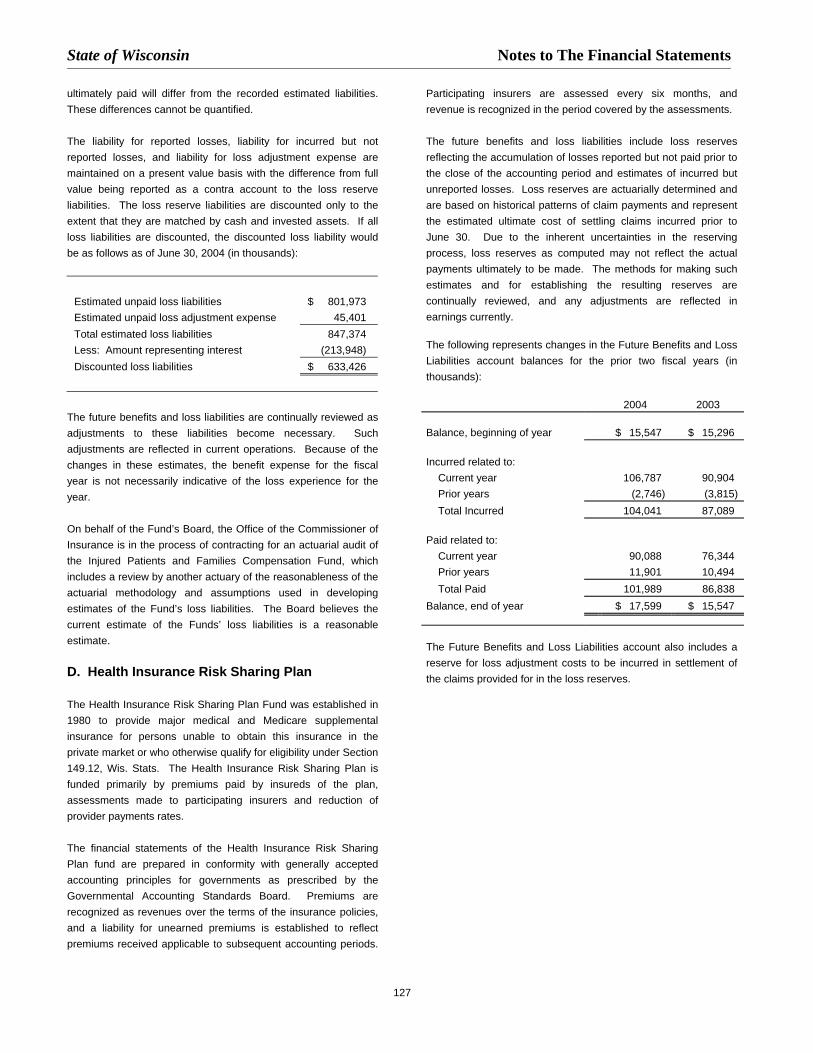
State of Wisconsin Notes to The Financial Statements
127
ultimately paid will differ from the recorded estimated liabilities.These differences cannot be quantified.
The liability for reported losses, liability for incurred but notreported losses, and liability for loss adjustment expense aremaintained on a present value basis with the difference from fullvalue being reported as a contra account to the loss reserveliabilities. The loss reserve liabilities are discounted only to theextent that they are matched by cash and invested assets. If allloss liabilities are discounted, the discounted loss liability wouldbe as follows as of June 30, 2004 (in thousands):
Estimated unpaid loss liabilities $ 801,973Estimated unpaid loss adjustment expense 45,401Total estimated loss liabilities 847,374Less: Amount representing interest (213,948)Discounted loss liabilities $ 633,426
The future benefits and loss liabilities are continually reviewed asadjustments to these liabilities become necessary. Suchadjustments are reflected in current operations. Because of thechanges in these estimates, the benefit expense for the fiscalyear is not necessarily indicative of the loss experience for theyear.
On behalf of the Fund’s Board, the Office of the Commissioner ofInsurance is in the process of contracting for an actuarial audit ofthe Injured Patients and Families Compensation Fund, whichincludes a review by another actuary of the reasonableness of theactuarial methodology and assumptions used in developingestimates of the Fund’s loss liabilities. The Board believes thecurrent estimate of the Funds’ loss liabilities is a reasonableestimate.
D. Health Insurance Risk Sharing Plan
The Health Insurance Risk Sharing Plan Fund was established in1980 to provide major medical and Medicare supplementalinsurance for persons unable to obtain this insurance in theprivate market or who otherwise qualify for eligibility under Section149.12, Wis. Stats. The Health Insurance Risk Sharing Plan isfunded primarily by premiums paid by insureds of the plan,assessments made to participating insurers and reduction ofprovider payments rates.
The financial statements of the Health Insurance Risk SharingPlan fund are prepared in conformity with generally acceptedaccounting principles for governments as prescribed by theGovernmental Accounting Standards Board. Premiums arerecognized as revenues over the terms of the insurance policies,and a liability for unearned premiums is established to reflectpremiums received applicable to subsequent accounting periods.
Participating insurers are assessed every six months, andrevenue is recognized in the period covered by the assessments.
The future benefits and loss liabilities include loss reservesreflecting the accumulation of losses reported but not paid prior tothe close of the accounting period and estimates of incurred butunreported losses. Loss reserves are actuarially determined andare based on historical patterns of claim payments and representthe estimated ultimate cost of settling claims incurred prior toJune 30. Due to the inherent uncertainties in the reservingprocess, loss reserves as computed may not reflect the actualpayments ultimately to be made. The methods for making suchestimates and for establishing the resulting reserves arecontinually reviewed, and any adjustments are reflected inearnings currently.
The following represents changes in the Future Benefits and LossLiabilities account balances for the prior two fiscal years (inthousands):
2004 2003
Balance, beginning of year $ 15,547 $ 15,296
Incurred related to:Current year 106,787 90,904Prior years (2,746) (3,815)Total Incurred 104,041 87,089
Paid related to:Current year 90,088 76,344Prior years 11,901 10,494Total Paid 101,989 86,838
Balance, end of year $ 17,599 $ 15,547
The Future Benefits and Loss Liabilities account also includes areserve for loss adjustment costs to be incurred in settlement ofthe claims provided for in the loss reserves.

State of Wisconsin Notes to The Financial Statements
128
Component Units
E. Wisconsin Health Care Liability Insurance Plan
The Wisconsin Health Care Liability Insurance Plan (the Plan) is astatutory unincorporated association established by rule of theCommissioner of Insurance of the State of Wisconsin asmandated by the State of Wisconsin legislature. The Planprovides health care liability insurance and liability coveragesnormally incidental to health care liability insurance to eligiblehealth care providers in the State of Wisconsin calling forpayment of premium prior to the effective date of the policy. Allinsurers authorized to write personal injury liability insurance inthe State of Wisconsin, with certain minor exceptions, arerequired to be members of the Plan.
The Plan generates its premium written revenue by sellingmedical malpractice insurance. Rates are calculated inaccordance with generally accepted actuarial principles. Therates are set so that the Plan will be self-supporting. Profit is notthe intent of the Plan.
Since the inception of the Plan in 1975, the health care liabilitycoverage limits have increased from $200 thousand peroccurrence and $600 thousand annual aggregate to the currentlimits of $1.0 million per occurrence and $3.0 million annualaggregate. A general liability coverage is also available toparticipating health care providers with limits of $1.0 million peroccurrence and $3.0 million annual aggregate. The Plan is notcovered under any reinsurance contracts.
In the event that sufficient funds are not available for the soundfinancial operation of the Plan, all members shall, on a temporarybasis, contribute to the financial needs of the Plan. Membersshall participate in the contributions in the proportion of theirrespective premiums to the aggregate premiums written by allmembers of the Plan. Such assessments shall be recouped byrate increases applied prospectively. There were noassessments for the year ended December 31, 2003.
The future benefits and loss liability includes amounts determinedfrom individual reported losses (case reserves) and an amount,based on past experience, for losses incurred but not reported.Such liabilities are necessarily based on estimates and, whilemanagement believes that the amounts are adequate, theultimate liability will differ from the amounts provided. Themethods for making such estimates and for establishing theresulting liability are annually reviewed, and any adjustments arereflected in income currently. Specific account balances as ofDecember 31, 2002 and December 31, 2003, are as follows (inthousands):
2003 2002
Balance at January 1 $ 51,680 $ 67,212Incurred related to:
Current year 6,739 4,044Prior years (12,895) (18,892)
Total Incurred (6,156) (14,848)Paid related to:
Current year 40 62Prior years 1,724 622
Total paid 1,764 684
Balance at December 31 $ 43,760 $ 51,680
There is inherent uncertainty in medical malpractice claims whenestablishing the estimates of unpaid losses and unpaid lossadjustment expenses. In 2003 and 2002, the Plan decreased itsestimates of unpaid losses and unpaid loss adjustment expensesrelated to insured events of prior years. These decreases weregreater than the estimated losses incurred for the current year,causing negative incurred losses and loss adjustment expenses.
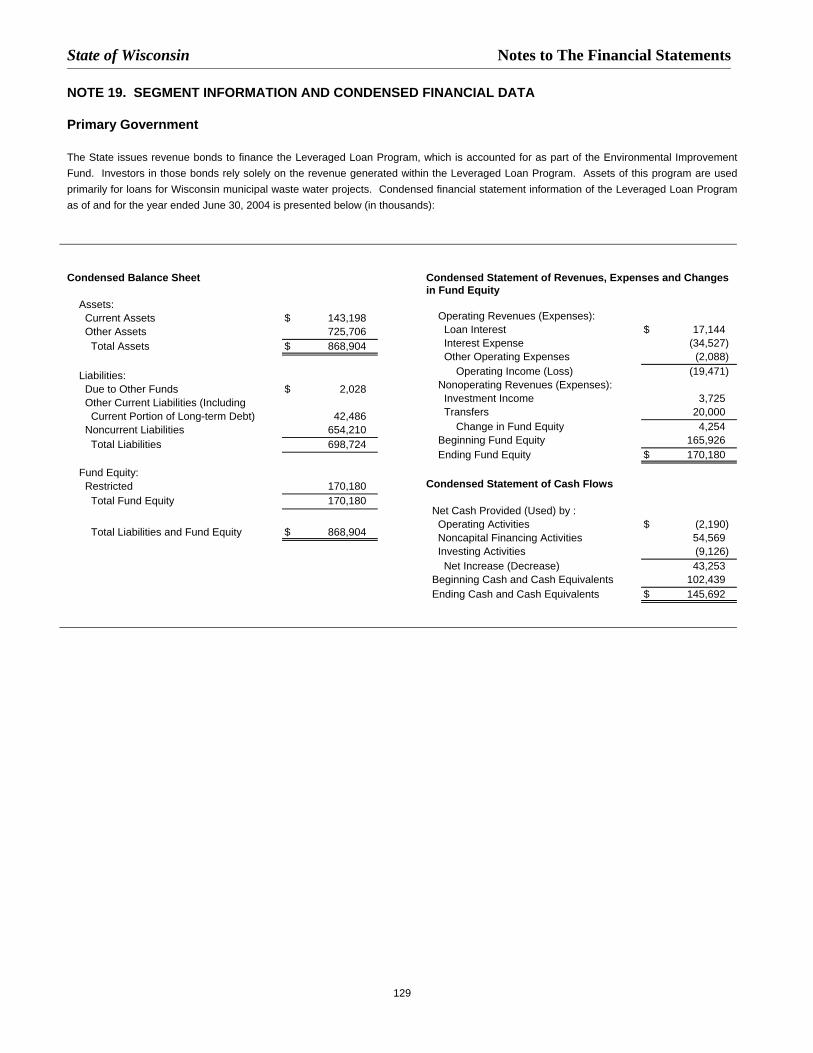
State of Wisconsin Notes to The Financial Statements
129
NOTE 19. SEGMENT INFORMATION AND CONDENSED FINANCIAL DATA
Primary Government
The State issues revenue bonds to finance the Leveraged Loan Program, which is accounted for as part of the Environmental ImprovementFund. Investors in those bonds rely solely on the revenue generated within the Leveraged Loan Program. Assets of this program are usedprimarily for loans for Wisconsin municipal waste water projects. Condensed financial statement information of the Leveraged Loan Programas of and for the year ended June 30, 2004 is presented below (in thousands):
Condensed Balance Sheet
Assets:Current Assets $ 143,198Other Assets 725,706
Total Assets $ 868,904
Liabilities:Due to Other Funds $ 2,028Other Current Liabilities (Including
Current Portion of Long-term Debt) 42,486Noncurrent Liabilities 654,210
Total Liabilities 698,724
Fund Equity:Restricted 170,180
Total Fund Equity 170,180
Total Liabilities and Fund Equity $ 868,904
Condensed Statement of Revenues, Expenses and Changesin Fund Equity
Operating Revenues (Expenses):Loan Interest $ 17,144 Interest Expense (34,527)Other Operating Expenses (2,088)
Operating Income (Loss) (19,471)Nonoperating Revenues (Expenses):
Investment Income 3,725Transfers 20,000
Change in Fund Equity 4,254Beginning Fund Equity 165,926Ending Fund Equity $ 170,180
Condensed Statement of Cash Flows
Net Cash Provided (Used) by : Operating Activities $ (2,190) Noncapital Financing Activities 54,569 Investing Activities (9,126) Net Increase (Decrease) 43,253 Beginning Cash and Cash Equivalents 102,439 Ending Cash and Cash Equivalents $ 145,692

State of Wisconsin Notes to The Financial Statements
130
NOTE 20. COMPONENT UNITS – CONDENSED FINANCIAL INFORMATION
Significant financial data for the State’s five discretely presented component units for the year ended December 31, 2003 or June 30, 2004 ispresented below (in thousands):
Wisconsin Housing Wisconsin University of Stateand Economic Health Care Wisconsin University of Fair ParkDevelopment Liability Hospitals and Wisconsin Exposition
Authority Insurance Plan Clinics Authority Foundation Center, Inc. Total
Condensed Balance Sheet
Assets:Cash, Investments and Other Assets $ 2,462,826 $ 89,095 $ 172,438 $ 1,796,284 $ 5,881 $ 4,526,524Due from Primary Government -- -- 2,548 -- 131 2,678Cash and Investments with Other
Component Units -- -- 187,584 -- -- 187,584Capital Assets, Net 19,569 -- 242,938 7,818 36,946 307,272
Total Assets $ 2,482,395 $ 89,095 $ 605,508 $ 1,804,102 $ 42,958 $ 5,024,058
Liabilities:Accounts Payable and Other
Current Liabilities $ 138,315 $ 35,777 $ 50,592 $ 294,099 $ 890 $ 519,673Due to Primary Government 2,399 14 3,451 -- 90 5,954Amounts Held for Other Component Units -- -- -- 172,191 -- 172,191Long-term Liabilities (Current and
Noncurrent Portions) 1,959,188 43,760 284,316 2,792 40,924 2,330,982Total Liabilities 2,099,902 79,551 338,359 469,082 41,905 3,028,799
Fund Equity: Invested in Capital Assets, Net of
Related Debt 1,180 -- 86,374 7,818 (3,343) 92,029 Restricted 217,980 9,544 11,279 1,227,680 -- 1,466,484
Unrestricted 163,333 -- 169,496 99,521 4,396 436,746Total Fund Equity 382,493 9,544 267,149 1,335,019 1,053 1,995,259
Total Liabilities and Fund Equity $ 2,482,395 $ 89,095 $ 605,508 $ 1,804,102 $ 42,958 $ 5,024,058
Condensed Statement of Revenues, Expenses and Changes in Fund Equity
Program Expenses:Depreciation $ 5,633 $ -- $ 25,262 $ 313 $ 1,012 $ 32,221Payments to Primary Government -- -- 725 98,587 -- 99,312Other 244,287 11,022 561,250 29,642 4,427 850,627
Total Program Expenses 249,920 11,022 587,237 128,542 5,439 982,160
Program Revenues:Charges for Services 3,457 2,676 595,358 -- 3,828 605,319Investment and Interest Income 105,347 7,138 -- 236,516 -- 349,001Operating Grants and Contributions 128,724 -- 1,006 160,426 -- 290,156Capital Grants and Contributions -- -- 6,028 -- -- 6,028Other 10,496 673 11,567 161 143 23,041
Total Program Revenues 248,024 10,487 613,959 397,103 3,971 1,273,545
Net Program Revenue/(Expense) (1,896) (535) 26,722 268,562 (1,468) 291,385
General Revenues:Interest and Investment Earnings 26,024 -- 13,325 -- -- 39,349
Change in Fund Equity 24,128 (535) 40,047 268,562 (1,468) 330,734Fund Equity, Beginning of Year 358,365 10,080 227,102 1,066,457 2,521 1,664,525Fund Equity, End of Year $ 382,493 $ 9,544 $ 267,149 $ 1,335,019 $ 1,053 $ 1,995,259
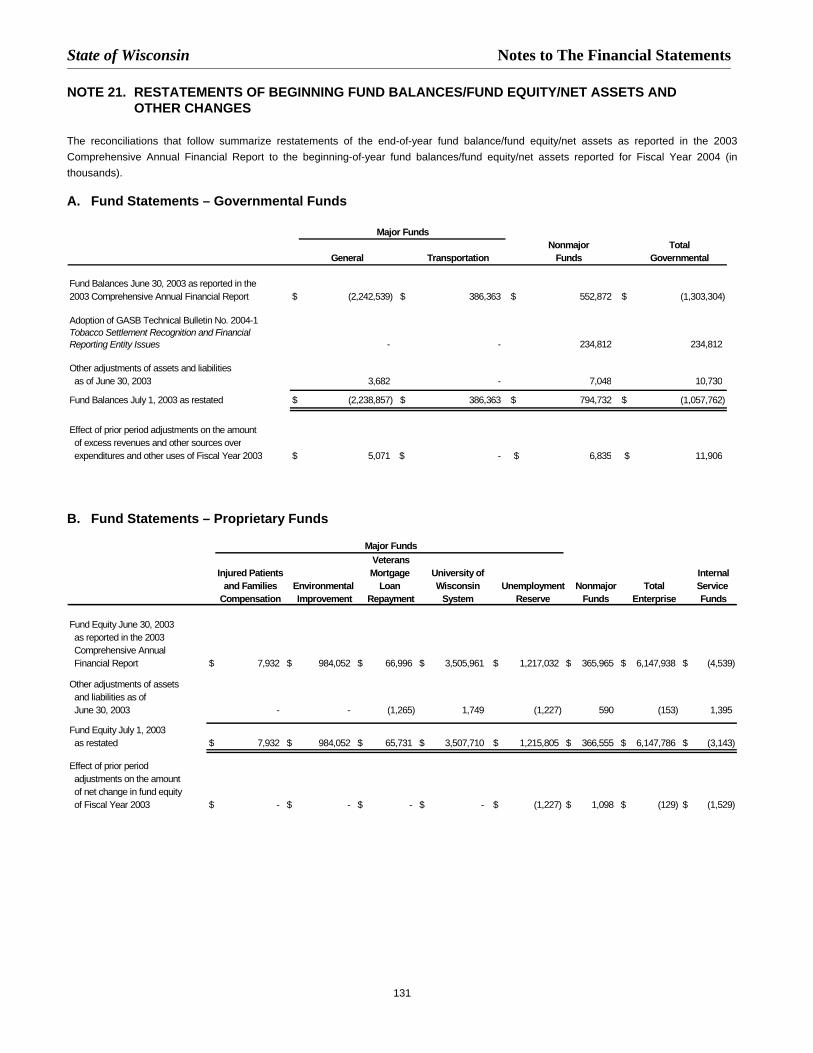
State of Wisconsin Notes to The Financial Statements
131
NOTE 21. RESTATEMENTS OF BEGINNING FUND BALANCES/FUND EQUITY/NET ASSETS ANDOTHER CHANGES
The reconciliations that follow summarize restatements of the end-of-year fund balance/fund equity/net assets as reported in the 2003Comprehensive Annual Financial Report to the beginning-of-year fund balances/fund equity/net assets reported for Fiscal Year 2004 (inthousands).
A. Fund Statements – Governmental Funds
B. Fund Statements – Proprietary Funds
Major FundsVeterans
Injured Patients Mortgage University of Internaland Families Environmental Loan Wisconsin Unemployment Nonmajor Total Service
Compensation Improvement Repayment System Reserve Funds Enterprise Funds
Fund Equity June 30, 2003 as reported in the 2003 Comprehensive Annual Financial Report $ 7,932 $ 984,052 $ 66,996 $ 3,505,961 $ 1,217,032 $ 365,965 $ 6,147,938 $ (4,539)
Other adjustments of assets and liabilities as of June 30, 2003 - - (1,265) 1,749 (1,227) 590 (153) 1,395
Fund Equity July 1, 2003 as restated $ 7,932 $ 984,052 $ 65,731 $ 3,507,710 $ 1,215,805 $ 366,555 $ 6,147,786 $ (3,143)
Effect of prior period adjustments on the amount of net change in fund equity of Fiscal Year 2003 $ - $ - $ - $ - $ (1,227) $ 1,098 $ (129) $ (1,529)
Major FundsNonmajor Total
General Transportation Funds Governmental
Fund Balances June 30, 2003 as reported in the 2003 Comprehensive Annual Financial Report $ (2,242,539) $ 386,363 $ 552,872 $ (1,303,304)
Adoption of GASB Technical Bulletin No. 2004-1Tobacco Settlement Recognition and FinancialReporting Entity Issues - - 234,812 234,812
Other adjustments of assets and liabilities as of June 30, 2003 3,682 - 7,048 10,730
Fund Balances July 1, 2003 as restated $ (2,238,857) $ 386,363 $ 794,732 $ (1,057,762)
Effect of prior period adjustments on the amount of excess revenues and other sources over expenditures and other uses of Fiscal Year 2003 $ 5,071 $ - $ 6,835 $ 11,906
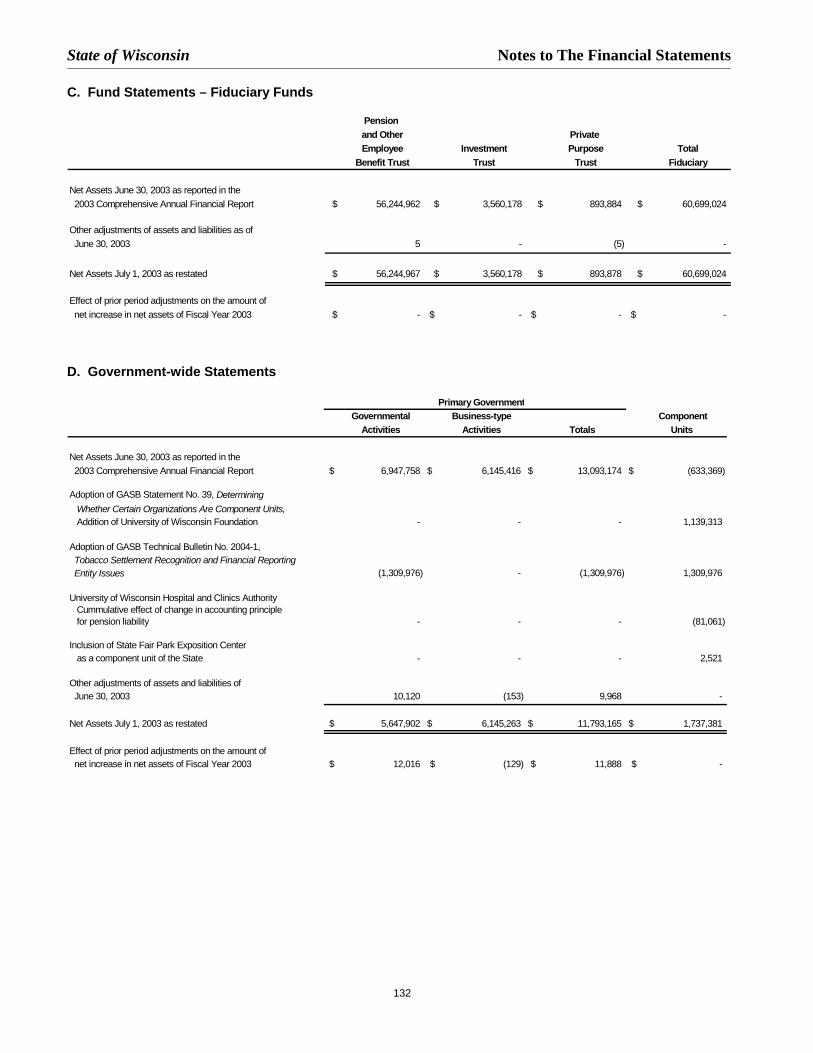
State of Wisconsin Notes to The Financial Statements
132
C. Fund Statements – Fiduciary Funds
D. Government-wide Statements
Primary GovernmentGovernmental Business-type Component
Activities Activities Totals Units
Net Assets June 30, 2003 as reported in the 2003 Comprehensive Annual Financial Report $ 6,947,758 $ 6,145,416 $ 13,093,174 $ (633,369)
Adoption of GASB Statement No. 39, Determining Whether Certain Organizations Are Component Units, Addition of University of Wisconsin Foundation - - - 1,139,313
Adoption of GASB Technical Bulletin No. 2004-1, Tobacco Settlement Recognition and Financial Reporting Entity Issues (1,309,976) - (1,309,976) 1,309,976
University of Wisconsin Hospital and Clinics Authority Cummulative effect of change in accounting principle for pension liability - - - (81,061)
Inclusion of State Fair Park Exposition Center as a component unit of the State - - - 2,521
Other adjustments of assets and liabilities of June 30, 2003 10,120 (153) 9,968 -
Net Assets July 1, 2003 as restated $ 5,647,902 $ 6,145,263 $ 11,793,165 $ 1,737,381
Effect of prior period adjustments on the amount of net increase in net assets of Fiscal Year 2003 $ 12,016 $ (129) $ 11,888 $ -
Pension and Other Private Employee Investment Purpose Total
Benefit Trust Trust Trust Fiduciary
Net Assets June 30, 2003 as reported in the 2003 Comprehensive Annual Financial Report $ 56,244,962 $ 3,560,178 $ 893,884 $ 60,699,024
Other adjustments of assets and liabilities as of June 30, 2003 5 - (5) -
Net Assets July 1, 2003 as restated $ 56,244,967 $ 3,560,178 $ 893,878 $ 60,699,024
Effect of prior period adjustments on the amount of net increase in net assets of Fiscal Year 2003 $ - $ - $ - $ -
State of Wisconsin Notes to The Financial Statements
133
NOTE 22. LITIGATION, CONTINGENCIES ANDCOMMITMENTS
A. Litigation and Contingencies
The State is a defendant in various legal proceedings pertainingto matters incidental to the performance of routine governmentaloperations.
Claims and Judgments Reported in Governmental Activities
The State accrues liabilities related to legal proceedings, if a lossis probable and reasonably estimable. Such losses, totaling $2.1million on June 30, 2004 reported in the governmental activities,are discussed below:
Litigation - The Department of Health and Family Services isinvolved in various legal proceedings where the ultimatedisposition is estimated at $0.5 million.
Other Claims - Work Injury Supplemental Benefits - The WorkInjury Supplemental Benefit Fund, administered by theDepartment of Workforce Development, provides compensatorypayments to survivors of fatally injured employees or disabledemployees with work-related injuries. The liability for annuities tobe paid to the above individuals totaled $1.6 million at June 30,2004.
Other Claims, Judgments, and Contingencies
The State is also named as a party in other legal proceedingswhere the ultimate disposition and consequence are not presentlydeterminable. The potential liability amount relating to anunfavorable outcome for certain of these proceedings couldimpact the State by approximately $9.6 million. However, theultimate dispositions and consequences of any single legalproceeding or all legal proceedings collectively should not have amaterial adverse effect on the State's financial position, except asnoted below.
Corporate Tax Measured by Interest from U.S. Securities - In thiscorporate franchise tax case, American Family Mutual InsuranceCompany and American Standard Insurance Company soughtrefunds of taxes paid that were measured by U.S. interest.
Federal law prohibits an income tax on U.S. interest, but allows anon-discriminatory franchise tax measured on U.S. interest. Theinsurance companies argued that because bonds authorized bythe State for housing and development were exempt from Statetaxes, that the franchise tax was discriminatory. The State hadheretofore held that the exemption applied only to direct Statetaxes and had uniformly included interest on the State authorizedbonds in the franchise tax measure. The Wisconsin Tax AppealsCommission and the County Circuit Court upheld the State.
The Court of Appeals, District IV, reversed the decisions. TheSupreme Court reversed the Court of Appeals. The taxpayersmaintain that the decision is not applicable to 1993 and 1994.The State maintains the principles of the decision are applicableto the subsequent years.
Due to the uncertainty in predicting the outcome, a liability has notbeen recorded as of June 30, 2004.
Federal Pension Income – The 1984-1988 period settlements withapproximately 3,200 military retirees and 14,000 civilian retirees,triggered by the United States Supreme Court ruling in Davis v.Michigan Department of the Treasury are essentially completed.The Davis case had held that a state government violates theintergovernmental tax immunity clause when it provided fortaxation of federal pension benefits. Subsequent litigation withother retirees on a variety of issues has occurred, with theDepartment prevailing in all instances. Litigation is still inprogress on a limited number of issues. The Department ofRevenue is confident that it will continue to prevail on this issue.Because a fiscal impact cannot be readily determined if the Statewere not to prevail, and due to the uncertainty in predicting theoutcome, a liability has not been recorded.
Environmental Clean-up Actions - The State is involved inenvironmental clean-up of property owned by the State that hasthe potential to cause soil and groundwater contamination.Fourteen sites have soil and/or groundwater contaminationassociated with underground storage tank releases with anestimated remediation cost of $2.4 million.
The State is also involved in environmental remediations on fiveproperties that do not involve releases from underground storagetanks, with an estimated cost of $2.5 million.
State of Wisconsin Notes to The Financial Statements
134
B. Commitments
Primary Government
In addition to legal proceedings, the State is party to commitmentswhich normally occur in governmental operations.
In addition to the amount of encumbrances outstanding atJune 30, 2004 reported as Fund Balance - Reserved forEncumbrances, additional obligations at June 30, 2004representing multi-year, long-term commitments included (inthousands):
Transportation Fund $ 291,527Transportation Revenue Bonds Capital
Projects Fund 41,252General Fund – Department of Commerce
programs, including economic and communitydevelopment programs 30
The Environmental Improvement Fund (the Fund) wasestablished to administer the Clean Water Fund Loan Program.Loans are made to local units of government for wastewatertreatment projects for terms of up to 20 years. These loans aremade at a number of prescribed interest rates based onenvironmental priority. The loans contractually are revenueobligations or general obligations of the local governmental unit.Additionally, various statutory provisions exist which providefurther security for payment. The fund has made financialassistance commitments of $133.3 million as of June 30, 2004.These loan commitments are expected to be met throughadditional federal grants and proceeds from issuance of revenueobligations.
In addition, the revenue obligation bonds of the Leveraged LoanProgram in the Fund are collateralized by a security interest in allthe assets of the Leveraged Loan Program. Neither the full faithand credit nor the taxing power of the State is pledged for thepayment of the Fund’s revenue obligation bonds. However, asthe loans granted to local units of government are at an interestrate less than the revenue bond rate, the State is obligated by theFund’s General Resolution to fund, at the time each loan is made,a reserve which subsidizes the Leveraged Loan Program in anamount which offsets this interest disparity.
The Injured Patients and Families Compensation Fund may berequired to purchase an annuity as a result of a claim settlement.Under specific annuity arrangements, the fund may have ultimateresponsibility for annuity payments if the annuity company and thereassignment company default on annuity payments. One of thefund's annuity providers has defaulted on $600 thousand inannuity payments. The total estimated replacement value of thefund's annuities as of June 30, 2004 was $140.1 million. The fund
reserves the right to pursue collection from State guaranteefunds.
State Public Deposit Guarantee - As required by Wis. Stat. Sec.34.08, the State is to make payments to public depositors forproofs of loss (e.g., loss resulting from a bank failure) up to $400thousand per depositor above the amount of federal insurance.This statutory requirement guarantees that the State will makepayments in favor of the public depositor that has submitted aproof of loss. Payments would be made in the order in whichsatisfactory proofs of loss are received by the State's Departmentof Financial Institutions, until the designated appropriation isexhausted. At June 30, 2004, the appropriation available totaled$31.8 million. Losses become fixed as of the date of the loss. Apublic depositor experiencing a loss must assign its interest in thedeposit, to the extent of the amount paid, to the Department ofFinancial Institutions. Any recovery made by the Department ofFinancial Institutions under the assignment is to be repaid to theappropriation. The possibility of a material loss resulting frompayments to and recovery from public depositors is remote.
The Veterans Mortgage Loan Repayment Fund accounts for theissuance and administration of veterans’ first mortgage loans.The loans are made to veterans for the purchase of homes toterms up to 30 years. The loan interest rates are set by the Boardof Veterans Affairs. The loans are secured by real estatemortgages. The fund has commitments for loans of $15.0 millionas of June 30, 2004. The loan commitments are expected to bemet from current fund assets.
State of Wisconsin Notes to The Financial Statements
135
Component Units
The Wisconsin Housing and Economic Development Authority'smission was expanded since its creation to include administrationof the Agricultural and Business Programs. These programsadminister funds that are legislatively appropriated to subsidizeinterest and provide guarantees of principal balances of qualifyingloans. At June 30, 2004, outstanding loan guarantees totaled$38.2 million.
NOTE 23. SUBSEQUENT EVENTS
Primary Government
Long-term Debt
State of Wisconsin General Obligation Bonds – In July 2004, theState issued a $1.0 million general obligation term bond 2004,Series B to be used to fund veterans home improvement loans.Interest is payable May 1 and November 1, beginning May 1,2005 with mandatory sinking fund payments beginning November1, 2005 to the stated maturity date November 1, 2014.
In July 2004, the State issued $117.2 million of general obligationbonds Series 4 to be used to refund various outstanding generalobligation bonds. Interest is payable May 1 and November 1,beginning November 1, 2004, with bonds maturing May 1 of theyears 2006 though 2020.
In July 2004, the State issued a $1.0 million general obligationterm bond 2004, Series C to be used to fund veterans homeimprovement loans. Interest is payable May 1 and November 1,beginning May 1, 2005 with mandatory sinking fund paymentsbeginning November 1, 2005 to the stated maturity dateNovember 1, 2019.
In August 2004, the State issued a $20.0 million generalobligation term bond 2004, Series D to be used to fund veteransprimary mortgage home loans. Interest is payable May 1 andNovember 1, beginning May 1, 2005 with mandatory sinking fundpayments beginning November 1, 2005 to the stated maturity dateNovember 1, 2034.
In October 2004, the State issued $225.0 million of 2004 Series Egeneral obligation bonds to be used for the acquisition,construction, development, extension, enlargement, orimprovement of land, water, property, highways, buildings,equipment, or facilities for public purposes. Interest is payable onMay 1 and November 1, beginning May 1, 2005, with bondsmaturing May 1, of the years 2006 through 2025.
In October 2004, the Environmental Improvement Fundexchanged $116.8 million global certificate 1 for $116.8 globalcertificate 2. Interest is payable May 1 and November 1,beginning November 1, 2005 with principal installments beginningNovember 1, 2009 through May 1, 2024.
In November 2004, the State redeemed early $42.0 million ofvarious outstanding veterans loan general obligation bondspursuant to the redemption provisions of those bonds. The bondswere redeemed from mortgage prepayments and undisbursedbond proceeds.

State of Wisconsin Notes to The Financial Statements
136
Revenue Bonds – In September 2004, the Department ofTransportation issued $95.9 million of 2004 Series 1transportation revenue refunding bonds. The proceeds weredeposited in an escrow account to provide for future debt serviceand redemption of $97.5 million of various outstanding revenuebonds. On June 1, 2004, Badger Tobacco Asset SecuritizationCorporation (BTASC) redeemed $40.3 million of the 6.125percent term bonds due June 1, 2027. Pursuant to the indenture,the bonds were redeemed with collections that had beendeposited into the Turbo Redemption Account. Subject toconditions outlined in the indenture, turbo term bonds shall beredeemed in whole or in part prior to their stated maturity and onany distribution date from amounts on deposit in the RedemptionAccount.
Component Units
Wisconsin Housing and Economic Development Authority – InJuly 2004, the Authority issued $150.0 million of the Variable RateDemand Home Ownership Revenue Bonds, 2004 Series C and D.These bonds were issued under the 1988 Home OwnershipRevenue Bond Resolution.
In July 2004, the Authority redeemed the following bonds (inthousands):
AmountProgram/Bond Resolution Redeemed
Housing Revenue Bonds, 1991 SeriesF, G, H & I $ 1,485
Home Ownership Revenue Bonds,1994 Series C & D 2,150
General Obligation Bonds, 1995 Series 4 120Home Ownership Revenue Bonds,
1998 Series F & G 2,975
In August 2004, the Authority redeemed the following bonds (inthousands):
AmountProgram/Bond Resolution Redeemed
Housing Revenue Bonds, 1993 Series C $ 1,710Housing Revenue Bonds, 2002 Series A, B & C 2,730
Required Supplementary Information
137
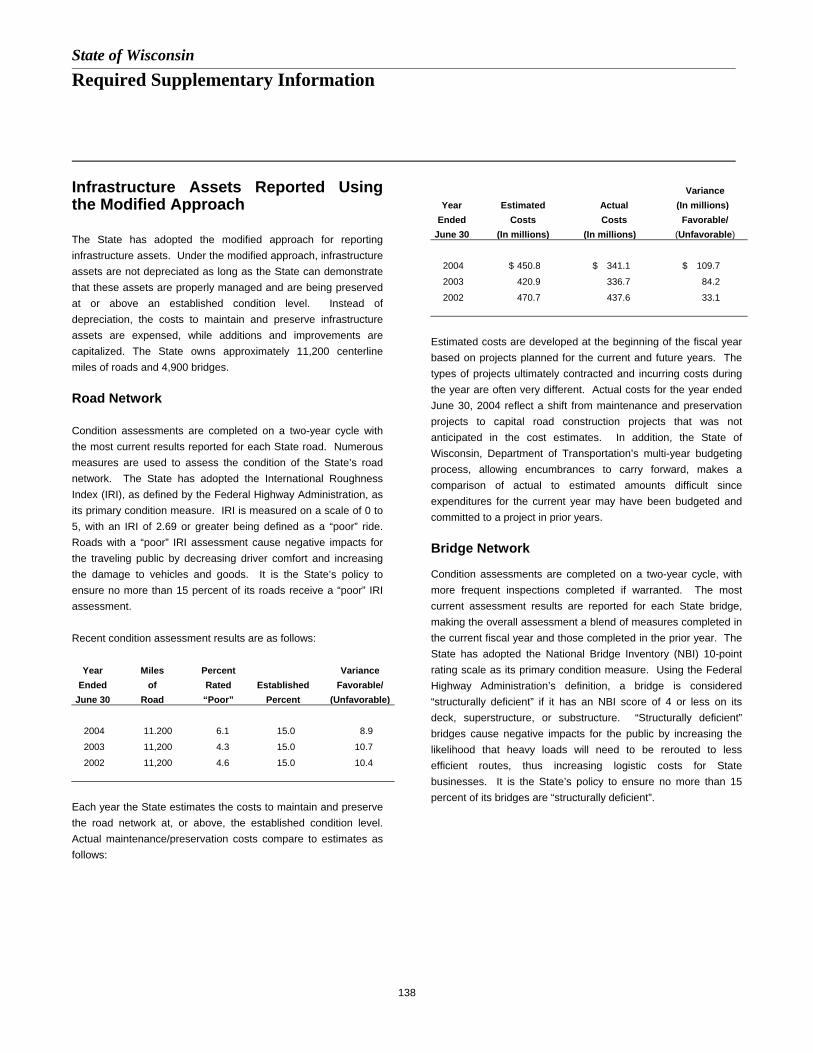
State of Wisconsin
Required Supplementary Information
138
Infrastructure Assets Reported Usingthe Modified Approach
The State has adopted the modified approach for reportinginfrastructure assets. Under the modified approach, infrastructureassets are not depreciated as long as the State can demonstratethat these assets are properly managed and are being preservedat or above an established condition level. Instead ofdepreciation, the costs to maintain and preserve infrastructureassets are expensed, while additions and improvements arecapitalized. The State owns approximately 11,200 centerlinemiles of roads and 4,900 bridges.
Road Network
Condition assessments are completed on a two-year cycle withthe most current results reported for each State road. Numerousmeasures are used to assess the condition of the State’s roadnetwork. The State has adopted the International RoughnessIndex (IRI), as defined by the Federal Highway Administration, asits primary condition measure. IRI is measured on a scale of 0 to5, with an IRI of 2.69 or greater being defined as a “poor” ride.Roads with a “poor” IRI assessment cause negative impacts forthe traveling public by decreasing driver comfort and increasingthe damage to vehicles and goods. It is the State’s policy toensure no more than 15 percent of its roads receive a “poor” IRIassessment.
Recent condition assessment results are as follows:
Year Miles Percent VarianceEnded of Rated Established Favorable/
June 30 Road “Poor” Percent (Unfavorable)
2004 11.200 6.1 15.0 8.9
2003 11,200 4.3 15.0 10.7
2002 11,200 4.6 15.0 10.4
Each year the State estimates the costs to maintain and preservethe road network at, or above, the established condition level.Actual maintenance/preservation costs compare to estimates asfollows:
VarianceYear Estimated Actual (In millions)
Ended Costs Costs Favorable/June 30 (In millions) (In millions) (Unfavorable)
2004 $ 450.8 $ 341.1 $ 109.7
2003 420.9 336.7 84.2
2002 470.7 437.6 33.1
Estimated costs are developed at the beginning of the fiscal yearbased on projects planned for the current and future years. Thetypes of projects ultimately contracted and incurring costs duringthe year are often very different. Actual costs for the year endedJune 30, 2004 reflect a shift from maintenance and preservationprojects to capital road construction projects that was notanticipated in the cost estimates. In addition, the State ofWisconsin, Department of Transportation’s multi-year budgetingprocess, allowing encumbrances to carry forward, makes acomparison of actual to estimated amounts difficult sinceexpenditures for the current year may have been budgeted andcommitted to a project in prior years.
Bridge Network
Condition assessments are completed on a two-year cycle, withmore frequent inspections completed if warranted. The mostcurrent assessment results are reported for each State bridge,making the overall assessment a blend of measures completed inthe current fiscal year and those completed in the prior year. TheState has adopted the National Bridge Inventory (NBI) 10-pointrating scale as its primary condition measure. Using the FederalHighway Administration’s definition, a bridge is considered“structurally deficient” if it has an NBI score of 4 or less on itsdeck, superstructure, or substructure. “Structurally deficient”bridges cause negative impacts for the public by increasing thelikelihood that heavy loads will need to be rerouted to lessefficient routes, thus increasing logistic costs for Statebusinesses. It is the State’s policy to ensure no more than 15percent of its bridges are “structurally deficient”.

139
Recent condition assessment results are as follows:
Year Number Percent VarianceEnded of Structurally Established Favorable/
June 30 Bridges Deficient Percent (Unfavorable)
2004 4.900 5.4 15.0 9.6
2003 4,900 6.2 15.0 8.8
2002 4,900 7.6 15.0 7.4
Each year the State estimates the costs to maintain and preservethe bridge network at, or above, the established condition level.Actual maintenance/preservation costs compare to estimates asfollows:
VarianceYear Estimated Actual (In millions)
Ended Costs Costs Favorable/June 30 (In millions) (In millions) (Unfavorable)
2004 $ 47.8 $ 52.3 $ (4.5)
2003 46.4 45.7 0.7
2002 33.6 38.4 (4.8)
Additional bridge maintenance and preservation projects wereplanned and completed during the year ended June 30, 2004.The State of Wisconsin, Department of Transportation’s multi-yearbudgeting process, allowing encumbrances to carry forward,makes a comparison of actual to estimated amounts difficult sinceexpenditures for the current year may have been budgeted andcommitted to a project in prior years.
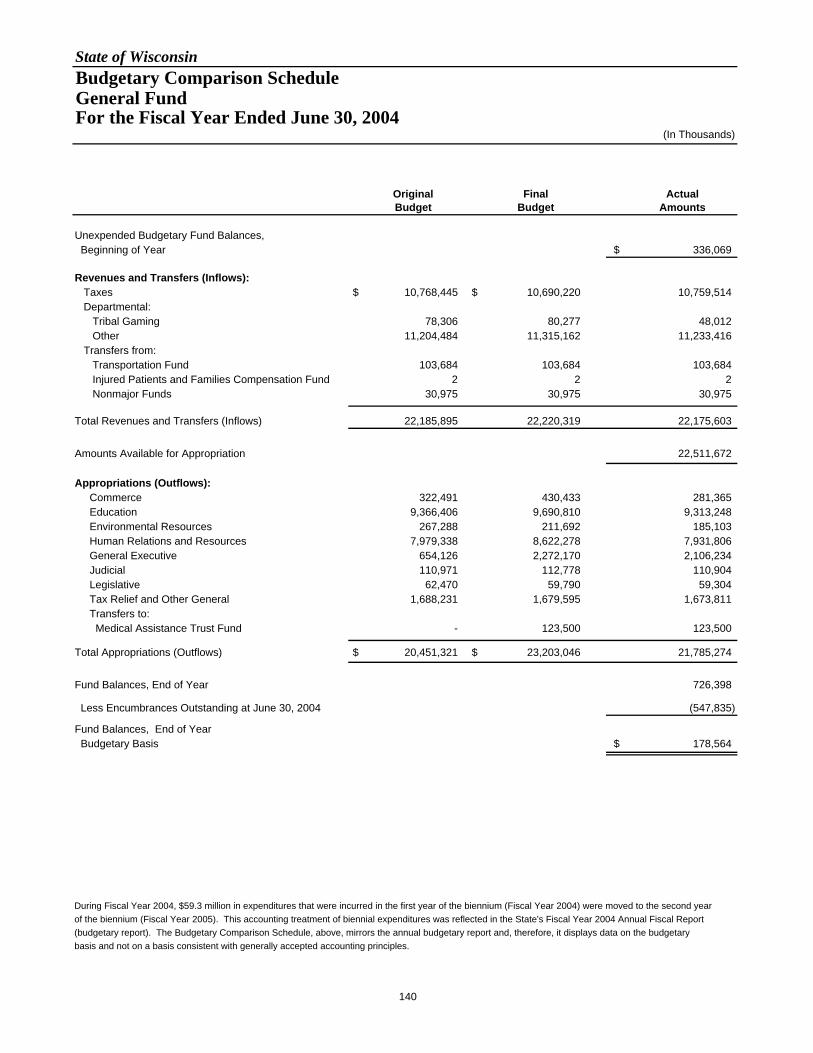
State of WisconsinBudgetary Comparison Schedule General Fund For the Fiscal Year Ended June 30, 2004
(In Thousands)
Original Final ActualBudget Budget Amounts
Unexpended Budgetary Fund Balances, Beginning of Year $ 336,069
Revenues and Transfers (Inflows): Taxes $ 10,768,445 $ 10,690,220 10,759,514 Departmental: Tribal Gaming 78,306 80,277 48,012 Other 11,204,484 11,315,162 11,233,416 Transfers from: Transportation Fund 103,684 103,684 103,684 Injured Patients and Families Compensation Fund 2 2 2 Nonmajor Funds 30,975 30,975 30,975
Total Revenues and Transfers (Inflows) 22,185,895 22,220,319 22,175,603
Amounts Available for Appropriation 22,511,672
Appropriations (Outflows): Commerce 322,491 430,433 281,365 Education 9,366,406 9,690,810 9,313,248 Environmental Resources 267,288 211,692 185,103 Human Relations and Resources 7,979,338 8,622,278 7,931,806 General Executive 654,126 2,272,170 2,106,234 Judicial 110,971 112,778 110,904 Legislative 62,470 59,790 59,304 Tax Relief and Other General 1,688,231 1,679,595 1,673,811 Transfers to: Medical Assistance Trust Fund - 123,500 123,500
Total Appropriations (Outflows) $ 20,451,321 $ 23,203,046 21,785,274
Fund Balances, End of Year 726,398
Less Encumbrances Outstanding at June 30, 2004 (547,835)
Fund Balances, End of Year Budgetary Basis $ 178,564
During Fiscal Year 2004, $59.3 million in expenditures that were incurred in the first year of the biennium (Fiscal Year 2004) were moved to the second yearof the biennium (Fiscal Year 2005). This accounting treatment of biennial expenditures was reflected in the State's Fiscal Year 2004 Annual Fiscal Report(budgetary report). The Budgetary Comparison Schedule, above, mirrors the annual budgetary report and, therefore, it displays data on the budgetarybasis and not on a basis consistent with generally accepted accounting principles.
140

State of WisconsinBudgetary Comparison Schedule Transportation Fund For the Fiscal Year Ended June 30, 2004
(In Thousands)
Original Final ActualBudget Budget Amounts
Unexpended Budgetary Fund Balances, Beginning of Year $ 402,071
Revenues (Inflows): Taxes $ 959,594 $ 959,594 959,594 Departmental 1,336,400 1,336,400 1,336,400
Total Revenues (Inflows) 2,295,994 2,295,994 2,295,994
Amounts Available for Appropriation 2,698,065
Appropriations and Transfers (Outflows): Commerce 91 97 97 Education 40,000 40,000 40,000 Environmental Resources 2,947,784 3,323,162 1,929,512 General Executive 4,179 2,318 2,240 Tax Relief and Other General 248,938 248,941 248,941 Transfers to: General Fund 103,684 103,684 103,684
Total Appropriations and Transfers (Outflows) $ 3,344,675 $ 3,718,202 2,324,474
Fund Balances, End of Year 373,591
Less Encumbrances Outstanding at June 30, 2004 (1,103,793)
Fund Balances, End of Year Budgetary Basis $ (730,203)
141

142

State of Wisconsin
Notes To Required Supplementary Information
143
NOTE 1. BUDGETARY INFORMATION
A. Budgetary – GAAP Reporting Reconciliation
The accompanying Budgetary Comparison Schedule compares the legally adopted budget (more fully described in RSI Note 1-B) withactual data on a budgetary basis. Because accounting principles applied for purposes of developing data on the budgetary basis differsignificantly from those used to present financial statements in conformity with generally accepted accounting principles (GAAP), areconciliation of basis and perspective differences as of June 30, 2004 is presented below (in thousands):
General FundTransportation
Fund
Fund balance June 30, 2004 (budgetary basis – budgetary fund structure) As reported on the budgetary comparison schedule $ 178,564 $ (730,203)
Reclassifications: To eliminate the effect of encumbrances that were reported as expenditures under budgetary reporting (basis difference) 547,835 1,103,793 To reclassify activities reported in another GAAP fund type (perspective differences): Enterprise funds (except for the University of Wisconsin System) 14,752 -- University of Wisconsin System (236,013) -- Internal service funds (10,650) -- Fiduciary funds (45,894) -- Transportation Revenue Bonds debt service fund -- 1,965
Fund balance June 30, 2004 (GAAP fund structure – budgetary basis, excluding encumbrances treated as expenditures at year end) 448,593 375,556
Adjustments (basis differences): To adjust expenditures for the municipal and county shared revenue program (453,881) -- To adjust expenditures for State property tax credit program (354,704) -- To accrue receivables and establish payables for individual income taxes (net) (742,362) -- To defer revenues for gross receipts public utility taxes (170,157) -- To adjust revenues and expenditures for tax-related items and other tax credit/aid programs (net) (294,597) (9,614) To accrue unpaid Medicaid claims to providers (net of receivable from federal government) (121,119) -- To adjust expenditures/revenues for certain major Health and Family Services and Workforce Development human services payments to local governments (169,151) -- To accrue State educational aids payments deferred until the subsequent year (75,000) -- To adjust revenues and expenditures for other items (net) 1,271 (17,936)
Fund balance June 30, 2004 (GAAP fund structure – GAAP basis) as reported on the governmental fund statements $(1,931,108) $ 348,006
State of Wisconsin Notes to Required Supplementary Information
144
B. Budgetary Basis of Accounting
The State's biennial budget is prepared using a modified cashbasis of accounting. The final budget is primarily a generalpurpose revenue and expenditure budget. General purposerevenues consist of general taxes and miscellaneous receiptswhich are paid into the General Fund, lose their identity, and arethen available for appropriation by the Legislature. The remainingrevenues consist of program revenues, which are credited by lawto an appropriation to finance a specified program or Stateagency, and segregated revenues which are paid into separateidentifiable funds.
While State departments and agencies are required to submitestimates of expected revenues for program revenue andsegregated revenue categories, these estimates are not formallyincorporated into the adopted budget except for revenueestimates of the Lottery Fund. As a result, legally budgetedrevenues for these categories are not available and,consequently, actual amounts are reported in the budget columnof the Budgetary Comparison Schedules.
Expenditure budgeting differs for the various types ofappropriations. For most appropriations, budgeted expendituresequal the amount from the adopted budget plus any subsequentlegislative or administrative revisions. Various supplementalappropriations were approved during the year and have beenincorporated into the budget figures.
While State statutes prohibit spending beyond budgetaryauthority, a provision is made to include the value of accountsreceivable, inventories and work in process in identifying availablerevenues. The State also utilizes nonbudget accounts for whichno budget is established but expenditures may be incurred. As aresult, actual expenditures may exceed budgeted amounts incertain categories.
The budgetary basis of accounting required by State law differsmaterially from the basis used to report revenues andexpenditures in accordance with GAAP. Other variances arisebecause the State's biennial budget is developed according to thestatutory required fund structure which differs extensively from thefund structure used in the GAAP basis financial statements. Thisdifference is primarily caused by the elimination of the Universityof Wisconsin System, and various fiduciary, proprietary and othergovernmental fund activity from the statutory General andTransportation funds. Consequently, a reconciliation betweenbudgetary basis and GAAP basis is provided in Note 1-A of thenotes to the required supplementary information.
The Budgetary Comparison Schedules for the General and theTransportation Fund present both the original and finalappropriated budgets, as well as the actual inflows, outflows, andfund balance on the budgetary basis. The supplementary budgetcomparison schedule provides this same information (with the
exception of the original budget data) for the nonmajorgovernmental funds with annual budgets. The capital project anddebt service funds are excluded from this schedule because nocomprehensive budget is approved for these funds. A specialrevenue fund, the Wisconsin Public Broadcasting Foundation, hasalso been excluded from reporting because it is a blendedcomponent unit that is neither budgeted nor included understatutory reporting. Of the permanent funds, only the HistoricalSociety Fund and a portion of the Common School Fund arebudgeted.
The State’s biennial budget was passed in July 2003. Thislegislation is recognized by State officials as the original budgetand is treated as such on the Budgetary Comparison Schedules.
While the legal level of budgetary control for the reported funds ismaintained at the appropriation line as specified by theLegislature in Chapter 20 of the Wisconsin Statutes, this level ofdetail is impractical for inclusion in the Comprehensive AnnualFinancial Report. Accordingly, a supplementary report isavailable upon request which provides budgetary comparisons atthe legal level of control.
Appropriation unexpended balances lapse at year-end or forwardto the subsequent fiscal year depending on the type ofappropriation involved:
• Continuing - unexpended balances automatically forward to ensuingyears until fully depleted or repealed by subsequent action of theLegislature.
• Annual: General Purpose Revenue - unencumbered balances lapse at year
end. Program Revenue - unexpended cash balances may be forwarded to
the next fiscal year.• Biennial - unexpended balances or deficits automatically forward to the
second year. At the end of the second year all unencumbered generalpurpose revenue balances lapse.
• Sum sufficient - moneys are appropriated and expended in the amountsnecessary to accomplish the purpose specified.
Encumbrances may be carried over to the next fiscal year as arevision to the budgetary appropriation with Department ofAdministration approval. Under budgetary reporting,encumbrances are treated like expenditures and are shown as areduction of fund balance. Under GAAP reporting, encumbrancesoutstanding at year end for purchase orders and contractsexpected to be honored in the following year are reported asreservations of fund balance since they do not constituteexpenditures or liabilities.
Supplementary Information
145

146
State of Wisconsin
Nonmajor Governmental Funds
147
SPECIAL REVENUE: Special revenue funds account for theproceeds of specific revenue sources that are legally restricted toexpenditures for a specified purpose. The State's specialrevenue funds are described below:
The Conservation Fund accounts for the management of theState's fish, wildlife, parks and other natural resources with fundsprovided from hunting and fishing licenses, recreational fees andforestry taxes.
The Heritage State Parks and Forests Fund accounts for thefunding for operations and maintenance of State parks, southernState forests, and recreation areas either by making partialmatching grants to "friends groups" or by accepting expendituretransfers from park and forest programs in the ConservationFund.
The Wisconsin Health Education Loan Repayment Fundaccounts for administrative expenditures related to issuing HealthEducation Loan bonds. These expenditures are funded fromtrustee transfers.
The Waste Management Fund accounts for the closure andlong-term care of approved landfills from fees imposed on landfilloperators.
The Wisconsin Election Campaign Fund accounts for taxpayerdonated funding for political candidates. The donations areintended to replace special interest funds.
The Investment and Local Impact Fund accounts for grants andloans to municipalities where metalliferous minerals exist to offsetthe negative effects of mining projects. These grants and loansare funded with taxes which have been imposed on miningactivities.
The Election Administration Fund accounts for federal andState moneys provided to develop, administer and manage astatewide voter registration system allowing all qualified electors,including those with disabilities, the opportunity to vote whilemaintaining uniform standards within the voting process andsafeguarding the vote of all electors.
The Industrial Building Construction Loan Fund accounts foreconomic development grants and loans for the construction ofindustrial buildings. These grants and loans are funded primarilywith investment income.
The Self-insured Employers Liability Fund establishes areserve to cover claims for employees of employers who havebecome insolvent. These employers were previously determinedto be exempt from the requirement to carry accident or deathinsurance. The reserve is also used to cover the cost ofinsurance carrier or insurance service organization used toprocess, investigate, and pay valid claims from the injuredemployees.
The Medical Assistance Trust Fund accounts for moneysreceived from the Medical Assistance (MA) program viaIntergovernmental Transfers. The moneys are used to fund MAeligible activities.
The Work Injury Supplemental Benefit Fund accounts forcompensatory payments to survivors of fatally injured employeesor disabled employees with work-related injuries. Thiscompensation is provided with funds collected from Stateemployers and insurance carriers.
The Tobacco Control Fund accounts for a portion of the moneysreceived from the settlement of the lawsuit between severalstates, including Wisconsin, and the tobacco companies. Themoneys are used to fund health care related costs includinggrants for tobacco prevention, research, and intervention.
The Uninsured Employers Fund accounts for the administrationof insurance enforcement activities and compensation to injuredemployees of uninsured employers. The revenue is primarilyprovided by funds collected from uninsured employers.
The Utility Public Benefits Fund accounts for voluntarycontributions and public benefits fees collected from customersby utilities to assist in funding low income assistance grants andenergy conservation and efficiency grants.
The Mediation Fund accounts for the resolution of disputesregarding medical malpractice. Dispute filing fees and feescharged to health care providers are the primary revenuesources.
The State Capitol Restoration Fund accounts for moneys fromprivate donations used to offset the costs of restoration work atthe State Capitol.
(Continued)
State of Wisconsin
Nonmajor Governmental Funds
(Continued)
148
The Agricultural Chemical Cleanup Fund accounts for theportion of the costs responsible persons pay to clean up fertilizerand pesticide spills and historical handling areas. Fertilizer andpesticide licenses and registration fees primarily provide therevenue.
The Agrichemical Management Fund accounts for theregulation and enforcement of pesticide, feed and fertilizerindustries. The revenue is generated by licenses and feesassessed to these industries.
The Agricultural Producer Security Fund accounts for theprogram to secure payments to producers. This fund issupported primarily with fees, surcharges, assessments,reimbursements and bond proceeds of surety bonds.
The Historical Legacy Trust Fund accounts for moneys tocommemorate the 200th anniversary of statehood. Gifts, grants,and bequests generate the revenue. Also, all moneys receivedby the State Sesquicentennial Commission after September 30,1998 are reported in this fund.
The History Preservation Partnership Trust Fund accounts formoneys received from admissions, sales, and other receipts ofthe Historical Society. The fund is supported primarily byprogram revenues from daily receipts, site deposits and othergenerated income from goods and services.
The Petroleum Inspection Fund accounts for revenues receivedfrom inspection fees on petroleum products shipped intoWisconsin and proceeds received from revenue bonds. Theseresources are used for petroleum inspection programs,environmental cleanup awards, clean air and water administrationand other environmental programs in the State.
The Environmental Fund accounts for the development andenforcement of groundwater standards, as well as assistance inthe emergency response, investigation and clean up ofcontaminated sites. This assistance is funded by fees onactivities or substances which may contaminate groundwater andfees for solid waste tipping, pesticide licenses and oil inspections.
The Dry Cleaner Environmental Response Fund accounts forthe financial assistance for the remediation of environmentalcontamination caused by the spillage of dry cleaning solvents.Revenues used to fund this program are dry cleaning facilitylicense and solvent fees.
The Recycling Fund accounts for the moneys from the recyclingsurcharge tax and recycling fees, used to reduce the amount ofsolid waste disposed of in landfills and incinerators.
The VendorNet Fund accounts for revenues, primarilysubscription fees from vendors, used to carry out informationtechnology development projects, including paying for costsassociated with technology-related equipment, software andsupport.
The Universal Service Fund accounts for various programs thatensure that all State residents receive essentialtelecommunication services at reasonable prices and that theyhave access to certain advanced telecommunications servicecapabilities. Assessment of entities in the telecommunicationsindustry is the primary source of revenues.
The Budget Stabilization Fund accounts for moneys reserved toprovide State revenue stability during periods of below-normaleconomic activity when actual State revenues are lower thanestimated revenues.
The Wisconsin Public Broadcasting Foundation Fundaccounts for financial resources generated to support theactivities of the Educational Communications Board. The primaryrevenue sources of the fund are from gifts, grants andcontributions.
The Children's Trust Fund accounts for the program whichprovides information and encourages the development of childabuse and neglect prevention programs. This fund is supportedprimarily with investment income and moneys received ascontributions, grants, gifts and bequests.
DEBT SERVICE: Debt service funds account for theaccumulation of resources for, and the payment of, principal,interest and related costs of general long-term obligations.
The Bond Security and Redemption Fund accounts for theaccumulation of resources for, and the payment of principal,interest and related costs of, general obligation bond debt.
The Annual Appropriation Bonds Fund accounts for theaccumulation of resources for, and the payment of principal,interest and related costs of, the appropriation obligations issuedin Fiscal Year 2004 to pay the State’s unfunded accrued priorservice (pension) liability and its unfunded accrued liability forsick leave conversion credits.
(Continued)
State of Wisconsin
Nonmajor Governmental Funds
(Continued)
149
The Badger Tobacco Asset Securitization Fund accounts forthe accumulation of resources for, and the payment of principal,interest and related costs of bonds issued by the Badger TobaccoAsset Securitization Corporation (BTASC) in Fiscal Year 2002 forthe purpose of making a one-time purchase of TobaccoSettlement Revenues (TSRs) from the State. These bonds arerevenue obligations of the BTASC secured by, and payable solelyand only out of, the moneys, assets or revenues pledged by theBTASC.
The Petroleum Inspection Revenue Bonds Fund accounts forthe accumulation of resources for, and the payment of principal,interest and related costs of, petroleum revenue bond obligations.
The Transportation Revenue Bonds Fund accounts for theaccumulation of resources for, and the payment of principal,interest and related costs of, transportation revenue bondobligations.
CAPITAL PROJECTS: Capital projects funds account forfinancial resources used for the acquisition, construction,renovation or repair of major capital facilities (other than thosefinanced by proprietary funds and trust funds). The State's capitalprojects funds are described below:
The Building Trust Fund accounts for repair projects of majorcapital facilities which are funded primarily through General Fundand agency transfers.
The Energy Efficiency Fund accounts for improvements onheating plants and loans to State agencies for energy efficiencyprojects. Revenues are primarily derived from utility rebates,utility matching funds, savings from improvements to heatingcosts and General Fund supported borrowing.
The Capital Improvement Fund accounts for revenues fromgeneral obligation bond proceeds, General Fund transfers andinvestment pool interest earnings which are primarily used for theacquisition or construction of major capital facilities and for repairand maintenance projects.
The Transportation Revenue Bonds Fund accounts for theaccumulation of financing resources for the construction,maintenance, and repair of certain major highway projects andadministrative facilities.
PERMANENT: Permanent funds are used to report resourcesthat are legally restricted to the extent that only earnings, notprincipal, may be used to support the State’s programs.
The Agricultural College Fund accounts for federal land grantrevenues used as public purpose loans for municipalities andschool districts.
The Common School Fund accounts for revenues received fromthe sale of federally granted land, fines and forfeitures from penallaw breaches, and the disposal of escheated property. Thesemoneys are used for public purpose loans to municipalities andschool districts. Earnings of this fund are distributed to aid localschool districts and to cover administrative costs incurred by thePublic Lands Commission.
The Normal School Fund accounts for public purpose loans tomunicipalities and school districts. These loans are financed withrevenues derived from the sale of federally granted land andtimber. The interest generated from this fund is used to supportand maintain State universities.
The University Fund accounts for federal land grant revenuesused for public loans to municipalities and school districts.
The Historical Society Fund accounts for investment incomeand donations received by the Wisconsin Historical Society toassist in the operations of the State's archives, research andlibrary services, museums, historic preservation, and executiveand administrative services.
The Benevolent Fund accounts for investment income used forthe care, custody and education of residents committed to theLincoln Hills School.
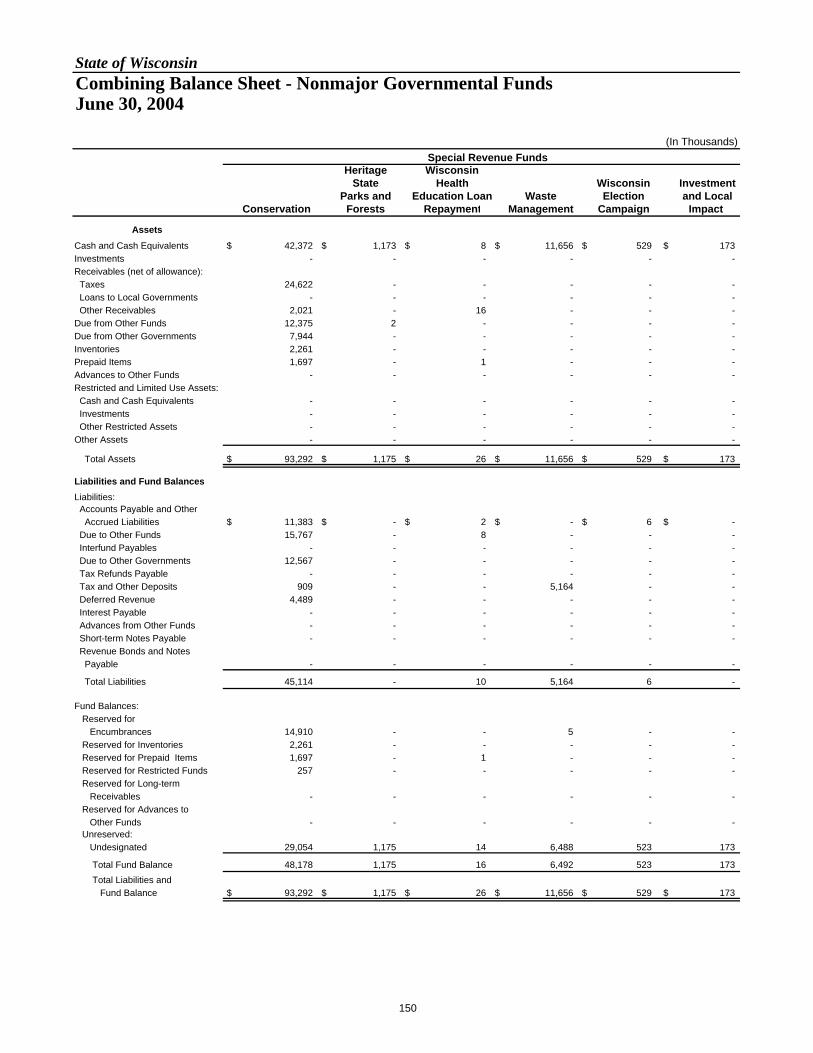
State of WisconsinCombining Balance Sheet - Nonmajor Governmental Funds June 30, 2004
(In Thousands)
Heritage WisconsinState Health Wisconsin Investment
Parks and Education Loan Waste Election and LocalConservation Forests Repayment Management Campaign Impact
Assets Cash and Cash Equivalents $ 42,372 $ 1,173 $ 8 $ 11,656 $ 529 $ 173 Investments - - - - - - Receivables (net of allowance): Taxes 24,622 - - - - - Loans to Local Governments - - - - - - Other Receivables 2,021 - 16 - - - Due from Other Funds 12,375 2 - - - - Due from Other Governments 7,944 - - - - - Inventories 2,261 - - - - - Prepaid Items 1,697 - 1 - - - Advances to Other Funds - - - - - - Restricted and Limited Use Assets: Cash and Cash Equivalents - - - - - - Investments - - - - - - Other Restricted Assets - - - - - - Other Assets - - - - - -
Total Assets $ 93,292 $ 1,175 $ 26 $ 11,656 $ 529 $ 173
Liabilities and Fund Balances Liabilities: Accounts Payable and Other Accrued Liabilities $ 11,383 $ - $ 2 $ - $ 6 $ - Due to Other Funds 15,767 - 8 - - - Interfund Payables - - - - - - Due to Other Governments 12,567 - - - - - Tax Refunds Payable - - - - - - Tax and Other Deposits 909 - - 5,164 - - Deferred Revenue 4,489 - - - - - Interest Payable - - - - - - Advances from Other Funds - - - - - - Short-term Notes Payable - - - - - - Revenue Bonds and Notes Payable - - - - - -
Total Liabilities 45,114 - 10 5,164 6 -
Fund Balances: Reserved for Encumbrances 14,910 - - 5 - - Reserved for Inventories 2,261 - - - - - Reserved for Prepaid Items 1,697 - 1 - - - Reserved for Restricted Funds 257 - - - - - Reserved for Long-term Receivables - - - - - - Reserved for Advances to Other Funds - - - - - - Unreserved: Undesignated 29,054 1,175 14 6,488 523 173
Total Fund Balance 48,178 1,175 16 6,492 523 173 Total Liabilities and Fund Balance $ 93,292 $ 1,175 $ 26 $ 11,656 $ 529 $ 173
Special Revenue Funds
150
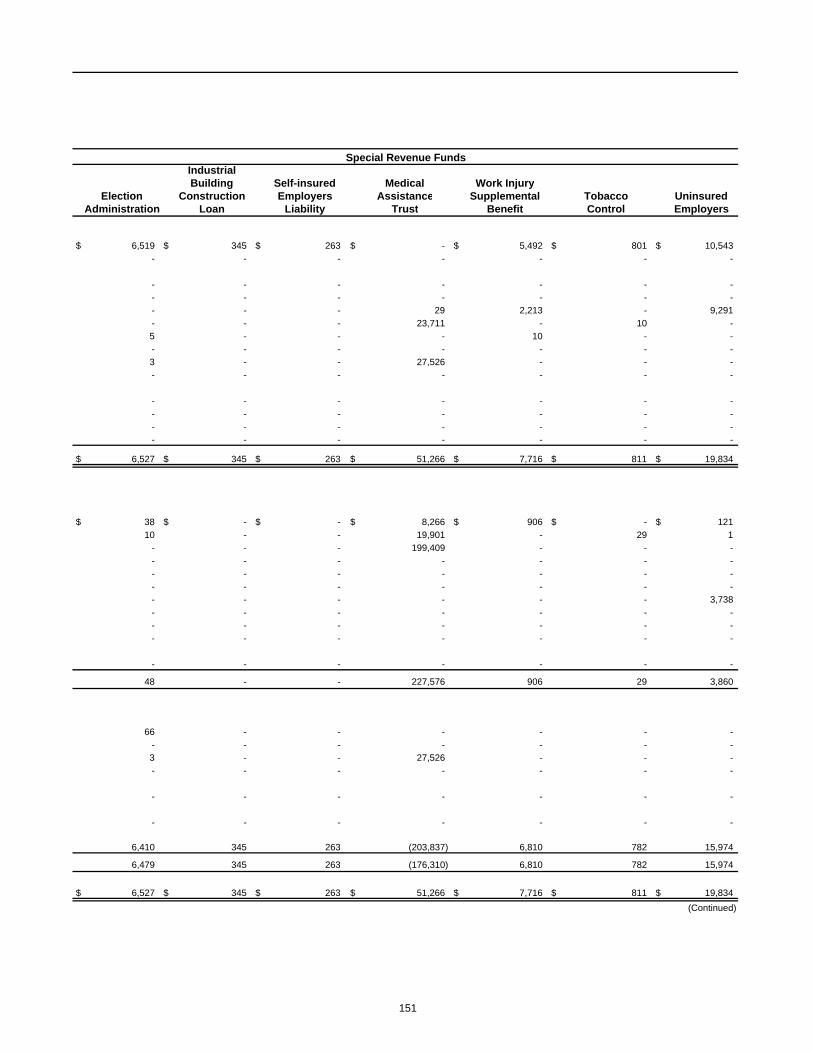
IndustrialBuilding Self-insured Medical Work Injury
Election Construction Employers Assistance Supplemental Tobacco UninsuredAdministration Loan Liability Trust Benefit Control Employers
$ 6,519 $ 345 $ 263 $ - $ 5,492 $ 801 $ 10,543 - - - - - - -
- - - - - - - - - - - - - - - - - 29 2,213 - 9,291 - - - 23,711 - 10 - 5 - - - 10 - - - - - - - - - 3 - - 27,526 - - - - - - - - - -
- - - - - - - - - - - - - - - - - - - - - - - - - - - -
$ 6,527 $ 345 $ 263 $ 51,266 $ 7,716 $ 811 $ 19,834
$ 38 $ - $ - $ 8,266 $ 906 $ - $ 121 10 - - 19,901 - 29 1
- - - 199,409 - - - - - - - - - - - - - - - - - - - - - - - - - - - - - - 3,738 - - - - - - - - - - - - - - - - - - - - -
- - - - - - -
48 - - 227,576 906 29 3,860
66 - - - - - - - - - - - - - 3 - - 27,526 - - - - - - - - - -
- - - - - - -
- - - - - - -
6,410 345 263 (203,837) 6,810 782 15,974
6,479 345 263 (176,310) 6,810 782 15,974
$ 6,527 $ 345 $ 263 $ 51,266 $ 7,716 $ 811 $ 19,834(Continued)
Special Revenue Funds
151

State of WisconsinCombining Balance Sheet - Nonmajor Governmental Funds June 30, 2004
(Continued)
Utility State Agricultural AgriculturalPublic Capitol Chemical Agrichemical Producer
Benefits Mediation Restoration Cleanup Management Security
Assets Cash and Cash Equivalents $ 32,124 $ 6 $ 5 $ 581 $ 3,220 $ 4,929 Investments - - - - - - Receivables (net of allowance): Taxes - - - - - - Loans to Local Governments - - - - - - Other Receivables 3,384 - - - 1 3 Due from Other Funds 385 73 - 3 46 46 Due from Other Governments - - - - - - Inventories - - - - 20 - Prepaid Items 5 6 - - 37 9 Advances to Other Funds - - - - 750 - Restricted and Limited Use Assets: Cash and Cash Equivalents - - - - - - Investments - - - - - - Other Restricted Assets - - - - - - Other Assets - - - - - -
Total Assets $ 35,899 $ 85 $ 5 $ 584 $ 4,073 $ 4,987
Liabilities and Fund Balances Liabilities: Accounts Payable and Other Accrued Liabilities $ 4,600 $ 14 $ - $ - $ 126 $ 37 Due to Other Funds 83 8 - - 1,497 30 Interfund Payables - - - - - - Due to Other Governments 256 - - - - - Tax Refunds Payable - - - - - - Tax and Other Deposits - - - - - - Deferred Revenue 389 - - - - - Interest Payable - - - - - - Advances from Other Funds - - - - - 750 Short-term Notes Payable - - - - - - Revenue Bonds and Notes Payable - - - - - -
Total Liabilities 5,327 22 - - 1,623 817
Fund Balances: Reserved for Encumbrances 1,092 - - - 24 - Reserved for Inventories - - - - 20 - Reserved for Prepaid Items 5 6 - - 37 9 Reserved for Restricted Funds - - - - - - Reserved for Long-term Receivables - - - - - - Reserved for Advances to Other Funds - - - - 750 - Unreserved: Undesignated 29,474 57 5 584 1,620 4,160
Total Fund Balance 30,571 63 5 584 2,451 4,170 Total Liabilities and Fund Balance $ 35,899 $ 85 $ 5 $ 584 $ 4,073 $ 4,987
Special Revenue Funds
152

HistoryHistorical Preservation Dry Cleaner
Legacy Partnership Petroleum EnvironmentalTrust Trust Inspection Environmental Response Recycling VendorNet
$ 61 $ 349 $ 50,582 $ 27,817 $ 2,848 $ 7,651 $ - - - - - - - -
- - - - - 1,390 - - - - - - - - - 89 2,672 3,374 36 5,330 - - 279 13,612 6,079 29 5,128 20 - - - 594 - 871 - - - - 4 - - - - 14 119 170 - 13,192 - - - - - - - -
- - - - - - - - - - - - - - - - - - - - - - - - - - - -
$ 61 $ 730 $ 66,986 $ 38,038 $ 2,914 $ 33,561 $ 20
$ - $ 220 $ 83,733 $ 1,666 $ 783 $ 127 $ - - 127 23,260 3,528 25 7,174 20 - - - - - - - - - 327 3,599 - 31 - - - - - - 391 - - - - - - - - - - - - - - - - - - - - - - - - - - - - 2,964 - - 142,300 - - - -
- - - - - - -
- 347 249,620 8,793 808 7,722 2,984
- 11 137 12,148 - 453 - - - - 4 - - - - 14 119 170 - 13,192 - - - - - - - -
- - - - - - -
- - - - - - -
61 358 (182,891) 16,922 2,105 12,194 (2,964)
61 383 (182,634) 29,245 2,106 25,839 (2,964)
$ 61 $ 730 $ 66,986 $ 38,038 $ 2,914 $ 33,561 $ 20(Continued)
153
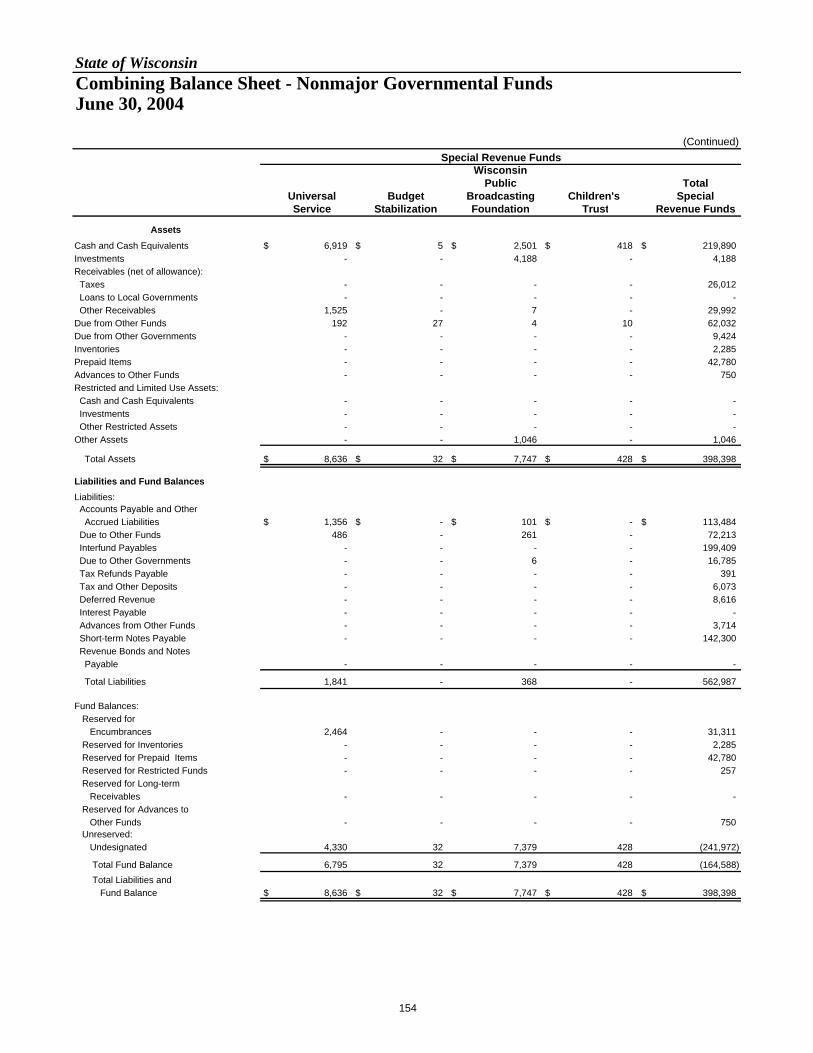
State of Wisconsin
Combining Balance Sheet - Nonmajor Governmental Funds June 30, 2004
(Continued)
WisconsinPublic Total
Universal Budget Broadcasting Children's SpecialService Stabilization Foundation Trust Revenue Funds
Assets Cash and Cash Equivalents $ 6,919 $ 5 $ 2,501 $ 418 $ 219,890 Investments - - 4,188 - 4,188 Receivables (net of allowance): Taxes - - - - 26,012 Loans to Local Governments - - - - - Other Receivables 1,525 - 7 - 29,992 Due from Other Funds 192 27 4 10 62,032 Due from Other Governments - - - - 9,424 Inventories - - - - 2,285 Prepaid Items - - - - 42,780 Advances to Other Funds - - - - 750 Restricted and Limited Use Assets: Cash and Cash Equivalents - - - - - Investments - - - - - Other Restricted Assets - - - - - Other Assets - - 1,046 - 1,046
Total Assets $ 8,636 $ 32 $ 7,747 $ 428 $ 398,398
Liabilities and Fund Balances Liabilities: Accounts Payable and Other Accrued Liabilities $ 1,356 $ - $ 101 $ - $ 113,484 Due to Other Funds 486 - 261 - 72,213 Interfund Payables - - - - 199,409 Due to Other Governments - - 6 - 16,785 Tax Refunds Payable - - - - 391 Tax and Other Deposits - - - - 6,073 Deferred Revenue - - - - 8,616 Interest Payable - - - - - Advances from Other Funds - - - - 3,714 Short-term Notes Payable - - - - 142,300 Revenue Bonds and Notes Payable - - - - -
Total Liabilities 1,841 - 368 - 562,987
Fund Balances: Reserved for Encumbrances 2,464 - - - 31,311 Reserved for Inventories - - - - 2,285 Reserved for Prepaid Items - - - - 42,780 Reserved for Restricted Funds - - - - 257 Reserved for Long-term Receivables - - - - - Reserved for Advances to Other Funds - - - - 750 Unreserved: Undesignated 4,330 32 7,379 428 (241,972)
Total Fund Balance 6,795 32 7,379 428 (164,588) Total Liabilities and Fund Balance $ 8,636 $ 32 $ 7,747 $ 428 $ 398,398
Special Revenue Funds
154

BadgerBond Annual Tobacco Petroleum Transportation Total
Security and Appropriation Asset Inspection Revenue Debt ServiceRedemption Bonds Securitization Revenue Bonds Bonds Funds
$ 45,088 $ - $ - $ 18,676 $ - $ 63,763 - - - 4,095 - 4,095
- - - - - - - - - - - - - - 54,816 1 - 54,817
2,519 - - - - 2,519 - - - - - - - - - - - - - - 207 - - 207 - - - - - -
- - 137,438 - 21,774 159,212 - 248,562 137,135 - 93,205 478,901 - - 119 - 847 966 - - - - - -
$ 47,607 $ 248,562 $ 329,715 $ 22,771 $ 115,825 $ 764,480
$ - $ - $ - $ - $ - $ - 8,633 - - - 9 8,642
- - - - - - - - - - - - - - - - - - - - - - - - - - 54,837 - - 54,837 - - - 5,616 36,138 41,754 - - - - - - - - - - - -
- - - 12,735 57,885 70,620
8,633 - 54,837 18,351 94,032 175,853
- - - - - - - - - - - - - - 207 - - 207 - - 273,933 - - 273,933
- - - - - -
- - - - - -
38,974 248,562 738 4,420 21,793 314,488
38,974 248,562 274,878 4,420 21,793 588,627
$ 47,607 $ 248,562 $ 329,715 $ 22,771 $ 115,825 $ 764,480(Continued)
Debt Service Funds
155
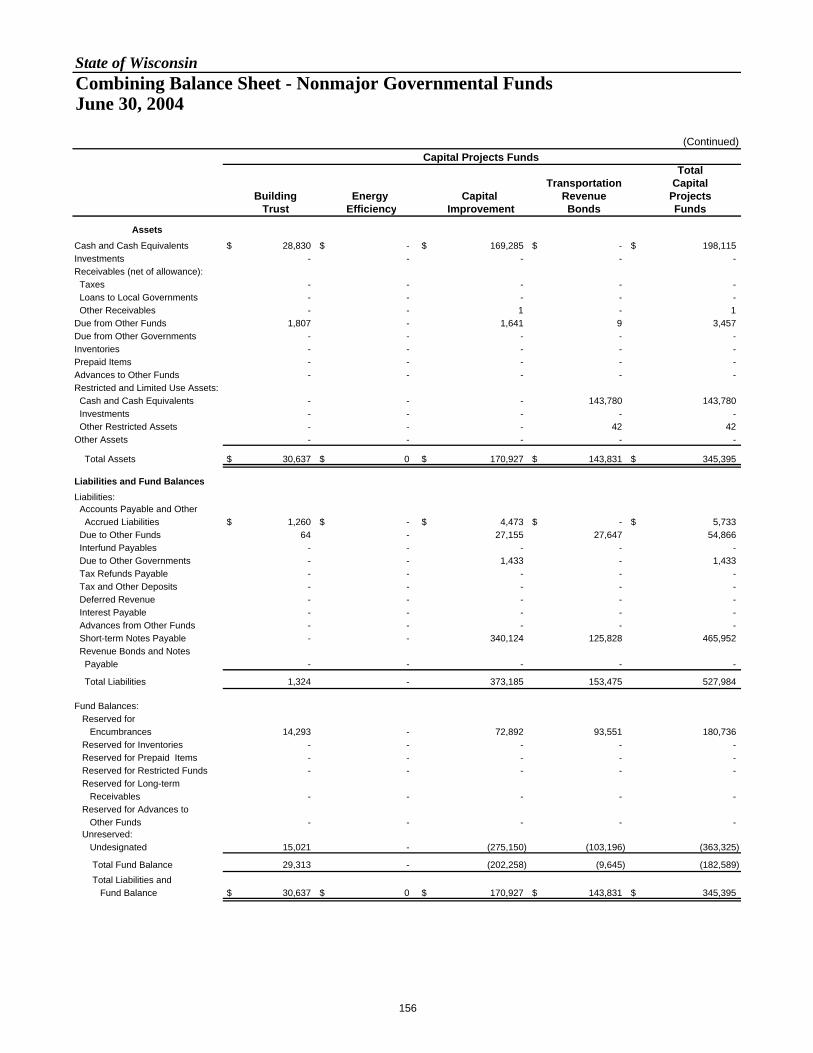
State of Wisconsin
Combining Balance Sheet - Nonmajor Governmental Funds June 30, 2004
(Continued)Capital Projects Funds
TotalTransportation Capital
Building Energy Capital Revenue ProjectsTrust Efficiency Improvement Bonds Funds
Assets Cash and Cash Equivalents $ 28,830 $ - $ 169,285 $ - $ 198,115 Investments - - - - - Receivables (net of allowance): Taxes - - - - - Loans to Local Governments - - - - - Other Receivables - - 1 - 1 Due from Other Funds 1,807 - 1,641 9 3,457 Due from Other Governments - - - - - Inventories - - - - - Prepaid Items - - - - - Advances to Other Funds - - - - - Restricted and Limited Use Assets: Cash and Cash Equivalents - - - 143,780 143,780 Investments - - - - - Other Restricted Assets - - - 42 42 Other Assets - - - - -
Total Assets $ 30,637 $ 0 $ 170,927 $ 143,831 $ 345,395
Liabilities and Fund Balances Liabilities: Accounts Payable and Other Accrued Liabilities $ 1,260 $ - $ 4,473 $ - $ 5,733 Due to Other Funds 64 - 27,155 27,647 54,866 Interfund Payables - - - - - Due to Other Governments - - 1,433 - 1,433 Tax Refunds Payable - - - - - Tax and Other Deposits - - - - - Deferred Revenue - - - - - Interest Payable - - - - - Advances from Other Funds - - - - - Short-term Notes Payable - - 340,124 125,828 465,952 Revenue Bonds and Notes Payable - - - - -
Total Liabilities 1,324 - 373,185 153,475 527,984
Fund Balances: Reserved for Encumbrances 14,293 - 72,892 93,551 180,736 Reserved for Inventories - - - - - Reserved for Prepaid Items - - - - - Reserved for Restricted Funds - - - - - Reserved for Long-term Receivables - - - - - Reserved for Advances to Other Funds - - - - - Unreserved: Undesignated 15,021 - (275,150) (103,196) (363,325)
Total Fund Balance 29,313 - (202,258) (9,645) (182,589) Total Liabilities and Fund Balance $ 30,637 $ 0 $ 170,927 $ 143,831 $ 345,395
156
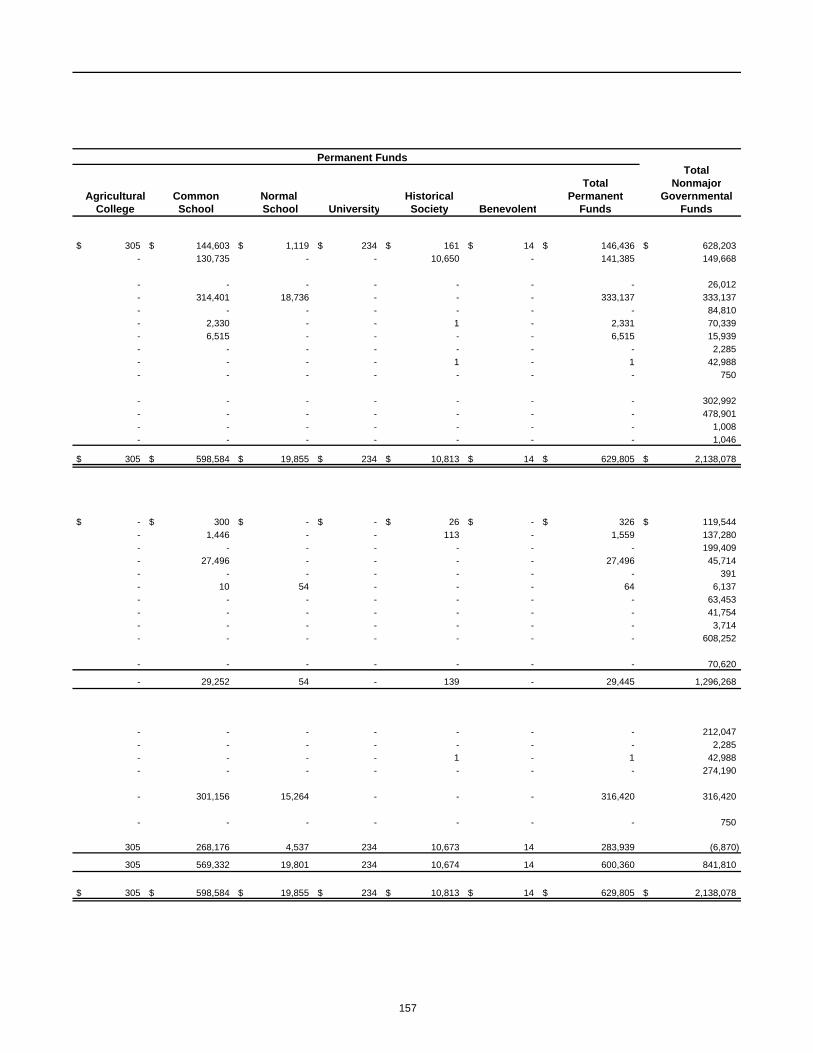
TotalTotal Nonmajor
Agricultural Common Normal Historical Permanent GovernmentalCollege School School University Society Benevolent Funds Funds
$ 305 $ 144,603 $ 1,119 $ 234 $ 161 $ 14 $ 146,436 $ 628,203- 130,735 - - 10,650 - 141,385 149,668
- - - - - - - 26,012- 314,401 18,736 - - - 333,137 333,137- - - - - - - 84,810- 2,330 - - 1 - 2,331 70,339- 6,515 - - - - 6,515 15,939- - - - - - - 2,285- - - - 1 - 1 42,988- - - - - - - 750
- - - - - - - 302,992- - - - - - - 478,901- - - - - - - 1,008- - - - - - - 1,046
$ 305 $ 598,584 $ 19,855 $ 234 $ 10,813 $ 14 $ 629,805 $ 2,138,078
$ - $ 300 $ - $ - $ 26 $ - $ 326 $ 119,544- 1,446 - - 113 - 1,559 137,280- - - - - - - 199,409- 27,496 - - - - 27,496 45,714- - - - - - - 391- 10 54 - - - 64 6,137- - - - - - - 63,453- - - - - - - 41,754- - - - - - - 3,714- - - - - - - 608,252
- - - - - - - 70,620
- 29,252 54 - 139 - 29,445 1,296,268
- - - - - - - 212,047- - - - - - - 2,285- - - - 1 - 1 42,988- - - - - - - 274,190
- 301,156 15,264 - - - 316,420 316,420
- - - - - - - 750
305 268,176 4,537 234 10,673 14 283,939 (6,870)
305 569,332 19,801 234 10,674 14 600,360 841,810
$ 305 $ 598,584 $ 19,855 $ 234 $ 10,813 $ 14 $ 629,805 $ 2,138,078
Permanent Funds
157
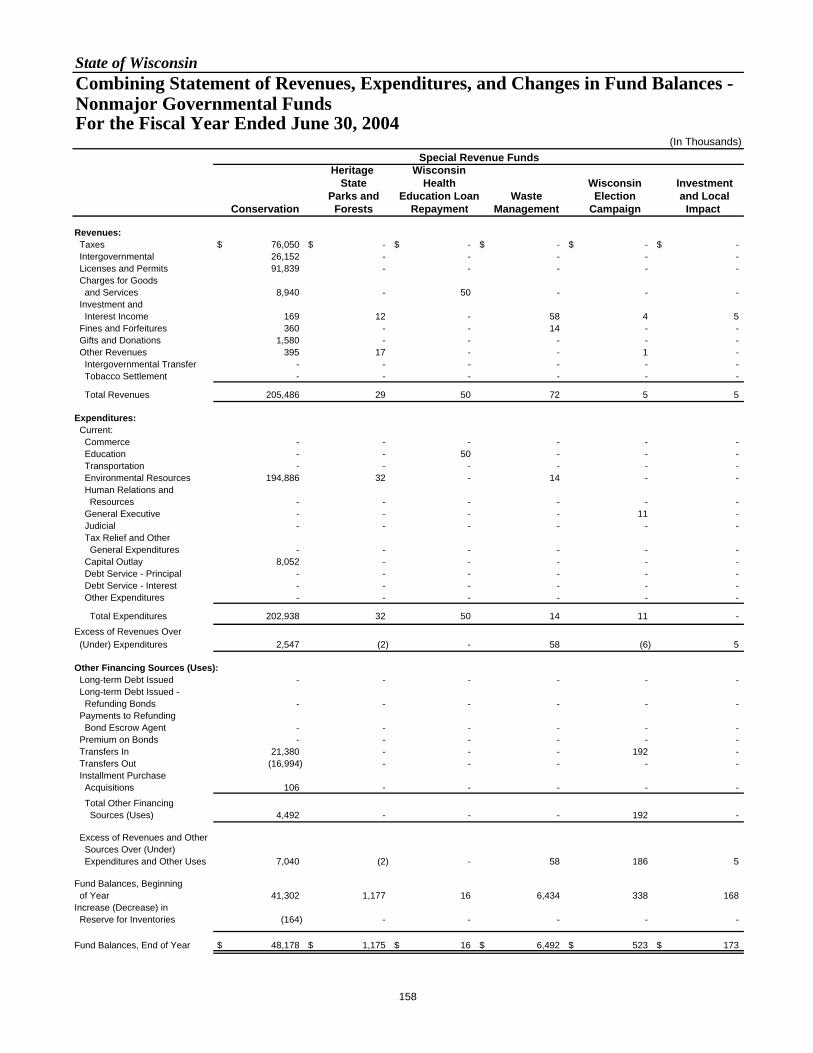
State of WisconsinCombining Statement of Revenues, Expenditures, and Changes in Fund Balances - Nonmajor Governmental Funds For the Fiscal Year Ended June 30, 2004
(In Thousands)
Heritage WisconsinState Health Wisconsin Investment
Parks and Education Loan Waste Election and LocalConservation Forests Repayment Management Campaign Impact
Revenues: Taxes $ 76,050 $ - $ - $ - $ - $ - Intergovernmental 26,152 - - - - - Licenses and Permits 91,839 - - - - - Charges for Goods and Services 8,940 - 50 - - - Investment and Interest Income 169 12 - 58 4 5 Fines and Forfeitures 360 - - 14 - - Gifts and Donations 1,580 - - - - - Other Revenues 395 17 - - 1 - Intergovernmental Transfer - - - - - - Tobacco Settlement - - - - - -
Total Revenues 205,486 29 50 72 5 5
Expenditures: Current: Commerce - - - - - - Education - - 50 - - - Transportation - - - - - - Environmental Resources 194,886 32 - 14 - - Human Relations and Resources - - - - - - General Executive - - - - 11 - Judicial - - - - - - Tax Relief and Other General Expenditures - - - - - - Capital Outlay 8,052 - - - - - Debt Service - Principal - - - - - - Debt Service - Interest - - - - - - Other Expenditures - - - - - -
Total Expenditures 202,938 32 50 14 11 - Excess of Revenues Over (Under) Expenditures 2,547 (2) - 58 (6) 5
Other Financing Sources (Uses): Long-term Debt Issued - - - - - - Long-term Debt Issued - Refunding Bonds - - - - - - Payments to Refunding Bond Escrow Agent - - - - - - Premium on Bonds - - - - - - Transfers In 21,380 - - - 192 - Transfers Out (16,994) - - - - - Installment Purchase Acquisitions 106 - - - - - Total Other Financing Sources (Uses) 4,492 - - - 192 -
Excess of Revenues and Other Sources Over (Under) Expenditures and Other Uses 7,040 (2) - 58 186 5
Fund Balances, Beginning of Year 41,302 1,177 16 6,434 338 168 Increase (Decrease) in Reserve for Inventories (164) - - - - -
Fund Balances, End of Year $ 48,178 $ 1,175 $ 16 $ 6,492 $ 523 $ 173
Special Revenue Funds
158
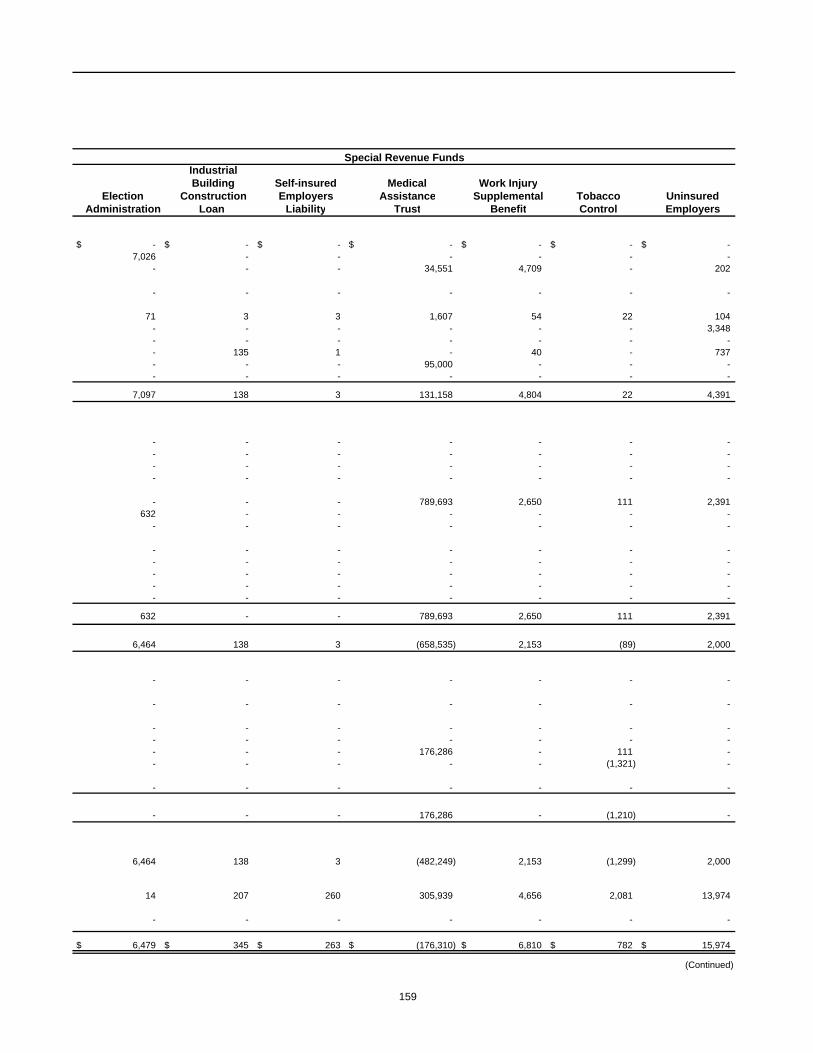
IndustrialBuilding Self-insured Medical Work Injury
Election Construction Employers Assistance Supplemental Tobacco UninsuredAdministration Loan Liability Trust Benefit Control Employers
$ - $ - $ - $ - $ - $ - $ - 7,026 - - - - - -
- - - 34,551 4,709 - 202
- - - - - - -
71 3 3 1,607 54 22 104 - - - - - - 3,348 - - - - - - - - 135 1 - 40 - 737 - - - 95,000 - - - - - - - - - -
7,097 138 3 131,158 4,804 22 4,391
- - - - - - - - - - - - - - - - - - - - - - - - - - - -
- - - 789,693 2,650 111 2,391 632 - - - - - -
- - - - - - -
- - - - - - - - - - - - - - - - - - - - - - - - - - - - - - - - - - -
632 - - 789,693 2,650 111 2,391
6,464 138 3 (658,535) 2,153 (89) 2,000
- - - - - - -
- - - - - - -
- - - - - - - - - - - - - - - - - 176,286 - 111 - - - - - - (1,321) -
- - - - - - -
- - - 176,286 - (1,210) -
6,464 138 3 (482,249) 2,153 (1,299) 2,000
14 207 260 305,939 4,656 2,081 13,974
- - - - - - -
$ 6,479 $ 345 $ 263 $ (176,310) $ 6,810 $ 782 $ 15,974
(Continued)
Special Revenue Funds
159

State of WisconsinCombining Statement of Revenues, Expenditures, and Changes in Fund Balances - Nonmajor Governmental Funds For the Fiscal Year Ended June 30, 2004
(Continued)
Utility State Agricultural AgriculturalPublic Capitol Chemical Agrichemical Producer
Benefits Mediation Restoration Cleanup Management Security
Revenues: Taxes $ - $ 73 $ - $ - $ - $ - Intergovernmental - - - - - - Licenses and Permits 108,474 211 - 2,963 5,740 2,072 Charges for Goods and Services - - - - - 53 Investment and Interest Income 281 1 - 21 18 46 Fines and Forfeitures - - - - - 28 Gifts and Donations 2 - - - - - Other Revenues - 1 5 - 3 7 Intergovernmental Transfer - - - - - - Tobacco Settlement - - - - - -
Total Revenues 108,757 286 5 2,984 5,760 2,206
Expenditures: Current: Commerce - - - 2,600 5,368 911 Education - - - - - - Transportation - - - - - - Environmental Resources - - - - - - Human Relations and Resources - - - - - - General Executive 84,849 - - - - - Judicial - 357 - - - - Tax Relief and Other General Expenditures - - - - - - Capital Outlay - - - - - - Debt Service - Principal - - - - - - Debt Service - Interest - - - - - - Other Expenditures - - - - - -
Total Expenditures 84,849 357 - 2,600 5,368 911 Excess of Revenues Over (Under) Expenditures 23,909 (71) 5 384 393 1,296
Other Financing Sources (Uses): Long-term Debt Issued - - - - - - Long-term Debt Issued - Refunding Bonds - - - - - - Payments to Refunding Bond Escrow Agent - - - - - - Premium on Bonds - - - - - - Transfers In - - - - - - Transfers Out (17,614) (3) - - (173) (11) Installment Purchase Acquisitions - - - - - - Total Other Financing Sources (Uses) (17,614) (3) - - (173) (11)
Excess of Revenues and Other Sources Over (Under) Expenditures and Other Uses 6,294 (74) 5 384 220 1,284
Fund Balances, Beginning of Year 24,277 137 - 200 2,231 2,885 Increase (Decrease) in Reserve for Inventories - - - - - -
Fund Balances, End of Year $ 30,571 $ 63 $ 5 $ 584 $ 2,451 $ 4,170
Special Revenue Funds
160

HistoryHistorical Preservation Dry Cleaner
Legacy Partnership Petroleum Environmental Trust Trust Inspection Environmental Response Recycling VendorNet
$ - $ - $ 96,499 $ - $ - $ 18,094 $ - - - - 1,633 - - - - - 91 22,471 1,013 22,199 -
- 1,335 41 1 - - -
1 - 170 334 31 123 - - - - 4,319 - - - - - - - - - - - - 8 18 - 28 20 - - - - - - - - - - - - - -
1 1,335 96,810 28,775 1,044 40,443 20
- - - - - - - - 1,249 - - - - - - - - - - - - - - 44,384 31,908 1,541 29,205 -
- - - - - - - - - - - - - - - - - - - - -
- - - - - - - - - 153 3,215 - 12 - - - - - - - - - - 1,368 - - - - - - - - - - -
- 1,249 45,906 35,123 1,541 29,217 -
1 86 50,904 (6,348) (496) 11,226 20
- - 45,000 - - - -
- - - - - -
- - - - - - - - 1,337 - - - - - 300 - 12,643 - - - - (3) (23,029) (4,552) (5) (7,794) -
- - - 19 - - -
- 297 23,309 8,110 (5) (7,794) -
1 383 74,213 1,763 (501) 3,432 20
61 - (256,847) 27,481 2,607 22,407 (2,984)
- - - 1 - - -
$ 61 $ 383 $ (182,634) $ 29,245 $ 2,106 $ 25,839 $ (2,964)
(Continued)
Special Revenue Funds
161

State of WisconsinCombining Statement of Revenues, Expenditures, and Changes in Fund Balances - Nonmajor Governmental Funds For the Fiscal Year Ended June 30, 2004
(Continued)
Wisconsin Total Public Special
Universal Budget Broadcasting Children's RevenueService Stabilization Foundation Trust Funds
Revenues: Taxes $ - $ - $ - $ - $ 190,716 Intergovernmental - - - - 34,811 Licenses and Permits 25,562 - - - 322,097 Charges for Goods and Services - - 43 - 10,463 Investment and Interest Income 39 - 739 3 3,918 Fines and Forfeitures - - - - 8,068 Gifts and Donations - 1 8,978 151 10,712 Other Revenues - 28 - - 1,444 Intergovernmental Transfer - - - - 95,000 Tobacco Settlement - - - - -
Total Revenues 25,601 30 9,760 155 677,231
Expenditures: Current: Commerce 22,172 - - - 31,051 Education - - 1,635 - 2,935 Transportation - - - - - Environmental Resources - - - - 301,969 Human Relations and Resources - - - 33 794,879 General Executive - - - - 85,492 Judicial - - - - 357 Tax Relief and Other General Expenditures - - - - - Capital Outlay - - - - 11,432 Debt Service - Principal - - - - - Debt Service - Interest - - - - 1,368 Other Expenditures - - - - -
Total Expenditures 22,172 - 1,635 33 1,229,483 Excess of Revenues Over (Under) Expenditures 3,429 30 8,124 122 (552,251)
Other Financing Sources (Uses): Long-term Debt Issued - - - - 45,000 Long-term Debt Issued - Refunding Bonds - - - - - Payments to Refunding Bond Escrow Agent - - - - - Premium on Bonds - - - - 1,337 Transfers In - - - 1 210,913 Transfers Out (829) - (6,059) - (78,388) Installment Purchase Acquisitions - - - - 125 Total Other Financing Sources (Uses) (829) - (6,059) 1 178,988
Excess of Revenues and Other Sources Over (Under) Expenditures and Other Uses 2,600 30 2,066 123 (373,264)
Fund Balances, Beginning of Year 4,195 3 5,313 305 208,838 Increase (Decrease) in Reserve for Inventories - - - - (163)
Fund Balances, End of Year $ 6,795 $ 32 $ 7,379 $ 428 $ (164,588)
Special Revenue Funds
162
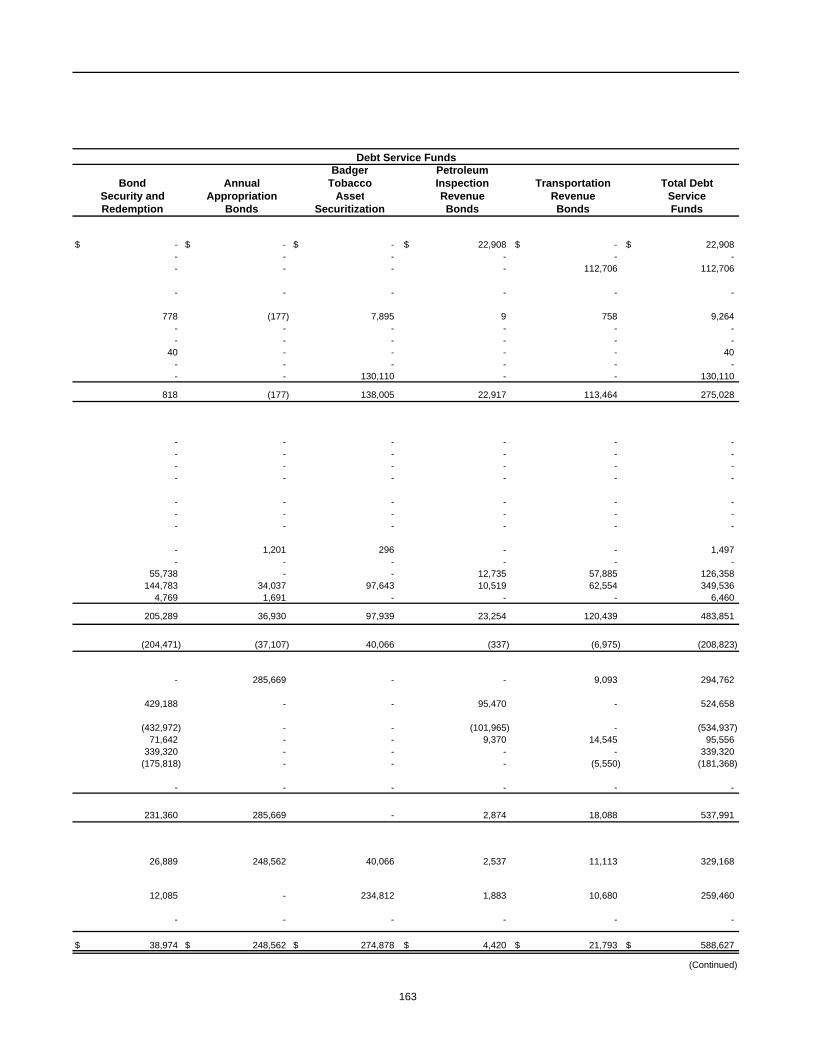
Badger PetroleumBond Annual Tobacco Inspection Transportation Total Debt
Security and Appropriation Asset Revenue Revenue ServiceRedemption Bonds Securitization Bonds Bonds Funds
$ - $ - $ - $ 22,908 $ - $ 22,908 - - - - - - - - - - 112,706 112,706
- - - - - -
778 (177) 7,895 9 758 9,264 - - - - - - - - - - - -
40 - - - - 40 - - - - - - - - 130,110 - - 130,110
818 (177) 138,005 22,917 113,464 275,028
- - - - - - - - - - - - - - - - - - - - - - - -
- - - - - - - - - - - - - - - - - -
- 1,201 296 - - 1,497 - - - - - -
55,738 - - 12,735 57,885 126,358 144,783 34,037 97,643 10,519 62,554 349,536
4,769 1,691 - - - 6,460
205,289 36,930 97,939 23,254 120,439 483,851
(204,471) (37,107) 40,066 (337) (6,975) (208,823)
- 285,669 - - 9,093 294,762
429,188 - - 95,470 - 524,658
(432,972) - - (101,965) - (534,937) 71,642 - - 9,370 14,545 95,556
339,320 - - - - 339,320 (175,818) - - - (5,550) (181,368)
- - - - - -
231,360 285,669 - 2,874 18,088 537,991
26,889 248,562 40,066 2,537 11,113 329,168
12,085 - 234,812 1,883 10,680 259,460
- - - - - -
$ 38,974 $ 248,562 $ 274,878 $ 4,420 $ 21,793 $ 588,627
(Continued)
Debt Service Funds
163
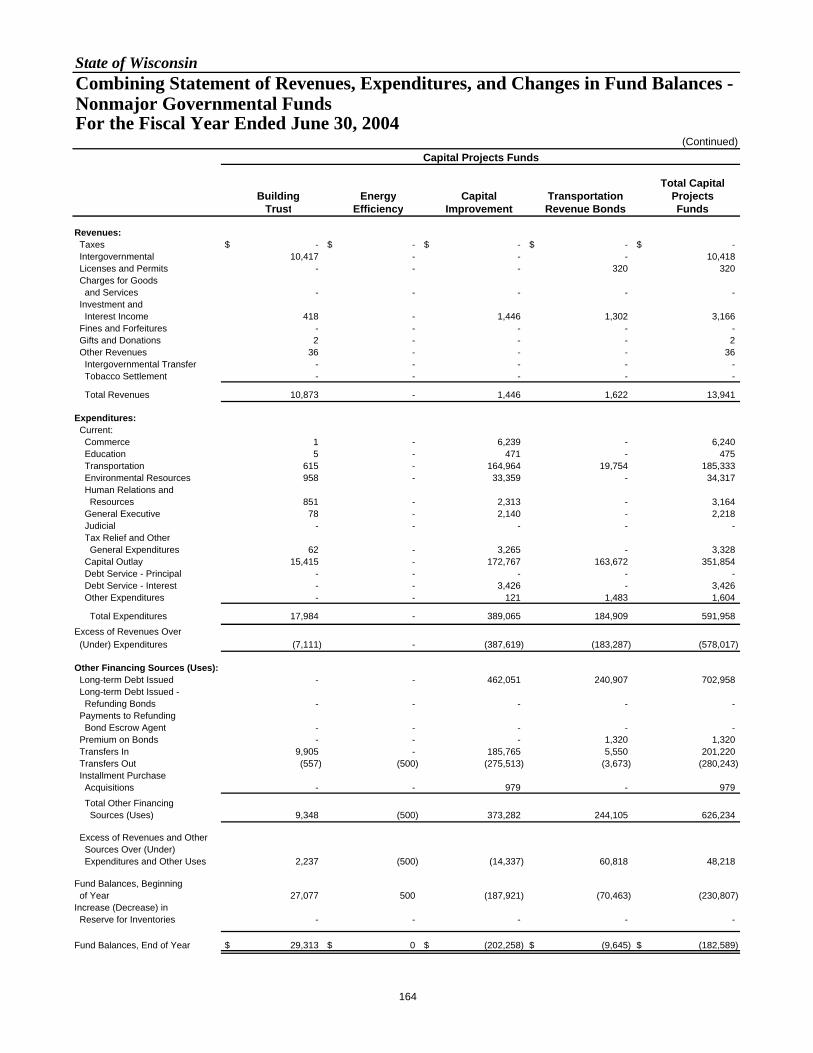
State of WisconsinCombining Statement of Revenues, Expenditures, and Changes in Fund Balances - Nonmajor Governmental Funds For the Fiscal Year Ended June 30, 2004
(Continued)
Total CapitalBuilding Energy Capital Transportation Projects
Trust Efficiency Improvement Revenue Bonds Funds
Revenues: Taxes $ - $ - $ - $ - $ - Intergovernmental 10,417 - - - 10,418 Licenses and Permits - - - 320 320 Charges for Goods and Services - - - - - Investment and Interest Income 418 - 1,446 1,302 3,166 Fines and Forfeitures - - - - - Gifts and Donations 2 - - - 2 Other Revenues 36 - - - 36 Intergovernmental Transfer - - - - - Tobacco Settlement - - - - -
Total Revenues 10,873 - 1,446 1,622 13,941
Expenditures: Current: Commerce 1 - 6,239 - 6,240 Education 5 - 471 - 475 Transportation 615 - 164,964 19,754 185,333 Environmental Resources 958 - 33,359 - 34,317 Human Relations and Resources 851 - 2,313 - 3,164 General Executive 78 - 2,140 - 2,218 Judicial - - - - - Tax Relief and Other General Expenditures 62 - 3,265 - 3,328 Capital Outlay 15,415 - 172,767 163,672 351,854 Debt Service - Principal - - - - - Debt Service - Interest - - 3,426 - 3,426 Other Expenditures - - 121 1,483 1,604
Total Expenditures 17,984 - 389,065 184,909 591,958 Excess of Revenues Over (Under) Expenditures (7,111) - (387,619) (183,287) (578,017)
Other Financing Sources (Uses): Long-term Debt Issued - - 462,051 240,907 702,958 Long-term Debt Issued - Refunding Bonds - - - - - Payments to Refunding Bond Escrow Agent - - - - - Premium on Bonds - - - 1,320 1,320 Transfers In 9,905 - 185,765 5,550 201,220 Transfers Out (557) (500) (275,513) (3,673) (280,243) Installment Purchase Acquisitions - - 979 - 979 Total Other Financing Sources (Uses) 9,348 (500) 373,282 244,105 626,234
Excess of Revenues and Other Sources Over (Under) Expenditures and Other Uses 2,237 (500) (14,337) 60,818 48,218
Fund Balances, Beginning of Year 27,077 500 (187,921) (70,463) (230,807) Increase (Decrease) in Reserve for Inventories - - - - -
Fund Balances, End of Year $ 29,313 $ 0 $ (202,258) $ (9,645) $ (182,589)
Capital Projects Funds
164
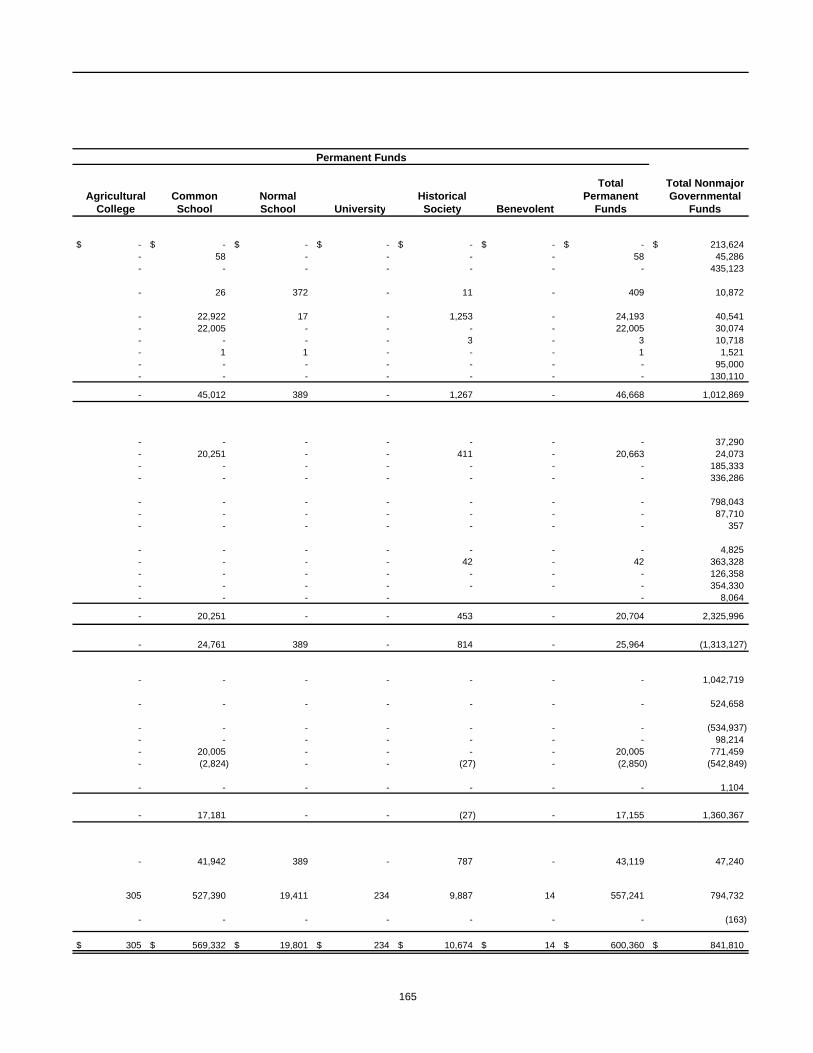
Total Total NonmajorAgricultural Common Normal Historical Permanent Governmental
College School School University Society Benevolent Funds Funds
$ - $ - $ - $ - $ - $ - $ - $ 213,624- 58 - - - - 58 45,286- - - - - - - 435,123
- 26 372 - 11 - 409 10,872
- 22,922 17 - 1,253 - 24,193 40,541- 22,005 - - - - 22,005 30,074- - - - 3 - 3 10,718- 1 1 - - - 1 1,521- - - - - - - 95,000- - - - - - - 130,110
- 45,012 389 - 1,267 - 46,668 1,012,869
- - - - - - - 37,290- 20,251 - - 411 - 20,663 24,073- - - - - - - 185,333- - - - - - - 336,286
- - - - - - - 798,043- - - - - - - 87,710- - - - - - - 357
- - - - - - - 4,825- - - - 42 - 42 363,328- - - - - - - 126,358- - - - - - - 354,330- - - - - 8,064
- 20,251 - - 453 - 20,704 2,325,996
- 24,761 389 - 814 - 25,964 (1,313,127)
- - - - - - - 1,042,719
- - - - - - - 524,658
- - - - - - - (534,937)- - - - - - - 98,214- 20,005 - - - - 20,005 771,459- (2,824) - - (27) - (2,850) (542,849)
- - - - - - - 1,104
- 17,181 - - (27) - 17,155 1,360,367
- 41,942 389 - 787 - 43,119 47,240
305 527,390 19,411 234 9,887 14 557,241 794,732
- - - - - - - (163)
$ 305 $ 569,332 $ 19,801 $ 234 $ 10,674 $ 14 $ 600,360 $ 841,810
Permanent Funds
165

State of WisconsinBudgetary Comparison Schedule Nonmajor Budgeted Governmental Funds For the Fiscal Year Ended June 30, 2004
(In Thousands)
Budget Actual Budget Actual Budget Actual
Unexpended Budgetary Fund Balance, Beginning of Year $ 50,172 $ 1,177 $ 16
Revenues (Inflows):
Taxes $ 76,800 76,800 $ - - $ - - Budgeted Transfers from: General Fund - - - - - - Departmental 157,275 157,275 29 29 50 50
Total Revenues 234,075 234,075 29 29 50 50
Amounts Available for Appropriation 284,247 1,206 66
Appropriations and Transfers (Outflows):
Commerce 1,781 1,491 - - - - Education 974 325 - - 77 51 Environmental Resources 295,842 228,446 32 32 - - Human Relations and Resources 319 239 - - - - General Executive - - - - - - Judicial - - - - - - Tax Relief and Other General 26 26 - - - - Budgeted Transfers to: General Fund 56 56 - - - -
Total Appropriations and Transfers $ 298,998 230,583 $ 32 32 $ 77 51
Fund Balances End of Year 53,664 1,175 16
Less Encumbrances Outstanding at June 30, 2004 (25,628) - -
Fund Balances, End of Year Budgetary Basis $ 28,036 $ 1,175 $ 16
Wisconsin Health
ConservationHeritage State
Parks and ForestsEducation
Loan Repayment
Special Revenue
166

Wisconsin Investment IndustrialElection and Local Election Building
Campaign Impact Construction LoanBudget Actual Budget Actual Budget Actual Budget Actual Budget Actual
$ 6,448 $ 343 $ 168 $ 14 $ 207
$ - - $ - - $ - - $ - - $ - -
- - - - - - - - - - 70 70 197 197 5 5 7,097 7,097 138 138
70 70 197 197 5 5 7,097 7,097 138 138
6,518 540 173 7,111 345
- - - - - - - - - - - - - - - - - - - -
27 14 - - - - - - - -
- - - - - - - - - - - - 100 11 - - 1,142 632 - - - - - - - - - - - - - - - - - - - - - -
- - - - - - - - - -
$ 27 14 $ 100 11 $ - - $ 1,142 632 $ - -
6,504 529 173 6,479 345
(5) - - (66) -
$ 6,500 $ 529 $ 173 $ 6,413 $ 345
(Continued)
Special Revenue
ManagementWaste
Administration
167
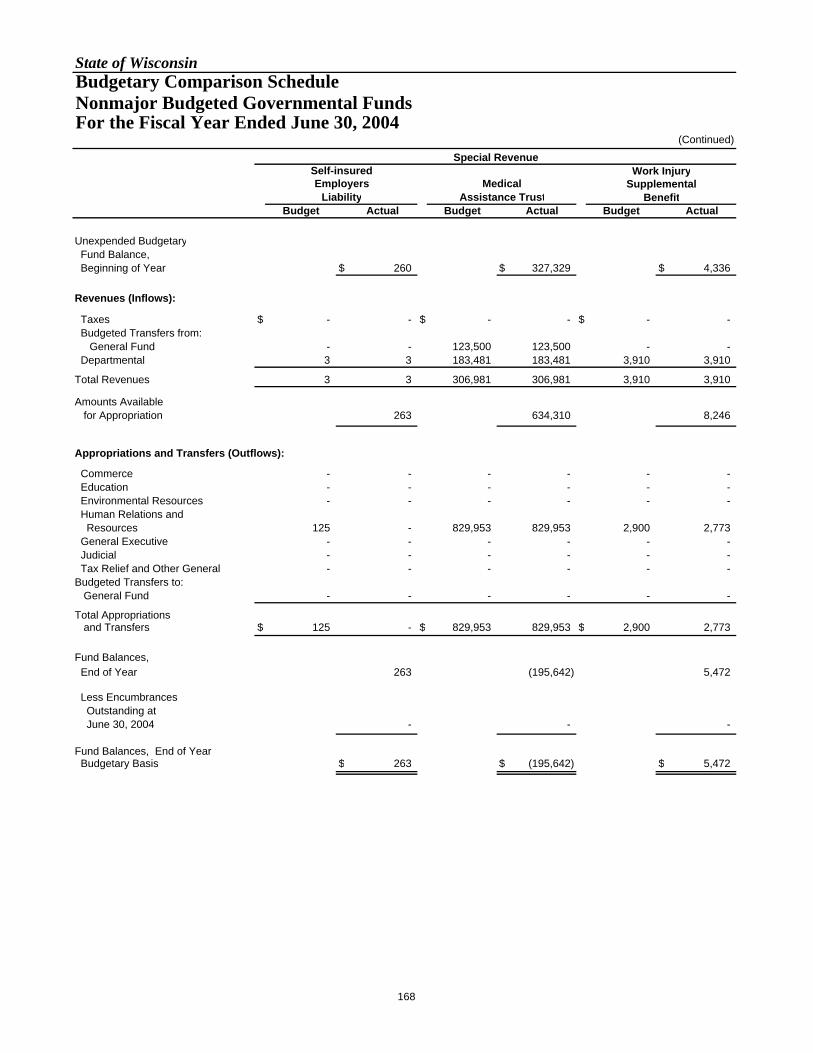
State of WisconsinBudgetary Comparison Schedule Nonmajor Budgeted Governmental Funds For the Fiscal Year Ended June 30, 2004
(Continued)
Self-insuredEmployers Medical
Liability Assistance TrustBudget Actual Budget Actual Budget Actual
Unexpended Budgetary Fund Balance, Beginning of Year $ 260 $ 327,329 $ 4,336
Revenues (Inflows):
Taxes $ - - $ - - $ - - Budgeted Transfers from: General Fund - - 123,500 123,500 - - Departmental 3 3 183,481 183,481 3,910 3,910
Total Revenues 3 3 306,981 306,981 3,910 3,910
Amounts Available for Appropriation 263 634,310 8,246
Appropriations and Transfers (Outflows):
Commerce - - - - - - Education - - - - - - Environmental Resources - - - - - - Human Relations and Resources 125 - 829,953 829,953 2,900 2,773 General Executive - - - - - - Judicial - - - - - - Tax Relief and Other General - - - - - - Budgeted Transfers to: General Fund - - - - - -
Total Appropriations and Transfers $ 125 - $ 829,953 829,953 $ 2,900 2,773
Fund Balances, End of Year 263 (195,642) 5,472
Less Encumbrances Outstanding at June 30, 2004 - - -
Fund Balances, End of Year Budgetary Basis $ 263 $ (195,642) $ 5,472
Work InjurySupplemental
Special Revenue
Benefit
168
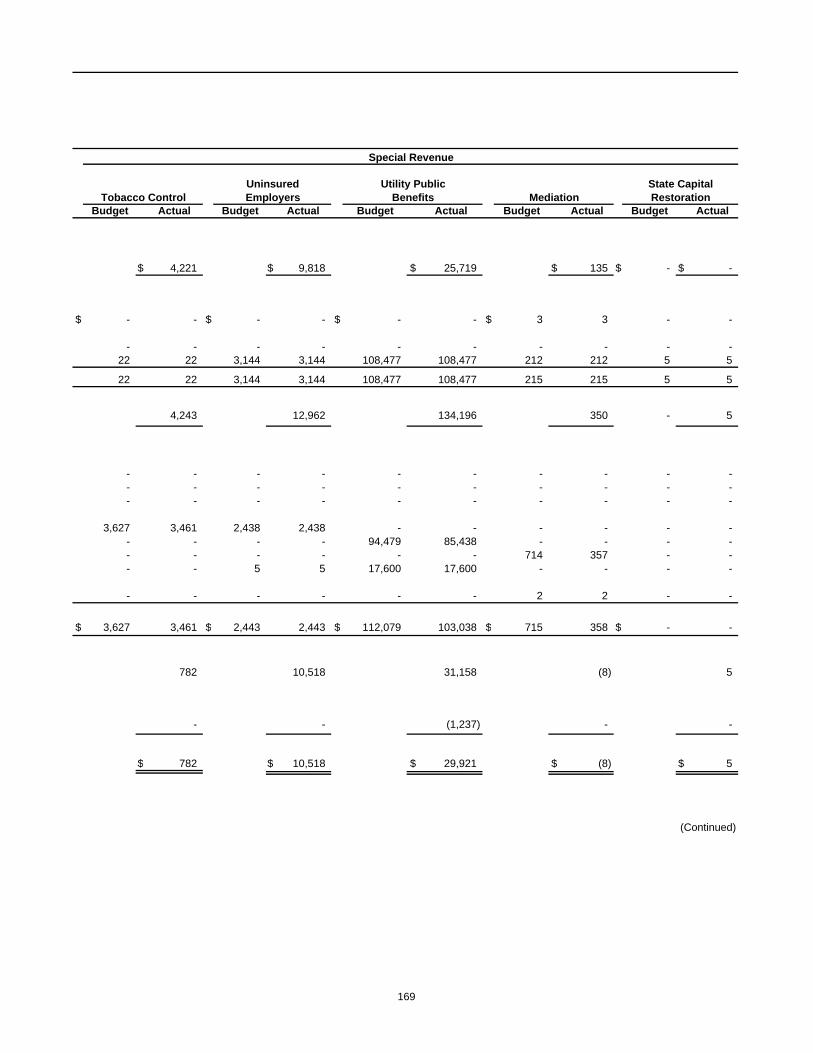
Budget Actual Budget Actual Budget Actual Budget Actual Budget Actual
$ 4,221 $ 9,818 $ 25,719 $ 135 $ - $ -
$ - - $ - - $ - - $ 3 3 - -
- - - - - - - - - - 22 22 3,144 3,144 108,477 108,477 212 212 5 5
22 22 3,144 3,144 108,477 108,477 215 215 5 5
4,243 12,962 134,196 350 - 5
- - - - - - - - - - - - - - - - - - - - - - - - - - - - - -
3,627 3,461 2,438 2,438 - - - - - - - - - - 94,479 85,438 - - - - - - - - - - 714 357 - - - - 5 5 17,600 17,600 - - - -
- - - - - - 2 2 - -
$ 3,627 3,461 $ 2,443 2,443 $ 112,079 103,038 $ 715 358 $ - -
782 10,518 31,158 (8) 5
- - (1,237) - -
$ 782 $ 10,518 $ 29,921 $ (8) $ 5
(Continued)
Special Revenue
UninsuredEmployersTobacco Control Benefits RestorationMediation
Utility Public State Capital
169

State of WisconsinBudgetary Comparison Schedule Nonmajor Budgeted Governmental Funds For the Fiscal Year Ended June 30, 2004
(Continued)
AgriculturalAgrichemical ProducerManagement Security
Budget Actual Budget Actual Budget Actual
Unexpended Budgetary Fund Balance, Beginning of Year $ 200 $ 2,224 $ 2,805
Revenues (Inflows):
Taxes $ - - $ - - $ - - Budgeted Transfers from: General Fund - - - - - - Departmental 2,984 2,984 5,760 5,760 2,284 2,284
Total Revenues 2,984 2,984 5,760 5,760 2,284 2,284
Amounts Available for Appropriation 3,184 7,984 5,089
Appropriations and Transfers (Outflows):
Commerce 6,372 2,600 5,551 5,399 1,082 922 Education - - - - - - Environmental Resources - - - - - - Human Relations and Resources - - - - - - General Executive - - - - - - Judicial - - - - - - Tax Relief and Other General - - - - - - Budgeted Transfers to: General Fund - - 116 116 - -
Total Appropriations and Transfers $ 6,372 2,600 $ 5,667 5,515 $ 1,082 922
Fund Balances End of Year 584 2,469 4,167
Less Encumbrances Outstanding at June 30, 2004 - (24) -
Fund Balances, End of Year Budgetary Basis $ 584 $ 2,444 $ 4,167
Special RevenueAgricultural
CleanupChemical
170
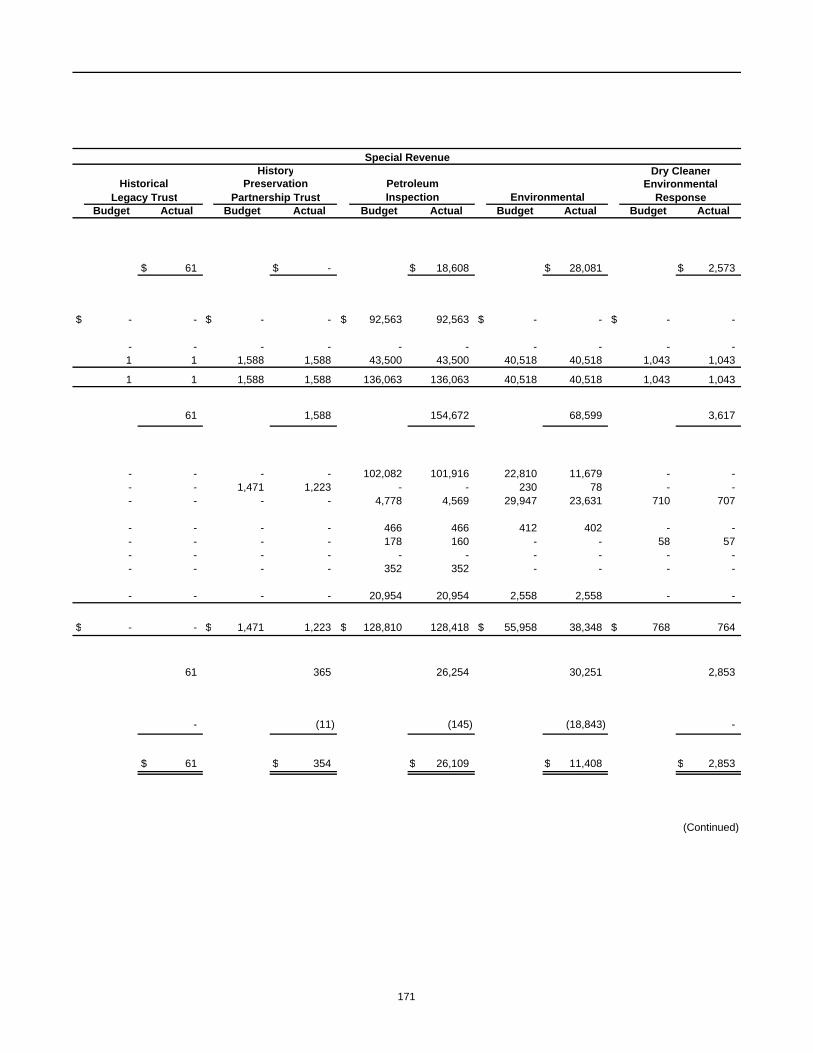
HistoryHistorical Preservation Petroleum
Inspection EnvironmentalBudget Actual Budget Actual Budget Actual Budget Actual Budget Actual
$ 61 $ - $ 18,608 $ 28,081 $ 2,573
$ - - $ - - $ 92,563 92,563 $ - - $ - -
- - - - - - - - - - 1 1 1,588 1,588 43,500 43,500 40,518 40,518 1,043 1,043
1 1 1,588 1,588 136,063 136,063 40,518 40,518 1,043 1,043
61 1,588 154,672 68,599 3,617
- - - - 102,082 101,916 22,810 11,679 - - - - 1,471 1,223 - - 230 78 - - - - - - 4,778 4,569 29,947 23,631 710 707
- - - - 466 466 412 402 - - - - - - 178 160 - - 58 57 - - - - - - - - - - - - - - 352 352 - - - -
- - - - 20,954 20,954 2,558 2,558 - -
$ - - $ 1,471 1,223 $ 128,810 128,418 $ 55,958 38,348 $ 768 764
61 365 26,254 30,251 2,853
- (11) (145) (18,843) -
$ 61 $ 354 $ 26,109 $ 11,408 $ 2,853
(Continued)
Special Revenue
Partnership TrustLegacy Trust
Dry Cleaner
ResponseEnvironmental
171

State of WisconsinBudgetary Comparison Schedule Nonmajor Budgeted Governmental Funds For the Fiscal Year Ended June 30, 2004
(Continued)
RecyclingBudget Actual Budget Actual Budget Actual
Unexpended Budgetary Fund Balance, Beginning of Year $ 3,565 $ (2,984) $ 1,767
Revenues (Inflows):
Taxes 25,543 25,543 $ - - $ - - Budgeted Transfers from: General Fund - - - - - - Departmental 20,050 20,050 20 20 26,491 26,491
Total Revenues 45,593 45,593 20 20 26,491 26,491
Amounts Available for Appropriation 49,158 (2,964) 28,259
Appropriations and Transfers (Outflows):
Commerce 710 523 - - 5,671 4,837 Education 492 486 - - 5,054 4,759 Environmental Resources 29,822 28,229 - - - - Human Relations and Resources 307 307 - - - - General Executive 253 201 90 - 12,687 12,687 Judicial - - - - - - Tax Relief and Other General 2 2 - - - - Budgeted Transfers to: General Fund 7,274 7,274 - - - -
Total Appropriations and Transfers 38,860 37,020 $ 90 - $ 23,411 22,282
Fund Balances, End of Year 12,137 (2,964) 5,977
Less Encumbrances Outstanding at June 30, 2004 (453) - (834)
Fund Balances, End of Year Budgetary Basis $ 11,684 $ (2,964) $ 5,142
Special Revenue
UniversalVendorNet Service
172
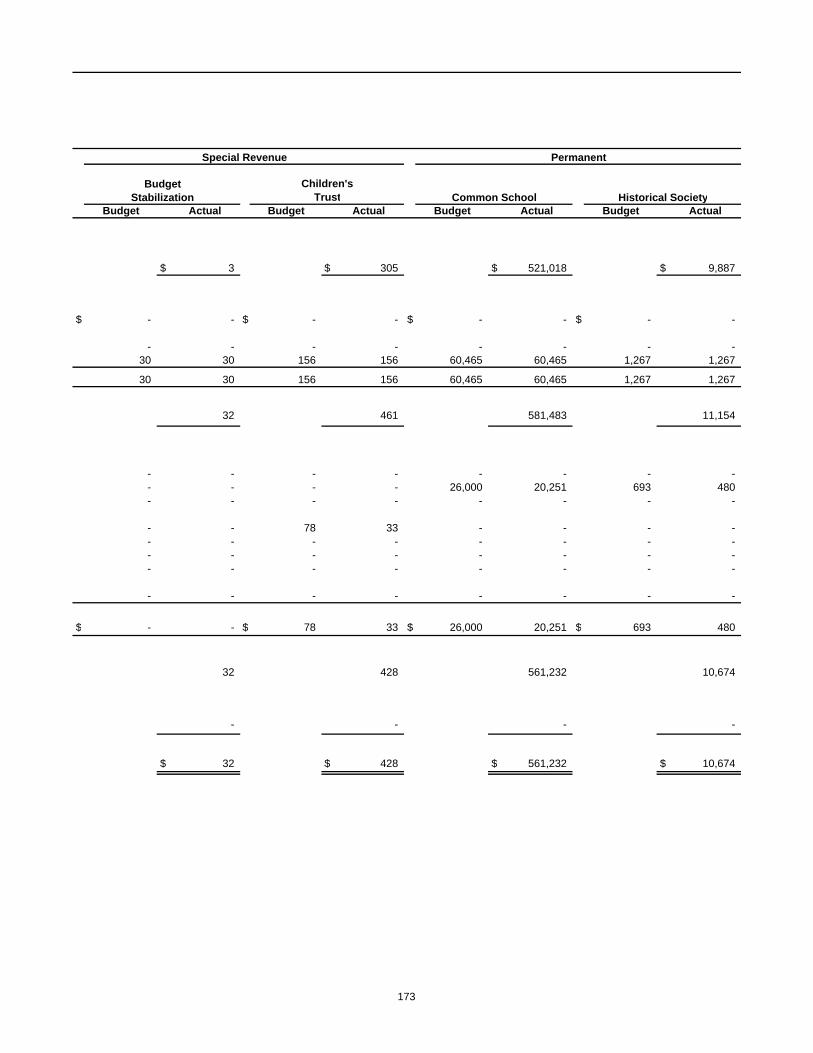
Children'sTrust
Budget Actual Budget Actual Budget Actual Budget Actual
$ 3 $ 305 $ 521,018 $ 9,887
$ - - $ - - $ - - $ - -
- - - - - - - - 30 30 156 156 60,465 60,465 1,267 1,267
30 30 156 156 60,465 60,465 1,267 1,267
32 461 581,483 11,154
- - - - - - - - - - - - 26,000 20,251 693 480 - - - - - - - -
- - 78 33 - - - - - - - - - - - - - - - - - - - - - - - - - - - -
- - - - - - - -
$ - - $ 78 33 $ 26,000 20,251 $ 693 480
32 428 561,232 10,674
- - - -
$ 32 $ 428 $ 561,232 $ 10,674
Historical SocietyCommon SchoolStabilization
PermanentSpecial Revenue
Budget
173

174
State of Wisconsin
Nonmajor Enterprise Funds
175
ENTERPRISE: Enterprise funds account for business-like Stateactivities that provide goods and/or services to the public and arefinanced primarily through user charges. The State's enterprisefunds are described below:
The State Fair Park Fund accounts for the annual State Fair,and various year round major sports events, agricultural andindustrial expositions, and other programs of civic interest. Itsrevenues are derived from admissions, fees, rents and sales, withno contributions from the State.
The Homes For Veterans Fund accounts for nursing home andassisted living facilities for veterans and their spouses. The costsassociated with providing this care are funded by private paycharges, the U.S. Department of Veterans Affairs and MedicalAssistance.
The Mendota Mental Health Institute Fund and the WinnebagoMental Health Institute Fund account for the diagnosis, careand treatment of individuals with mental and emotionaldisturbances. The services are provided with funds collectedfrom third parties and contributions from the State.
The Northern Developmental Disabilities Center Fund, theCentral Developmental Disabilities Center Fund and theSouthern Developmental Disabilities Center Fund account forservices provided to developmentally disabled citizens with thegoal of ultimately returning such persons to the community ifpossible. These services are provided with funds collected fromthird parties and contributions from the State.
The Institutional Farm Operations Fund accounts for therevenues and expenses associated with employing inmates inagricultural and other work activities. The associated costs arefunded from farm product sales and a General Fund supplement.
The Correctional Canteen Operations Fund accounts for theprogram which provides goods for the education, recreation, andconvenience of inmates. Charges made to inmates are theprimary source of funds for these activities.
The Lottery Fund accounts for State managed lottery activitiesused to provide property tax relief to taxpayers. Revenues, whichare derived from ticket sales, are used to pay winners,commissions to retailers, operating expenses and property taxrelief.
The Health Insurance Risk Sharing Plan Fund provides majormedical and Medicare supplemental coverage for residents whoare unable to obtain health insurance coverage in the privatemarket. This service is funded by premiums paid by insureds ofthe Plan, assessments of health insurers doing business in the
State, reduction of health care provider payments, and generalpurpose revenue from the State.
The Local Government Property Insurance Fund accounts forproperty insurance coverage provided to local governments. Thisinsurance is financed with premiums collected from policyholdersand income on investments.
The State Life Insurance Fund accounts for the program toprovide State sponsored life insurance to residents in a mannerconsistent with private insurers. This insurance is financed withpremiums collected from policyholders and investment earnings.
The Income Continuation Insurance Fund accounts for long-term and short-term disability benefits (up to 75 percent of grosssalary) for employees of the State and of participating local publicemployers and operates on a self-insured basis. This fund alsoaccounts for the collection of contributions and investment activityproviding funding for the benefits.
The Duty Disability Fund accounts for the compensation ofprotective category employees of the State Retirement Systemfor duty-related disabilities, as well as the collection ofcontributions and investment activity providing funding for thebenefits.
The Long-term Disability Insurance Fund accounts for long-term disability benefits paid to State Retirement Systemparticipants, as well as the collection of contributions andinvestment activity providing funding for the benefits.
The Health Insurance Fund accounts for group health insuranceplans provided on a self-insured, fee for service basis or prepaidbasis to current and retired employees of the State and ofparticipating local public employers.
The Veterans Trust Fund accounts for various programs forveterans, including loans and grants to individuals andorganizations and the operations of the State Veterans Museum.Revenues to finance this program are primarily derived fromveteran loan payments and investment income.
The Wisconsin Education Revenue Bonds Fund accounts forbond proceeds to provide health education loans to fulltimemedical and dental students at qualifying universities or colleges.
The Transportation Infrastructure Loan Fund accounts for thedevelopment of innovative financing mechanisms that will moreeffectively use federal financial transportation resources. FederalHighway Administration funds, and interest from the fund balanceand from loan recipients, are the primary revenues for this fund.

State of WisconsinCombining Balance Sheet - Nonmajor Enterprise Funds June 30, 2004
(In Thousands)
Mendota Winnebago NorthernMental Mental Developmental
State Fair Homes for Health Health DisabilitiesPark Veterans Institute Institute Center
AssetsCurrent Assets: Cash and Cash Equivalents $ 61 $ 5,432 $ 3,801 $ 191 $ 258 Investments - - - 6 - Receivables (net of allowance): Loans Receivable - - - - - Other Receivables 2,593 6,148 5,446 5,651 2,971 Due from Other Funds 1 15 1,906 711 2,584 Due from Other Governments - 3,036 - - - Inventories 44 1,085 341 471 93 Prepaid Items 1,452 591 536 582 610 Total Current Assets 4,151 16,308 12,030 7,612 6,517
Noncurrent Assets: Investments - - - - - Receivables (net of allowance): Loans Receivable - - - - - Deferred Charges 191 19 - - - Capital Assets (net of accumulated depreciation) 39,404 26,712 17,542 13,515 6,171 Nondepreciable Capital Assets 23,161 4,884 787 880 73 Other Assets - - - - - Total Noncurrent Assets 62,755 31,615 18,328 14,395 6,244 Total Assets $ 66,906 $ 47,923 $ 30,358 $ 22,008 $ 12,761
LiabilitiesCurrent Liabilities: Accounts Payable and Other Accrued Liabilities $ 1,676 $ 2,116 $ 2,133 $ 1,948 $ 753 Due to Other Funds 1,047 6,391 5,252 5,868 5,744 Interfund Payables 5,721 - - - - Due to Other Governments - 134 69 39 - Tax and Other Deposits 75 30 - - - Deferred Revenue 3,899 - 11 - - Interest Payable 302 31 - - - Short-term Notes Payable 1,321 269 - - - Current Portion of Long-term Liabilities: Future Benefits and Loss Liabilities - - - - - Compensated Absences 80 578 741 605 270 Capital Leases 71 - 39 34 - General Obligation Bonds Payable 1,664 161 - - -
Total Current Liabilities 15,854 9,711 8,246 8,495 6,768
Noncurrent Liabilities: Accounts Payable and Other Accrued Liabilities - - - - - Noncurrent Portion of Long-term Liabilities: Future Benefits and Loss Liabilities - - - - - Compensated Absences 57 488 961 768 360 Capital Leases 9 - 426 453 - General Obligation Bonds Payable 34,628 3,838 - - - Total Noncurrent Liabilities 34,694 4,326 1,388 1,221 360 Total Liabilities 50,548 14,036 9,634 9,716 7,128
Fund EquityInvested in Capital Assets, Net of Related Debt 25,063 27,347 17,863 13,908 6,244 Restricted for Future Benefits - - - - - Restricted for Other Purposes - - - - - Unrestricted (8,705) 6,539 2,862 (1,616) (611)
Total Fund Equity 16,358 33,887 20,724 12,292 5,633
Total Liabilities and Fund Equity $ 66,906 $ 47,923 $ 30,358 $ 22,008 $ 12,761
176

Central Southern LocalDevelopmental Developmental Institutional Correctional Health Government
Disabilities Disabilities Farm Canteen Insurance Risk PropertyCenter Center Operations Operations Lottery Sharing Plan Insurance
$ 4,559 $ 4,454 $ - $ 1,204 $ 36,970 $ 49,825 $ 24,113 - - - - 16,384 - -
- - - - - - - 4,037 2,270 602 191 5,578 1,222 3,090
130 428 28 - 1,958 743 - - - - - - - 1,063
240 271 2,311 1,024 1,218 - - 686 522 8 17 29,377 31 -
9,652 7,945 2,950 2,437 91,486 51,820 28,266
- - - - 112,020 - 8,105
- - - - - - - - - - - - - -
11,900 9,390 5,090 29 115 - - 393 73 1,636 - - - -
- - - - 5,799 - - 12,293 9,463 6,726 29 117,934 - 8,105
$ 21,946 $ 17,408 $ 9,676 $ 2,467 $ 209,419 $ 51,820 $ 36,371
$ 2,141 $ 1,470 $ 183 $ 256 $ 27,439 $ 670 $ 811 5,185 4,088 200 70 9,326 73 2
- - 3,250 - - - - - - 9 - - - - - - - - - - - - - - - 429 16,565 6,702 - - 3 - - - - - - - - - - -
- - - - - 17,599 4,354 778 291 32 5 147 6 -
- 57 79 - - - - - - - - - - -
8,103 5,906 3,755 332 37,340 34,913 11,870
- - - - 99,415 - -
- - - - - - - 1,389 490 65 - 173 8 -
- 768 325 - - - - - - - - - - -
1,389 1,258 390 - 99,588 8 - 9,492 7,165 4,145 332 136,928 34,922 11,870
12,293 8,638 6,321 29 115 - - - - - - - 5,380 24,501 - - - - 72,376 - -
160 1,605 (790) 2,105 - 11,519 -
12,453 10,243 5,531 2,134 72,491 16,898 24,501
$ 21,946 $ 17,408 $ 9,676 $ 2,467 $ 209,419 $ 51,820 $ 36,371
(Continued)
177
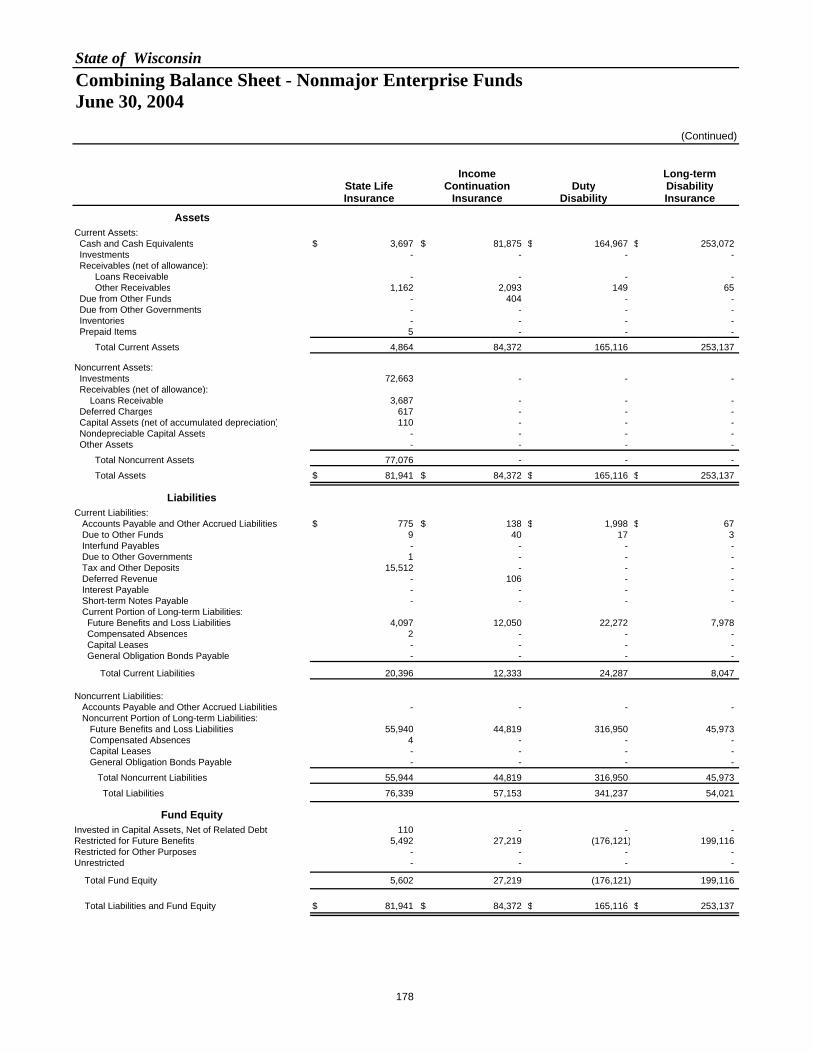
State of WisconsinCombining Balance Sheet - Nonmajor Enterprise Funds June 30, 2004
(Continued)
Income Long-termState Life Continuation Duty DisabilityInsurance Insurance Disability Insurance
AssetsCurrent Assets: Cash and Cash Equivalents $ 3,697 $ 81,875 $ 164,967 $ 253,072 Investments - - - - Receivables (net of allowance): Loans Receivable - - - - Other Receivables 1,162 2,093 149 65 Due from Other Funds - 404 - - Due from Other Governments - - - - Inventories - - - - Prepaid Items 5 - - - Total Current Assets 4,864 84,372 165,116 253,137
Noncurrent Assets: Investments 72,663 - - - Receivables (net of allowance): Loans Receivable 3,687 - - - Deferred Charges 617 - - - Capital Assets (net of accumulated depreciation) 110 - - - Nondepreciable Capital Assets - - - - Other Assets - - - - Total Noncurrent Assets 77,076 - - - Total Assets $ 81,941 $ 84,372 $ 165,116 $ 253,137
LiabilitiesCurrent Liabilities: Accounts Payable and Other Accrued Liabilities $ 775 $ 138 $ 1,998 $ 67 Due to Other Funds 9 40 17 3 Interfund Payables - - - - Due to Other Governments 1 - - - Tax and Other Deposits 15,512 - - - Deferred Revenue - 106 - - Interest Payable - - - - Short-term Notes Payable - - - - Current Portion of Long-term Liabilities: Future Benefits and Loss Liabilities 4,097 12,050 22,272 7,978 Compensated Absences 2 - - - Capital Leases - - - - General Obligation Bonds Payable - - - -
Total Current Liabilities 20,396 12,333 24,287 8,047
Noncurrent Liabilities: Accounts Payable and Other Accrued Liabilities - - - - Noncurrent Portion of Long-term Liabilities: Future Benefits and Loss Liabilities 55,940 44,819 316,950 45,973 Compensated Absences 4 - - - Capital Leases - - - - General Obligation Bonds Payable - - - - Total Noncurrent Liabilities 55,944 44,819 316,950 45,973 Total Liabilities 76,339 57,153 341,237 54,021
Fund EquityInvested in Capital Assets, Net of Related Debt 110 - - - Restricted for Future Benefits 5,492 27,219 (176,121) 199,116 Restricted for Other Purposes - - - - Unrestricted - - - -
Total Fund Equity 5,602 27,219 (176,121) 199,116
Total Liabilities and Fund Equity $ 81,941 $ 84,372 $ 165,116 $ 253,137
178
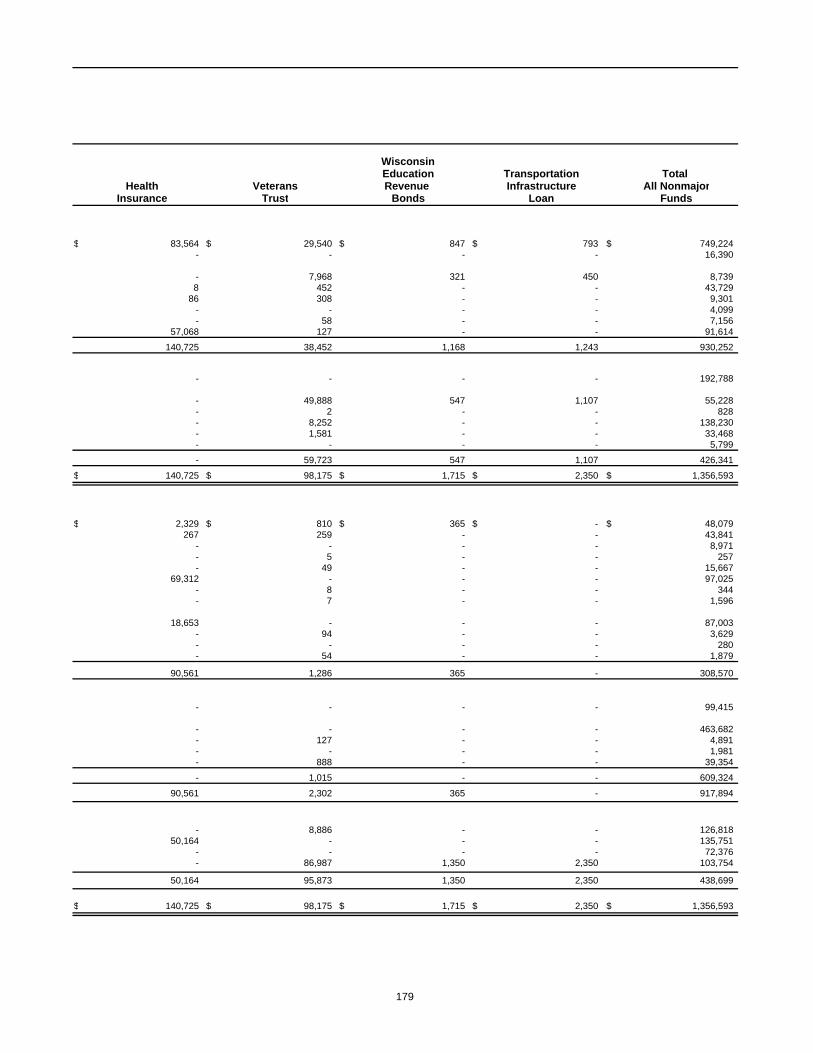
Wisconsin Education Transportation Total
Health Veterans Revenue Infrastructure All NonmajorInsurance Trust Bonds Loan Funds
$ 83,564 $ 29,540 $ 847 $ 793 $ 749,224 - - - - 16,390
- 7,968 321 450 8,739 8 452 - - 43,729
86 308 - - 9,301 - - - - 4,099 - 58 - - 7,156
57,068 127 - - 91,614 140,725 38,452 1,168 1,243 930,252
- - - - 192,788
- 49,888 547 1,107 55,228 - 2 - - 828 - 8,252 - - 138,230 - 1,581 - - 33,468 - - - - 5,799 - 59,723 547 1,107 426,341
$ 140,725 $ 98,175 $ 1,715 $ 2,350 $ 1,356,593
$ 2,329 $ 810 $ 365 $ - $ 48,079 267 259 - - 43,841
- - - - 8,971 - 5 - - 257 - 49 - - 15,667
69,312 - - - 97,025 - 8 - - 344 - 7 - - 1,596
18,653 - - - 87,003 - 94 - - 3,629 - - - - 280 - 54 - - 1,879
90,561 1,286 365 - 308,570
- - - - 99,415
- - - - 463,682 - 127 - - 4,891 - - - - 1,981 - 888 - - 39,354 - 1,015 - - 609,324
90,561 2,302 365 - 917,894
- 8,886 - - 126,818 50,164 - - - 135,751
- - - - 72,376 - 86,987 1,350 2,350 103,754
50,164 95,873 1,350 2,350 438,699
$ 140,725 $ 98,175 $ 1,715 $ 2,350 $ 1,356,593
179
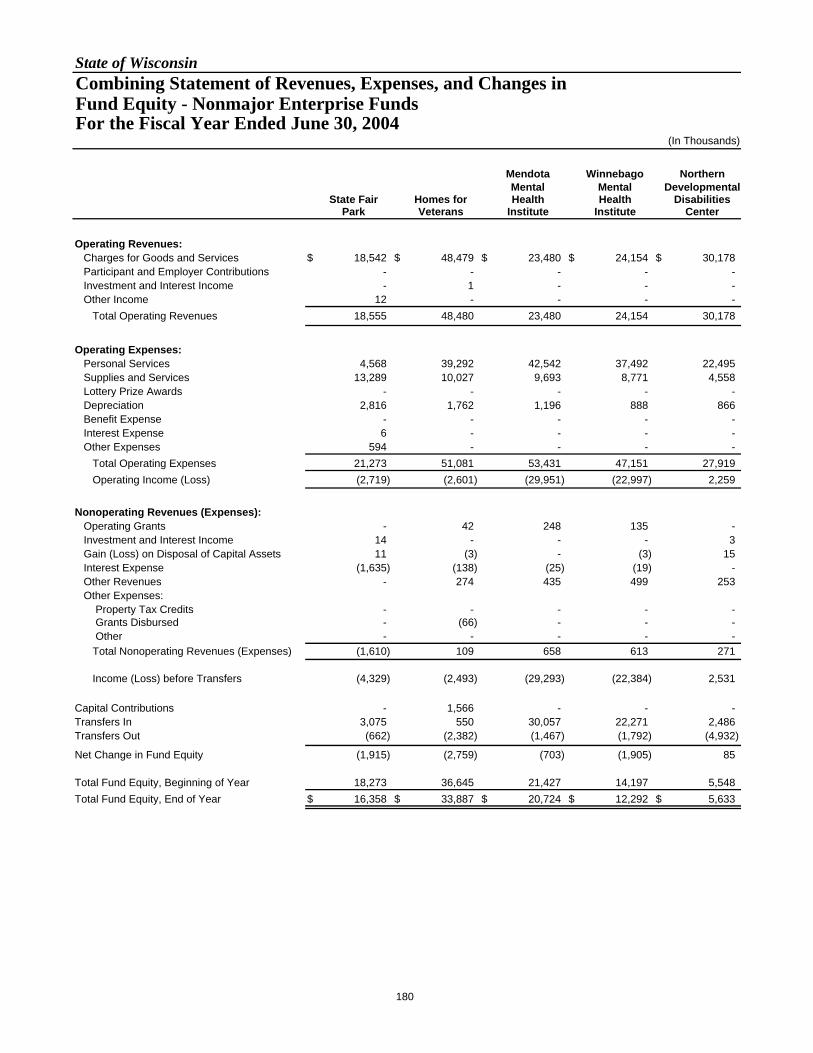
State of WisconsinCombining Statement of Revenues, Expenses, and Changes in Fund Equity - Nonmajor Enterprise Funds For the Fiscal Year Ended June 30, 2004
(In Thousands)
Mendota Winnebago NorthernMental Mental Developmental
State Fair Homes for Health Health DisabilitiesPark Veterans Institute Institute Center
Operating Revenues: Charges for Goods and Services $ 18,542 $ 48,479 $ 23,480 $ 24,154 $ 30,178 Participant and Employer Contributions - - - - - Investment and Interest Income - 1 - - - Other Income 12 - - - - Total Operating Revenues 18,555 48,480 23,480 24,154 30,178
Operating Expenses: Personal Services 4,568 39,292 42,542 37,492 22,495 Supplies and Services 13,289 10,027 9,693 8,771 4,558 Lottery Prize Awards - - - - - Depreciation 2,816 1,762 1,196 888 866 Benefit Expense - - - - - Interest Expense 6 - - - - Other Expenses 594 - - - - Total Operating Expenses 21,273 51,081 53,431 47,151 27,919 Operating Income (Loss) (2,719) (2,601) (29,951) (22,997) 2,259
Nonoperating Revenues (Expenses): Operating Grants - 42 248 135 - Investment and Interest Income 14 - - - 3 Gain (Loss) on Disposal of Capital Assets 11 (3) - (3) 15 Interest Expense (1,635) (138) (25) (19) - Other Revenues - 274 435 499 253 Other Expenses: Property Tax Credits - - - - - Grants Disbursed - (66) - - - Other - - - - - Total Nonoperating Revenues (Expenses) (1,610) 109 658 613 271
Income (Loss) before Transfers (4,329) (2,493) (29,293) (22,384) 2,531
Capital Contributions - 1,566 - - - Transfers In 3,075 550 30,057 22,271 2,486 Transfers Out (662) (2,382) (1,467) (1,792) (4,932)
Net Change in Fund Equity (1,915) (2,759) (703) (1,905) 85
Total Fund Equity, Beginning of Year 18,273 36,645 21,427 14,197 5,548 Total Fund Equity, End of Year $ 16,358 $ 33,887 $ 20,724 $ 12,292 $ 5,633
180
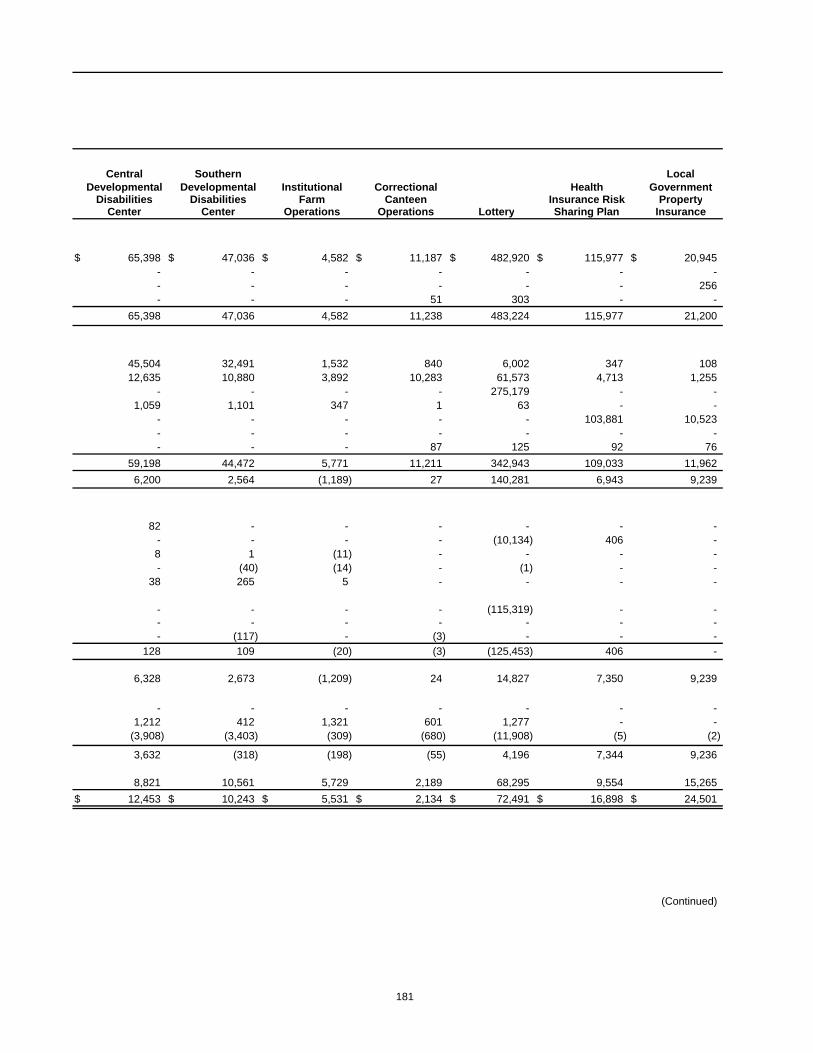
Central Southern LocalDevelopmental Developmental Institutional Correctional Health Government
Disabilities Disabilities Farm Canteen Insurance Risk PropertyCenter Center Operations Operations Lottery Sharing Plan Insurance
$ 65,398 $ 47,036 $ 4,582 $ 11,187 $ 482,920 $ 115,977 $ 20,945 - - - - - - - - - - - - - 256 - - - 51 303 - -
65,398 47,036 4,582 11,238 483,224 115,977 21,200
45,504 32,491 1,532 840 6,002 347 108 12,635 10,880 3,892 10,283 61,573 4,713 1,255
- - - - 275,179 - - 1,059 1,101 347 1 63 - -
- - - - - 103,881 10,523 - - - - - - - - - - 87 125 92 76
59,198 44,472 5,771 11,211 342,943 109,033 11,962 6,200 2,564 (1,189) 27 140,281 6,943 9,239
82 - - - - - - - - - - (10,134) 406 - 8 1 (11) - - - - - (40) (14) - (1) - -
38 265 5 - - - -
- - - - (115,319) - - - - - - - - - - (117) - (3) - - -
128 109 (20) (3) (125,453) 406 -
6,328 2,673 (1,209) 24 14,827 7,350 9,239
- - - - - - - 1,212 412 1,321 601 1,277 - -
(3,908) (3,403) (309) (680) (11,908) (5) (2)
3,632 (318) (198) (55) 4,196 7,344 9,236
8,821 10,561 5,729 2,189 68,295 9,554 15,265 $ 12,453 $ 10,243 $ 5,531 $ 2,134 $ 72,491 $ 16,898 $ 24,501
(Continued)
181
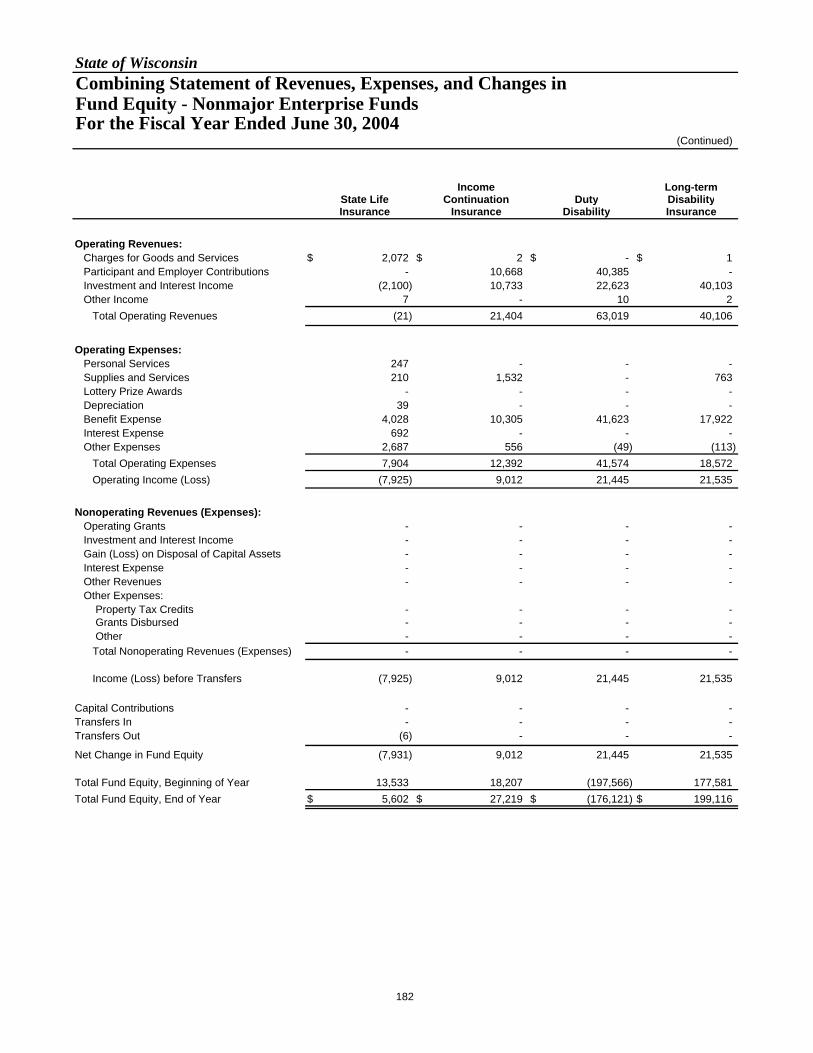
State of WisconsinCombining Statement of Revenues, Expenses, and Changes in Fund Equity - Nonmajor Enterprise Funds For the Fiscal Year Ended June 30, 2004
(Continued)
Income Long-termState Life Continuation Duty DisabilityInsurance Insurance Disability Insurance
Operating Revenues: Charges for Goods and Services $ 2,072 $ 2 $ - $ 1 Participant and Employer Contributions - 10,668 40,385 - Investment and Interest Income (2,100) 10,733 22,623 40,103 Other Income 7 - 10 2 Total Operating Revenues (21) 21,404 63,019 40,106
Operating Expenses: Personal Services 247 - - - Supplies and Services 210 1,532 - 763 Lottery Prize Awards - - - - Depreciation 39 - - - Benefit Expense 4,028 10,305 41,623 17,922 Interest Expense 692 - - - Other Expenses 2,687 556 (49) (113) Total Operating Expenses 7,904 12,392 41,574 18,572 Operating Income (Loss) (7,925) 9,012 21,445 21,535
Nonoperating Revenues (Expenses): Operating Grants - - - - Investment and Interest Income - - - - Gain (Loss) on Disposal of Capital Assets - - - - Interest Expense - - - - Other Revenues - - - - Other Expenses: Property Tax Credits - - - - Grants Disbursed - - - - Other - - - - Total Nonoperating Revenues (Expenses) - - - -
Income (Loss) before Transfers (7,925) 9,012 21,445 21,535
Capital Contributions - - - - Transfers In - - - - Transfers Out (6) - - -
Net Change in Fund Equity (7,931) 9,012 21,445 21,535
Total Fund Equity, Beginning of Year 13,533 18,207 (197,566) 177,581 Total Fund Equity, End of Year $ 5,602 $ 27,219 $ (176,121) $ 199,116
182
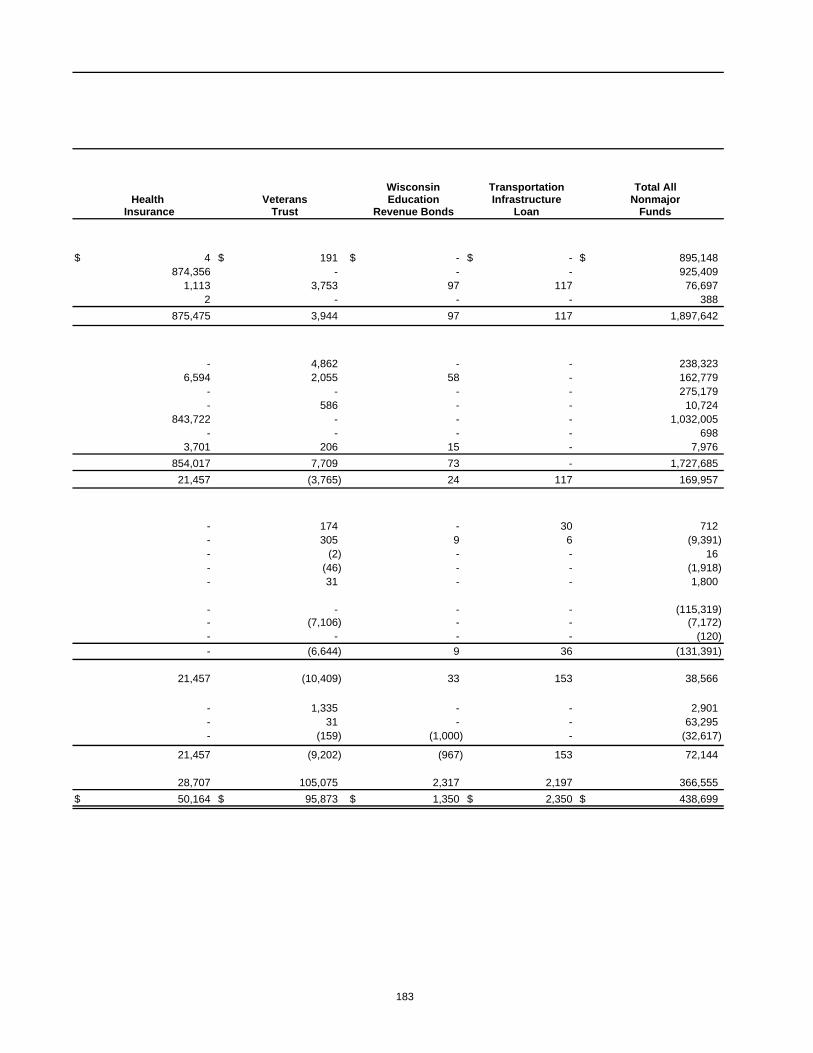
Wisconsin Transportation Total AllHealth Veterans Education Infrastructure Nonmajor
Insurance Trust Revenue Bonds Loan Funds
$ 4 $ 191 $ - $ - $ 895,148 874,356 - - - 925,409
1,113 3,753 97 117 76,697 2 - - - 388
875,475 3,944 97 117 1,897,642
- 4,862 - - 238,323 6,594 2,055 58 - 162,779
- - - - 275,179 - 586 - - 10,724
843,722 - - - 1,032,005 - - - - 698
3,701 206 15 - 7,976 854,017 7,709 73 - 1,727,685 21,457 (3,765) 24 117 169,957
- 174 - 30 712 - 305 9 6 (9,391) - (2) - - 16 - (46) - - (1,918) - 31 - - 1,800
- - - - (115,319) - (7,106) - - (7,172) - - - - (120) - (6,644) 9 36 (131,391)
21,457 (10,409) 33 153 38,566
- 1,335 - - 2,901 - 31 - - 63,295 - (159) (1,000) - (32,617)
21,457 (9,202) (967) 153 72,144
28,707 105,075 2,317 2,197 366,555 $ 50,164 $ 95,873 $ 1,350 $ 2,350 $ 438,699
183

State of WisconsinCombining Statement of Cash Flows - Nonmajor Enterprise Funds For the Fiscal Year Ended June 30, 2004
(In Thousands)
Mendota Winnebago NorthernMental Mental Developmental
State Fair Homes for Health Health DisabilitiesPark Veterans Institute Institute Center
Cash Flows from Operating Activities: Cash Receipts from Customers $ 20,867 $ 56,740 $ 22,551 $ 26,074 $ 32,929 Cash Payments to Suppliers for Goods and Services (19,293) (10,654) (10,290) (8,248) (4,729) Cash Payments to Employees for Services (4,533) (39,253) (41,394) (39,589) (20,450) Cash Payments for Lottery Prizes - - - - - Cash Payments for Loans Originated - - - - - Collection of Loans - - - - - Interest Income - 1 - - - Cash Payments for Benefits - - - - - Other Operating Revenues 12 - - - - Other Operating Expenses (600) - - - - Other Sources of Cash - 274 3,392 3,833 415 Other Uses of Cash - - - - - Net Cash Provided (Used) by Operating Activities (3,547) 7,108 (25,741) (17,932) 8,166
Cash Flows from Noncapital Financing Activities: Operating Grants Receipts - 42 215 140 - Grants for Loans to Governments - - - - - Grants Disbursed - (66) - - - Interest Payments - - - - - Property Tax Credit Payments - - - - - Interfund Loans Received 5,751 - - - - Interfund Loans Repaid - - - (2,587) (5,680) Transfers In 3,075 (31) 30,097 22,283 2,486 Transfers Out (662) (2,384) (1,467) (823) (4,932) Other Cash Inflows from Noncapital Financing Activities - - - - - Net Cash Provided (Used) by Noncapital Financing Activities 8,164 (2,438) 28,845 19,013 (8,126) Cash Flows from Capital and Related Financing Activities: Proceeds from Issuance of Long-term Debt - 689 - - - Capital Contributions - 1,566 - - - Repayment of Long-term Debt (1,394) (88) - - - Interest Payments (1,646) (176) (25) (19) - Capital Lease Obligations (97) (41) (80) (33) - Proceeds from Sale of Capital Assets 11 - - - 216 Payments for Purchase of Capital Assets (1,721) (4,536) (1,091) (905) (20) Other Cash Inflows from Capital Financing Activities - 158 - - - Other Cash Outflows from Capital Financing Activities - (44) - - - Net Cash Provided (Used) by Capital and Related Financing Activities (4,847) (2,472) (1,196) (957) 196
Cash Flows from Investing Activities: Proceeds from Sale and Maturities of Investment Securities - - - 4 - Purchase of Investment Securities - - - - - Cash Payments for Loans Originated - - - - - Collection of Loans - - - - - Investment and Interest Receipts 14 - - - 3 Net Cash Provided (Used) by Investing Activities 14 - - 4 3
Net Increase (Decrease) in Cash and Cash Equivalents (216) 2,198 1,908 128 238 Cash and Cash Equivalents, Beginning of Year 276 3,235 1,893 63 20 Cash and Cash Equivalents, End of Year $ 61 $ 5,432 $ 3,801 $ 191 $ 258
184

)
Central Southern LocalDevelopmental Developmental Institutional Correctional Health Government
Disabilities Disabilities Farm Canteen Insurance Risk PropertyCenter Center Operations Operations Lottery Sharing Plan Insurance
$ 77,285 $ 52,951 $ 4,365 $ 11,132 $ 481,829 $ 118,216 $ 22,550 (12,278) (11,291) (2,889) (10,232) (28,137) (4,816) (1,220) (45,250) (32,359) (1,519) (901) (5,883) (337) (108)
- - - - (289,528) - - - - - - - - - - - - - - - - - - - - - - - - - - - - (103,812) (13,288) - - - 52 - - - - - - (88) (31,430) (97) (73)
38 1,035 213 - - - - - - (128) - - - -
19,794 10,337 41 (37) 126,851 9,153 7,861
82 - - - - - - - - - - - - - - - - - - - - - - - - - - - - - - - (118,357) - - - - - - - - -
(11,496) (5,410) (401) - - - - 1,212 412 1,321 601 1,185 - -
(3,908) (616) (309) (664) (15,576) - (2)
- - - - - - -
(14,110) (5,614) 611 (63) (132,748) - (2)
- - - - - - - - - - - - - - - - - - - - - - (40) (15) - - - - - (55) (79) - - - - - 1 - - - - -
(1,130) (192) (456) (20) - - - - - - 38 - - - - - (102) - - - -
(1,130) (287) (652) 18 - - -
- - - - 18,520 - 3,750 - - - - (1,722) - - - - - - - - - - - - - - - - - - - - 616 406 877 - - - - 17,414 406 4,627
4,555 4,437 - (82) 11,518 9,560 12,485 4 17 - 1,286 25,453 40,265 11,628
$ 4,559 $ 4,454 $ - $ 1,204 $ 36,970 $ 49,825 $ 24,113
(Continued)
185
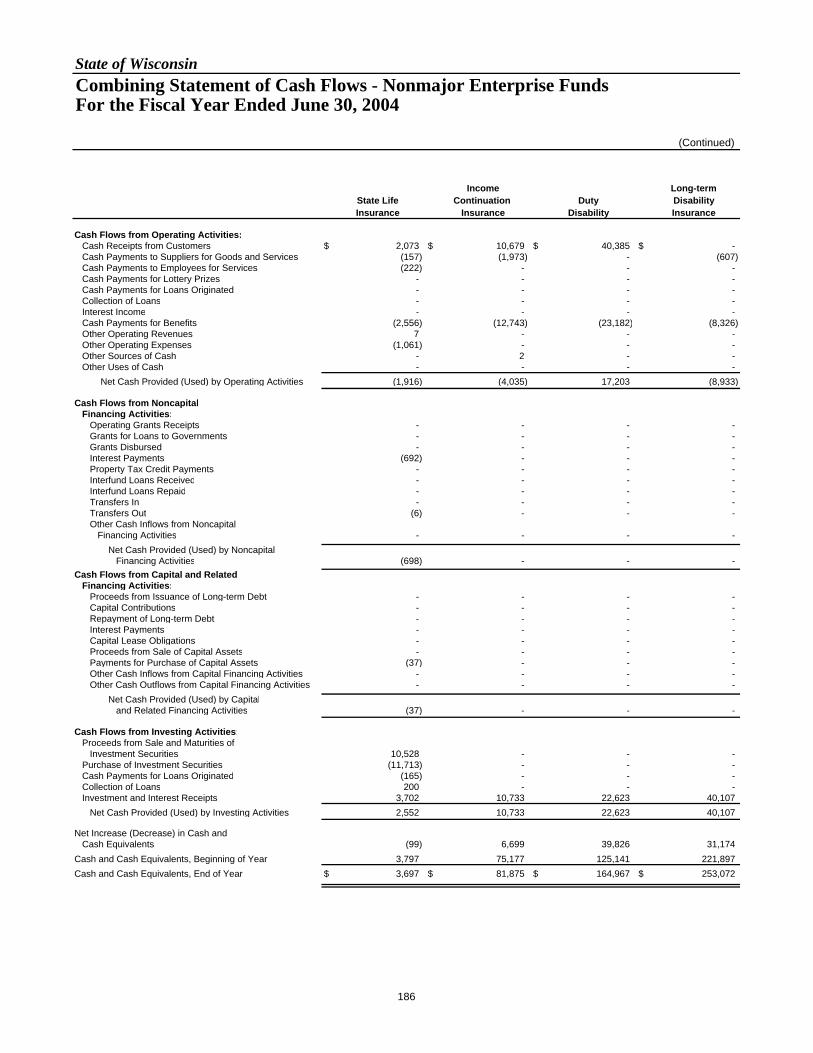
State of WisconsinCombining Statement of Cash Flows - Nonmajor Enterprise Funds For the Fiscal Year Ended June 30, 2004
(Continued)
Income Long-termState Life Continuation Duty DisabilityInsurance Insurance Disability Insurance
Cash Flows from Operating Activities: Cash Receipts from Customers $ 2,073 $ 10,679 $ 40,385 $ - Cash Payments to Suppliers for Goods and Services (157) (1,973) - (607) Cash Payments to Employees for Services (222) - - - Cash Payments for Lottery Prizes - - - - Cash Payments for Loans Originated - - - - Collection of Loans - - - - Interest Income - - - - Cash Payments for Benefits (2,556) (12,743) (23,182) (8,326) Other Operating Revenues 7 - - - Other Operating Expenses (1,061) - - - Other Sources of Cash - 2 - - Other Uses of Cash - - - - Net Cash Provided (Used) by Operating Activities (1,916) (4,035) 17,203 (8,933)
Cash Flows from Noncapital Financing Activities: Operating Grants Receipts - - - - Grants for Loans to Governments - - - - Grants Disbursed - - - - Interest Payments (692) - - - Property Tax Credit Payments - - - - Interfund Loans Received - - - - Interfund Loans Repaid - - - - Transfers In - - - - Transfers Out (6) - - - Other Cash Inflows from Noncapital Financing Activities - - - - Net Cash Provided (Used) by Noncapital Financing Activities (698) - - -
Cash Flows from Capital and Related Financing Activities: Proceeds from Issuance of Long-term Debt - - - - Capital Contributions - - - - Repayment of Long-term Debt - - - - Interest Payments - - - - Capital Lease Obligations - - - - Proceeds from Sale of Capital Assets - - - - Payments for Purchase of Capital Assets (37) - - - Other Cash Inflows from Capital Financing Activities - - - - Other Cash Outflows from Capital Financing Activities - - - - Net Cash Provided (Used) by Capital and Related Financing Activities (37) - - -
Cash Flows from Investing Activities: Proceeds from Sale and Maturities of Investment Securities 10,528 - - - Purchase of Investment Securities (11,713) - - - Cash Payments for Loans Originated (165) - - - Collection of Loans 200 - - - Investment and Interest Receipts 3,702 10,733 22,623 40,107 Net Cash Provided (Used) by Investing Activities 2,552 10,733 22,623 40,107
Net Increase (Decrease) in Cash and Cash Equivalents (99) 6,699 39,826 31,174 Cash and Cash Equivalents, Beginning of Year 3,797 75,177 125,141 221,897 Cash and Cash Equivalents, End of Year $ 3,697 $ 81,875 $ 164,967 $ 253,072
186
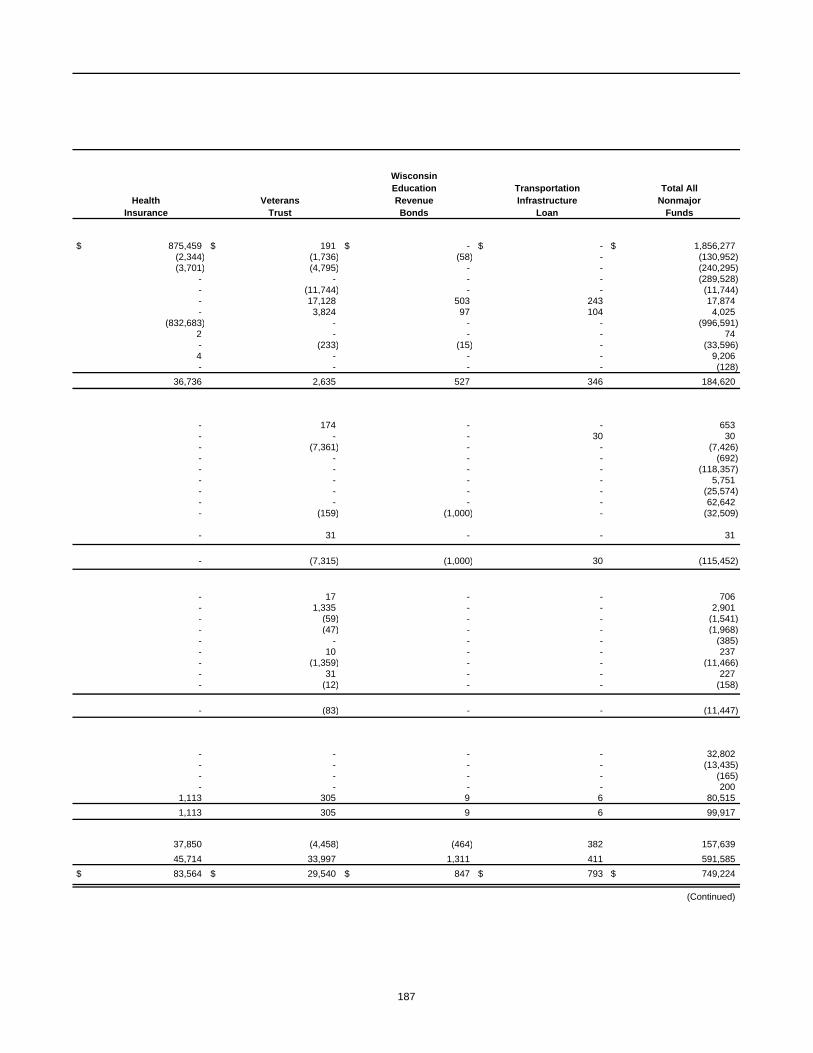
WisconsinEducation Transportation Total All
Health Veterans Revenue Infrastructure NonmajorInsurance Trust Bonds Loan Funds
$ 875,459 $ 191 $ - $ - $ 1,856,277 (2,344) (1,736) (58) - (130,952) (3,701) (4,795) - - (240,295)
- - - - (289,528) - (11,744) - - (11,744) - 17,128 503 243 17,874 - 3,824 97 104 4,025
(832,683) - - - (996,591) 2 - - - 74 - (233) (15) - (33,596) 4 - - - 9,206 - - - - (128)
36,736 2,635 527 346 184,620
- 174 - - 653 - - - 30 30 - (7,361) - - (7,426) - - - - (692) - - - - (118,357) - - - - 5,751 - - - - (25,574) - - - - 62,642 - (159) (1,000) - (32,509)
- 31 - - 31
- (7,315) (1,000) 30 (115,452)
- 17 - - 706 - 1,335 - - 2,901 - (59) - - (1,541) - (47) - - (1,968) - - - - (385) - 10 - - 237 - (1,359) - - (11,466) - 31 - - 227 - (12) - - (158)
- (83) - - (11,447)
- - - - 32,802 - - - - (13,435) - - - - (165) - - - - 200
1,113 305 9 6 80,515 1,113 305 9 6 99,917
37,850 (4,458) (464) 382 157,639 45,714 33,997 1,311 411 591,585
$ 83,564 $ 29,540 $ 847 $ 793 $ 749,224
(Continued)
187
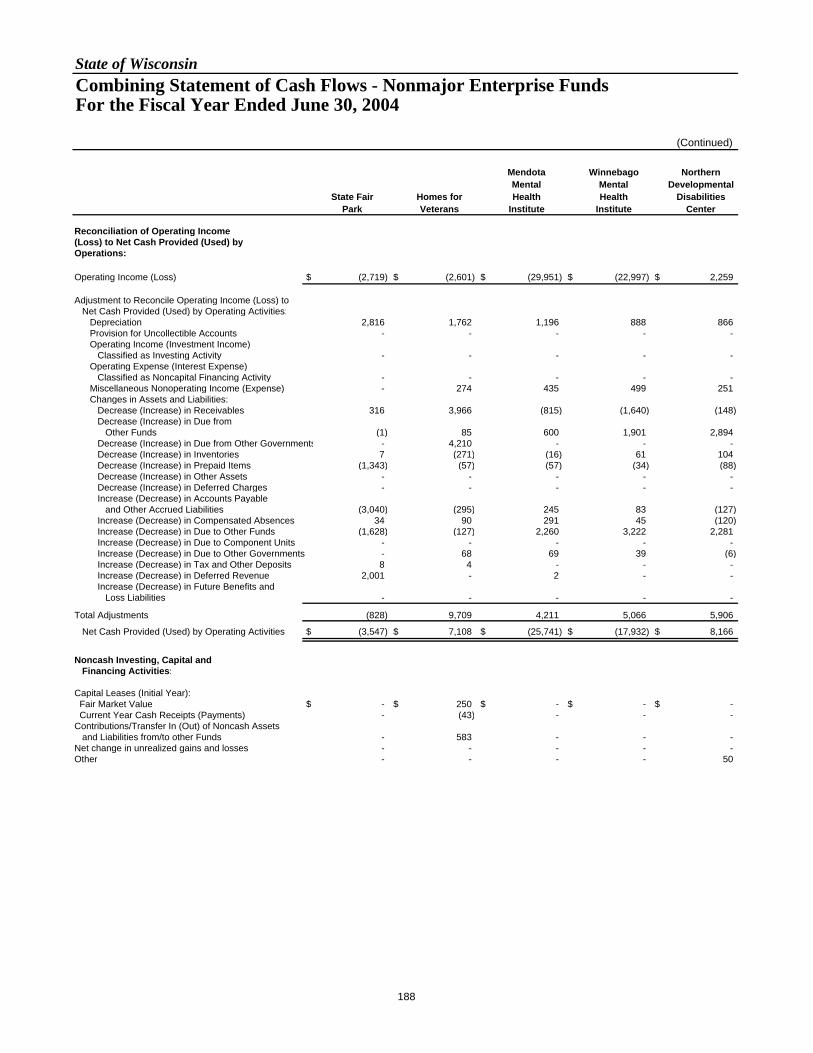
State of WisconsinCombining Statement of Cash Flows - Nonmajor Enterprise Funds For the Fiscal Year Ended June 30, 2004
(Continued)
Mendota Winnebago NorthernMental Mental Developmental
State Fair Homes for Health Health DisabilitiesPark Veterans Institute Institute Center
Reconciliation of Operating Income (Loss) to Net Cash Provided (Used) by Operations:
Operating Income (Loss) $ (2,719) $ (2,601) $ (29,951) $ (22,997) $ 2,259
Adjustment to Reconcile Operating Income (Loss) to Net Cash Provided (Used) by Operating Activities: Depreciation 2,816 1,762 1,196 888 866 Provision for Uncollectible Accounts - - - - - Operating Income (Investment Income) Classified as Investing Activity - - - - - Operating Expense (Interest Expense) Classified as Noncapital Financing Activity - - - - - Miscellaneous Nonoperating Income (Expense) - 274 435 499 251 Changes in Assets and Liabilities: Decrease (Increase) in Receivables 316 3,966 (815) (1,640) (148) Decrease (Increase) in Due from Other Funds (1) 85 600 1,901 2,894 Decrease (Increase) in Due from Other Governments - 4,210 - - - Decrease (Increase) in Inventories 7 (271) (16) 61 104 Decrease (Increase) in Prepaid Items (1,343) (57) (57) (34) (88) Decrease (Increase) in Other Assets - - - - - Decrease (Increase) in Deferred Charges - - - - - Increase (Decrease) in Accounts Payable and Other Accrued Liabilities (3,040) (295) 245 83 (127) Increase (Decrease) in Compensated Absences 34 90 291 45 (120) Increase (Decrease) in Due to Other Funds (1,628) (127) 2,260 3,222 2,281 Increase (Decrease) in Due to Component Units - - - - - Increase (Decrease) in Due to Other Governments - 68 69 39 (6) Increase (Decrease) in Tax and Other Deposits 8 4 - - - Increase (Decrease) in Deferred Revenue 2,001 - 2 - - Increase (Decrease) in Future Benefits and Loss Liabilities - - - - -
Total Adjustments (828) 9,709 4,211 5,066 5,906
Net Cash Provided (Used) by Operating Activities $ (3,547) $ 7,108 $ (25,741) $ (17,932) $ 8,166
Noncash Investing, Capital and Financing Activities:
Capital Leases (Initial Year): Fair Market Value $ - $ 250 $ - $ - $ - Current Year Cash Receipts (Payments) - (43) - - - Contributions/Transfer In (Out) of Noncash Assets and Liabilities from/to other Funds - 583 - - - Net change in unrealized gains and losses - - - - - Other - - - - 50
188
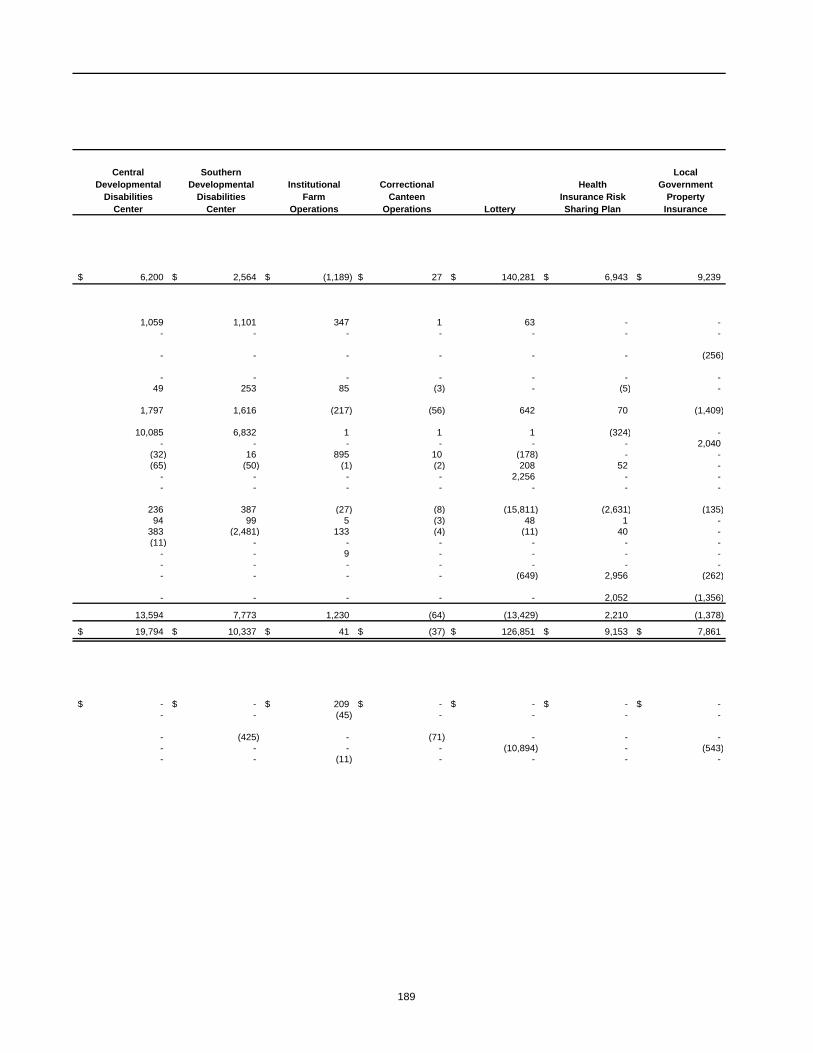
Central Southern LocalDevelopmental Developmental Institutional Correctional Health Government
Disabilities Disabilities Farm Canteen Insurance Risk PropertyCenter Center Operations Operations Lottery Sharing Plan Insurance
$ 6,200 $ 2,564 $ (1,189) $ 27 $ 140,281 $ 6,943 $ 9,239
1,059 1,101 347 1 63 - - - - - - - - -
- - - - - - (256)
- - - - - - - 49 253 85 (3) - (5) -
1,797 1,616 (217) (56) 642 70 (1,409)
10,085 6,832 1 1 1 (324) - - - - - - - 2,040
(32) 16 895 10 (178) - - (65) (50) (1) (2) 208 52 -
- - - - 2,256 - - - - - - - - -
236 387 (27) (8) (15,811) (2,631) (135) 94 99 5 (3) 48 1 -
383 (2,481) 133 (4) (11) 40 - (11) - - - - - -
- - 9 - - - - - - - - - - - - - - - (649) 2,956 (262)
- - - - - 2,052 (1,356)
13,594 7,773 1,230 (64) (13,429) 2,210 (1,378)
$ 19,794 $ 10,337 $ 41 $ (37) $ 126,851 $ 9,153 $ 7,861
$ - $ - $ 209 $ - $ - $ - $ - - - (45) - - - -
- (425) - (71) - - - - - - - (10,894) - (543) - - (11) - - - -
189
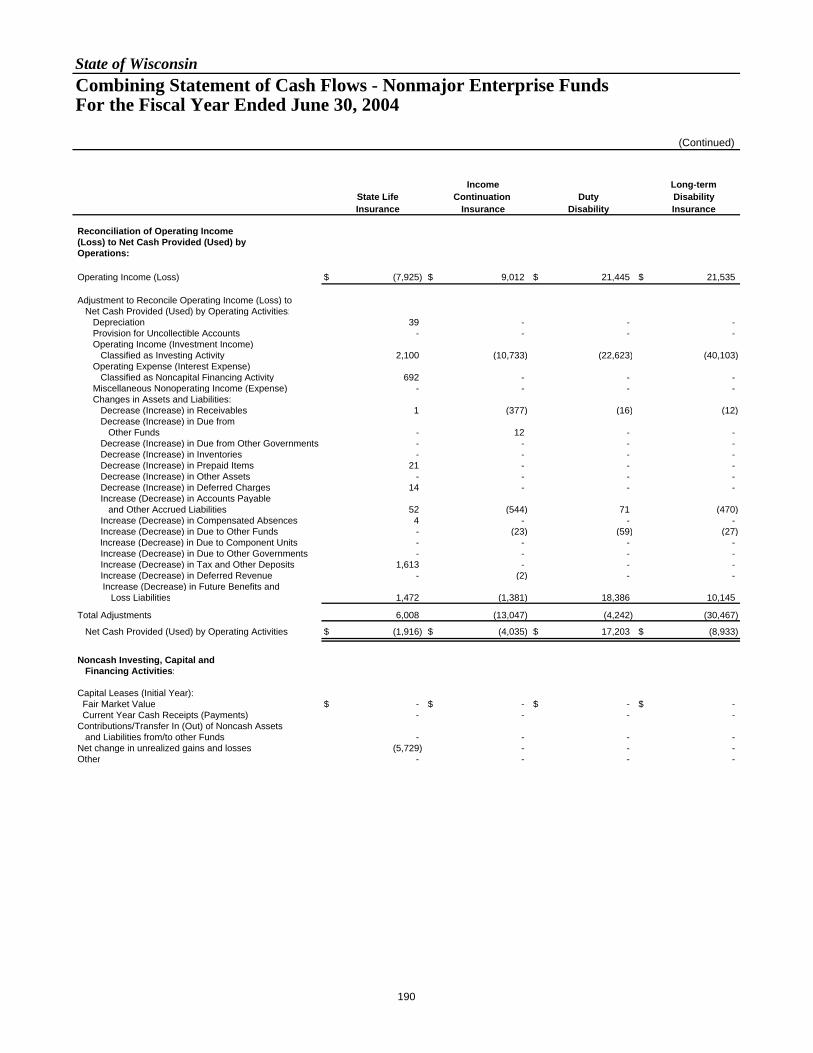
State of WisconsinCombining Statement of Cash Flows - Nonmajor Enterprise Funds For the Fiscal Year Ended June 30, 2004
(Continued)
Income Long-termState Life Continuation Duty DisabilityInsurance Insurance Disability Insurance
Reconciliation of Operating Income (Loss) to Net Cash Provided (Used) by Operations:
Operating Income (Loss) $ (7,925) $ 9,012 $ 21,445 $ 21,535
Adjustment to Reconcile Operating Income (Loss) to Net Cash Provided (Used) by Operating Activities: Depreciation 39 - - - Provision for Uncollectible Accounts - - - - Operating Income (Investment Income) Classified as Investing Activity 2,100 (10,733) (22,623) (40,103) Operating Expense (Interest Expense) Classified as Noncapital Financing Activity 692 - - - Miscellaneous Nonoperating Income (Expense) - - - - Changes in Assets and Liabilities: Decrease (Increase) in Receivables 1 (377) (16) (12) Decrease (Increase) in Due from Other Funds - 12 - - Decrease (Increase) in Due from Other Governments - - - - Decrease (Increase) in Inventories - - - - Decrease (Increase) in Prepaid Items 21 - - - Decrease (Increase) in Other Assets - - - - Decrease (Increase) in Deferred Charges 14 - - - Increase (Decrease) in Accounts Payable and Other Accrued Liabilities 52 (544) 71 (470) Increase (Decrease) in Compensated Absences 4 - - - Increase (Decrease) in Due to Other Funds - (23) (59) (27)
Increase (Decrease) in Due to Component Units - - - - Increase (Decrease) in Due to Other Governments - - - - Increase (Decrease) in Tax and Other Deposits 1,613 - - - Increase (Decrease) in Deferred Revenue - (2) - -
Increase (Decrease) in Future Benefits and Loss Liabilities 1,472 (1,381) 18,386 10,145
Total Adjustments 6,008 (13,047) (4,242) (30,467)
Net Cash Provided (Used) by Operating Activities $ (1,916) $ (4,035) $ 17,203 $ (8,933)
Noncash Investing, Capital and Financing Activities:
Capital Leases (Initial Year): Fair Market Value $ - $ - $ - $ - Current Year Cash Receipts (Payments) - - - - Contributions/Transfer In (Out) of Noncash Assets and Liabilities from/to other Funds - - - - Net change in unrealized gains and losses (5,729) - - - Other - - - -
190
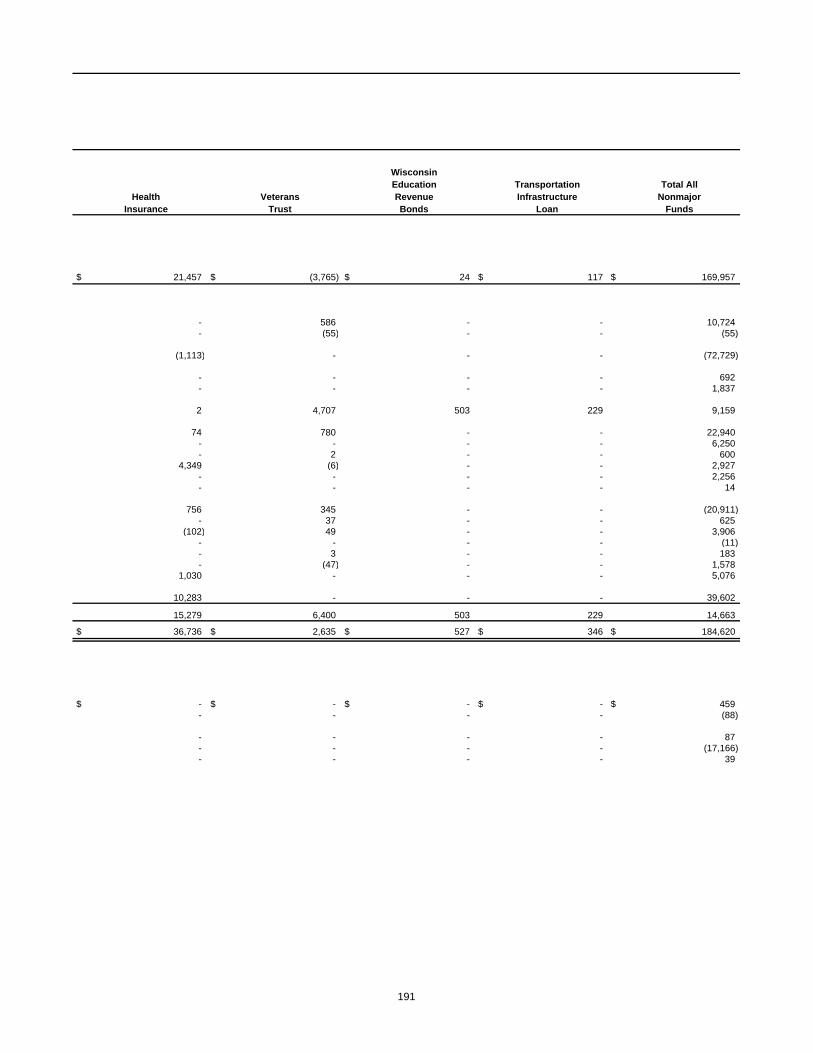
WisconsinEducation Transportation Total All
Health Veterans Revenue Infrastructure NonmajorInsurance Trust Bonds Loan Funds
$ 21,457 $ (3,765) $ 24 $ 117 $ 169,957
- 586 - - 10,724 - (55) - - (55)
(1,113) - - - (72,729)
- - - - 692 - - - - 1,837
2 4,707 503 229 9,159
74 780 - - 22,940 - - - - 6,250 - 2 - - 600
4,349 (6) - - 2,927 - - - - 2,256 - - - - 14
756 345 - - (20,911) - 37 - - 625
(102) 49 - - 3,906 - - - - (11) - 3 - - 183 - (47) - - 1,578
1,030 - - - 5,076
10,283 - - - 39,602
15,279 6,400 503 229 14,663
$ 36,736 $ 2,635 $ 527 $ 346 $ 184,620
$ - $ - $ - $ - $ 459 - - - - (88)
- - - - 87 - - - - (17,166) - - - - 39
191

192
State of Wisconsin
Internal Service Funds
193
INTERNAL SERVICE: Internal service funds account for theoperations of State agencies which render services to other Stateagencies, institutions, or other governmental units on a cost-reimbursement basis. The State's internal service funds aredescribed below:
The Technology Services Fund accounts for computer andtelephone services provided to State and local governmentalagencies and school systems. The moneys to finance theseservices come from computing service charges and telephoneand data network charges.
The Fleet Services Fund accounts for the costs associated withproviding vehicle and aircraft services to State agencies. Moneysto finance these services come from user fees and the sale ofused vehicles.
The Financial Services Fund accounts for the costs associatedwith providing accounting, auditing, payroll and other financialservices to State agencies. Moneys to finance these servicescome from State agency user fees.
The Facilities Operations and Maintenance Fund accounts forthe costs of operating State-owned facilities including utilities,heat, protective services, custodial and maintenance servicesand minor repair projects. The moneys to finance these costs aresupplied from rents charged for facility and parking use and ageneral purpose revenue supplement for maintenance of thecapitol and executive residence.
The Risk Management Fund accounts for the costs of losses fordamage to property owned by agencies, personal injury orproperty damage liabilities incurred by a State officer, agent oremployee, and workers' compensation costs for State employees.Moneys to finance these costs come from charges to Stateagencies.
The Badger State Industries Fund accounts for the programwhich gives inmates work experience in manufacturing goodsand providing services. The sale of goods and services providesthe moneys necessary to run the program.
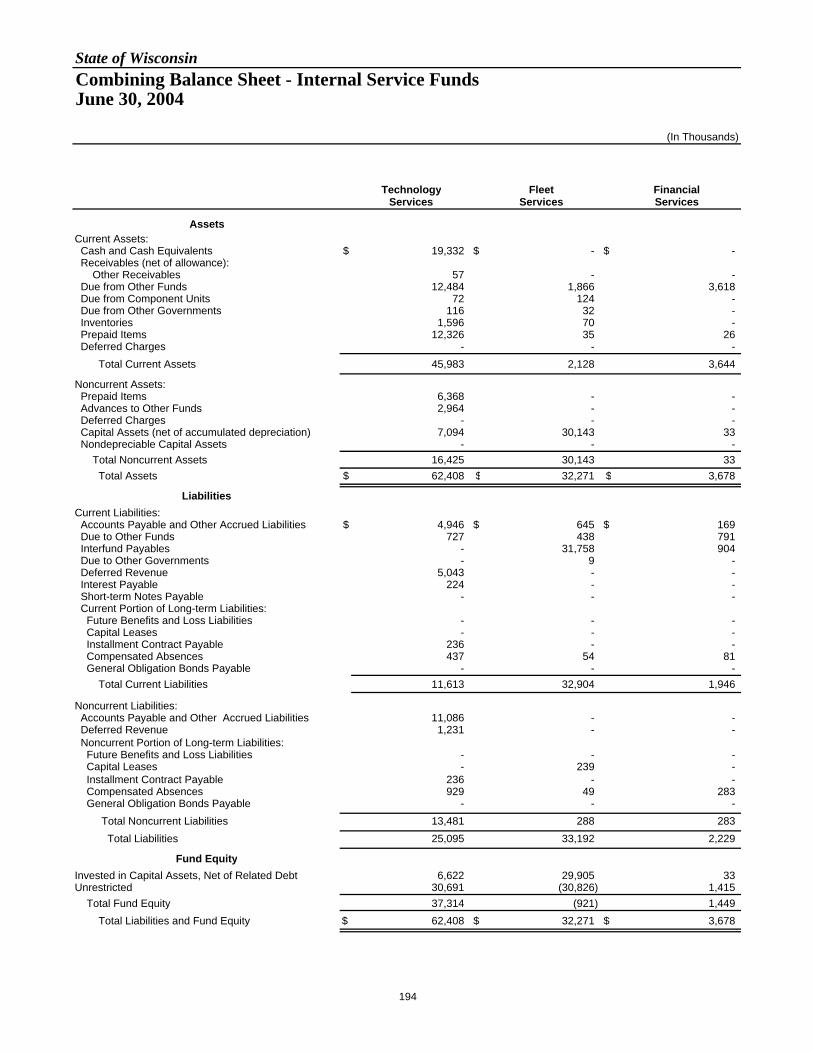
State of WisconsinCombining Balance Sheet - Internal Service Funds June 30, 2004
(In Thousands)
Technology Fleet Financial
Services Services Services
AssetsCurrent Assets: Cash and Cash Equivalents $ 19,332 $ - $ - Receivables (net of allowance): Other Receivables 57 - - Due from Other Funds 12,484 1,866 3,618 Due from Component Units 72 124 - Due from Other Governments 116 32 - Inventories 1,596 70 - Prepaid Items 12,326 35 26 Deferred Charges - - - Total Current Assets 45,983 2,128 3,644
Noncurrent Assets: Prepaid Items 6,368 - - Advances to Other Funds 2,964 - - Deferred Charges - - - Capital Assets (net of accumulated depreciation) 7,094 30,143 33 Nondepreciable Capital Assets - - - Total Noncurrent Assets 16,425 30,143 33 Total Assets $ 62,408 $ 32,271 $ 3,678
LiabilitiesCurrent Liabilities: Accounts Payable and Other Accrued Liabilities $ 4,946 $ 645 $ 169 Due to Other Funds 727 438 791 Interfund Payables - 31,758 904 Due to Other Governments - 9 - Deferred Revenue 5,043 - - Interest Payable 224 - - Short-term Notes Payable - - - Current Portion of Long-term Liabilities: Future Benefits and Loss Liabilities - - - Capital Leases - - - Installment Contract Payable 236 - - Compensated Absences 437 54 81 General Obligation Bonds Payable - - - Total Current Liabilities 11,613 32,904 1,946
Noncurrent Liabilities: Accounts Payable and Other Accrued Liabilities 11,086 - - Deferred Revenue 1,231 - - Noncurrent Portion of Long-term Liabilities: Future Benefits and Loss Liabilities - - - Capital Leases - 239 - Installment Contract Payable 236 - - Compensated Absences 929 49 283 General Obligation Bonds Payable - - - Total Noncurrent Liabilities 13,481 288 283 Total Liabilities 25,095 33,192 2,229
Fund EquityInvested in Capital Assets, Net of Related Debt 6,622 29,905 33 Unrestricted 30,691 (30,826) 1,415 Total Fund Equity 37,314 (921) 1,449 Total Liabilities and Fund Equity $ 62,408 $ 32,271 $ 3,678
194
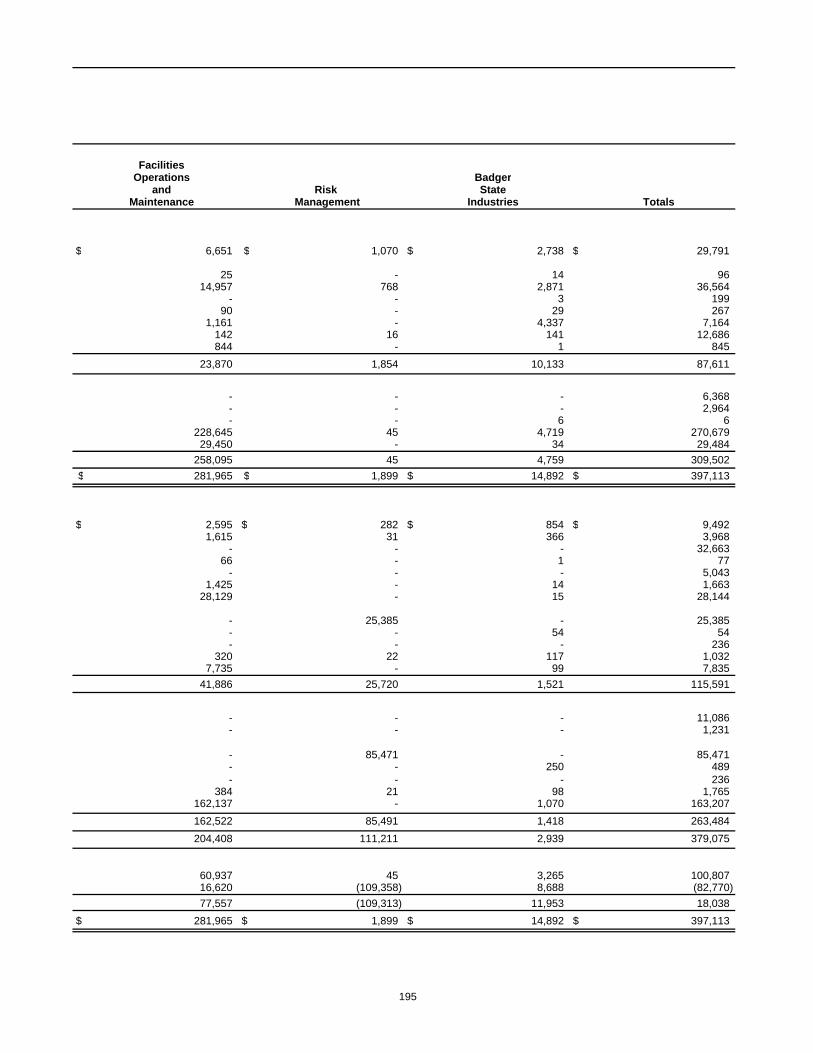
Facilities Operations Badger
and Risk State Maintenance Management Industries Totals
$ 6,651 $ 1,070 $ 2,738 $ 29,791
25 - 14 96 14,957 768 2,871 36,564
- - 3 199 90 - 29 267
1,161 - 4,337 7,164 142 16 141 12,686 844 - 1 845
23,870 1,854 10,133 87,611
- - - 6,368 - - - 2,964 - - 6 6
228,645 45 4,719 270,679 29,450 - 34 29,484
258,095 45 4,759 309,502 $ 281,965 $ 1,899 $ 14,892 $ 397,113
$ 2,595 $ 282 $ 854 $ 9,492 1,615 31 366 3,968
- - - 32,663 66 - 1 77
- - - 5,043 1,425 - 14 1,663
28,129 - 15 28,144
- 25,385 - 25,385 - - 54 54 - - - 236
320 22 117 1,0327,735 - 99 7,835
41,886 25,720 1,521 115,591
- - - 11,086 - - - 1,231
- 85,471 - 85,471 - - 250 489 - - - 236
384 21 98 1,765 162,137 - 1,070 163,207 162,522 85,491 1,418 263,484 204,408 111,211 2,939 379,075
60,937 45 3,265 100,807 16,620 (109,358) 8,688 (82,770) 77,557 (109,313) 11,953 18,038
$ 281,965 $ 1,899 $ 14,892 $ 397,113
195
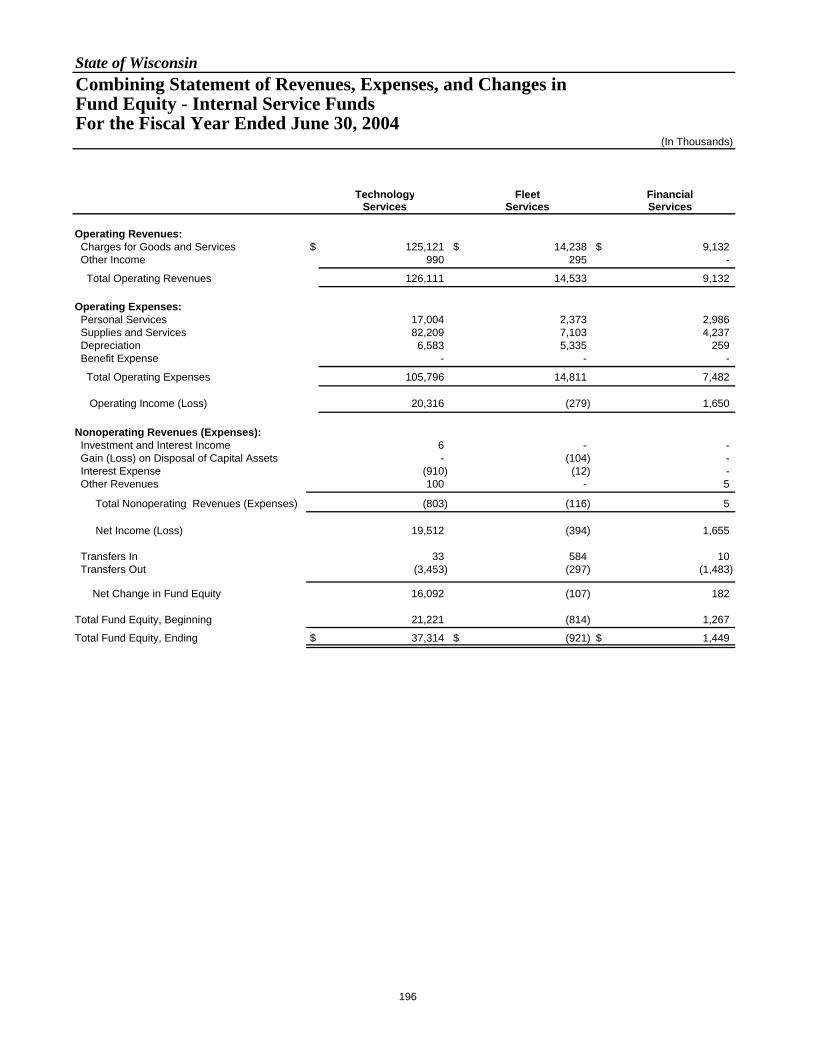
State of WisconsinCombining Statement of Revenues, Expenses, and Changes in Fund Equity - Internal Service Funds For the Fiscal Year Ended June 30, 2004
(In Thousands)
Technology Fleet FinancialServices Services Services
Operating Revenues: Charges for Goods and Services $ 125,121 $ 14,238 $ 9,132 Other Income 990 295 -
Total Operating Revenues 126,111 14,533 9,132
Operating Expenses: Personal Services 17,004 2,373 2,986 Supplies and Services 82,209 7,103 4,237 Depreciation 6,583 5,335 259 Benefit Expense - - -
Total Operating Expenses 105,796 14,811 7,482
Operating Income (Loss) 20,316 (279) 1,650
Nonoperating Revenues (Expenses): Investment and Interest Income 6 - - Gain (Loss) on Disposal of Capital Assets - (104) - Interest Expense (910) (12) - Other Revenues 100 - 5
Total Nonoperating Revenues (Expenses) (803) (116) 5
Net Income (Loss) 19,512 (394) 1,655
Transfers In 33 584 10 Transfers Out (3,453) (297) (1,483)
Net Change in Fund Equity 16,092 (107) 182
Total Fund Equity, Beginning 21,221 (814) 1,267
Total Fund Equity, Ending $ 37,314 $ (921) $ 1,449
196

Facilities
Operations Badger and Risk State
Maintenance Management Industries Totals
$ 51,905 $ 27,192 $ 18,864 $ 246,452 6 - - 1,291
51,911 27,192 18,864 247,743
15,410 1,237 6,445 45,455 17,554 4,051 14,056 129,210 8,781 56 445 21,459
- 14,627 - 14,627
41,746 19,972 20,946 210,752
10,165 7,220 (2,082) 36,991
38 - 1 46 (111) - 10 (205)
(8,676) - (40) (9,637) 1,030 18 - 1,153
(7,719) 18 (28) (8,644)
2,446 7,238 (2,110) 28,347
6,250 - 878 7,755 (9,559) (24) (105) (14,921)
(863) 7,214 (1,337) 21,181
78,419 (116,526) 13,290 (3,143)
$ 77,557 $ (109,313) $ 11,953 $ 18,038
197
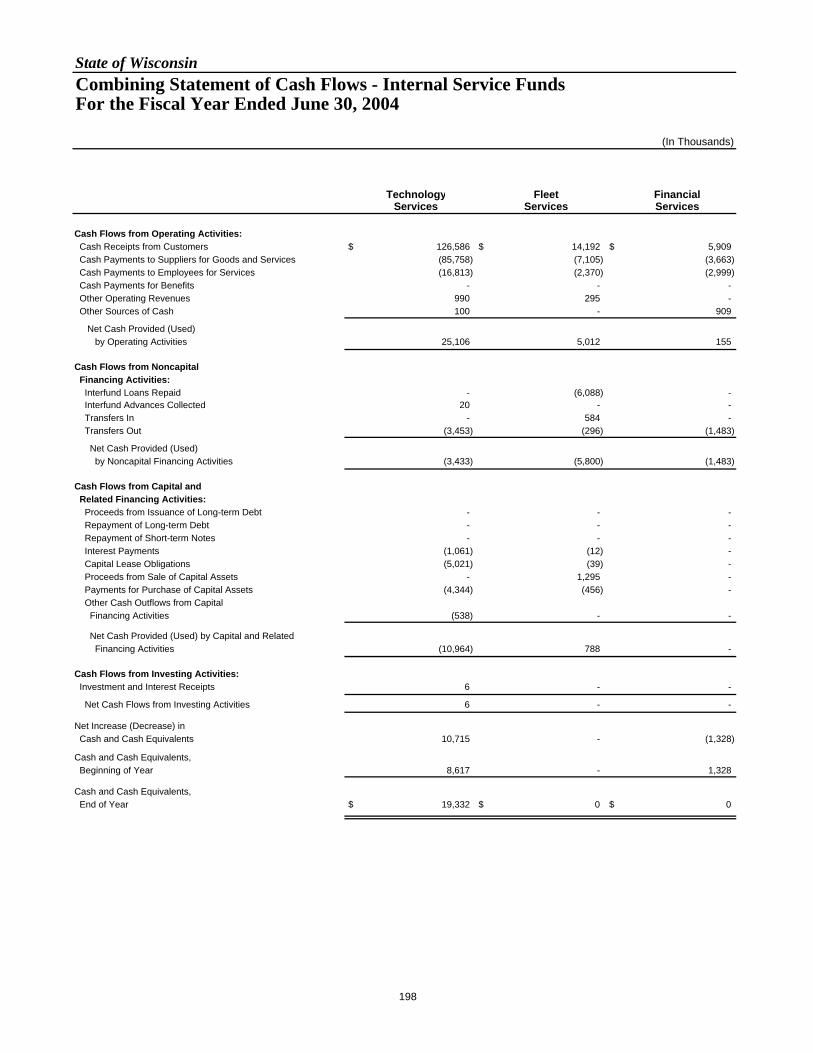
State of WisconsinCombining Statement of Cash Flows - Internal Service Funds For the Fiscal Year Ended June 30, 2004
(In Thousands)
Technology Fleet FinancialServices Services Services
Cash Flows from Operating Activities: Cash Receipts from Customers $ 126,586 $ 14,192 $ 5,909 Cash Payments to Suppliers for Goods and Services (85,758) (7,105) (3,663) Cash Payments to Employees for Services (16,813) (2,370) (2,999) Cash Payments for Benefits - - - Other Operating Revenues 990 295 - Other Sources of Cash 100 - 909
Net Cash Provided (Used) by Operating Activities 25,106 5,012 155
Cash Flows from Noncapital Financing Activities: Interfund Loans Repaid - (6,088) - Interfund Advances Collected 20 - - Transfers In - 584 - Transfers Out (3,453) (296) (1,483)
Net Cash Provided (Used) by Noncapital Financing Activities (3,433) (5,800) (1,483)
Cash Flows from Capital and Related Financing Activities: Proceeds from Issuance of Long-term Debt - - - Repayment of Long-term Debt - - - Repayment of Short-term Notes - - - Interest Payments (1,061) (12) - Capital Lease Obligations (5,021) (39) - Proceeds from Sale of Capital Assets - 1,295 - Payments for Purchase of Capital Assets (4,344) (456) - Other Cash Outflows from Capital Financing Activities (538) - -
Net Cash Provided (Used) by Capital and Related Financing Activities (10,964) 788 -
Cash Flows from Investing Activities: Investment and Interest Receipts 6 - -
Net Cash Flows from Investing Activities 6 - -
Net Increase (Decrease) in Cash and Cash Equivalents 10,715 - (1,328)
Cash and Cash Equivalents, Beginning of Year 8,617 - 1,328
Cash and Cash Equivalents, End of Year $ 19,332 $ 0 $ 0
198
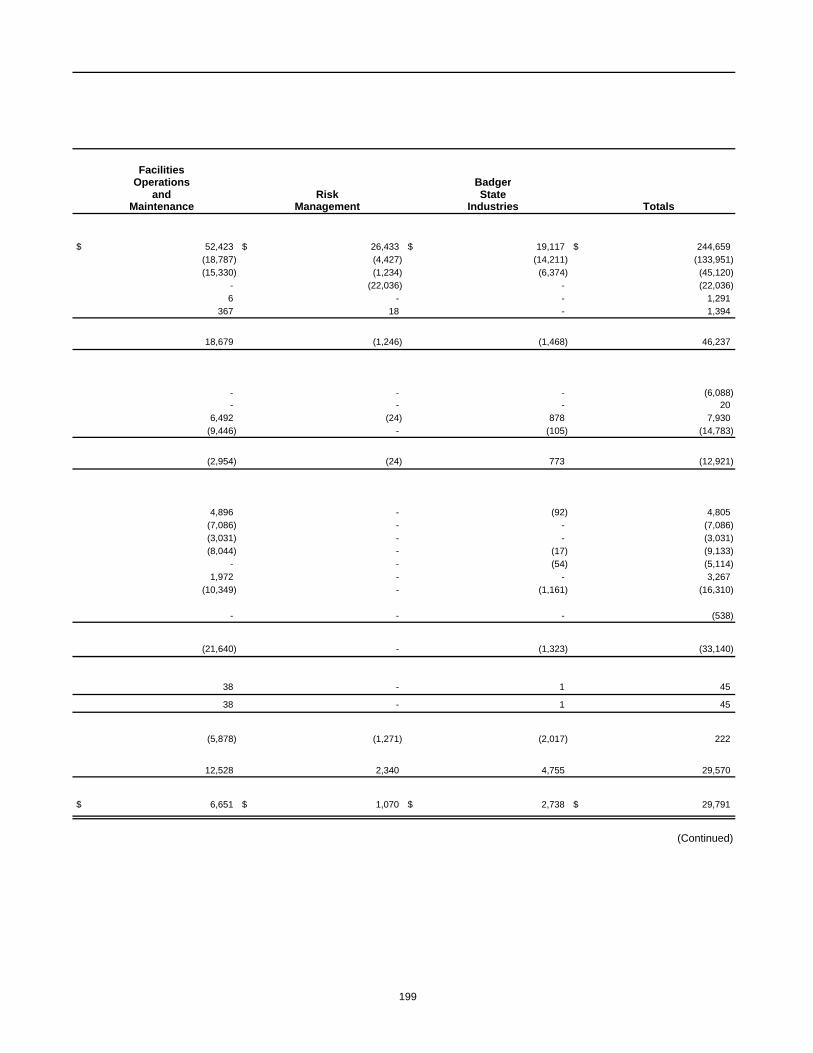
Facilities Operations Badger
and Risk State Maintenance Management Industries Totals
$ 52,423 $ 26,433 $ 19,117 $ 244,659
(18,787) (4,427) (14,211) (133,951)(15,330) (1,234) (6,374) (45,120)
- (22,036) - (22,036)6 - - 1,291
367 18 - 1,394
18,679 (1,246) (1,468) 46,237
- - - (6,088)- - - 20
6,492 (24) 878 7,930(9,446) - (105) (14,783)
(2,954) (24) 773 (12,921)
4,896 - (92) 4,805(7,086) - - (7,086)(3,031) - - (3,031)(8,044) - (17) (9,133)
- - (54) (5,114)1,972 - - 3,267
(10,349) - (1,161) (16,310)
- - - (538)
(21,640) - (1,323) (33,140)
38 - 1 45
38 - 1 45
(5,878) (1,271) (2,017) 222
12,528 2,340 4,755 29,570
$ 6,651 $ 1,070 $ 2,738 $ 29,791
(Continued)
199
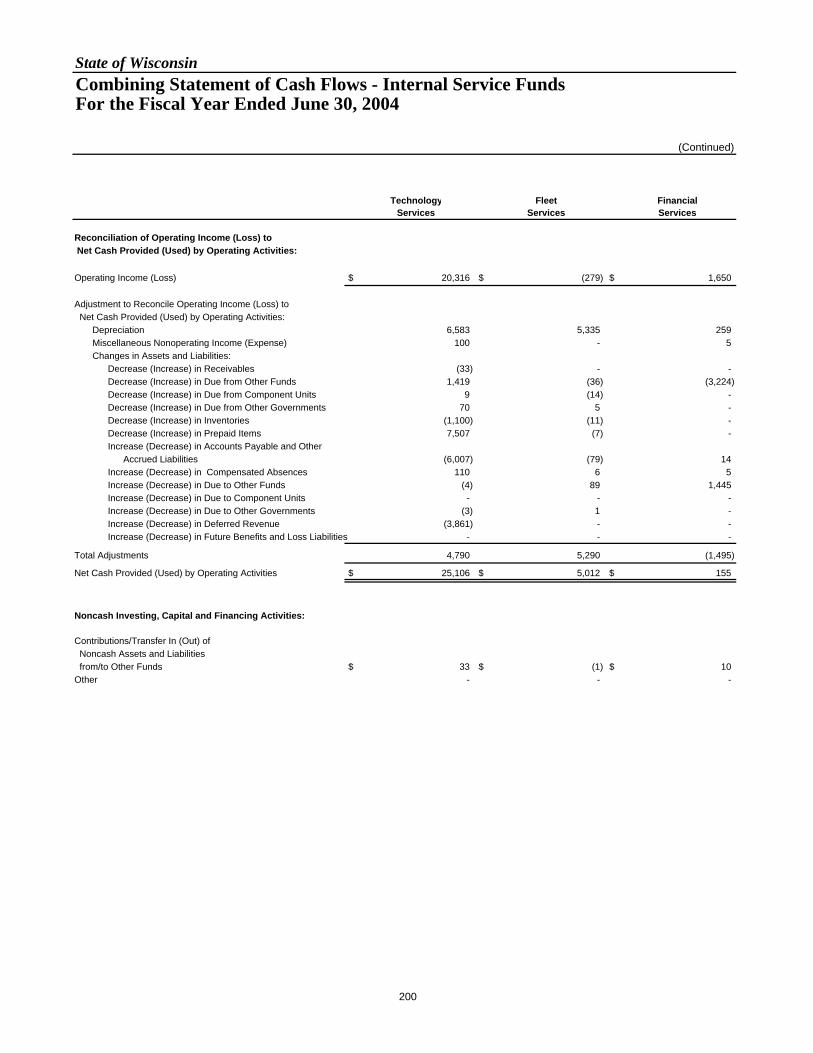
State of WisconsinCombining Statement of Cash Flows - Internal Service Funds For the Fiscal Year Ended June 30, 2004
(Continued)
Technology Fleet FinancialServices Services Services
Reconciliation of Operating Income (Loss) to Net Cash Provided (Used) by Operating Activities:
Operating Income (Loss) $ 20,316 $ (279) $ 1,650
Adjustment to Reconcile Operating Income (Loss) to Net Cash Provided (Used) by Operating Activities: Depreciation 6,583 5,335 259 Miscellaneous Nonoperating Income (Expense) 100 - 5 Changes in Assets and Liabilities: Decrease (Increase) in Receivables (33) - - Decrease (Increase) in Due from Other Funds 1,419 (36) (3,224) Decrease (Increase) in Due from Component Units 9 (14) - Decrease (Increase) in Due from Other Governments 70 5 - Decrease (Increase) in Inventories (1,100) (11) - Decrease (Increase) in Prepaid Items 7,507 (7) - Increase (Decrease) in Accounts Payable and Other Accrued Liabilities (6,007) (79) 14 Increase (Decrease) in Compensated Absences 110 6 5 Increase (Decrease) in Due to Other Funds (4) 89 1,445 Increase (Decrease) in Due to Component Units - - - Increase (Decrease) in Due to Other Governments (3) 1 - Increase (Decrease) in Deferred Revenue (3,861) - - Increase (Decrease) in Future Benefits and Loss Liabilities - - -
Total Adjustments 4,790 5,290 (1,495)
Net Cash Provided (Used) by Operating Activities $ 25,106 $ 5,012 $ 155
Noncash Investing, Capital and Financing Activities:
Contributions/Transfer In (Out) of Noncash Assets and Liabilities from/to Other Funds $ 33 $ (1) $ 10 Other - - -
200

Facilities Operations Badger
and Risk State Maintenance Management Industries Totals
$ 10,165 $ 7,220 $ (2,082) $ 36,991
8,781 56 445 21,459776 18 - 899
11 - 313 291516 (759) (11) (2,095)56 - (2) 48
(65) - (12) (2)125 - (77) (1,062)
(4) (1) (12) 7,484
(713) (374) 266 (6,893)13 3 9 146
(960) - (302) 268- - (3) (3)
(23) - 1 (24)- - - (3,861)- (7,409) - (7,409)
8,514 (8,467) 614 9,246
$ 18,679 $ (1,246) $ (1,468) $ 46,237
$ - $ - $ - $ 42- - 10 10
201

202
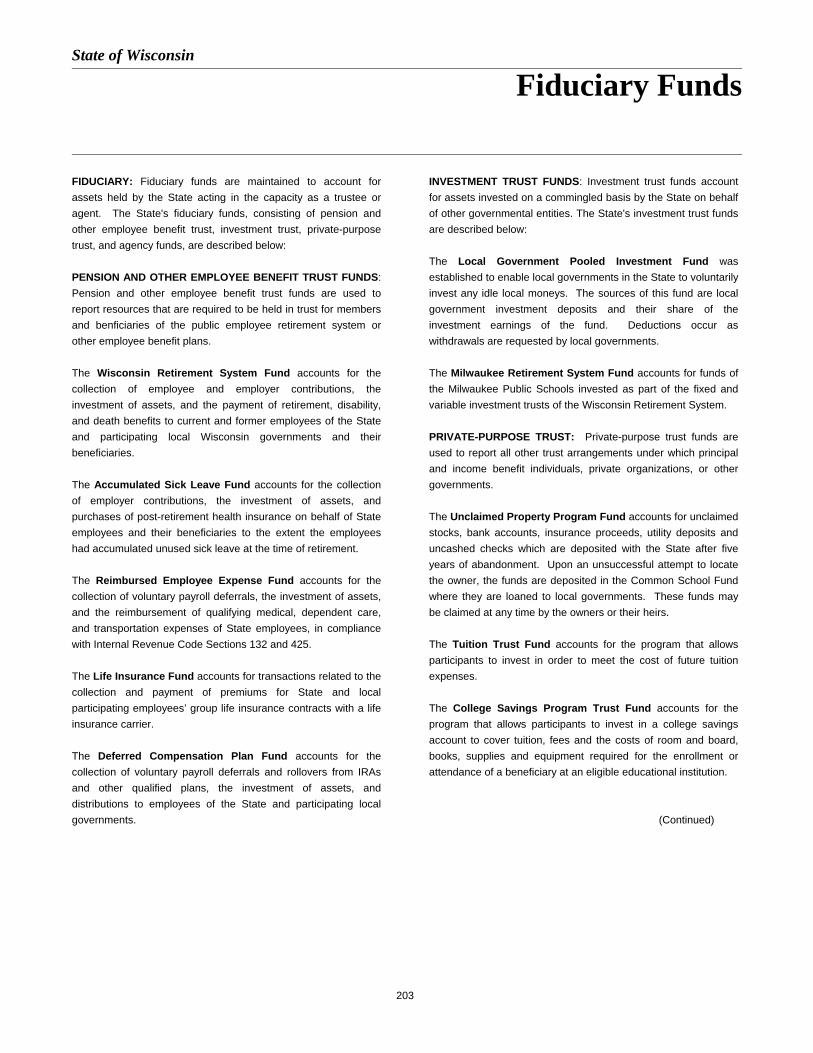
State of Wisconsin
Fiduciary Funds
203
FIDUCIARY: Fiduciary funds are maintained to account forassets held by the State acting in the capacity as a trustee oragent. The State's fiduciary funds, consisting of pension andother employee benefit trust, investment trust, private-purposetrust, and agency funds, are described below:
PENSION AND OTHER EMPLOYEE BENEFIT TRUST FUNDS:Pension and other employee benefit trust funds are used toreport resources that are required to be held in trust for membersand benficiaries of the public employee retirement system orother employee benefit plans.
The Wisconsin Retirement System Fund accounts for thecollection of employee and employer contributions, theinvestment of assets, and the payment of retirement, disability,and death benefits to current and former employees of the Stateand participating local Wisconsin governments and theirbeneficiaries.
The Accumulated Sick Leave Fund accounts for the collectionof employer contributions, the investment of assets, andpurchases of post-retirement health insurance on behalf of Stateemployees and their beneficiaries to the extent the employeeshad accumulated unused sick leave at the time of retirement.
The Reimbursed Employee Expense Fund accounts for thecollection of voluntary payroll deferrals, the investment of assets,and the reimbursement of qualifying medical, dependent care,and transportation expenses of State employees, in compliancewith Internal Revenue Code Sections 132 and 425.
The Life Insurance Fund accounts for transactions related to thecollection and payment of premiums for State and localparticipating employees’ group life insurance contracts with a lifeinsurance carrier.
The Deferred Compensation Plan Fund accounts for thecollection of voluntary payroll deferrals and rollovers from IRAsand other qualified plans, the investment of assets, anddistributions to employees of the State and participating localgovernments.
INVESTMENT TRUST FUNDS: Investment trust funds accountfor assets invested on a commingled basis by the State on behalfof other governmental entities. The State's investment trust fundsare described below:
The Local Government Pooled Investment Fund wasestablished to enable local governments in the State to voluntarilyinvest any idle local moneys. The sources of this fund are localgovernment investment deposits and their share of theinvestment earnings of the fund. Deductions occur aswithdrawals are requested by local governments.
The Milwaukee Retirement System Fund accounts for funds ofthe Milwaukee Public Schools invested as part of the fixed andvariable investment trusts of the Wisconsin Retirement System.
PRIVATE-PURPOSE TRUST: Private-purpose trust funds areused to report all other trust arrangements under which principaland income benefit individuals, private organizations, or othergovernments.
The Unclaimed Property Program Fund accounts for unclaimedstocks, bank accounts, insurance proceeds, utility deposits anduncashed checks which are deposited with the State after fiveyears of abandonment. Upon an unsuccessful attempt to locatethe owner, the funds are deposited in the Common School Fundwhere they are loaned to local governments. These funds maybe claimed at any time by the owners or their heirs.
The Tuition Trust Fund accounts for the program that allowsparticipants to invest in order to meet the cost of future tuitionexpenses.
The College Savings Program Trust Fund accounts for theprogram that allows participants to invest in a college savingsaccount to cover tuition, fees and the costs of room and board,books, supplies and equipment required for the enrollment orattendance of a beneficiary at an eligible educational institution.
(Continued)

204
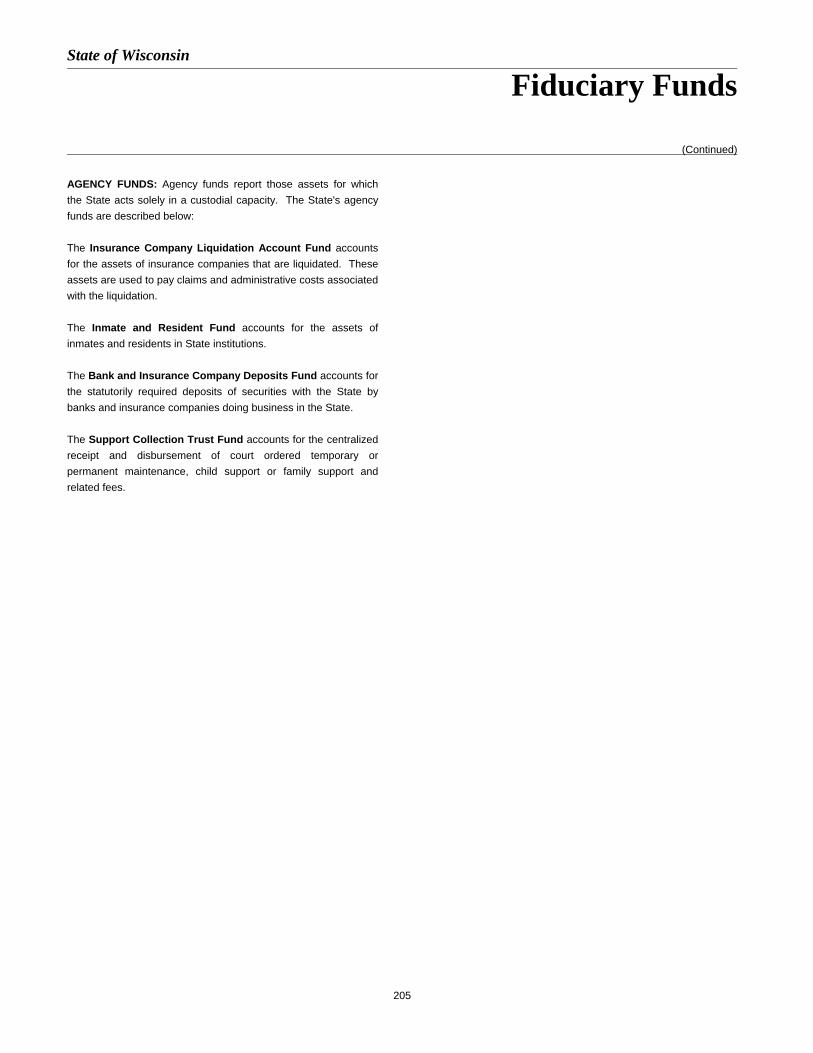
State of Wisconsin
Fiduciary Funds
(Continued)
205
AGENCY FUNDS: Agency funds report those assets for whichthe State acts solely in a custodial capacity. The State's agencyfunds are described below:
The Insurance Company Liquidation Account Fund accountsfor the assets of insurance companies that are liquidated. Theseassets are used to pay claims and administrative costs associatedwith the liquidation.
The Inmate and Resident Fund accounts for the assets ofinmates and residents in State institutions.
The Bank and Insurance Company Deposits Fund accounts forthe statutorily required deposits of securities with the State bybanks and insurance companies doing business in the State.
The Support Collection Trust Fund accounts for the centralizedreceipt and disbursement of court ordered temporary orpermanent maintenance, child support or family support andrelated fees.
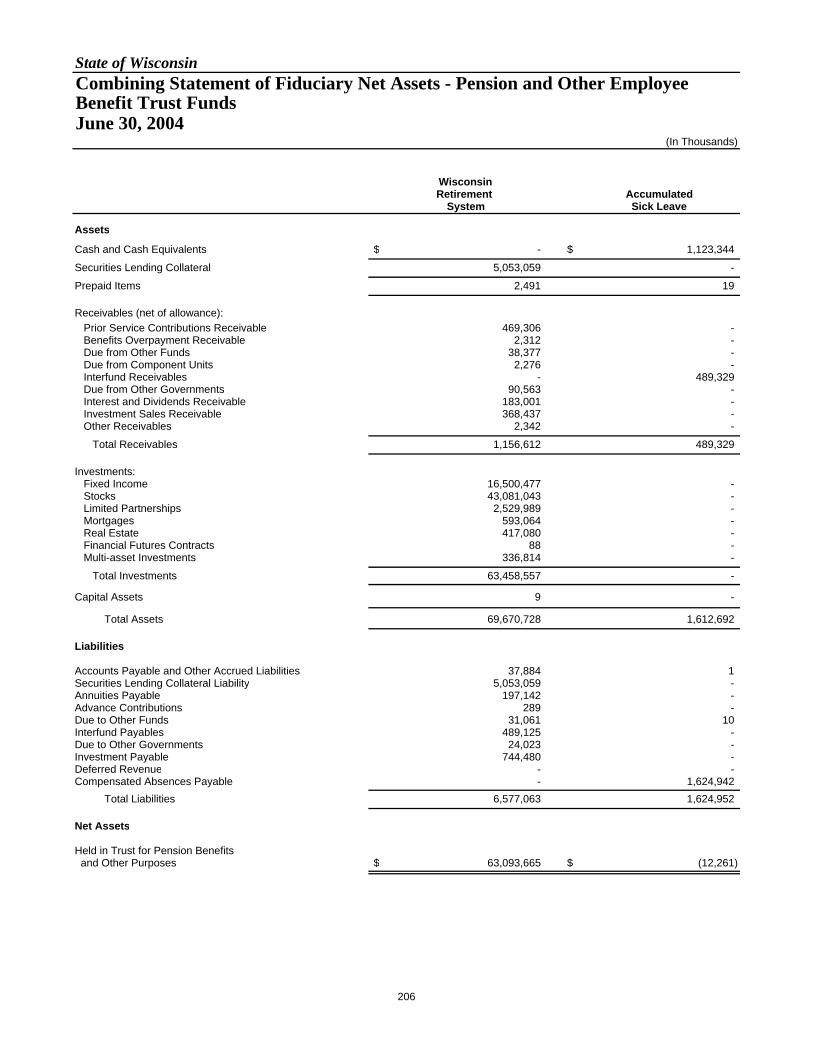
State of WisconsinCombining Statement of Fiduciary Net Assets - Pension and Other Employee Benefit Trust Funds June 30, 2004
(In Thousands)
WisconsinRetirement Accumulated
System Sick Leave
Assets
Cash and Cash Equivalents $ - $ 1,123,344 Securities Lending Collateral 5,053,059 - Prepaid Items 2,491 19
Receivables (net of allowance): Prior Service Contributions Receivable 469,306 - Benefits Overpayment Receivable 2,312 - Due from Other Funds 38,377 - Due from Component Units 2,276 - Interfund Receivables - 489,329 Due from Other Governments 90,563 - Interest and Dividends Receivable 183,001 - Investment Sales Receivable 368,437 - Other Receivables 2,342 - Total Receivables 1,156,612 489,329
Investments: Fixed Income 16,500,477 - Stocks 43,081,043 - Limited Partnerships 2,529,989 - Mortgages 593,064 - Real Estate 417,080 - Financial Futures Contracts 88 - Multi-asset Investments 336,814 - Total Investments 63,458,557 -
Capital Assets 9 -
Total Assets 69,670,728 1,612,692
Liabilities
Accounts Payable and Other Accrued Liabilities 37,884 1 Securities Lending Collateral Liability 5,053,059 - Annuities Payable 197,142 - Advance Contributions 289 - Due to Other Funds 31,061 10 Interfund Payables 489,125 - Due to Other Governments 24,023 - Investment Payable 744,480 - Deferred Revenue - - Compensated Absences Payable - 1,624,942 Total Liabilities 6,577,063 1,624,952
Net Assets
Held in Trust for Pension Benefits and Other Purposes $ 63,093,665 $ (12,261)
206
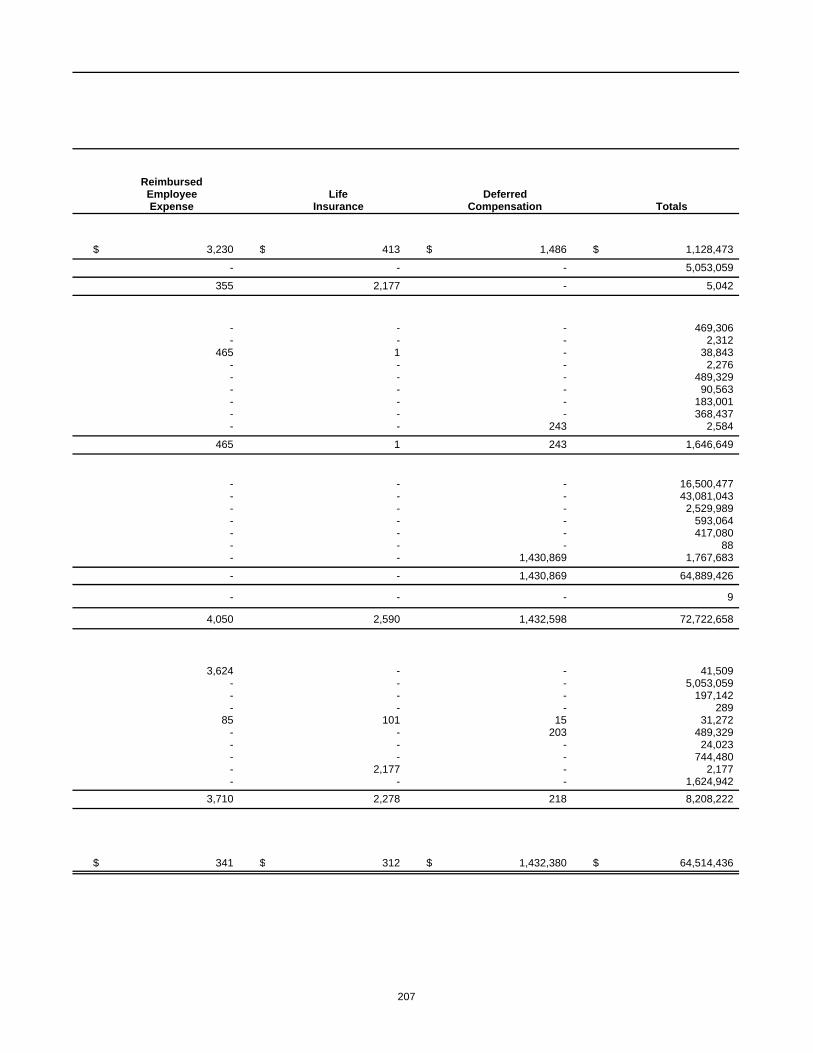
ReimbursedEmployee Life DeferredExpense Insurance Compensation Totals
$ 3,230 $ 413 $ 1,486 $ 1,128,473 - - - 5,053,059
355 2,177 - 5,042
- - - 469,306 - - - 2,312
465 1 - 38,843 - - - 2,276 - - - 489,329 - - - 90,563 - - - 183,001 - - - 368,437 - - 243 2,584
465 1 243 1,646,649
- - - 16,500,477 - - - 43,081,043 - - - 2,529,989 - - - 593,064 - - - 417,080 - - - 88 - - 1,430,869 1,767,683 - - 1,430,869 64,889,426
- - - 9
4,050 2,590 1,432,598 72,722,658
3,624 - - 41,509 - - - 5,053,059 - - - 197,142 - - - 289
85 101 15 31,272 - - 203 489,329 - - - 24,023 - - - 744,480 - 2,177 - 2,177 - - - 1,624,942
3,710 2,278 218 8,208,222
$ 341 $ 312 $ 1,432,380 $ 64,514,436
207

State of WisconsinCombining Statement of Changes in Fiduciary Net Assets - Pension and Other Employee Benefit Trust Funds For the Fiscal Year Ended June 30, 2004
(In Thousands)
WisconsinRetirement Accumulated
System Sick Leave
AdditionsContributions: Employer Contributions $ 487,964 $ 840,183 Employee Contributions 582,499 -
Total Contributions 1,070,463 840,183
Investment Income: Net Appreciation (Depreciation) in Fair Value of Investments 8,498,783 - Interest 548,335 - Dividends 304,237 - Securities Lending Income 46,074 - Other 97,994 - Investment Income of Investment, Private Purpose and Other Employee Trust Funds - 219,910 Less: Investment Expense (146,551) - Securities Lending Rebates and Fees (37,329) - Investment Income Distributed to Other Funds (306,119) - Net Investment Income 9,005,424 219,910
Interest on Prior Service Receivable 36,119 -
Miscellaneous Income: Other 803 -
Total Additions 10,112,811 1,060,093
Deductions
Benefits and Refunds: Retirement, Disability, and Beneficiary 2,744,709 - Separations 23,777 -
Total Benefits and Refunds 2,768,486 -
Distributions - -
Insurance Premiums - 383,986
Unusual Write-off of Receivable (159) -
Administrative Expense 14,208 58
Miscellaneous Expense 5 -
Interfund Transfer Out 488 -
Total Deductions 2,783,029 384,043
Net Increase (Decrease) 7,329,782 676,050 Net Assets - Beginning of Year 55,763,883 (688,311)
Net Assets - End of Year $ 63,093,665 $ (12,261)
208

ReimbursedEmployee Life DeferredExpense Insurance Compensation Totals
$ - $ 5,581 $ - $ 1,333,728 21,489 31,674 123,032 758,694
21,489 37,254 123,032 2,092,422
- - - 8,498,783 - - - 548,335 - - - 304,237 - - - 46,074 - - - 97,994
49 15 196,157 416,130
- - - (146,551) - - - (37,329)
- - - (306,119) 49 15 196,157 9,421,555
- - - 36,119
- 629 948 2,380
21,538 37,898 320,137 11,552,476
- - - 2,744,709 - - - 23,777
- - - 2,768,486
20,830 - 53,702 74,533
- 37,254 - 421,240
- - - (159)
801 624 2,723 18,415
- - - 5
- - - 488
21,632 37,878 56,425 3,283,007
(94) 19 263,712 8,269,469 434 293 1,168,668 56,244,967
$ 341 $ 312 $ 1,432,380 $ 64,514,436
209

State of WisconsinCombining Statement of Fiduciary Net Assets - Investment Trust Funds June 30, 2004
(In Thousands)
LocalGovernment Milwaukee
Pooled RetirementInvestment System Totals
Assets
Cash and Cash Equivalents $ 2,482,191 $ 91,070 $ 2,573,261 Interfund Receivables 627,765 - 627,765
Total Assets 3,109,956 91,070 3,201,026
Liabilities
Due to Other Funds 16 - 16 Total Liabilities 16 - 16
Net Assets
Held in Trust for Pool Participants and Other Purposes $ 3,109,940 $ 91,070 $ 3,201,010
210
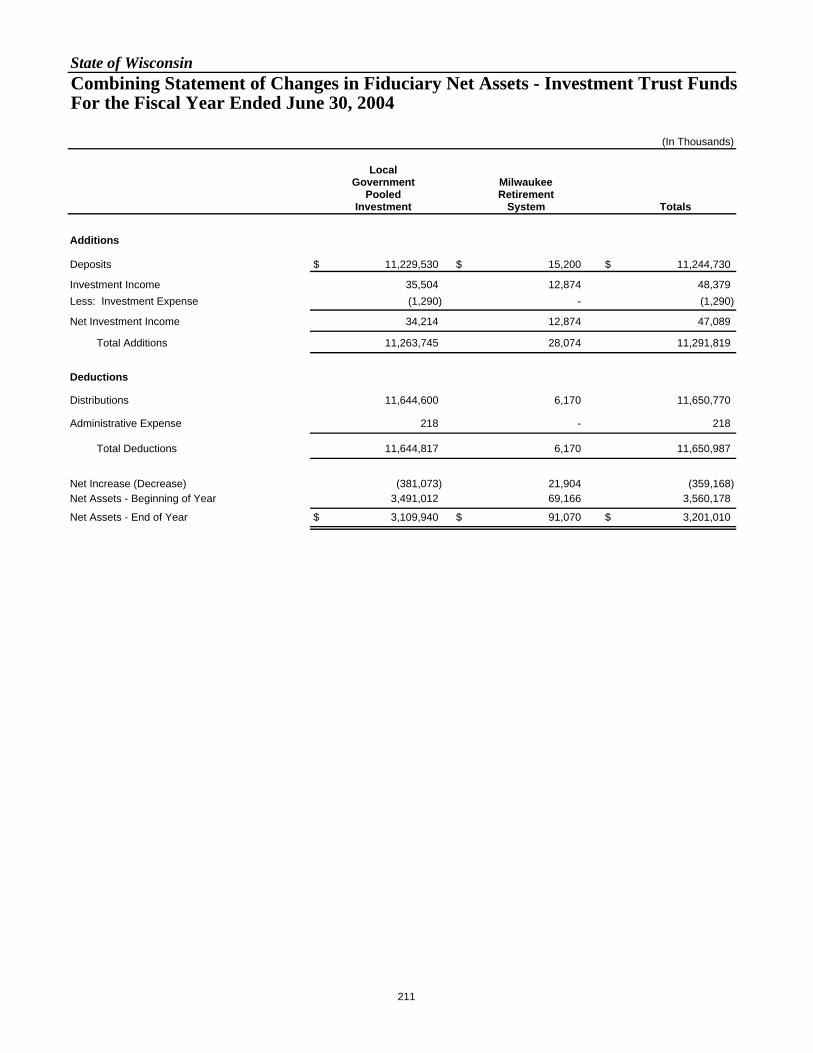
State of WisconsinCombining Statement of Changes in Fiduciary Net Assets - Investment Trust FundsFor the Fiscal Year Ended June 30, 2004
(In Thousands)
LocalGovernment Milwaukee
Pooled RetirementInvestment System Totals
Additions
Deposits $ 11,229,530 $ 15,200 $ 11,244,730
Investment Income 35,504 12,874 48,379 Less: Investment Expense (1,290) - (1,290)
Net Investment Income 34,214 12,874 47,089
Total Additions 11,263,745 28,074 11,291,819
Deductions
Distributions 11,644,600 6,170 11,650,770
Administrative Expense 218 - 218
Total Deductions 11,644,817 6,170 11,650,987
Net Increase (Decrease) (381,073) 21,904 (359,168) Net Assets - Beginning of Year 3,491,012 69,166 3,560,178
Net Assets - End of Year $ 3,109,940 $ 91,070 $ 3,201,010
211
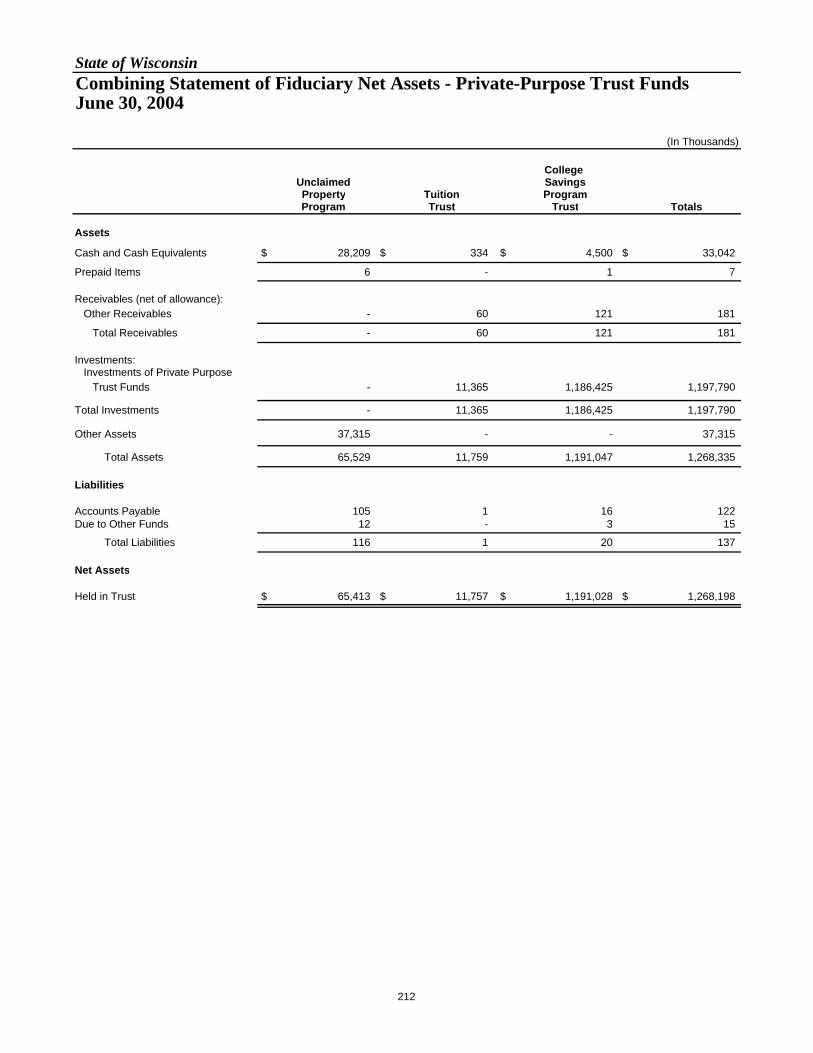
State of WisconsinCombining Statement of Fiduciary Net Assets - Private-Purpose Trust Funds June 30, 2004
(In Thousands)
College Unclaimed SavingsProperty Tuition ProgramProgram Trust Trust Totals
Assets
Cash and Cash Equivalents $ 28,209 $ 334 $ 4,500 $ 33,042
Prepaid Items 6 - 1 7
Receivables (net of allowance): Other Receivables - 60 121 181
Total Receivables - 60 121 181
Investments: Investments of Private Purpose Trust Funds - 11,365 1,186,425 1,197,790
Total Investments - 11,365 1,186,425 1,197,790
Other Assets 37,315 - - 37,315
Total Assets 65,529 11,759 1,191,047 1,268,335
Liabilities
Accounts Payable 105 1 16 122 Due to Other Funds 12 - 3 15
Total Liabilities 116 1 20 137
Net Assets
Held in Trust $ 65,413 $ 11,757 $ 1,191,028 $ 1,268,198
212

State of WisconsinCombining Statement of Changes in Fiduciary Net Assets - Private-Purpose Trust Funds For the Fiscal Year Ended June 30, 2004
(In Thousands)
College Unclaimed SavingsProperty Tuition ProgramProgram Trust Trust Totals
AdditionsDeposits $ - $ 114 $ 350,905 $ 351,020
Investment Income - (301) 138,644 138,343 Less: Investment Expense - - (6,468) (6,468)
Net Investment Income - (301) 132,175 131,875
Miscellaneous Income Escheat Additions 81,026 - - 81,026
Total Miscellaneous Income 81,026 - - 81,026
Total Additions 81,026 (186) 483,081 563,921
Deductions
Distributions 11,260 1,383 146,275 158,918
Administrative Expense 8,357 63 2,227 10,646
Transfers Out 20,026 - 11 20,036
Total Deductions 39,642 1,446 148,513 189,601
Net Increase (Decrease) 41,383 (1,632) 334,568 374,320 Net Assets - Beginning of Year 24,029 13,389 856,460 893,878
Net Assets - End of Year $ 65,413 $ 11,757 $ 1,191,028 $ 1,268,198
213
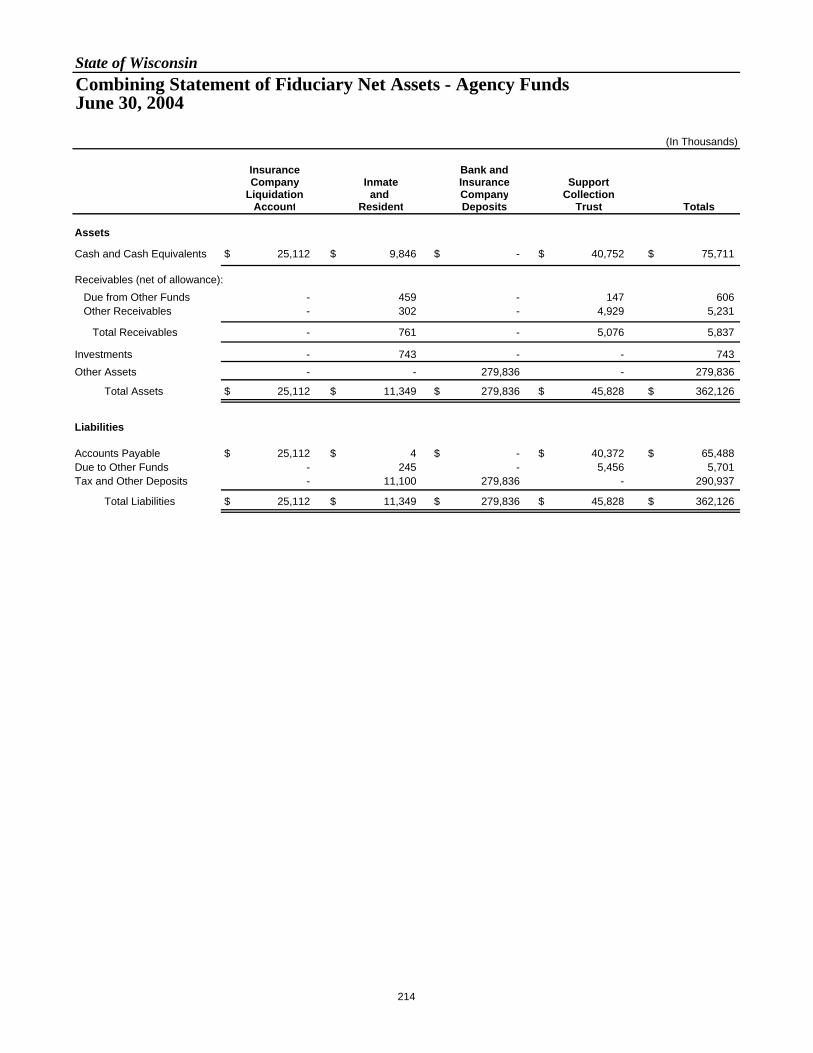
State of WisconsinCombining Statement of Fiduciary Net Assets - Agency Funds June 30, 2004
(In Thousands)
Insurance Bank andCompany Inmate Insurance Support
Liquidation and Company CollectionAccount Resident Deposits Trust Totals
Assets
Cash and Cash Equivalents $ 25,112 $ 9,846 $ - $ 40,752 $ 75,711
Receivables (net of allowance): Due from Other Funds - 459 - 147 606 Other Receivables - 302 - 4,929 5,231
Total Receivables - 761 - 5,076 5,837
Investments - 743 - - 743 Other Assets - - 279,836 - 279,836
Total Assets $ 25,112 $ 11,349 $ 279,836 $ 45,828 $ 362,126
Liabilities
Accounts Payable $ 25,112 $ 4 $ - $ 40,372 $ 65,488 Due to Other Funds - 245 - 5,456 5,701 Tax and Other Deposits - 11,100 279,836 - 290,937
Total Liabilities $ 25,112 $ 11,349 $ 279,836 $ 45,828 $ 362,126
214
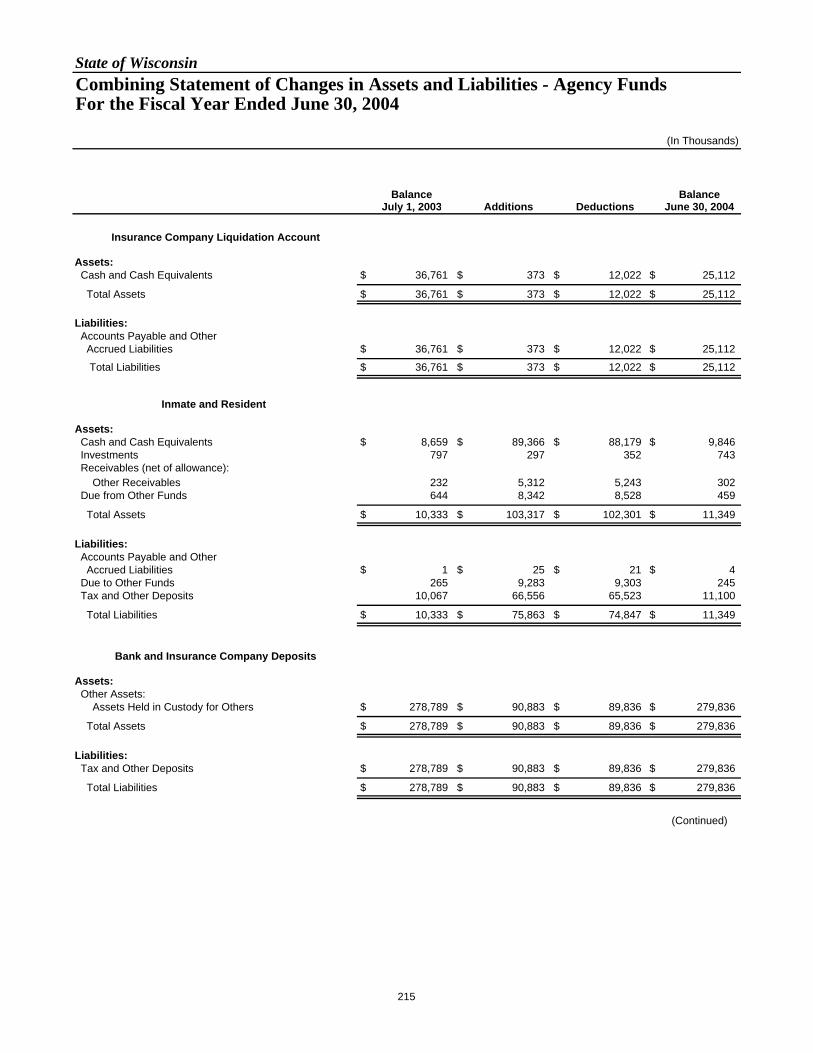
State of Wisconsin
Combining Statement of Changes in Assets and Liabilities - Agency Funds For the Fiscal Year Ended June 30, 2004
(In Thousands)
Balance BalanceJuly 1, 2003 Additions Deductions June 30, 2004
Insurance Company Liquidation Account
Assets: Cash and Cash Equivalents $ 36,761 $ 373 $ 12,022 $ 25,112
Total Assets $ 36,761 $ 373 $ 12,022 $ 25,112
Liabilities: Accounts Payable and Other Accrued Liabilities $ 36,761 $ 373 $ 12,022 $ 25,112 Total Liabilities $ 36,761 $ 373 $ 12,022 $ 25,112
Inmate and Resident
Assets: Cash and Cash Equivalents $ 8,659 $ 89,366 $ 88,179 $ 9,846 Investments 797 297 352 743 Receivables (net of allowance): Other Receivables 232 5,312 5,243 302 Due from Other Funds 644 8,342 8,528 459
Total Assets $ 10,333 $ 103,317 $ 102,301 $ 11,349
Liabilities: Accounts Payable and Other Accrued Liabilities $ 1 $ 25 $ 21 $ 4 Due to Other Funds 265 9,283 9,303 245 Tax and Other Deposits 10,067 66,556 65,523 11,100
Total Liabilities $ 10,333 $ 75,863 $ 74,847 $ 11,349
Bank and Insurance Company Deposits
Assets: Other Assets: Assets Held in Custody for Others $ 278,789 $ 90,883 $ 89,836 $ 279,836
Total Assets $ 278,789 $ 90,883 $ 89,836 $ 279,836
Liabilities: Tax and Other Deposits $ 278,789 $ 90,883 $ 89,836 $ 279,836
Total Liabilities $ 278,789 $ 90,883 $ 89,836 $ 279,836
(Continued)
215

State of Wisconsin
Combining Statement of Changes in Assets and Liabilities - Agency Funds For the Fiscal Year Ended June 30, 2004
(Continued)
Balance BalanceJuly 1, 2003 Additions Deductions June 30, 2004
Support Collection Trust
Assets: Cash and Cash Equivalents $ 39,989 $ 1,979,811 $ 1,979,048 $ 40,752 Receivables (net of allowance): Other Receivables 1,610 7,524 4,205 4,929 Due from Other Funds 288 4,901 5,042 147
Total Assets $ 41,887 $ 1,992,236 $ 1,988,295 $ 45,828
Liabilities: Accounts Payable and Other Accrued Liabilities $ 37,197 $ 46,091 $ 42,916 $ 40,372 Due to Other Funds 4,690 11,401 10,635 5,456
Total Liabilities $ 41,887 $ 57,492 $ 53,551 $ 45,828
Total - All Agency Funds
Assets: Cash and Cash Equivalents $ 85,410 $ 2,069,549 $ 2,079,248 $ 75,711 Investments 797 297 352 743 Receivables (net of allowance): Other Receivables 1,842 12,836 9,448 5,231 Due from Other Funds 932 13,243 13,570 606 Other Assets: Assets Held in Custody for Others 278,789 90,883 89,836 279,836
Total Assets $ 367,771 $ 2,186,809 $ 2,192,454 $ 362,126
Liabilities: Accounts Payable and Other Accrued Liabilities $ 73,959 $ 46,488 $ 54,958 $ 65,488 Due to Other Funds 4,955 20,684 19,938 5,701 Tax and Other Deposits 288,856 157,440 155,359 290,937
Total Liabilities $ 367,771 $ 224,612 $ 230,256 $ 362,126
216

STATISTICAL SECTION
217
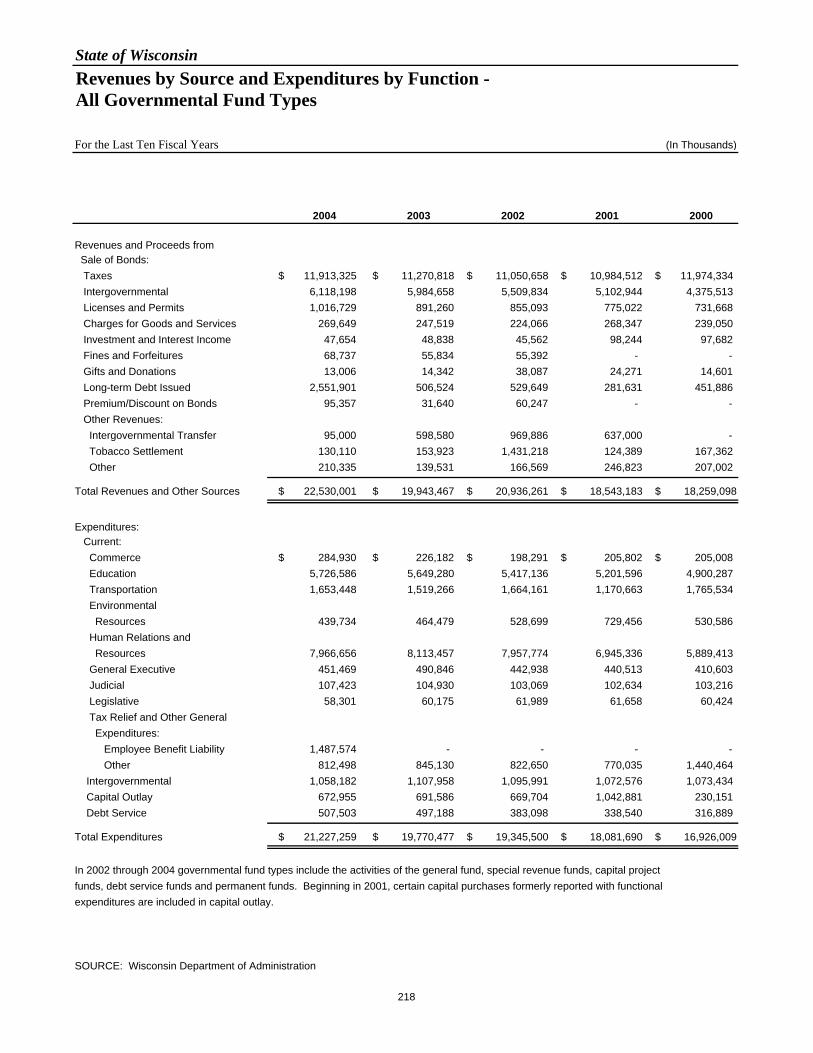
State of WisconsinRevenues by Source and Expenditures by Function - All Governmental Fund Types
For the Last Ten Fiscal Years (In Thousands)
2004 2003 2002 2001 2000
Revenues and Proceeds from Sale of Bonds: Taxes $ 11,913,325 $ 11,270,818 $ 11,050,658 $ 10,984,512 $ 11,974,334 Intergovernmental 6,118,198 5,984,658 5,509,834 5,102,944 4,375,513 Licenses and Permits 1,016,729 891,260 855,093 775,022 731,668 Charges for Goods and Services 269,649 247,519 224,066 268,347 239,050 Investment and Interest Income 47,654 48,838 45,562 98,244 97,682 Fines and Forfeitures 68,737 55,834 55,392 - - Gifts and Donations 13,006 14,342 38,087 24,271 14,601 Long-term Debt Issued 2,551,901 506,524 529,649 281,631 451,886 Premium/Discount on Bonds 95,357 31,640 60,247 - - Other Revenues: Intergovernmental Transfer 95,000 598,580 969,886 637,000 - Tobacco Settlement 130,110 153,923 1,431,218 124,389 167,362 Other 210,335 139,531 166,569 246,823 207,002
Total Revenues and Other Sources $ 22,530,001 $ 19,943,467 $ 20,936,261 $ 18,543,183 $ 18,259,098
Expenditures: Current: Commerce $ 284,930 $ 226,182 $ 198,291 $ 205,802 $ 205,008 Education 5,726,586 5,649,280 5,417,136 5,201,596 4,900,287 Transportation 1,653,448 1,519,266 1,664,161 1,170,663 1,765,534 Environmental Resources 439,734 464,479 528,699 729,456 530,586 Human Relations and Resources 7,966,656 8,113,457 7,957,774 6,945,336 5,889,413 General Executive 451,469 490,846 442,938 440,513 410,603 Judicial 107,423 104,930 103,069 102,634 103,216 Legislative 58,301 60,175 61,989 61,658 60,424 Tax Relief and Other General Expenditures: Employee Benefit Liability 1,487,574 - - - - Other 812,498 845,130 822,650 770,035 1,440,464 Intergovernmental 1,058,182 1,107,958 1,095,991 1,072,576 1,073,434 Capital Outlay 672,955 691,586 669,704 1,042,881 230,151 Debt Service 507,503 497,188 383,098 338,540 316,889
Total Expenditures $ 21,227,259 $ 19,770,477 $ 19,345,500 $ 18,081,690 $ 16,926,009
In 2002 through 2004 governmental fund types include the activities of the general fund, special revenue funds, capital projectfunds, debt service funds and permanent funds. Beginning in 2001, certain capital purchases formerly reported with functionalexpenditures are included in capital outlay.
SOURCE: Wisconsin Department of Administration
218
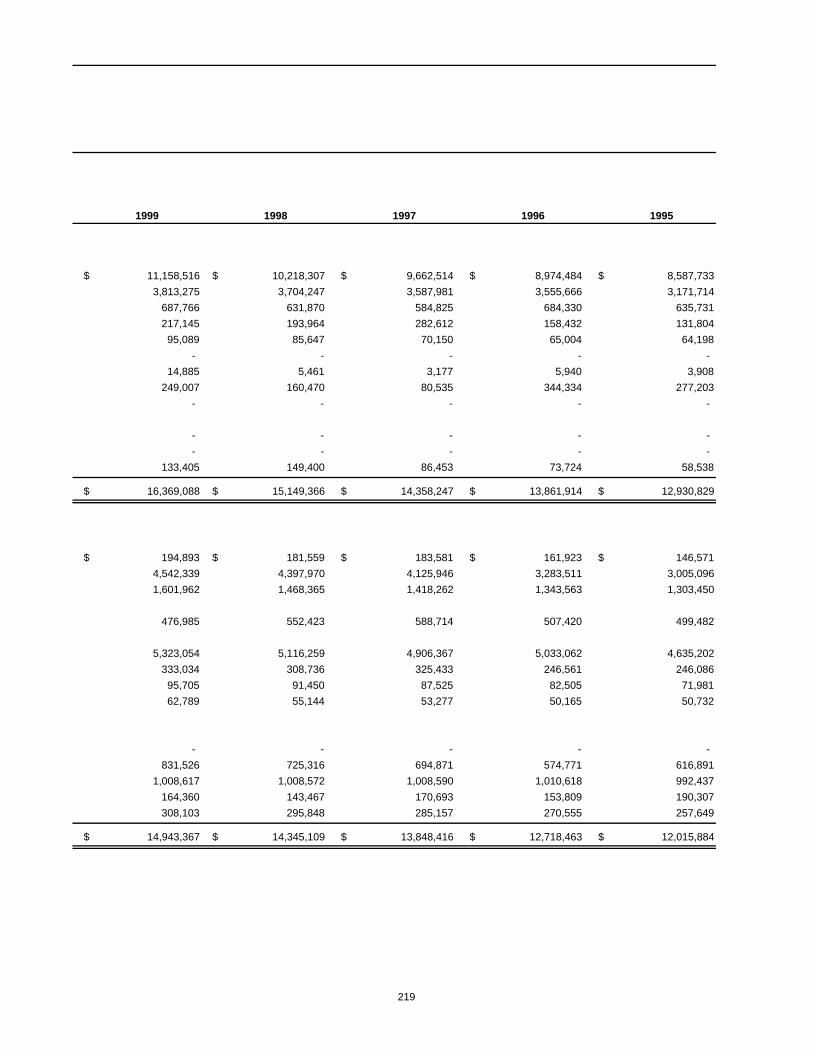
1999 1998 1997 1996 1995
$ 11,158,516 $ 10,218,307 $ 9,662,514 $ 8,974,484 $ 8,587,7333,813,275 3,704,247 3,587,981 3,555,666 3,171,714
687,766 631,870 584,825 684,330 635,731217,145 193,964 282,612 158,432 131,80495,089 85,647 70,150 65,004 64,198
- - - - - 14,885 5,461 3,177 5,940 3,908
249,007 160,470 80,535 344,334 277,203- - - - -
- - - - - - - - - -
133,405 149,400 86,453 73,724 58,538
$ 16,369,088 $ 15,149,366 $ 14,358,247 $ 13,861,914 $ 12,930,829
$ 194,893 $ 181,559 $ 183,581 $ 161,923 $ 146,5714,542,339 4,397,970 4,125,946 3,283,511 3,005,0961,601,962 1,468,365 1,418,262 1,343,563 1,303,450
476,985 552,423 588,714 507,420 499,482
5,323,054 5,116,259 4,906,367 5,033,062 4,635,202333,034 308,736 325,433 246,561 246,08695,705 91,450 87,525 82,505 71,98162,789 55,144 53,277 50,165 50,732
- - - - - 831,526 725,316 694,871 574,771 616,891
1,008,617 1,008,572 1,008,590 1,010,618 992,437164,360 143,467 170,693 153,809 190,307308,103 295,848 285,157 270,555 257,649
$ 14,943,367 $ 14,345,109 $ 13,848,416 $ 12,718,463 $ 12,015,884
219

State of WisconsinAssessed and Equalized Value of Taxable Property
For the Last Ten Years (In Thousands)
Ratio of Total Real Property Personal Property Total Assessed Value
Assessed Equalized Assessed Equalized Assessed Equalized To TotalYear (A) Value (B) Value Value (B) Value Value (B) Value Equalized Value
2003 $ 316,714,032 $ 351,117,098 $ 8,851,153 $ 9,593,114 $ 325,565,185 $ 360,710,212 90%2002 294,556,690 325,577,878 9,098,710 9,748,601 303,655,400 335,326,479 912001 271,139,540 302,795,906 8,901,978 9,687,800 280,041,518 312,483,706 902000 250,964,857 277,213,707 8,538,646 9,107,785 259,503,503 286,321,492 911999 232,669,301 258,023,890 8,031,429 8,543,624 240,700,730 266,567,514 901998 217,599,762 238,769,117 9,694,739 10,225,798 227,294,501 248,994,915 911997 201,938,959 223,570,764 8,956,300 9,503,469 210,895,259 233,074,233 901996 186,902,000 207,896,469 8,473,140 9,047,289 195,375,140 216,943,759 901995 173,908,997 192,505,594 8,394,885 9,032,516 182,303,882 201,538,109 901994 159,967,395 176,376,443 7,999,884 8,618,423 167,967,279 184,994,866 91
(A) Represents values certified to the Department of Revenue on August 15 of each year. Assessed values for 2004 are not yet available.(B) Municipalities assess property for tax purposes at different percentages of market value. Each community's assessment percentage is multiplied by the State-established market value of manufacturing property to determine the local assessed value of such property.
SOURCE: Wisconsin Department of Revenue
State of WisconsinState Forestation Tax
For the Last Ten Years (In Thousands)
StateForestation
Year Tax Collections
2004 $ 391,187,815 $ 78,238 $ 72,1242003 360,710,211 72,142 67,0702002 335,326,479 67,065 62,4952001 312,483,706 62,497 57,3622000 286,321,492 57,264 53,3101999 266,567,514 53,314 49,8141998 248,994,915 49,799 44,2521997 233,074,233 46,615 42,6611996 216,943,759 43,389 39,1041995 201,538,109 40,308 36,335
(A) Represents values certified to the Department of Revenue on August 15 of each year.(B) Tax levy equals two-tenths of one mill for each dollar of the equalized value certified by the Department of Revenue.
SOURCES: Wisconsin Department of Administration, Division of Executive Budget and Finance Wisconsin Department of Revenue Wisconsin Office of the State Treasurer
StateForestationTax Levy (B)
TotalEqualized Value (A)
220

State of WisconsinLegal Debt Margin
For the Last Ten Calendar Years (In Thousands)
Legal Debt Margin as a
Calendar Annual Debt Actual Legal Debt Percentage of Year Limit Borrowing (A) Margin Debt Limit
2004 (B) $ 2,933,909 $ 664,435 $ 2,269,474 77.4 %2003 2,705,327 499,030 2,206,297 81.62002 2,514,949 481,000 2,033,949 80.92001 2,343,628 485,645 1,857,983 79.32000 2,147,411 538,795 1,608,616 74.91999 1,999,256 482,360 1,516,896 75.91998 1,867,462 475,485 1,391,977 74.51997 1,748,057 404,310 1,343,747 76.91996 1,627,078 353,295 1,273,783 78.31995 1,511,536 368,322 1,143,214 75.6
Wis. Stat. Sec. 18.05 limits the amount of public debt contracted in any calendar year to the lesser of: (a) Three-fourths of one percent of the aggregate value of taxable property;
or (b) Five percent of aggregate value of taxable property Less: Net indebtedness at January 1
(A) Consists of bonds issued less refundings.(B) Debt issued through October 21, 2004.
SOURCE: Wisconsin Department of Administration
221

State of WisconsinRatio of Net General Obligation Bonded Debt and Notes to Assessed Value and Net General Obligation Bonded Debt and Notes Per Capita
For the Last Ten Fiscal Years (In Thousands)
General Obligation Bonded Debt and Commercial Paper
PayableDebt From Ratio To
Gross Service Proprietary Net AssessedAssessed Bonded Moneys Fund Bonded Value Per
Year Population Value (A) Debt (B) Available (C) Revenues (D) Debt (E) (Percent) Capita
2003 5,472 $ 325,565,185 $ 4,321,327 $ 12,085 $ 913,452 $ 3,395,790 1.04 $ 6212002 5,441 303,655,400 4,303,825 9,621 996,238 3,297,966 1.09 6062001 5,402 280,041,518 4,028,006 4,493 911,054 3,112,459 1.11 5762000 5,364 259,503,503 3,691,996 222 881,199 2,810,575 1.08 5241999 5,250 240,700,730 3,540,251 2,425 880,666 2,657,160 1.10 5061998 5,224 227,294,501 3,409,269 2,892 818,277 2,588,100 1.14 4951997 5,170 210,895,259 3,176,955 2,242 673,715 2,500,998 1.19 4841996 5,146 195,375,140 3,085,526 9,201 635,930 2,440,395 1.25 4741995 5,113 182,303,882 2,986,486 16 624,355 2,362,115 1.30 4621994 5,075 167,967,279 2,870,941 3,902 578,608 2,288,431 1.36 451
(A) Current values certified on August 15. Assessed values for 2004 are not yet available. (B) Includes gross general obligation bonded debt for all fund types. 1997-2000 restated for general obligation commercial paper. (C) Represents moneys available in Debt Service Fund reserved for retirement of general obligation bonded debt restated
for prior period adjustments. (D) Prior to fiscal year 2002, the UW was considered a discrete presentation and not included in proprietary funds. (E) Excludes general obligation bonds expected to be repaid from revenues of three proprietary funds; includes general obligation bonds reported for the University of Wisconsin System.
SOURCES: Wisconsin Department of Administration, Wisconsin Department of Revenue U.S. Department of Commerce, Bureau of Census
State of WisconsinRatio of Annual Debt Service for General Bonded Debt to Total Governmental Expenditures
For the Last Ten Fiscal Years (In Thousands)
Debt Debt Total TotalService Service Debt Governmental Ratio
Year Principal Interest Service Expenditures (Percent)
2004 $ 55,738 $ 144,783 $ 200,521 $ 21,227,259 0.942003 211,779 149,299 361,078 19,770,477 1.832002 123,692 137,599 261,291 19,345,500 1.352001 140,206 93,099 233,305 18,081,690 1.292000 140,675 86,892 227,567 16,926,009 1.341999 136,357 87,931 224,288 14,943,367 1.501998 128,159 90,015 218,174 14,345,109 1.521997 124,877 89,106 213,983 13,848,416 1.551996 119,540 91,103 210,643 12,718,463 1.661995 113,280 91,817 205,097 12,015,884 1.71
Years prior to 2002 were not restated for GASB 34. SOURCE: Wisconsin Department of Administration 222

State of WisconsinDepartment of Transportation Revenue Bond Coverage
For the Last Ten Fiscal Years (In Thousands)
Debt ServiceGross Operating Net Total Debt Revenue Bond
Year Revenues (A) Expenses (B) Revenues Principal Interest Service Coverage
2004 $ 417,029 $ 55 $ 416,974 $ 46,870 $ 57,083 $ 103,953 4.012003 321,934 71 321,863 38,115 52,738 90,853 3.542002 324,967 105 324,862 36,560 46,454 83,014 3.912001 316,061 36 316,025 33,705 39,488 73,193 4.322000 313,155 66 313,089 30,860 41,063 71,923 4.351999 295,938 49 295,889 30,750 47,063 77,813 3.801998 282,850 56 282,794 29,710 45,733 75,443 3.751997 257,590 80 257,510 25,385 52,982 78,367 3.291996 249,339 37 249,302 21,590 46,421 68,011 3.671995 247,819 33 247,786 19,080 44,837 63,917 3.88
The State of Wisconsin, Department of Transportation finances certain state highway projects and related transportation facilities through the issuance of revenue bonds. The revenue bonds, $1,316.3 million outstanding at June 30, 2004, are secured by a pledge of theregistration fees collected under Wis. Stat. Sec. 341.25 and investments.
(A) Includes revenues from Wis. Stat. Sec. 341.25 registration fees including fees collected under the International Registration Plan, a multi-state plan for the collection of registration fees from interstate trucking, and interest earnings. (B) Includes administrative operating expenses.
SOURCE: Wisconsin Department of Transportation
223

State of WisconsinWisconsin Housing and Economic Development Authority Revenue BondsHome Ownership Revenue Bonds
For the Last Ten Fiscal Years (In Thousands)
Direct Debt ServiceGross Operating Net Total Debt Revenue Bond
Year Revenues (A) Expenses (B) Revenues Principal Interest Service Coverage (C)
2004 $ 418,843 $ 9,437 $ 409,406 $ 422,310 $ 59,809 $ 482,119 0.852003 633,445 8,158 625,287 528,825 78,782 607,607 1.032002 429,838 8,287 421,551 300,645 88,279 388,924 1.082001 286,366 7,731 278,635 178,905 95,138 274,043 1.022000 250,352 8,379 241,973 217,333 90,506 307,839 0.791999 392,684 8,947 383,737 305,265 94,414 399,679 0.961998 298,596 8,627 289,969 213,512 96,940 310,452 0.921997 222,298 8,229 214,069 126,974 91,441 218,415 0.971996 236,521 7,823 228,698 117,311 86,571 203,882 1.121995 178,760 7,082 171,678 171,421 78,769 250,190 0.69 (D)
(A) Includes mortgage payments received.(B) Includes administrative and general costs, mortgage insurance premiums, and lender service fees.(C) 1997 thru 2004 include gains/losses due to the increases/decreases in fair market value of investments as a result of the implementation of GASB 31. The Revenue Bond Coverage excludes these amounts.(D) $79.3 million of mortgage prepayments on hand at the end of fiscal year 1994 were used to redeem Home Ownership Revenue Bonds in fiscal year 1995.
SOURCE: Wisconsin Housing and Economic Development Authority
State of WisconsinWisconsin Housing and Economic Development Authority Revenue BondsHousing Revenue Bonds
For the Last Ten Fiscal Years (In Thousands)
Direct Debt ServiceGross Operating Net Total Debt Revenue Bond
Year Revenues (A) Expenses (B) Revenues Principal Interest Service Coverage (C)
2004 $ 70,811 $ 4,099 $ 66,712 $ 35,175 $ 22,942 $ 58,117 1.152003 66,740 3,772 62,968 119,420 24,162 143,582 0.442002 66,480 3,449 63,031 16,725 25,884 42,609 1.482001 59,553 4,346 55,207 15,230 25,919 41,149 1.352000 58,054 4,139 53,915 35,279 26,176 61,455 0.881999 59,653 4,211 55,442 18,387 27,384 45,771 1.211998 67,721 5,107 62,614 12,822 25,803 38,625 1.481997 62,229 4,278 57,951 12,439 26,586 39,025 1.381996 50,625 4,320 46,305 11,818 27,962 39,780 1.161995 47,686 6,194 41,492 8,463 28,101 36,564 1.13
(A) Includes mortgage payments received.(B) Includes administrative and general costs, mortgage insurance premiums, and lender service fees.(C) 1997 thru 2004 include gains/losses due to the increases/decreases in fair market value of investments as a result of the implementation of GASB 31. The Revenue Bond Coverage excludes these amounts.
SOURCE: Wisconsin Housing and Economic Development Authority
224
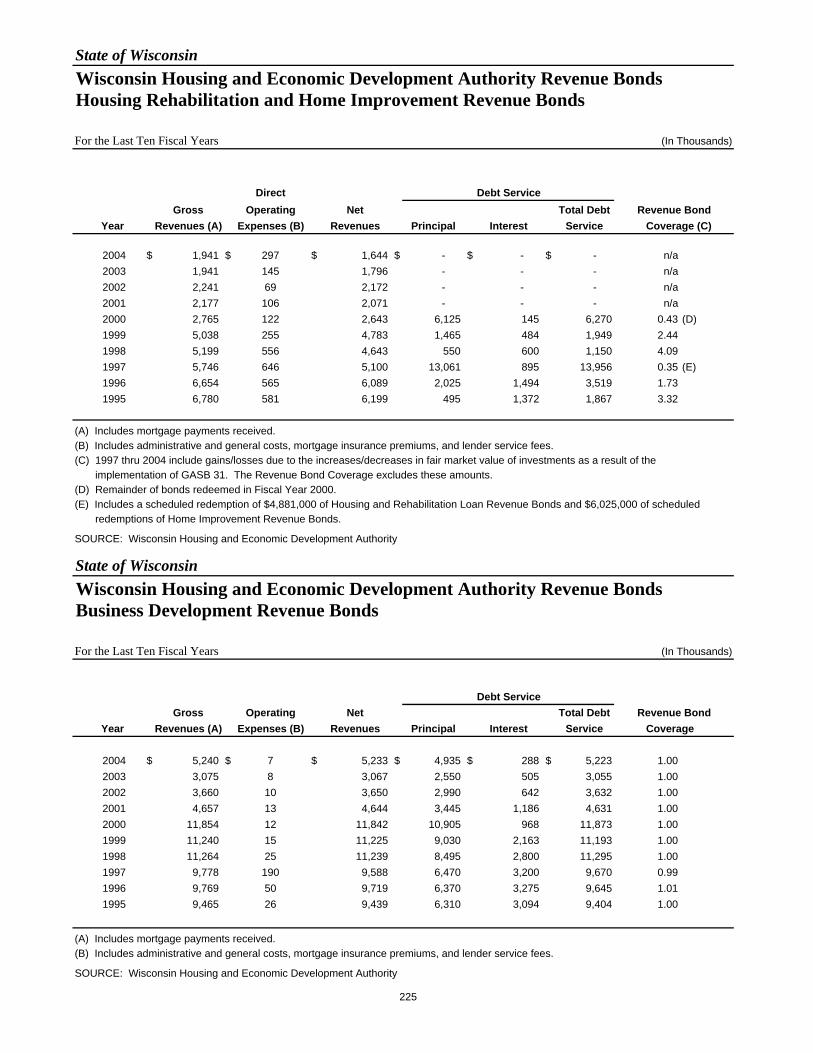
State of WisconsinWisconsin Housing and Economic Development Authority Revenue BondsHousing Rehabilitation and Home Improvement Revenue Bonds
For the Last Ten Fiscal Years (In Thousands)
Direct Debt ServiceGross Operating Net Total Debt Revenue Bond
Year Revenues (A) Expenses (B) Revenues Principal Interest Service Coverage (C)
2004 $ 1,941 $ 297 $ 1,644 $ - $ - $ - n/a2003 1,941 145 1,796 - - - n/a2002 2,241 69 2,172 - - - n/a2001 2,177 106 2,071 - - - n/a2000 2,765 122 2,643 6,125 145 6,270 0.43 (D)1999 5,038 255 4,783 1,465 484 1,949 2.441998 5,199 556 4,643 550 600 1,150 4.091997 5,746 646 5,100 13,061 895 13,956 0.35 (E)1996 6,654 565 6,089 2,025 1,494 3,519 1.731995 6,780 581 6,199 495 1,372 1,867 3.32
(A) Includes mortgage payments received.(B) Includes administrative and general costs, mortgage insurance premiums, and lender service fees.(C) 1997 thru 2004 include gains/losses due to the increases/decreases in fair market value of investments as a result of the implementation of GASB 31. The Revenue Bond Coverage excludes these amounts.(D) Remainder of bonds redeemed in Fiscal Year 2000.(E) Includes a scheduled redemption of $4,881,000 of Housing and Rehabilitation Loan Revenue Bonds and $6,025,000 of scheduled redemptions of Home Improvement Revenue Bonds.
SOURCE: Wisconsin Housing and Economic Development Authority
State of WisconsinWisconsin Housing and Economic Development Authority Revenue BondsBusiness Development Revenue Bonds
For the Last Ten Fiscal Years (In Thousands)
Debt ServiceGross Operating Net Total Debt Revenue Bond
Year Revenues (A) Expenses (B) Revenues Principal Interest Service Coverage
2004 $ 5,240 $ 7 $ 5,233 $ 4,935 $ 288 $ 5,223 1.002003 3,075 8 3,067 2,550 505 3,055 1.002002 3,660 10 3,650 2,990 642 3,632 1.002001 4,657 13 4,644 3,445 1,186 4,631 1.002000 11,854 12 11,842 10,905 968 11,873 1.001999 11,240 15 11,225 9,030 2,163 11,193 1.001998 11,264 25 11,239 8,495 2,800 11,295 1.001997 9,778 190 9,588 6,470 3,200 9,670 0.991996 9,769 50 9,719 6,370 3,275 9,645 1.011995 9,465 26 9,439 6,310 3,094 9,404 1.00
(A) Includes mortgage payments received.(B) Includes administrative and general costs, mortgage insurance premiums, and lender service fees.
SOURCE: Wisconsin Housing and Economic Development Authority
225
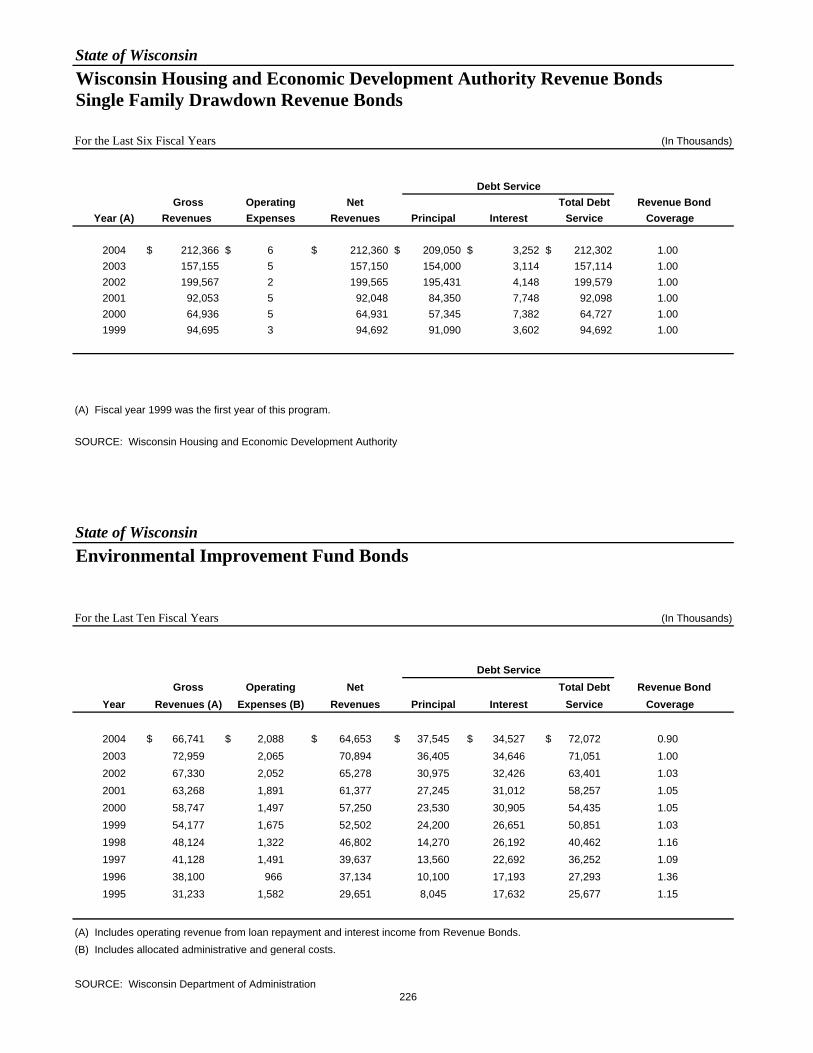
State of WisconsinWisconsin Housing and Economic Development Authority Revenue BondsSingle Family Drawdown Revenue Bonds
For the Last Six Fiscal Years (In Thousands)
Debt ServiceGross Operating Net Total Debt Revenue Bond
Year (A) Revenues Expenses Revenues Principal Interest Service Coverage
2004 $ 212,366 $ 6 $ 212,360 $ 209,050 $ 3,252 $ 212,302 1.002003 157,155 5 157,150 154,000 3,114 157,114 1.002002 199,567 2 199,565 195,431 4,148 199,579 1.002001 92,053 5 92,048 84,350 7,748 92,098 1.002000 64,936 5 64,931 57,345 7,382 64,727 1.001999 94,695 3 94,692 91,090 3,602 94,692 1.00
(A) Fiscal year 1999 was the first year of this program.
SOURCE: Wisconsin Housing and Economic Development Authority
State of WisconsinEnvironmental Improvement Fund Bonds
For the Last Ten Fiscal Years (In Thousands)
Debt ServiceGross Operating Net Total Debt Revenue Bond
Year Revenues (A) Expenses (B) Revenues Principal Interest Service Coverage
2004 $ 66,741 $ 2,088 $ 64,653 $ 37,545 $ 34,527 $ 72,072 0.902003 72,959 2,065 70,894 36,405 34,646 71,051 1.002002 67,330 2,052 65,278 30,975 32,426 63,401 1.032001 63,268 1,891 61,377 27,245 31,012 58,257 1.052000 58,747 1,497 57,250 23,530 30,905 54,435 1.051999 54,177 1,675 52,502 24,200 26,651 50,851 1.031998 48,124 1,322 46,802 14,270 26,192 40,462 1.161997 41,128 1,491 39,637 13,560 22,692 36,252 1.091996 38,100 966 37,134 10,100 17,193 27,293 1.361995 31,233 1,582 29,651 8,045 17,632 25,677 1.15
(A) Includes operating revenue from loan repayment and interest income from Revenue Bonds.(B) Includes allocated administrative and general costs.
SOURCE: Wisconsin Department of Administration 226
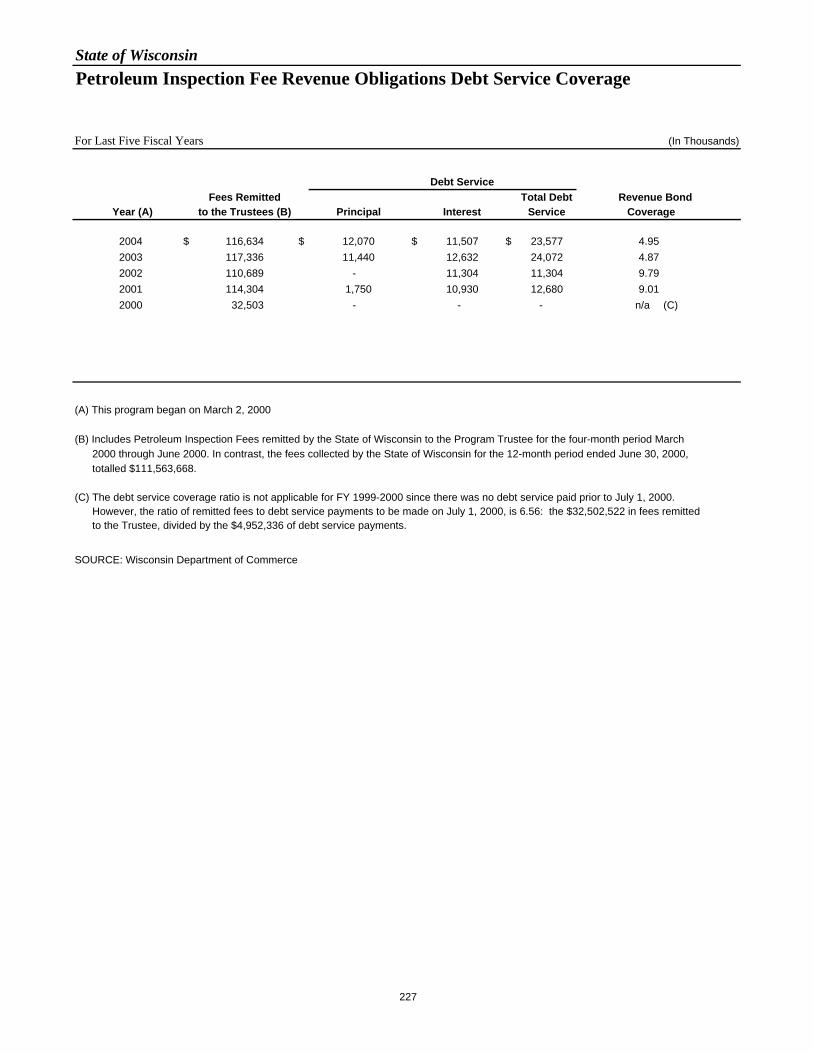
State of WisconsinPetroleum Inspection Fee Revenue Obligations Debt Service Coverage
For Last Five Fiscal Years (In Thousands)
Debt ServiceFees Remitted Total Debt Revenue Bond
Year (A) to the Trustees (B) Principal Interest Service Coverage
2004 $ 116,634 $ 12,070 $ 11,507 $ 23,577 4.952003 117,336 11,440 12,632 24,072 4.872002 110,689 - 11,304 11,304 9.792001 114,304 1,750 10,930 12,680 9.012000 32,503 - - - n/a (C)
(A) This program began on March 2, 2000 (B) Includes Petroleum Inspection Fees remitted by the State of Wisconsin to the Program Trustee for the four-month period March 2000 through June 2000. In contrast, the fees collected by the State of Wisconsin for the 12-month period ended June 30, 2000, totalled $111,563,668.
(C) The debt service coverage ratio is not applicable for FY 1999-2000 since there was no debt service paid prior to July 1, 2000. However, the ratio of remitted fees to debt service payments to be made on July 1, 2000, is 6.56: the $32,502,522 in fees remitted to the Trustee, divided by the $4,952,336 of debt service payments.
SOURCE: Wisconsin Department of Commerce
227

State of WisconsinLocal Government Property Insurance FundTen-Year Claims Development Information
Fiscal and Policy Year Ended June 30 (In Thousands)
1995 1996 1997 1998 1999 2000 2001 2002 2003 2004
1. Premium and investment revenues:
Earned $ 9,982 $ 10,347 $ 10,633 $ 11,241 $ 11,396 $ 11,801 $ 13,578 $ 14,518 $ 18,190 $ 26,920
Ceded 1,460 1,359 1,678 1,875 1,023 1,055 2,258 2,815 4,602 5,710
Net Earned 8,522 8,988 8,955 9,366 10,373 10,746 11,320 11,706 13,588 21,210
2. Loss expenses 211 112 266 447 604 449 369 273 307 530
3. Estimated incurred claims and
allocated expense, end of policy year
Direct incurred 4,427 9,402 8,431 16,828 12,543 16,134 14,125 14,837 18,589 11,118
Ceded 2,300 1,600 1,328 8,515 4,127 7,881 1,075 979 4,183 - Net Incurred 4,427 7,802 7,103 8,313 8,416 8,253 13,050 13,858 14,406 11,118
4. Paid (cumulative) as of:
End of policy year 2,489 3,376 4,005 4,561 4,206 4,866 5,060 7,278 9,040 7,138
One year later 4,493 6,956 5,880 7,979 7,452 7,344 12,333 13,669 12,431
Two years later 4,604 6,667 6,361 8,173 7,714 8,088 13,459 14,814
Three years later 4,604 6,763 6,385 8,620 7,714 7,741 13,492
Four years later 4,604 6,763 6,460 8,620 7,714 7,760
Five years later 4,604 6,809 6,460 8,620 7,714
Six years later 4,604 6,809 6,460 8,620
Seven years later 4,604 6,809 6,460
Eight years later 4,604 6,809
Nine years later 4,604
The table above illustrates how the Local Government Property Insurance Fund's earned revenues (net of insurance) and investment income
compare to related costs of loss (net of loss assumed by reinsurers) and other expenses assumed by the fund as of the end of each of the last
ten years. The rows of the table are defined as follows:
(1) These lines show the total of each fiscal year's earned contribution revenues and investment revenues, amount of reinsurance premium ceded and
net earned revenues.
(2) This line shows each fiscal year's other operating cost of the fund including overhead and claims expense not allocable to individual claims.
(3) This section shows the fund's incurred claims and allocated claims adjustment expense (both paid and accrued) as originally reported at the
end of the first year in which the event that triggered coverage under the contract occurred (called policy year).
(4) This section of 10 rows shows the cumulative amounts paid as of the end of successive years for each policy year.
(Continued)
228
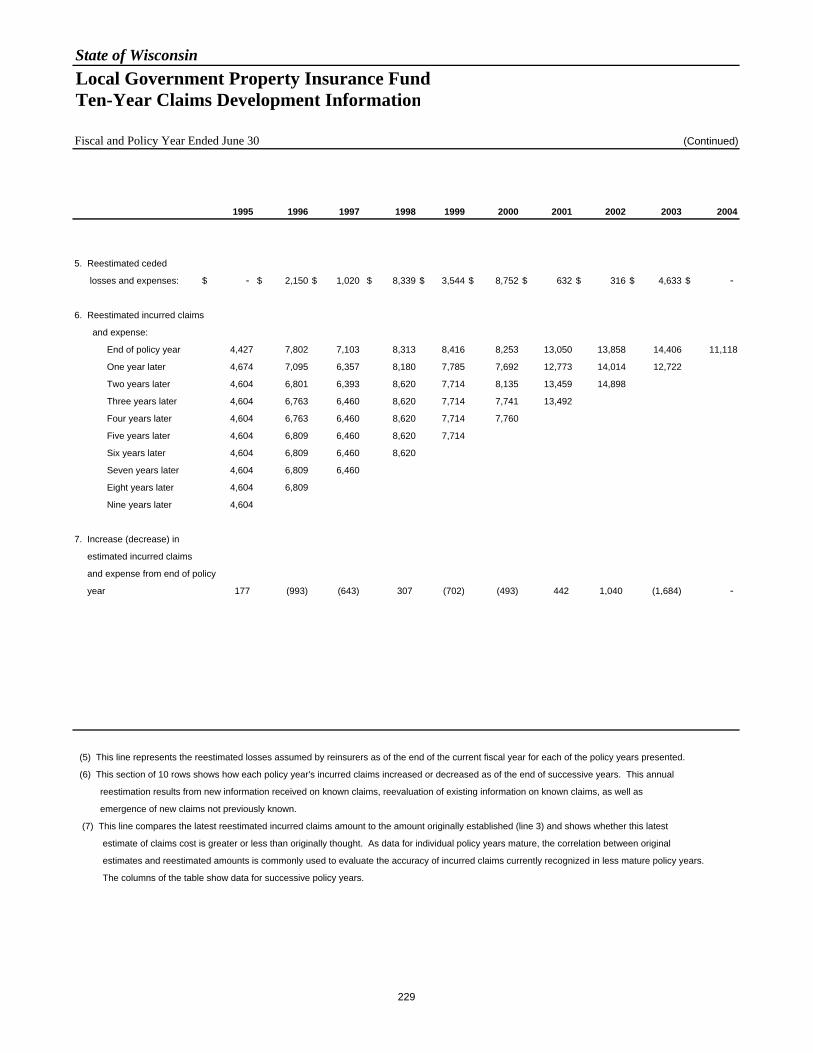
State of WisconsinLocal Government Property Insurance FundTen-Year Claims Development Information
Fiscal and Policy Year Ended June 30 (Continued)
1995 1996 1997 1998 1999 2000 2001 2002 2003 2004
5. Reestimated ceded
losses and expenses: $ - $ 2,150 $ 1,020 $ 8,339 $ 3,544 $ 8,752 $ 632 $ 316 $ 4,633 $ -
6. Reestimated incurred claims
and expense:
End of policy year 4,427 7,802 7,103 8,313 8,416 8,253 13,050 13,858 14,406 11,118
One year later 4,674 7,095 6,357 8,180 7,785 7,692 12,773 14,014 12,722
Two years later 4,604 6,801 6,393 8,620 7,714 8,135 13,459 14,898
Three years later 4,604 6,763 6,460 8,620 7,714 7,741 13,492
Four years later 4,604 6,763 6,460 8,620 7,714 7,760
Five years later 4,604 6,809 6,460 8,620 7,714
Six years later 4,604 6,809 6,460 8,620
Seven years later 4,604 6,809 6,460
Eight years later 4,604 6,809
Nine years later 4,604
7. Increase (decrease) in
estimated incurred claims
and expense from end of policy
year 177 (993) (643) 307 (702) (493) 442 1,040 (1,684) -
(5) This line represents the reestimated losses assumed by reinsurers as of the end of the current fiscal year for each of the policy years presented.
(6) This section of 10 rows shows how each policy year's incurred claims increased or decreased as of the end of successive years. This annual
reestimation results from new information received on known claims, reevaluation of existing information on known claims, as well as
emergence of new claims not previously known.
(7) This line compares the latest reestimated incurred claims amount to the amount originally established (line 3) and shows whether this latest
estimate of claims cost is greater or less than originally thought. As data for individual policy years mature, the correlation between original
estimates and reestimated amounts is commonly used to evaluate the accuracy of incurred claims currently recognized in less mature policy years.
The columns of the table show data for successive policy years.
229
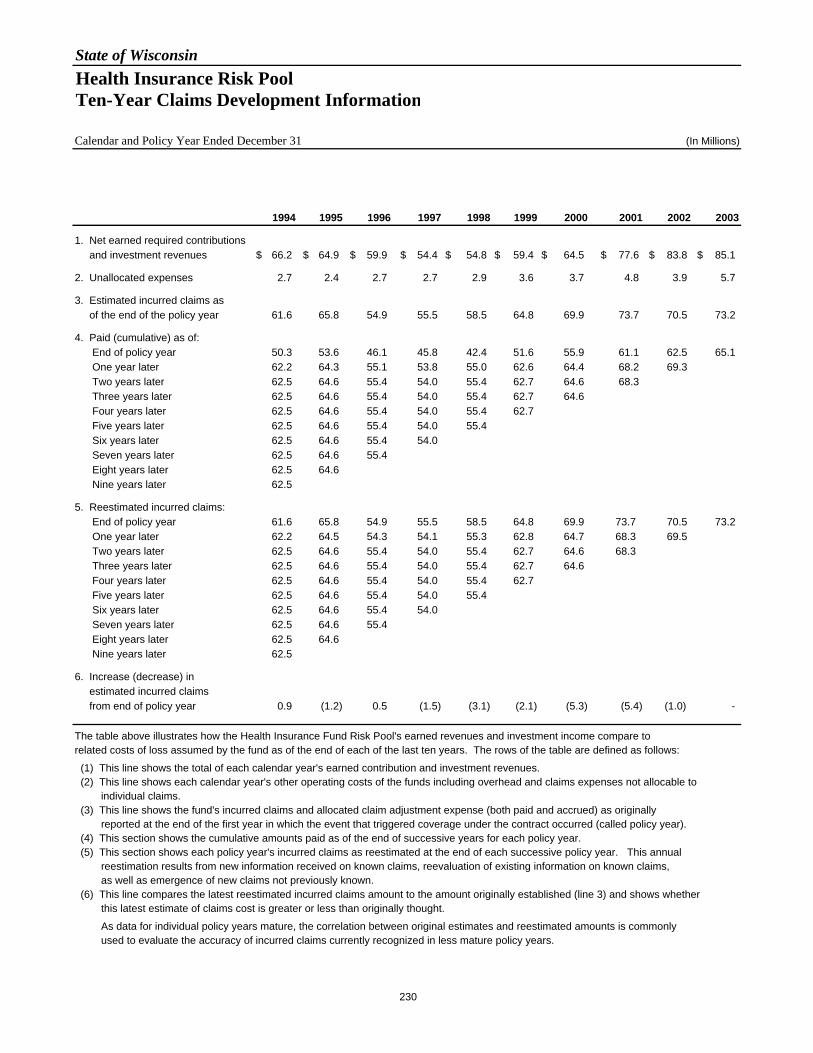
State of WisconsinHealth Insurance Risk PoolTen-Year Claims Development Information
Calendar and Policy Year Ended December 31 (In Millions)
1994 1995 1996 1997 1998 1999 2000 2001 2002 2003
1. Net earned required contributions and investment revenues $ 66.2 $ 64.9 $ 59.9 $ 54.4 $ 54.8 $ 59.4 $ 64.5 $ 77.6 $ 83.8 $ 85.1
2. Unallocated expenses 2.7 2.4 2.7 2.7 2.9 3.6 3.7 4.8 3.9 5.7
3. Estimated incurred claims as of the end of the policy year 61.6 65.8 54.9 55.5 58.5 64.8 69.9 73.7 70.5 73.2
4. Paid (cumulative) as of: End of policy year 50.3 53.6 46.1 45.8 42.4 51.6 55.9 61.1 62.5 65.1 One year later 62.2 64.3 55.1 53.8 55.0 62.6 64.4 68.2 69.3 Two years later 62.5 64.6 55.4 54.0 55.4 62.7 64.6 68.3 Three years later 62.5 64.6 55.4 54.0 55.4 62.7 64.6 Four years later 62.5 64.6 55.4 54.0 55.4 62.7 Five years later 62.5 64.6 55.4 54.0 55.4 Six years later 62.5 64.6 55.4 54.0 Seven years later 62.5 64.6 55.4 Eight years later 62.5 64.6 Nine years later 62.5
5. Reestimated incurred claims: End of policy year 61.6 65.8 54.9 55.5 58.5 64.8 69.9 73.7 70.5 73.2 One year later 62.2 64.5 54.3 54.1 55.3 62.8 64.7 68.3 69.5 Two years later 62.5 64.6 55.4 54.0 55.4 62.7 64.6 68.3 Three years later 62.5 64.6 55.4 54.0 55.4 62.7 64.6 Four years later 62.5 64.6 55.4 54.0 55.4 62.7 Five years later 62.5 64.6 55.4 54.0 55.4 Six years later 62.5 64.6 55.4 54.0 Seven years later 62.5 64.6 55.4 Eight years later 62.5 64.6 Nine years later 62.5
6. Increase (decrease) in estimated incurred claims from end of policy year 0.9 (1.2) 0.5 (1.5) (3.1) (2.1) (5.3) (5.4) (1.0) -
The table above illustrates how the Health Insurance Fund Risk Pool's earned revenues and investment income compare to related costs of loss assumed by the fund as of the end of each of the last ten years. The rows of the table are defined as follows: (1) This line shows the total of each calendar year's earned contribution and investment revenues. (2) This line shows each calendar year's other operating costs of the funds including overhead and claims expenses not allocable to individual claims. (3) This line shows the fund's incurred claims and allocated claim adjustment expense (both paid and accrued) as originally reported at the end of the first year in which the event that triggered coverage under the contract occurred (called policy year). (4) This section shows the cumulative amounts paid as of the end of successive years for each policy year. (5) This section shows each policy year's incurred claims as reestimated at the end of each successive policy year. This annual reestimation results from new information received on known claims, reevaluation of existing information on known claims, as well as emergence of new claims not previously known. (6) This line compares the latest reestimated incurred claims amount to the amount originally established (line 3) and shows whether this latest estimate of claims cost is greater or less than originally thought. As data for individual policy years mature, the correlation between original estimates and reestimated amounts is commonly used to evaluate the accuracy of incurred claims currently recognized in less mature policy years.
230

State of WisconsinIncome Continuation Insurance Risk PoolTen-Year Claims Development Information
Calendar and Policy Year Ended December 31 (In Millions)
1994 1995 1996 1997 1998 1999 2000 2001 2002 2003
1. Net earned required contributions and investment revenues $ 0.1 $ 11.8 $ 11.4 $ 17.0 $ 17.0 $ 19.5 $ 8.2 $ 7.9 $ 3.7 $ 25.5
2. Unallocated expenses 0.7 0.8 0.9 1.1 1.2 1.5 0.8 1.9 1.7 1.9
3. Estimated incurred claims as of the end of the policy year 17.2 19.4 18.7 19.1 19.3 17.3 21.4 28.9 17.1 23.4
4. Paid (cumulative) as of: End of policy year 1.9 2.7 2.4 2.5 2.5 2.4 3.2 5.5 3.5 4.5 One year later 3.9 5.1 4.6 5.4 4.5 4.6 6.4 10.0 7.7 Two years later 4.5 5.8 5.2 5.7 4.8 5.3 8.0 12.1 Three years later 4.9 6.2 5.5 6.1 5.2 6.0 9.0 Four years later 5.1 6.4 5.8 6.5 5.5 6.6 Five years later 5.3 6.7 6.1 6.8 5.8 Six years later 5.6 7.1 6.4 7.1 Seven years later 5.8 7.4 6.8 Eight years later 6.1 7.8 Nine years later 6.4
5. Reestimated incurred claims: End of policy year 17.2 19.4 18.7 19.1 19.3 17.3 21.4 28.9 17.1 23.4 One year later 10.9 12.8 12.1 12.1 9.8 9.8 18.0 20.4 15.8 Two years later 8.8 10.9 9.3 9.3 8.2 10.2 16.3 18.9 Three years later 7.9 10.0 9.9 8.7 7.4 11.5 14.3 Four years later 7.3 9.5 9.2 8.3 12.4 10.1 Five years later 8.0 9.9 8.2 8.7 7.4 Six years later 7.7 9.3 8.0 8.8 Seven years later 7.5 9.2 8.7 Eight years later 8.0 9.4 Nine years later 7.7
6. Increase (decrease) in estimated incurred claims from end of policy year (9.5) (10.0) (10.0) (10.3) (11.9) (7.2) (7.1) (10.0) (1.3) -
The table above illustrates how the Income Continuation Insurance Fund Risk Pool's earned revenues and investment income compare to related costs of loss assumed by the fund as of the end of each of the last ten years. The rows of the table are defined as follows: (1) This line shows the total of each calendar year's earned contribution and investment revenues. (2) This line shows each calendar year's other operating costs of the funds including overhead and claims expenses not allocable to individual claims. (3) This line shows the fund's incurred claims and allocated claim adjustment expense (both paid and accrued) as originally reported at the end of the first year in which the event that triggered coverage under the contract occurred (called policy year). (4) This section shows the cumulative amounts paid as of the end of successive years for each policy year. (5) This section shows each policy year's incurred claims as reestimated at the end of each successive policy year. This annual reestimation results from new information received on known claims, reevaluation of existing information on known claims, as well as emergence of new claims not previously known. (6) This line compares the latest reestimated incurred claims amount to the amount originally established (line 3) and shows whether this latest estimate of claims cost is greater or less than originally thought. As data for individual policy years mature, the correlation between original estimates and reestimated amounts is commonly used to evaluate the accuracy of incurred claims currently recognized in less mature policy years.
231

State of WisconsinDuty Disability Insurance Risk PoolTen-Year Claims Development Information
Calendar and Policy Year Ended December 31 (In Millions)
1994 1995 1996 1997 1998 1999 2000 2001 2002 2003
1. Net earned required contributions and investment revenues $ 16.2 $ 22.0 $ 23.7 $ 27.0 $ 32.8 $ 38.9 $ 31.3 $ 32.4 $ 25.8 $ 68.3
2. Unallocated expenses 0.2 0.2 0.4 0.1 0.2 0.6 0.2 0.3 0.4 0.1
3. Estimated incurred claims as of the end of the policy year 5.1 4.8 15.5 14.1 16.9 21.7 27.6 35.4 30.7 41.0
4. Paid (cumulative) as of: End of policy year - - 0.1 0.1 0.1 0.1 0.2 0.3 0.2 0.3 One year later 0.4 1.1 0.4 0.5 0.6 0.8 0.8 1.0 0.8 Two years later 1.4 2.5 0.8 1.1 1.2 1.6 1.6 1.8 Three years later 2.5 4.0 1.4 1.7 1.9 2.4 2.5 Four years later 3.7 5.6 2.0 2.3 2.6 3.3 Five years later 5.0 7.2 2.5 2.9 3.4 Six years later 6.2 8.9 3.2 3.5 Seven years later 7.5 10.7 3.9 Eight years later 8.8 12.7 Nine years later 10.1
5. Reestimated incurred claims: End of policy year 5.1 4.8 15.5 14.1 16.9 21.7 27.6 35.4 30.7 41.0 One year later 6.1 8.8 5.8 8.2 9.5 7.6 6.2 9.2 11.5 Two years later 10.2 10.5 8.3 12.6 16.6 13.5 8.5 11.7 Three years later 12.9 13.6 9.8 14.5 18.9 15.7 9.9 Four years later 14.5 17.7 11.5 15.0 19.6 18.1 Five years later 17.9 19.6 13.0 15.1 20.9 Six years later 19.4 22.1 13.5 15.7 Seven years later 21.4 23.2 14.2 Eight years later 23.0 25.6 Nine years later 24.3
6. Increase (decrease) in estimated incurred claims from end of policy year 19.2 20.8 (1.3) 1.6 4.0 (3.6) (17.7) (23.7) (19.2) -
The table above illustrates how the Duty Disability Fund Risk Pool's earned revenues and investment income compare to related costs of loss assumed by the fund as of the end of each of the last ten years. The rows of the table are defined as follows: (1) This line shows the total of each calendar year's earned contribution and investment revenues. (2) This line shows each calendar year's other operating costs of the funds including overhead and claims expenses not allocable to individual claims. (3) This line shows the fund's incurred claims and allocated claim adjustment expense (both paid and accrued) as originally reported at the end of the first year in which the event that triggered coverage under the contract occurred (called policy year). (4) This section shows the cumulative amounts paid as of the end of successive years for each policy year. (5) This section shows each policy year's incurred claims as reestimated at the end of each successive policy year. This annual reestimation results from new information received on known claims, reevaluation of existing information on known claims, as well as emergence of new claims not previously known. (6) This line compares the latest reestimated incurred claims amount to the amount originally established (line 3) and shows whether this latest estimate of claims cost is greater or less than originally thought. As data for individual policy years mature, the correlation between original estimates and reestimated amounts is commonly used to evaluate the accuracy of incurred claims currently recognized in less mature policy years.
232

State of WisconsinLong-term Disability Insurance Risk PoolTen-Year Claims Development Information
Calendar and Policy Year Ended December 31 (In Millions)
1994 1995 1996 1997 1998 1999 2000 2001 2002 2003
1. Net earned required contributions and investment revenues $ 30.8 $ 47.8 $ 36.1 $ 38.9 $ 37.7 $ 36.1 $ (3.0) $ (6.9) $ (22.9) $ 52.5
2. Unallocated expenses 0.2 0.2 0.2 0.2 0.4 0.6 0.3 1.0 0.8 0.7
3. Estimated incurred claims as of the end of the policy year 3.3 5.4 4.5 4.5 7.7 9.1 9.4 10.0 11.7 15.9
4. Paid (cumulative) as of: End of policy year - 0.1 0.1 0.1 0.1 0.1 0.2 0.5 - 0.3 One year later 0.4 0.5 0.7 0.4 0.8 0.6 0.8 1.0 1.1 Two years later 0.8 0.9 1.4 0.9 1.6 1.3 1.5 2.0 Three years later 1.2 1.3 2.0 1.4 2.1 2.3 2.6 Four years later 1.6 1.6 2.5 1.8 2.9 3.2 Five years later 2.0 1.9 3.0 2.3 3.6 Six years later 2.3 2.2 3.7 2.7 Seven years later 2.6 2.5 4.2 Eight years later 2.9 2.8 Nine years later 3.1
5. Reestimated incurred claims: End of policy year 3.3 5.4 4.5 4.5 7.7 9.1 9.4 10.0 11.7 15.9 One year later 2.5 3.4 4.3 2.5 5.1 6.1 4.9 8.7 8.4 Two years later 3.2 3.9 5.4 3.6 6.8 8.2 7.2 8.3 Three years later 3.7 4.1 6.1 3.7 6.0 7.8 8.5 Four years later 4.1 4.1 5.7 4.2 8.0 9.9 Five years later 4.3 3.7 5.9 4.2 7.5 Six years later 4.5 4.7 6.5 4.9 Seven years later 4.5 4.0 6.5 Eight years later 4.1 4.5 Nine years later 4.2
6. Increase (decrease) in estimated incurred claims from end of policy year 0.9 (0.9) 2.0 0.4 (0.2) 0.8 (0.9) (1.7) (3.3) -
The table above illustrates how the Long-term Disability Insurance Fund Risk Pool's earned revenues and investment income compare to related costs of loss assumed by the fund as of the end of each of the last ten years. The rows of the table are defined as follows: (1) This line shows the total of each calendar year's earned contribution and investment revenues. (2) This line shows each calendar year's other operating costs of the funds including overhead and claims expenses not allocable to individual claims. (3) This line shows the fund's incurred claims and allocated claim adjustment expense (both paid and accrued) as originally reported at the end of the first year in which the event that triggered coverage under the contract occurred (called policy year). (4) This section shows the cumulative amounts paid as of the end of successive years for each policy year. (5) This section shows each policy year's incurred claims as reestimated at the end of each successive policy year. This annual reestimation results from new information received on known claims, reevaluation of existing information on known claims, as well as emergence of new claims not previously known. (6) This line compares the latest reestimated incurred claims amount to the amount originally established (line 3) and shows whether this latest estimate of claims cost is greater or less than originally thought. As data for individual policy years mature, the correlation between original estimates and reestimated amounts is commonly used to evaluate the accuracy of incurred claims currently recognized in less mature policy years.
233

State of WisconsinBank Deposits
For the Last Ten Fiscal Years (In Thousands)
StateState Nationally Chartered
Chartered Chartered Savings AndYear Banks Banks Loans (A)
2004 $ 51,812,520 $ 15,767,889 $ 3,258,2692003 47,733,076 15,709,867 3,198,2432002 46,836,527 14,697,466 3,210,7612001 42,675,366 14,320,141 4,965,3682000 44,709,945 9,917,244 6,329,2951999 45,943,028 15,797,789 10,798,4051998 41,578,232 14,192,053 7,428,7911997 37,949,640 13,640,277 9,334,4421996 30,807,941 17,113,236 8,651,2681995 26,363,116 19,235,764 8,557,009
(A) Includes Savings Banks
SOURCES: Wisconsin Department of Financial Institutions
State of WisconsinUnemployment Data
For the Last Ten Years
Population Unemployment RateYear (Thousands) Wisconsin U.S.
2003 5,472 5.6 6.02002 5,441 5.5 5.82001 5,402 4.6 4.82000 5,364 3.5 4.01999 5,250 3.0 4.21998 5,224 3.4 4.51997 5,170 3.7 4.91996 5,147 3.5 5.41995 5,113 3.7 5.61994 5,075 4.7 6.1
SOURCES: U.S. Department of Commerce, Bureau of Economic Analysis Wisconsin Department of Workforce Development
2004 data is not available.
234
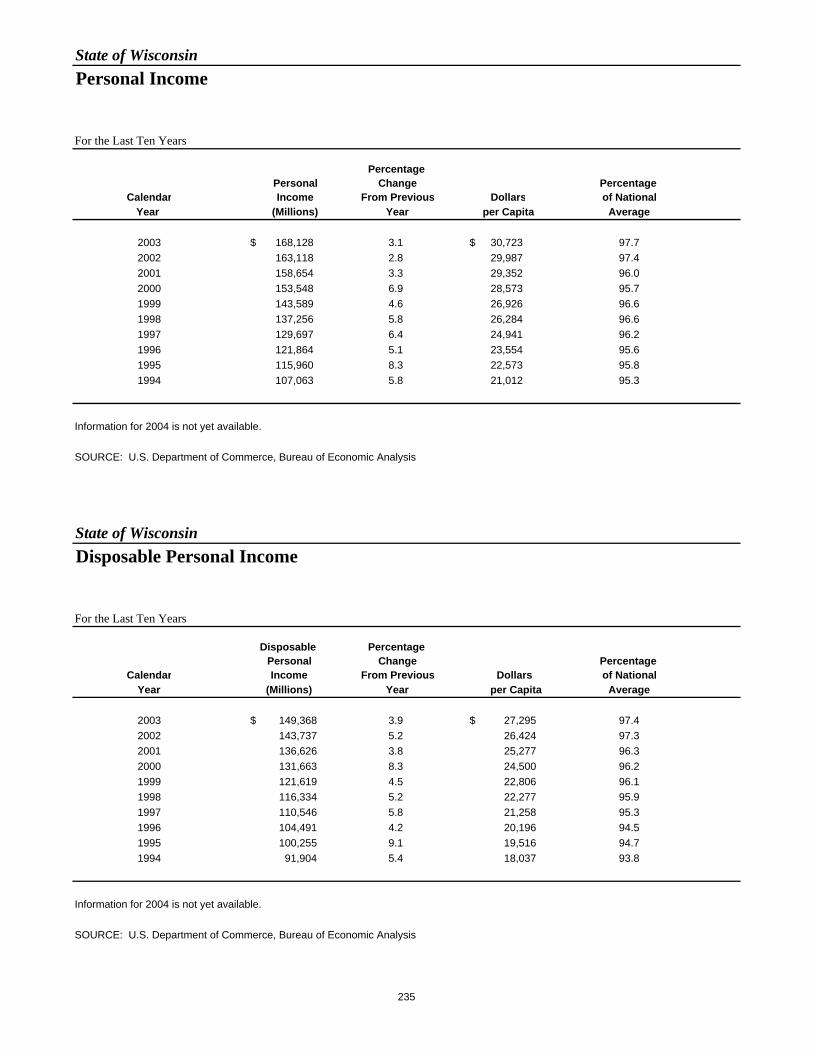
State of WisconsinPersonal Income
For the Last Ten Years
Percentage Personal Change Percentage
Calendar Income From Previous Dollars of NationalYear (Millions) Year per Capita Average
2003 $ 168,128 3.1 $ 30,723 97.72002 163,118 2.8 29,987 97.42001 158,654 3.3 29,352 96.02000 153,548 6.9 28,573 95.71999 143,589 4.6 26,926 96.61998 137,256 5.8 26,284 96.61997 129,697 6.4 24,941 96.21996 121,864 5.1 23,554 95.61995 115,960 8.3 22,573 95.81994 107,063 5.8 21,012 95.3
Information for 2004 is not yet available.
SOURCE: U.S. Department of Commerce, Bureau of Economic Analysis
State of WisconsinDisposable Personal Income
For the Last Ten Years
Disposable Percentage Personal Change Percentage
Calendar Income From Previous Dollars of NationalYear (Millions) Year per Capita Average
2003 $ 149,368 3.9 $ 27,295 97.42002 143,737 5.2 26,424 97.32001 136,626 3.8 25,277 96.32000 131,663 8.3 24,500 96.21999 121,619 4.5 22,806 96.11998 116,334 5.2 22,277 95.91997 110,546 5.8 21,258 95.31996 104,491 4.2 20,196 94.51995 100,255 9.1 19,516 94.71994 91,904 5.4 18,037 93.8
Information for 2004 is not yet available.
SOURCE: U.S. Department of Commerce, Bureau of Economic Analysis
235

State of WisconsinKindergarten through Grade 12Enrollment Statistics
For the Last Ten Years
Year Public Private Total
2004 853,363 124,248 977,6112003 855,139 129,132 984,2712002 854,688 133,279 987,9672001 855,725 151,472 1,007,1972000 875,038 135,638 1,010,6761999 859,387 135,039 994,4261998 881,248 147,344 1,028,5921997 859,469 138,658 998,1271996 852,130 137,212 989,3421995 860,686 148,002 1,008,688
SOURCE: Wisconsin Department of Public Instruction, Division for Management and Budget, Educational Information Services
State of WisconsinTotal New Housing Units Authorized in Permit-Issuing Places
For the Last Ten Years
Calendar Percent ChangeYear Wisconsin Wisconsin U.S.
2003 40,884 7.0 8.12002 38,208 1.2 6.82001 37,773 10.6 2.82000 34,154 (4.0) (4.3)1999 35,570 0.4 3.21998 35,436 11.0 11.91997 31,925 (4.1) 1.11996 33,296 2.8 7.01995 32,403 (6.4) (2.8)1994 34,619 7.8 14.4
Information for 2004 is not yet available.
SOURCE: U.S. Bureau of the Census, "Construction Reports C40 Housing Authorized by Building Permits and Public Contracts"
236

State of WisconsinState of Wisconsin's Largest Employers(Over 1000 Employees)
Rank Employer Name Type of Industry
1 Wal-Mart Associates Inc. General Merchandise Stores2 Menard Inc. Building Materials and Garden Supplies3 Kohl's Department Stores Inc. General Merchandise Stores4 Kohler Co. Fabricated Metal Products5 Division of Target Corporation General Merchandise Stores6 Shopko Stores Inc. General Merchandise Stores7 Land's End Inc. Catalog and Mail Order Houses8 Walgreen Company Illinois Pharmaceutical Stores9 Marshfield Clinic Health Services10 Quad/Graphics Inc. Printing and Publishing11 United Parcel Service Inc. Trucking and Warehousing12 Gunderson Lutheran Administrative Health Services13 Aurora Health Care Metro, Inc. Health Services14 Columbia St. Mary's Group Health Services15 Wisconsin Hospitality Group LL Hospitality16 Thedacare, Inc. Health Services17 We Energies Power Company18 U.S. Bank National Assn. Banking19 Aurora Medical Group Inc. Health Services20 Kwik Trip Inc. Convenience Stores and Truck Stops21 Rockwell Automation Inc. Industrial Automation22 Stora Enso North America Corp. Paper and Allied Products23 Northwestern Mutual Life Insurance Insurance24 Medical College of Wisconsin Inc. Medical Schools and Medical Centers25 Pick N Save Mega Foods Groceries and Related Products
Note: Employee data as of March 2004
SOURCE: Wisconsin Department of Workforce Development
237
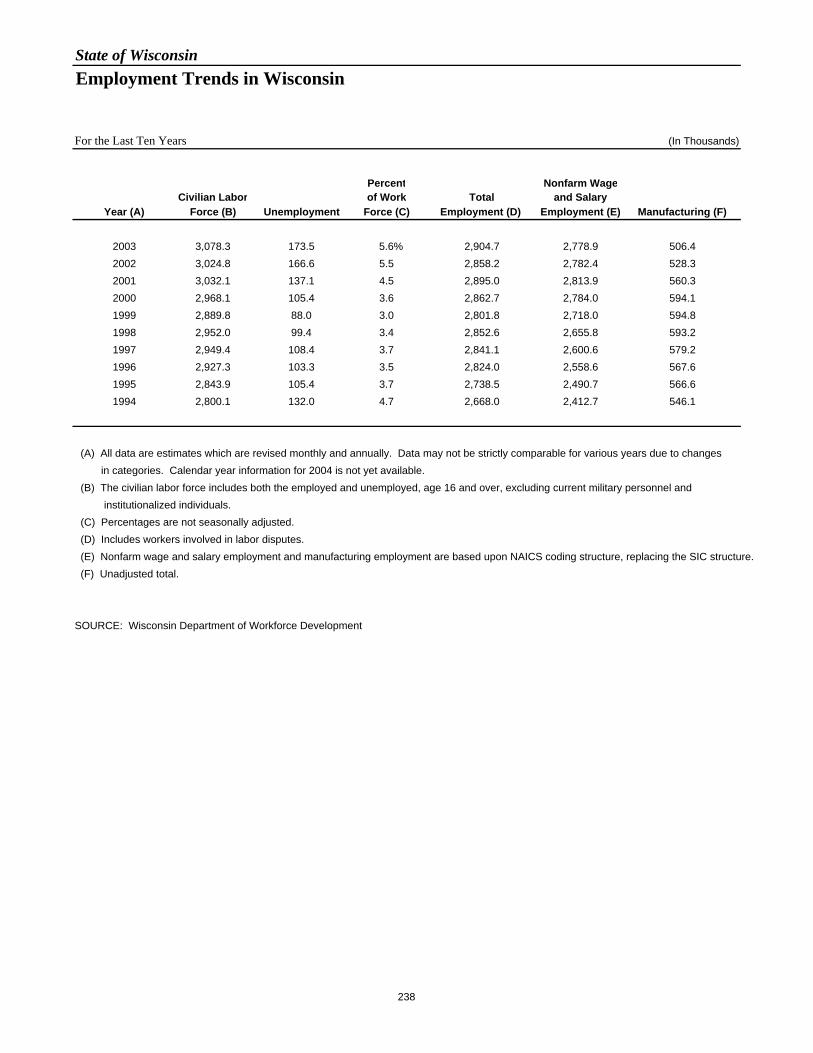
State of WisconsinEmployment Trends in Wisconsin
For the Last Ten Years (In Thousands)
Percent Nonfarm WageCivilian Labor of Work Total and Salary
Year (A) Force (B) Unemployment Force (C) Employment (D) Employment (E) Manufacturing (F)
2003 3,078.3 173.5 5.6% 2,904.7 2,778.9 506.42002 3,024.8 166.6 5.5 2,858.2 2,782.4 528.32001 3,032.1 137.1 4.5 2,895.0 2,813.9 560.32000 2,968.1 105.4 3.6 2,862.7 2,784.0 594.11999 2,889.8 88.0 3.0 2,801.8 2,718.0 594.81998 2,952.0 99.4 3.4 2,852.6 2,655.8 593.21997 2,949.4 108.4 3.7 2,841.1 2,600.6 579.21996 2,927.3 103.3 3.5 2,824.0 2,558.6 567.61995 2,843.9 105.4 3.7 2,738.5 2,490.7 566.61994 2,800.1 132.0 4.7 2,668.0 2,412.7 546.1
(A) All data are estimates which are revised monthly and annually. Data may not be strictly comparable for various years due to changes in categories. Calendar year information for 2004 is not yet available. (B) The civilian labor force includes both the employed and unemployed, age 16 and over, excluding current military personnel and institutionalized individuals. (C) Percentages are not seasonally adjusted. (D) Includes workers involved in labor disputes. (E) Nonfarm wage and salary employment and manufacturing employment are based upon NAICS coding structure, replacing the SIC structure. (F) Unadjusted total.
SOURCE: Wisconsin Department of Workforce Development
238
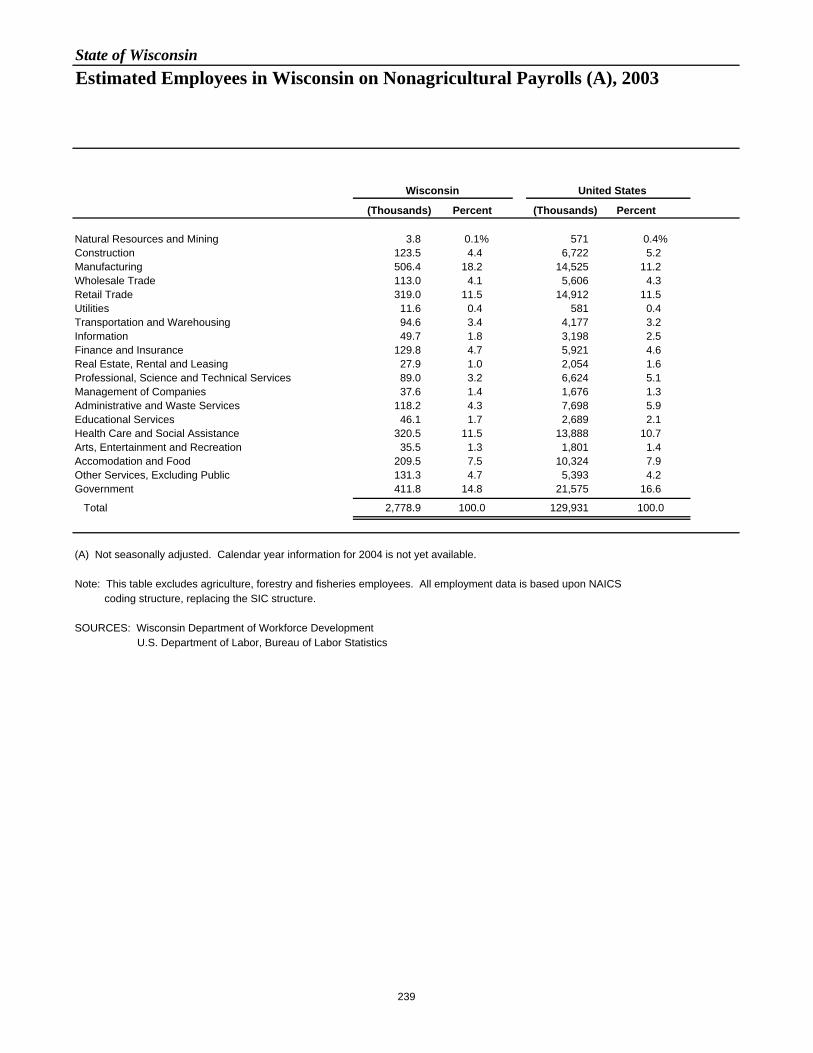
State of WisconsinEstimated Employees in Wisconsin on Nonagricultural Payrolls (A), 2003
Wisconsin United States
(Thousands) Percent (Thousands) Percent
Natural Resources and Mining 3.8 0.1% 571 0.4%Construction 123.5 4.4 6,722 5.2Manufacturing 506.4 18.2 14,525 11.2Wholesale Trade 113.0 4.1 5,606 4.3Retail Trade 319.0 11.5 14,912 11.5Utilities 11.6 0.4 581 0.4Transportation and Warehousing 94.6 3.4 4,177 3.2Information 49.7 1.8 3,198 2.5Finance and Insurance 129.8 4.7 5,921 4.6Real Estate, Rental and Leasing 27.9 1.0 2,054 1.6Professional, Science and Technical Services 89.0 3.2 6,624 5.1Management of Companies 37.6 1.4 1,676 1.3Administrative and Waste Services 118.2 4.3 7,698 5.9Educational Services 46.1 1.7 2,689 2.1Health Care and Social Assistance 320.5 11.5 13,888 10.7Arts, Entertainment and Recreation 35.5 1.3 1,801 1.4Accomodation and Food 209.5 7.5 10,324 7.9Other Services, Excluding Public 131.3 4.7 5,393 4.2Government 411.8 14.8 21,575 16.6
Total 2,778.9 100.0 129,931 100.0
(A) Not seasonally adjusted. Calendar year information for 2004 is not yet available.
Note: This table excludes agriculture, forestry and fisheries employees. All employment data is based upon NAICS coding structure, replacing the SIC structure.
SOURCES: Wisconsin Department of Workforce Development U.S. Department of Labor, Bureau of Labor Statistics
239
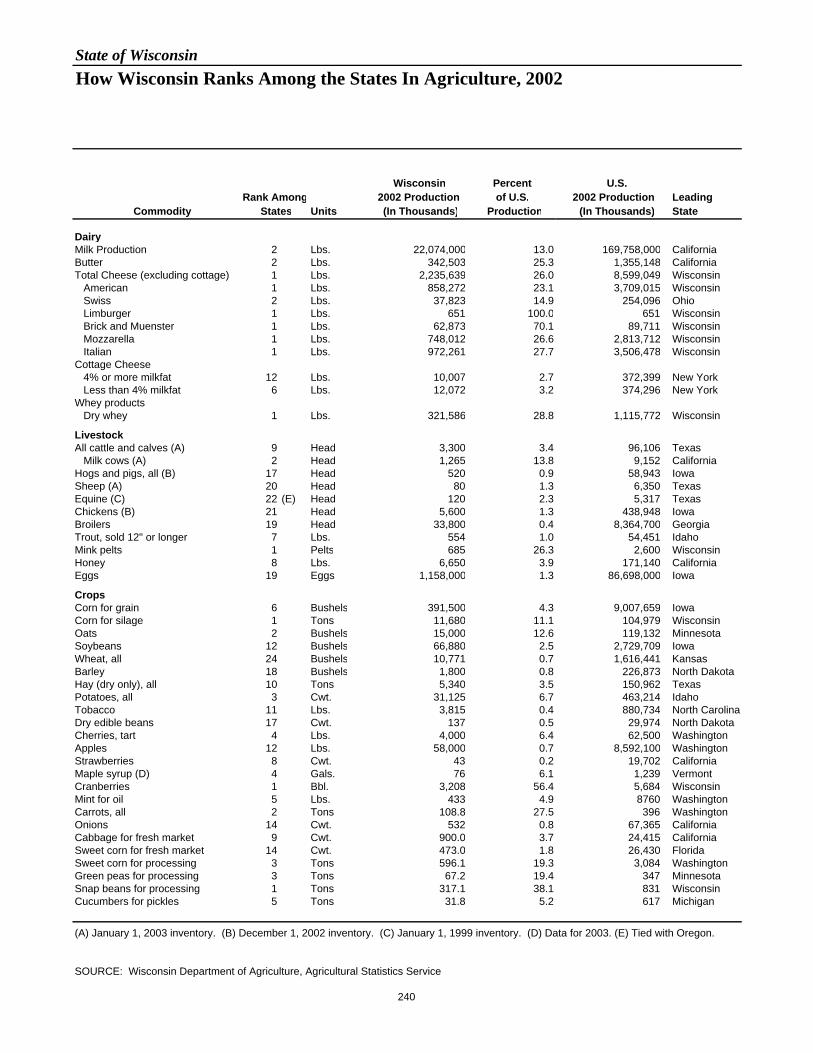
State of WisconsinHow Wisconsin Ranks Among the States In Agriculture, 2002
Wisconsin Percent U.S. Rank Among 2002 Production of U.S. 2002 Production Leading
Commodity States Units (In Thousands) Production (In Thousands) State
DairyMilk Production 2 Lbs. 22,074,000 13.0 169,758,000 California Butter 2 Lbs. 342,503 25.3 1,355,148 California Total Cheese (excluding cottage) 1 Lbs. 2,235,639 26.0 8,599,049 Wisconsin American 1 Lbs. 858,272 23.1 3,709,015 Wisconsin Swiss 2 Lbs. 37,823 14.9 254,096 Ohio Limburger 1 Lbs. 651 100.0 651 Wisconsin Brick and Muenster 1 Lbs. 62,873 70.1 89,711 Wisconsin Mozzarella 1 Lbs. 748,012 26.6 2,813,712 Wisconsin Italian 1 Lbs. 972,261 27.7 3,506,478 Wisconsin Cottage Cheese 4% or more milkfat 12 Lbs. 10,007 2.7 372,399 New York Less than 4% milkfat 6 Lbs. 12,072 3.2 374,296 New York Whey products Dry whey 1 Lbs. 321,586 28.8 1,115,772 Wisconsin
Livestock All cattle and calves (A) 9 Head 3,300 3.4 96,106 Texas Milk cows (A) 2 Head 1,265 13.8 9,152 California Hogs and pigs, all (B) 17 Head 520 0.9 58,943 Iowa Sheep (A) 20 Head 80 1.3 6,350 Texas Equine (C) 22 (E) Head 120 2.3 5,317 Texas Chickens (B) 21 Head 5,600 1.3 438,948 Iowa Broilers 19 Head 33,800 0.4 8,364,700 Georgia Trout, sold 12" or longer 7 Lbs. 554 1.0 54,451 Idaho Mink pelts 1 Pelts 685 26.3 2,600 Wisconsin Honey 8 Lbs. 6,650 3.9 171,140 California Eggs 19 Eggs 1,158,000 1.3 86,698,000 Iowa
Crops Corn for grain 6 Bushels 391,500 4.3 9,007,659 Iowa Corn for silage 1 Tons 11,680 11.1 104,979 Wisconsin Oats 2 Bushels 15,000 12.6 119,132 Minnesota Soybeans 12 Bushels 66,880 2.5 2,729,709 Iowa Wheat, all 24 Bushels 10,771 0.7 1,616,441 Kansas Barley 18 Bushels 1,800 0.8 226,873 North Dakota Hay (dry only), all 10 Tons 5,340 3.5 150,962 Texas Potatoes, all 3 Cwt. 31,125 6.7 463,214 Idaho Tobacco 11 Lbs. 3,815 0.4 880,734 North Carolina Dry edible beans 17 Cwt. 137 0.5 29,974 North Dakota Cherries, tart 4 Lbs. 4,000 6.4 62,500 Washington Apples 12 Lbs. 58,000 0.7 8,592,100 Washington Strawberries 8 Cwt. 43 0.2 19,702 California Maple syrup (D) 4 Gals. 76 6.1 1,239 Vermont Cranberries 1 Bbl. 3,208 56.4 5,684 Wisconsin Mint for oil 5 Lbs. 433 4.9 8760 Washington Carrots, all 2 Tons 108.8 27.5 396 Washington Onions 14 Cwt. 532 0.8 67,365 California Cabbage for fresh market 9 Cwt. 900.0 3.7 24,415 California Sweet corn for fresh market 14 Cwt. 473.0 1.8 26,430 Florida Sweet corn for processing 3 Tons 596.1 19.3 3,084 Washington Green peas for processing 3 Tons 67.2 19.4 347 Minnesota Snap beans for processing 1 Tons 317.1 38.1 831 Wisconsin Cucumbers for pickles 5 Tons 31.8 5.2 617 Michigan
(A) January 1, 2003 inventory. (B) December 1, 2002 inventory. (C) January 1, 1999 inventory. (D) Data for 2003. (E) Tied with Oregon.
SOURCE: Wisconsin Department of Agriculture, Agricultural Statistics Service
240

State of WisconsinMiscellaneous Data
Date Wisconsin Became Part of United States...................................................... 1783Inception as a State (30th State)............................................................................ 1848Form of Government.............................................................................................. Legislative-Executive-JudicialCapital.................................................................................................................... Madison
State Symbols Flower................................................................................................................... Wood Violet Tree...................................................................................................................... Sugar Maple Wildlife Animal...................................................................................................... White-tailed Deer Animal...................................................................................................................Badger Fish....................................................................................................................... Muskellunge Bird....................................................................................................................... Robin
Total Area............................................................................................................... 35.8 Million Acres Land Area............................................................................................................. 34.8 Million Acres Water Area........................................................................................................... 1.0 Million AcresMiles of State Highways......................................................................................... 11,753 Miles
Higher Education (Students) University of Wisconsin System........................................................................... 160,635 University of Wisconsin Extension........................................................................176,795 Private.................................................................................................................. 55,835 Vocational/Technical Colleges............................................................................. 451,271
Recreation Number of State Parks......................................................................................... 44 Number of State Forests...................................................................................... 12 Number of State Trails..........................................................................................25 Number of Historic Sites....................................................................................... 8 Number of Recreational Areas............................................................................. 5
Permanent Classified State Employees................................................................. 41,344
SOURCE: Wisconsin Blue Book, 2003-2004
241

242
Acknowledgments
The Comprehensive Annual Financial Report was prepared by the Department of Administration, Division ofExecutive Budget and Finance, State Controller’s Office, Financial Reporting Section:
Marilyn T. Klement, CPAGeorge KiehlLaurie M. LemkeMan M. LeMary E. Sommerfeld, CPAConnie Hall, CPA
Special acknowledgment goes to:
Kathy Farmer, CPA of the Audit Section of the State Controller’s Office, who assisted with the preparation ofthe report.
All fiscal and accounting personnel throughout Wisconsin State government, along with Legislative AuditBureau staff, whose dedicated efforts and cooperation contributed to the compilation of financial informationthat appears in the report.