2004 final report - university of south florida · this report format is adapted from the county of...
TRANSCRIPT

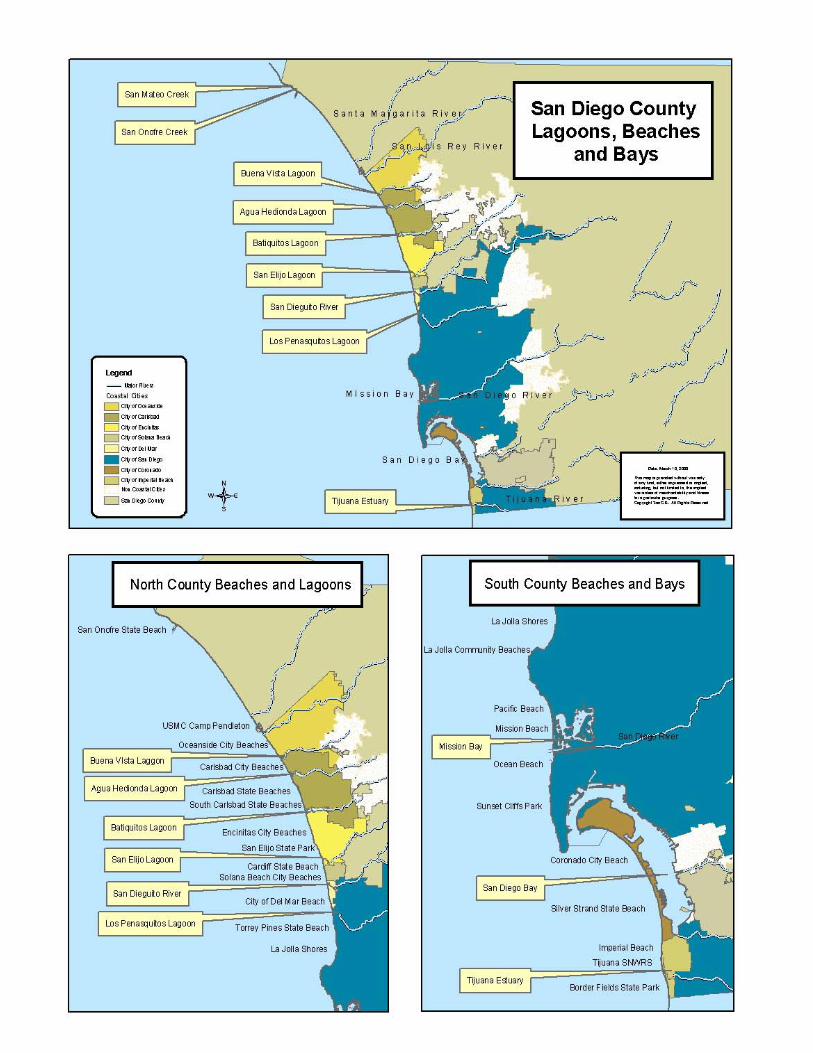
San Diego County 2004 Beach Closure & Advisory Report
Mission Beach, City of San Diego. Photo: City of San Diego
Beach water quality contamination events and days posted for beaches within San Diego County, California, USA.
Prepared by the County of San Diego Department of Environmental Health Land & Water Quality Division Ocean & Bay Recreational Water Program

ii
County of San Diego
BOARD OF SUPERVISORS
GREG COX District 1
DIANNE JACOB
District 2
PAM SLATER-PRICE District 3
RON ROBERTS
District 4
BILL HORN District 5
________________________________________________________ CHIEF ADMINISTRATIVE OFFICER
WALTER F. ECKARD
DEPUTY CHIEF ADMINISTRATIVE OFFICER LAND USE AND ENVIRONMENTAL GROUP
ROBERT R. COPPER
DEPARTMENT OF ENVIRONMENTAL HEALTH GARY W. ERBECK, DIRECTOR
Prepared by
LAND & WATER QUALITY DIVISION MARK McPHERSON
Project staff: Clay Clifton and Frank Lupena

iii
San Diego County 2004 Beach Closure & Advisory Report County of San Diego Department of Environmental Health Ocean & Bay Recreational Water Program
• Mark McPherson, Chief of Land & Water Quality Division
• Clay Clifton, Environmental Health Specialist II
• Frank Lupena, Environmental Health Technician
ACKNOWLEDGEMENTS The work of the Department of Environmental Health’s Ocean & Bay Recreational Water Program would not be possible without the assistance of many people. The Ocean & Bay Recreational Water Program staff wishes to acknowledge the following:
• County of San Diego Public Health Laboratory
• City of San Diego Metropolitan Wastewater Department, Environmental Monitoring & Technical Services Division
• U.S. International Boundary & Water Commission (IBWC), San Diego office
• City of Coronado Public Services
• San Elijo Water Reclamation Facility
• Encina Wastewater Authority
• City of Oceanside Water Utilities Laboratory
• San Onofre Nuclear Generating Station
• UCSD Scripps Institution of Oceanography, San Diego Coastal Ocean Observing System and the State Water Resources Control Board / Ocean Imaging Inc. Remote Sensing projects
• Ja-Jan and the San Diego chapter of the Surfrider Foundation
SPECIAL THANKS The staff of Environmental Health’s Ocean & Bay Recreational Water Protection Program would like to thank the Marine Safety and Lifeguard Divisions of the cities of Oceanside, Encinitas, Solana Beach, Del Mar, San Diego, Coronado and Imperial Beach; and the State Department of Parks and Recreation Lifeguards for their continued assistance in posting warning signs.
This report format is adapted from the County of Orange Health Care Agency Ocean Water Protection Program 2003 Annual Ocean and Bay Water Quality Report.
Photographs courtesy of Peter Neubauer and Frank Lupena unless noted otherwise. Editing courtesy of Dr. Gretel Silyn Roberts.

iv
TABLE OF CONTENTS
EXECUTIVE SUMMARY ........................................................................................................................................................ 1 Major findings of the San Diego County 2004 Beach Closure & Advisory Report:............................................................. 1
THE OCEAN & BAY RECREATIONAL WATER PROGRAM................................................................................................. 3 Disease-Causing Microorganisms....................................................................................................................................... 4 Indicator Bacteria Testing Methods..................................................................................................................................... 5 Monitoring of ocean and bay coastal waters for bacterial indicators of fecal contamination and State of California Ocean Water-Contact Sports Standards ........................................................................................................................................ 6 Beach Mile Days.................................................................................................................................................................. 8
OCEAN AND BAY WATER QUALITY ADVISORIES DUE TO STANDARDS VIOLATIONS ................................................ 9 Advisories for San Diego County Beaches 2000 - 2004 (April - October) .......................................................................... 9 Advisory days posted by coastal jurisdiction 2000 – 2004 (April – October) .................................................................... 11 Analysis of dry weather bacterial exceedances, June 1– October 15, 2004 .................................................................... 12 Beaches under a chronic advisory or closure ................................................................................................................... 14
OCEAN AND BAY WATER CLOSURES DUE TO SEWAGE SPILLS................................................................................. 15 Sewage Spills and Ocean and Bay Water Closures 2000 – 2004 (calendar year)........................................................... 16
OCEAN AND BAY GENERAL ADVISORIES 2000 - 2004................................................................................................... 19 SPECIAL STUDIES, 2000 – 2004 ........................................................................................................................................ 22
Mission Bay Bacterial Source Identification Study, 2002 – 2004...................................................................................... 22 Mission Bay Epidemiology Study, summer 2003 .............................................................................................................. 23 San Diego Coastal Ocean Observing System and Remote Sensing Projects at south county beaches ......................... 25
FIGURES Figure 1: Sunset at Windansea in San Diego......................................................................................................................... 1 Figure 2: Surfer at a beach in San Diego County ................................................................................................................... 3 Figure 3: Beach water sample collection. ............................................................................................................................... 5 Figure 4: Weekly sampling at San Diego County Beaches (April - October). ........................................................................ 7 Figure 5: The Crystal Pier in Pacific Beach. Photo City of San Diego................................................................................... 8 Figure 6: Advisory beach mile days due to bacterial exceedances........................................................................................ 9 Figure 7: Routine samples versus exceedances .................................................................................................................. 10 Figure 8: Advisory events (exceedances) and days posted ................................................................................................. 10 Figure 9: Dry weather flow from Cottonwood Creek outlet at Moonlight Beach, Encinitas .................................................. 11 Figure 10: Resample confirmations ...................................................................................................................................... 12 Figure 11: Exceedances by indicator.................................................................................................................................... 12 Figure 12: Advisories caused by single indicator exceedance ............................................................................................. 13 Figure 13: Children’s Pool in La Jolla, San Diego................................................................................................................. 14 Figure 14: Sanitary sewer overflow (SSO)............................................................................................................................ 15 Figure 15: Graph of beach closures and gallons spilled....................................................................................................... 16 Figure 16: Graph of contribution of Tijuana River to closure Beach Mile Days .................................................................... 18 Figure 17: Water contact closure sign at the south end of Seacoast Dr............................................................................... 18 Figure 18: Plume from the San Diego River outlet following heavy rains in January 2005. Photo: Ocean Imaging, Inc. ... 20 Figure 19: Wet weather flow at 15th St. storm drain outlet in Del Mar .................................................................................. 21 Figure 20: Map of sampling locations in Mission Bay........................................................................................................... 24 Figure 21: Turbidity plumes along the coast following rain................................................................................................... 25 Figure 22: Ocean current direction data on SDCCOS.......................................................................................................... 26

v
TABLES Table 1: Disease- causing microorganisms ............................................................................................................................ 4 Table 2: Number of weekly sampling stations between April 1 and October 31, 2004 .......................................................... 6 Table 3: Days posted for bacterial exceedances (Advisories) between April 1 and October 31.......................................... 11 Table 4: Beach closures and gallons spilled......................................................................................................................... 16 Table 5: Closure beach mile days due to sewage contamination......................................................................................... 17 Table 6: Contribution of BMD closures caused by Tijuana River ......................................................................................... 18
Young surfer crossing the San Elijo Lagoon outlet at Cardiff State Beach

1
EXECUTIVE SUMMARY The 2004 Beach Closure and Advisory Report provides an analysis of beach water quality advisories and closures for the 52 miles of recreational ocean and bay waters in San Diego County for the years 2000 – 2004.
Major findings of the San Diego County 2004 Beach Closure & Advisory Report: Sewage Spills and Closures • The total number of closure Beach Mile Days due to sewage spills increased to 225 in 2004 from 188 in
2003. This represents the second consecutive year of increase and a 142% increase in the total number of closure Beach Mile Days since 2000. Several beach closures occurred in late 2004 and coincided with urban runoff flows following rain. Since closures require two consecutive days of sample results within state standards to remove signs, many of these closures lasted a week or more due to the bacterial contamination in follow-up samples associated with the urban runoff.
• The total number of ocean and bay water closure events due to sewage spills increased to 42 in 2004 from 39 in 2003. This represents the second consecutive year of increase, but a 4.6% decline in the number of closures since 2000.
Advisories due to bacterial exceedances in monitoring • The number of advisory Beach Mile Days due to exceedances (standards violations) in monitoring during
the AB 411 period (April - October) increased to 30 in 2004 from 28 in 2003. This represents the first year of increase, but a 64% decrease in advisory Beach Mile Days since 2000.
• The number of Advisory days posted during the AB 411 period (April - October) increased 9.8% from 460 in 2003 to 505 in 2004. However, this number represents a 51% reduction in Advisory days posted due to state standards violations during the AB 411 period since 2000.
• The increase from 2003 to 2004 in advisory days posted and advisory Beach Mile Days during the AB 411 period may be attributable to adaptive re-sampling by DEH and the subsequent exceedance of the 30-day geometric mean standard at problematic locations. The overall reduction since 2000 in advisory Beach Mile Days may be attributable to changes in sampling protocol used by DEH (see page 11), and abatement of sources of contamination when identified by municipal stormwater programs.
• The location with the most Advisory days posted due to state standards violations for the AB 411 period was P.B. Point in Pacific Beach (City of San Diego).
Figure 1: Sunset at Windansea in San Diego
2
HERAM
As part of the County of San Diego Department of Environmental Health (DEH), the Ocean & Bay Recreational Water Program is responsible for the protection of public health along the County’s 52 miles of ocean and bay recreational waters. Ocean and bay waters used for full body-contact recreational activities such as swimming, surfing and diving must meet specific bacteriological standards to be considered safe for such purposes. Every day the Ocean & Bay Recreational Water Program staff reviews the latest bacteriological water sample results from six different laboratories, receives any reports of sewage releases, and other information needed to determine the safety of water contact at beaches within San Diego County. The California Health and Safety Code and Title 17 of the California Code of Regulations require the local health officer (the DEH Ocean & Bay Recreational Water Program) to make public notifications as soon as it has information that indicates contamination of ocean or bay recreational waters and a possible increased health risk to ocean users. Sources of ocean and bay water contamination of can include sewage releases, sewage contaminated runoff, urban runoff in both dry and wet weather, and unknown sources when results from beach water quality monitoring indicate levels of fecal indicator bacteria that violate state standards. DEH will issue a water contact Closure or Advisory (signs are posted at the beach, hotline and Web page are updated) until additional sampling results indicate bacterial levels are within state standards and/or the source of the problem is eliminated.
The following is a listing of the reports located on the Web page in “Documents and Information”
• Annual Ocean and Bay Water Quality Reports (2001, 2002, 2003, and 2004); • Ocean Illness Survey report and form • Impacts on ocean waters adjacent to lagoon outlets after rainfall
.The Ocean & Bay Recreational Water Program staff maintaina daily Beach & Bay Water quality Report Hotline and WebPage.
Beach & Bay Water Quality Report Hotline: 619-338-2073
The Beach & Bay Water quality Report Web Page: www.earth911.org or link by going to www.sdcounty.ca.gov/deh “Beach & Bay Water Quality”

3
THE OCEAN & BAY RECREATIONAL WATER PROGRAM As part of the County of San Diego Department of Environmental Health (DEH), the Ocean & Bay Recreational Water Program is responsible for the protection of public health along the County’s 52 miles of ocean and bay recreational waters. (52 of the 154 total shoreline miles {73 ocean and 81 bay} are considered recreational shoreline). Ocean and bay waters used for full body-contact recreational activities such as swimming, surfing and diving must meet specific bacteriological standards to be considered safe for such purposes. Every day the Ocean & Bay Recreational Water Program staff reviews the latest bacteriological water sample results from six different laboratories, receives reports of sewage releases, and other information needed to determine the safety of water contact at beaches within San Diego County. The California Health and Safety Code and Title 17 of the California Code of Regulations require the local health officer (the DEH Ocean & Bay Recreational Water Program) to make public notifications as soon as it has information that indicates contamination of ocean or bay recreational waters and a possible increased health risk to users. Sources of ocean and bay water contamination can include sewage releases, sewage contaminated runoff, urban runoff in both dry and wet weather, and unknown sources when results from beach water quality monitoring indicate levels of fecal indicator bacteria that violate state standards. DEH will issue a water contact Closure or Advisory (signs are posted at the beach, hotline and Web page are updated) until additional sampling results indicate bacterial levels are within state standards and/or the source of contamination is eliminated.
The following is a listing of the reports and data located on the DEH web page in “Documents and Information”:
• Annual Ocean and Bay Water Quality Reports (2001, 2002, 2003 and 2004) • Ocean Illness Survey report and form • Impacts of Rainstorms on Water Quality at Beaches Adjacent to Lagoons
Figure 2: Surfer at a beach in San Diego County
The Ocean & Bay Recreational Water Program staff maintaina daily Beach & Bay Water quality Report Hotline and WebPage.
Beach & Bay Water Quality Report Hotline: 619-338-2073
The Beach & Bay Water quality Report Web Page: www.earth911.org or link by going to www.sdcounty.ca.gov/deh “Beach & Bay Water Quality”

4
Disease-Causing Microorganisms Polluted runoff and untreated sewage may contain pathogenic bacteria, viruses or protozoa. When polluted runoff or sewage is released into ocean or bay waters these disease-causing organisms may be present near the sites where polluted discharges enter the water, or farther away depending upon ocean currents. Swimming, surfing or other exposure to contaminated waters increases the risk of illness from pathogens found in contaminated water.
The following table lists some of the pathogens found in sewage-contaminated water and possibly in runoff, and the diseases (or symptoms) they cause.
Table 1: Disease- causing microorganisms
Pathogenic Agent Disease
Bacteria
Escherichia coli (E. coli) Gastroenteritis
Salmonella (not typhi) Gastroenteritis, usually with fever; less commonly septicemia
Shigella Gastroenteritis, usually with fever
Protozoa (intestinal parasites)
Cryptosporidium Diarrhea – Cryptosporidiosis
Giardia lamblia Diarrhea – Giardiasis
Viruses
Rotavirus Gastroenteritis
Enteroviruses Respiratory infection, rash, fever; meningitis
Norwalk and Norwalk-like viruses Gastroenteritis
Adenovirus Respiratory infection and gastroenteritis
The levels of bacteria, viruses and protozoa decrease in recreational waters over time by the following processes:
• Die off due to sun (ultraviolet exposure), salt water or age. • Predation by other organisms • Dilution

5
Indicator Bacteria Testing Methods The detection and enumeration of disease-causing organisms (pathogens) identified with waterborne illness is difficult, time-consuming and costly. Thus, most water quality laboratories test for fecal indicator bacteria (i.e., total coliforms, fecal coliforms and enterococci) as a means to ascertain the likelihood that human pathogens may be present in recreational waters. Fecal indicator bacteria normally occur in the intestines of all warm-blooded animals, are excreted in high numbers in feces, but can also be found in soil and decaying vegetation. Total coliforms are a broad group of organisms that include fecal coliform bacteria as well as E. coli. The enterococci group has been determined to be a good indicator of swimming associated gastroenteritis. The methods most commonly used to detect fecal indicator bacteria in ocean waters include:
• Membrane Filtration (MF) This test method produces results in 24 hours. The City of San Diego Environmental Monitoring & Technical Services Division and the Encina Wastewater Authority use the MF method for the analyses of total coliforms, fecal coliforms and enterococci in ocean waters.
• Multiple-tube Fermentation (MTF) This test method produces results from 24 to 96 hours. The County
of San Diego Public Health Laboratory and City of Oceanside Water Utilities Laboratory use the MTF method for the analyses of total coliforms and fecal coliforms in ocean waters. The San Elijo Water Reclamation Facility uses the MTF method for the analyses of total coliforms, fecal coliforms and enterococci in ocean waters.
• Colilert 18 ® This test method produces results in 18 hours. Special investigative samples by the City of San Diego use the Colilert 18 technique for the analyses of total coliforms and E. coli.
• Enterolert® This test method produces results in 24 hours. The County of San Diego Public Health Laboratory and City of Oceanside Water Utilities Laboratory use the Enterolert® technique for the analyses of enterococci bacteria in ocean waters.
All of the methods are culture based, which means that the indicator bacteria present in water must be allowed to grow in order to be detected. Differences between the methods include how the bacteria are detected and counted, how soon the results become known, and cost. Detailed descriptions for these methods are available in the latest edition of Standard Methods for the Examination of Water and Wastewater.
Figure 3: Beach water sample collection.
Samples are collected in ankle to knee- deep water, 4 - 6 inches below the surface

6
Monitoring of ocean and bay coastal waters for bacterial indicators of fecal contamination and State of California Ocean Water-Contact Sports Standards
Over the past 20 years, the County of San Diego Department of Environmental Health (DEH) and local sanitation agencies (City of San Diego, San Elijo Water Reclamation Facility, Encina Wastewater Authority, and the City of Oceanside) have been conducting bacterial monitoring of the coastal waters in San Diego County for the protection of pubic health and for regulatory permit requirements.
In 1997, Assembly Bill 411 amended the California Health and Safety Code (Sections 115880-115915) to require the standardization of bacterial monitoring of water quality at public beaches in California and public notification by the local health agency when results indicate bacterial levels exceed (violate) state standards [see next page]. To fulfill these requirements (called “AB 411”) the DEH Ocean & Bay Recreational Water Program collects beach water samples from over 60 locations per week between April and October. Over 13 per week are collected by DEH between November and March. In addition to the samples collected by DEH, the county’s five dischargers of treated wastewater effluent collect beach water samples as part of their NPDES permit requirements. The Cities of Oceanside and Coronado also collect beach water samples voluntarily. The results from all of these monitoring efforts are shared with DEH. The total number of beach water samples collected in San Diego County is over 103 per week between April and October, and over 40 per week between November and March.
The chart and graph below show the distribution of the weekly beach water quality monitoring in San Diego County between April and October. The numbers shown are the number of routine samples collected per week. Follow-up sampling by DEH can add an additional five to fifteen samples per week.
For a detailed map of sampling locations at San Diego County beaches, go to www.earth911.org and select ‘Beach Water Quality’ for San Diego County.
Table 2: Number of weekly sampling stations between April 1 and October 31, 2004
San Onofre. State Beach that includes San Mateo Creek outlet, Old Man's and Trail Six 2
Camp Pendleton. USMC beaches that include San Onofre Creek outlet and Camp Del Mar 2
Oceanside. From Harbor Beach south to St. Malo. Includes Buccaneer Beach 11 includes one station sampled 2x week Carlsbad. Includes Buena Vista Lagoon outlet, municipal beach, and Carlsbad State beaches 10 Encinitas. From Leucadia south through Cardiff State Beach. Includes Moonlight Beach. 10 includes two stations sampled 2x week
Solana Beach. Includes Tide Beach Park, Fletcher Cove, and Seascape Beach Park 3 Del Mar. From San Dieguito River Beach south through Anderson Canyon 3 includes one station sampled 2x week SD, Mission Bay. Includes 18 swimming, sailing and PWC areas 18 SD, Ocean. From Torrey Pines State Beach south through Sunset Cliffs Park. Includes La Jolla, Windansea, Paciific Beach, Mission Beach, and Ocean Beach 20 includes two stations sampled 2x week San Diego Bay. Includes seven locations on San Diego Bay 7 Coronado. Includes Coronado municipal beach and Silver Strand State Beach 9 includes four stations sampled 2x week Imperial Beach. From Camp Surf south through End of Seacoast Drive 4 BF, TJSNWRS. Border Field State Park and Tijuana Slough National Wildlife Refuge Shoreline 4 103

7
Distribution of weekly shoreline sampling stations, April to October, 2004
San Onofre2%
Carlsbad10%
Encinitas10%
Solana Beach3%
Del Mar3%
BF, TJSNWRS 4%
Oceanside11%
Camp Pendleton2%
SD, Mission Bay17%
SD, Ocean18%
San Diego Bay 7%
Imperial Beach 4%
Coronado 9%
San OnofreCamp PendletonOceansideCarlsbadEncinitasSolana BeachDel MarSD, Mission BaySD, OceanSan Diego Bay Coronado Imperial Beach BF, TJSNWRS
Figure 4: Weekly sampling at San Diego County Beaches (April - October).
Sampling is conducted by the following agencies: County of San Diego Department of Environmental Health (DEH), City of Oceanside, Encina Wastewater Authority, San Elijo Water Reclamation Facility, City of San Diego, City of Coronado, and the San Onofre Nuclear Generating Station.
The California Department of Health Services established the following bacterial standards for ocean water contact in the California Code of Regulations, Title 17 (Sections 7956-7962) to implement AB 411. These are often referred to as the “AB 411 Standards”. These standards and the other requirements of AB 411 became effective in July 1999.
Single sample standards for total coliforms, fecal coliforms and enterococci bacteria shall not exceed: Total Coliforms: 10,000 organisms per 100 milliliter sample. Fecal Coliforms: 400 organisms per 100 milliliter sample. Enterococci: 104 organisms per 100 milliliter sample. Fecal: Total ratio: >1,000 total coliforms if ratio exceeds 0.1.
30-day geometric mean standards (of five weekly samples) for total coliforms, fecal coliforms and enterococci bacteria shall not exceed:
Total Coliforms: 1,000 organisms per 100 milliliter sample. Fecal Coliforms: 200 organisms per 100 milliliter sample. Enterococci: 35 organisms per 100 milliliter sample.
Sources of the indicator bacteria used to test for fecal contamination of beach water quality include: Environment-soils, decaying vegetation Animal wastes-birds, dogs, cats, seals Storm water/ urban runoff - sources vary Humans-sewage, kids with diapers, shedding from body

8
Beach Mile Days
Figure 5: The Crystal Pier in Pacific Beach. Photo City of San Diego The term “Beach Mile Days” is used to represent the measurement of the number of days and the distance of ocean or bay shoreline waters that are closed due to a sewage spill or under advisory for a violation of the AB 411 Ocean Water-Contact Sports Standards. Beach Mile Days (BMDs) are calculated by multiplying the number of days of a closure or posting by the number of miles of beach closed or posted: (Number of Days) x (Miles of beach closed or posted) = Beach Mile Days For example, if a sewage spill resulted in the closure of ½ mile of beach for 7 days then: (7 days) x (0.5 mile) = 3.5 Beach Mile Days of closure The total number of available ocean and bay recreational Beach Mile Days for San Diego County are: (365 days) x (49.2 miles ocean) = 17,958 Available Beach Mile Days (365 days) x (3 miles bays) = 1,095 Available Beach Mile Days (365 days) x (52.2 miles total) = 19,053 Available Beach Mile Days. Using BMDs is a more meaningful measurement of ocean and bay water impairment than using the number of incidences or the number of days since BMDs take into account both the amount of beach and the length of time of a closure or posting. The California State Water Resources Control Board and all California coastal counties use BMDs for reporting closures and postings which provides a standardized measure allowing comparison of different areas (beach to beach or county to county) or assessing trends over time.

9
OCEAN AND BAY WATER QUALITY ADVISORIES DUE TO STANDARDS VIOLATIONS When a bacteriological water sample fails to meet any of the AB 411 Ocean Water-Contact Sports Standards (see page 7) the following occurs:
• Warning signs are posted at the affected ocean or bay areas indicating that the waters have exceeded health standards.
• All the information regarding the posted areas is updated on the DEH Beach and Bay Hotline (619-338-2073) and www.earth911.org web page.
• Additional bacteriological water samples are collected at the posted areas and the results are evaluated daily to determine if the areas posted with warning signs should be increased, reduced, shifted or removed.
Because ocean or bay waters which violate the AB 411 Ocean Water-Contact Sports Standards may cause illness to users, the DEH Ocean & Bay Recreational Water Program recommends staying out of the water at all beach areas that are posted with the health warning sign shown above.
Advisories for San Diego County Beaches 2000 - 2004 (April - October) The information provided in this section is the data reported to the California State Water Resources Control Board beginning with the year 2000, the first calendar year that the AB 411 Ocean Water-Contact Sports Standards were in place. Comparisons for days posted under advisory are limited to the April to October time period due to changes in monitoring frequencies at some locations between November and March since 2000.
The following charts and graphs depict the total number of advisory Beach Mile Days due to exceedances of standards [Figure 6], the total number of samples collected versus the number of advisories issued due to bacterial exceedances [Figure 7], and the total days posted [Figure 8] between April 1 and October 31 each year.
Beach Mile Days for Advisories due to exceedances of standards, April 1 to October 31
83
45 4528 30
0
20
40
60
80
100
2000 2001 2002 2003 2004
year
BM
Ds
AdvisoryBMDs
Figure 6: Advisory beach mile days due to bacterial exceedances
Temporary sign

10
Comparison of routine samples vs. exceedances, April 1 to October 31
34913092
35223334
3062
170 131 98 99 800
1000
2000
3000
4000
2000 2001 2002 2003 2004
year
beac
h w
ater
sam
ples Routine samples
Number of routine samplescausing Advisories due tobacterial exceedances
Figure 7: Routine samples versus exceedances
Bacterial Exceedances (Advisories), April 1 to October 31
170 131 98 99 80
1034
760 730
460 505
0
200
400
600
800
1000
1200
2000 2001 2002 2003 2004
year
Number of routinesamples causingAdvisories due tobacterial exceedances
Days posted forbacterial exceedances
Figure 8: Advisory events (exceedances) and days posted Overall, water quality at most beaches in San Diego County is very good during dry weather. Weekly bacterial monitoring data is sent to Heal The Bay, which provides a water quality grade for each location based upon the last four weeks of monitoring data. In its 2004 Summer Beach Report Card, Heal The Bay assigned 94% of monitored locations in San Diego County with a grade of ‘A’ or ‘B’ for water quality. The annual, summer, and weekly report cards by Heal The Bay can be viewed at www.healthebay.org. For most locations, the annual grade assigned by Heal The Bay agrees with the assessment of health risk from water contact by DEH. The weekly report card provides beach goers with the recent trend in water quality at a beach, but does not provide the current status assigned by DEH. For the current status, check the DEH Beach and Bay Water Quality Report Hotline (619-338-2073) or web page (www.earth911.org ‘beach water quality’).
These graphs do not include chronic advisory days (Children's Pool). See page14.

11
Advisory days posted by coastal jurisdiction 2000 – 2004 (April – October) The number of days posted under advisory due to bacterial exceedances for each coastal jurisdiction is shown below.
Table 3: Days posted for bacterial exceedances (Advisories) between April 1 and October 31
2000 2001 2002 2003 2004San Onofre 1 13 4 11 0Camp Pendleton 0 0 0 0 0Oceanside 15 8 26 32 53Carlsbad 5 4 1 4 2Encinitas 69 22 5 22 16Solana Beach 0 5 2 7 2Del Mar 3 0 5 2 11Mission Bay, SD 581 346 279 124 190Mission Bay Epi study . . . 70. ocean beaches, SD 229 177 76 124 168San Diego Bay 77 166 319 50 61Coronado 8 5 4 2 0Imperial Beach 7 6 0 5 0BF, TJSNWRS 39 8 9 7 2
totals per year, all locations 1034 760 730 460 505
For a detailed map of sampling locations at San Diego County beaches, go to www.earth911.org and select ‘ Beach Water Quality’ for San Diego County.
Changes in sampling procedures by DEH: In April 2001 DEH moved its routine sample collection point at locations with outlets (storm drains, rivers, or lagoons) to 25 yards downcoast from the mixing zone, except in Mission Bay due to inadequate signage at drain outlets there. This change was made to conform to the State’s and other agencies recommendations. This change in the routine sample collection procedure was applied to Mission Bay locations in June 2003.
Figure 9: Dry weather flow from Cottonwood Creek outlet at Moonlight Beach, Encinitas

12
Analysis of dry weather bacterial exceedances, June 1– October 15, 2004 The following graphs show information related to bacterial exceedances (violations of single sample standards) for beach water samples collected between June 1st and October 15th, 2004. The exceedance rate during this dry weather period was 2% (52 exceedances in 2300 routine monitoring samples). Figure 10 shows the percentage of re-samples that did not confirm the presence of bacterial contamination detected in the initial sample exceedance. Re-samples are collected after an advisory has been issued due to a routine sample result that exceeds (violates) any one of the four state single sample standards [page 7]. While a total of 43 (83%) re-samples did not confirm the initial exceedance, 15 (29%) did yield elevated bacterial levels that can affect the 30-day geometric mean and compliance with those standards.
Re-sample confirmation of bacterial exceedances (N=52), June 1 - October 15
29%
54%
17%Re-sample results withinsingle sample standards,but elevated (enterococci> 30 MPN/100mL)
Re-sample results withinsingle sample standards(does not confirm initialexceedance)
Re-sample resultsexceed 1 or more singlesample standards(confirms initialexceedance)
Figure 10: Resample confirmations
Fourteen (27%) of the 52 advisories were caused by multiple indicator exceedances (i.e., fecal coliforms and enterococci, or enterococci and FC/TC ratio, etc.), while 38 (73%) were caused by an exceedance of only one indicator [Figure 12, next page]. The number of exceedances by each indicator is shown in Figure 11.
Exceedances by indicator. 71 total in 52 samples.
46
14
0
11
0
10
20
30
40
50
Enterococci Fecal Coliforms Total Coliforms FC/ TC ratio
Indicator
Valu
es (N
=71)
Figure 11: Exceedances by indicator

13
Advisories caused by a single indicator exceedance
92%
5%
0%
3%
EnterococciFecal ColiformsTotal ColiformsFC/ TC ratio
Figure 12: Advisories caused by single indicator exceedance

14
Beaches under a chronic advisory or closure Analysis of water quality advisory and closure data in the 2004 Beach Closure and Advisory Report does not include locations posted or closed under a chronic status (i.e., Children’s Pool, and the Tijuana Slough and Border Field State Park shorelines) because normal protocols to remove signs are not followed at these locations. Although sample results at chronic locations may occasionally be within state standards, the presence of known, on-going sources of contamination require these beaches to remain under a water quality advisory or closure status to protect public health.
Figure 13: Children’s Pool in La Jolla, San Diego

15
OCEAN AND BAY WATER CLOSURES DUE TO SEWAGE SPILLS When a known release of sewage is reported to the DEH Ocean & Bay Recreational Water Program, staff immediately issues a water contact closure for ocean or bay waters that may be affected by the sewage discharge.
The closure area is based on many factors including type of sewage (e.g., untreated, secondary treated, sewage sludge), volume of discharge, location of spill, ocean currents and tides, historical sewage spills in the area, and any other pertinent information. After the initial closure area is established, the appropriate agencies are notified, the area is posted with closure signs, a press release is issued, the Beach & Bay Water Quality Phone Hotline and www.earth911.org web page are updated with the beach closure information, and bacterial sampling of the affected area is initiated.
The closed ocean or bay water area will be reopened or reduced in size when the contamination source has been eliminated and after two daily consecutive sampling results indicate the affected area meets the AB 411 Ocean Water-Contact Sports Standards.
Status information regarding the closure is listed on the Beach & Bay Ocean and Bay Water Quality Report Hotline at (619) 338-2073 and the www.earth911.org web page, see beach water quality.
Figure 14: Sanitary sewer overflow (SSO)
Temporary sign
A 100 gallon /minute spill through a sewer manhole. Overflows are typically caused by blockages (grease, tree roots, debris) or rain infiltration of sewer lines. Spills often flow into the street and then into storm drains, which transport flows directly to the ocean or into rivers or creeks, which flow to the ocean. The storm drain system is not connected to the sewer system in San Diego County.

16
Sewage Spills and Ocean and Bay Water Closures 2000 – 2004 (calendar year) The following charts and graphs depict the total number of closures and known volume of sewage spilled to recreational waters in San Diego County from 2000 – 2004 [Table 4, Figure 15] and total number of Beach Mile Days due to closures [Table 5]. In 2004, the total number of closures and total number of closure Beach Mile Days increased for the second consecutive year. Until the 2004/ 2005 rainy season began in October 2004, San Diego County was on track to have its lowest number of beach closures in seven years. Nineteen (45%) of the 42 beach closures in 2004 occurred after October 16th.
Table 5, Closure beach mile days due to sewage contamination, shows the extent of loss of recreational beach use by the county as a whole and by coastal jurisdiction for every year since 2000. The number of Beach Mile Days can be used to determine the percentage loss caused by beach closures. For example, the county as a whole lost about 1.2% of its yearly Beach Mile Days to closures in 2004 [(225 /19053) x 100], but Imperial Beach lost 15.8% of its yearly Beach Mile Days to closures in 2004 [(81/511) x 100].
The yearly contribution by the Tijuana River to the total number of closure Beach Mile Days is shown in Table 6 and Figure 16 [page 18]. It is noteworthy that the closures caused by the Tijuana River account for 70% or more of closure Beach Mile Days for every year except 2002. Closures caused by sewage-contaminated runoff from the Tijuana River are seasonal because the river flow is diverted to the U.S. IBWC treatment plant during low flow conditions (flows less than 15 million gallons per day), so years with lower amounts of rainfall tend to have fewer beach closures at south county beaches.
Table 4: Beach closures and gallons spilled
2000 2001 2002 2003 2004 Beach closure events 44 50 35 39 42 Volume (gal) of sewage spilled to recreational waters 36,673,012 1,952,453 11,704,314 2,066,355 7,359,373
Figure 15: Graph of beach closures and gallons spilled
Beach Closures and volume of sewage impacting recreational waters
44 50 35 39 42
1
10
100
1,000
10,000
100,000
1,000,000
10,000,000
100,000,000
2000 2001 2002 2003 2004
year
Clo
sure
eve
nts
and
gallo
ns
Beach closureevents
Volume (gal) ofsewage spilled torecreationalwaters
This graph does not include volumes of sew age-contaminated runoff discharged by the the Tijuana River.

17
Table 5: Closure beach mile days due to sewage contamination
Beach Closure BMDs in San Diego County. Source of sewage contamination may not have originated in the jurisdiction affected.
coastal jurisdiction
available BMDs [beach miles x 365 days] 2000 2001 2002 2003 2004
San Onofre SB (includes MCB Camp Pendleton) 4.3 x 365 = 1569 1.3 0.5 0.0 1.0 0.0 Oceanside (Harbor Beach, Oceanside pier, and Buccaneer Beach) 3.7 x 365 = 1351 1.2 0.0 1.2 0.3 3.0 Carlsbad (Carlsbad State and South Carlsbad State Beaches and Aqua Hedionda Lagoon) 6.5 x 365 = 2372 1.3 3.5 1.8 4.7 1.0 Encinitas (Leucadia/ Grandview, Stone Steps, Moonlight, Swami's, San Elijo State Park and Cardiff State Beach) 5.9 x 365 = 2153 0.4 2.1 4.9 4.8 10.5
Solana Beach (Tide Beach, Fletcher Cove, Seascape Park) 1.3 x 365 = 475 0.1 0.1 0.0 0.0 1.5
Del Mar (San Dieguito River Beach to Andersen Canyon) 2.2 x 365 = 803 0.3 0.2 0.9 0.6 0.0 City of San Diego, coastal beaches (Torrey Pines State Beach south to Pt Loma) 17.9 x 365 = 6533 8.3 5.9 4.1 11.3 31.0
City of San Diego, Mission Bay 2.0 x 365 = 730 0.3 20.3 8.0 11.0 12.0
San Diego Bay (can include Coronado, San Diego, and Chula Vista jurisdictions) 1.0 x 365 = 365 1.6 1.5 3.7 1.0 5.5 Coronado (and Silver Strand SB) Includes closures due to sewage contamination from Tijuana R. 3.7 x 365 = 1351 18.2 93.4 0.0 81.3 79.5 Imperial Beach Includes closures due to sewage contamination from Tijuana R. 1.4 x 365 = 511 32.0 76.9 22.0 72.0 81.0 Border Field State Park and TJSNWRS (non-chronic closures)
2.3 x 365 = 839 27.6 0.0 8.9 0.0 0.0
Yearly total BMDs 52.2 x 365 = 19053 93 204 56 188 225 +
Border Field State Park and TJSNWRS BMDs (chronic closures) 98.5 163 141 136 200
Chronic closures: See page 14.

18
Table 6: Contribution of BMD closures caused by Tijuana River
Beach Mile Days graph for Closures due to sewage contamination Year 2000 2001 2002 2003 2004
Closure BMDs, including those due to Tijuana River* 93 204 56 188 225Closure BMDs, NOT including those due to Tijuana River* 15 34 31 35 67
% contribution of BMD Closures due to Tijuana River 84 83 45 81 70*non-chronic closures
Beach Mile Days for Closures
93
204
56
188225
1534 31 35
67
0
50
100
150
200
250
2000 2001 2002 2003 2004year
BM
Ds
Closure BMDs,including thosedue to TijuanaRiver*Closure BMDs,NOT includingthose due toTijuana River*
Figure 16: Graph of contribution of Tijuana River to closure Beach Mile Days
Figure 17: Water contact closure sign at the south end of Seacoast Dr.
To the south is the Tijuana Slough National Wildlife Refuge Shoreline. This area typically re-opens in early summer every year until the next significant rain the following winter.

19
OCEAN AND BAY GENERAL ADVISORIES 2000 - 2004 During and after a significant rainstorm event, storm drains, creeks and rivers carry floodwaters and urban runoff (which may include fertilizers, road oils, litter and large amounts of bacteria from a variety of sources such as animal waste and decomposing vegetation) directly to ocean and bay waters.
The levels of bacteria can rise significantly in ocean and bay waters, especially near storm drains, creeks, rivers and lagoon outlets that discharge urban runoff during and after rainstorms. To ensure that public health is protected, the DEH Ocean & Bay Recreational Water Program staff issue a General Advisory to avoid all ocean or bay water contact for 72 hours (three days) after a significant rain (greater or equal to 0.20"). The elevated bacterial levels in the coastal ocean waters may continue for a period of three days depending on the intensity of the rain and the volume of runoff.
The General Advisory issued by the Ocean & Bay Recreational Water Program consists of a press release to the media, and listing on the Beach & Bay Ocean and Bay Water Quality Report Hotline (619) 338-2073 and the www.earth911.org web page. Additional temporary advisory signs are not posted for General Advisories.
The following is a list of significant coastal outlets in San Diego County based upon volume or quality of flow during wet weather, or year round flow to ocean waters. Locations with low flow diversions (LFD) to sewer treatment plants or other treatment are noted. Most of these outlets are posted with the permanent health risk warning signs shown above.
Camp Pendleton and San Onofre State Beach: San Mateo Creek outlet, San Onofre Creek outlet, and Santa Margarita River outlet
Oceanside: San Luis Rey River outlet, Wisconsin Street storm drain, and Loma Alta Creek outlet (LFD)
Carlsbad: Buena Vista Lagoon outlet, Carlsbad Village Drive storm drain, Pine Ave storm drain, Aqua Hedionda Lagoon outlet (north – Tamarack; south- Warm Water Jetty), Encina Creek outlet, Batiquitos Lagoon outlet Encinitas: Cottonwood Creek outlet /Moonlight Beach (UV treatment), San Elijo Lagoon outlet Solana Beach: storm drains at Fletcher Cove (LFD) and Seascape Beach Park Del Mar: San Dieguito River Beach, 15th Street storm drain, storm drain between 12th and 15th Street, Sea Orbit Lane storm drain, and Andersen Canyon storm drain City of San Diego coastal beaches: Los Peñasquitos Lagoon outlet, Torrey Pines Golf Course drainage at Black’s, Scripps Institute of Oceanography permitted discharge on south side of Scripps pier, storm drains at El Paseo Grande, Vallecitos, Avenida Del La Playa (LFD), La Jolla Cove (LFD), Coast Bl gazebo, north Nicholson Pt/ Hospitals, Ravina/ Horseshoes (LFD), Bonair (LFD), Playa Del Norte, P.B. Point, Tourmaline (LFD), Law Street, San Diego River outlet / Dog Beach, storm drains at Narragansett Ave, Pescadero Ave, Point Loma Ave,
Permanent sign

20
Osprey Street, Hill Street, Monaco Street, and Ladera Street. City of San Diego Mission Bay beaches: Tecolote Creek outlet (LFD), Tecolote Shores (LFD), Leisure Lagoon, Cuddahy Creek outlet, Visitor’s Center storm drain (LFD), De Anza Cove storm drains (LFD), Rose Creek outlet (LFD), north Crown Point (LFD), south Crown Point (LFD), La Cima (LFD), Santa Clara Cove (LFD), Santa Barbara Cove (LFD), Bonita Cove, and Balboa Court (LFD). San Diego Bay beaches: Lawrence Street, Spanish Landing, Bayside Park, and Tidelands Park. City of Coronado: storm drain at north beach (LFD) Tijuana Slough National Wildlife Refuge Shoreline: Tijuana River outlet (LFD)
Figure 18: Plume from the San Diego River outlet following heavy rains in January 2005. Photo: Ocean Imaging, Inc.

21
The dates that DEH issued a General Advisory for San Diego County ocean and bay waters due to contamination by urban runoff following rain during 2000 – 2004 are listed below.
YEAR 2000 (38 Total General Advisory Days) January 25 – January 28, February 11 – February 29 March 5 – March 9, April 18 – April 23 October 27 – November 1, November 11 – November 14
YEAR 2001 (49 Total General Advisory Days) January 9 – January 15, January 26 – January 29 February 13 – February 17 February 24 – March 2, March 6 – March 9 March 10 – March 12, April 7 – April 13 November 13 – 16, November 25 – 28 November 29 – December 6, December 10 – 13, December 21 – 24
YEAR 2002 (35 Total General Advisory Days) January 28 – February 1 March 8 – 11, March 18 - 21 March 24 – 27 April 24 – 29, September 6 – 10 November 8 – November 12 December 17 – 24, December 29 – 31
YEAR 2003 (32 Total General Advisory Days) February 11 – February 18 February 25 – March 2 March 16 – 20, April 14 – 18 May 3 – 6, November 1 – 4 November 12 – 15, December 26 – 29 YEAR 2004 (48 Total General Advisory Days) January 3 – 6, February 3 – 6 February 19 – 29, March 2 – 5 April 2 – 5, April 17 – 20 October 17 – 23, October 27 – 30 November 9 – 10, November 21 – 24 November 28 – December 1 December 5 – 9, December 28 – 31
Figure 19: Wet weather flow at 15th St. storm drain outlet in Del Mar

22
SPECIAL STUDIES, 2000 – 2004 Three studies of interest have been completed in the past three years.
Mission Bay Bacterial Source Identification Study, 2002 – 2004 In 2002, the City of San Diego obtained a $1.3 million grant under the state’s Clean Beach Initiative (Prop 13) to identify the sources of bacterial contamination to Mission Bay. Despite a $10 million low flow diversion system constructed in the early 1990’s for storm drains encircling Mission Bay, monitoring from 1999 to 2003 at 45 locations showed an overall bacterial exceedance rate of 11% in the bay during dry weather, and as high as 56% at problem locations.
Some of the major tasks of the Mission Bay Bacterial Source Identification Study included the investigation of potential sources of human sewage from park restroom infrastructure and anchored boats, and molecular source tracking techniques to identify the host origin (human, bird, etc.) of bacteria found in bay waters.
The two phases of the study (July 2002 to June 2003, and July 2003 to June 2004) included 1,300 hours of visual observations of suspected sources, collection of 500 bay water samples, and over 1,000 isolates from samples analyzed using molecular source tracking. The major findings of the study are below. It is important to note these findings apply to Mission Bay water quality during dry weather and in absence of any significant urban runoff flows.
1. Leaks from sewer infrastructure in Mission Bay Park and illegal sewage discharge by moored boats are not likely chronic sources of bacterial contamination of beaches in the bay.
2. The molecular source tracking results confirmed that the majority (67%) of indicator bacteria comes from birds and the contribution from human sources is insignificant (less than 6%).
3. The beach sediments act as a reservoir or source of bacteria, that allow bacteria to persist after deposition has occurred. When sediments are disturbed by strong winds or swimmers’ feet, the indicator bacteria are released back into the bay water.
4. High tide washing of the wrack line on the beach where organic debris (eel grass, algae, etc.) sits can also produce elevated bacterial levels when bacteria associated with the decomposition of this organic matter are washed into bay waters.
5. The accumulation of organic debris inside storm drain outlets allows the replication of indicator bacteria that are released into bay waters on higher tides. This is common even at storm drains connected to the low flow diversion system.
This study has not been published in a peer reviewed scientific journal. For a copy of the study, please contact the City of San Diego Stormwater Program at (619) 525-8647.

23
Mission Bay Epidemiology Study, summer 2003 The Southern California Coastal Water Research Project and the University of California Berkeley coordinated a cohort based epidemiological study in Mission Bay to determine if there is an increased health risk in swimmers compared to non-swimmers and, if so, was there any association between illness in swimmers and bacterial or viral indicators of water quality. The study involved nearly 8,800 participants from the six most popular swimming beaches in Mission Bay on weekends and holidays during the summer of 2003. On the same day that participants were recruited, multiple water samples were collected at each of the six locations four times each day. Ten to fourteen days after water exposure in the bay, participants were contacted by telephone and interviewed about symptoms of illness that occurred since their visit to the beach.
The major findings of the study are summarized below. It is important to note that these findings apply to Mission Bay water quality during dry weather and in absence of any significant urban runoff flows and any sewage spills.
1. The risk of swimming related illness in Mission Bay during the summer of 2003 was modest. Of the fourteen measured illness symptoms, only skin rash and diarrhea were significantly elevated in swimmers compared to non-swimmers. The attributable risk was estimated as 11 additional cases of diarrhea per 1,000 swimmers compared to non-swimmers. [The attributable risk increased to 27 additional cases of diarrhea per 1,000 swimmers compared to non-swimmers for children aged 5 to 12 years old.]
2. Among swimmers, there were no associations between risk of illness and the traditional bacterial
indicators of water quality.
3. Among swimmers, there were no associations between risk of illness and the measured levels of non-traditional indicators of water quality (Bacteriodes, enterococcus using rapid methods [QPCR], human pathogenic virus [adenovirus and Norwalk-like virus], or somatic phage.)
These findings suggest the risk of illness from water contact during the study was not related to the typical water quality measures used for monitoring.
This study is currently available at www.sccwrp.org/pubs/techrpt.htm
24
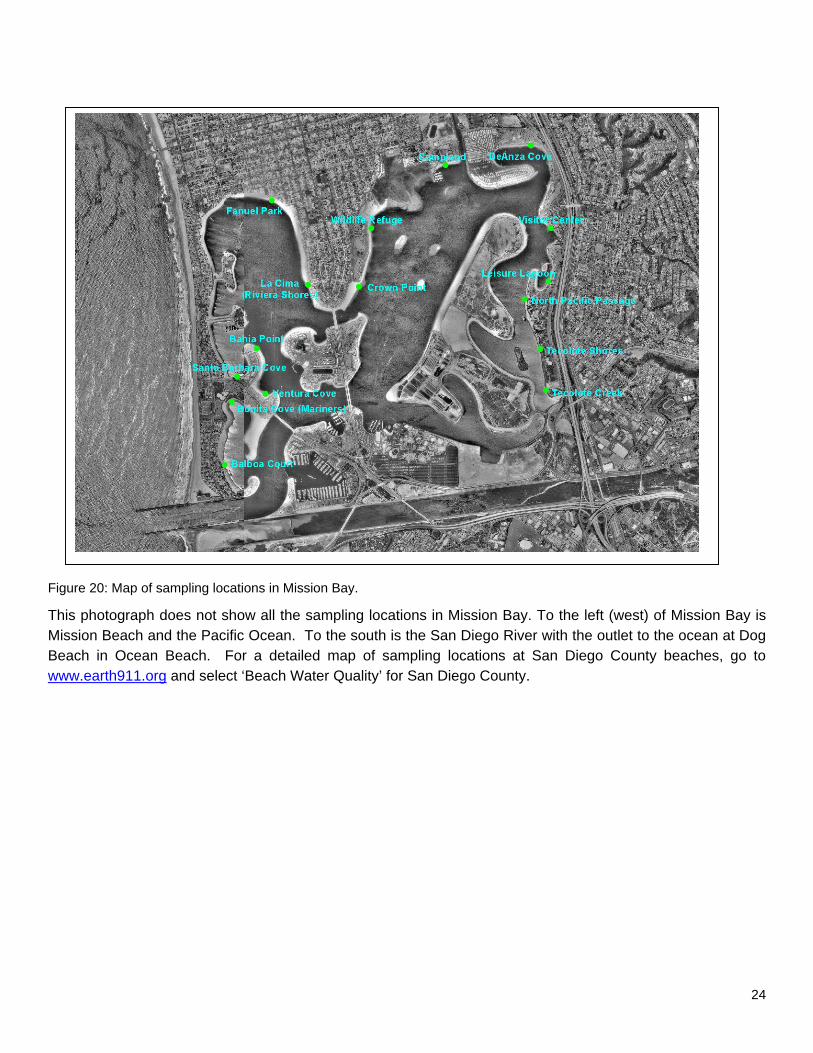
Figure 20: Map of sampling locations in Mission Bay.
This photograph does not show all the sampling locations in Mission Bay. To the left (west) of Mission Bay is Mission Beach and the Pacific Ocean. To the south is the San Diego River with the outlet to the ocean at Dog Beach in Ocean Beach. For a detailed map of sampling locations at San Diego County beaches, go to www.earth911.org and select ‘Beach Water Quality’ for San Diego County.

25
San Diego Coastal Ocean Observing System and Remote Sensing Projects at south county beaches In 2002, the County of San Diego provided $ 112,000 in funding to the Scripps Institution of Oceanography to collect and analyze bacteria levels in beach water samples in order to validate the San Diego Coastal Ocean Observing System (SDCOOS www.sdcoos.ucsd.edu) as a tool for real time beach water quality monitoring. The study area of this effort were the south county beaches, particularly Imperial Beach, that are routinely subject to beach closures following winter and spring rains. The study effort focused on the historical analysis of bacterial data in comparison to ocean currents, rainfall amounts, and flows from the Tijuana Estuary, as well targeted bacterial sampling to be correlated with Doppler radar measurements of alongshore and near shore currents measured at the Imperial Beach pier and one kilometer offshore from the Tijuana Rivermouth.
Concurrent with this project was the Remote Sensing Project funded by the State Water Resources Control Board, the City of San Diego, and the U.S. International Boundary & Water Commission. This project sought to confirm the source(s) of contamination of south county beaches using aerial photographs and satellite imagery. See also www.sdcoastview.oceani.com
The San Diego Coastal Ocean Observing System has placed on one web page most of the information tools DEH uses in determining when to issue closures for south county beaches. The correlation of bacterial monitoring data and measurements of ocean currents in this study, and DEH observations, has validated the DEH protocol to issue closures at beaches north of the Tijuana River outlet (Imperial Beach, Silver Strand State Beach and Coronado) following significant rainfall, and other times when data indicates northward moving currents. The Remote Sensing Project has confirmed the Tijuana River/ Estuary as the primary source of contamination of south county beaches during wet weather.
Figure 21: Turbidity plumes along the coast following rain
Satellite image of turbidity plumes from major outlets on the southern San Diego coast following a winter storm. The plume from the Tijuana River can be seen south of Imperial Beach affecting all south county beaches. Plumes from San Diego Bay and the San Diego River are also shown. A fourth plume from the San Antonio De Los Buenos wastewater treatment plant in Baja California, Mexico is visible south of the international border.

26
Figure 22: Ocean current direction data on SDCCOS
SDCOOS web page www.sdcoos.ucsd.edu real time measurement of near shore current direction at the Tijuana River outlet. The values indicate the magnitude of north or south current direction. Values greater than zero indicate south to north moving currents; and values less than zero indicate north to south moving currents. DEH uses this data and other information to determine when to issue closures for south county beaches due to sewage- contaminated runoff from the Tijuana River. This real time data for beach water quality monitoring allows DEH to make more accurate and timely notifications to protect public health, as well as reduce unnecessary economic hardship on local communities.