2004 financial analysis - phc4 · an annual report on the financial ... or as components of larger...
TRANSCRIPT

2004FINANCIAL
ANALYSIS
VOLUME ONE
GENERAL ACUTE CARE HOSPITALS
An Annual Report
on the Financial Health of Pennsylvania’s Hospitals
Pennsylvania Health Care Cost Containment CouncilApril 2005
PHC4 • 2004 Financial Analysis • Volume One • 1
Hospital Income
The Pennsylvania Health Care Cost Con-tainment Council (PHC4) is an independent state agency charged with addressing the cost and quality of health care in Pennsylvania. PHC4 fosters competition in the health care market through the collection, analysis and dis-semination of quality health care information.
In order to maintain a high quality, cost-ef-fective health care delivery system, hospitals and freestanding surgery centers must be financially viable. Beginning with fiscal year 1989, PHC4 has produced a series of financial reports that measure the financial health of the Commonwealth’s hospitals and surgery centers and the utilization of their services.
This is the first report in PHC4’s Financial Analysis 2004 series. This volume presents a
profile of the financial health of Pennsylvania’s 182 General Acute Care (GAC) hospitals. A Preview of statewide financial trends was released in February 2005. A subsequent volume will report on the non-GAC hospitals (rehabilitation, long-term acute, psychiatric and specialty) as well as ambulatory surgery centers.
This report focuses primarily on Fiscal Year 2004 (FY04). For most General Acute Care hospitals, FY04 began on July 1, 2003 and ended June 30, 2004. For those hospitals that utilize a different fiscal year, the data presented in this report reflect the fiscal year that ended prior to June 30, 2004.
The information contained in this report was derived from the annual hospital financial statements supplemented with additional data supplied by each hospital. By law, hospitals are required to submit this financial and utilization information to PHC4. Every reasonable effort has been made to ensure the accuracy of the information contained herein. Each facility had the opportunity to review its data and to make correc-tions. The ultimate responsibility for data accuracy lies with the individual facility.
Foreword
Table of Contents
Hospital Income......................................................................1
For-Profit Hospitals .................................................................7
Utilization and Revenue by Payor .........................................9
Uncompensated Care ...........................................................17
Hospitals with a Negative 3-Year Average Total Margin....19
Individual Hospital Data......................................................29
Explanation of Terms ...........................................................44
Non-Compliant Hospitals....................................................45

PHC4 • 2004 Financial Analysis • Volume One • 1
Hospital Income
Hospital Income
What are General Acute Care Hospitals?General Acute Care (GAC) hospitals
include all non-federal, short-term general and specialty acute care hospitals open to the public. By definition, patients typically stay at GAC hospitals less than 30 days. However, many GAC hospitals operate subunits, such as skilled nursing units, where a patient’s stay may exceed 30 days. Generally, all of the ac-tivities of a hospital and any of its subunits are included in the information presented in this report. Ancillary operations, such as physician practice groups, have been excluded whenever possible.
During the 2004 fiscal year (FY04), there were 182 GAC hospitals licensed in Penn-sylvania. All but 20 of these GAC hospitals functioned solely as non-profit organizations or as components of larger non-profit orga-nizations. All income or “profit” from their operations is retained within the organization. The primary uses of income are to fund capital improvements, retire outstanding debt, and to provide a reserve in the event revenues do not cover expenses in the future.
For-profit hospitals may distribute a portion of their income to shareholders as dividends. In FY04, six for-profit corpora-tions operated 20 GAC hospitals. Four of the six corporations made a profit during FY04 (2003) and two of the four corporations paid dividends to its shareholders. The dividends were equal to 6.9% of net (after-tax) income for Health Management Associates (HMA) and 2.3% of net income for Universal Health Systems (UHS). Consequently, about 93% of HMA’s income and about 98% of UHS’
income was retained within the corporation. Since Community Health Systems and Prov-ince Healthcare made a profit and did not pay dividends, 100% of their income was retained in the corporation. (Additional information on Pennsylvania’s for-profit GAC hospitals is presented in the “For-Profit Hospitals” section on page 7.)
Why is Income Important?Hospitals need a positive total income
(total margin) to stay in business. Those that have a negative total margin (deficit) are not receiving sufficient revenue to pay all of their expenses. Hospitals operating at a deficit must use other sources of funds, such as cash re-serves or the liquidation of assets, to pay their expenses. Unless these hospitals can alleviate the deficit by increasing revenues and/or cut-ting expenses, they can stay in business only as long as they have assets to liquidate.
Earning a positive total margin alone may not be enough to remain viable. Hospitals need to earn sufficient income to make im-provements to their facilities and equipment. These investments are necessary to replace worn out or obsolete buildings and equipment, keep pace with changes in medical technology, and meet the changing health care needs of the community.
In addition to using their own funds, hospitals finance improvements to facilities and equipment by issuing bonds or entering into other debt financing. However, financial institutions and potential bondholders must be convinced that a hospital is capable of re-paying its debt. Therefore, it may be difficult for hospitals that are projected to have low or negative income to borrow money.
It is very important to closely monitor

2 • PHC4 • 2004 Financial Analysis • Volume One
Hospital Income
PHC4 • 2004 Financial Analysis • Volume One • 3
Hospital Income
hospital income levels because relatively small changes in revenues or expenses can make a large difference in the financial health of a hospital. For example, a hospital realizing an above-average 4% operating margin one year can have an operating deficit the following year if revenues fall by 2% and expenses rise at the rate of inflation (e.g., 3%).
What is an “Appropriate” Income Level?The “appropriate” level of income needed
to keep a hospital viable will be different for each individual hospital or health system. The precise amount of income a hospital needs depends on several factors, including, but not limited to: the condition of its plant and equipment, amount of debt, assets available for capital improvements, the mix of care provided by the hospital, the level of payment risk, and the current and future needs of the market a hospital serves.
For example, a hospital that has expe-rienced low or negative income levels for a number of years may need to realize an above average income level if it is to make overdue capital improvements, reduce outstanding debts, and replenish its capital reserves. Alter-natively, a hospital with a history of con-tinuous moderate income levels can probably remain viable with a lower income level if it has kept pace with needed improvements and has not depleted its capital reserves or acquired debt in order to meet expenses in the past.
Operating Margin vs. Total MarginHospital income is usually expressed as
either operating margin or total margin. Operating margin reflects the percent of
operating revenue remaining after all operating expenses are paid. A hospital’s operations in-
clude patient care as well as a variety of other related functions such as medical education, cafeterias, office space, and parking. A posi-tive operating margin indicates a hospital is receiving more revenue for its operations than it costs to run them. Alternatively, a negative operating margin indicates that revenues are not covering costs.
The calculation of total margin includes both operating income and income from all other sources. The income from sources other than operations is called “non-operating income.” Examples of non-operating income are investment and trust income and contribu-tions. However, some hospitals include all or part of investment and trust income in operat-ing revenue, particularly when the funds have been designated to support specific operations of a hospital.
Total margin reveals the composite finan-cial health of a facility during the year. If total margin is negative, the hospital is losing money after all sources of revenue and income have been considered.
Some hospitals have endowments that enable them to provide care beyond the level of operating revenue they receive. For those hospitals, a negative operating margin may not be that critical as long as they can realize a healthy positive total margin. Other hospi-tals may not have large endowments or other sources of income. As a result, their operating margins and total margins will be very similar. In these instances, a low or negative operating and total margin may reveal the hospital is under financial stress.
Typically, for-profit hospitals present their financial statements differently than non-profit hospitals. The major differences are that for-profit hospitals typically do not have

2 • PHC4 • 2004 Financial Analysis • Volume One
Hospital Income
PHC4 • 2004 Financial Analysis • Volume One • 3
Hospital Income
a significant amount of non-operating income (if any) and are subject to income taxes.
Thirteen (13) of the 20 for-profit hospitals did not report any non-operating income and six of the remaining seven reported a relatively small amount of non-operating income. Con-sequently, for 19 of the 20 for-profit hospitals, the difference between the operating and total margins is primarily the hospitals’ share of the parent corporations’ income tax expense. The one exception is Elkins Park, which was sold and posted a non-operating gain resulting from the “disposals of facilities and long-term investments.”
If a for-profit hospital had a positive oper-ating margin and its parent corporation paid income taxes, the hospital will have an income tax expense. This tax expense will cause the hospital’s total margin to be lower than the operating margin.
If a for-profit hospital lost money and its parent corporation was subject to income taxes or the parent posted a tax credit, a tax credit was calculated for the facility. The tax credit is an estimate of how much the parent’s tax expense was affected because the hospi-tal’s loss reduced the parent’s net income. In these circumstances, the tax credit will make the hospital’s total margin greater than the operating margin.
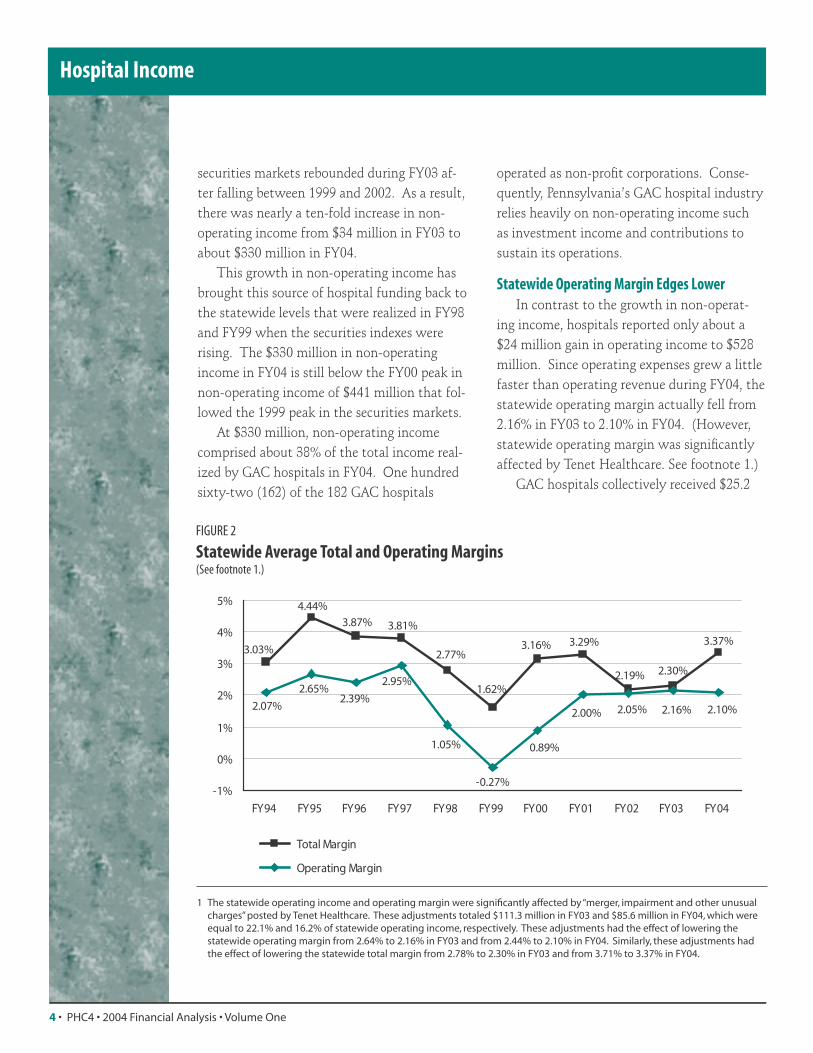
Statewide Total Margin Improves in FY04The overall net income or total margin
realized by GAC hospitals grew by more than a full point from 2.30% in Fiscal Year 2003 (FY03) to 3.37% in Fiscal Year 2004 (FY04).
The improvement in the total margin was primarily driven by a rise in non-operating income. Many hospitals realized gains in the value of their investments during FY04 as the
������
��
����
����
����
����
������
���� ���� ���� ���� ���� ���� ���� ����
��������������������
����������������
(mill
ion
s)
FIGURE 1
Statewide Operating and Non-Operating Income
4 • PHC4 • 2004 Financial Analysis • Volume One
Hospital Income
PHC4 • 2004 Financial Analysis • Volume One • 5
Hospital Income
securities markets rebounded during FY03 af-ter falling between 1999 and 2002. As a result, there was nearly a ten-fold increase in non-operating income from $34 million in FY03 to about $330 million in FY04.
This growth in non-operating income has brought this source of hospital funding back to the statewide levels that were realized in FY98 and FY99 when the securities indexes were rising. The $330 million in non-operating income in FY04 is still below the FY00 peak in non-operating income of $441 million that fol-lowed the 1999 peak in the securities markets.
At $330 million, non-operating income comprised about 38% of the total income real-ized by GAC hospitals in FY04. One hundred sixty-two (162) of the 182 GAC hospitals
operated as non-profit corporations. Conse-quently, Pennsylvania’s GAC hospital industry relies heavily on non-operating income such as investment income and contributions to sustain its operations.
Statewide Operating Margin Edges LowerIn contrast to the growth in non-operat-
ing income, hospitals reported only about a $24 million gain in operating income to $528 million. Since operating expenses grew a little faster than operating revenue during FY04, the statewide operating margin actually fell from 2.16% in FY03 to 2.10% in FY04. (However, statewide operating margin was significantly affected by Tenet Healthcare. See footnote 1.)
GAC hospitals collectively received $25.2
1 The statewide operating income and operating margin were significantly affected by “merger, impairment and other unusual charges” posted by Tenet Healthcare. These adjustments totaled $111.3 million in FY03 and $85.6 million in FY04, which were equal to 22.1% and 16.2% of statewide operating income, respectively. These adjustments had the effect of lowering the statewide operating margin from 2.64% to 2.16% in FY03 and from 2.44% to 2.10% in FY04. Similarly, these adjustments had the effect of lowering the statewide total margin from 2.78% to 2.30% in FY03 and from 3.71% to 3.37% in FY04.
�����
����� �����
�����
�����
����� �����
����� �����
�����
�����
�����
����� �����
����� ����� ����� �����
�����
������
�����
�����
���
��
��
��
��
��
��
���� ���� ���� ���� ���� ���� ���� ���� ���� ���� ����
������������
����������������
FIGURE 2
Statewide Average Total and Operating Margins(See footnote 1.)

4 • PHC4 • 2004 Financial Analysis • Volume One
Hospital Income
PHC4 • 2004 Financial Analysis • Volume One • 5
Hospital Income
���
���
����
������
���
�� ��
���
��
���
��
���
���
���
���
���
���� ���� ���� ���� ���� ���
����
����
�����
����
�����
����
������
������������ ����������������� �����
3-yr Average Total Margin
Reporting HospitalsFY01 to FY03
Reporting HospitalsFY02 to FY04
Number Percent Number Percent
Loss 67 37% 66 37%
0-2% 41 23% 38 21%
2-4% 33 18% 33 18%
4-6% 14 8% 22 12%
6-8% 15 8% 10 6%
>8% 10 6% 11 6%
Total 180 100% 180 100%
billion in operating revenue during FY04, a growth of 7.9% or $1.8 billion over FY03. Statewide operating expenses grew 8.0%, or $1.8 billion, to a statewide total of $24.6 bil-lion.
Net patient revenue (NPR) the revenue hospitals receive for patient care, grew about the same rate as overall hospital operating revenue. NPR increased 8.0% or $1.8 billion to a statewide total of $23.9 billion.
Over the prior two fiscal years (FY02 and FY03), the majority of GAC hospitals experi-enced declines in their operating margins and the statewide operating margin made small improvements. In contrast, during FY04, 61% or 111 of the 181 GAC hospitals that operated in both FY03 and FY04 saw their operating margin improve while the statewide operating margin fell.
FIGURE 3
Statewide Distribution of Three-year Average Total Margin
TABLE 1
Statewide Distribution of Three-Year Average Total Margin

6 • PHC4 • 2004 Financial Analysis • Volume One
Hospital Income
PHC4 • 2004 Financial Analysis • Volume One • 7
For-Profit Hospitals
Fewer Hospitals Lose Money Twenty-seven (27) fewer GAC hospitals
reported losses during FY04. A year earlier (FY03), nearly one-half (48%) or 88 hospitals posted losses. The number of GAC hospitals with negative total margins fell to 61 or about one-third (34%) by the end of FY04.
There were 38 hospitals that reported a positive total margin in FY04 after expe-riencing losses in FY03. In contrast to the statewide total margin that was bolstered by non-operating income, as a group, the im-provement in operating income played a larger role in the recovery of these 38 hospitals. Twenty-six (26) of the 38 hospitals realized a larger growth in operating income than non-operating income, and collectively, 62% of the growth in total income came from operations.
Eleven hospitals posted losses in FY04 after reporting positive total margins in FY03. Operating income was also the primary factor that caused ten of the eleven hospitals to post losses in FY04.
Since extraordinary or short-term events can have a significant impact on a hospital’s annual total margin, a three-year average total
margin can provide a better perspective on a hospital’s medium-term financial health. The percent of hospitals that have sustained losses over a three-year period did not change in FY04. Thirty-seven percent (37%) of the GAC hospitals had negative three-year average total margins in both FY03 and FY04. There was a four-point or eight-hospital growth in the number of hospitals that had three-year average total margins between 4% and 6% and small declines in the 0%–2% and 6%–8% ranges.
The Growth in Hospital Charges Continues to Outpace the Growth in Net Patient Revenue
Hospitals maintain a schedule of fees for all of the services they provide. These are commonly referred to as “charges.” Table 2 demonstrates how much charges are increas-ing compared to patient revenues and total operating expenses. For example, in FY97 hospital charges were 2.2 times greater than hospital NPR. In the eight subsequent years, average charges have grown faster than NPR. By FY04, statewide charges were 3.5 times greater than statewide NPR.
FY97 FY98 FY99 FY00 FY01 FY02 FY03 FY04
Charges to NPR 222% 231% 243% 255% 274% 294% 329% 348%
Charges to TOE 215% 219% 228% 242% 263% 284% 318% 337%
TABLE 2
Statewide Ratio of Charges to Net Patient Revenue (NPR) and Total Operating Expenses (TOE)
6 • PHC4 • 2004 Financial Analysis • Volume One
Hospital Income
PHC4 • 2004 Financial Analysis • Volume One • 7
For-Profit Hospitals
For-Profit Hospitals
For-profit facilities are common among Pennsylvania’s freestanding psychiatric, reha-bilitation, and long-term acute care hospitals. However, prior to 1998, all of the GAC hospi-tals in the Commonwealth were operated by non-profit organizations. Twenty (20) of the 23 facilities listed on Table 3 operated as for-profit hospitals during FY04. Tenet Healthcare closed Parkview Hospital and sold Elkins Park to the non-profit Albert Einstein Healthcare Network. In addition, Tenet acquired the formerly non-profit Roxborough Memorial Hospital.
Two facilities, Chestnut Hill and Phoenix-ville began to operate as for-profit hospitals during FY05. Also during FY05 (CY04), Tenet ended its operation of the Medical College of Pennsylvania and the facility continued to op-erate as the non-profit Woman’s Medical Hos-pital. Woman’s Medical Hospital announced in March 2005 that it was closing.
A Means for RecoveryTwenty-two (22) of the 23 hospitals
presented on Table 3 operated as non-profit hospitals prior to their acquisition by for-profit hospitals. The one exception is the Bariatric Care Center that opened as a new for-profit facility. Nineteen (19) of the 22 formerly non-profit hospitals had either a negative 3-year av-erage total margin, sustained very large losses, and/or were in danger of not satisfying debt obligations prior to their acquisition. Conse-quently, these hospitals were under consider-able financial stress, and for most of them, their financial health had been deteriorating.
Nineteen (19) of the 22 are still operating as for-profit GAC hospitals. Seventeen (17) of these hospitals operated as for-profit for the entire FY04 and 12 had better total margins during FY04 than they did during their last year as a non-profit hospital.
TaxesWhile some non-profit hospitals pay a fee
in lieu of taxes to their local municipality, non-profit hospitals are exempt from local, state and federal taxes. In contrast, for-profit facili-ties generally pay all applicable taxes.
On one hand, the tax revenue generated from for-profit hospitals can be considered a public benefit. On the other hand, these tax expenses must be recovered through the fees for patient care.
Of all the taxes incurred by for-profit hospitals, PHC4 only receives separate data on each hospital’s pro rata share of their parent corporation’s federal income taxes. Nine of the 20 for-profit hospitals in FY04 had positive operating margins and reported federal income tax expenses totaling $48.5 million. For these hospitals, federal taxes were equal to about 5.6% of their total operating revenue.
The ten for-profit facilities that had nega-tive operating margins during FY04 estimated tax credits of $76.7 million because their losses either reduced the overall tax expense or increased the tax credit posted by the par-ent corporations. The net effect of the nine hospitals that made a profit and the ten that operated at a loss was a net statewide federal tax credit of about $28.2 million for the 20 for-profit hospitals. The Bariatric Care Center is a limited liability corporation and is not subject to income taxes.

8 • PHC4 • 2004 Financial Analysis • Volume One
For-Profit Hospitals
PHC4 • 2004 Financial Analysis • Volume One • 9
Utilization and Revenue by Payor
Hospital New Corporate Owner
Date became
For-profit
Full Fiscal Year before Acquisition (Non-Profit)
Current Full Fiscal Year after Acquisition
(For-Profit)
Fiscal Year
Total Margin
3-yr Avg Total
MarginFiscal Year
Total Margin
Ashland Regional Province Healthcare 8/01 FY01 -5.94% -1.84% FY04 -13.24%
Bariatric Care Centers Bariatric Care Centers of PA, LLC. 9/02 NA NA NA FY04 -19.55%
Berwick Community Health Systems, Inc. 3/99 FY98 3.67% 5.21% FY04 3.15%
Brandywine Community Health Systems, Inc. 6/01 FY00 -2.39% -3.72% FY04 6.91%
Brownsville TriCounty Health System, LLC. 5/05 FY04 -6.90% -5.50% FY06 NA
Carlisle Regional Health Management Associates, Inc. 6/01 FY01 10.30% 4.53% FY04 14.87%
Central Montgomery Universal Health Services, Inc. 12/01 FY01 -3.80% -3.62% FY04 -3.93%
Chestnut Hill Community Health Systems, Inc. 2/05 FY04 -22.44% -9.90% FY06 NA
Community Lancaster Health Management Associates, Inc. 7/99 FY99 -17.69% -6.19% FY04 3.34%
Easton Community Health Systems, Inc. 10/01 FY01 -1.64% -1.20% FY04 4.21%
Elkins Park Tenet Healthcare 11/98 FY98 -26.44% -10.72% FY03 -51.98% 3
Graduate Tenet Healthcare 11/98 FY98 -8.63% -7.51% FY04 -38.66%
Hahnemann University Tenet Healthcare 11/98 FY98 -11.86% -4.62% FY04 -7.8% 4
Jennersville Regional Community Health Systems, Inc. 10/01 FY01 -12.61% -12.51% FY04 -2.71%
Lancaster Regional Health Management Associates, Inc. 7/00 FY00 24.32% 1 -9.50% FY04 10.47%
Lock Haven Community Health Systems, Inc. 8/02 FY02 -12.86% -5.52% FY04 5.04%
Medical College of PA Tenet Healthcare 11/98 FY98 -21.19% -5.23% FY04 -13.29%
Parkview Tenet Healthcare 11/98 FY98 -27.46% 2 -19.39% 2 FY03 -16.08% 3
Phoenixville Community Health Systems, Inc. 8/04 FY04 1.01% 3.75% FY06 NA
Pottstown Community Health Systems, Inc. 7/03 FY03 -8.16% -1.53% FY04 2.73%
Roxborough Tenet Healthcare 12/02 FY02 -12.66% -6.64% FY04 -2.46%
St. Christopher’s Children Tenet Healthcare 11/98 FY98 -17.02% -0.83% FY04 10.12%
Warminster Tenet Healthcare 11/98 FY98 -26.59% -6.11% FY04 -6.21%
1 The large positive FY00 total margin for Lancaster Regional is the result of a $20.3 million non-operating gain associated with the acquisition of the hospital by Health Management Associates.
2 The Allegheny Health Education and Research Foundation (AHERF) reported Parkview and City Avenue Hospitals as a single facility. The data presented for FY98 reflects the combined operation of Parkview and City Avenue. City Avenue closed 4/00.
3 The large negative total margins were due to “merger, impairment and other unusual charges” adjustments resulting from the planned closing sale of these facilities.
4 Hahnemann Hospital would have realized a small positive total margin in FY04 if a “merger, impairment and other unusual charges” adjustment is excluded.
TABLE 3
Pennsylvania’s For-Profit GAC Hospitals
8 • PHC4 • 2004 Financial Analysis • Volume One
For-Profit Hospitals
PHC4 • 2004 Financial Analysis • Volume One • 9
Utilization and Revenue by Payor
Utilization and Revenue by Payor
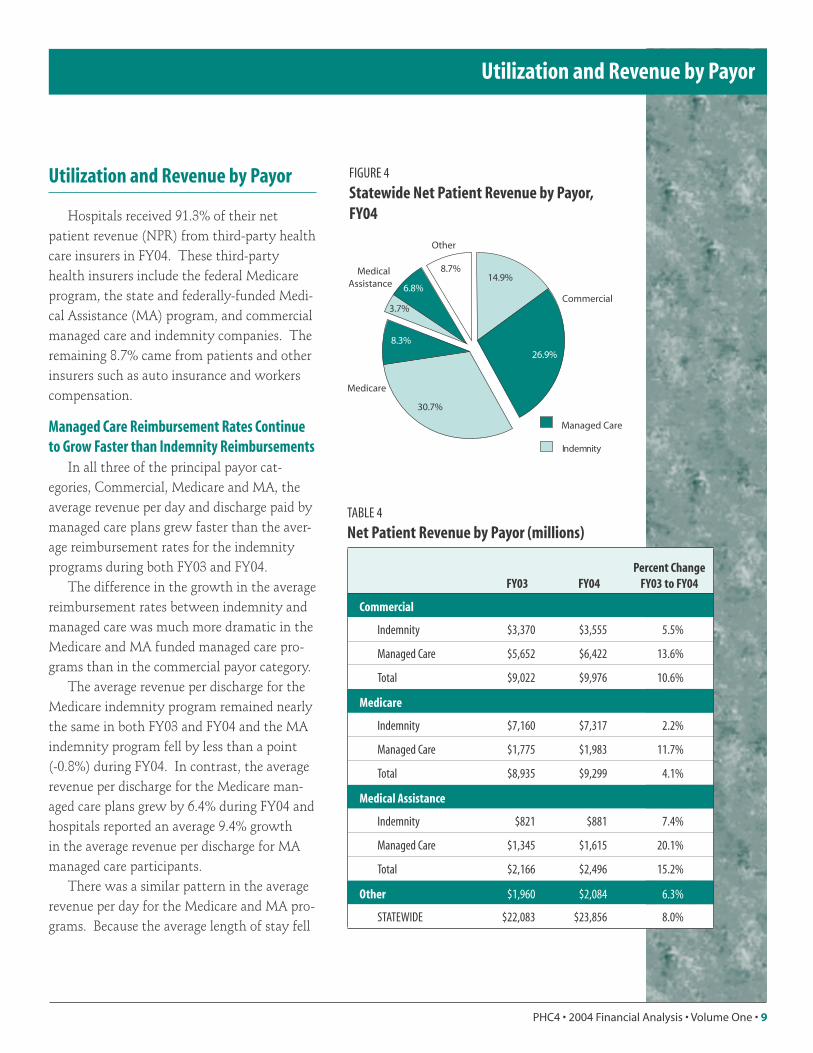
Hospitals received 91.3% of their net patient revenue (NPR) from third-party health care insurers in FY04. These third-party health insurers include the federal Medicare program, the state and federally-funded Medi-cal Assistance (MA) program, and commercial managed care and indemnity companies. The remaining 8.7% came from patients and other insurers such as auto insurance and workers compensation.
Managed Care Reimbursement Rates Continue to Grow Faster than Indemnity Reimbursements
In all three of the principal payor cat-egories, Commercial, Medicare and MA, the average revenue per day and discharge paid by managed care plans grew faster than the aver-age reimbursement rates for the indemnity programs during both FY03 and FY04.
The difference in the growth in the average reimbursement rates between indemnity and managed care was much more dramatic in the Medicare and MA funded managed care pro-grams than in the commercial payor category.
The average revenue per discharge for the Medicare indemnity program remained nearly the same in both FY03 and FY04 and the MA indemnity program fell by less than a point (-0.8%) during FY04. In contrast, the average revenue per discharge for the Medicare man-aged care plans grew by 6.4% during FY04 and hospitals reported an average 9.4% growth in the average revenue per discharge for MA managed care participants.
There was a similar pattern in the average revenue per day for the Medicare and MA pro-grams. Because the average length of stay fell
FIGURE 4
Statewide Net Patient Revenue by Payor, FY04
����
����
����
�����
�����
�����
����
����������
�����������������
���������
��������
������������
������
FY03 FY04Percent Change
FY03 to FY04
Commercial
Indemnity $3,370 $3,555 5.5%
Managed Care $5,652 $6,422 13.6%
Total $9,022 $9,976 10.6%
Medicare
Indemnity $7,160 $7,317 2.2%
Managed Care $1,775 $1,983 11.7%
Total $8,935 $9,299 4.1%
Medical Assistance
Indemnity $821 $881 7.4%
Managed Care $1,345 $1,615 20.1%
Total $2,166 $2,496 15.2%
Other $1,960 $2,084 6.3%
STATEWIDE $22,083 $23,856 8.0%
TABLE 4
Net Patient Revenue by Payor (millions)

10 • PHC4 • 2004 Financial Analysis • Volume One
Utilization and Revenue by Payor
PHC4 • 2004 Financial Analysis • Volume One • 11
Utilization and Revenue by Payor
for Medicare indemnity and managed care and MA indemnity patients, the increases in the average revenue per day were greater than the increases in the average revenue per discharge. There was a small increase (0.02 days) in the average length of stay for MA managed care patients. Accordingly, the growth in the aver-age revenue per day was a little smaller than the average revenue per discharge.
Growth in Medicare Revenue Continues to Lag Behind Other Payors
As a result of the increase in the average reimbursement rates by commercial insurers, Medicare fell from the first to second largest payor for general acute care (GAC) hospitals
during FY04. Medicare provided $9.3 billion or 39% of statewide GAC NPR. The total NPR hospitals received from Medicare grew 4.1% during FY04. This 4.1% increase was 3.9-points below the overall 8.0% increase in NPR from all payors. This was the fifth straight year that the growth in Medicare revenue lagged behind the commercial and MA payor categories.
Like the MA program, the growth in state-wide GAC Medicare revenues was driven by reimbursement increases from managed care programs. Although a little more than one-fifth (21%) of Medicare revenue comes from Medicare managed care participants, hospi-tals reported that 57% of the FY04 growth in
Discharges Inpatient Revenue per Discharge
FY03 FY04
Percent Change
FY03 to FY04 FY03 FY04
Percent Change
FY03 to FY04
Commercial
Indemnity 196,546 189,940 -3.4% $8,732 $9,685 10.9%
Managed Care 393,977 398,609 1.2% $7,504 $8,393 11.9%
Total 590,524 588,549 -0.3% $7,912 $8,810 11.3%
Medicare
Indemnity 663,074 679,467 2.5% $8,459 $8,456 0.0%
Managed Care 172,377 181,056 5.0% $7,579 $8,065 6.4%
Total 835,451 860,522 3.0% $8,277 $8,374 1.2%
Medical Assistance
Indemnity 99,847 107,941 8.1% $6,908 $6,853 -0.8%
Managed Care 152,843 166,791 9.1% $6,247 $6,832 9.4%
Total 252,690 274,732 8.7% $6,508 $6,840 5.1%
Other 98,327 97,043 -1.3% $8,275 $8,917 7.8%
STATEWIDE 1,776,992 1,820,847 2.5% $7,904 $8,312 5.2%
TABLE 5
Discharges by Payor
10 • PHC4 • 2004 Financial Analysis • Volume One
Utilization and Revenue by Payor
PHC4 • 2004 Financial Analysis • Volume One • 11
Utilization and Revenue by Payor
Medicare revenue was provided by the man-aged care plans.
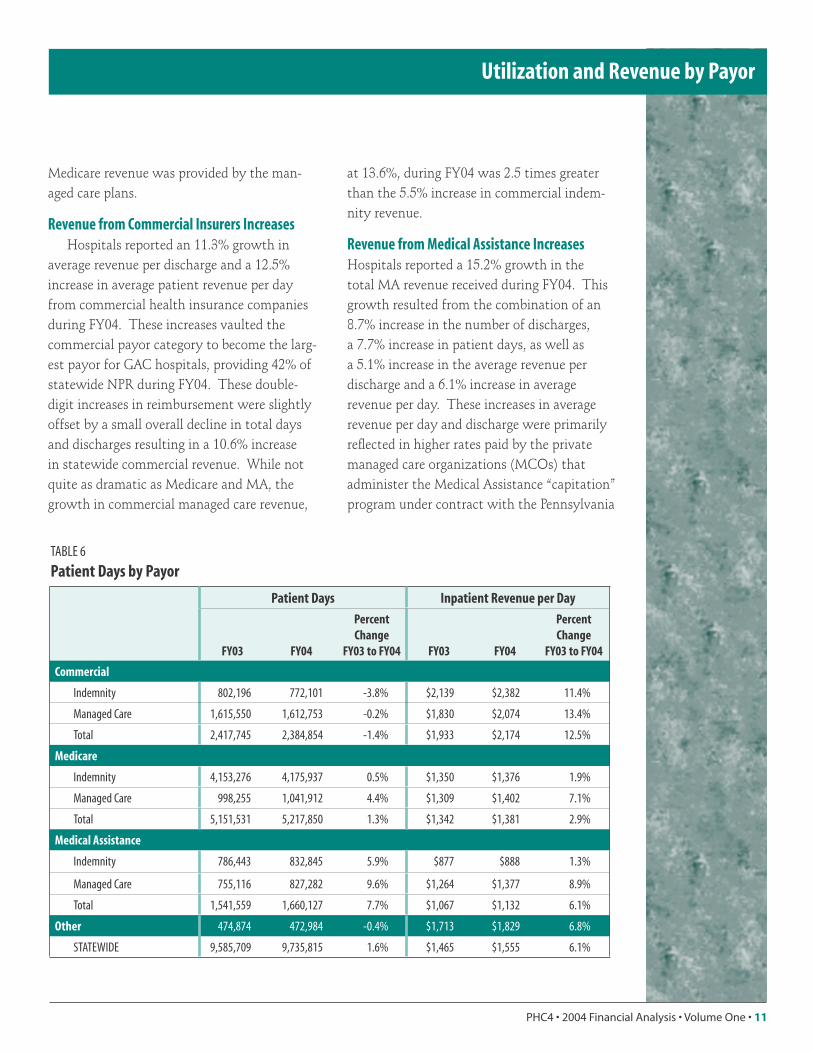
Revenue from Commercial Insurers IncreasesHospitals reported an 11.3% growth in
average revenue per discharge and a 12.5% increase in average patient revenue per day from commercial health insurance companies during FY04. These increases vaulted the commercial payor category to become the larg-est payor for GAC hospitals, providing 42% of statewide NPR during FY04. These double-digit increases in reimbursement were slightly offset by a small overall decline in total days and discharges resulting in a 10.6% increase in statewide commercial revenue. While not quite as dramatic as Medicare and MA, the growth in commercial managed care revenue,
at 13.6%, during FY04 was 2.5 times greater than the 5.5% increase in commercial indem-nity revenue.
Revenue from Medical Assistance IncreasesHospitals reported a 15.2% growth in the total MA revenue received during FY04. This growth resulted from the combination of an 8.7% increase in the number of discharges, a 7.7% increase in patient days, as well as a 5.1% increase in the average revenue per discharge and a 6.1% increase in average revenue per day. These increases in average revenue per day and discharge were primarily reflected in higher rates paid by the private managed care organizations (MCOs) that administer the Medical Assistance “capitation” program under contract with the Pennsylvania
Patient Days Inpatient Revenue per Day
FY03 FY04
Percent Change
FY03 to FY04 FY03 FY04
Percent Change
FY03 to FY04
Commercial
Indemnity 802,196 772,101 -3.8% $2,139 $2,382 11.4%
Managed Care 1,615,550 1,612,753 -0.2% $1,830 $2,074 13.4%
Total 2,417,745 2,384,854 -1.4% $1,933 $2,174 12.5%
Medicare
Indemnity 4,153,276 4,175,937 0.5% $1,350 $1,376 1.9%
Managed Care 998,255 1,041,912 4.4% $1,309 $1,402 7.1%
Total 5,151,531 5,217,850 1.3% $1,342 $1,381 2.9%
Medical Assistance
Indemnity 786,443 832,845 5.9% $877 $888 1.3%
Managed Care 755,116 827,282 9.6% $1,264 $1,377 8.9%
Total 1,541,559 1,660,127 7.7% $1,067 $1,132 6.1%
Other 474,874 472,984 -0.4% $1,713 $1,829 6.8%
STATEWIDE 9,585,709 9,735,815 1.6% $1,465 $1,555 6.1%
TABLE 6
Patient Days by Payor
12 • PHC4 • 2004 Financial Analysis • Volume One
Utilization and Revenue by Payor
PHC4 • 2004 Financial Analysis • Volume One • 13
Utilization and Revenue by Payor
Department of Public Welfare (DPW). Under this program, MCOs receive a flat fee per person to provide the medical care for enrollees.
It is difficult to make com-parisons between the average reimbursement rates per day and per discharge for MA indemnity and managed care components because the over-all mix of care provided by each component is different. For example, long-term skilled nursing care is reimbursed through the MA indemnity category. This long-term care tends to have much longer
lengths of stay, lower reimbursements per day, but higher reimbursements per discharge. Also, MA recipients that need extraordinary levels of acute care are typically reimbursed through the indemnity program.
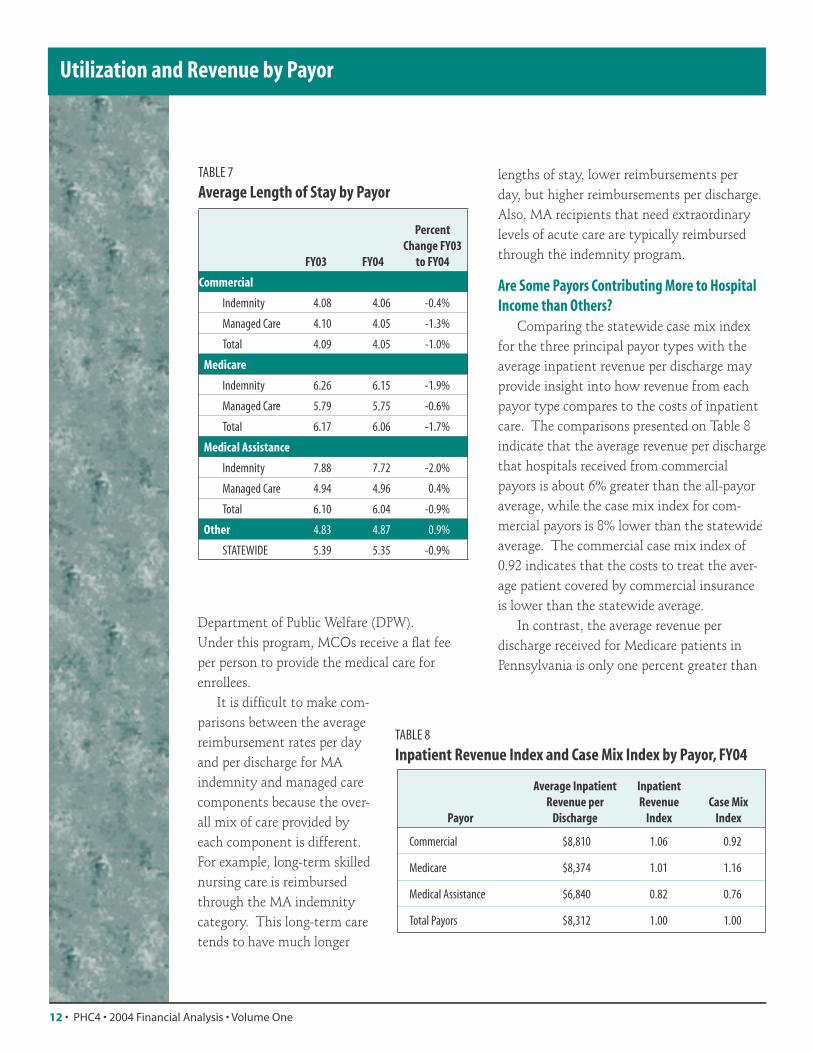
Are Some Payors Contributing More to Hospital Income than Others?
Comparing the statewide case mix index for the three principal payor types with the average inpatient revenue per discharge may provide insight into how revenue from each payor type compares to the costs of inpatient care. The comparisons presented on Table 8 indicate that the average revenue per discharge that hospitals received from commercial payors is about 6% greater than the all-payor average, while the case mix index for com-mercial payors is 8% lower than the statewide average. The commercial case mix index of 0.92 indicates that the costs to treat the aver-age patient covered by commercial insurance is lower than the statewide average.
In contrast, the average revenue per discharge received for Medicare patients in Pennsylvania is only one percent greater than
FY03 FY04
Percent Change FY03
to FY04
Commercial
Indemnity 4.08 4.06 -0.4%
Managed Care 4.10 4.05 -1.3%
Total 4.09 4.05 -1.0%
Medicare
Indemnity 6.26 6.15 -1.9%
Managed Care 5.79 5.75 -0.6%
Total 6.17 6.06 -1.7%
Medical Assistance
Indemnity 7.88 7.72 -2.0%
Managed Care 4.94 4.96 0.4%
Total 6.10 6.04 -0.9%
Other 4.83 4.87 0.9%
STATEWIDE 5.39 5.35 -0.9%
TABLE 7
Average Length of Stay by Payor
Payor
Average Inpatient Revenue per
Discharge
Inpatient Revenue
IndexCase Mix
Index
Commercial $8,810 1.06 0.92
Medicare $8,374 1.01 1.16
Medical Assistance $6,840 0.82 0.76
Total Payors $8,312 1.00 1.00
TABLE 8
Inpatient Revenue Index and Case Mix Index by Payor, FY04
12 • PHC4 • 2004 Financial Analysis • Volume One
Utilization and Revenue by Payor
PHC4 • 2004 Financial Analysis • Volume One • 13
Utilization and Revenue by Payor
the statewide average while the case mix index is 16% greater than statewide average. This relatively large difference suggests that Medicare reimbursements are not covering hospital costs of treating Medicare patients in Pennsylvania.
The inpatient revenue index for Medical Assistance patients of 0.82 is about six points greater than the case mix index of 0.76 which suggests that MA payments are in line with or exceed the costs of providing inpatient care to MA recipients.
The ideal way to determine how a payor or a payor category is contributing to hospital income is to compare the costs to treat pa-tients covered by that payor with the revenue received from that payor. Since comprehen-sive and comparable cost data are not available for all patients, a common alternative tool to compare the resources a hospital utilizes in treating patients is the case mix index.
Instead of costs, the case mix index utilizes charges to assess the monetary value of the treatment patients receive. Hospitals routinely track the charges incurred by each patient, pro-viding a comprehensive database of charges.
In summary, a case mix index is typically used to compare the charges for a particular group of patients or a particular category of care with the average charges for all patients at a hospital. Individual hospital charge and utilization data can be aggregated to create a statewide case mix index. For example, the statewide average case mix index of 0.92 for commercial payors indicates that the average charge for a patient covered by commercial health insurance is about 8% less than the average for all patients at Pennsylvania’s GAC hospitals.
If the costs to provide care compared to the charges established by the hospital (cost-to-charge ratio) were the same for all categories of
����
��������
����
����
����
����
����
��������
����
����
����
��������
����
����
����
����
����
����
��������
��������
��������
��������
��������
��������
��������
����
�����
���
��
FIGURE 5
Statewide Inpatient Discharges

14 • PHC4 • 2004 Financial Analysis • Volume One
Utilization and Revenue by Payor
PHC4 • 2004 Financial Analysis • Volume One • 15
Utilization and Revenue by Payor
care, then the case mix index would be identical to an index derived from actual costs. However, the cost-to-charge ratio varies among the dif-ferent categories of care provided at hospitals. For example, the cost-to-charge ratio may differ between routine maternity care and coronary artery bypass graft surgery. The case mix index is not a perfect substitute for an index of
actual costs. However, when a case mix index is developed using a cross-section of treatment categories, it can provide a reasonably good reflection of differences in overall costs among various patient groups.
The case mix index for commercial and MA patients is typically lower than Medicare patients because commercial insurers and MA
����
�����
�����
�����
�����
�����
����������
�����
�����
����
����
����
����
����
�
��
��
��
��
��������
��������
��������
��������
��������
��������
��������
����
�����
���
��
FIGURE 6
Statewide Inpatient Days
����
����
��������
�������� ���� ����
���� ���� ����
���
���
���
���
���
���� ���� ���� ���� ���� ���� ���� ���� ���� ���� ����
����
��
FIGURE 7
Statewide Average Length of Stay

14 • PHC4 • 2004 Financial Analysis • Volume One
Utilization and Revenue by Payor
PHC4 • 2004 Financial Analysis • Volume One • 15
Utilization and Revenue by Payor
serve a younger clientele that, on average, require less costly treatment. MA also funds the majority of psychiatric care in Pennsylva-nia. Inpatient psychiatric care at GAC hos-pitals tends to be less costly than most other inpatient care.
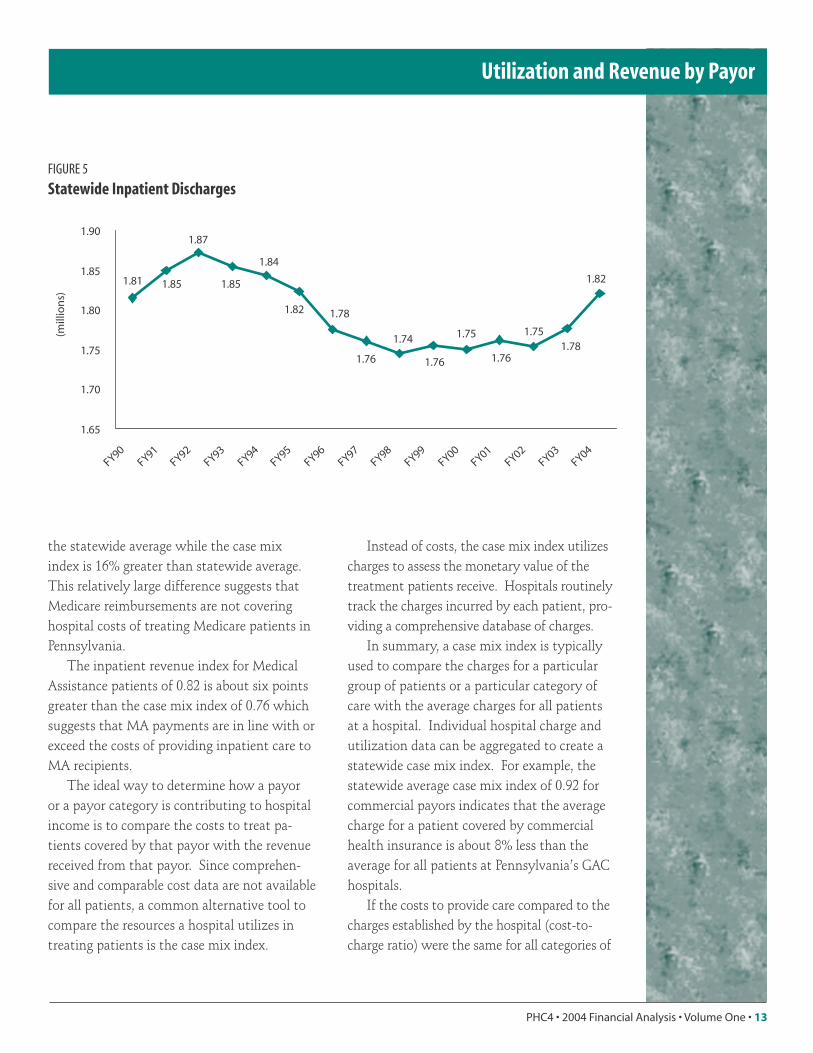
Growth in Inpatient Care Continues Inpatient discharges grew for the second
straight year, increasing 2.5% to 1.82 million discharges during FY04. As shown in Figure 5, discharges had been hovering in the 1.74 to 1.76 million discharge range between FY97 and FY02.
The average length of an inpatient stay (ALOS) has declined every year since at least FY94 with the rate of decline waning in recent years. Figure 7 reveals that this trend contin-ued in FY04 as the ALOS fell by another 0.04 of a day to 5.35 days.
With the decline in the ALOS, the growth in patient days lagged behind the growth in discharges. Patient days grew 1.6% to 9.74 mil-
How Much Influence Do Hospitals Have over Reimbursement Rates from Commercial Insurers?
The reimbursement hospitals receive from most insurers and managed care organizations are derived through a contract negotiation process between the hospital and the third-party payor.
Figure 8 shows that, on average, hospitals received 19.2% of their total annual NPR from their largest single commercial payor. For this analysis, the revenue from the commercial payors includes all health insurance plans of-fered by that insurer, including Medicare and MA managed care plans.
A hospital may have leverage in negotiat-ing reimbursement rates by exercising its option not to enter contractual arrangements with a specific payor. However, considering that the average operating margin during FY04 was a little over 2.0%, hospitals with small positive operating margins might face operat-ing losses, at least in the short-run, if even a
�����
����
����
����
����
�� �� ��� ��� ��� ���
���
���
���
���
���
�������������������������
FIGURE 8
Statewide Average Contribution to Net Patient Revenue *
* Includes Medicare and Medical Assistance funded managed care plans administered by commercial health insurers.
lion patient days in FY04.Preliminary analysis of
outpatient data indicates that the outpatient visits at GAC hospitals grew by 2.8% from 33.1 million visits in FY03 to 34.1 million visits in FY04.

16 • PHC4 • 2004 Financial Analysis • Volume One
Utilization and Revenue by Payor
PHC4 • 2004 Financial Analysis • Volume One • 17
Uncompensated Care
contract with the fifth-highest commercial payor was rejected.
Figure 8 also reveals that small changes in reimbursement rates from third-party pay-ors can have a significant impact on hospital income. For example, if payment rates from the largest third-party payor do not keep pace with increasing hospital costs, hospitals with a small positive margin one year could suddenly have a negative margin the following year.
The Average Days in Accounts Receivable Continues to Fall
During the period between when hospital services to a patient are concluded and when a hospital receives the payment for those services, the amount the hospital expects to receive is booked as accounts receivable (AR). AR can be affected by a number of factors including: the efficiency of hospital billing and claims systems, the time it takes third-party payors and individuals to pay bills, communi-cations between hospitals and payors, and the time it takes hospitals to remove uncollectible accounts from accounts receivable.
On a statewide basis, the amount of time the average bill remained in AR declined
another 4.1 days to 50.5 days during FY04. Figure 9 shows that statewide average days in patient accounts receivable declined for the fifth straight year for a total of more than 18 days since the peak of 69.0 days in FY99.
Over the past three years, a number of hos-pitals reported implementing a variety of mea-sures to reduce the level of their patient AR as a means to improve financial performance. For example, many hospitals have reduced AR by implementing measures that reduce the likelihood that claims will be rejected by an insurer.
In addition to hospital programs reducing AR, the decline in statewide days in AR is also the result of the implementation of Act 68 of 1998. Act 68, inter alia, requires licensed health insurers and managed care organiza-tions to pay clean claims within 45 days of the receipt of the claim. These provisions of Act 68 are implemented and enforced by the Pennsylvania Insurance Department.
Assuming that the opportunity costs of financing AR are 5%, the benefit of the 4.1-day reduction in statewide AR was equal to about $13.3 million, or 2.5% of FY04 statewide oper-ating income.
�������� ����
���� ����
����
��������
����
��
��
��
��
��
���� ���� ���� ���� ���� ���� ���� ���� ����
����
��
FIGURE 9
Statewide Average Days in Accounts Receivable

16 • PHC4 • 2004 Financial Analysis • Volume One
Utilization and Revenue by Payor
PHC4 • 2004 Financial Analysis • Volume One • 17
Uncompensated Care
Uncompensated Care
Uncompensated Care Rates StableThe dollar value of uncompensated care
grew by 7.2% or $35 million from $479 million during FY03 to $514 million during FY04. However, since statewide net patient revenue grew a little faster (8.0%), uncompensated care comprised a slightly smaller portion of total patient care during FY04. Statewide uncom-pensated care revenue was equal to 2.15% of total net patient revenue in FY04; down from 2.17% in FY03.
Sixty-six percent (66%) of uncompensated care was categorized as bad debt during FY04. This indicates that Pennsylvania hospitals as a group attempted to collect for about two-thirds of the care that was ultimately deter-
mined to be uncompensated care. Alterna-tively, about 34% of unreimbursed care was provided as charity care to patients that met the individual hospitals’ charity care guide-lines.
How Uncompensated Care is CalculatedThe “Percent of Uncompensated Care”
reflects the portion of all care that was written off as either bad debt or recorded as charity care. This percentage is calculated as the ratio of statewide bad debt and charity care report-ed as charges to the total charges for all care provided by GAC hospitals.
“Uncompensated Care Revenue” provides an estimate of the amount of revenue hos-pitals lost due to bad debt and charity care. This foregone revenue reflects what hospitals would have received if they had been reim-
����� ����� ����� �����
��
��
��
��
��
���� ���� ���� ����
���������������������������
����� ���������� �����
���������������������������������������������������
FIGURE 10Statewide Uncompensated Care Revenue *
In order to meet the requirements under Act 77 of 2001 (Tobacco Settlement Act) PHC4 modified the way in which uncompensated care is captured and reported. Beginning in FY03 hospitals submit bad debt and charity care at full charges. Uncompensated care revenue is calculated using each hospital’s unique revenue-to-charge ratio. The FY01 and FY02 statewide uncompensated care revenue levels are estimates developed by converting actual FY01 and FY02 data to the new methodology. In converting the data, it was assumed that hospitals did not change their accounting procedures for bad debt between FY01 and FY03.

18 • PHC4 • 2004 Financial Analysis • Volume One
Uncompensated Care
PHC4 • 2004 Financial Analysis • Volume One • 19
Hospitals with a Negative 3-Year Average Total Margin
bursed for uncompensated care. The estimate of foregone revenue is based on the average overall reimbursement hospitals received from all payors including commercial health insurers, Medicare, Medical Assistance, and patients.
All services and materials that are provided to the general public under an established fee are eligible to be included in uncompensated care. Consequently, some of the costs of important public health programs may not be included. Hospitals frequently report these activities separately.
A few hospitals include the difference between the reimbursement they receive from government-funded programs, such as Medi-cal Assistance, and their customary fees or charges as a component of charity care in their audited financial statements. These differences are NOT included in the uncompensated care levels reported to PHC4. However, if a patient fails to pay a required co-payment, or receives care beyond the range of services covered by a third-party payor, these foregone revenues may be included in charity care or bad debt.

18 • PHC4 • 2004 Financial Analysis • Volume One
Uncompensated Care
PHC4 • 2004 Financial Analysis • Volume One • 19
Hospitals with a Negative 3-Year Average Total Margin
Hospitals with a Negative 3-Year Average Total Margin
The total margin for a single year may not completely reflect the financial health of a hospital. There are numerous factors that can affect a single-year margin, including a sharp decline in the value and earnings of securities, a reassessment of the book value of assets, early retirement of obsolete facilities and equipment, and the restructuring of the opera-tions of the hospital. Therefore, the 3-year average total margin may be a better indicator of a hospital’s performance.
For some hospitals, a negative 3-year aver-age total margin may only indicate a cyclical downturn or the need to make adjustments in hospital operations and the sources of revenues. As shown in Table 9, 120 hospitals have realized a negative 3-year average total margin at some point since FY98. Nearly half, 59 of the 120 hospitals posted a positive total margin in FY04; and for 47 of those 59 hospi-tals the total margin was above 2%.
Alternatively, 55 of the 120 hospitals re-flected on Table 9 were still in operation with a negative total margin at the end of FY04.
Some hospitals join with other health systems as a means to preserve or enhance the operation of their facilities. Forty-six (46) of the 120 hospitals were either acquired by a for-profit hospital, merged under the license of another non-profit health system, or entered into an affiliation agreement while still operat-ing as a separately licensed hospital. More than half (25) of the 46 hospitals had positive total margins in FY04.
Five hospitals that had been affiliated with another hospital or health system terminated
their affiliation and returned to operating as an independent hospital or affiliated with another system. Three of these five hospitals had a positive total margin in FY04.
Table 12 highlights the nine hospitals that have made recent recoveries. These nine hospi-tals experienced a negative 3-year average total margin at the end of FY03 and their net income was large enough during FY04 to give them a positive 3-year average total margin for the three years ending in FY04.
Hospitals that have undertaken aggres-sive turnaround programs may experience a further decline in the annual total margin as they implement initiatives to reduce costs and improve revenue. For example, hospitals may take one-time restructuring charges related to severance and early-retirement programs. Hospitals that develop new or enhanced clini-cal operations will incur operating losses until new revenues catch up to the incremental expenses.
Some hospitals have available assets that enable them to operate for a period of time while sustaining annual losses. Available assets are those that can be liquidated by the hospital or its board of directors to fund operating deficits. Some of the hospitals with a negative 3-year average total margin have diverted funds earmarked for capital replace-ment or improvement to pay expenses not covered by revenue.
Some hospitals with persistent small negative margins may be able to function for an extended period of time because they are generating positive cash flow. For example, if a hospital’s annual operating loss is less than its annual depreciation expense, its net assets may actually increase even though it operated at a loss. However, hospitals in this situa-

20 • PHC4 • 2004 Financial Analysis • Volume One
Hospitals with a Negative 3-Year Average Total Margin
PHC4 • 2004 Financial Analysis • Volume One • 21
Hospitals with a Negative 3-Year Average Total Margin
Number of Facilities
Hospitals Closed
FY04 Total Margin 1
Negative 0% - 2% Above 2%
Acquired by for-profit corporation following bankruptcy 7 2 5 0 1
Acquired by for-profit corporation (no bankruptcy) 10 0 3 0 7
Merged with another non-profit facility or health system 1 11 0 4 2 5
Affiliated with another non-profit facility or health system 18 1 7 0 10
No longer an operating licensed hospital 4 4 0 0 0
No change 65 0 34 9 22
Ended affiliation 5 0 2 1 2
Total 120 7 55 12 47
1 The FY04 total margin for hospitals that merged with another hospital or health system reflects the total margin for the surviving hospital unless the merger occurred during FY04.
tion are also using a portion of the funds that should be dedicated to replacing obsolete or worn out facilities and equipment to pay their operating expenses.
Hospitals cannot utilize available assets or divert depreciation funds to pay operating ex-penses indefinitely. Eventually, the hospital’s inability to replace or upgrade facilities and equipment will have an effect on their ability to provide quality healthcare.
A few hospitals may be able to function with persistent losses because they are part of a larger health system that can underwrite the hospital’s operating loss. A hospital with a negative margin may be an important source of patients to a health system; losses incurred
by one facility may be at least partially offset by the overall economic benefit to the entire system.
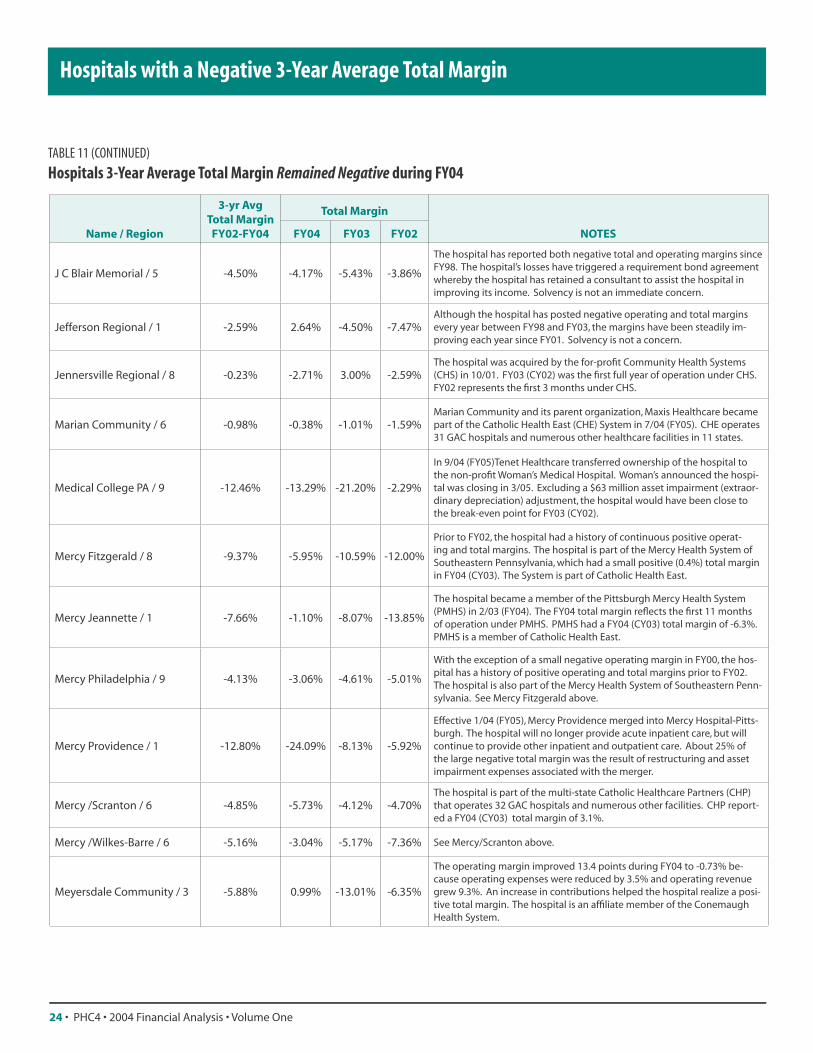
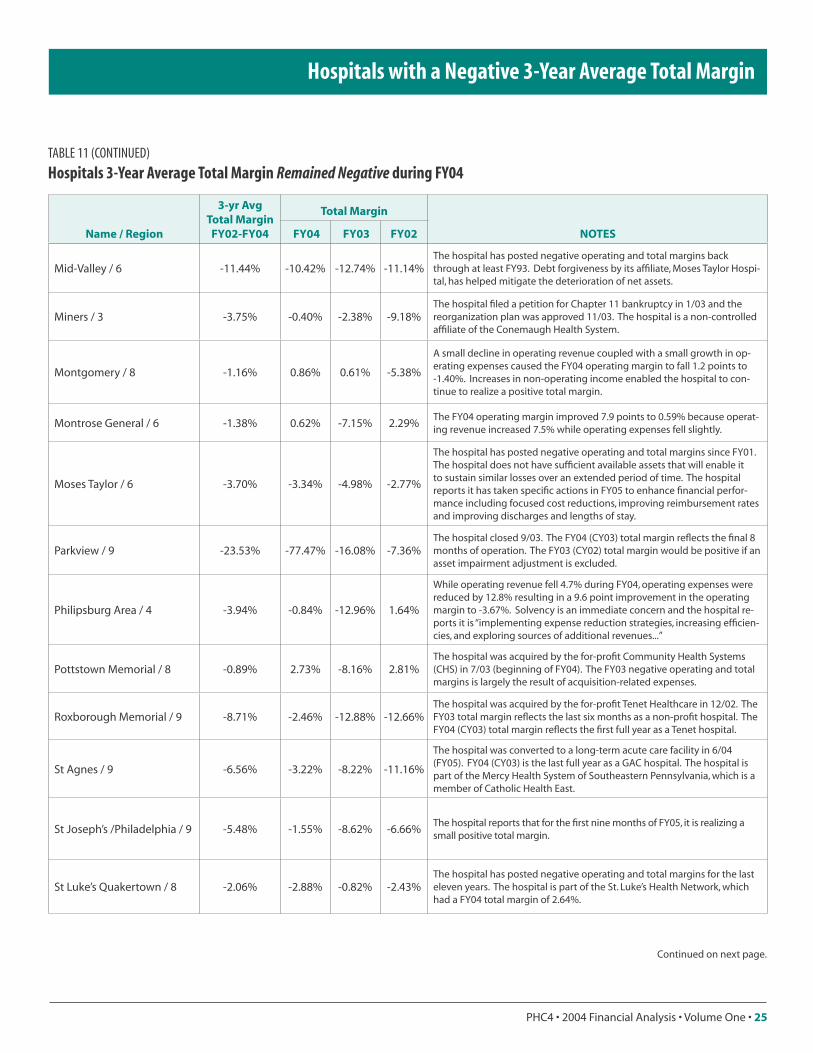
Tables 10 and 11 present the 66 hospitals where the 3-year average total margin either became negative during FY04 or remained negative. The “Notes” presented in those tables provide some information on why the hospital’s income levels have changed and, where possible, some insights on the future solvency of the hospital. The information for these “Notes” was derived from each facility’s audited financial statements, discussions with hospital financial officers, and public informa-tion made available by the hospitals and their parent organizations.
TABLE 9
Status of Hospitals with a Negative 3-Year Average Total Margin at Some Point during FY98-FY04

20 • PHC4 • 2004 Financial Analysis • Volume One
Hospitals with a Negative 3-Year Average Total Margin
PHC4 • 2004 Financial Analysis • Volume One • 21
Hospitals with a Negative 3-Year Average Total Margin
Name / Region
3-yr Avg Total Margin
FY02-FY04
Total Margin
NOTES FY04 FY03 FY02
Graduate / 9 -8.73% -38.66% 2.23% 4.94%
The hospital’s operating income fell $81.0 million from $5.4 million in FY03 (CY02) to a $75.1 million loss in FY04 (CY03). Contributing to the large CY03 loss was a $27.7 million decline in operating revenue, a $44.4 million extraordinary expense for “merger, impairment and other unusual charges” and a $9.4 million increase in the accrual for bad debts.
Greene County Memorial / 1 -4.37% -7.41% -2.45% -3.28%
While operating revenue remained relatively constant, operating ex-penses grew by 3.6% during FY04 causing the operating margin to fall 4.2 points to -7.33%. The hospital does not have sufficient available assets that will enable it to continue to sustain similar losses for an ex-tended period of time.
Kane Community / 2 -1.13% -12.59% 6.83% 2.71%
The last time the hospital posted an annual loss was FY95. The principal factor in the 17.8 point decline in the operating margin to -13.17% dur-ing FY04 was a $1.6 million increase in the cost of “other professional services.”
Monsour / 1 -20.40% -15.31% -17.19% -29.83%The hospital filed for Chapter 11 bankruptcy in October 2004 after emerging from bankruptcy in 2003. This is the fourth Chapter 11 filing since 1987.
Palmerton / 7 -3.92% -11.11% -5.15% 4.46%Effective July 2004, the hospital affiliated with Gnaden Huetten Memo-rial Hospital to form Blue Mountain Health System.
UPMC Braddock / 1 -3.41% -10.98% 0.01% 1.38%
The last time the hospital posted an annual loss was FY97. The 11 point decline in the operating margin during FY04 was primarily the result of a 13.0% growth in operating expenses that exceeded the 1.8% growth in operating revenue.
UPMC Lee Regional / 3 -2.71% -9.01% -3.55% 4.20%
The FY04 operating margin fell 9.5 points to -11.11% because operating expenses grew 11.3% while operating revenue grew 2.0%. “Medical fees” and “enterprise-shared services” led the increase in FY04 operating expenses. A $3.2 million improvement in non-operating gains during FY04 to $1.6 million prevented the total margin from falling as far as the operating margin.
UPMC McKeesport / 1 -1.26% -4.15% -0.52% 1.24%
The 12.9% increase in operating expenses during FY04 outpaced the 3.8% growth in operating revenue causing the operating margin to fall 8.6 points to -6.36%. Increases in “professional fees,” “employee benefits” and “enterprise services” led the increase in FY04 operating expenses. A $4.3 million improvement in non-operating income to $1.9 million prevented a corresponding decline in the total margin during FY04.
Washington / 1 -0.02% 2.28% -3.83% 1.31%
The FY04 operating margin improved 4.7 points to -0.68% because the 6.4% increase in operating revenue outpaced the 1.6% growth in oper-ating expenses. A $2.8 million increase in “non-operating gains” pushed the total margin to 2.28%.
TABLE 10
Hospitals 3-Year Average Total Margin Became Negative during FY04

22 • PHC4 • 2004 Financial Analysis • Volume One
Hospitals with a Negative 3-Year Average Total Margin
PHC4 • 2004 Financial Analysis • Volume One • 23
Hospitals with a Negative 3-Year Average Total Margin
Name / Region
3-yr Avg Total Margin
FY02-FY04
Total Margin
NOTES FY04 FY03 FY02
Albert Einstein / 9 -0.30% 2.73% -4.36% 0.18%
Prior to FY03, the hospital had a long history of positive total margins. The negative total margin in FY03 was driven by extraordinary non-operat-ing adjustments for restructuring costs, professional liability and worker’s compensation.
Aliquippa Community / 1 -14.88% -8.15% -23.47% -13.49%
The hospital emerged from Chapter 11 bankruptcy in 4/05. During FY04, the hospital increased operating revenue by 4.2% and reduced operating expenses by 8.7% resulting in a 15.3 point improvement in its operating margin. Excluding $2.0 million in extraordinary expenses for “reorganiza-tional items,” the hospital would be near break even for FY04.
Altoona / 3 -0.63% 2.55% 0.43% -5.97%While the operating margin fell by about one-half point from -0.55% in FY03 to -1.07% in FY04, the total margin improved 2.1 points due to non-operating investment gains.
Armstrong County Memorial / 1
-1.04% 0.72% -3.04% -0.91%After three years of operating losses between FY01 and FY03, the hospital realized a positive operating margin of 0.19% in FY04 by holding the in-crease in expenses to 3.3% while operating revenues increased 7.1%.
Ashland Regional / 7 -13.07% -13.24% -18.25% -0.45%
Acquired by the for-profit Province Healthcare in 8/01 following a 3/01 petition for Chapter 11 bankruptcy. FY02 reflects the first five months of operation by Province. Province operates 20 GAC hospitals in 12 states and had a CY03 after-tax margin of 4.1%.
Barnes Kasson County / 6 -4.20% -4.51% -6.06% -2.04%
Although the hospital posted losses for the third straight year, the cash flow deficit was relatively small and there was little deterioration of the hospital’s limited available assets during FY04 (FYE 9/03). The hospital can-not continue to sustain similar losses for an extended period of time.
Bloomsburg / 4 -6.87% -5.20% -8.51% -6.87%
The hospital has posted negative total margins since FY99. The financial performance of the hospital’s parent organization, Bloomsburg Health Sys-tem, and affiliates has triggered a provision in a loan agreement whereby the System has engaged a consultant to make recommendations on improving income. The hospital does not appear to have sufficient avail-able assets that will enable it to continue to sustain similar losses for an extended period of time.
Bradford Regional / 2 -2.35% -0.92% -2.45% -3.84%
The hospital has experienced operating losses every year since FY97 and only three positive total margins in the past eight years when investment income and contributions have been greater than the operating loss. Sol-vency does not appear to be an immediate concern.
Brookville / 2 -1.48% -3.79% -1.56% 1.03%
The hospital has only posted a positive operating margin one year since FY95. The hospital does not appear to have sufficient available assets that will enable it to continue to sustain similar losses for an extended period of time.
Brownsville General / 1 -5.50% -6.90% -3.76% -6.04%In 3/05 (FY05) the hospital was sold to a for-profit corporation formed by local investors.
Bucktail / 4 -1.54% 0.17% -8.50% 3.80%
Operating revenue increased 15.3% while the growth in operating ex-penses were held to 2.9% during FY04. As a result, the operating margin improved 12.4 points to -3.41%. Non-operating revenues enabled the hospital to post a small positive total margin for FY04.
Central Montgomery / 8 -2.12% -3.93% 0.19% -2.98%The hospital was acquired by the for-profit Universal Health Services (UHS) in 1/02. FY02 reflects the last 6 months as a non-profit hospital. FY03 (CY02) reflects the first full year of operation by UHS.
TABLE 11
Hospitals 3-Year Average Total Margin Remained Negative during FY04

22 • PHC4 • 2004 Financial Analysis • Volume One
Hospitals with a Negative 3-Year Average Total Margin
PHC4 • 2004 Financial Analysis • Volume One • 23
Hospitals with a Negative 3-Year Average Total Margin
Charles Cole Memorial / 2 -4.64% 0.58% -4.86% -10.34%The combination of a 0.6% increase in operating revenue and a 3.2% re-duction in operating expenses resulted in a 4 point improvement in the operating margin to -1.79%.
Chester County / 8 -0.57% 2.71% -0.75% -4.35%The 9.5% growth in operating revenue outpaced the 5.8% increase in expenses causing the total and operating margins to improve 3.5 points to 2.71%.
Chestnut Hill / 9 -9.90% -22.44% -3.35% -2.98%In March 2005 (FY05), the hospital was purchased by the for-profit Com-munity Health Systems (CHS). The University of Pennsylvania Health Sys-tem has a 15% minority interest in the hospital.
Community/Scranton / 6 -2.55% -2.72% -2.38% -2.54%After five years of positive operating and total margins between FY96 and FY00, the hospital has experienced negative operating and total margins since FY01. Solvency does not appear to be a concern.
Doylestown / 8 -1.63% 4.50% 1.74% -13.28%With the exception of FY01 and FY02, the hospital has a history of positive operating and total margins. An investment impairment adjustment and investment losses contributed to the large FY02 negative total margin.
Elkins Park / 8 -24.56% -7.85% -51.98% -12.47%
The hospital was sold to the Albert Einstein Healthcare Network in 11/03. The large negative FY03 (CY02) total margin was driven primarily by an as-set impairment (extraordinary depreciation) adjustment taken its final full year as a Tenet hospital. The FY04 total margin reflects the last ten months as a Tenet hospital.
Ellwood City / 2 -5.18% 3.01% -15.17% -5.06%
The 18.2 point improvement in the total margin was primarily the result of a large swing in investment income from a $1.7 million loss in FY03 to a $1.8 million gain in FY04. In addition, operating revenue grew by 5.3% while the growth in operating expenses was held to 1.2%. As a result, the operating margin improved 4.2 points to - 3.72%.
Frick / 1 -5.42% -4.29% -9.16% -2.90%The hospital has posted negative operating and total margins since FY99. The hospital is part of the Westmoreland Health System, which posted a 1.1% total margin in FY04.
Hazleton General / 6 -3.24% -6.11% -4.30% 0.99%
Hazleton General and Hazleton St. Joseph are members of the Hazleton Healthcare Alliance. Except for modest positive total margins in FY02, the hospitals have experienced negative total margins since FY99. It does not appear that the hospitals have sufficient available assets to sustain similar losses over an extended period of time.
Hazleton St Joseph / 6 -3.55% -7.52% -4.55% 1.04% See Hazleton General above.
Highlands / 1 -4.13% -9.48% -6.14% 3.10%
The hospital cannot continue to sustain losses at the FY04 level. However, the hospital reports that it has a positive cash flow and expects to realize significantly better operating and total margins for FY05. FY05 revenue is tracking higher as a result of growth in patient volumes and increases in commercial reimbursement rates. The hospital also reports decreases in pension and employee healthcare expenses during FY05.
Indiana Regional / 3 -0.93% 3.76% -7.14% -0.43%The operating margin improved nearly a point to -1.33% during FY04. A $7.3 million improvement in investment earnings was the primary factor in the 10.9 point swing in the total margin.
TABLE 11 (CONTINUED)
Hospitals 3-Year Average Total Margin Remained Negative during FY04
Continued on next page.
Name / Region
3-yr Avg Total Margin
FY02-FY04
Total Margin
NOTES FY04 FY03 FY02
24 • PHC4 • 2004 Financial Analysis • Volume One
Hospitals with a Negative 3-Year Average Total Margin
PHC4 • 2004 Financial Analysis • Volume One • 25
Hospitals with a Negative 3-Year Average Total Margin
J C Blair Memorial / 5 -4.50% -4.17% -5.43% -3.86%
The hospital has reported both negative total and operating margins since FY98. The hospital’s losses have triggered a requirement bond agreement whereby the hospital has retained a consultant to assist the hospital in improving its income. Solvency is not an immediate concern.
Jefferson Regional / 1 -2.59% 2.64% -4.50% -7.47%Although the hospital has posted negative operating and total margins every year between FY98 and FY03, the margins have been steadily im-proving each year since FY01. Solvency is not a concern.
Jennersville Regional / 8 -0.23% -2.71% 3.00% -2.59%The hospital was acquired by the for-profit Community Health Systems (CHS) in 10/01. FY03 (CY02) was the first full year of operation under CHS. FY02 represents the first 3 months under CHS.
Marian Community / 6 -0.98% -0.38% -1.01% -1.59%Marian Community and its parent organization, Maxis Healthcare became part of the Catholic Health East (CHE) System in 7/04 (FY05). CHE operates 31 GAC hospitals and numerous other healthcare facilities in 11 states.
Medical College PA / 9 -12.46% -13.29% -21.20% -2.29%
In 9/04 (FY05)Tenet Healthcare transferred ownership of the hospital to the non-profit Woman’s Medical Hospital. Woman’s announced the hospi-tal was closing in 3/05. Excluding a $63 million asset impairment (extraor-dinary depreciation) adjustment, the hospital would have been close to the break-even point for FY03 (CY02).
Mercy Fitzgerald / 8 -9.37% -5.95% -10.59% -12.00%
Prior to FY02, the hospital had a history of continuous positive operat-ing and total margins. The hospital is part of the Mercy Health System of Southeastern Pennsylvania, which had a small positive (0.4%) total margin in FY04 (CY03). The System is part of Catholic Health East.
Mercy Jeannette / 1 -7.66% -1.10% -8.07% -13.85%
The hospital became a member of the Pittsburgh Mercy Health System (PMHS) in 2/03 (FY04). The FY04 total margin reflects the first 11 months of operation under PMHS. PMHS had a FY04 (CY03) total margin of -6.3%. PMHS is a member of Catholic Health East.
Mercy Philadelphia / 9 -4.13% -3.06% -4.61% -5.01%
With the exception of a small negative operating margin in FY00, the hos-pital has a history of positive operating and total margins prior to FY02. The hospital is also part of the Mercy Health System of Southeastern Penn-sylvania. See Mercy Fitzgerald above.
Mercy Providence / 1 -12.80% -24.09% -8.13% -5.92%
Effective 1/04 (FY05), Mercy Providence merged into Mercy Hospital-Pitts-burgh. The hospital will no longer provide acute inpatient care, but will continue to provide other inpatient and outpatient care. About 25% of the large negative total margin was the result of restructuring and asset impairment expenses associated with the merger.
Mercy /Scranton / 6 -4.85% -5.73% -4.12% -4.70%The hospital is part of the multi-state Catholic Healthcare Partners (CHP) that operates 32 GAC hospitals and numerous other facilities. CHP report-ed a FY04 (CY03) total margin of 3.1%.
Mercy /Wilkes-Barre / 6 -5.16% -3.04% -5.17% -7.36% See Mercy/Scranton above.
Meyersdale Community / 3 -5.88% 0.99% -13.01% -6.35%
The operating margin improved 13.4 points during FY04 to -0.73% be-cause operating expenses were reduced by 3.5% and operating revenue grew 9.3%. An increase in contributions helped the hospital realize a posi-tive total margin. The hospital is an affiliate member of the Conemaugh Health System.
TABLE 11 (CONTINUED)
Hospitals 3-Year Average Total Margin Remained Negative during FY04
Name / Region
3-yr Avg Total Margin
FY02-FY04
Total Margin
NOTES FY04 FY03 FY02
24 • PHC4 • 2004 Financial Analysis • Volume One
Hospitals with a Negative 3-Year Average Total Margin
PHC4 • 2004 Financial Analysis • Volume One • 25
Hospitals with a Negative 3-Year Average Total Margin
Mid-Valley / 6 -11.44% -10.42% -12.74% -11.14%The hospital has posted negative operating and total margins back through at least FY93. Debt forgiveness by its affiliate, Moses Taylor Hospi-tal, has helped mitigate the deterioration of net assets.
Miners / 3 -3.75% -0.40% -2.38% -9.18%The hospital filed a petition for Chapter 11 bankruptcy in 1/03 and the reorganization plan was approved 11/03. The hospital is a non-controlled affiliate of the Conemaugh Health System.
Montgomery / 8 -1.16% 0.86% 0.61% -5.38%
A small decline in operating revenue coupled with a small growth in op-erating expenses caused the FY04 operating margin to fall 1.2 points to -1.40%. Increases in non-operating income enabled the hospital to con-tinue to realize a positive total margin.
Montrose General / 6 -1.38% 0.62% -7.15% 2.29%The FY04 operating margin improved 7.9 points to 0.59% because operat-ing revenue increased 7.5% while operating expenses fell slightly.
Moses Taylor / 6 -3.70% -3.34% -4.98% -2.77%
The hospital has posted negative operating and total margins since FY01. The hospital does not have sufficient available assets that will enable it to sustain similar losses over an extended period of time. The hospital reports it has taken specific actions in FY05 to enhance financial perfor-mance including focused cost reductions, improving reimbursement rates and improving discharges and lengths of stay.
Parkview / 9 -23.53% -77.47% -16.08% -7.36%The hospital closed 9/03. The FY04 (CY03) total margin reflects the final 8 months of operation. The FY03 (CY02) total margin would be positive if an asset impairment adjustment is excluded.
Philipsburg Area / 4 -3.94% -0.84% -12.96% 1.64%
While operating revenue fell 4.7% during FY04, operating expenses were reduced by 12.8% resulting in a 9.6 point improvement in the operating margin to -3.67%. Solvency is an immediate concern and the hospital re-ports it is “implementing expense reduction strategies, increasing efficien-cies, and exploring sources of additional revenues...”
Pottstown Memorial / 8 -0.89% 2.73% -8.16% 2.81%The hospital was acquired by the for-profit Community Health Systems (CHS) in 7/03 (beginning of FY04). The FY03 negative operating and total margins is largely the result of acquisition-related expenses.
Roxborough Memorial / 9 -8.71% -2.46% -12.88% -12.66%The hospital was acquired by the for-profit Tenet Healthcare in 12/02. The FY03 total margin reflects the last six months as a non-profit hospital. The FY04 (CY03) total margin reflects the first full year as a Tenet hospital.
St Agnes / 9 -6.56% -3.22% -8.22% -11.16%
The hospital was converted to a long-term acute care facility in 6/04 (FY05). FY04 (CY03) is the last full year as a GAC hospital. The hospital is part of the Mercy Health System of Southeastern Pennsylvania, which is a member of Catholic Health East.
St Joseph’s /Philadelphia / 9 -5.48% -1.55% -8.62% -6.66%The hospital reports that for the first nine months of FY05, it is realizing a small positive total margin.
St Luke’s Quakertown / 8 -2.06% -2.88% -0.82% -2.43%The hospital has posted negative operating and total margins for the last eleven years. The hospital is part of the St. Luke’s Health Network, which had a FY04 total margin of 2.64%.
TABLE 11 (CONTINUED)
Hospitals 3-Year Average Total Margin Remained Negative during FY04
Name / Region
3-yr Avg Total Margin
FY02-FY04
Total Margin
NOTES FY04 FY03 FY02
Continued on next page.

26 • PHC4 • 2004 Financial Analysis • Volume One
Hospitals with a Negative 3-Year Average Total Margin
PHC4 • 2004 Financial Analysis • Volume One • 27
Hospitals with a Negative 3-Year Average Total Margin
Suburban General/Pgh / 1 -3.07% -0.58% -4.66% -4.09%The hospital merged under Allegheny General Hospital during FY05. Both hospitals are part of the West Penn Allegheny Health System. Allegheny General had an operating and total margin of 3.17% in FY04.
Sunbury Community / 4 -5.07% -0.37% -4.76% -10.93%The FY04 operating margin improved 3.8 points during FY04 to -2.68% because operating revenue increased 10.4% while operating expenses grew 6.4%.
Temple Univ Children’s / 9 -30.61% -9.86% -11.04% -90.75%
The hospital has posted losses since its inception in FY98. The hospital is sustained through transfers from the Temple University Health System Foundation and other affiliates of the Temple University Health System. The hospital is projected to incur losses in FY05 and the System has pledged continued support through FY05.
Titusville Area / 2 -2.25% -1.60% -3.78% -1.44%The reduction in the operating loss and growth in non-operating income contributed almost equally to the 2.2 point improvement in the FY04 total margin.
Tyrone / 3 -18.21% -9.51% -25.60% -21.80%While the FY04 total margin improved 16.1 points to -9.51%, the hospital does not have available assets that will enable it to continue to sustain similar losses.
Univ PA /Presbyterian / 9 -4.29% -0.42% -5.33% -7.96%
The 11.8% increase in operating revenue outpaced the 7.3% increase in operating expenses causing the FY04 operating margin to improve 4.2 points to -1.10%. The University of Pennsylvania Health System had a 3.14% total margin in FY04.
Warminster / 8 -3.60% -6.21% -3.28% -1.07%
Operating margin fell 4.7 points during FY04 to -10.03% because operat-ing expenses rose 5.0% while operating revenue remained close to the FY03 levels. The difference between the operating margin and the -6.21% total margin is the tax benefit posted by Tenet Healthcare because the hospital posted a loss.
Wills Eye / 9 -20.06% 23.93% -50.08% -62.83%
The hospital went through a major transition; it sold its former facilities during FY01 and began operations in a new facility during FY03. The hospital’s operating margin improved by 20 points to -19.01% during FY04. Investment gains and contributions are responsible for the 43-point spread between operating and total margins.
WVHCS / 6 -3.44% -0.63% -4.97% -4.95%
The hospital has reported negative operating and total margins since FY99. The 7.5% increase in operating revenue outpaced the 4.1% increase in operating expenses. As a result, the FY04 operating margin improved 3.3 points to -2.69%. Solvency is not an issue.
TABLE 11 (CONTINUED)
Hospitals 3-Year Average Total Margin Remained Negative during FY04
Name / Region
3-yr Avg Total Margin
FY02-FY04
Total Margin
NOTES FY04 FY03 FY02

26 • PHC4 • 2004 Financial Analysis • Volume One
Hospitals with a Negative 3-Year Average Total Margin
PHC4 • 2004 Financial Analysis • Volume One • 27
Hospitals with a Negative 3-Year Average Total Margin
TABLE 12
Hospitals 3-Year Average Total Margin Was Negative during FY03 and Became Positive in FY04
Name / Region
3-yr Avg Total Margin
FY02-FY04
Total Margin
NOTES FY04 FY03 FY02
Allegheny General / 1 0.45% 3.17% -1.56% -0.49%
The hospital experienced small negative total margins during FY01 through FY03; its first three years as part of the West Penn Allegheny Health System (WPAHS). In FY03, WPAHS initiated strategies in “revenue enhancement and cost containment “ to improve its financial situation. The WPAHS total margin improved over 2.7 points from -1.27% in FY03 to 1.44% in FY04.
Brandywine / 8 3.73% 6.91% 0.27% 2.40%After three years of consecutive losses as a non-profit hospital, the hospital has reported positive total margins since its acquisition by the for-profit Community Health Systems (CHS) in 6/01 (FY02).
Conemaugh Valley Memorial / 3 0.32% 4.84% -0.31% -4.18%
The hospital has reported positive operating margins every year since FY01. Non-operating losses, lead by investment losses, resulted in consecutive negative total margins between FY01 and FY03. Positive investment returns are the primary factor in the 5.2 point improvement in total margin during FY04.
Forbes Regional / 1 0.38% 5.72% -1.37% -3.71%
The growth in operating expenses during FY04 was held to less than one percent while operating revenue grew by 8.0%. As a result, the FY04 operating margin improved 7.0 points to 5.72%. See Allegheny General.
Geisinger/Danville / 4 3.39% 10.11% -0.06% -2.03%
The FY04 operating margin improved over 10.1 points to 10.04%. The 19.3% growth in NPR coupled with an increase in investment earnings allocated to operations caused operating revenue to increase 24.4% during FY04. In contrast, operating expenses grew by 11.9% in FY04.
Lock Haven / 4 1.48% 5.04% 11.06% -12.86%FY02 was the last year the hospital was operated by a local non-profit corporation. FY03 reflects the first eleven months the hospital was operated by the for-profit Community Health Systems (CHS).
Medical Center Beaver / 1 0.58% 5.29% -2.67% -1.60%
FY04 was the first year the Medical Center had a positive operating margin since FY98. The Medical Center held the growth in operating expenses to 4.5% while operating revenue grew 6.7% resulting in a small positive operating margin of 0.73% in FY04. Net gains on the sale of investments and investment earnings lifted the total margin to 5.29%.
Continued on next page.

28 • PHC4 • 2004 Financial Analysis • Volume One
Hospitals with a Negative 3-Year Average Total Margin
PHC4 • 2004 Financial Analysis • Volume One • 29
Sharon Regional / 2 1.07% 3.94% 0.88% -2.07%
Prior to FY01, the hospital had a history of positive operating and total margins. After two years of losses during FY01 and FY02, the hospital began to rebound with small positive operating and total margins in FY03. Financial performance continued to improve in FY04 with further growth in operating and investment income.
Troy Community / 6 1.07% 6.19% -2.41% -1.36%
The hospital has posted negative operating and total margins every year since FY95. Operating margin improved 8.7 points to 6.19% during FY04. Net patient revenue (NPR) grew 11.2% and operating revenue grew 9.9% while FY04 operating expenses were held nearly constant.
TABLE 12 (CONTINUED)
Hospitals 3-Year Average Total Margin Was Negative during FY03 and Became Positive in FY04
Name / Region
3-yr Avg Total Margin
FY02-FY04
Total Margin
NOTES FY04 FY03 FY02

28 • PHC4 • 2004 Financial Analysis • Volume One
Hospitals with a Negative 3-Year Average Total Margin
PHC4 • 2004 Financial Analysis • Volume One • 29
��������
��������
��������
��������
��������
��������
��������
��������
��������
Individual Hospital Data
Individual Hospital Data
The tables on the following pages provide hospital-specifi c fi nancial data for the 182 gen-eral acute care hospitals covered in this report. The hospitals have been arranged by PHC4’s nine regions.
Included in these tables are the FY04 operating and total margins for each indi-vidual hospital. The corresponding operating income and total income expressed in dol-lars, as well as each hospital’s total operating revenue, can be found on PHC4’s Web site at www.phc4.org. (Note: Comparing net patient revenue to total operating expenses will not provide operating income or operating margin. Operating revenue from the PHC4 Web site must be used to compute operating income.)
Averages for all of the hospitals in the region are presented in the fi rst row of each table. The regional averages that are ex-pressed as a percentage (e.g., “3-Year Average Change in NPR” and “Operating Margin”) are calculated as if the entire region were a single reporting entity. For example, the regional average operating margins are calculated by adding the operating income and the operat-ing revenue for all hospitals in the region. The regional total operating income is divided by the regional total operating revenue to yield a regional average operating margin.
In calculating the regional averages, esti-mated data was used for hospitals that reported less than a full year of data due to a change in the fi scal year usually caused by a change in ownership. No estimated data was used for the individual hospital data.
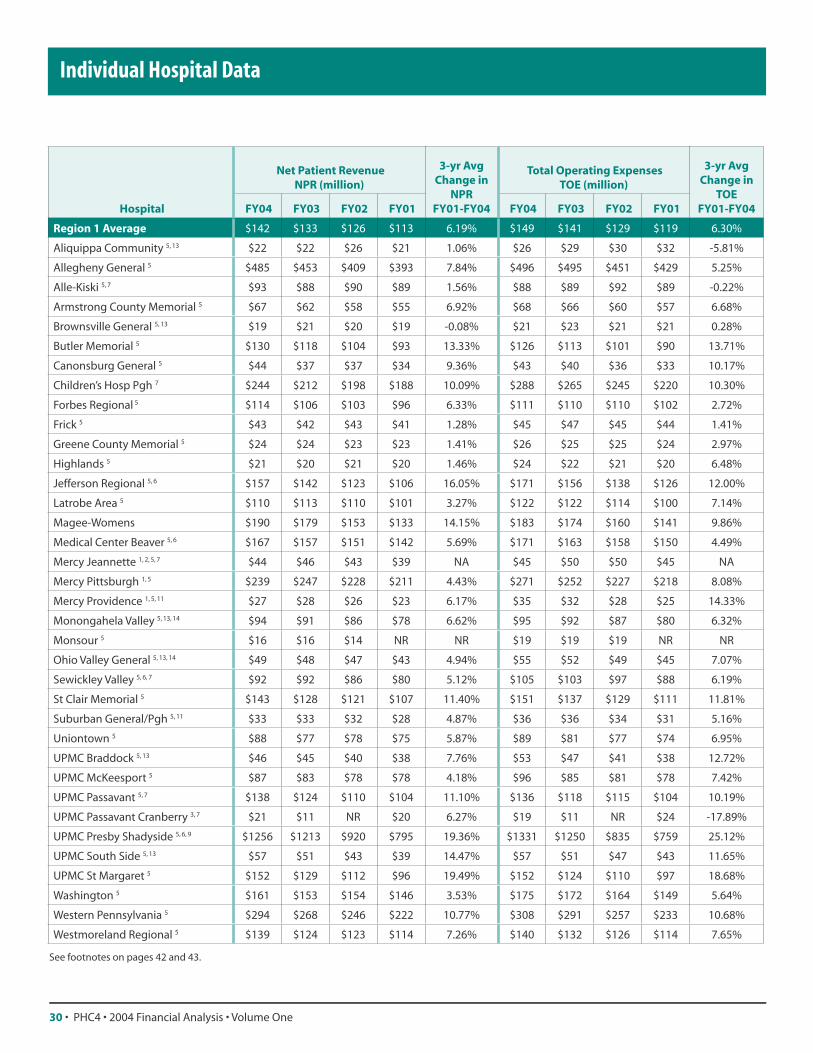
30 • PHC4 • 2004 Financial Analysis • Volume One
Individual Hospital Data
PHC4 • 2004 Financial Analysis • Volume One • 31
Individual Hospital Data
Hospital
Net Patient RevenueNPR (million)
3-yr Avg Change in
NPRFY01-FY04
Total Operating ExpensesTOE (million)
3-yr Avg Change in
TOEFY01-FY04 FY04 FY03 FY02 FY01 FY04 FY03 FY02 FY01
Region 1 Average $142 $133 $126 $113 6.19% $149 $141 $129 $119 6.30%
Aliquippa Community 5, 13 $22 $22 $26 $21 1.06% $26 $29 $30 $32 -5.81%
Allegheny General 5 $485 $453 $409 $393 7.84% $496 $495 $451 $429 5.25%
Alle-Kiski 5, 7 $93 $88 $90 $89 1.56% $88 $89 $92 $89 -0.22%
Armstrong County Memorial 5 $67 $62 $58 $55 6.92% $68 $66 $60 $57 6.68%
Brownsville General 5, 13 $19 $21 $20 $19 -0.08% $21 $23 $21 $21 0.28%
Butler Memorial 5 $130 $118 $104 $93 13.33% $126 $113 $101 $90 13.71%
Canonsburg General 5 $44 $37 $37 $34 9.36% $43 $40 $36 $33 10.17%
Children’s Hosp Pgh 7 $244 $212 $198 $188 10.09% $288 $265 $245 $220 10.30%
Forbes Regional 5 $114 $106 $103 $96 6.33% $111 $110 $110 $102 2.72%
Frick 5 $43 $42 $43 $41 1.28% $45 $47 $45 $44 1.41%
Greene County Memorial 5 $24 $24 $23 $23 1.41% $26 $25 $25 $24 2.97%
Highlands 5 $21 $20 $21 $20 1.46% $24 $22 $21 $20 6.48%
Jefferson Regional 5, 6 $157 $142 $123 $106 16.05% $171 $156 $138 $126 12.00%
Latrobe Area 5 $110 $113 $110 $101 3.27% $122 $122 $114 $100 7.14%
Magee-Womens $190 $179 $153 $133 14.15% $183 $174 $160 $141 9.86%
Medical Center Beaver 5, 6 $167 $157 $151 $142 5.69% $171 $163 $158 $150 4.49%
Mercy Jeannette 1, 2, 5, 7 $44 $46 $43 $39 NA $45 $50 $50 $45 NA
Mercy Pittsburgh 1, 5 $239 $247 $228 $211 4.43% $271 $252 $227 $218 8.08%
Mercy Providence 1, 5, 11 $27 $28 $26 $23 6.17% $35 $32 $28 $25 14.33%
Monongahela Valley 5, 13, 14 $94 $91 $86 $78 6.62% $95 $92 $87 $80 6.32%
Monsour 5 $16 $16 $14 NR NR $19 $19 $19 NR NR
Ohio Valley General 5, 13, 14 $49 $48 $47 $43 4.94% $55 $52 $49 $45 7.07%
Sewickley Valley 5, 6, 7 $92 $92 $86 $80 5.12% $105 $103 $97 $88 6.19%
St Clair Memorial 5 $143 $128 $121 $107 11.40% $151 $137 $129 $111 11.81%
Suburban General/Pgh 5, 11 $33 $33 $32 $28 4.87% $36 $36 $34 $31 5.16%
Uniontown 5 $88 $77 $78 $75 5.87% $89 $81 $77 $74 6.95%
UPMC Braddock 5, 13 $46 $45 $40 $38 7.76% $53 $47 $41 $38 12.72%
UPMC McKeesport 5 $87 $83 $78 $78 4.18% $96 $85 $81 $78 7.42%
UPMC Passavant 5, 7 $138 $124 $110 $104 11.10% $136 $118 $115 $104 10.19%
UPMC Passavant Cranberry 3, 7 $21 $11 NR $20 6.27% $19 $11 NR $24 -17.89%
UPMC Presby Shadyside 5, 6, 9 $1256 $1213 $920 $795 19.36% $1331 $1250 $835 $759 25.12%
UPMC South Side 5, 13 $57 $51 $43 $39 14.47% $57 $51 $47 $43 11.65%
UPMC St Margaret 5 $152 $129 $112 $96 19.49% $152 $124 $110 $97 18.68%
Washington 5 $161 $153 $154 $146 3.53% $175 $172 $164 $149 5.64%
Western Pennsylvania 5 $294 $268 $246 $222 10.77% $308 $291 $257 $233 10.68%
Westmoreland Regional 5 $139 $124 $123 $114 7.26% $140 $132 $126 $114 7.65%
See footnotes on pages 42 and 43.

30 • PHC4 • 2004 Financial Analysis • Volume One
Individual Hospital Data
PHC4 • 2004 Financial Analysis • Volume One • 31
Individual Hospital Data
Hospital
Operating Margin
FY04
Total Margin
FY04
3-yr Average Total Margin
FY02-FY04
Percent of Uncompensated
Care FY04
Medicare Share of NPR
FY04
Medical Assistance
Share of NPRFY04
Region 1 Average 2.89% 4.18% 3.48% 1.78% 43.95% 9.05%
Aliquippa Community 5, 13 -8.15% -8.15% -14.88% 1.32% 69.47% 8.93%
Allegheny General 5 3.17% 3.17% 0.45% 1.72% 39.20% 8.70%
Alle-Kiski 5, 7 6.74% 6.74% 2.39% 1.60% 57.38% 5.63%
Armstrong County Memorial 5 0.19% 0.72% -1.04% 2.45% 48.45% 6.81%
Brownsville General 5, 13 -7.60% -6.90% -5.50% 1.57% 64.91% 7.13%
Butler Memorial 5 4.60% 5.18% 6.30% 1.67% 49.69% 8.12%
Canonsburg General 5 5.38% 5.38% 3.31% 1.73% 54.32% 3.08%
Children’s Hosp Pgh 7 4.40% 5.42% 1.02% 1.32% 4.95% 27.82%
Forbes Regional 5 5.72% 5.72% 0.38% 1.62% 51.96% 6.02%
Frick 5 -4.43% -4.29% -5.42% 2.34% 56.68% 6.03%
Greene County Memorial 5 -7.33% -7.41% -4.37% 4.26% 56.00% 5.29%
Highlands 5 -13.05% -9.48% -4.13% 3.59% 55.06% 17.32%
Jefferson Regional 5, 6 -1.65% 2.64% -2.59% 1.58% 60.88% 3.61%
Latrobe Area 5 -5.24% -0.35% 0.03% 2.28% 53.02% 6.08%
Magee-Womens 8.89% 11.39% 5.43% 1.05% 6.26% 19.78%
Medical Center Beaver 5, 6 0.73% 5.29% 0.58% 1.32% 48.51% 5.57%
Mercy Jeannette 1, 2, 5, 7 -1.36% -1.10% -7.66% 1.47% 52.01% 5.39%
Mercy Pittsburgh 1, 5 -5.09% -5.09% 0.51% 3.07% 51.75% 7.45%
Mercy Providence 1, 5, 11 -24.09% -24.09% -12.80% 9.25% 68.46% 17.28%
Monongahela Valley 5, 13, 14 0.05% 2.53% 2.20% 1.65% 62.28% 8.64%
Monsour 5 -15.31% -15.31% -20.40% 4.68% 60.20% 26.32%
Ohio Valley General 5, 13, 14 -1.68% 7.02% 3.93% 2.36% 57.27% 3.17%
Sewickley Valley 5, 6, 7 0.17% 2.68% 1.03% 1.67% 43.56% 3.61%
St Clair Memorial 5 2.92% 4.36% 3.06% 1.29% 50.27% 0.95%
Suburban General/Pgh 5, 11 -0.58% -0.58% -3.07% 2.05% 67.65% 3.25%
Uniontown 5 0.68% 1.56% 1.20% 3.46% 54.05% 13.58%
UPMC Braddock 5, 13 -10.98% -10.98% -3.41% 4.95% 58.42% 21.10%
UPMC McKeesport 5 -6.36% -4.15% -1.26% 2.67% 68.16% 10.56%
UPMC Passavant 5, 7 4.72% 5.97% 4.75% 0.76% 55.89% 1.13%
UPMC Passavant Cranberry 3, 7 9.47% 9.47% NR 1.51% 21.18% 1.08%
UPMC Presby Shadyside 5, 6, 9 7.71% 8.48% 11.14% 1.38% 38.05% 9.75%
UPMC South Side 5, 13 2.35% 4.14% 2.01% 2.77% 57.75% 8.22%
UPMC St Margaret 5 2.54% 4.76% 5.63% 1.23% 52.42% 2.72%
Washington 5 -0.68% 2.28% -0.02% 2.68% 47.38% 9.35%
Western Pennsylvania 5 3.72% 3.72% 2.44% 1.51% 46.27% 8.14%
Westmoreland Regional 5 1.64% 3.81% 1.03% 1.54% 50.60% 4.24%
See footnotes on pages 42 and 43.
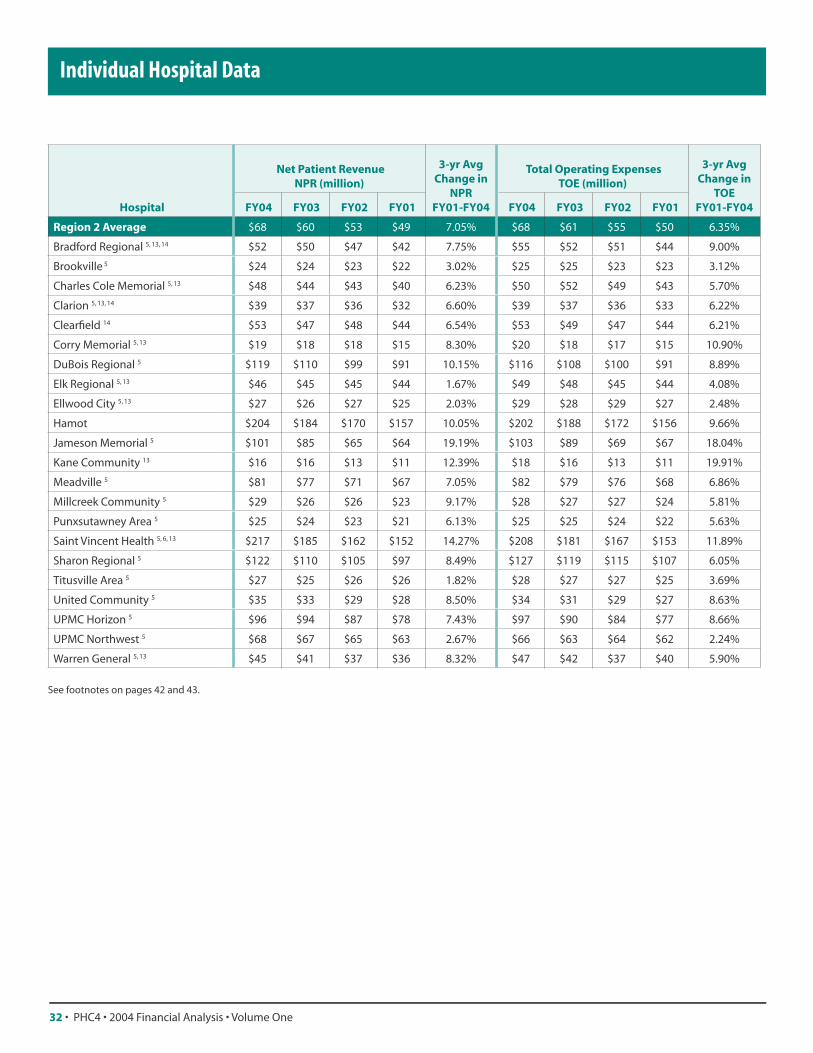
32 • PHC4 • 2004 Financial Analysis • Volume One
Individual Hospital Data
PHC4 • 2004 Financial Analysis • Volume One • 33
Individual Hospital Data
Hospital
Net Patient RevenueNPR (million)
3-yr Avg Change in
NPRFY01-FY04
Total Operating ExpensesTOE (million)
3-yr Avg Change in
TOEFY01-FY04 FY04 FY03 FY02 FY01 FY04 FY03 FY02 FY01
Region 2 Average $68 $60 $53 $49 7.05% $68 $61 $55 $50 6.35%
Bradford Regional 5, 13, 14 $52 $50 $47 $42 7.75% $55 $52 $51 $44 9.00%
Brookville 5 $24 $24 $23 $22 3.02% $25 $25 $23 $23 3.12%
Charles Cole Memorial 5, 13 $48 $44 $43 $40 6.23% $50 $52 $49 $43 5.70%
Clarion 5, 13, 14 $39 $37 $36 $32 6.60% $39 $37 $36 $33 6.22%
Clearfield 14 $53 $47 $48 $44 6.54% $53 $49 $47 $44 6.21%
Corry Memorial 5, 13 $19 $18 $18 $15 8.30% $20 $18 $17 $15 10.90%
DuBois Regional 5 $119 $110 $99 $91 10.15% $116 $108 $100 $91 8.89%
Elk Regional 5, 13 $46 $45 $45 $44 1.67% $49 $48 $45 $44 4.08%
Ellwood City 5, 13 $27 $26 $27 $25 2.03% $29 $28 $29 $27 2.48%
Hamot $204 $184 $170 $157 10.05% $202 $188 $172 $156 9.66%
Jameson Memorial 5 $101 $85 $65 $64 19.19% $103 $89 $69 $67 18.04%
Kane Community 13 $16 $16 $13 $11 12.39% $18 $16 $13 $11 19.91%
Meadville 5 $81 $77 $71 $67 7.05% $82 $79 $76 $68 6.86%
Millcreek Community 5 $29 $26 $26 $23 9.17% $28 $27 $27 $24 5.81%
Punxsutawney Area 5 $25 $24 $23 $21 6.13% $25 $25 $24 $22 5.63%
Saint Vincent Health 5, 6, 13 $217 $185 $162 $152 14.27% $208 $181 $167 $153 11.89%
Sharon Regional 5 $122 $110 $105 $97 8.49% $127 $119 $115 $107 6.05%
Titusville Area 5 $27 $25 $26 $26 1.82% $28 $27 $27 $25 3.69%
United Community 5 $35 $33 $29 $28 8.50% $34 $31 $29 $27 8.63%
UPMC Horizon 5 $96 $94 $87 $78 7.43% $97 $90 $84 $77 8.66%
UPMC Northwest 5 $68 $67 $65 $63 2.67% $66 $63 $64 $62 2.24%
Warren General 5, 13 $45 $41 $37 $36 8.32% $47 $42 $37 $40 5.90%
See footnotes on pages 42 and 43.
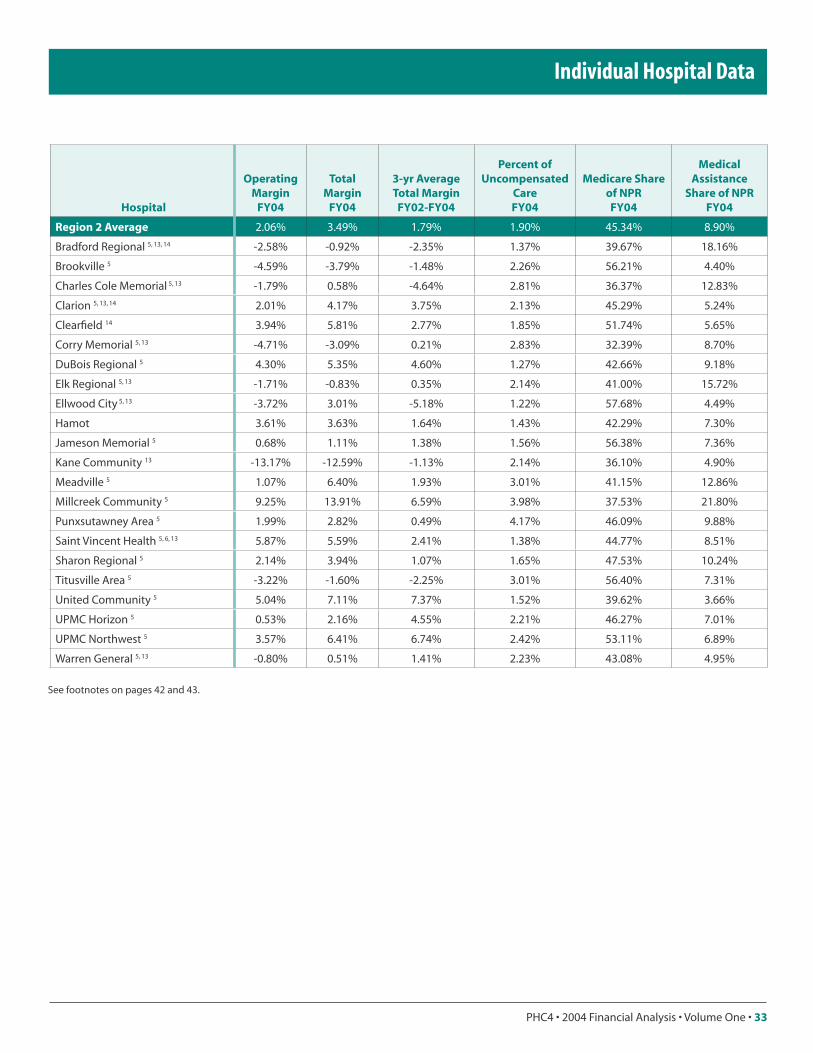
32 • PHC4 • 2004 Financial Analysis • Volume One
Individual Hospital Data
PHC4 • 2004 Financial Analysis • Volume One • 33
Individual Hospital Data
Hospital
Operating Margin
FY04
Total Margin
FY04
3-yr Average Total Margin
FY02-FY04
Percent of Uncompensated
Care FY04
Medicare Share of NPRFY04
Medical Assistance
Share of NPRFY04
Region 2 Average 2.06% 3.49% 1.79% 1.90% 45.34% 8.90%
Bradford Regional 5, 13, 14 -2.58% -0.92% -2.35% 1.37% 39.67% 18.16%
Brookville 5 -4.59% -3.79% -1.48% 2.26% 56.21% 4.40%
Charles Cole Memorial 5, 13 -1.79% 0.58% -4.64% 2.81% 36.37% 12.83%
Clarion 5, 13, 14 2.01% 4.17% 3.75% 2.13% 45.29% 5.24%
Clearfield 14 3.94% 5.81% 2.77% 1.85% 51.74% 5.65%
Corry Memorial 5, 13 -4.71% -3.09% 0.21% 2.83% 32.39% 8.70%
DuBois Regional 5 4.30% 5.35% 4.60% 1.27% 42.66% 9.18%
Elk Regional 5, 13 -1.71% -0.83% 0.35% 2.14% 41.00% 15.72%
Ellwood City 5, 13 -3.72% 3.01% -5.18% 1.22% 57.68% 4.49%
Hamot 3.61% 3.63% 1.64% 1.43% 42.29% 7.30%
Jameson Memorial 5 0.68% 1.11% 1.38% 1.56% 56.38% 7.36%
Kane Community 13 -13.17% -12.59% -1.13% 2.14% 36.10% 4.90%
Meadville 5 1.07% 6.40% 1.93% 3.01% 41.15% 12.86%
Millcreek Community 5 9.25% 13.91% 6.59% 3.98% 37.53% 21.80%
Punxsutawney Area 5 1.99% 2.82% 0.49% 4.17% 46.09% 9.88%
Saint Vincent Health 5, 6, 13 5.87% 5.59% 2.41% 1.38% 44.77% 8.51%
Sharon Regional 5 2.14% 3.94% 1.07% 1.65% 47.53% 10.24%
Titusville Area 5 -3.22% -1.60% -2.25% 3.01% 56.40% 7.31%
United Community 5 5.04% 7.11% 7.37% 1.52% 39.62% 3.66%
UPMC Horizon 5 0.53% 2.16% 4.55% 2.21% 46.27% 7.01%
UPMC Northwest 5 3.57% 6.41% 6.74% 2.42% 53.11% 6.89%
Warren General 5, 13 -0.80% 0.51% 1.41% 2.23% 43.08% 4.95%
See footnotes on pages 42 and 43.
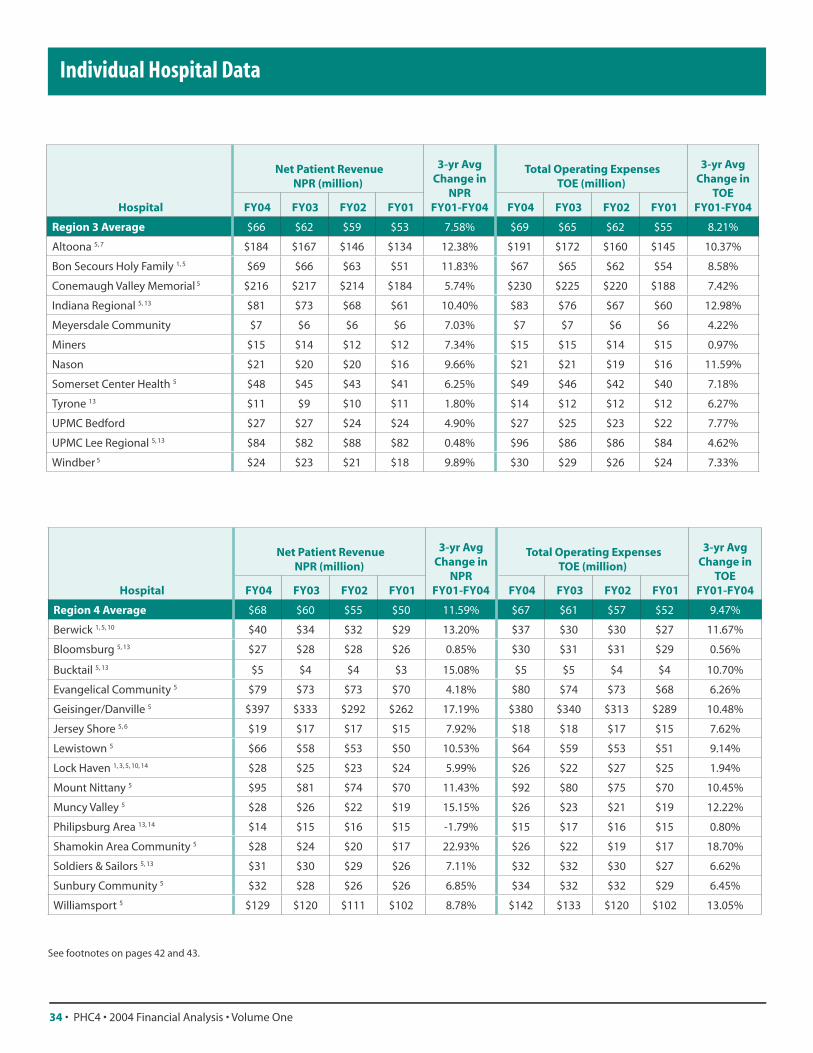
34 • PHC4 • 2004 Financial Analysis • Volume One
Individual Hospital Data
PHC4 • 2004 Financial Analysis • Volume One • 35
Individual Hospital Data
Hospital
Net Patient RevenueNPR (million)
3-yr Avg Change in
NPRFY01-FY04
Total Operating ExpensesTOE (million)
3-yr Avg Change in
TOEFY01-FY04 FY04 FY03 FY02 FY01 FY04 FY03 FY02 FY01
Region 3 Average $66 $62 $59 $53 7.58% $69 $65 $62 $55 8.21%
Altoona 5, 7 $184 $167 $146 $134 12.38% $191 $172 $160 $145 10.37%
Bon Secours Holy Family 1, 5 $69 $66 $63 $51 11.83% $67 $65 $62 $54 8.58%
Conemaugh Valley Memorial 5 $216 $217 $214 $184 5.74% $230 $225 $220 $188 7.42%
Indiana Regional 5, 13 $81 $73 $68 $61 10.40% $83 $76 $67 $60 12.98%
Meyersdale Community $7 $6 $6 $6 7.03% $7 $7 $6 $6 4.22%
Miners $15 $14 $12 $12 7.34% $15 $15 $14 $15 0.97%
Nason $21 $20 $20 $16 9.66% $21 $21 $19 $16 11.59%
Somerset Center Health 5 $48 $45 $43 $41 6.25% $49 $46 $42 $40 7.18%
Tyrone 13 $11 $9 $10 $11 1.80% $14 $12 $12 $12 6.27%
UPMC Bedford $27 $27 $24 $24 4.90% $27 $25 $23 $22 7.77%
UPMC Lee Regional 5, 13 $84 $82 $88 $82 0.48% $96 $86 $86 $84 4.62%
Windber 5 $24 $23 $21 $18 9.89% $30 $29 $26 $24 7.33%
Hospital
Net Patient RevenueNPR (million)
3-yr Avg Change in
NPRFY01-FY04
Total Operating ExpensesTOE (million)
3-yr Avg Change in
TOEFY01-FY04 FY04 FY03 FY02 FY01 FY04 FY03 FY02 FY01
Region 4 Average $68 $60 $55 $50 11.59% $67 $61 $57 $52 9.47%
Berwick 1, 5, 10 $40 $34 $32 $29 13.20% $37 $30 $30 $27 11.67%
Bloomsburg 5, 13 $27 $28 $28 $26 0.85% $30 $31 $31 $29 0.56%
Bucktail 5, 13 $5 $4 $4 $3 15.08% $5 $5 $4 $4 10.70%
Evangelical Community 5 $79 $73 $73 $70 4.18% $80 $74 $73 $68 6.26%
Geisinger/Danville 5 $397 $333 $292 $262 17.19% $380 $340 $313 $289 10.48%
Jersey Shore 5, 6 $19 $17 $17 $15 7.92% $18 $18 $17 $15 7.62%
Lewistown 5 $66 $58 $53 $50 10.53% $64 $59 $53 $51 9.14%
Lock Haven 1, 3, 5, 10, 14 $28 $25 $23 $24 5.99% $26 $22 $27 $25 1.94%
Mount Nittany 5 $95 $81 $74 $70 11.43% $92 $80 $75 $70 10.45%
Muncy Valley 5 $28 $26 $22 $19 15.15% $26 $23 $21 $19 12.22%
Philipsburg Area 13, 14 $14 $15 $16 $15 -1.79% $15 $17 $16 $15 0.80%
Shamokin Area Community 5 $28 $24 $20 $17 22.93% $26 $22 $19 $17 18.70%
Soldiers & Sailors 5, 13 $31 $30 $29 $26 7.11% $32 $32 $30 $27 6.62%
Sunbury Community 5 $32 $28 $26 $26 6.85% $34 $32 $32 $29 6.45%
Williamsport 5 $129 $120 $111 $102 8.78% $142 $133 $120 $102 13.05%
See footnotes on pages 42 and 43.

34 • PHC4 • 2004 Financial Analysis • Volume One
Individual Hospital Data
PHC4 • 2004 Financial Analysis • Volume One • 35
Individual Hospital Data
Hospital
Operating Margin
FY04
Total Margin
FY04
3-yr Average Total Margin
FY02-FY04
Percent of Uncompensated
Care FY04
Medicare Share of NPRFY04
Medical Assistance
Share of NPRFY04
Region 3 Average -0.83% 1.94% -0.08% 2.44% 48.40% 6.92%
Altoona 5, 7 -1.07% 2.55% -0.63% 2.95% 39.35% 8.81%
Bon Secours Holy Family 1, 5 4.76% 4.46% 4.28% 2.23% 57.08% 7.58%
Conemaugh Valley Memorial 5 1.75% 4.84% 0.32% 2.27% 55.11% 5.79%
Indiana Regional 5, 13 -1.33% 3.76% -0.93% 2.61% 44.17% 5.54%
Meyersdale Community -0.73% 0.99% -5.88% 5.14% 57.33% 5.21%
Miners -0.49% -0.40% -3.75% 2.59% 52.76% 7.55%
Nason -0.23% 1.92% 0.96% 1.96% 42.96% 5.23%
Somerset Center Health 5 0.90% 3.06% 1.99% 2.13% 45.03% 10.34%
Tyrone 13 -21.08% -9.51% -18.21% 4.83% 38.35% 14.61%
UPMC Bedford 2.15% 3.98% 5.89% 1.96% 36.23% 8.72%
UPMC Lee Regional 5, 13 -11.11% -9.01% -2.71% 1.90% 52.73% 3.74%
Windber 5 -0.30% -2.46% 0.30% 1.69% 56.66% 5.70%
Hospital
Operating Margin
FY04
Total Margin
FY04
3-yr Average Total Margin
FY02-FY04
Percent of Uncompensated
Care FY04
Medicare Share of NPRFY04
Medical Assistance
Share of NPRFY04
Region 4 Average 6.07% 6.56% 2.97% 2.42% 37.83% 6.33%
Berwick 1, 5, 10 9.52% 3.15% 5.02% 1.52% 43.55% 5.27%
Bloomsburg 5, 13 -7.10% -5.20% -6.87% 0.92% 33.76% 8.19%
Bucktail 5, 13 -3.41% 0.17% -1.54% 5.23% 31.45% 35.80%
Evangelical Community 5 3.59% 8.75% 6.03% 3.28% 35.73% 3.38%
Geisinger/Danville 5 10.04% 10.11% 3.39% 1.71% 32.64% 5.23%
Jersey Shore 5, 6 4.99% 5.62% 2.49% 2.12% 48.98% 3.11%
Lewistown 5 4.31% 5.02% 2.18% 2.50% 48.91% 7.08%
Lock Haven 1, 3, 5, 10, 14 8.43% 5.04% 1.48% 2.85% 26.35% 13.88%
Mount Nittany 5 3.75% 4.06% 2.60% 2.70% 34.55% 4.08%
Muncy Valley 5 6.48% 7.46% 8.43% 2.80% 33.47% 25.64%
Philipsburg Area 13, 14 -3.67% -0.84% -3.94% 3.03% 43.42% 4.82%
Shamokin Area Community 5 10.59% 10.85% 10.40% 3.22% 58.47% 4.44%
Soldiers & Sailors 5, 13 2.80% 2.97% 0.91% 4.28% 37.27% 9.27%
Sunbury Community 5 -2.68% -0.37% -5.07% 3.76% 54.67% 5.68%
Williamsport 5 2.61% 3.35% 3.36% 3.20% 43.83% 6.34%
See footnotes on pages 42 and 43.

36 • PHC4 • 2004 Financial Analysis • Volume One
Individual Hospital Data
PHC4 • 2004 Financial Analysis • Volume One • 37
Individual Hospital Data
Hospital
Net Patient RevenueNPR (million)
3-yr Avg Change in
NPRFY01-FY04
Total Operating ExpensesTOE (million)
3-yr Avg Change in
TOEFY01-FY04 FY04 FY03 FY02 FY01 FY04 FY03 FY02 FY01
Region 5 Average $166 $142 $128 $117 11.49% $161 $140 $130 $119 9.21%
Carlisle Regional 1, 3, 5, 7, 10 $88 $86 $22 $66 11.18% $67 $74 $21 $75 -3.34%
Chambersburg 5 $156 $144 $127 $115 12.04% $150 $134 $123 $113 10.64%
Community Lancaster 1, 10, 11, 13 $37 $39 $46 $41 -3.18% $35 $37 $40 $35 -0.03%
Ephrata Community 5 $113 $96 $78 $65 24.98% $109 $95 $75 $61 26.33%
Fulton County 5, 13 $20 $18 $17 $15 9.97% $20 $18 $17 $16 8.43%
Gettysburg 5 $68 $57 $53 $52 10.36% $61 $56 $54 $51 6.13%
Good Samaritan/Lebanon 5, 13 $106 $96 $95 $86 7.68% $107 $99 $93 $85 8.37%
Hanover 5 $82 $73 $67 $63 10.21% $81 $75 $69 $64 9.26%
Holy Spirit 5, 13 $178 $152 $129 $114 18.70% $186 $153 $133 $116 20.05%
J C Blair Memorial 5, 13, 14 $29 $29 $29 $28 2.15% $34 $35 $32 $31 3.18%
Lancaster General 5, 13 $478 $417 $341 $282 23.25% $461 $395 $341 $299 18.04%
Lancaster Regional 1, 3, 5, 10, 13 $109 $95 $88 $21 NA $89 $77 $76 $19 NA
Memorial York 13 $62 $57 $54 $50 8.15% $64 $58 $56 $51 8.62%
Milton S Hershey 5 $442 $369 $358 $322 12.41% $431 $383 $377 $346 8.23%
Pinnacle Health 5 $409 $396 $365 $361 4.39% $416 $403 $392 $382 2.96%
Waynesboro $42 $38 $36 $34 8.18% $40 $38 $35 $33 6.33%
York 5 $407 $379 $349 $313 9.96% $394 $370 $342 $302 10.11%
See footnotes on pages 42 and 43.

36 • PHC4 • 2004 Financial Analysis • Volume One
Individual Hospital Data
PHC4 • 2004 Financial Analysis • Volume One • 37
Individual Hospital Data
Hospital
Operating Margin
FY04
Total Margin
FY04
3-yr Average Total Margin
FY02-FY04
Percent of Uncompensated
Care FY04
Medicare Share of NPRFY04
Medical Assistance
Share of NPRFY04
Region 5 Average 6.07% 6.69% 4.68% 2.18% 35.55% 5.91%
Carlisle Regional 1, 3, 5, 7, 10 23.61% 14.87% 11.23% 1.40% 39.00% 0.56%
Chambersburg 5 5.53% 7.45% 7.64% 3.45% 38.34% 3.60%
Community Lancaster 1, 10, 11, 13 5.42% 3.34% 5.73% 2.26% 32.19% 6.42%
Ephrata Community 5 5.81% 6.01% 5.56% 2.85% 36.09% 1.96%
Fulton County 5, 13 2.19% 2.19% 3.69% 6.20% 40.90% 12.19%
Gettysburg 5 11.07% 15.77% 4.87% 2.94% 37.71% 4.57%
Good Samaritan/Lebanon 5, 13 3.01% 4.10% 3.25% 3.09% 45.95% 5.64%
Hanover 5 1.72% 2.96% 1.14% 2.55% 32.46% 1.26%
Holy Spirit 5, 13 -0.68% 0.57% 0.78% 1.96% 40.41% 3.17%
J C Blair Memorial 5, 13, 14 -10.84% -4.17% -4.50% 2.83% 39.55% 9.85%
Lancaster General 5, 13 8.53% 8.90% 8.55% 1.01% 32.12% 5.44%
Lancaster Regional 1, 3, 5, 10, 13 19.04% 10.47% 9.99% 0.78% 37.27% 6.05%
Memorial York 13 0.81% 1.22% 0.48% 2.52% 40.48% 7.77%
Milton S Hershey 5 7.16% 7.29% 4.00% 1.38% 29.12% 9.98%
Pinnacle Health 5 1.63% 3.52% 0.82% 2.42% 39.67% 6.65%
Waynesboro 6.11% 7.94% 5.20% 3.51% 35.99% 2.75%
York 5 5.65% 8.45% 5.99% 3.27% 34.36% 6.22%
See footnotes on pages 42 and 43.

38 • PHC4 • 2004 Financial Analysis • Volume One
Individual Hospital Data
PHC4 • 2004 Financial Analysis • Volume One • 39
Individual Hospital Data
Hospital
Net Patient RevenueNPR (million)
3-yr Avg Change in
NPRFY01-FY04
Total Operating ExpensesTOE (million)
3-yr Avg Change in
TOEFY01-FY04 FY04 FY03 FY02 FY01 FY04 FY03 FY02 FY01
Region 6 Average $69 $65 $62 $58 6.36% $72 $69 $65 $62 5.63%
Barnes Kasson County 1, 5 $13 $15 $15 $13 -0.16% $15 $17 $16 $14 2.65%
Community/Scranton 5 $129 $126 $126 $121 2.16% $140 $133 $134 $129 2.77%
Geisinger Wyoming Valley 5, 13 $100 $93 $74 $58 24.17% $101 $91 $77 $62 20.85%
Hazleton General 1, 5 $44 $42 $38 $38 4.85% $47 $43 $40 $41 4.97%
Hazleton St Joseph 1 $34 $38 $39 $36 -2.50% $39 $41 $39 $38 0.28%
Marian Community 5, 13, 14 $33 $33 $30 $29 4.52% $34 $34 $32 $30 4.64%
Memorial/Towanda 5, 13 $31 $29 $28 $24 9.45% $29 $29 $27 $24 8.12%
Mercy/Scranton 1, 5 $117 $116 $110 $103 4.42% $125 $123 $117 $108 5.03%
Mercy/Wilkes-Barre 1, 5 $75 $73 $75 $71 1.66% $77 $78 $77 $76 0.50%
Mid-Valley 13 $10 $10 $9 $9 2.77% $11 $12 $11 $10 4.12%
Montrose General 1 $9 $8 $8 $7 9.36% $9 $9 $8 $8 5.94%
Moses Taylor 5 $100 $94 $90 $83 6.95% $108 $103 $96 $87 8.30%
Pocono 5 $134 $116 $102 $86 18.37% $132 $116 $101 $93 13.82%
Robert Packer 5 $156 $139 $137 $123 8.92% $158 $149 $145 $134 5.86%
Troy Community $9 $8 $7 $7 7.54% $9 $9 $8 $8 3.25%
Tyler Memorial 13 $24 $21 $21 $19 8.99% $23 $22 $21 $19 7.88%
Wayne Memorial $48 $45 $41 $40 6.60% $53 $49 $46 $43 7.56%
WVHCS 5, 13 $169 $158 $165 $167 0.42% $189 $182 $183 $188 0.31%
Hospital
Net Patient RevenueNPR (million)
3-yr Avg Change in
NPRFY01-FY04
Total Operating ExpensesTOE (million)
3-yr Avg Change in
TOEFY01-FY04 FY04 FY03 FY02 FY01 FY04 FY03 FY02 FY01
Region 7 Average $161 $142 $126 $114 13.63% $160 $143 $125 $116 12.69%
Ashland Regional 1, 3, 5, 10 $15 $14 $6 $18 -5.60% $18 $17 $6 $20 -2.97%
Easton 1, 3, 5, 10, 13 $174 $145 $31 $115 16.99% $159 $141 $29 $122 10.26%
Gnaden Huetten Memorial 5 $47 $44 $42 $38 8.07% $48 $44 $40 $37 10.43%
Good Samaritan Regional 5 $60 $55 $52 $49 7.02% $63 $56 $52 $53 6.80%
Lehigh Valley 5 $532 $461 $396 $354 16.74% $536 $476 $407 $372 14.64%
Lehigh Valley/Muhlenberg $105 $79 $63 $56 29.54% $105 $87 $70 $61 24.11%
Palmerton $25 $26 $26 $23 2.65% $30 $30 $27 $24 8.58%
Pottsville Warne Clinic 5 $65 $61 $56 $52 8.51% $66 $64 $59 $54 7.75%
Reading 5, 13 $416 $368 $332 $304 12.33% $404 $361 $318 $287 13.64%
Sacred Heart/Allentown 5 $104 $99 $97 $91 4.64% $106 $102 $98 $98 2.97%
St Joseph/Reading 5 $146 $140 $125 $106 12.30% $144 $132 $116 $102 13.65%
St Luke’s Miners 5 $31 $30 $28 $27 5.67% $32 $31 $28 $27 5.78%
St Luke’s/Bethlehem 5 $370 $318 $282 $250 16.03% $366 $316 $281 $250 15.51%
See footnotes on pages 42 and 43.
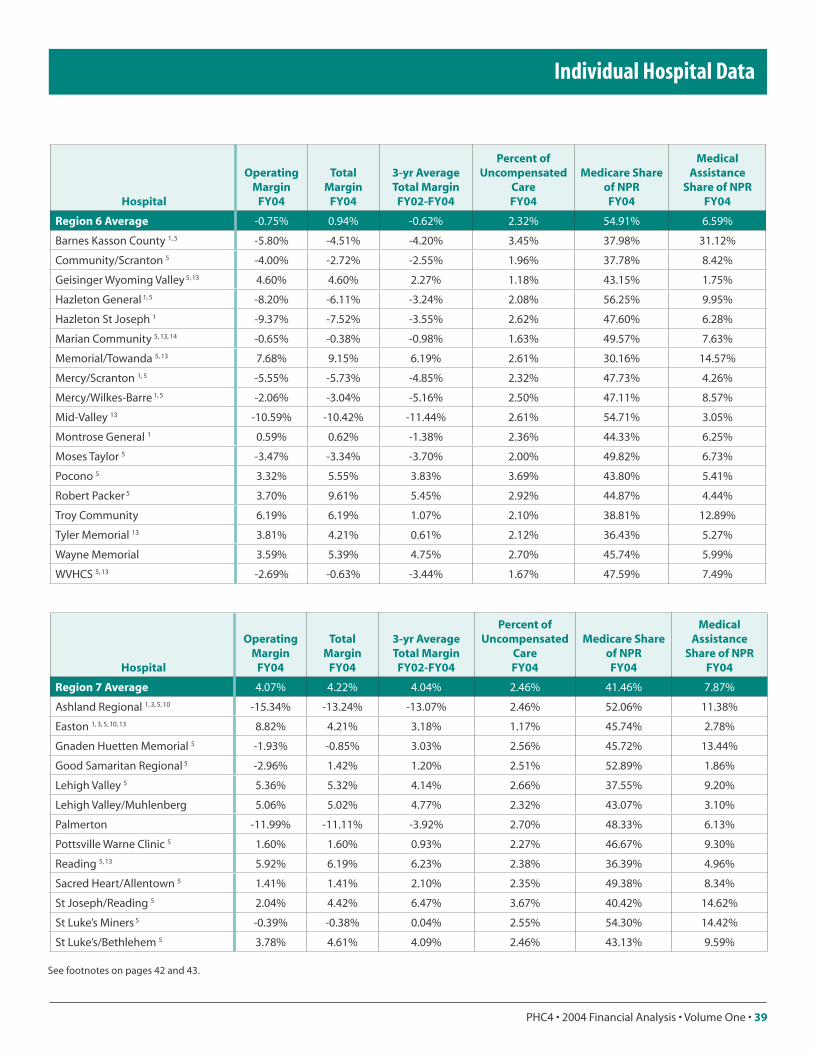
38 • PHC4 • 2004 Financial Analysis • Volume One
Individual Hospital Data
PHC4 • 2004 Financial Analysis • Volume One • 39
Individual Hospital Data
Hospital
Operating Margin
FY04
Total Margin
FY04
3-yr Average Total Margin
FY02-FY04
Percent of Uncompensated
Care FY04
Medicare Share of NPRFY04
Medical Assistance
Share of NPRFY04
Region 6 Average -0.75% 0.94% -0.62% 2.32% 54.91% 6.59%
Barnes Kasson County 1, 5 -5.80% -4.51% -4.20% 3.45% 37.98% 31.12%
Community/Scranton 5 -4.00% -2.72% -2.55% 1.96% 37.78% 8.42%
Geisinger Wyoming Valley 5, 13 4.60% 4.60% 2.27% 1.18% 43.15% 1.75%
Hazleton General 1, 5 -8.20% -6.11% -3.24% 2.08% 56.25% 9.95%
Hazleton St Joseph 1 -9.37% -7.52% -3.55% 2.62% 47.60% 6.28%
Marian Community 5, 13, 14 -0.65% -0.38% -0.98% 1.63% 49.57% 7.63%
Memorial/Towanda 5, 13 7.68% 9.15% 6.19% 2.61% 30.16% 14.57%
Mercy/Scranton 1, 5 -5.55% -5.73% -4.85% 2.32% 47.73% 4.26%
Mercy/Wilkes-Barre 1, 5 -2.06% -3.04% -5.16% 2.50% 47.11% 8.57%
Mid-Valley 13 -10.59% -10.42% -11.44% 2.61% 54.71% 3.05%
Montrose General 1 0.59% 0.62% -1.38% 2.36% 44.33% 6.25%
Moses Taylor 5 -3.47% -3.34% -3.70% 2.00% 49.82% 6.73%
Pocono 5 3.32% 5.55% 3.83% 3.69% 43.80% 5.41%
Robert Packer 5 3.70% 9.61% 5.45% 2.92% 44.87% 4.44%
Troy Community 6.19% 6.19% 1.07% 2.10% 38.81% 12.89%
Tyler Memorial 13 3.81% 4.21% 0.61% 2.12% 36.43% 5.27%
Wayne Memorial 3.59% 5.39% 4.75% 2.70% 45.74% 5.99%
WVHCS 5, 13 -2.69% -0.63% -3.44% 1.67% 47.59% 7.49%
Hospital
Operating Margin
FY04
Total Margin
FY04
3-yr Average Total Margin
FY02-FY04
Percent of Uncompensated
Care FY04
Medicare Share of NPRFY04
Medical Assistance
Share of NPRFY04
Region 7 Average 4.07% 4.22% 4.04% 2.46% 41.46% 7.87%
Ashland Regional 1, 3, 5, 10 -15.34% -13.24% -13.07% 2.46% 52.06% 11.38%
Easton 1, 3, 5, 10, 13 8.82% 4.21% 3.18% 1.17% 45.74% 2.78%
Gnaden Huetten Memorial 5 -1.93% -0.85% 3.03% 2.56% 45.72% 13.44%
Good Samaritan Regional 5 -2.96% 1.42% 1.20% 2.51% 52.89% 1.86%
Lehigh Valley 5 5.36% 5.32% 4.14% 2.66% 37.55% 9.20%
Lehigh Valley/Muhlenberg 5.06% 5.02% 4.77% 2.32% 43.07% 3.10%
Palmerton -11.99% -11.11% -3.92% 2.70% 48.33% 6.13%
Pottsville Warne Clinic 5 1.60% 1.60% 0.93% 2.27% 46.67% 9.30%
Reading 5, 13 5.92% 6.19% 6.23% 2.38% 36.39% 4.96%
Sacred Heart/Allentown 5 1.41% 1.41% 2.10% 2.35% 49.38% 8.34%
St Joseph/Reading 5 2.04% 4.42% 6.47% 3.67% 40.42% 14.62%
St Luke’s Miners 5 -0.39% -0.38% 0.04% 2.55% 54.30% 14.42%
St Luke’s/Bethlehem 5 3.78% 4.61% 4.09% 2.46% 43.13% 9.59%
See footnotes on pages 42 and 43.

40 • PHC4 • 2004 Financial Analysis • Volume One
Individual Hospital Data
PHC4 • 2004 Financial Analysis • Volume One • 41
Individual Hospital Data
Hospital
Net Patient RevenueNPR (million)
3-yr Avg Change in
NPRFY01-FY04
Total Operating ExpensesTOE (million)
3-yr Avg Change in
TOEFY01-FY04 FY04 FY03 FY02 FY01 FY04 FY03 FY02 FY01
Region 8 Average $135 $131 $113 $104 9.78% $140 $136 $120 $110 9.13%
Abington Memorial 5, 13, 14 $416 $390 $348 $312 11.04% $458 $425 $391 $345 10.89%
Bariatric Care Centers 1, 10, 11, 14 $11 NA NA NA NA $13 NA NA NA NA
Brandywine 1, 3, 5, 10 $105 $79 $44 $56 NA $95 $82 $44 $62 NA
Central Montgomery 1, 3, 5, 10 $58 $56 $27 $52 4.31% $62 $58 $30 $55 4.34%
Chester County 5 $125 $116 $102 $93 11.53% $130 $123 $115 $101 9.42%
Crozer-Chester 5, 13 $470 $465 $431 $394 6.39% $479 $477 $433 $400 6.63%
Delaware County Memorial 5, 13 $141 $142 $131 $116 6.99% $141 $141 $130 $118 6.57%
Doylestown 5 $157 $142 $133 $107 15.49% $158 $143 $146 $122 9.85%
Elkins Park 1, 2, 5, 8, 10, 11 $25 $38 $35 $36 NA $42 $71 $44 $45 NA
Grand View 5 $112 $104 $96 $86 9.86% $112 $106 $98 $89 8.83%
Holy Redeemer 5, 7 $137 $148 $135 $119 4.97% $153 $149 $137 $119 9.72%
Jennersville Regional 1, 3, 10, 13, 14 $39 $35 $7 $26 17.55% $41 $34 $7 $41 0.21%
Main Line Bryn Mawr 5, 6 $185 $173 $152 $172 2.56% $197 $180 $158 $175 4.05%
Main Line Lankenau 5, 6 $266 $229 $199 $180 16.02% $276 $235 $212 $191 14.83%
Main Line Paoli 5, 6 $123 $100 $80 $67 27.55% $115 $96 $78 $67 23.62%
Mercy Fitzgerald 1, 5 $144 $138 $121 $129 3.77% $160 $159 $146 $136 5.74%
Mercy Suburban 1, 5 $81 $67 $59 $56 15.19% $81 $68 $62 $56 14.82%
Montgomery 5 $84 $85 $75 $70 6.23% $87 $88 $83 $77 4.67%
Phoenixville 7, 11, 13 $96 $87 $82 $68 13.71% $97 $88 $78 $64 16.94%
Pottstown Memorial 5, 10, 13 $115 $102 $92 $83 12.84% $109 $114 $92 $83 10.41%
Riddle Memorial 5 $102 $94 $83 $75 11.56% $108 $98 $90 $82 10.59%
St Luke’s Quakertown 5 $30 $26 $23 $21 13.21% $31 $27 $24 $23 11.48%
St Mary 1, 3, 5, 13 $195 $172 $71 $133 15.70% $185 $160 $68 $126 15.38%
Temple Lower Bucks 5 $104 $92 $80 $76 12.25% $106 $96 $84 $82 9.65%
Warminster 1, 5, 10, 13, 14 $54 $53 $49 $46 5.24% $60 $57 $50 $46 9.56%
See footnotes on pages 42 and 43.

40 • PHC4 • 2004 Financial Analysis • Volume One
Individual Hospital Data
PHC4 • 2004 Financial Analysis • Volume One • 41
Individual Hospital Data
Hospital
Operating Margin
FY04
Total Margin
FY04
3-yr Average Total Margin
FY02-FY04
Percent of Uncompensated
Care FY04
Medicare Share of NPRFY04
Medical Assistance
Share of NPRFY04
Region 8 Average 0.87% 1.98% 1.12% 1.67% 41.01% 6.11%
Abington Memorial 5, 13, 14 0.63% 2.62% 3.33% 1.14% 41.95% 3.23%
Bariatric Care Centers 1, 10, 11, 14 -19.55% -19.55% NA 4.32% 0.00% 0.00%
Brandywine 1, 3, 5, 10 11.82% 6.91% 3.73% 1.73% 31.43% 3.35%
Central Montgomery 1, 3, 5, 10 -6.26% -3.93% -2.12% 1.23% 40.55% 4.54%
Chester County 5 2.71% 2.71% -0.57% 1.94% 33.82% 5.89%
Crozer-Chester 5, 13 0.75% 0.98% 1.20% 2.59% 35.03% 15.57%
Delaware County Memorial 5, 13 1.34% 2.21% 2.26% 1.84% 43.42% 9.80%
Doylestown 5 3.38% 4.50% -1.63% 1.36% 44.13% 1.57%
Elkins Park 1, 2, 5, 8, 10, 11 -61.97% -7.85% -24.56% 3.06% 39.22% 4.78%
Grand View 5 3.41% 6.29% 1.59% 1.67% 41.96% 2.59%
Holy Redeemer 5, 7 -7.22% -3.25% 0.72% 0.43% 50.28% 2.56%
Jennersville Regional 1, 3, 10, 13, 14 -2.71% -2.71% -0.23% 2.65% 30.39% 3.96%
Main Line Bryn Mawr 5, 6 -1.25% -0.33% 0.78% 0.82% 42.24% 2.73%
Main Line Lankenau 5, 6 3.57% 3.22% 2.79% 0.98% 47.06% 5.41%
Main Line Paoli 5, 6 10.65% 12.60% 12.21% 1.08% 34.89% 2.35%
Mercy Fitzgerald 1, 5 -5.95% -5.95% -9.37% 2.87% 48.17% 13.80%
Mercy Suburban 1, 5 2.24% 2.24% 0.59% 2.95% 41.76% 9.15%
Montgomery 5 -1.40% 0.86% -1.16% 2.79% 50.21% 5.48%
Phoenixville 7, 11, 13 1.50% 1.01% 3.75% 1.54% 39.66% 2.36%
Pottstown Memorial 5, 10, 13 5.71% 2.73% -0.89% 1.61% 37.88% 4.11%
Riddle Memorial 5 0.16% 2.01% 1.85% 0.88% 39.34% 2.90%
St Luke’s Quakertown 5 -3.10% -2.88% -2.06% 2.97% 38.46% 4.53%
St Mary 1, 3, 5, 13 7.11% 7.29% 7.67% 1.04% 44.84% 2.15%
Temple Lower Bucks 5 0.52% 1.51% 2.46% 2.38% 38.97% 7.49%
Warminster 1, 5, 10, 13, 14 -10.03% -6.21% -3.60% 2.34% 46.87% 5.73%
See footnotes on pages 42 and 43.
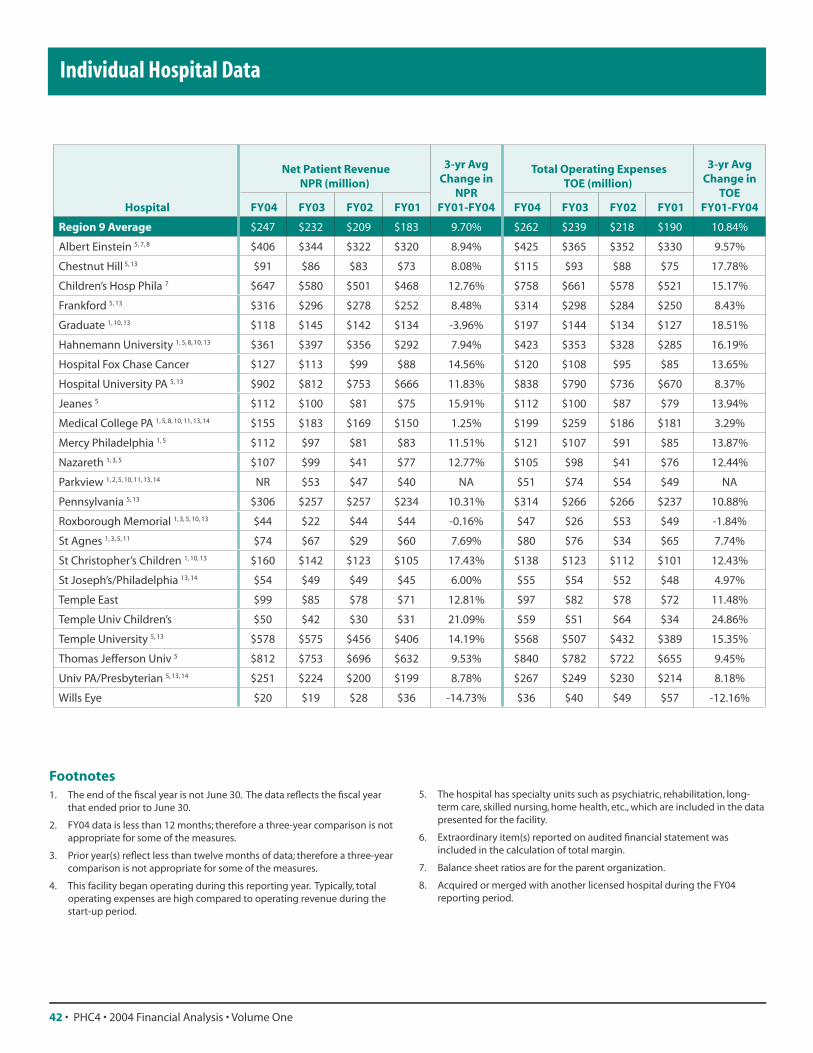
42 • PHC4 • 2004 Financial Analysis • Volume One
Individual Hospital Data
PHC4 • 2004 Financial Analysis • Volume One • 43
Individual Hospital Data
Footnotes1. The end of the fiscal year is not June 30. The data reflects the fiscal year
that ended prior to June 30.
2. FY04 data is less than 12 months; therefore a three-year comparison is not appropriate for some of the measures.
3. Prior year(s) reflect less than twelve months of data; therefore a three-year comparison is not appropriate for some of the measures.
4. This facility began operating during this reporting year. Typically, total operating expenses are high compared to operating revenue during the start-up period.
5. The hospital has specialty units such as psychiatric, rehabilitation, long-term care, skilled nursing, home health, etc., which are included in the data presented for the facility.
6. Extraordinary item(s) reported on audited financial statement was included in the calculation of total margin.
7. Balance sheet ratios are for the parent organization.
8. Acquired or merged with another licensed hospital during the FY04 reporting period.
Hospital
Net Patient RevenueNPR (million)
3-yr Avg Change in
NPRFY01-FY04
Total Operating ExpensesTOE (million)
3-yr Avg Change in
TOEFY01-FY04 FY04 FY03 FY02 FY01 FY04 FY03 FY02 FY01
Region 9 Average $247 $232 $209 $183 9.70% $262 $239 $218 $190 10.84%
Albert Einstein 5, 7, 8 $406 $344 $322 $320 8.94% $425 $365 $352 $330 9.57%
Chestnut Hill 5, 13 $91 $86 $83 $73 8.08% $115 $93 $88 $75 17.78%
Children’s Hosp Phila 7 $647 $580 $501 $468 12.76% $758 $661 $578 $521 15.17%
Frankford 5, 13 $316 $296 $278 $252 8.48% $314 $298 $284 $250 8.43%
Graduate 1, 10, 13 $118 $145 $142 $134 -3.96% $197 $144 $134 $127 18.51%
Hahnemann University 1, 5, 8, 10, 13 $361 $397 $356 $292 7.94% $423 $353 $328 $285 16.19%
Hospital Fox Chase Cancer $127 $113 $99 $88 14.56% $120 $108 $95 $85 13.65%
Hospital University PA 5, 13 $902 $812 $753 $666 11.83% $838 $790 $736 $670 8.37%
Jeanes 5 $112 $100 $81 $75 15.91% $112 $100 $87 $79 13.94%
Medical College PA 1, 5, 8, 10, 11, 13, 14 $155 $183 $169 $150 1.25% $199 $259 $186 $181 3.29%
Mercy Philadelphia 1, 5 $112 $97 $81 $83 11.51% $121 $107 $91 $85 13.87%
Nazareth 1, 3, 5 $107 $99 $41 $77 12.77% $105 $98 $41 $76 12.44%
Parkview 1, 2, 5, 10, 11, 13, 14 NR $53 $47 $40 NA $51 $74 $54 $49 NA
Pennsylvania 5, 13 $306 $257 $257 $234 10.31% $314 $266 $266 $237 10.88%
Roxborough Memorial 1, 3, 5, 10, 13 $44 $22 $44 $44 -0.16% $47 $26 $53 $49 -1.84%
St Agnes 1, 3, 5, 11 $74 $67 $29 $60 7.69% $80 $76 $34 $65 7.74%
St Christopher’s Children 1, 10, 13 $160 $142 $123 $105 17.43% $138 $123 $112 $101 12.43%
St Joseph’s/Philadelphia 13, 14 $54 $49 $49 $45 6.00% $55 $54 $52 $48 4.97%
Temple East $99 $85 $78 $71 12.81% $97 $82 $78 $72 11.48%
Temple Univ Children’s $50 $42 $30 $31 21.09% $59 $51 $64 $34 24.86%
Temple University 5, 13 $578 $575 $456 $406 14.19% $568 $507 $432 $389 15.35%
Thomas Jefferson Univ 5 $812 $753 $696 $632 9.53% $840 $782 $722 $655 9.45%
Univ PA/Presbyterian 5, 13, 14 $251 $224 $200 $199 8.78% $267 $249 $230 $214 8.18%
Wills Eye $20 $19 $28 $36 -14.73% $36 $40 $49 $57 -12.16%
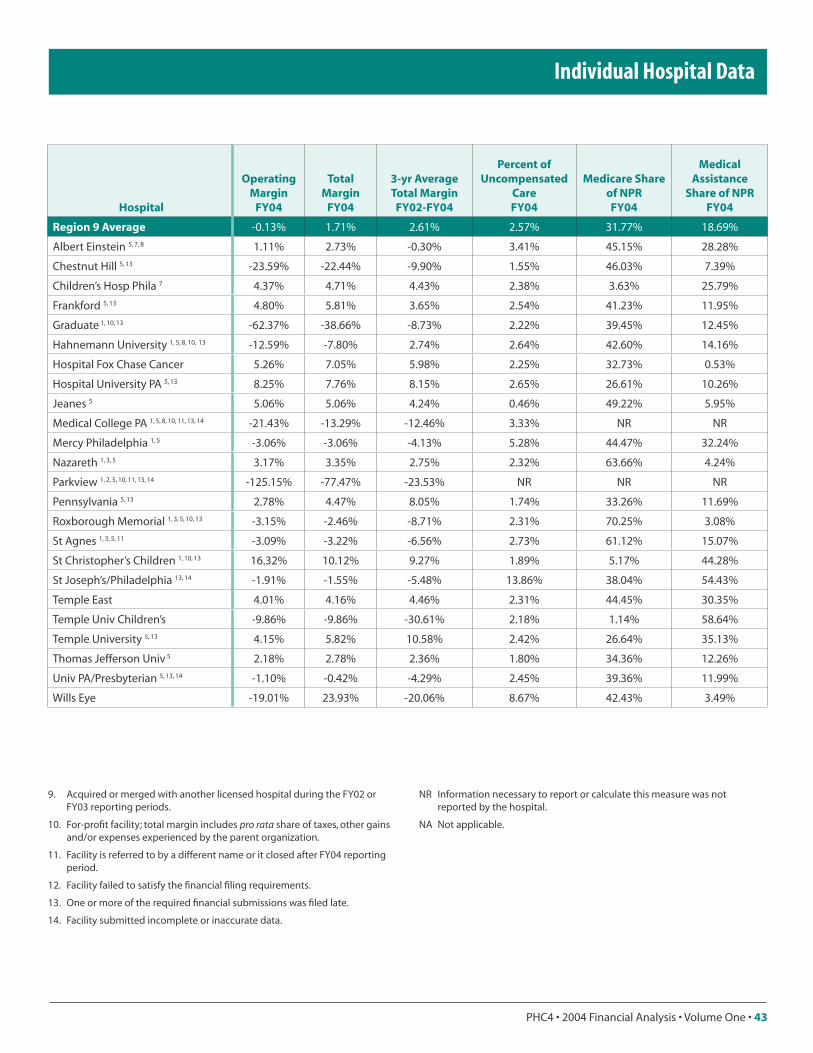
42 • PHC4 • 2004 Financial Analysis • Volume One
Individual Hospital Data
PHC4 • 2004 Financial Analysis • Volume One • 43
Individual Hospital Data
9. Acquired or merged with another licensed hospital during the FY02 or FY03 reporting periods.
10. For-profit facility; total margin includes pro rata share of taxes, other gains and/or expenses experienced by the parent organization.
11. Facility is referred to by a different name or it closed after FY04 reporting period.
12. Facility failed to satisfy the financial filing requirements.
13. One or more of the required financial submissions was filed late.
14. Facility submitted incomplete or inaccurate data.
NR Information necessary to report or calculate this measure was not reported by the hospital.
NA Not applicable.
Hospital
Operating Margin
FY04
Total Margin
FY04
3-yr Average Total Margin
FY02-FY04
Percent of Uncompensated
Care FY04
Medicare Share of NPRFY04
Medical Assistance
Share of NPRFY04
Region 9 Average -0.13% 1.71% 2.61% 2.57% 31.77% 18.69%
Albert Einstein 5, 7, 8 1.11% 2.73% -0.30% 3.41% 45.15% 28.28%
Chestnut Hill 5, 13 -23.59% -22.44% -9.90% 1.55% 46.03% 7.39%
Children’s Hosp Phila 7 4.37% 4.71% 4.43% 2.38% 3.63% 25.79%
Frankford 5, 13 4.80% 5.81% 3.65% 2.54% 41.23% 11.95%
Graduate 1, 10, 13 -62.37% -38.66% -8.73% 2.22% 39.45% 12.45%
Hahnemann University 1, 5, 8, 10, 13 -12.59% -7.80% 2.74% 2.64% 42.60% 14.16%
Hospital Fox Chase Cancer 5.26% 7.05% 5.98% 2.25% 32.73% 0.53%
Hospital University PA 5, 13 8.25% 7.76% 8.15% 2.65% 26.61% 10.26%
Jeanes 5 5.06% 5.06% 4.24% 0.46% 49.22% 5.95%
Medical College PA 1, 5, 8, 10, 11, 13, 14 -21.43% -13.29% -12.46% 3.33% NR NR
Mercy Philadelphia 1, 5 -3.06% -3.06% -4.13% 5.28% 44.47% 32.24%
Nazareth 1, 3, 5 3.17% 3.35% 2.75% 2.32% 63.66% 4.24%
Parkview 1, 2, 5, 10, 11, 13, 14 -125.15% -77.47% -23.53% NR NR NR
Pennsylvania 5, 13 2.78% 4.47% 8.05% 1.74% 33.26% 11.69%
Roxborough Memorial 1, 3, 5, 10, 13 -3.15% -2.46% -8.71% 2.31% 70.25% 3.08%
St Agnes 1, 3, 5, 11 -3.09% -3.22% -6.56% 2.73% 61.12% 15.07%
St Christopher’s Children 1, 10, 13 16.32% 10.12% 9.27% 1.89% 5.17% 44.28%
St Joseph’s/Philadelphia 13, 14 -1.91% -1.55% -5.48% 13.86% 38.04% 54.43%
Temple East 4.01% 4.16% 4.46% 2.31% 44.45% 30.35%
Temple Univ Children’s -9.86% -9.86% -30.61% 2.18% 1.14% 58.64%
Temple University 5, 13 4.15% 5.82% 10.58% 2.42% 26.64% 35.13%
Thomas Jefferson Univ 5 2.18% 2.78% 2.36% 1.80% 34.36% 12.26%
Univ PA/Presbyterian 5, 13, 14 -1.10% -0.42% -4.29% 2.45% 39.36% 11.99%
Wills Eye -19.01% 23.93% -20.06% 8.67% 42.43% 3.49%
44 • PHC4 • 2004 Financial Analysis • Volume One PHC4 • 2004 Financial Analysis • Volume One • 45
NOTE: Utilization and financial data include subunits of a hospital such as skilled nursing, long-term care, rehabilitation and psychiat-ric. Utilization data excludes routine newborn care; the mother and routine newborn are presented as a single patient.
Commercial Third-Party Payors: Commercial insurers encom-pass all indemnity and managed care health insurance plans, including Blue Cross and Blue Shield plans, and hospital and health care system plans. Does not include government-funded programs such as Medicare or Medical Assistance sponsored managed care.
Discharges: The total inpatient discharges that occurred during the fiscal year.
Net Patient Revenue (NPR): Net patient revenue reflects revenue for patient care only and does not include revenue from other operations such as the cafeteria, parking, rent, research and educational activities. Revenue from those operations is in-cluded in total operating revenue. NPR may include retroactive adjustments from third-party payors for care provided during a prior fiscal year.
Other Third-Party Payors: Third-party payors other than health insurance companies and managed care organizations. These include direct payments by employers or associations, auto insurance, workers’ compensation, and government programs (other than Medicare and Medical Assistance).
Operating Income: The amount by which total operating rev-enue exceeds total operating expenses.
(total operating revenue – total operating expenses)
Operating Margin: The ratio of operating income to total operating revenue. This measure places operating income in perspective with the volume of business realized by the hospital.
(operating income / total operating revenue)
Outpatient Visits: The number of visits to the individual outpa-tient units of the hospital during the fiscal year. Outpatient visits do not reflect visits made by hospital staff to patients’ homes.
Patient Days: Each day a patient stays in an inpatient facility is considered a patient day.
Percent of Uncompensated Care: This is the ratio of uncom-pensated care (charity care and bad debt) to the total care pro-vided by the hospital. Charity care is the care a hospital provides without charge because the patient is unable to compensate the hospital through third-party coverage or the patient’s own resources. Bad debt represents the foregone revenue for care in which the hospital initially anticipated payment, extended
credit to the patient, but was later determined to be uncollect-able. This rate can be used to express uncompensated care as a percent of total charges or as an estimate of the percent of total net patient revenue.
(charity care charges + bad debt charges) / total charges
Three-year Average Change in Net Patient Revenue (NPR) or Total Operating Expenses (TOE): The average annual change in the hospital’s NPR or TOE that occurred from the end of FY01 through FY04.
(((NPR04
– NPR01
) / NPR01
) / 3) or (((TOE04
– TOE01
) / TOE01
) / 3)
Three-year Average Total Margin: The average total margin realized by the hospital during FY02 through FY04.
(Σ revenue over expenses 04, 03, 02
/ Σ total revenue 04, 03, 02
)
Total Net Income (Revenue over Expenses): Total net income reflects the sum of operating income and non-operating in-come. Total income may also include an extraordinary item such as the gain or loss from the sale of securities.
For the for-profit hospitals, total net income is net of a pro rata share of income taxes, gains and non-operating expenses incurred by the parent corporation.
Total Margin: The ratio of total income to total revenue. This measure puts income from all sources in perspective with all revenues received by a hospital.
(revenue over expenses / total revenue)
Total Operating Expenses (TOE): All costs associated with operating the entire facility such as salaries, professional fees, supplies, depreciation, interest, insurance, and bad debts. The acquisition of durable equipment and other property are not considered expenses and are reflected on the hospital’s balance sheet as assets. However, the cost to finance equipment (inter-est) as well as the depreciation, operation and maintenance costs of capital equipment are operating expenses.
Total Operating Revenue (TOR): All revenues allocated by the hospital to meet operating expenses. Includes revenue sources such as net patient revenue, investment income, contributions, and revenue from other operations (e.g., cafeteria, parking, rent, research and educational activities). Individual hospitals may also allocate investment income, contributions, etc., as non-op-erating income.
Total Revenue: Operating revenue plus non-operating income. The non-operating income component typically includes unre-stricted contributions, investment income, and net investment gains and losses on marketable securities.
Explanation of Terms

44 • PHC4 • 2004 Financial Analysis • Volume One PHC4 • 2004 Financial Analysis • Volume One • 45
Hospitals with Fiscal Year-End other than 6/30/04
Ashland Regional ....................................................... 12/31/2003
Bariatric Care Centers................................................ 12/31/2003
Barnes Kasson County .................................................9/30/2003
Berwick........................................................................... 12/31/2003
Bon Secours Holy Family ............................................8/31/2003
Brandywine .................................................................. 12/31/2003
Carlisle Regional ............................................................9/30/2003
Central Montgomery ................................................ 12/31/2003
Community Lancaster .................................................9/30/2003
Easton............................................................................. 12/31/2003
Elkins Park ..................................................................... 12/31/2003
Graduate........................................................................ 12/31/2003
Hahnemann University ............................................ 12/31/2003
Hazleton General........................................................ 12/31/2003
Hazleton St Joseph .................................................... 12/31/2003
Jennersville Regional ................................................ 12/31/2003
Lancaster Regional........................................................9/30/2003
Lock Haven ................................................................... 12/31/2003
Medical College PA .................................................... 12/31/2003
Mercy Fitzgerald ......................................................... 12/31/2003
Mercy Jeannette ......................................................... 12/31/2003
Mercy Philadelphia .................................................... 12/31/2003
Mercy Pittsburgh........................................................ 12/31/2003
Mercy Providence....................................................... 12/31/2003
Mercy/Scranton .......................................................... 12/31/2003
Mercy Suburban ......................................................... 12/31/2003
Mercy/Wilkes-Barre ................................................... 12/31/2003
Montrose General ...................................................... 12/31/2003
Nazareth ........................................................................ 12/31/2003
Parkview ........................................................................ 12/31/2003
Roxborough Memorial ............................................. 12/31/2003
St Agnes......................................................................... 12/31/2003
St Christopher’s Children......................................... 12/31/2003
St Mary ........................................................................... 12/31/2003
Warminster ................................................................... 12/31/2003
Non-Compliant Hospitals - Late Submissions
The following hospitals were not in compliance with one or more of PHC4’s filing requirements (audited financial statements or the financial data submitted on the website) at the filing deadline.
Abington Memorial
Aliquippa Community
Bloomsburg
Bradford Regional
Brownsville General
Bucktail
Charles Cole Memorial
Chestnut Hill
Clarion
Community Lancaster
Corry Memorial
Crozer-Chester
Delaware County Memorial
Easton
Elk Regional
Ellwood City
Frankford
Fulton County
Geisinger Wyoming Valley
Good Samaritan/Lebanon
Graduate
Hahnemann University
Holy Spirit
Hospital University PA
Indiana Regional
J C Blair Memorial
Jennersville Regional
Kane Community
Lancaster General
Lancaster Regional
Marian Community
Medical College PA
Memorial/Towanda
Memorial York
Mid-Valley
Monongahela Valley
Ohio Valley General
Parkview
Pennsylvania
Philipsburg Area
Phoenixville
Pottstown Memorial
Reading
Roxborough Memorial
St Joseph’s/Philadelphia
Saint Vincent Health
Soldiers & Sailors
St Christopher’s Children
St Mary
Temple University
Tyler Memorial
Tyrone
Univ PA/Presbyterian
UPMC Braddock
UPMC Lee Regional
UPMC South Side
Warminster
Warren General
WVHCS

FOR MORE INFORMATIONAdditional fi nancial and utilization data for Fiscal Year 2004 and prior years may be purchased.
For more information, contact PHC4’s Data Requests Unit. The information contained in this
report and other PHC4 publications are available on our Web site www. phc4.org.
Pennsylvania Health Care Cost Containment Council
Marc P. Volavka, Executive Director225 Market Street, Suite 400
Harrisburg, PA 17101Phone: 717-232-6787
Fax: 717-232-3821
www.phc4.org