2005-2009 estimate roxbury - african...
TRANSCRIPT

Neighborhood*
Roxbury
American Community Survey 2005-2009 Estimate
June 2011
*These geographies are based on Zip Codes and zoning boundaries

Prepared by: Boston Redevelopment Authority Research Division Mark Melnik Nicoya Borella Alvaro Lima Director of Research
Assistance provided by the Office of Digital Cartography and GIS
About the American Community Survey
The American Community Survey (ACS) is an annual survey conducted by the US Census Bureau. The ACS asks a host of demographic, economic, and housing related questions that were historically associated with the now discontinued long-form of the Census. The ACS is a sample of the total population. As a result, the data are subject to sampling error. All counts displayed in the ACS are estimates with a plus/minus factor for all counts and percentages. Additionally, because of the small sample sizes of the ACS, it is not possible to estimate characteristics for small geographies with the one-year data collections. In order to look at small areas within a city, such as neighborhoods, data users need to use the 5-year ACS estimates. The first 5-year estimates (2005-2009) for the ACS are now available and are the basis of this report. It is important to note that the 2005-2009 ACS data are not Census counts, but rather estimates of population characteristics. As a result, counts estimated in this report will not match those corresponding population counts observed in the 2010 Census. Please note that subcategory percentages in this report reflect the percentage within the category it is associated with and not the percent within the total. Major categories are typically highlighted in red in this report. Subcategories are distinguished by indented text. All analyses in this report were done by the BRA Research Division. The proper sourcing of this material
is: 2005-2009 American Community Survey, BRA Research Analysis
Page 3
Table of Contents Demographic Characteristics 4
Total Population 4
Race/Ethnicity 4
Age 4
Place of Birth by Citizenship Status 5
Citizenship Status by Year of Entry in the United States 5
Place of Birth for the Foreign-Born Population 6
Language Spoken at Home 6
Linguistic Isolation by Household Language 7
Marital Status by Sex 7
Presence and Age of Own Children by Family Type 8
Presence and Age of Related Children by Family Type 8
Educational Attainment by Sex 9
Household Population 9
Average Household Size 9
Economic Characteristics 10
Employment Status 10
Work Status by Sex 10
Class of Worker 10
Industry for the Civilian Employed Population 11
Occupation for the Civilian Employed Population 11
Family Poverty Status 12
Per Capita Income 13
Median Household Income 13
Household Income 13
Gross Rent as a Percentage of Household Income 14
Housing Characteristics 15
Housing Units 15
Occupancy Status 15
Tenure 15
Vacancy Status 15
Page 4
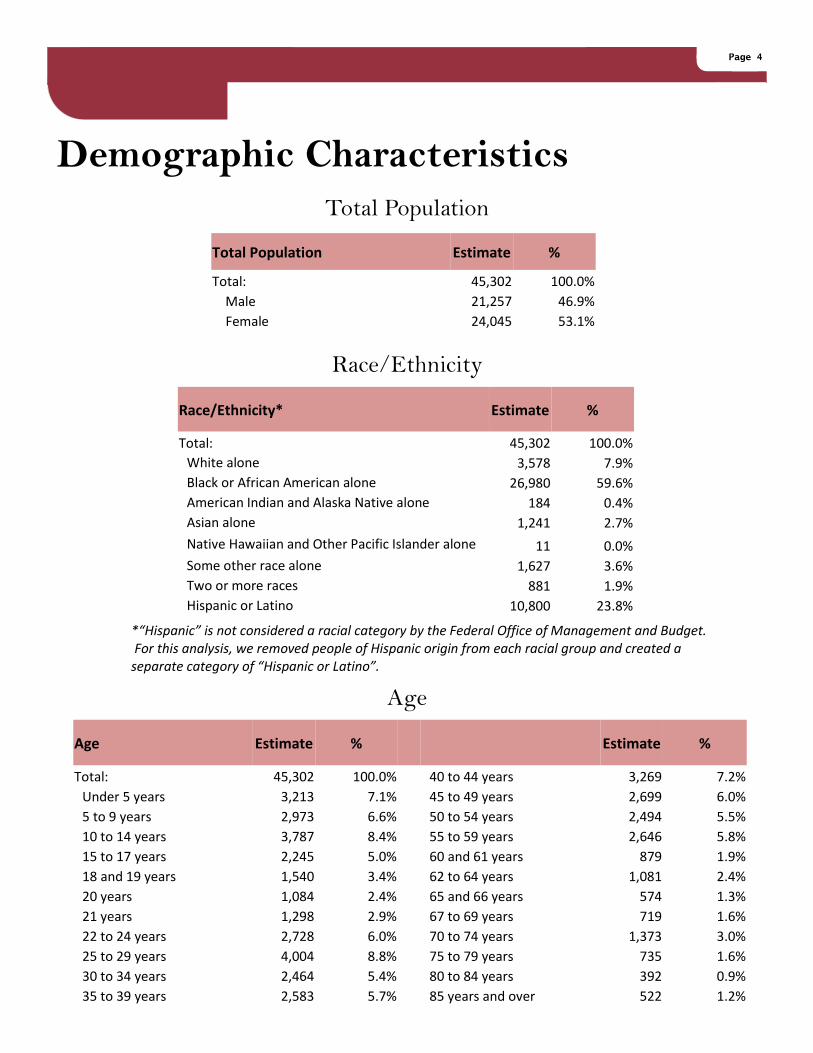
Demographic Characteristics
Total Population
Race/Ethnicity
Age
*“Hispanic” is not considered a racial category by the Federal Office of Management and Budget. For this analysis, we removed people of Hispanic origin from each racial group and created a separate category of “Hispanic or Latino”.
Total Population Estimate %
Total: 45,302 100.0%
Male 21,257 46.9%
Female 24,045 53.1%
Age Estimate % Estimate %
Total: 45,302 100.0% 40 to 44 years 3,269 7.2%
Under 5 years 3,213 7.1% 45 to 49 years 2,699 6.0%
5 to 9 years 2,973 6.6% 50 to 54 years 2,494 5.5%
10 to 14 years 3,787 8.4% 55 to 59 years 2,646 5.8%
15 to 17 years 2,245 5.0% 60 and 61 years 879 1.9%
18 and 19 years 1,540 3.4% 62 to 64 years 1,081 2.4%
20 years 1,084 2.4% 65 and 66 years 574 1.3%
21 years 1,298 2.9% 67 to 69 years 719 1.6%
22 to 24 years 2,728 6.0% 70 to 74 years 1,373 3.0%
25 to 29 years 4,004 8.8% 75 to 79 years 735 1.6%
30 to 34 years 2,464 5.4% 80 to 84 years 392 0.9%
35 to 39 years 2,583 5.7% 85 years and over 522 1.2%
Race/Ethnicity* Estimate %
Total: 45,302 100.0%
White alone 3,578 7.9%
Black or African American alone 26,980 59.6%
American Indian and Alaska Native alone 184 0.4%
Asian alone 1,241 2.7%
Native Hawaiian and Other Pacific Islander alone 11 0.0%
Some other race alone 1,627 3.6%
Two or more races 881 1.9%
Hispanic or Latino 10,800 23.8%

Page 5
Place of Birth by Citizenship Status
Citizenship Status by Year of Entry in the United States
* Born in Puerto Rico, the U.S. Island Areas, or born abroad of American parent(s)
Place of Birth by Citizenship Status Estimate %
Total: 45,302 100.0%
Native: 34,504 76.2%
Born in Massachusetts 24,539 71.1%
Born in other state in the United States: 8,010 23.2%
Northeast 2,516 31.4%
Midwest 433 5.4%
South 4,603 57.5%
West 458 5.7%
Born outside the United States: 1,955 5.7%
Puerto Rico 1,702 87.1%
U.S. Island Areas 76 3.9%
Born abroad of American parent(s) 177 9.1%
Foreign born: 10,798 23.8%
Naturalized U.S. citizen 4,672 43.3%
Not a U.S. citizen 6,126 56.7%
Citizenship Status by Year of Entry in the US Estimate %
Total Population Born Outside the United States: 12,753 100.0%
Entered 2000 or later: 2,900 22.7%
Native* 492 17.0%
Foreign born: 2,408 83.0%
Naturalized U.S. citizen 233 9.7%
Not a U.S. citizen 2,175 90.3%
Entered 1990 to 1999: 4,298 33.7%
Native* 443 10.3%
Foreign born: 3,855 89.7%
Naturalized U.S. citizen 1,645 42.7%
Not a U.S. citizen 2,210 57.3%
Entered 1980 to 1989: 2,860 22.4%
Native* 322 11.3%
Foreign born: 2,538 88.7%
Naturalized U.S. citizen 1,404 55.3%
Not a U.S. citizen 1,134 44.7%
Entered before 1980: 2,695 21.1%
Native* 698 25.9%
Foreign born: 1,997 74.1%
Naturalized U.S. citizen 1,390 69.6%
Not a U.S. citizen 607 30.4%

Page 6
Language Spoken at Home Place of Birth for the Foreign-Born Population
Language Spoken at Home by Age for the Population 5 Years and Over
Estimate %
Total: 42,089 100.0%
5 to 17 years: 9,005 21.4%
Speak only English 5,633 62.6%
Speak Spanish 2,161 24.0%
Speak other Indo-European languages 915 10.2%
Speak Asian and Pacific Island languages 132 1.5%
Speak other languages 164 1.8%
18 to 64 years: 28,769 68.4%
Speak only English 17,403 60.5%
Speak Spanish 6,589 22.9%
Speak other Indo-European languages 3,204 11.1%
Speak Asian and Pacific Island languages 615 2.1%
Speak other languages 958 3.3%
65 years and over: 4,315 10.3%
Speak only English 3,071 71.2%
Speak Spanish 747 17.3%
Speak other Indo-European languages 472 10.9%
Speak Asian and Pacific Island languages - 0.0%
Speak other languages 25 0.6%
Place of Birth for the Foreign-Born Population (Top 20 Countries)
Estimate %
Total: 10,798 100.0%
Dominican Republic 2,256 20.9%
Haiti 1,249 11.6%
Cape Verde 801 7.4%
Trinidad and Tobago 626 5.8%
Jamaica 574 5.3%
Honduras 421 3.9%
China 386 3.6%
Barbados 371 3.4%
Nigeria 312 2.9%
Ethiopia 294 2.7%
Guatemala 238 2.2%
Vietnam 219 2.0%
Brazil 151 1.4%
El Salvador 148 1.4%
India 116 1.1%
Panama 115 1.1%
Canada 112 1.0%
Venezuela 101 0.9%
Costa Rica 96 0.9%
Guyana 83 0.8%

Page 7
Marital Status by Sex
Linguistic Isolation by Household Language*
* Linguistically isolated households are those in which no person over the age of 14 can speak English
Marital Status by Sex for the Population 15 Years and Over
Estimate %
Total: 35,329 100.0%
Male: 16,308 46.2%
Never married 9,973 61.2%
Now married: 4,305 26.4%
Married, spouse present 2,429 56.4%
Married, spouse absent: 1,876 43.6%
Separated 792 42.2%
Other 1,084 57.8%
Widowed 528 3.2%
Divorced 1,502 9.2%
Female: 19,021 53.8%
Never married 10,530 55.4%
Now married: 4,829 25.4%
Married, spouse present 2,469 51.1%
Married, spouse absent: 2,360 48.9%
Separated 1,456 61.7%
Other 904 38.3%
Widowed 1,534 8.1%
Divorced 2,128 11.2%
Linguistic Isolation by Household Language Estimate %
Total: 15,322 100.0%
English only 9,087 59.3%
Spanish: 3,795 24.8%
Linguistically isolated 1,232 32.5%
Not linguistically isolated 2,563 67.5%
Other Indo-European languages: 1,731 11.3%
Linguistically isolated 455 26.3%
Not linguistically isolated 1,276 73.7%
Asian and Pacific Island languages: 250 1.6%
Linguistically isolated 128 51.2%
Not linguistically isolated 122 48.8%
Other languages: 459 3.0%
Linguistically isolated 118 25.7%
Not linguistically isolated 341 74.3%
Page 8
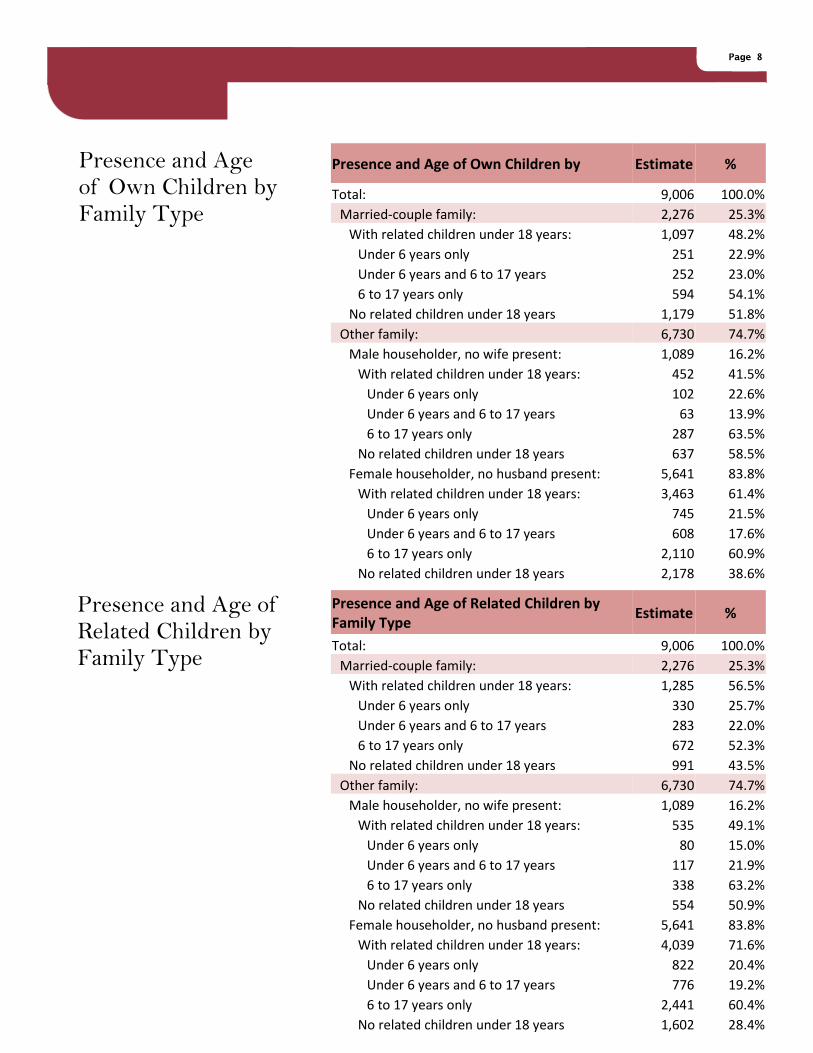
Presence and Age of Own Children by Family Type
Presence and Age of Related Children by Family Type
Presence and Age of Related Children by Family Type
Estimate %
Total: 9,006 100.0%
Married-couple family: 2,276 25.3%
With related children under 18 years: 1,285 56.5%
Under 6 years only 330 25.7%
Under 6 years and 6 to 17 years 283 22.0%
6 to 17 years only 672 52.3%
No related children under 18 years 991 43.5%
Other family: 6,730 74.7%
Male householder, no wife present: 1,089 16.2%
With related children under 18 years: 535 49.1%
Under 6 years only 80 15.0%
Under 6 years and 6 to 17 years 117 21.9%
6 to 17 years only 338 63.2%
No related children under 18 years 554 50.9%
Female householder, no husband present: 5,641 83.8%
With related children under 18 years: 4,039 71.6%
Under 6 years only 822 20.4%
Under 6 years and 6 to 17 years 776 19.2%
6 to 17 years only 2,441 60.4%
No related children under 18 years 1,602 28.4%
Presence and Age of Own Children by Estimate %
Total: 9,006 100.0%
Married-couple family: 2,276 25.3%
With related children under 18 years: 1,097 48.2%
Under 6 years only 251 22.9%
Under 6 years and 6 to 17 years 252 23.0%
6 to 17 years only 594 54.1%
No related children under 18 years 1,179 51.8%
Other family: 6,730 74.7%
Male householder, no wife present: 1,089 16.2%
With related children under 18 years: 452 41.5%
Under 6 years only 102 22.6%
Under 6 years and 6 to 17 years 63 13.9%
6 to 17 years only 287 63.5%
No related children under 18 years 637 58.5%
Female householder, no husband present: 5,641 83.8%
With related children under 18 years: 3,463 61.4%
Under 6 years only 745 21.5%
Under 6 years and 6 to 17 years 608 17.6%
6 to 17 years only 2,110 60.9%
No related children under 18 years 2,178 38.6%

Page 9
Educational Attainment by Sex
Household Population
Average Household Size
Educational Attainment for Population 25 Years and Over
Estimate %
Total: 26,434 100.0%
Male: 11,963 45.3%
Less than high school diploma 3,643 30.5%
High school graduate, GED, or alternative 3,493 29.2%
Some college or associates degree 2,482 20.7%
Bachelor's degree or higher 2,345 19.6%
Female: 14,471 54.7%
Less than high school diploma 3,288 22.7%
High school graduate, GED, or alternative 4,134 28.6%
Some college or associates degree 4,125 28.5%
Bachelor's degree or higher 2,924 20.2%
Average Household Size Estimate
Total: 2.8
Owner Occupied 3.2
Renter Occupied 2.7
Population by Household Type Estimate %
Total: 45,302 100.0%
In households: 43,304 95.6%
In family households 34,508 79.7%
In nonfamily households 8,796 20.3%
In group quarters 1,998 4.4%

Page 10
Economic Characteristics
Employment Status
Class of Worker
Work Status by Sex
Employment Status for the Population 16 Years and Over
Estimate %
Total: 34,682 100.0%
In labor force: 20,707 59.7%
In Armed Forces - 0.0%
Civilian: 20,707 100.0%
Employed 17,704 85.5%
Unemployed 3,003 14.5%
Not in labor force 13,975 40.3%
Work Status in the Past 12 Months for Population 16-64 Years
Estimate %
Total: 30,367 100.0%
Male: 14,231 46.9%
Worked in the past 12 months 10,147 71.3%
Did not work in the past 12 months 4,084 28.7%
Female: 16,136 53.1%
Worked in the past 12 months 11,600 71.9%
Did not work in the past 12 months 4,536 28.1%
Class of Worker for the Civilian Employed Population 16 Years and Over
Estimate %
Total: 17,704 100.0%
Private for-profit wage and salary workers: 11,760 66.4%
Employee of private company workers 11,613 98.8%
Self-employed in own incorporated business workers 147 1.3%
Private not-for-profit wage and salary workers 2,962 16.7%
Local government workers 1,564 8.8%
State government workers 700 4.0%
Federal government workers 297 1.7%
Self-employed in own not incorporated business workers 421 2.4%
Unpaid family workers - 0.0%

Page 11
Industry for the Civilian Employed Population
Occupation for the Civilian Employed Population
Industry for the Civilian Employed Population 16 Years and Over Estimate %
Total: 17,704 100.0%
Agriculture, forestry, fishing and hunting, and mining 121 0.7%
Construction 513 2.9%
Manufacturing 726 4.1%
Wholesale trade 209 1.2%
Retail trade 2,278 12.9%
Transportation and warehousing, and utilities 795 4.5%
Information 494 2.8%
Finance and insurance, and real estate and rental and leasing 1,242 7.0%
Professional, scientific, and management, and administrative and waste management services 1,733 9.8%
Educational services, and health care and social assistance 5,685 32.1%
Arts, entertainment, and recreation, and accommodation and food services 1,582 8.9%
Other services, except public administration 1,442 8.1%
Public administration 884 5.0%
Occupation for the Civilian Employed Population 16 Years and Over Estimate %
Total: 17,704 100.0%
Management, professional, and related occupations: 5,173 29.2%
Management, business, and financial occupations 1,588 30.7%
Professional and related occupations 3,585 69.3%
Service occupations: 4,800 27.1%
Healthcare support occupations 919 19.1%
Protective service occupations 652 13.6%
Food preparation and serving related occupations 829 17.3%
Building and grounds cleaning and maintenance occupations 1,550 32.3%
Personal care and service occupations 850 17.7%
Sales and office occupations: 5,265 29.7%
Sales and related occupations 2,437 46.3%
Office and administrative support occupations 2,828 53.7%
Farming, fishing, and forestry occupations 8 0.0%
Construction, extraction, maintenance, and repair occupations: 749 4.2%
Construction and extraction occupations 371 49.5%
Installation, maintenance, and repair occupations 378 50.5%
Production, transportation, and material moving occupations: 1,709 9.7%
Production occupations 489 28.6%
Transportation and material moving occupations 1,220 71.4%
Page 12
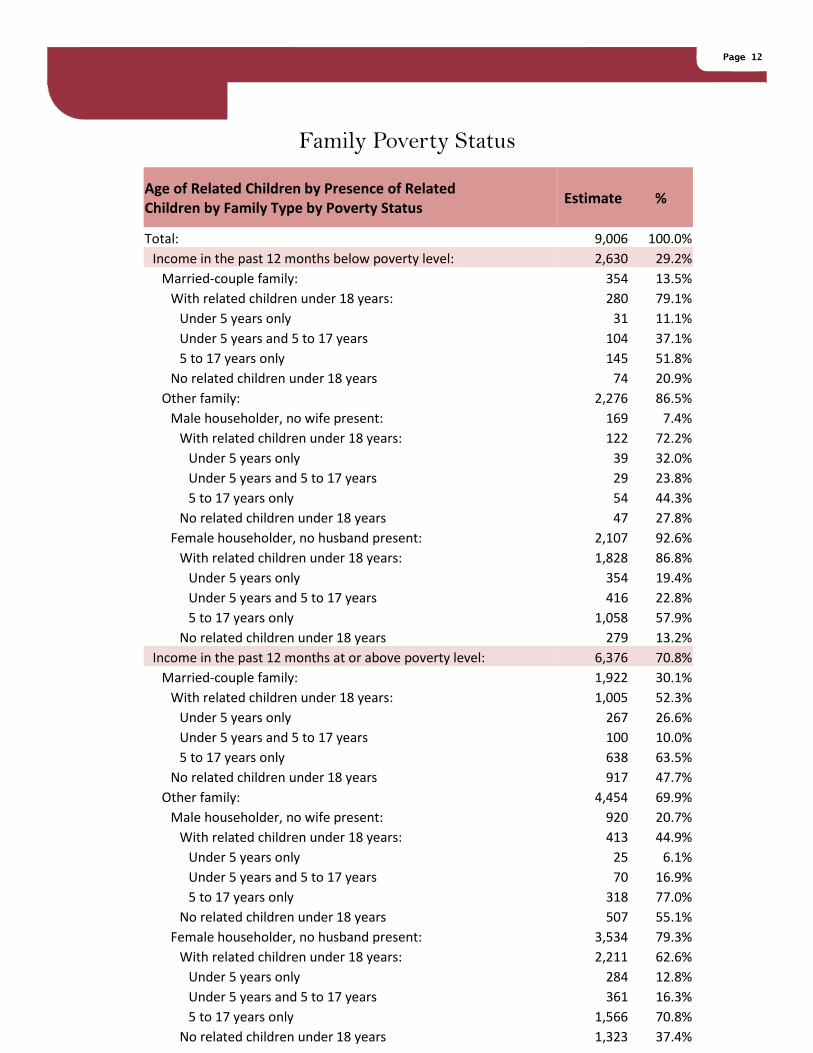
Family Poverty Status
Age of Related Children by Presence of Related Children by Family Type by Poverty Status
Estimate %
Total: 9,006 100.0%
Income in the past 12 months below poverty level: 2,630 29.2%
Married-couple family: 354 13.5%
With related children under 18 years: 280 79.1%
Under 5 years only 31 11.1%
Under 5 years and 5 to 17 years 104 37.1%
5 to 17 years only 145 51.8%
No related children under 18 years 74 20.9%
Other family: 2,276 86.5%
Male householder, no wife present: 169 7.4%
With related children under 18 years: 122 72.2%
Under 5 years only 39 32.0%
Under 5 years and 5 to 17 years 29 23.8%
5 to 17 years only 54 44.3%
No related children under 18 years 47 27.8%
Female householder, no husband present: 2,107 92.6%
With related children under 18 years: 1,828 86.8%
Under 5 years only 354 19.4%
Under 5 years and 5 to 17 years 416 22.8%
5 to 17 years only 1,058 57.9%
No related children under 18 years 279 13.2%
Income in the past 12 months at or above poverty level: 6,376 70.8%
Married-couple family: 1,922 30.1%
With related children under 18 years: 1,005 52.3%
Under 5 years only 267 26.6%
Under 5 years and 5 to 17 years 100 10.0%
5 to 17 years only 638 63.5%
No related children under 18 years 917 47.7%
Other family: 4,454 69.9%
Male householder, no wife present: 920 20.7%
With related children under 18 years: 413 44.9%
Under 5 years only 25 6.1%
Under 5 years and 5 to 17 years 70 16.9%
5 to 17 years only 318 77.0%
No related children under 18 years 507 55.1%
Female householder, no husband present: 3,534 79.3%
With related children under 18 years: 2,211 62.6%
Under 5 years only 284 12.8%
Under 5 years and 5 to 17 years 361 16.3%
5 to 17 years only 1,566 70.8%
No related children under 18 years 1,323 37.4%

Page 13
Household Income (In 2009 Inflation-Adjusted Dollars)
Per Capita Income Median Household Income
Per Capita Income Estimate
Per Capita Income in the Past 12 Months (in 2009 inflation-adjusted dollars) $ 17,162
Household Income in the Past 12 Months Estimate %
Total: 15,322 100.0%
Less than $10,000 3,434 22.4%
$10,000 to $14,999 1,563 10.2%
$15,000 to $19,999 1,358 8.9%
$20,000 to $24,999 757 4.9%
$25,000 to $29,999 1,002 6.5%
$30,000 to $34,999 808 5.3%
$35,000 to $39,999 394 2.6%
$40,000 to $44,999 700 4.6%
$45,000 to $49,999 616 4.0%
$50,000 to $59,999 998 6.5%
$60,000 to $74,999 1,194 7.8%
$75,000 to $99,999 1,137 7.4%
$100,000 to $124,999 602 3.9%
$125,000 to $149,999 351 2.3%
$150,000 to $199,999 262 1.7%
$200,000 or more 146 1.0%
Median Household Income Estimate
Median Household Income in the Past 12 Months (in 2009 inflation-adjusted dollars) $ 27,740

Page 14
Gross Rent as a Percentage of Household Income
Gross Rent as a Percentage of Household Income in the Past 12 Months
Estimate %
Estimate %
Total: 11,424 100.0%
Less than $10,000: 3,203 28.0% $50,000 to $74,999: 1,265 11.1%
Less than 20.0 percent 146 4.6% Less than 20.0 percent 438 34.6%
20.0 to 24.9 percent 98 3.1% 20.0 to 24.9 percent 321 25.4%
25.0 to 29.9 percent 363 11.3% 25.0 to 29.9 percent 240 19.0%
30.0 to 34.9 percent 335 10.5% 30.0 to 34.9 percent 149 11.8%
35.0 percent or more 1,838 57.4% 35.0 percent or more 117 9.2%
Not computed 423 13.2% Not computed - 0.0%
$10,000 to $19,999: 2,772 24.3% $75,000 to $99,999: 366 3.2%
Less than 20.0 percent 302 10.9% Less than 20.0 percent 231 63.1%
20.0 to 24.9 percent 274 9.9% 20.0 to 24.9 percent 61 16.7%
25.0 to 29.9 percent 419 15.1% 25.0 to 29.9 percent 36 9.8%
30.0 to 34.9 percent 385 13.9% 30.0 to 34.9 percent 27 7.4%
35.0 percent or more 1,379 49.7% 35.0 percent or more 11 3.0%
Not computed 13 0.5% Not computed - 0.0%
$20,000 to $34,999: 2,156 18.9% $100,000 or more: 512 4.5%
Less than 20.0 percent 408 18.9% Less than 20.0 percent 446 87.1%
20.0 to 24.9 percent 153 7.1% 20.0 to 24.9 percent 55 10.7%
25.0 to 29.9 percent 327 15.2% 25.0 to 29.9 percent 11 2.1%
30.0 to 34.9 percent 214 9.9% 30.0 to 34.9 percent - 0.0%
35.0 percent or more 1,054 48.9% 35.0 percent or more - 0.0%
Not computed - 0.0% Not computed - 0.0%
$35,000 to $49,999: 1,150 10.1%
Less than 20.0 percent 330 28.7%
20.0 to 24.9 percent 206 17.9%
25.0 to 29.9 percent 190 16.5%
30.0 to 34.9 percent 129 11.2%
35.0 percent or more 259 22.5%
Not computed 36 3.1%
Page 15
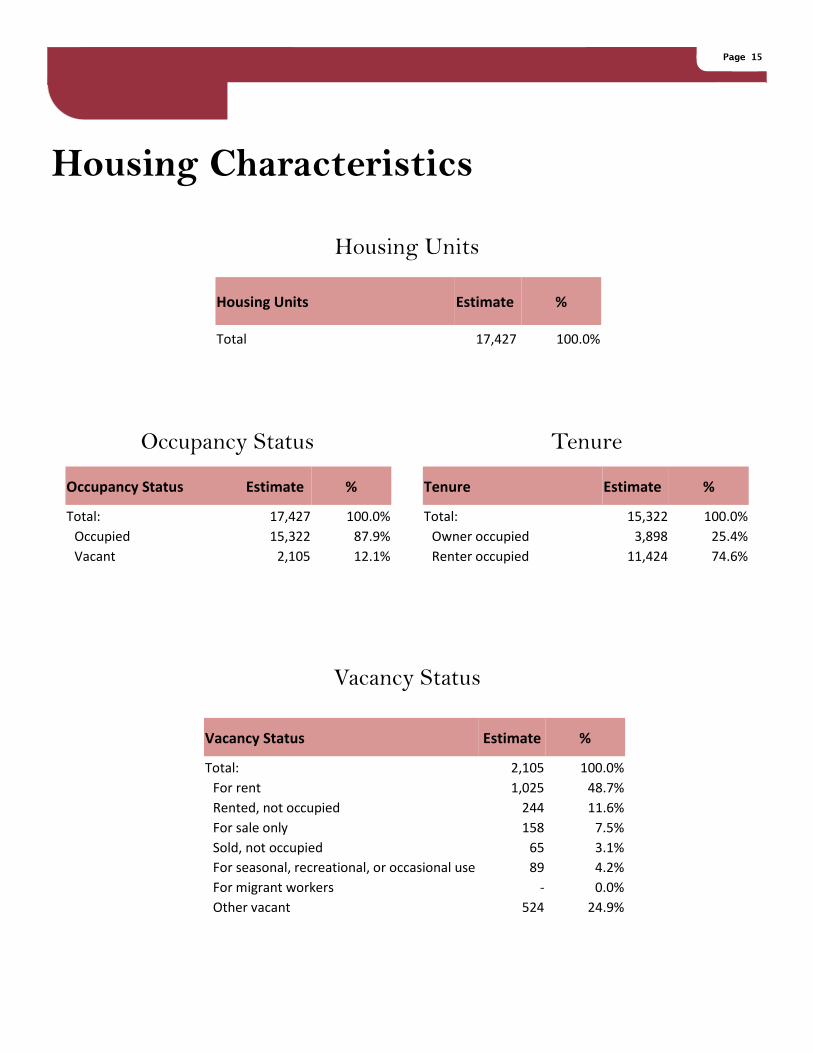
Housing Characteristics
Housing Units
Occupancy Status
Vacancy Status
Tenure
Tenure Estimate %
Total: 15,322 100.0%
Owner occupied 3,898 25.4%
Renter occupied 11,424 74.6%
Vacancy Status Estimate %
Total: 2,105 100.0%
For rent 1,025 48.7%
Rented, not occupied 244 11.6%
For sale only 158 7.5%
Sold, not occupied 65 3.1%
For seasonal, recreational, or occasional use 89 4.2%
For migrant workers - 0.0%
Other vacant 524 24.9%
Occupancy Status Estimate %
Total: 17,427 100.0%
Occupied 15,322 87.9%
Vacant 2,105 12.1%
Housing Units Estimate %
Total 17,427 100.0%