2005 annual report web copy - oconto county, wisconsin · k. pranica (1 fte) public health nurse m....
TRANSCRIPT
1
2005 Annual Report
Oconto County Department of Health and Human Services
2
______________________________________
Department of Health and Human Services …...promoting healthy and responsible families
501 Park Avenue 920-834-7000
Dear Health and Human Services Board Members: As you will see in this report, 2005 was another very active year with expenditures again increasing by almost $1,000,000, which fortunately, is mainly comprised of carry-over funds. These additional funds pay for both the cost to continue services for existing people as well as those for new individuals and families. To provide and coordinate these services, we have a combination of new and experienced staff. As Director of the Oconto County Department of Health and Human Services, what I am most proud of is the professionalism, work ethic, and compassion exhibited by the workers. From managers to public health staff, economic support workers, administrative staff, and social workers, caseloads and the work that comes with them continue to increase and yet, rarely, if ever, do you hear someone complain. Yes, at times they show their frustration and surely there are no saints amongst them, but it is my belief the reason they continue to plug along is knowing they are making a difference by helping families lead better and safer lives. Inside this booklet is a very short synopsis of the accomplishments of the staff and what our budget supported during 2005. One of my responsibilities as Director is, to the best of my ability, to assure the employees adequate resources and support to successfully fulfill their job responsibilities. Fortunately my job has been made easier by having a very supportive Board of Directors and knowing that together with the staff we are striving for the same goals and successful outcomes for Oconto County residents. Thank you for your support, Craig Johnson, Director Oconto County Health and Human Services Director

3
TABLE OF CONTENTS Page ADMINISTRATION Board of Directors/Committees ………………………………………………………………………………………………………………… 1 Program Organizational Chart ………………………………………………………………………………………………………………… 2 Financial Summary ……………………………………………………………………………………………………………………………………… 3 PUBLIC HEALTH DIVISION Organizational Chart …………………………………………………………………………………………………………………………… 4 Financial Summary ……………………………………………………………………………………………………………………………………… 5 Program Activity Graphs …………………………………………………………………………………………………………………………… 6-8 Division Summary ……………………………………………………………………………………………………………………………………… 9 ECONOMIC SUPPORT DIVISION Organizational Chart …………………………………………………………………………………………………………………………… 10-11 Financial Summary ……………………………………………………………………………………………………………………………………… 12 Program Highlights ……………………………………………………………………………………………………………………………………… 13-16 Division Summary ……………………………………………………………………………………………………………………………………… 17 FAMILY SERVICES DIVISION Organizational Chart …………………………………………………………………………………………………………………………… 18 Financial Summary ……………………………………………………………………………………………………………………………………… 19 Program Activity Graphs …………………………………………………………………………………………………………………………… 20-22 Division Summary ……………………………………………………………………………………………………………………………………… 23 COMMUNITY SERVICES DIVISION Organizational Chart …………………………………………………………………………………………………………………………… 24 Financial Summary ……………………………………………………………………………………………………………………………………… 25-26 Program Activity Graph …………………………………………………………………………………………………………………………… 27 Program Activity Table …………………………………………………………………………………………………………………………… 28 Division Summary ……………………………………………………………………………………………………………………………………… 29 VOCATIONAL SERVICES DIVISION Organizational Chart …………………………………………………………………………………………………………………………… 30 Financial Summary ……………………………………………………………………………………………………………………………………… 31 Program Activity Graph …………………………………………………………………………………………………………………………… 32 Division Summary ……………………………………………………………………………………………………………………………………… 33 ADMINISTRATIVE SUPPORT DIVISION Organizational Chart …………………………………………………………………………………………………………………………… 34 Financial Summary ……………………………………………………………………………………………………………………………………… 35

4
VISION
Our Vision is to provide or arrange social, financial, medical and emotional support to the people of Oconto County.
Individuals and families will be treated with respect and
dignity, and ensured the right to privacy.
MISSION
Oconto County Department of Health and Human Services ...promoting healthy and responsible families.

1
OCONTO COUNTY DEPARTMENT OF HEALTH AND HUMAN SERVICES BOARD OF DIRECTORS AND COMMITTEES 2006
Lois Trever, Chair P.O. Box 225 Mountain, WI 54149 Loretta Shellman, Vice Chair P.O. Box 128 Oconto Falls, WI 54154 Kathy Gohr 8811 Gohr Road Krakow, WI 54137 LONG TERM SUPPORT COMMITTEE Gerald Beekman Michele Braski Ruth Carriveau Sue Cota Kathy Gohr William Greasby Jon Hanchett Debra Konitzer Doug Kurek Mike Reimer Alane Roberts Oliver Shallow Jr. Claire Trepanier Lois Trever
Claire Trepanier 139 Messenger Avenue Oconto, WI 54153 Gerald Beekman 1206 Park Avenue Oconto, WI 54153 Carolyn Barke 6048 Highway 32 Gillett, WI 54124 FAMILY SUPPORT ADVISORY COMMITTEE Lynette Bodoh Kim Boucher James Collins Tana Galbreath Claire Janssen Lynn Johnson Debra Konitzer Jane Nowak Michele Olson Robin Peters Alane Roberts Juniper Sundance Tami Tipler Jacquelyn Walske Lori Zuber CLIENT RIGHTS COMMITTEE Marie Bartz Gerald Beekman Kathy Gohr James Schroeder
James E. Schroeder 10357 Hwy 22 & 32 Gillett, WI 54154 Marie Bartz 3009 Chandler Street Abrams, WI 54101 Barb Smith 146 Wallis Street Gillett, WI 54124 W2 COMMUNITY STEERING COMMITTEE Carolyn Barke Marie Bartz Gerald Beekman Kathy Gohr Penny Helmle Craig Johnson James Schroeder Loretta Shellman Barb Smith Claire Trepanier Lois Trever PERSONNEL COMMITTEE Carolyn Barke Loretta Shellman Barb Smith

2
3
$1,389,731 $1,733,965
$355,369 $374,870
$3,542,324
$4,005,381
$8,293,697$8,431,188
$13,581,121
$14,545,404
$0
$2,000,000
$4,000,000
$6,000,000
$8,000,000
$10,000,000
$12,000,000
$14,000,000
$16,000,000
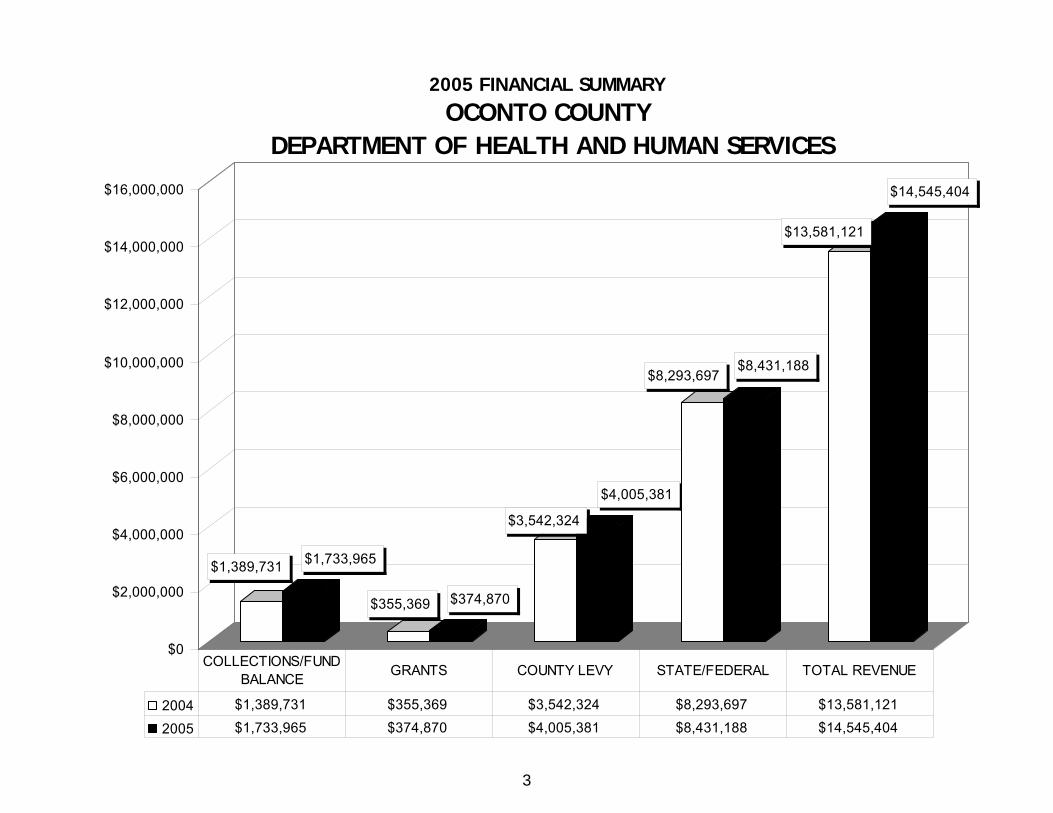
2005 FINANCIAL SUMMARY
OCONTO COUNTY DEPARTMENT OF HEALTH AND HUMAN SERVICES
2004 $1,389,731 $355,369 $3,542,324 $8,293,697 $13,581,121
2005 $1,733,965 $374,870 $4,005,381 $8,431,188 $14,545,404
COLLECTIONS/FUND BALANCE GRANTS COUNTY LEVY STATE/FEDERAL TOTAL REVENUE

4
HEALTH & HUMAN SERVICESPUBLIC HEALTH
Public Health ManagerDebra Konitzer
Case ManagerM. Olson
(1 FTE)
Case ManagerJ. Walske
(1 FTE)
WIC Coordinator/RD(Contracted)
WIC Nutritionist(Contracted)
Public Health NurseC. Luebeck
(1 FTE)
Public Health NurseK. Pranica
(1 FTE)
Public Health NurseM. LeMere
(1 FTE)
Community Health EducatorS. Applebee
(.8 FTE)
Case ManagerL. Bodoh
(1 FTE)
Public Health TechnicianJ. Drews
(.8 FTE)
Healthy Babies(Contracted)
Families First Public Health Programming WIC Program
AUTHORIZED COUNTY POSITIONS: 8COUNTY FTE: 7.6CONTRACTED POSITIONS: 6
Public Health Nurse(Contracted)
Special InstructionTeacher
(Contracted)
Public Health PreparednessCoordinator(Contracted)

5
2005 FINANCIAL SUMMARY
PUBLIC HEALTH DIVISIONTOTAL EXPENSES
$49,307
$158,234
$11,633
$194,048
$182,991
$88,738
$50,077
$671,424
$153,895
$11,173
$173,396
$185,034
$85,320
$601,542
$0 $100,000 $200,000 $300,000 $400,000 $500,000 $600,000 $700,000
Communicable Disease
Human Health Hazards
Health Promotion & Disease Prevention
Public Health - General
WIC
Healthy Babies
Families First
TOTAL EXPENSES
2004 2005$1,259,667 $1,357,145
6
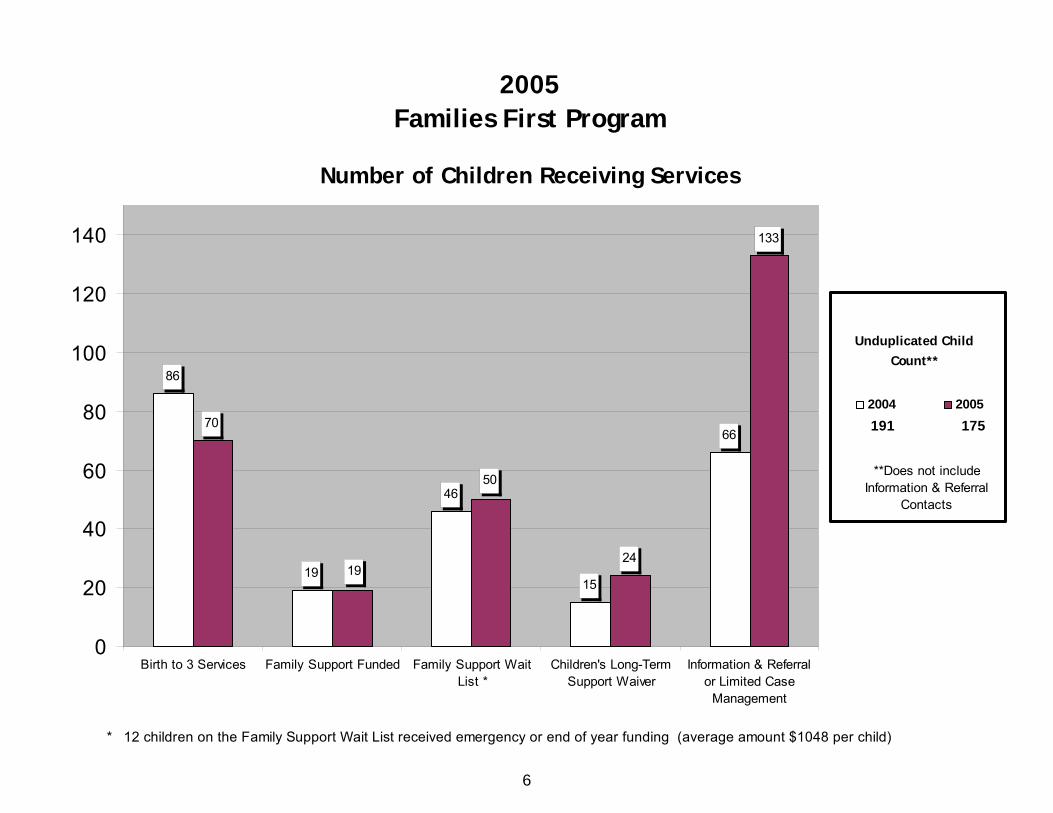
2005 Families First Program
Number of Children Receiving Services
86
19
46
15
66
133
24
50
19
70
0
20
40
60
80
100
120
140
Birth to 3 Services Family Support Funded Family Support WaitList *
Children's Long-TermSupport Waiver
Information & Referralor Limited Case
Management
2004 2005175
**Does not include Information & Referral
Contacts
191
* 12 children on the Family Support Wait List received emergency or end of year funding (average amount $1048 per child)
Unduplicated Child Count**

7
2005 Wisconsin Wins Tobacco Vendor Compliance Check Activity
0%5%
10%15%20%25%30%35%40%
Oconto Brown Shawano Marinette Langlade
Counties
Illegal Tobacco Sales of Area Counties, 2004 vs. 2005
Total percentage ofillegal tobacco sales,2004
Total percentage ofillegal tobacco sales,2005
Comparison of Percentages of Illegal Tobacco Sales by Type of Vendor in Oconto County, 2005
6% Golf Courses
6% Grocery Stores
9% Other
12% Restaurants
38% Convenience Stores
29% Taverns
8
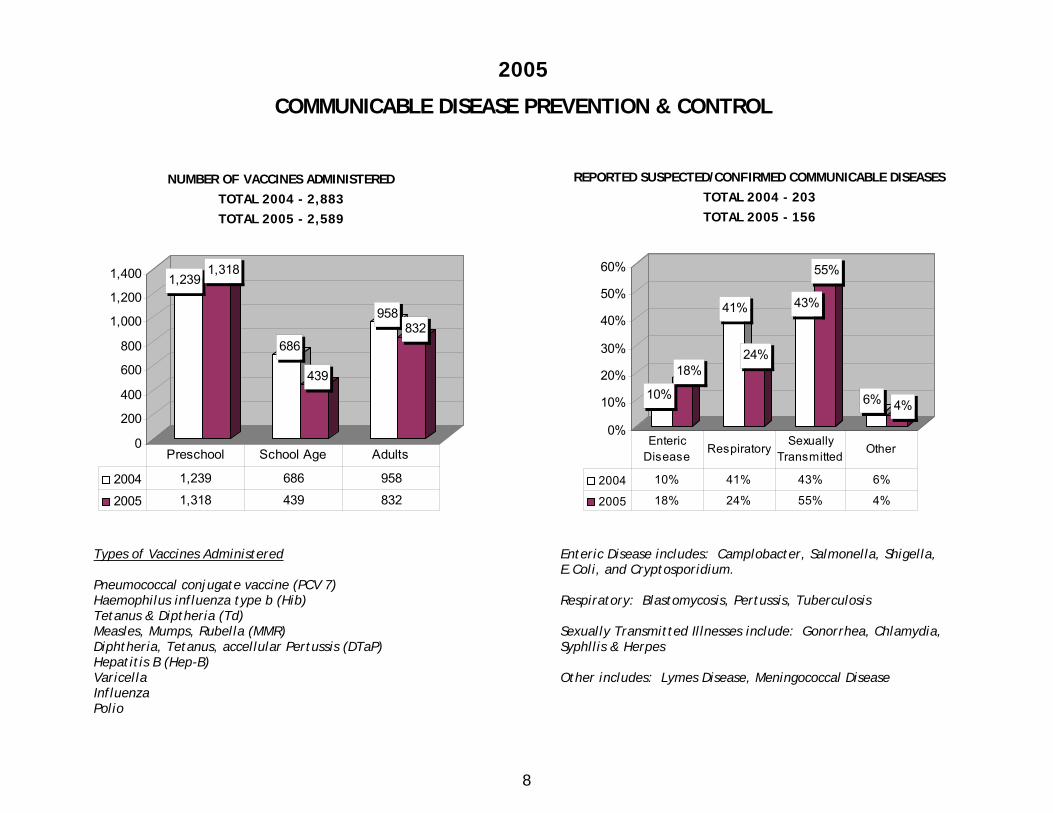
2005
COMMUNICABLE DISEASE PREVENTION & CONTROL
Types of Vaccines Administered Pneumococcal conjugate vaccine (PCV 7) Haemophilus influenza type b (Hib) Tetanus & Diptheria (Td) Measles, Mumps, Rubella (MMR) Diphtheria, Tetanus, accellular Pertussis (DTaP) Hepatitis B (Hep-B) Varicella Influenza Polio
Enteric Disease includes: Camplobacter, Salmonella, Shigella, E.Coli, and Cryptosporidium. Respiratory: Blastomycosis, Pertussis, Tuberculosis Sexually Transmitted Illnesses include: Gonorrhea, Chlamydia, Syphllis & Herpes Other includes: Lymes Disease, Meningococcal Disease
10%
18%
41%
24%
43%
55%
6% 4%
0%
10%
20%
30%
40%
50%
60%
REPORTED SUSPECTED/CONFIRMED COMMUNICABLE DISEASESTOTAL 2004 - 203TOTAL 2005 - 156
2004 10% 41% 43% 6%
2005 18% 24% 55% 4%
Enteric Disease
Respiratory Sexually
Transmitted Other
1,2391,318
686
439
958832
0
200
400
600
800
1,000
1,200
1,400
NUMBER OF VACCINES ADMINISTEREDTOTAL 2004 - 2,883TOTAL 2005 - 2,589
2004 1,239 686 958
2005 1,318 439 832
Preschool School Age Adults

9
2005 PUBLIC HEALTH DIVISION SUMMARY
The Women, Infant and Children (WIC) Program served an average of 549 clients per month. Farmer’s Market Nutrition Program, was available again this year. Through this program, WIC participants are given $20 in WIC checks to purchase fresh fruits, vegetables and herbs from local Farmer’s Markets and farmstands. The fresh produce purchased must be grown in Wisconsin. Another project statewide was the implementation of a web-based computer system which forced changes in the program’s flow of service provision. 131 reports of human health hazards/animal bites were investigated and action taken. Oconto County SAFE Kids Chapter activities:
Child Passenger Safety 244 seats were inspected; 12% of the seats arrived installed correctly. 106 seats were distributed to families;
41 boosters and 65 seats 37 were free, 38 at reduced price, and 31 at regular price
Delivering Fire Prevention
Local firefighters, food establishments, and the SAFE Kids Chapter partnered to serve 33 households in 3 communities. They delivered:
pizza (on the fire engine) fire prevention education smoke detectors
The Chapter hopes to expand this program to more communities in 2006.
The Wisconsin Well Woman Program (WWWP) is a breast and cervical cancer screening program for limited income, uninsured or underinsured Wisconsin women ages 35-64. In 2005, 100 Oconto County residents received free breast and/or cervical cancer screenings through the WWWP; a 21% increase from 2004 and a 54% increase since the year 2000. The Quality of Life Project continues to support and monitor several programs, including the following:
Healthy Babies – Oconto County Mentoring Program Parenting Resource Center of Oconto County Oconto County Healthy Hearts Project Child Welfare/Reunification Services Youth Activities such as “Teen Court” ParentLink

10

11

12
2005 FINANCIAL SUMMARY
ECONOMIC SUPPORT DIVISIONTOTAL EXPENSES
$56,111
$160,836
$14,005
$49,036
$228,095
$83,803
$378,713
$70,381
$37,107
$70,289
$136,066
$126
$47,490
$273,060
$71,545
$366,213
$63,302
$26,148
$0 $50,000 $100,000 $150,000 $200,000 $250,000 $300,000 $350,000 $400,000
Burials
Day Care & LMCC
Medical Trans.
Economic Support
WHEAP
W-2
Fraud
FSET Supplement
New Beginnings
TOTAL EXPENSES
2004 2005
$1,040,061 $1,092,265

13
WISCONSIN HOME ENERGY ASSISTANCE PROGRAM
2005
Count Expenditures
Total Households Applied for Energy Assistance 1,395
Total Households Paid Energy Assistance 1,285 $476,566
Total Households Paid LIHEAP Funded Benefits 1,281 $325,343
Total Households Paid Public Benefit Funded Benefits 824 $81,223
Total Crisis Assistance Applications (Excluding Furnace) 429
Total Households Receiving Crisis Assistance (Excluding Furnace) 206
Total Households Paid Crisis Assistance (Excluding Furnace) 197 $90,940
Total Households Paid LIHEAP Funded Crisis Applications (Excluding Furnace) 181 $80,388
Total Households Paid Public Benefit Funded Crisis Applications 21 $10,552
Total Heating Unit Repairs Paid 22 $4,245
Total Heating Unit Replacements Paid 38 $107,086
Total Heating Unit Repairs and Replacements Paid 60 $111,331
Total Expenditures $1,287,674
14
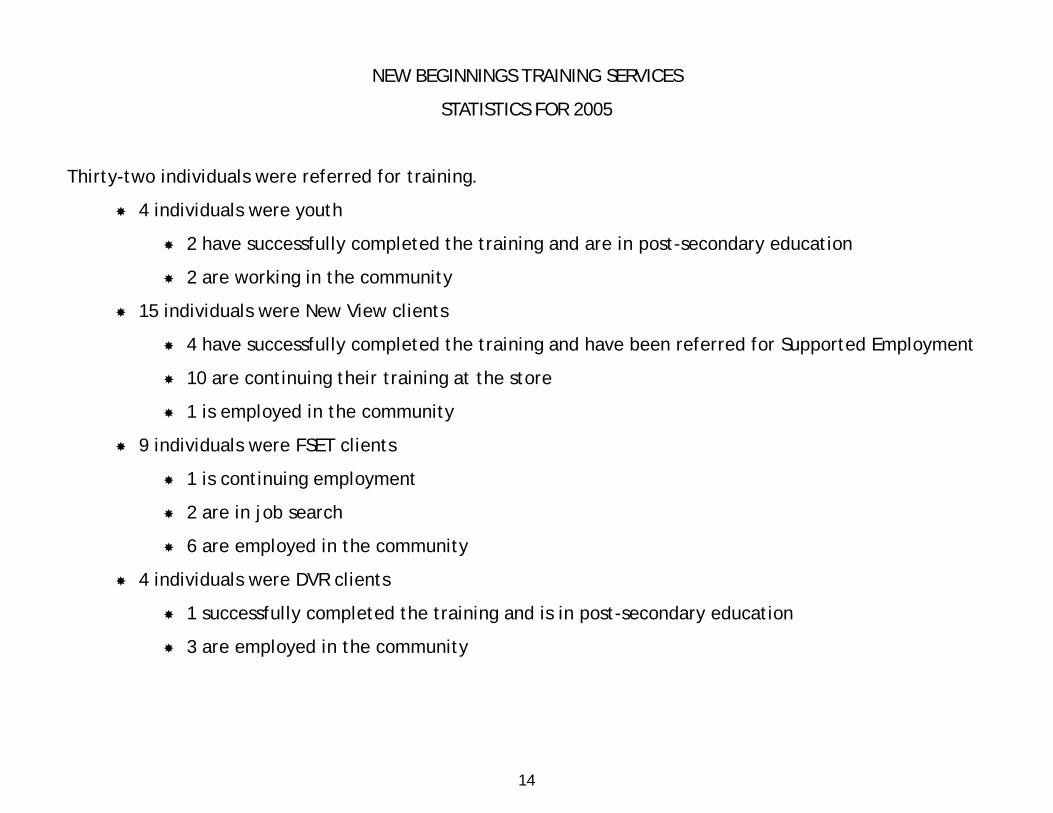
NEW BEGINNINGS TRAINING SERVICES
STATISTICS FOR 2005
Thirty-two individuals were referred for training.
4 individuals were youth
2 have successfully completed the training and are in post-secondary education
2 are working in the community
15 individuals were New View clients
4 have successfully completed the training and have been referred for Supported Employment
10 are continuing their training at the store
1 is employed in the community
9 individuals were FSET clients
1 is continuing employment
2 are in job search
6 are employed in the community
4 individuals were DVR clients
1 successfully completed the training and is in post-secondary education
3 are employed in the community

15
NEW BEGINNINGS FOOD PANTRY PARTICIPATION 2005
MONTH HOUSEHOLDS ADULTS CHILDREN TOTAL
JANUARY 103 169 77 246
FEBRUARY 94 150 55 205
MARCH 102 169 79 248
APRIL 95 159 73 232
MAY 103 170 66 236
JUNE 104 175 77 252
JULY 102 158 69 227
AUGUST 94 150 61 211
SEPTEMBER 91 160 70 230
OCTOBER 68 118 52 170
NOVEMBER 77 130 68 198
DECEMBER 87 150 51 201
TOTAL 1,120 1,858 798 2,656
NEW BEGINNINGS EMERGENCY ASSISTANCE REFERRALS—2005
MONTH NUMBER OF PEOPLE DOLLAR AMOUNT
JANUARY 0 0.00
FEBRUARY 4 50.95
MARCH 0 0.00
APRIL 9 49.70
MAY 9 131.76
JUNE 7 145.21
JULY 3 44.88
AUGUST 8 108.05
SEPTEMBER 13 151.35
OCTOBER 2 59.15
NOVEMBER 5 68.04
DECEMBER 10 173.39
TOTAL 70 $982.48
16
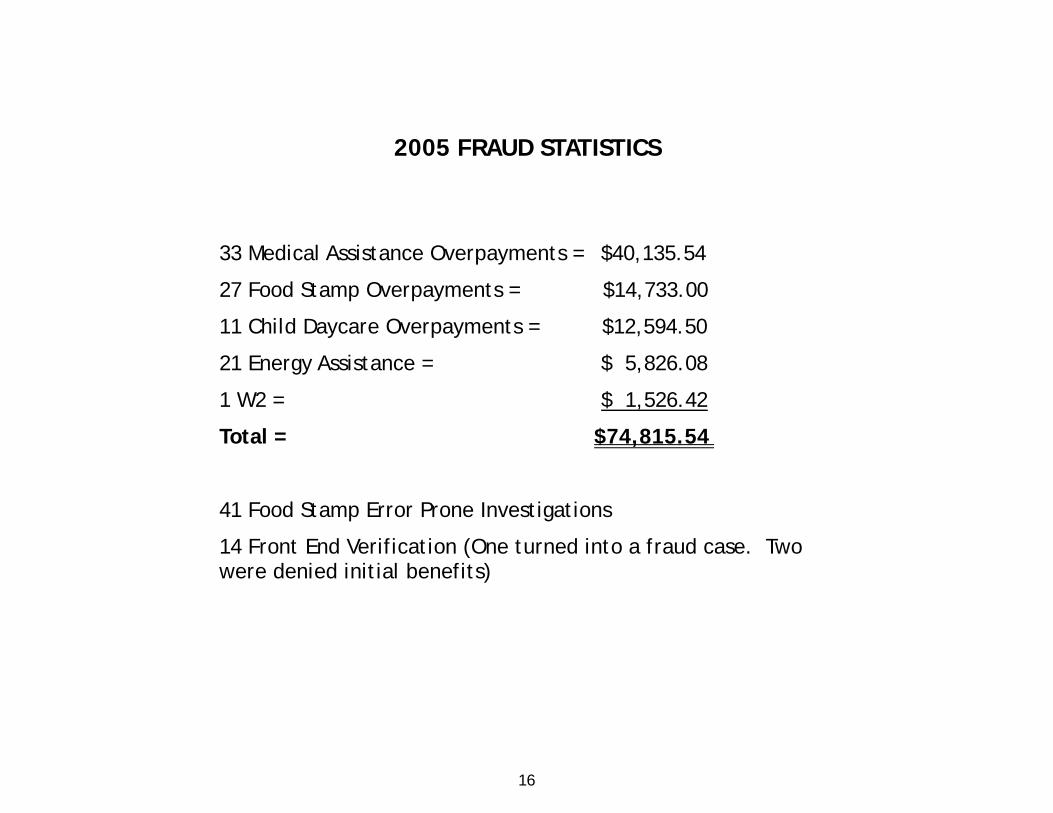
2005 FRAUD STATISTICS
33 Medical Assistance Overpayments = $40,135.54
27 Food Stamp Overpayments = $14,733.00
11 Child Daycare Overpayments = $12,594.50
21 Energy Assistance = $ 5,826.08
1 W2 = $ 1,526.42
Total = $74,815.54
41 Food Stamp Error Prone Investigations
14 Front End Verification (One turned into a fraud case. Two were denied initial benefits)

17
2005 W2/ECONOMIC SUPPORT SERVICES DIVISION SUMMARY
NEW BEGINNINGS
Fundraising efforts included Younkers’ Days, grant writing, cookouts, raffles, 5K Run and golf outing. We are still in partnership with United Way, and are starting a partnership with Sam’s Club and GAP, Inc.
W2/FOOD STAMPS/MEDICAL ASSISTANCE/CHILD CARE
CARES Worker Web was implemented in 2005. CARES is the computer system which maintains the W2 and Economic Support Programs. The State switched this program to go web-based and changed the name to CARES Worker Web (CWW).
Moved Job Center functions and W2 staff back to Courthouse.
3 year W2 plan written and approved by the State to continue W2 thru 2008.
WHEAP
New Governor’s Energy Assistance Program (GEAP) dollars implemented in 2005/2006 heating year.
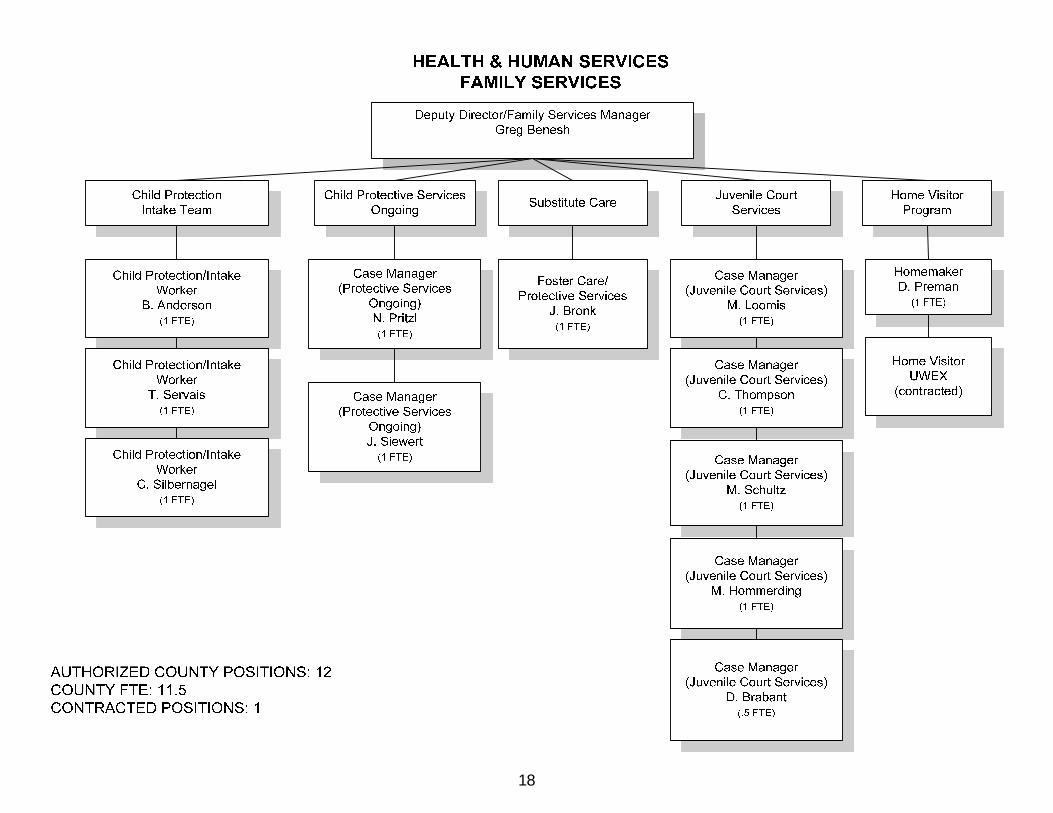
18

19
2005 FINANCIAL SUMMARY
FAMILY SERVICES DIVISIONTOTAL EXPENSES
$1,124,876
$884,208
$1,110,385
$918,404
$0
$200,000
$400,000
$600,000
$800,000
$1,000,000
$1,200,000
Family Services Substitute Care
2004 2005
$2,009,084 $2,028,789
TOTAL EXPENSES
20
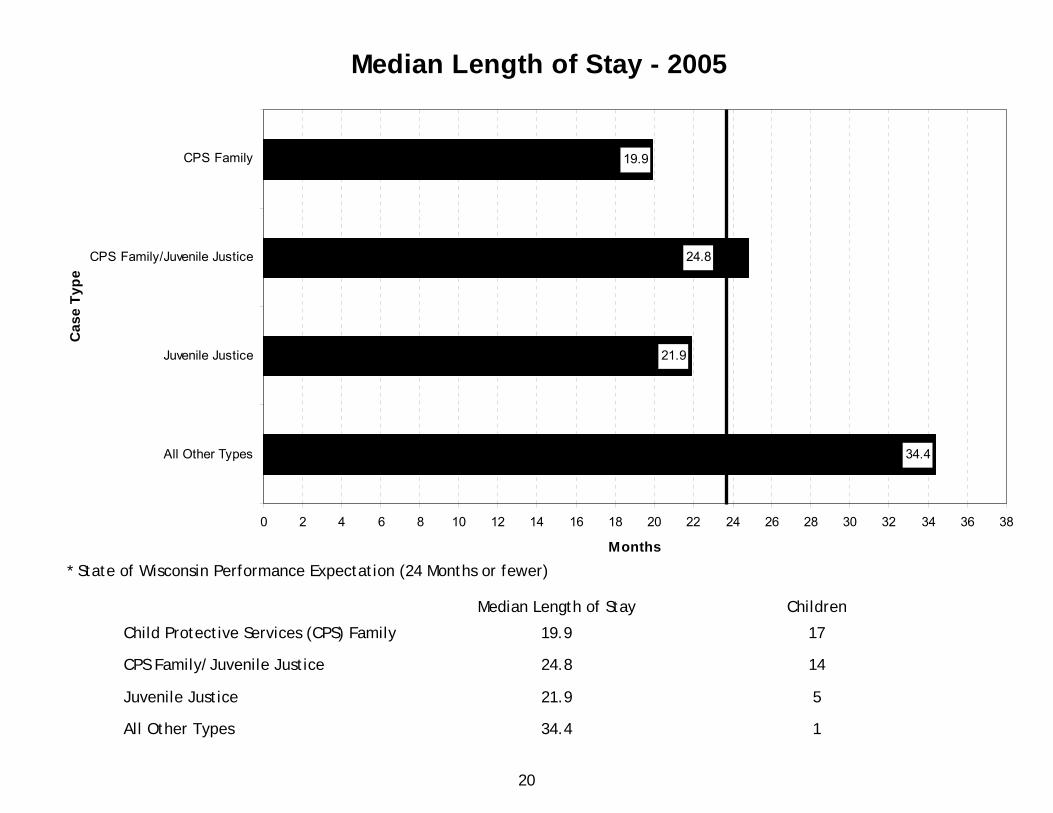
Median Length of Stay - 2005
34.4
21.9
24.8
19.9
0 2 4 6 8 10 12 14 16 18 20 22 24 26 28 30 32 34 36 38
All Other Types
Juvenile Justice
CPS Family/Juvenile Justice
CPS Family
Cas
e Ty
pe
Months
Median Length of Stay Children
Child Protective Services (CPS) Family 19.9 17
CPS Family/Juvenile Justice 24.8 14
Juvenile Justice 21.9 5
All Other Types 34.4 1
* State of Wisconsin Performance Expectation (24 Months or fewer)

21
Placement Stability - 2005
0% 10% 20% 30% 40% 50% 60% 70% 80% 90% 100%
Juvenile Justice
CPS Family/Juvenile Justice
CPS Family
Cas
e Ty
pe
Percent
1 or 2 Placement Settings 3 Placement Settings 4 Placement Settings 5 or More Placement Settings
1 or 2 Placement Settings 3 Placement Settings 4 Placement Settings 5 or More Placement Settings Total
CPS Family 9 100% 0 0% 0 0% 0 0% 9
CPS Family/Juvenile Justice 4 80% 0 0% 1 20% 0 0% 5
Juvenile Justice 6 100% 0 0% 0 0% 0 0% 6
* Child and Family Services Review National Standard (86.7% or more)

22
CHILD ABUSE AND NEGLECT REPORTS2001 - 2005
0
100
200
300
400
500
ReportsSubstantiations
Reports 259 346 361 468 421
Substantiations 36 65 28 53 29
2001 2002 2003 2004 2005

23
2005 FAMILY SERVICES DIVISION SUMMARY
2004
2005
JUVENILE COURT
Number of Referrals Counsel and Release Formal Supervision Other Dispositions Average Caseload Size
284 83 115 86 40
250 62 120 68 35
INTENSIVE SUPERVISION PROGRAM
Number Served Placed Out of Home
14 4
17 5
KINSHIP CARE
Number Served Waiting List
32 8
35 8
Number of Families Individuals Served Home Visits
34 112 558
48 151 625
HOME VISITOR PROGRAM

24
25
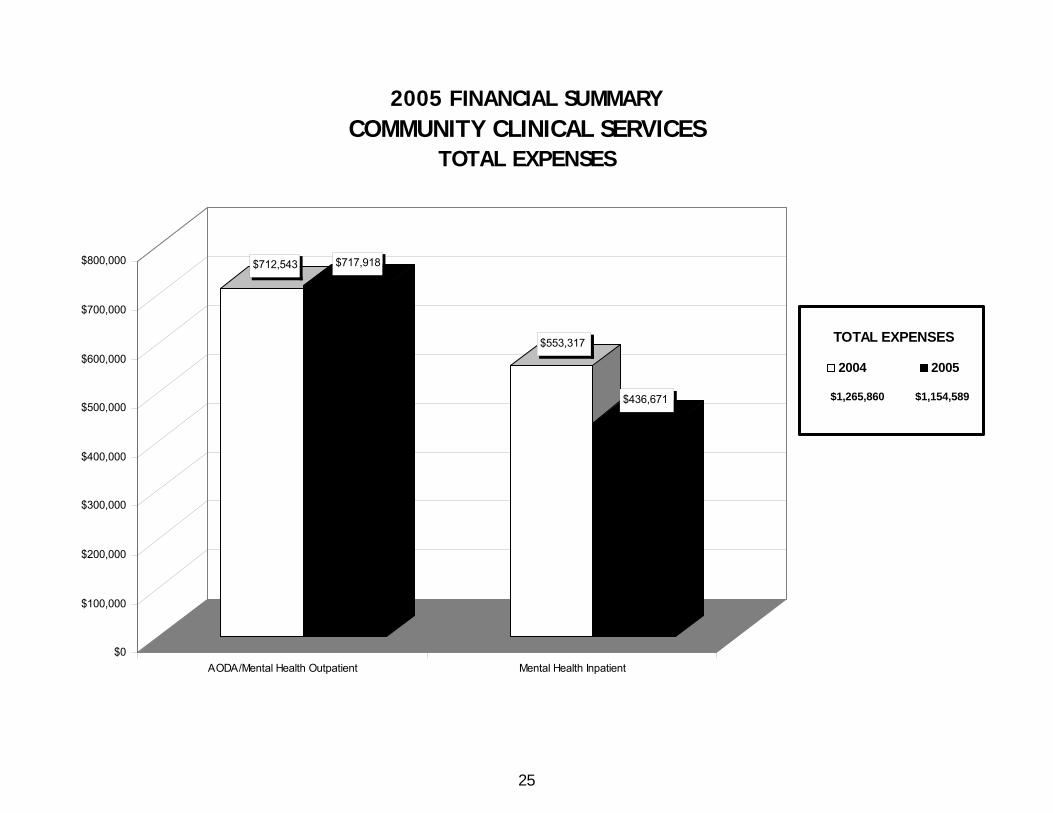
$712,543 $717,918
$553,317
$436,671
$0
$100,000
$200,000
$300,000
$400,000
$500,000
$600,000
$700,000
$800,000
AODA/Mental Health Outpatient Mental Health Inpatient
2005 FINANCIAL SUMMARYCOMMUNITY CLINICAL SERVICES
TOTAL EXPENSES
2004 2005
$1,265,860 $1,154,589
TOTAL EXPENSES

26
$735,701$508,366
$4,945,712
$5,830,564
$942,924 $1,064,010
$0
$1,000,000
$2,000,000
$3,000,000
$4,000,000
$5,000,000
$6,000,000
Protective Services/CaseMgmnt.
Residential Services Day Services/Pre.-Voc./Respite
2005 FINANCIAL SUMMARY
COMMUNITY LONG TERM SUPPORT SERVICESTOTAL EXPENSES
2004 2005
TOTAL EXPENSES
$6,624,337 $7,402,940
27
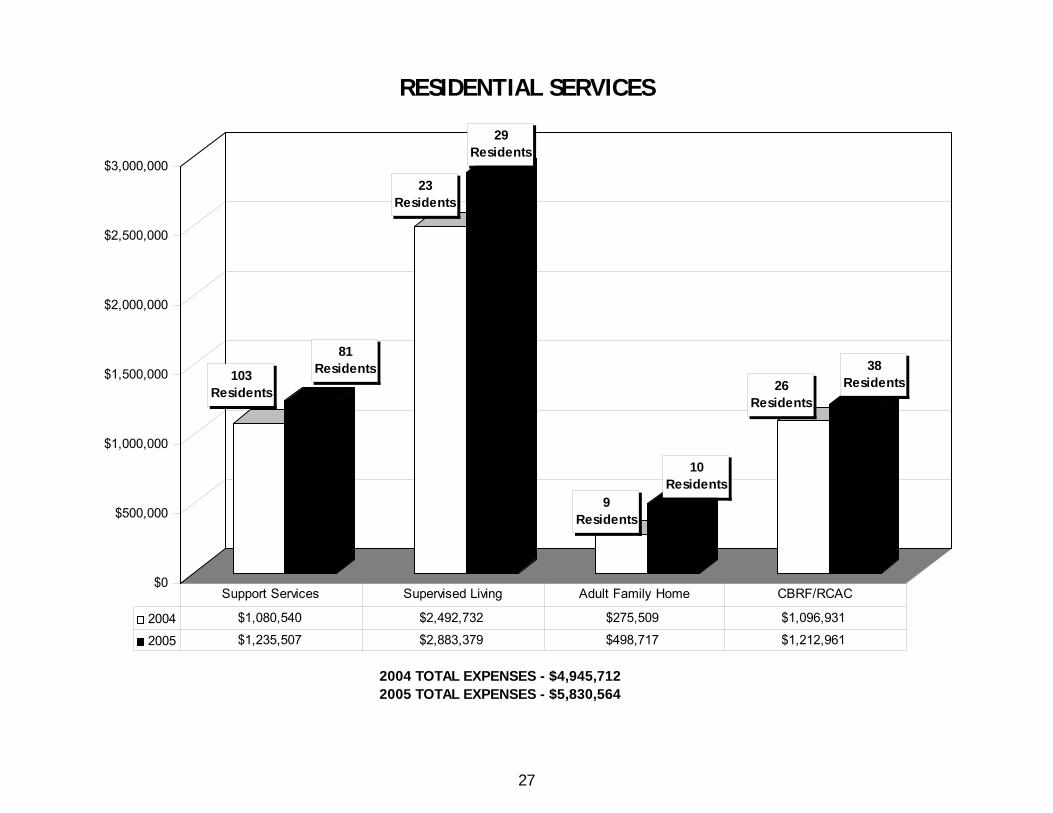
103 Residents
81Residents
23 Residents
29Residents
9Residents
10Residents
26Residents
38Residents
$0
$500,000
$1,000,000
$1,500,000
$2,000,000
$2,500,000
$3,000,000
RESIDENTIAL SERVICES
2004 $1,080,540 $2,492,732 $275,509 $1,096,931
2005 $1,235,507 $2,883,379 $498,717 $1,212,961
Support Services Supervised Living Adult Family Home CBRF/RCAC
2004 TOTAL EXPENSES - $4,945,7122005 TOTAL EXPENSES - $5,830,564

28
2005 INPATIENT CARE
* Short term inpatient – under 30 days
Number
Average Stay
Cost
Number
Average Stay
Cost
2004
2005
2004
2005
2004
2005
Mental Health Short Term *
74
64
6 days
4 days
$199,647
$132,800
Mental Health Long Term
5
3
109 days
152 days
$353,670
$303,871
Total
79
67
$553,317
$436,671
Alcohol and Other Drugs (AODA)
22
25
22 days
21 days
$59,027
$63,291
29
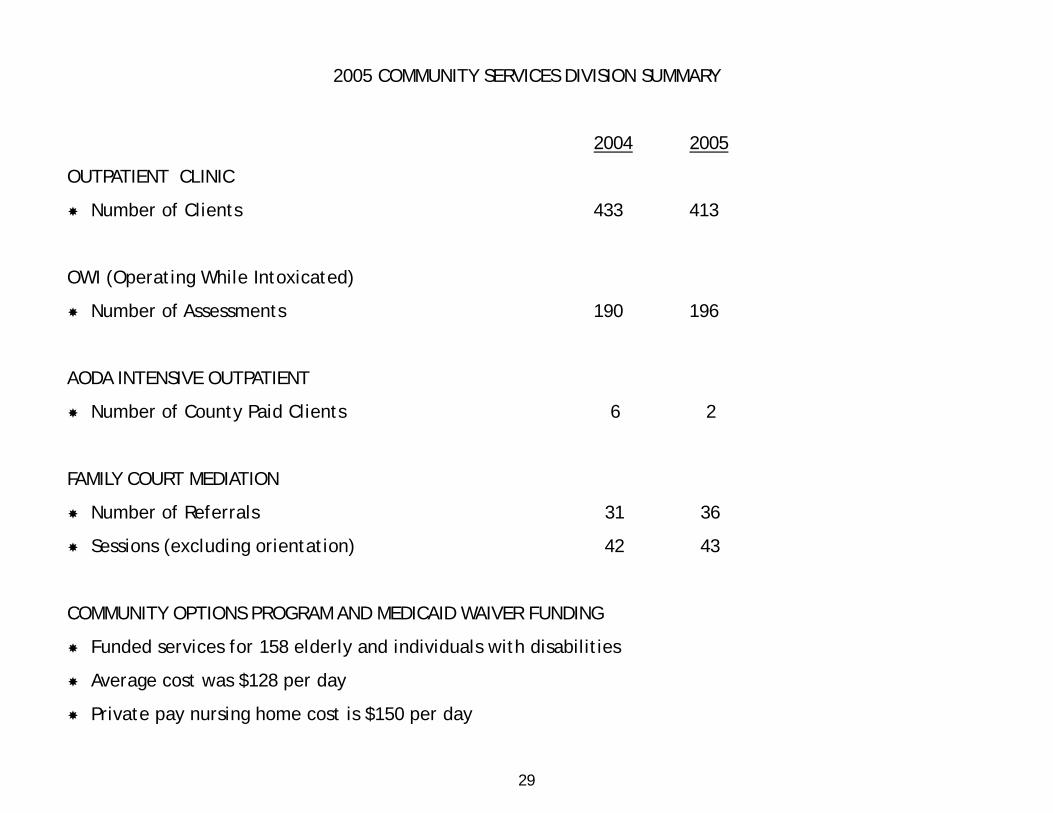
2005 COMMUNITY SERVICES DIVISION SUMMARY
2004 2005
OUTPATIENT CLINIC
Number of Clients 433 413
OWI (Operating While Intoxicated)
Number of Assessments 190 196
AODA INTENSIVE OUTPATIENT
Number of County Paid Clients 6 2
FAMILY COURT MEDIATION
Number of Referrals 31 36
Sessions (excluding orientation) 42 43
COMMUNITY OPTIONS PROGRAM AND MEDICAID WAIVER FUNDING
Funded services for 158 elderly and individuals with disabilities
Average cost was $128 per day
Private pay nursing home cost is $150 per day

30

31
2005 FINANCIAL SUMMARY
VOCATIONAL SERVICES DIVISIONTOTAL EXPENSES
$592,886
$94,620
$95,366
$105,433
$91,730
$41,119
$601,951
$105,924
$84,667
$101,291
$86,648
$23,541
$0 $100,000 $200,000 $300,000 $400,000 $500,000 $600,000 $700,000
Sheltered EmploymentDirect Support
Developmental ActivityPre-Voc. Day Center
Supported Employment
WIA
FSET
Case Management
TOTAL EXPENSES
2004 2005$1,004,022 $1,021,154
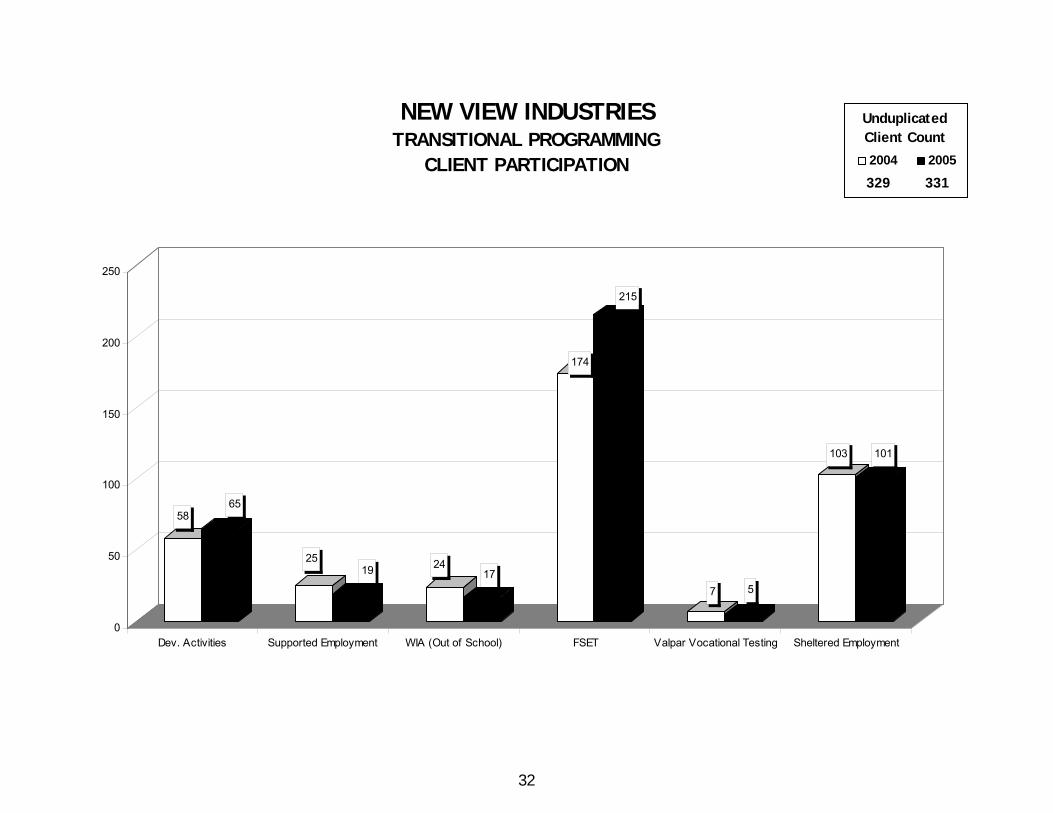
32
5865
2519 24
17
174
215
7 5
103 101
0
50
100
150
200
250
Dev. Activities Supported Employment WIA (Out of School) FSET Valpar Vocational Testing Sheltered Employment
NEW VIEW INDUSTRIESTRANSITIONAL PROGRAMMING
CLIENT PARTICIPATION 2004 2005
UnduplicatedClient Count
331329
33
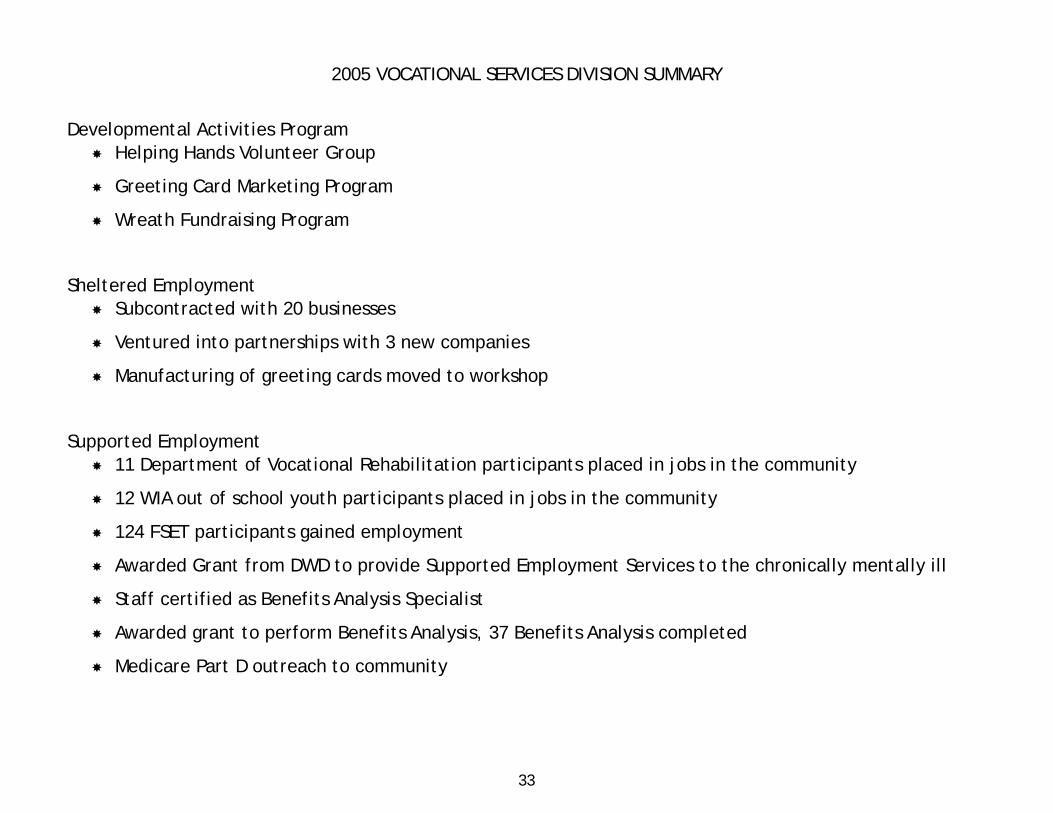
2005 VOCATIONAL SERVICES DIVISION SUMMARY
Developmental Activities Program Helping Hands Volunteer Group
Greeting Card Marketing Program
Wreath Fundraising Program
Sheltered Employment Subcontracted with 20 businesses
Ventured into partnerships with 3 new companies
Manufacturing of greeting cards moved to workshop
Supported Employment 11 Department of Vocational Rehabilitation participants placed in jobs in the community
12 WIA out of school youth participants placed in jobs in the community
124 FSET participants gained employment
Awarded Grant from DWD to provide Supported Employment Services to the chronically mentally ill
Staff certified as Benefits Analysis Specialist
Awarded grant to perform Benefits Analysis, 37 Benefits Analysis completed
Medicare Part D outreach to community

34

35
$557
$113,628
$184,000
$140,380
$193,533
$234,514
$0
$50,000
$100,000
$150,000
$200,000
$250,000
Overhead/HIPAA Capital Outlay Agency Mgmnt. Support Staff
2005 FINANCIAL SUMMARY
ADMINISTRATIVE SUPPORT DIVISIONTOTAL EXPENSES
2004 2005
TOTAL EXPENSES
$378,090 $488,522